Embed Size (px)
Citation preview

Gerhard Brandt, ABB AG, Mannheim, Germany
Solutions for Performance Monitoring, Diagnosis and Optimization of Power Plants

© ABB GroupMarch 11, 2013 | Slide 2
Agenda
� Introduction
� Carbon-in-Ash Instrument
� Mill Runback Calculator.
� Combustion Optimization
� Soot Blowing Optimization.
� Startup Optimization
� Life-time Calculation
� Temperature State Space Control
� Life Steam Flow Calculation
� Unit Control
� Energy Optimizer
� Process Quality Monitoring
� Loop Performance Monitoring
� Energy Efficiency Consulting

© ABB2009-05-26 PGE2009_JSchneider_20090526.ppt | 3
Primary energy Transport Generation T&DIndustrial processes
Industrial production
80% of energyis lost
Ava
ilabl
e en
ergy
Only 20% of primary energy generates economic valueThe rest is lost to conversion processes, transportation and operational inefficiencies

Motivation for optimization
Benefits
� Reduce fuel consumption and emissions
� Increase flexibility
� Identify and rectify equipment problems
� Improve predictive maintenance and availability
� Optimize asset lifecycles
Measures
� Tune control loops
� Optimize the combustion process and improve boiler controls
� Optimize ramp rates, low load running and startups
� Optimize operation of multiple generating units
� Monitor and predict plant performance
� Issue early warnings for equipment diagnosis and preventive maintenance

© ABB3/11/2013 2VAA000312AA5100_en_CI_5.1_ Combustion Instrument - Sales Presentation | 5
� Majority of the combustible portion of the ash accounting for the energy loss is simply unburned carbon.
� Unburned carbon is a highly variable parameter which is dependent upon coal type, load, fuel and air distribution, and other boiler-specific factors, the need for on-line real-time measurement has become more critical in combustion optimization process
� ABB Carbon In Ash Instrument (CIA) provides a true real-time and representative measurements of the unburned carbon in the fly ash for utility power plants
Carbon In Ash InstrumentBasics

Receiver Measures Microwave Intensity (Carbon)
Dust Probes (Loading)
Microwave Oscillator 94 GHz +- 75 MHz
wave resonance
“Mirrors”
CIA Output
Carbon/Ash Loading @ %
OR
Carbon @ g/m3
� Active Component is a 94GHz Microwave System
� Slightly Parabolic “Mirrors” Create Resonant Microwave Cavity Across Furnace Back pass or Economizer Ductwork
� Total Ash Loading Determined by “Dust Probe”
Carbon In Ash InstrumentABB’s Technology Edge!

© ABB3/11/2013 2VAA000312AA5100_en_CI_5.1_ Combustion Instrument - Sales Presentation | 7
One microwave sender and receiver required per CIA unit
Mirrors
Dust probes
Microwave oscillator
Microwave receiver
Ash
Carbon In Ash InstrumentInstallation

© ABB3/11/2013 2VAA000312AA5100_en_CI_5.1_ Combustion Instrument - Sales Presentation | 8
� Increased combustion efficiency
� Increased quality of Fly Ash resulting in better sale price!
� Improved Mercury capture
� Loss of Ignition availability
� Balanced plant efficiency
� Reduced operating cost
� Reduced amount of Fly Ash & reduced Land Filling
� Reduced manual LOI procedure
Increased
ReducedABB’s Carbon in Ash Instrument
Carbon In Ash InstrumentBenefits

© ABB GroupMarch 11, 2013 | Slide 9
OPTIMAX® PerformanceMill Run Back Calculator
� Run-Back Calculator based on physical model of the mill
� Outputs:
� Maximal Drying capacity
� Maximal grinding capacity
� Moisture of coal / biomass
� Implemented on controller
Referenz: P. Niemczyk et al: Derivation and validation of a coal mill model for control

© ABB GroupMarch 11, 2013 | Slide 10
OPTIMAX® PerformanceMill Drying capacity
� MCF: Max. coal/biomass addition
� 3:30: Addition of Biomass
kg
/s

optimizedvalues
controlledentities
measuredvalues
Boilermodel
Optimizer
• Targets• Constraints
optimizedsetpoints
Iteration
Sum of weighted goals= minimum
Combustion Optimization Principe

OFADMD MV
OFA E-WBIAS MV
AUX E-WBIAS MV
AUX A-HBIAS MV
AUX B-GBIAS MV
EastAH
West AH
ID
OPACITY CV
NOxCV
FD
O2 BALANCE
CV
O2 SPBIAS MV
MILL HBIAS MV
MILL GBIAS MV
MILL BBIAS MV
MILL ABIAS MV
EAST TILTDMD MV
WEST TILTDMD MV
WB-FURNDP MV
G
LOADDMD FF
RH SPRAY CV
MAIN STEAM
RH STEAM
FEEDWATER
WESTFURNACE
EASTFURNACE
Manipulated Variable
Constraint Variable
Disturbance Feed-ForwardFF
CV
MV
LEGEND
OFADMD MV
OFA E-WBIAS MV
AUX E-WBIAS MV
AUX A-HBIAS MV
AUX B-GBIAS MV
EastAH
West AH
ID
OPACITY CV
NOxCV
FD
O2 BALANCE
CV
O2 SPBIAS MV
MILL HBIAS MV
MILL GBIAS MV
MILL BBIAS MV
MILL ABIAS MV
EAST TILTDMD MV
WEST TILTDMD MV
WB-FURNDP MV
G
LOADDMD FF
RH SPRAY CV
MAIN STEAM
RH STEAM
FEEDWATER
WESTFURNACE
EASTFURNACE
Manipulated Variable
Constraint Variable
Disturbance Feed-ForwardFF
CV
MV
LEGEND� NOx – maximum constraint,
main objective
� Opacity – maximum constraint, noisy value
� O2 imbalance – delta O2 between furnaces, controlled with furnace biases on Aux Air and OFAD
� Actuator constraints – must keep base DCS loops in operating range, usually below a max output
� Spray valves
� Dampers
Combustion Optimizer Typical Scope

NOx (ppm)
� Max limit lowered sequentially by 10 ppm from 225 to 195
Combustion Optimizer Reference: reducing NOx

© ABB GroupMarch 11, 2013 | Slide 14
Lifetime MonitoringMotivation
Boilers
� Increasing peak operation results in additional load cycles on individual components
� New component materials allow higher steam parameters
� Optimum plant or boiler operation is achieved when the:
� Operation is safe, and when there is
� Good Agreement between design and the current operating lifetime consumption
Turbines
� Requirement for operational safety and high availability
� Obligation to prevent highly stressed components from failing,
� due to:
� Permanent loads such as high pressures and temperatures
� Centrifugal forces in a high temperature range
� Low-frequency alternating loads

© ABB GroupMarch 11, 2013 | Slide 15
Features� Online calculation of lifetime consumption of
critical components� BoilerLife certified by TÜV� Calculations according to international
standards� Online reporting on lifetime status of critical
components
Benefits� Improving maintenance planning � Ensure that components will not fail or need
replacement too early� Certified reporting to safety authorities
Lifetime MonitoringBoiler and Turbine

© ABB GroupMarch 11, 2013 | Slide 16
Activation signals for individual soot blower groups are: � Temperature limits� Soot blower steam consumption � Water consumption of water injectors � Boiler efficiency� Injection rates of intermediate superheaters� Pressure losses� Blower performance
Soot Blowing Optimization Model based calculation of heat exchangers

© ABB GroupMarch 11, 2013 | Slide 17
Soot Blowing OptimizationCalculation results with a detailed boiler model
Calculated conditions of
heat exchange areas
Start of soot
blowing sequence
Features� Provides operator guidance as to
when to initiate a soot blowing sequence
� Calculates cleanliness factors per section
� Measures heat transfer efficiency� Applies to furnace, walls and
convective sections
Benefits� Easy-to-spot effects of minor
changes in soot blowing sequences� Significant heat rate savings� Increase in long term plant
performance� Online computation of surface
cleanliness� Typical payback time < 2 years
9000 kJ/kW h Heat for Sootblowing [MJ/d] Total Heat Loss [MJ/d] 383.5
1350
203.6
5.55555556
0
50
100
150
200
250
300
350
400
450
1 2 4 8 16
Heat Loss [MJ/d]
Heat for Sootblow ing [MJ/d]
Total Heat Loss [MJ/d]

© ABB GroupMarch 11, 2013 | Slide 18© ABB3/11/2013 Enter filename via "View - Header and Footer...". Apply to all. | 18
BoilerMaxBoiler start-up Optimization
Benefits:
� Shorter start-up and shut-down time reduces fuel consumption
� Faster load response to load dispatcher, advantages in energy trading
� Explicit consideration of thermal stresses in thick-walled components, control of temperature variances during start-up
� Earlier warm-up and speed-up of the steam turbine and therefore earlier grid synchronization possible

© ABB GroupMarch 11, 2013 | Slide 19© ABB11.03.2013 Enter filename via "View - Header and Footer...". Apply to all. | 19
BoilerMaxFunctional principle
manipulated
values
Boiler
model
Optimizer
optimized
setpoints
and inputs
Iterations
Cost function
= Minimum !
process values
Nonlinear Model Predictive Control (NMPC) with cyclic tracking of the real process
Power plant
boiler
optimized
values
Optimization aims

© ABB GroupMarch 11, 2013 | Slide 20© ABB3/11/2013 Enter filename via "View - Header and Footer...". Apply to all. | 20
Tm: mid temperature
Ti: inner temperature
BoilerMaxDetermination of thermal stresses
Principle:
� Temperature difference ∆T is indicator for thermal stresses
� Measurement of ∆T between inner surface and the mean diameter of the annular cross section of thick-walled components
� Alternative 1: determination on non-heated surface
� Alternative 2: indirect determination from steam temperature gradients
∆T ≈ Tm - Ti
∆∆∆∆T live steam header in °C
∆∆∆∆T limit

© ABB GroupMarch 11, 2013 | Slide 21© ABB11.03.2013 Enter filename via "View - Header and Footer...". Apply to all. | 21
BoilerMaxEnhanced start-up phase
� Traditional start-up to comply with design limits
� BoilerMax start-up allows exploitation of design limits for more efficient process control:
� Based on process model
� NMPC technology
� Predictive coordination of multiple variables
� Online optimization in real-time
Up to 15% savings due to
fast and low-stress boiler
start-up
Fuel flow
HP-Bypass position
LS temperature
dT thick-walled component
Traditional – BoilerMax

© ABB GroupMarch 11, 2013 | Slide 22
m E•
R2R1 R3 R4
M
PI
PI-State Space Controller
TE T1 T2 T3 TA
mD•
Attemperator Q Burner
•
K1 K2 K3 K4
SP TA
Error
–+
T1^ T2
^ T3^ TA
^
–+
Observer
F
State Space ControllerImproved Temperature Control

PI-PI-cascadeState Controller
with Observer (SCOT)
Physical Temperature Limit
DCS max Temperature
Temperature SP
Tout
Time
Outlet Temperature ∆T Set Point
� Increasing the live steam and rehated steam operation temperature results in an immediate increment of unit efficiency
� With a higher set point, however, the margin between the operation point and max. admissible temperature is reduced
� This is no problem thanks to the improved performance that the state controller delivers
State Space ControllerImproved Temperature Control

© ABB GroupMarch 11, 2013 | Slide 24
PI-PI State Space Controller
(SSC)
Potential live steam
temperature increase
Physical Limit
DCS Limit
PI-PI SP
SP SSC
OPTIMAX® State Space ControllerImproved Temperature Control
© ABB GroupMarch 11, 2013 | Slide 25
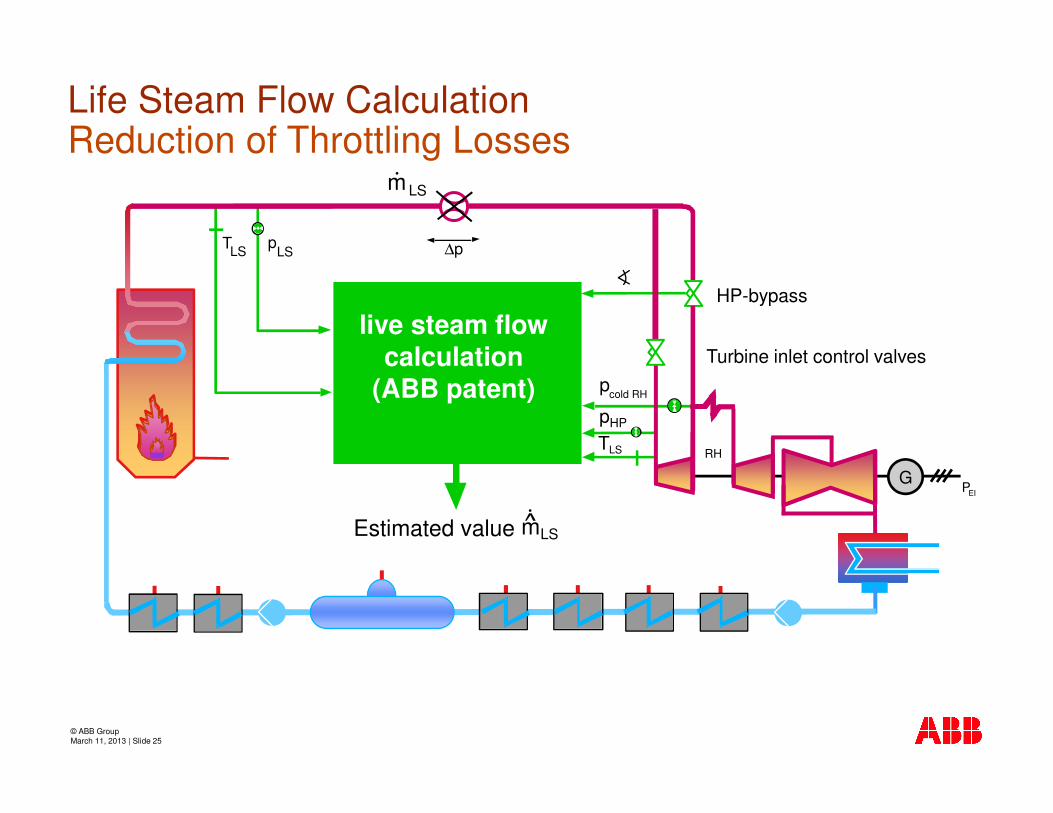
Life Steam Flow CalculationReduction of Throttling Losses
HP-bypass
Turbine inlet control valves
pcold RH
pT
Estimated value•
mLS
m•
LS
LS LS ∆p
PEI
G
RH
live steam flowcalculation
(ABB patent)
TLS
pHP

© ABB GroupMarch 11, 2013 | Slide 26
MODAN:Modified sliding pressureby turbine valve throttling
CONDSTOP:Fast shutdown of the LP FW heater line on steam and condensate side
MODAKOND:Modified sliding pressure by turbine valve throttling and LP heater line shutdown
Unit ControlFlexible and Reliable Operation
pFD k·∆f–+
– +
+
–
+–
Dyn. PressureMddel
Unit SPFrequency demand
PressureControl
Fuel Controller
FeedforwardBoiler
Dynamic LoadModel
Dynamic
Feedforward
ABB-CONDSTOP
0
6
12
15
18
40 70 100
stationäre Turbinenandrosselung in %
Last in %
MODAN
MODAKOND(ABB-CONDSTOP)
FeedforwardTurbine
Load Dispath
PEI
P–
GZÜ
Dynamic, Controlled Runbacks

© ABB11.03.2013 | 27
Energy Optimizer
� Flexible exploitation of different production units
� Gas turbines
� Boilers
� Steam turbines
� Different fuels
� Varying operational policies.:
� Prio steam production
� Prio el. production
� Start/Stop of boilers and turbines
� Energy Optimizer: Online-Optimization considering process constraints and market needs

© ABB11.03.2013 | 28
Reference 1: Internal Optimization JänschwaldePooling of six 500 MW units
Advantage of Multi-unit optimization� Exploit communication network between management system and unit control system� Real-time optimization of set points and secondary frequency control� Fast and optimal reaction to fulfill production task, incl. gradients and timing of load ramps� Goals:
� minimize fuel consumption and CO2-emmissions� increase flexibility

Reference 2: Pooling of up to 500 biogas plants
Process Database Redundant Controller IEC 60870-5-104 ScannerOperation & Management
Operations Client Engineering ClientImport / Export for
operational management
Service Client
Up to 500 production units,typically 500 kW per unit
4 GridOperators

� Process values alone usually give no information about the efficiency or the
process quality of a plant
12,2
3,7
4,0
0,2233
123,45312.3
12.0
12.6 23.4
12.8
23.4
12.4 11.823.4
12.4
2,412,5
OPTIMAX® PlantPerformanceStarting point: Monitoring of Process Values in DCS

� Performance indicators are determined by using multiple process values
12,2
3,7
4,0
0,2233
123,45312.3
12.0
12.6 23.4
12.8
23.4
12.4 11.823.4
12.4
2,412,5
96%
72%
90% 39%87%
72%68%
OPTIMAX® PlantPerformanceDetermination of Performance Indicators

ηact ηexp
Comp. 1
Total Plant
ηactηexp
ηact ηexp
Plant Area 1
ηact ηexp
Plant Area 2
ηact ηexp
Comp. 2
OPTIMAX® PlantPerformanceIdentifying the origin of a performance deviation

© ABB3/11/2013 | 33
Loop Auditing
� Transparent commissioning of control through loop optimizer.
� Model based tuning of each individual loop with a well documented report for each loop
� Reports are available at any time during commissioning giving a fast and accurate account of the loop commissioning status.
� Fully integrated into the System 800xA

© ABB3/11/2013 | 34
Loop Auditing
� Loop auditing given feedback on current control loop performance to detect worsening control loop behavior.
� Indicating on possible causes for the worsening of the control loop performance.
Loop Reports
Causes
Optimize Loops

Power and Water Plant OperationsABB Industrial Energy Efficiency (IEE) Assessment

Industrial Energy Efficiency (IEE)Master Plan

Industrial Energy Efficiency (IEE)Implementation