Embed Size (px)
Citation preview

Getting Started with Kaggle Data Science CompetitionsPosted by Loren Shure, June 18, 2015
Have you been interested in data science competitions, but not sure where to begin? Today's guest blogger, Toshi Takeuchi, would like to give a quick
tutorial on how to get started with Kaggle using MATLAB.
Contents
The Titanic Competition on Kaggle
Data Import and Preview
Establishing the Baseline
Back to Examining the Data
Exploratory Data Analysis and Visualization
Feature Engineering
Your Secret Weapon - Classification Learner
Random Forest and Boosted Trees
Model Evaluation
Create a Submission File
Conclusion - Let's Give It a Try
The Titanic Competition on Kaggle
MATLAB is no stranger to competition - the MATLAB Programming Contest (http://www.mathworks.com/matlabcentral/contest/) continued for over a
decade. When it comes to data science competitions, Kaggle is currently one of the most popular destinations and it offers a number of "Getting
Started 101" projects you can try before you take on a real one. One of those is Titanic: Machine Learning from Disaster (https://www.kaggle.com
/c/titanic).
The goal of the competition is to predict the survival outcomes for the ill-fated Titanic passengers. You use the training data to build your predictive
model and you submit the predicted survival outcomes for the test data. Your score is determined by the prediction accuracy.
Don't worry if you don't rank well on this one. There are entries with a 1.00000 score (https://www.kaggle.com/c/titanic/leaderboard) in the leaderboard,
but they either seriously overfit (http://en.wikipedia.org/wiki/Overfitting) their models to the test data, or perhaps even cheated, given that the full
dataset is available from the other sources (http://lib.stat.cmu.edu/S/Harrell/data/ascii/titanic.txt). That is not only pointless, but also raises serious
questions - what kind of standards of conduct must data scientists meet to produce trustworthy results?
So just think of this as a way to do a practice run on Kaggle before you take on a real challenge.
If you haven't done so, sign up with Kaggle (https://www.kaggle.com/) - it's free. Then navigate to the Titanic data (https://www.kaggle.com/c/titanic
/data) page to download the following files:
train.csv - the training data
test.csv - the test data
Data Import and Preview
We begin by importing the data into tables in MATLAB. Let's check the imported data. I am assuming that you have downloaded the CSV files into the
current folder.
Getting Started with Kaggle Data Science Compet... http://blogs.mathworks.com/loren/2015/06/18/get...
1 of 12 10/20/2015 09:09 AM
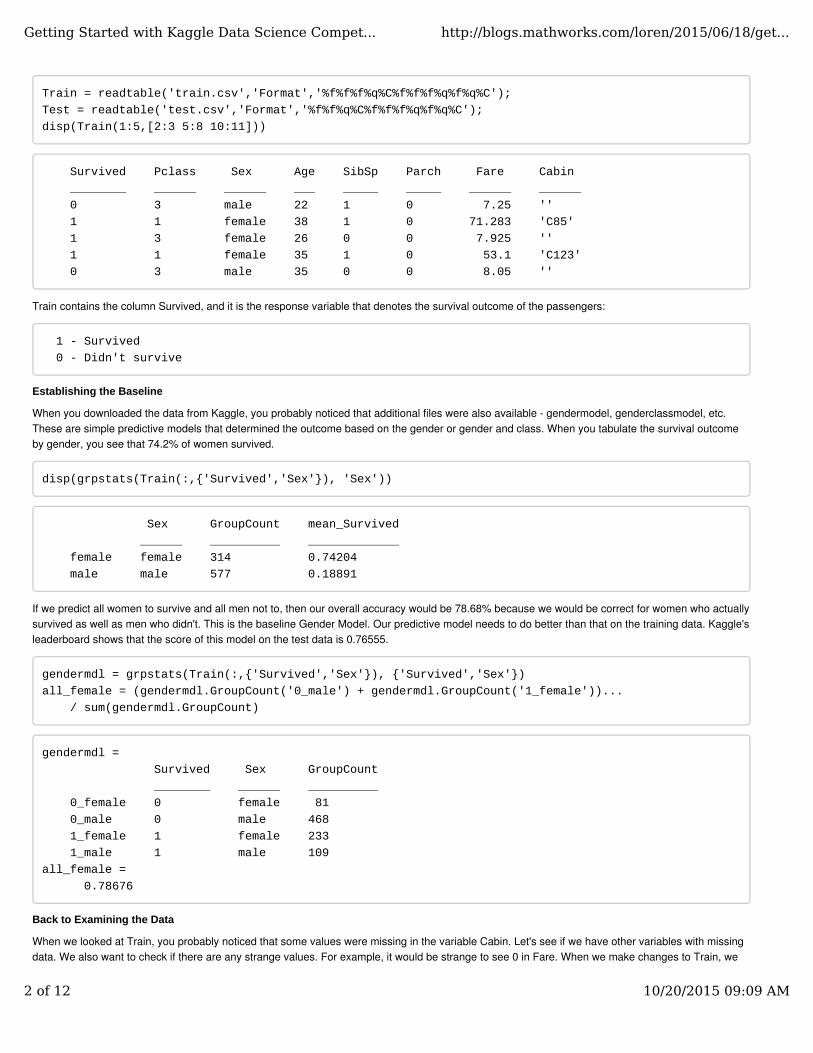
Train = readtable('train.csv','Format','%f%f%f%q%C%f%f%f%q%f%q%C');
Test = readtable('test.csv','Format','%f%f%q%C%f%f%f%q%f%q%C');
disp(Train(1:5,[2:3 5:8 10:11]))
Survived Pclass Sex Age SibSp Parch Fare Cabin
________ ______ ______ ___ _____ _____ ______ ______
0 3 male 22 1 0 7.25 ''
1 1 female 38 1 0 71.283 'C85'
1 3 female 26 0 0 7.925 ''
1 1 female 35 1 0 53.1 'C123'
0 3 male 35 0 0 8.05 ''
Train contains the column Survived, and it is the response variable that denotes the survival outcome of the passengers:
1 - Survived
0 - Didn't survive
Establishing the Baseline
When you downloaded the data from Kaggle, you probably noticed that additional files were also available - gendermodel, genderclassmodel, etc.
These are simple predictive models that determined the outcome based on the gender or gender and class. When you tabulate the survival outcome
by gender, you see that 74.2% of women survived.
disp(grpstats(Train(:,{'Survived','Sex'}), 'Sex'))
Sex GroupCount mean_Survived
______ __________ _____________
female female 314 0.74204
male male 577 0.18891
If we predict all women to survive and all men not to, then our overall accuracy would be 78.68% because we would be correct for women who actually
survived as well as men who didn't. This is the baseline Gender Model. Our predictive model needs to do better than that on the training data. Kaggle's
leaderboard shows that the score of this model on the test data is 0.76555.
gendermdl = grpstats(Train(:,{'Survived','Sex'}), {'Survived','Sex'})
all_female = (gendermdl.GroupCount('0_male') + gendermdl.GroupCount('1_female'))...
/ sum(gendermdl.GroupCount)
gendermdl =
Survived Sex GroupCount
________ ______ __________
0_female 0 female 81
0_male 0 male 468
1_female 1 female 233
1_male 1 male 109
all_female =
0.78676
Back to Examining the Data
When we looked at Train, you probably noticed that some values were missing in the variable Cabin. Let's see if we have other variables with missing
data. We also want to check if there are any strange values. For example, it would be strange to see 0 in Fare. When we make changes to Train, we
Getting Started with Kaggle Data Science Compet... http://blogs.mathworks.com/loren/2015/06/18/get...
2 of 12 10/20/2015 09:09 AM

also have to apply the same changes to Test.
Train.Fare(Train.Fare == 0) = NaN; % treat 0 fare as NaN
Test.Fare(Test.Fare == 0) = NaN; % treat 0 fare as NaN
vars = Train.Properties.VariableNames; % extract column names
figure
imagesc(ismissing(Train))
ax = gca;
ax.XTick = 1:12;
ax.XTickLabel = vars;
ax.XTickLabelRotation = 90;
title('Missing Values')
We have 177 passengers with unknown age. There are several ways to deal with missing values (http://www.mathworks.com/help/matlab
/data_analysis/missing-data.html). Sometimes you simply remove them, but let's use the average, 29.6991, for simplicity in this case.
avgAge = nanmean(Train.Age) % get average age
Train.Age(isnan(Train.Age)) = avgAge; % replace NaN with the average
Test.Age(isnan(Test.Age)) = avgAge; % replace NaN with the average
avgAge =
29.699
We have 15 passengers associated with unknown fares. We know their classes, and it is reasonable to assume that fares varied by passenger class.
Getting Started with Kaggle Data Science Compet... http://blogs.mathworks.com/loren/2015/06/18/get...
3 of 12 10/20/2015 09:09 AM

fare = grpstats(Train(:,{'Pclass','Fare'}),'Pclass'); % get class average
disp(fare)
for i = 1:height(fare) % for each |Pclass|
% apply the class average to missing values
Train.Fare(Train.Pclass == i & isnan(Train.Fare)) = fare.mean_Fare(i);
Test.Fare(Test.Pclass == i & isnan(Test.Fare)) = fare.mean_Fare(i);
end
Pclass GroupCount mean_Fare
______ __________ _________
1 1 216 86.149
2 2 184 21.359
3 3 491 13.788
With regards to Cabin, you notice that some passengers had multiple cabins and they are all in the first class. We will treat missing values as 0. Some
third class cabin numbers are irregular and we need to handle those exceptions.
% tokenize the text string by white space
train_cabins = cellfun(@strsplit, Train.Cabin, 'UniformOutput', false);
test_cabins = cellfun(@strsplit, Test.Cabin, 'UniformOutput', false);
% count the number of tokens
Train.nCabins = cellfun(@length, train_cabins);
Test.nCabins = cellfun(@length, test_cabins);
% deal with exceptions - only the first class people had multiple cabins
Train.nCabins(Train.Pclass ~= 1 & Train.nCabins > 1,:) = 1;
Test.nCabins(Test.Pclass ~= 1 & Test.nCabins > 1,:) = 1;
% if |Cabin| is empty, then |nCabins| should be 0
Train.nCabins(cellfun(@isempty, Train.Cabin)) = 0;
Test.nCabins(cellfun(@isempty, Test.Cabin)) = 0;
For two passengers, we don't know their port of embarkation. We will use the most frequent value, S (Southampton), from this variable to fill in the
missing values. We also want to turn this into a numeric variable for later use.
% get most frequent value
freqVal = mode(Train.Embarked);
% apply it to missling value
Train.Embarked(isundefined(Train.Embarked)) = freqVal;
Test.Embarked(isundefined(Test.Embarked)) = freqVal;
% convert the data type from categorical to double
Train.Embarked = double(Train.Embarked);
Test.Embarked = double(Test.Embarked);
Let's also turn Sex into a numeric variable for later use.
Train.Sex = double(Train.Sex);
Test.Sex = double(Test.Sex);
Getting Started with Kaggle Data Science Compet... http://blogs.mathworks.com/loren/2015/06/18/get...
4 of 12 10/20/2015 09:09 AM

Let's remove variables that we don't plan to use, because they contain too many missing values or unique values.
Train(:,{'Name','Ticket','Cabin'}) = [];
Test(:,{'Name','Ticket','Cabin'}) = [];
Exploratory Data Analysis and Visualization
At this point, we can begin further exploration of the data (http://www.mathworks.com/help/stats/exploratory-data-analysis.html) by visualizing the
distribution of variables. This is a time consuming but very important step. To keep it simple, I will just use one example - Age. The histogram shows
that you have a higher survival rate for agess under 5, and a very low survival rate for ages above 65.
figure
histogram(Train.Age(Train.Survived == 0)) % age histogram of non-survivers
hold on
histogram(Train.Age(Train.Survived == 1)) % age histogram of survivers
hold off
legend('Didn''t Survive', 'Survived')
title('The Titanic Passenger Age Distribution')
Feature Engineering
How can you take advantage of this visualization? We can create a new variable called AgeGroup using discretize() (http://www.mathworks.com
/help/matlab/ref/discretize.html) to group values into separate bins like child, teen, etc.
% group values into separate bins
Train.AgeGroup = double(discretize(Train.Age, [0:10:20 65 80], ...
'categorical',{'child','teen','adult','senior'}));
Test.AgeGroup = double(discretize(Test.Age, [0:10:20 65 80], ...
'categorical',{'child','teen','adult','senior'}));
Creating such a new variable by processing existing variables is called feature engineering and it is a critical step to perform well with the competition
and it is where your creativity really comes in. We had already created a new variable nCabins to deal with missing data, but often you do this as part
Getting Started with Kaggle Data Science Compet... http://blogs.mathworks.com/loren/2015/06/18/get...
5 of 12 10/20/2015 09:09 AM

of exploratory data analysis. Let's also look at Fare.
figure
histogram(Train.Fare(Train.Survived == 0)); % fare histogram of non-survivers
hold on
histogram(Train.Fare(Train.Survived == 1),0:10:520) % fare histogram of survivers
hold off
legend('Didn''t Survive', 'Survived')
title('The Titanic Passenger Fare Distribution')
% group values into separate bins
Train.FareRange = double(discretize(Train.Fare, [0:10:30, 100, 520], ...
'categorical',{'<10','10-20','20-30','30-100','>100'}));
Test.FareRange = double(discretize(Test.Fare, [0:10:30, 100, 520], ...
'categorical',{'<10','10-20','20-30','30-100','>100'}));
Your Secret Weapon - Classification Learner
The Classification Learner (http://www.mathworks.com/help/stats/classificationlearner-app.html) app is a new GUI-based MATLAB app that was
introduced in R2015a in Statistics and Machine Learning Toolbox. This will be your secret weapon to try out different algorithms very quickly. Let's
launch it!
classificationLearner
Click on Import Data
Select Train in Step 1 in Set Up Classification dialog box
In Step 2, change the "Import as" value for PassengerId to "Do not import", and Survived to "Response". All other variables should be already marked
as Predictor.
In Step 3, just leave it as is to Cross Validation.
Getting Started with Kaggle Data Science Compet... http://blogs.mathworks.com/loren/2015/06/18/get...
6 of 12 10/20/2015 09:09 AM

Random Forest and Boosted Trees
At this point, we are ready to apply some machine learning algorithms on the dataset. One of the popular algorithms on Kaggle is an ensemble method
called Random Forest, and it is available as Bagged Trees in the app. Let's try that by selecting it from the classifier menu and clicking on the Train
button.
When finished, you can open the Confusion Matrix tab. You see that this model achieved 83.7% overall accuracy, which is better than the Gender
Model baseline.
Getting Started with Kaggle Data Science Compet... http://blogs.mathworks.com/loren/2015/06/18/get...
7 of 12 10/20/2015 09:09 AM

Boosted Trees is another family of ensemble methods popular among Kaggle participants. You can easily try various options and compare the results
in the app. It seems Random Forest is the clear winner here.
You can save the trained model into the workspace by clicking on Export Model in the app. If you save the model as trainedClassifier, then you can
use it on Test as follows.
yfit = predict(trainedClassifier, Test{:,trainedClassifier.PredictorNames})
You can also generate a Random Forest model programmatically using TreeBagger (http://www.mathworks.com/help/stats/treebagger-class.html).
Let's adjust the formatting of the data to satisfy its requirements and split the training data into subsets for holdout cross validation.
Getting Started with Kaggle Data Science Compet... http://blogs.mathworks.com/loren/2015/06/18/get...
8 of 12 10/20/2015 09:09 AM

Y_train = Train.Survived; % slice response variable
X_train = Train(:,3:end); % select predictor variables
vars = X_train.Properties.VariableNames; % get variable names
X_train = table2array(X_train); % convert to a numeric matrix
X_test = table2array(Test(:,2:end)); % convert to a numeric matrix
categoricalPredictors = {'Pclass', 'Sex', 'Embarked', 'AgeGroup', 'FareRange'};
rng(1); % for reproducibility
c = cvpartition(Y_train,'holdout', 0.30); % 30%-holdout cross validation
Now we can train a Random Forest model and get the out-of-bag sampling accuracy metric, which is similar to the error metric from k-fold cross
validation. You can generate random indices from the cvpartition object c to partition the dataset for training.
% generate a Random Forest model from the partitioned data
RF = TreeBagger(200, X_train(training(c),:), Y_train(training(c)),...
'PredictorNames', vars, 'Method','classification',...
'CategoricalPredictors', categoricalPredictors, 'oobvarimp', 'on');
% compute the out-of-bag accuracy
oobAccuracy = 1 - oobError(RF, 'mode', 'ensemble')
oobAccuracy =
0.82212
One of the benefits of Random Forest is its feature importance metric, which represents the change in prediction error with or without the presence of a
given variable in the out-of-bag sampling process.
[~,order] = sort(RF.OOBPermutedVarDeltaError); % sort the metrics
figure
barh(RF.OOBPermutedVarDeltaError(order)) % horizontal bar chart
title('Feature Importance Metric')
ax = gca; ax.YTickLabel = vars(order); % variable names as labels
Getting Started with Kaggle Data Science Compet... http://blogs.mathworks.com/loren/2015/06/18/get...
9 of 12 10/20/2015 09:09 AM

As expected Sex has the most predictive power, but nCabins, an engineered feature we came up with, also made a significant contribution. This is why
feature engineering is important to do well in the competition! We also used fairly naive ways to fill missing values; you can also be much more creative
there.
Model Evaluation
To get a sense of how well this model actually performs, we want to check it against the holdout data. The accuracy drops significantly against unseen
data, and that's what we expect to see when we submit our prediction to Kaggle.
[Yfit, Yscore] = predict(RF, X_train(test(c),:)); % use holdout data
cfm = confusionmat(Y_train(test(c)), str2double(Yfit)); % confusion matrix
cvAccuracy = sum(cfm(logical(eye(2))))/length(Yfit) % compute accuracy
cvAccuracy =
0.79401
When you tweak your features and modify your parameters, it is useful to use a perfcurve plot (http://www.mathworks.com/help/stats/perfcurve.html)
(performance curve or receiver operating characteristic plot) to compare the performance. Here is an example.
posClass = strcmp(RF.ClassNames,'1'); % get the index of the positive class
curves = zeros(2,1); labels = cell(2,1);% pre-allocated variables
[rocX, rocY, ~, auc] = perfcurve(Y_train(test(c)),Yscore(:,posClass),'1');
figure
curves(1) = plot(rocX, rocY); % use the perfcurve output to plot
labels{1} = sprintf('Random Forest - AUC: %.1f%%', auc*100);
curves(end) = refline(1,0); set(curves(end),'Color','r');
labels{end} = 'Reference Line - A random classifier';
xlabel('False Positive Rate')
ylabel('True Positive Rate')
title('ROC Plot')
legend(curves, labels, 'Location', 'SouthEast')
Getting Started with Kaggle Data Science Compet... http://blogs.mathworks.com/loren/2015/06/18/get...
10 of 12 10/20/2015 09:09 AM

Create a Submission File
To enter your submission to the Kaggle competition, all you have to do is to upload a CSV file (https://www.kaggle.com/c/titanic/submissions/attach).
You just need the PassengerId and Survived columns for submission, and you populate the Survived with 1s and 0s. We are going to use the Random
Forest model we built to populate this variable.
PassengerId = Test.PassengerId; % extract Passenger Ids
Survived = predict(RF, X_test); % generate response variable
Survived = str2double(Survived); % convert to double
submission = table(PassengerId,Survived); % combine them into a table
disp(submission(1:5,:)) % preview the table
writetable(submission,'submission.csv') % write to a CSV file
PassengerId Survived
___________ ________
892 0
893 0
894 0
895 0
896 0
Conclusion - Let's Give It a Try
When you upload the submission CSV file, you should see your score immediately, and that would be around the 0.7940 range, putting you within the
top 800. I'm pretty sure you are seeing a lot of room for improvement. For example, I just used averages for filling missing values in Fare but perhaps
you can do better than that given the importance of the feature. Maybe you can come up with better engineered features from the variables I glossed
over.
If you want to learn more about how you canget started with Kaggle using MATLAB, please visit our Kaggle (http://www.mathworks.com/academia
/student-competitions/kaggle/) page and check out more tutorials and resources. Good luck, and let us know your results here
(http://blogs.mathworks.com/loren/?p=1195#respond)!
Getting Started with Kaggle Data Science Compet... http://blogs.mathworks.com/loren/2015/06/18/get...
11 of 12 10/20/2015 09:09 AM

Get the MATLAB code
Published with MATLAB® R2015a
These postings are the author's and don't necessarily represent the opinions of MathWorks.
Getting Started with Kaggle Data Science Compet... http://blogs.mathworks.com/loren/2015/06/18/get...
12 of 12 10/20/2015 09:09 AM