Embed Size (px)
DESCRIPTION
Reporte sobre el estado regional en eficiencia energetica de algunos paises.
Citation preview
Fuel Economy State of the World 2016Time for global action
02 FUEL ECONOMY STATE OF THE WORLD 2016 TIME FOR GLOBAL ACTION
Produced by FIA Foundation.
Authored by GFEI partners and guest contributors.
Edited by Alex Körner (consultant) and Sheila Watson (FIA Foundation).
Contributors:Anup Bandivadekar, Joshua Miller, Drew Kodjak, Rachel Muncrief, Zifei Yang (ICCT),Rob de Jong, Bert Fabian (UNEP),Lew Fulton (UC Davis)Stephen Perkins, Jari Kauppila (ITF)Pierpaolo Cazzola (IEA)Richard Clarke (FIA Foundation)
Nikolas Hill (Ricardo Energy and Environment)
Design by Diana Fauner and John Pap (FIA Foundation).
GFEI activities at global, regional and national level are supported, in addition to the six GFEI partners, by the European Commission and the Global Environment Facility (GEF).
ContentsAcknowledgementsGFEI partners’ statement
Executive summary
1. Introduction 1.1. The GFEI 1.2. Fuel economy potential and benefits 1.3. Recent fuel economy progress 1.4. GFEI - A record of action 1.5. GFEI - A global role
2. Update on GFEI in-country work 2.1. GFEI toolkit 2.2. National progress
3. Update on fuel economy progress 3.1. International light-duty vehicle fuel economy comparison 3.2. International policy developments for light-duty vehicle e�ciency 3.3. International policy developments for heavy-duty vehicle e�ciency
4. Summaries of relevant work 4.1. Comparison of vehicle technology and fuel e�ciency across countries 4.2. Low carbon alternatives: Electric vehicles, hybrids & sustainable biofuels, hydrogen & fuel cell electric vehicles 4.3. Real world fuel consumption 4.4. Improving understanding of technology and costs for CO2 reductions from cars and LCVs in the period to 2030 and development of cost curves
5. Next steps 5.1. 100 for 50by50 5.2. GFEI and heavy duty vehicles 5.3. GFEI and electric vehicles 5.4. The “Green NCAP”
Annexes Annex 1. In-country work to establish fuel economy baselines Annex 2. References Annex 3. The GFEI partners
What others say about GFEI
1
2
4557
1011
202124
28293135
383942
4446
4849495051
54545556
64

1TIME FOR GLOBAL ACTIONFUEL ECONOMY STATE OF THE WORLD 2016
Sheila Watson
Director of Environment and Research
FIA Foundation
Pierpaolo Cazzola
Senior Transport and Energy Analyst
International Energy Agency
Rob de Jong
Head, Transport Unit
United Nations Environment Programme (UNEP)
Stephen Perkins
Head of Joint Transport Research Centre
International Transport Forum at the OECD
Drew Kodjak
Executive Director
International Council on Clean Transportation
Lew Fulton
Co-director
The Sustainable Transportation Energy Pathways (STEPS) Programme, ITS-Davis
Tables
Figures1 Global passenger light duty vehicle stock out to 20502 LDV emission reductions due to fuel economy policies3 Energy savings due to fuel economy policies compared to 2005 baseline4 Road transport vehicles sales 20145 Growth in road transport energy use 2000 to 20126 Fuel Economy Policy Map7 Baseline Light-Duty Vehicle Fuel Economy and Trends8 Average new LDV fuel economy by country normalised to the NEDC test cycle, 2005 to 20139 Fuel economy distribution for OECD and non-OECD, 201310 Vehicle size evolution, major regions, 2005 to 201311 Market shares of passenger cars (PC) for OECD and non -OECD regions and coverage with fuel
economy standards12 Global comparison of passenger car e�ciency standards13 Global comparison of light truck e�ciency standards14 Progress of adopted light-duty vehicle e�ciency standards towards the 2030 GFEI target15 Market shares of di¦erent power train configurations by country 201316 Market shares and fuel economy by vehicles segment, selected countries, 2005-201317 Vehicle power distribution and fuel economy for selected countries in 201318 PLDV sales by technology in the IEA 4DS and Technology Improve scenario19 Gap between tested and on-road fuel economy, 2001 to 201420 Comparison of 2025 cost-curves for spark-ignition lower-medium cars with those for xEV
powertrains21 Road transport emissions until 2050 for a 6 degree and a 2 degree emission trajectory22 Battery electric and plug-in hybrid vehicle sales worldwide, 2010 to 2014
567
1314242629303132
333334394041424547
4950
1 Table of key GFEI numbers2 Fuel economy evolution compared to GFEI target3 Comparison of latest adopted regulations for light-duty vehicle e�ciency4 Cost-e¦ectivess analyses of light-duty e�ciency standards5 Comparison of latest adopted regulations for heavy-duty vehicle e�ciency6 Regulatory developments in heavy-duty vehicle e�ciency in 2014-2015
63032353637
The Global Fuel Economy Initiative (GFEI) has developed a global status which reflects the very real commitment of the partners to reducing the fuel consumption (Lge/100km) of light duty vehicles by 50% by 2050, as well as the huge significance of the issue which it is seeking to address. As partners in this work we re-a�rm that commitment. We believe that the very high profile role which the issue has played in global processes such as the development of the Sustainable Development Goals (SDGs), the UNFCCC’s climate negotiations and the Lima-Paris Action Agenda (LPAA) at COP21 in Paris 2015 and the G20’s Energy Ministers Declaration in Turkey in 2015, augurs well for future progress.
However, we believe that there is still a long way to go and some substantial work to be done. The ultimate success of any attempts to improve global levels of fuel economy will depend on the progress we can make on a country by country basis. It is essential that all key stakeholders are fully engaged, open and positive in their involvement in this work. The latest events at Volkswagen present an excellent opportunity for the car industry to acknowledge the wider impact of its products on the planet which we share, and for governments to improve enforcement and encourage the industry to re-double its e¦orts to address those impacts. This means not just an early adoption of real driving emissions (RDE) requirements for type approval, but also inclusion of provisions for real world in-use testing of independently sourced vehicles so that emissions reductions are sustained throughout the useful life of the vehicle. We at GFEI remain open to further engagement, and to working together to achieve this.
We acknowledge the Global Environment Facility (GEF) and European Commission (EC) in supporting our work, as well as the substantial resources committed by each GFEI partner to the initiative, and we look forward to greater successes in the future.
GFEI partner’s statement
UNEP
Boxes1 Fuel economy policy highlights in 20152 In-country work to establish fuel economy baselines3 Alternative Fuelled Vehicles - Opportunities and Challenges4 Comparison of test bench versus portable emission measurement system (PEMS) vehicle testing5 Fuel economy baseline
2226435254

2 3FUEL ECONOMY STATE OF THE WORLD 2016 TIME FOR GLOBAL ACTION
Vehicles play a vital role in our economic and social prosperity, connecting people, goods and places. However, to prevent dangerous climate change the vehicles of the future must be more e�cient and less polluting. The Global Fuel Economy Initiative (GFEI) brings together technical and policy experts to show how to achieve this and to support governments and the private sector to make this happen.
Our work is focused around a series of targets to significantly improve vehicle fuel economy globally. These include a 50% reduction in the average fuel consumption (Lge/100km) of all light duty vehicles in use in 2050, compared to a 2005 baseline. To achieve this, all new cars sold and vans must reach a similar target by 2030.
Our new ‘100 for 50by50’ campaign aims to rapidly expand our impact by extending the number of countries committing to improve fuel economy to one hundred.
This report provides an overview of the state of the world of fuel economy policy today and its potential benefits in the future. By 2050, up to 33 Gt of CO2 and almost $8 trillion could be saved worldwide, if the GFEI target of doubling fuel economy of light
duty vehicles was turned into reality. GFEI tracks the achievements so far – between 2005 and 2013 fuel economy of new cars improved by 2% per year globally – and compares them to our target: global fuel economy is improving, but not at the necessary pace.
With the support of GFEI, 27 developing countries are now at various stages of developing fuel economy policies and more will be joining in the future. This report summarises results from the latest events and gives insights in the most relevant fuel economy related work from our partner organizations.
Light duty vehicle fuel economy improvement is o¦ to a good start – with policies already adopted the world is about half the way to the 2030 GFEI target. To finally achieve it, the next three to five years are critical, and GFEI will work hard to do so.
GFEI is also broadening its scope. The coming year will see the partnership getting more engaged in heavy duty vehicle fuel economy policy development, the promotion of electric vehicles and a truly independent vehicle fuel economy and pollutant testing scheme – the “Green NCAP”.
2015 is a key year for action on fuel economy. World leaders are making historic commitments to target sustainable development through new Global Goals for Sustainable Development (SDGs), energy e�ciency through the G20, and to tackle climate change through climate negotiations in Paris (COP21).
Executive summary

4 5FUEL ECONOMY STATE OF THE WORLD 2016 TIME FOR GLOBAL ACTION
The Global Fuel Economy Initiative works to promote greater appreciation of the issue of fuel economy in light duty vehicles, and the benefits which can accrue from addressing it. 2014 and 2015 have been busy years for this work, and the GFEI partnership has found itself at the centre of a growing global debate on the issue of fuel e�ciency.
1.1. The GFEIThe Global Fuel Economy Initiative (GFEI) is a partnership of six organisations; the FIA Foundation, which hosts the secretariat, the United Nations Environment Programme (UNEP), the International Council on Clean Transportation (ICCT), the International Energy Agency (IEA), the University of California at Davis (UC Davis), and the International Transport Forum of the OECD (ITF). Since GFEI was established in 2009, the partnership has worked with governments and other stakeholders to promote the benefits of improving vehicle fuel economy.
GFEI also works with a series of regional partners to deliver expert local policy support to countries around the world and has a business and stakeholder contact group from across the vehicle and energy sector. This combination of expert knowledge, in-depth data analysis and modelling, together with global outreach, has led GFEI to become the authoritative worldwide campaign for improved fuel economy.
1.2. Fuel economy potential and benefitsThe global fleet of light duty vehicles is set to increase massively by 2050, from around 850 million passenger cars in 2013 to over 2 billion by 2050, with nearly 90% of this growth in non-OECD countries (Figure 1). By then, there will be an additional 2.7 billion urban dwellers, 94% of these in non-OECD countries, with one third in China and India alone. Whilst huge benefits can result from greater personal mobility, such a growth in the fleet is unsustainable in terms of resource use, congestion and air quality.
Transport currently makes up 23% of energy related CO2 emissions, but rising prosperity and population growth mean that emissions are set to increase if no action is taken. Indeed, it is expected that by 2016 or 2017 transport emissions from developing countries will surpass those from Annex I countries.
GFEI has shown that by using existing cost-e¦ective technologies it is possible to reduce average vehicle fuel consumption (Lge/100km) by 50% by 2050 (Eads, 2011). Such improvements include increased
1 Introduction
0
500
1000
1500
2000
2500
2005 2010 2015 2020 2025 2030 2035 2040 2045 2050
Pass
enge
r veh
icle
sto
ck (m
)
OECD Non OECD
FIGURE 1 Global passenger light duty vehicle stock out to 2050
Source: IEA ETP 2015 (IEA 2015)
KEY MESSAGE • THE GLOBAL PASSENGER LIGHT DUTY VEHICLE STOCK IS EXPECTED TO ALMOST TRIPLE BETWEEN NOW AND 2050.
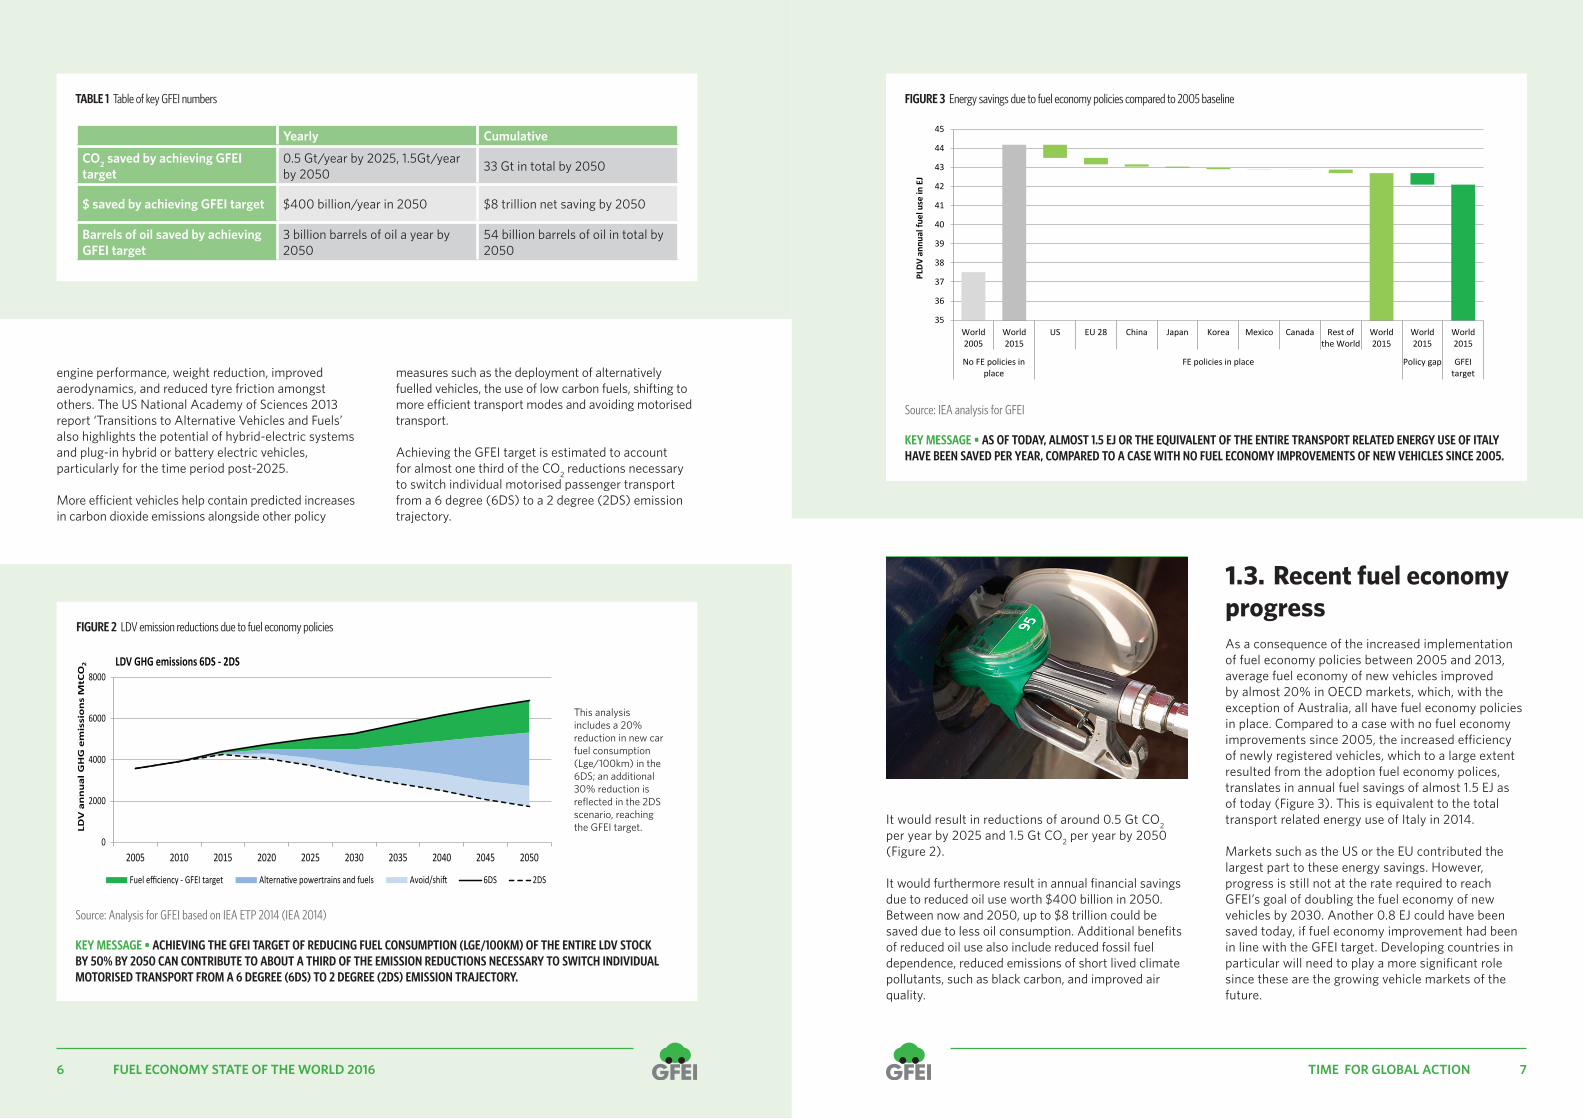
It would result in reductions of around 0.5 Gt CO2 per year by 2025 and 1.5 Gt CO2 per year by 2050 (Figure 2).
It would furthermore result in annual financial savings due to reduced oil use worth $400 billion in 2050. Between now and 2050, up to $8 trillion could be saved due to less oil consumption. Additional benefits of reduced oil use also include reduced fossil fuel dependence, reduced emissions of short lived climate pollutants, such as black carbon, and improved air quality.
1.3. Recent fuel economy progressAs a consequence of the increased implementation of fuel economy policies between 2005 and 2013, average fuel economy of new vehicles improved by almost 20% in OECD markets, which, with the exception of Australia, all have fuel economy policies in place. Compared to a case with no fuel economy improvements since 2005, the increased e�ciency of newly registered vehicles, which to a large extent resulted from the adoption fuel economy polices, translates in annual fuel savings of almost 1.5 EJ as of today (Figure 3). This is equivalent to the total transport related energy use of Italy in 2014.
Markets such as the US or the EU contributed the largest part to these energy savings. However, progress is still not at the rate required to reach GFEI’s goal of doubling the fuel economy of new vehicles by 2030. Another 0.8 EJ could have been saved today, if fuel economy improvement had been in line with the GFEI target. Developing countries in particular will need to play a more significant role since these are the growing vehicle markets of the future.
35
36
37
38
39
40
41
42
43
44
45
World2005
World2015
US EU 28 China Japan Korea Mexico Canada Rest ofthe World
World2015
World2015
World2015
No FE policies inplace
FE policies in place Policy gap GFEItarget
PLDV
ann
ual f
uel u
se in
EJ
6 7FUEL ECONOMY STATE OF THE WORLD 2016 TIME FOR GLOBAL ACTION
engine performance, weight reduction, improved aerodynamics, and reduced tyre friction amongst others. The US National Academy of Sciences 2013 report ‘Transitions to Alternative Vehicles and Fuels’ also highlights the potential of hybrid-electric systems and plug-in hybrid or battery electric vehicles, particularly for the time period post-2025.
More e�cient vehicles help contain predicted increases in carbon dioxide emissions alongside other policy
measures such as the deployment of alternatively fuelled vehicles, the use of low carbon fuels, shifting to more e�cient transport modes and avoiding motorised transport.
Achieving the GFEI target is estimated to account for almost one third of the CO2 reductions necessary to switch individual motorised passenger transport from a 6 degree (6DS) to a 2 degree (2DS) emission trajectory.
Source: IEA analysis for GFEI
FIGURE 3 Energy savings due to fuel economy policies compared to 2005 baseline
KEY MESSAGE • AS OF TODAY, ALMOST 1.5 EJ OR THE EQUIVALENT OF THE ENTIRE TRANSPORT RELATED ENERGY USE OF ITALY HAVE BEEN SAVED PER YEAR, COMPARED TO A CASE WITH NO FUEL ECONOMY IMPROVEMENTS OF NEW VEHICLES SINCE 2005.
0
2000
4000
6000
8000
2005 2010 2015 2020 2025 2030 2035 2040 2045 2050
LDV
an
nu
al G
HG
em
issi
on
s M
tCO
2 LDV GHG emissions 6DS - 2DS
Fuel efficiency - GFEI target Alternative powertrains and fuels Avoid/shift 6DS 2DS
FIGURE 2 LDV emission reductions due to fuel economy policies
Source: Analysis for GFEI based on IEA ETP 2014 (IEA 2014)
KEY MESSAGE • ACHIEVING THE GFEI TARGET OF REDUCING FUEL CONSUMPTION (LGE/100KM) OF THE ENTIRE LDV STOCK BY 50% BY 2050 CAN CONTRIBUTE TO ABOUT A THIRD OF THE EMISSION REDUCTIONS NECESSARY TO SWITCH INDIVIDUAL MOTORISED TRANSPORT FROM A 6 DEGREE (6DS) TO 2 DEGREE (2DS) EMISSION TRAJECTORY.
Yearly Cumulative
CO2 saved by achieving GFEI target
0.5 Gt/year by 2025, 1.5Gt/year by 2050 33 Gt in total by 2050
$ saved by achieving GFEI target $400 billion/year in 2050 $8 trillion net saving by 2050
Barrels of oil saved by achieving GFEI target
3 billion barrels of oil a year by 2050
54 billion barrels of oil in total by 2050
TABLE 1 Table of key GFEI numbers
This analysis includes a 20% reduction in new car fuel consumption (Lge/100km) in the 6DS; an additional 30% reduction is reflected in the 2DS scenario, reaching the GFEI target.

8 9FUEL ECONOMY STATE OF THE WORLD 2016 TIME FOR GLOBAL ACTION
4.24.24.2
2030
LGE/100KM
GLOBAL AVG
4.24.24.24.2
7.17.17.1
2013
LGE/100KM
GLOBAL AVG
7.17.17.17.1
8.38.38.3
2005
LGE/100KM
GLOBAL AVG
8.38.38.38.3
6.5Gt/year of CO2from road transport
74% of transport CO2 emissions from road vehicles 300 fewer power stations $2 trillion savings
10 2 3 4 5 6 7 8 9 10 11
-1.4
-1.2
-0.9
-1.5
-1.5
-1.2
+0.2
-1.2
-2.7
-0.8
-0.8
+0.2
-1.0
+0.2
-0.1
-0.4
-1.3
-1.3
-1.7
JAPAN
FRANCE
ITALY
TURKEY
INDIA
GERMANY
SOUTH KOREA
ARGENTINA
SOUTH AFRICA
BRAZIL
INDONESIA
MEXICO
CHINA
RUSSIA
AUSTRALIA
CANADA
US
UK
EU
FUEL ECONOMYAverage LGE/100km
Change 2005-2013
CAR SALES2013
201320051 MILLION SALES
FUTURE VEHICLE GROWTH TRENDS
2500
1500
2010 2020 2030 2040 2050
500
-1.7
LGE/100kmLGE/100km
20058.6 2013
6.9
OECDCOUNTRIES
-0.1LGE/100km
20057.3
20137.2
NON-OECDCOUNTRIES
FUEL ECONOMYAverage LGE/100km
2005 2013
Num
ber o
f veh
icle
s (m
)
OECD PASSENGER VEHICLES NON-OECD PASSENGER VEHICLES
20% 27%19% 39%2005 2013 2005 20132005 2013 2005 20132005 2013 2005 2013
26% 31%35% 38% 55% 30%45% 32%
NON-OECD COUNTRIESOECD COUNTRIES
Medium carsSmall cars Large cars
1% 8% 9% 7% 10% 1%
DOUBLE AVERAGE FUEL ECONOMYOF NEW CARS BY 2030 AND ALL CARS BY 2050
GFEI TARGETS AND FUEL ECONOMY FACTS
BENEFITS OF IMPROVED FUEL ECONOMY AND REDUCING EMISSIONSAVERAGE SIZE OF CARS
OECD AND NON-OECD COUNTRIES’ PROGRESS G20 PROGRESS ON FUEL ECONOMY
In 2014, total global C02 emissions were 38Gt. Out of the 8.8Gt of total transport emissions, 74% (6.5Gt) were from road transport.
The 33Gt of CO2 that could be saved between 2015 and 2050 is roughly the equivalent of closing 300 coal power stations over the same time period.
A total of $2 trillion could be made in fuel savings by 2025, $500 billion of which would fund the costs of initiating a transition to electric vehicles.
-$2TRILLION
+$500BILLION
10 11FUEL ECONOMY STATE OF THE WORLD 2016 TIME FOR GLOBAL ACTION
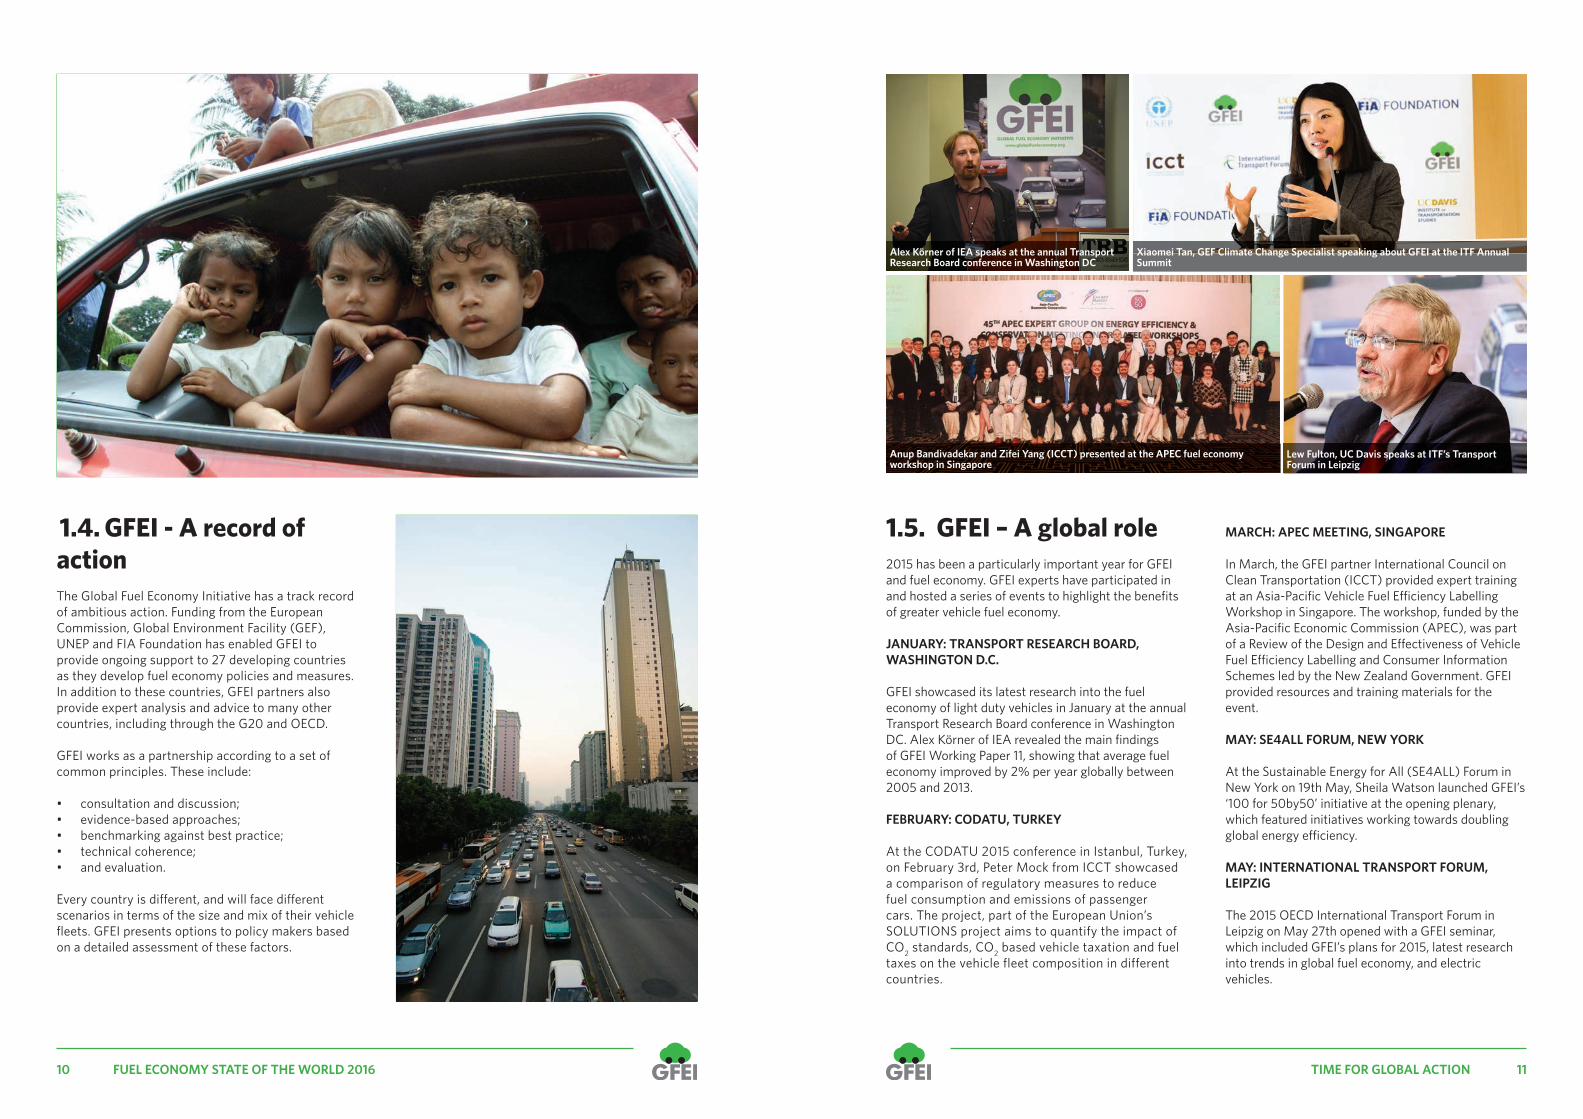
Alex Körner of IEA speaks at the annual Transport Research Board conference in Washington DC
Xiaomei Tan, GEF Climate Change Specialist speaking about GFEI at the ITF Annual Summit
Anup Bandivadekar and Zifei Yang (ICCT) presented at the APEC fuel economy workshop in Singapore
Lew Fulton, UC Davis speaks at ITF’s Transport Forum in Leipzig
1.4. GFEI - A record of action The Global Fuel Economy Initiative has a track record of ambitious action. Funding from the European Commission, Global Environment Facility (GEF), UNEP and FIA Foundation has enabled GFEI to provide ongoing support to 27 developing countries as they develop fuel economy policies and measures. In addition to these countries, GFEI partners also provide expert analysis and advice to many other countries, including through the G20 and OECD.
GFEI works as a partnership according to a set of common principles. These include:
• consultation and discussion; • evidence-based approaches; • benchmarking against best practice; • technical coherence; • and evaluation.
Every country is di¦ erent, and will face di¦ erent scenarios in terms of the size and mix of their vehicle fl eets. GFEI presents options to policy makers based on a detailed assessment of these factors.
1.5. GFEI – A global role2015 has been a particularly important year for GFEI and fuel economy. GFEI experts have participated in and hosted a series of events to highlight the benefi ts of greater vehicle fuel economy.
JANUARY: TRANSPORT RESEARCH BOARD, WASHINGTON D.C.
GFEI showcased its latest research into the fuel economy of light duty vehicles in January at the annual Transport Research Board conference in Washington DC. Alex Körner of IEA revealed the main fi ndings of GFEI Working Paper 11, showing that average fuel economy improved by 2% per year globally between 2005 and 2013.
FEBRUARY: CODATU, TURKEY
At the CODATU 2015 conference in Istanbul, Turkey, on February 3rd, Peter Mock from ICCT showcased a comparison of regulatory measures to reduce fuel consumption and emissions of passenger cars. The project, part of the European Union’s SOLUTIONS project aims to quantify the impact of CO2 standards, CO2 based vehicle taxation and fuel taxes on the vehicle fleet composition in different countries.
MARCH: APEC MEETING, SINGAPORE
In March, the GFEI partner International Council on Clean Transportation (ICCT) provided expert training at an Asia-Pacifi c Vehicle Fuel E� ciency Labelling Workshop in Singapore. The workshop, funded by the Asia-Pacifi c Economic Commission (APEC), was part of a Review of the Design and E¦ ectiveness of Vehicle Fuel E� ciency Labelling and Consumer Information Schemes led by the New Zealand Government. GFEI provided resources and training materials for the event.
MAY: SE4ALL FORUM, NEW YORK
At the Sustainable Energy for All (SE4ALL) Forum in New York on 19th May, Sheila Watson launched GFEI’s ‘100 for 50by50’ initiative at the opening plenary, which featured initiatives working towards doubling global energy e� ciency.
MAY: INTERNATIONAL TRANSPORT FORUM, LEIPZIG
The 2015 OECD International Transport Forum in Leipzig on May 27th opened with a GFEI seminar, which included GFEI’s plans for 2015, latest research into trends in global fuel economy, and electric vehicles.

12 13FUEL ECONOMY STATE OF THE WORLD 2016 TIME FOR GLOBAL ACTION
Source: OICA (2015)
-
5,000,000
10,000,000
15,000,000
20,000,000
25,000,000
Num
ber o
f veh
icle
s so
ld
Registrations or sales of new vehicles (all vehicles) (2014)FIGURE 4 Road transport vehicles sales 2014
FIA Foundation’s Sheila Watson speaks at the 2015 OECD International Transport Forum in Leipzig
The Global Environment Facility gave a presentation which highlighted the importance of supporting GFEI and funding sustainable transport initiatives in the future.
Sheila Watson presented GFEI’s work and the ‘100for50by50’ commitment to the Forum’s plenary gathering of over 60 transport ministers.
JUNE: CLIMATE TALKS, BONN
In June, over 190 parties to the UNFCCC global climate framework gathered in Bonn to discuss and agree a draft text for COP21. Sheila Watson addressed a Technical Experts Group on energy e� ciency and urban transport, highlighting the potential benefi ts of improved fuel e� ciency in urban areas, and the role of GFEI in securing those benefi ts.
JUNE: GFEI GLOBAL TRAINING WEEK, PARIS
GFEI’s Global Training Week, held in Paris included over 50 participants from over 30 di¦ erent countries. Participants heard from a range of GFEI experts, as well as sharing their own experiences. The meeting was also addressed by Stephane Crouzat, Diplomatic Counseller to Madame Segolene Royale, Minister for Ecology, Sustainable Development and Energy in the French Government, who highlighted the importance of GFEI to the COP21 Climate Change negotiations.
JUNE: SE4ALL GLOBAL FORUM, VIENNA
Sustainable Energy for All (SE4ALL) hosted an annual meeting of its Global Forum in Vienna, which was attended by a wide range of stakeholders with an interest in energy issues from renewables to e� ciency. Sheila Watson addressed two panels and the High Level Energy E� ciency VIP lunch on the opportunities which 2015 o¦ ers to promote the whole e� ciency agenda.
SEPTEMBER: B4E SUMMIT, LONDON
Sheila Watson chaired a panel of business leaders and experts on the topic of energy e� ciency in mobility and logistics at the B4E Annual Summit in London. The Summit was addressed by the UK Minister for Energy and Climate Change and included a wide range of contributions on the importance of energy e� ciency as the ‘new fuel’, and the support needed to drive forward improvements in performance globally.
SEPTEMBER: SDG SUMMIT
Sheila Watson attended the sustainable development summit in New York as a member of the civic society delegation to witness the formal approval of the SDGs. GFEI has worked hard to incorporate energy e� ciency into the 17 Global Goals. The SDG Summit also marked an important staging post towards the climate talks in Paris.
G20: Supporting the G20 Energy E¦ ciency Action Plan
The Global Fuel Economy Initiative is supporting the International Partnership for Energy E� ciency Cooperation (IPEEC) transport taskforce to take forward the G20 Energy E� ciency Action Plan, a voluntary plan that was agreed at the Brisbane G20 meeting in Australia in November 2014. This work was subsequently re-a� rmed by G20 Energy Ministers in Turkey in 2015. The action plan aims to be practical and to strengthen voluntary energy e� ciency collaboration in a fl exible way. It currently consists of 13 participating economies in the transport work stream: Australia, Brazil, Canada, China, the EU, France, Germany, Italy, Japan, Mexico, Russia, the UK and the US.
The plan states that participating countries should consider “further action in support of GFEI’s overall aim of improving fuel e� ciency” (G20, 2014, paragraph 2.5, page 5). In 2015, this work has included developing recommendations for G20 consideration related to clean fuels, vehicle emissions and vehicle fuel e� ciency, including strengthened domestic standards in G20 countries, in as many
areas as possible. The action plan recognises that “While such standards are applied domestically, in accordance with di¦ ering national circumstances and priorities, international work can accelerate technical development of standards and testing regimes and facilitate voluntary harmonisation. Harmonisation of national standards helps reduce development costs for new vehicles and lessens the regulatory burden. This work will include collaboration and exchange of experiences and best practices on relevant national standards.”
G20 countries accounted for over 90% of vehicle sales in 2014, at around 80 million, and were also responsible for manufacturing 96% of cars produced (Figure 4). Within the G20, there are di¦ erences between countries in terms of the size of their vehicle fl eets and average fuel economy levels. Argentina currently has the lowest level of annual sales, at 613,848 in 2014, compared with China, which sold 23 million.
Energy consumption from road transport is increasing signifi cantly in many G20 countries. Between 2000 and 2012, China experienced over 200% growth and road energy use also grew signifi cantly in Saudi Arabia, India and Indonesia. (Figure 5).
KEY MESSAGE • IN 2014, G20 COUNTRIES ACCOUNTED FOR 90% OF THE SALES AND 96% OF THE PRODUCTION OF ROAD VEHICLES.

14 15FUEL ECONOMY STATE OF THE WORLD 2016 TIME FOR GLOBAL ACTION
Source: Enerdata (2015)
FIGURE 5 Growth in road transport energy use 2000 to 2012
KEY MESSAGE • IN BETWEEN 2000 AND 2012, ROAD TRANSPORT ENERGY USE GREW STRONGLY IN MOST G20 COUNTRIES.
-50%
0%
50%
100%
150%
200%
250%
Change in road transport energy consumption 2000-2012
Road transport makes up around 90% of all transport energy consumption in G20 countries. The relative importance of the transport sector in energy consumption for G20 countries depends on a range of factors, including levels of income and importance of manufacturing sector and heavy industry. Transport makes up more than 40% of final energy consumption in the US and Mexico, and over 30% in Saudi Arabia, Brazil and Australia, whereas this proportion is currently less than 15% in India and China.
Improved vehicle fuel economy has potentially massive economic and energy saving benefits for G20 countries. As Part 3 sets out, many G20 countries have fuel economy standards, with 14 of the 20 economies in the G20 covered by mandatory fuel economy standards, accounting for three quarters of global light-duty vehicle sales. Currently 16 out of 19 countries in the G20 have vehicle labelling schemes for fuel economy (the EU also has a scheme). Fuel economy labels can also be linked to other tax-based incentives. Many countries also have subsidy schemes to promote electric vehicles.
COP21 - The “100 for 50 by 50” campaign
The 21st session of the Conference of the Parties (COP21) to the United Nations Framework Convention on Climate Change (UNFCCC), meeting in Paris in December 2015, aims to achieve a new international agreement to keep global warming below 2 degrees centigrade in 2050 (compared with the climate of the pre-industrial era in 1850). Improved vehicle fuel economy is vital for mitigating climate change as part of a package of measures to limit and reduce carbon emissions from transport.
The Global Fuel Economy Initiative is recognised as an ‘Accelerator’ of Sustainable Energy for All (SE4All), and a ‘High Impact Opportunity’ for improving energy e�ciency. This led to GFEI being showcased at the United Nations during the 2014 Climate Summit in New York.
GFEI has developed the ‘100 countries for 50by50’ campaign in order to influence these key global policy agendas. The aim is to secure the engagement of 100
key countries in a commitment to the GFEI target of 50by50. By supporting the improvements in fuel economy which GFEI promotes, and which are based on existing cost-e¦ective technologies, these ‘100 countries for 50by50’ supporters will be helping to put the world on a path to more sustainable mobility. All GFEI supporting countries make the following commitment:
• Global commitment – to publically support the GFEI’s target to double fuel economy of the global passenger vehicle fleet by 2050, and for new passenger vehicles by 2030.
• Domestic commitment – to develop and adopt national policies to improve fuel economy for new passenger vehicles, consistent with GFEI targets, recognising that each country starts from its own baseline.
• Resources and engagement commitment – to actively contribute to the e¦orts of the GFEI, which could include: – Sending representatives to the annual GFEI
training summit – Dedicating sta¦ time to develop fuel economy
databases and policies, in collaboration with GFEI partner organisations
– Engaging in regional initiatives on fuel economy as appropriate, and provide technical or financial support to these e¦orts as available.
At COP21, GFEI will announce the involvement of several key countries as part of ‘100for50by50’.
A place in the SDGsTransport was largely missing from the Millennium Development Goals. However, after a great deal of careful and targeted work, GFEI partners are delighted to see that Energy E�ciency is reflected in Goal 7 of the new SDG framework – “Ensure access to a¦ordable, reliable, sustainable, and modern energy for all”. These goals which were agreed in September 2015, are supported by a range of key indicators. GFEI’s own tracking data will play an important role in helping to track progress on SDG 7.
GFEI worked towards SDG 7 with a range of key partners including Sustainable Energy For All (SE4ALL). SE4ALL recognises fuel economy as a high impact opportunity for transport e�ciency, and has included transport as part of its sustainable energy tracking framework.
Sharing knowledge and experiences, and capacity building are part of the key principles GFEI is based on. Together with the unique expertise we can o¦er, GFEI is part of a global move to action towards sustainable development, improved energy e�ciency and addressing climate change.

16 17FUEL ECONOMY STATE OF THE WORLD 2016 TIME FOR GLOBAL ACTION
Capacity Building
GFEI helps capacity building for fuel economy policy in countries around the world.
Strong evidence base
GFEI brings together leading global experts in the fi eld of fuel economy, and including the only global data on fuel economy trends.
Awareness raising
GFEI helps shape a series of global processes on energy e� ciency and fuel economy.
The Global Fuel Economy Initiative’s fuel economy work is directly relevant to two of these seventeen goals, focused on improving energy e� ciency and tackling climate change.
Goal 7 of the Global Goals aims to ensure access to a¦ ordable, reliable, sustainable and modern energy for all. As part of this, target 7.3 aims to double the global rate of improvement in energy e� ciency. This includes vehicle fuel economy.
Goal 13 aims to take urgent action to combat climate change and its impacts. The transport sector is responsible for nearly a quarter of CO2 emissions, and improved fuel economy can help reduce this.
30% reductionin L/100km by 2020 in all new cars in OECD countries
50% reductionin L/100km by 2030 in all new cars globally
50% reductionin L/100km by 2050 in all cars globally
Global Goals
The UN in 2015 committed to 17 Global Goals, a series of ambitious targets for everyone, to end extreme poverty and tackle climate change.
GLOBAL GOAL 7
GFEI’S WORK:
GLOBAL GOAL 13
THE GFEI FUEL ECONOMY TARGETS:
GLOBAL GOALS AND THE GLOBAL FUEL ECONOMY INITIATIVE (GFEI)
GFEI
The Global Fuel Economy Initiative (GFEI) is a partnership of 6 organisations, the FIA Foundation, IEA, ICCT, ITF, UNEP, and UC Davis promoting vehicle fuel economy worldwide.
50%
30%
50%

18 19FUEL ECONOMY STATE OF THE WORLD 2016 TIME FOR GLOBAL ACTION
This timeline picks out a number of key events since GFEI was established in 2009, including major reports, political commitments, and new policies and standards to improve fuel economy.
2014
GFEI State of the World report launched
GFEI included in draft Sustainable Development Goals
GEF awards support for fuel economy policies in 6 more countries
GFEI included in G20 Action Plan on Energy E� ciency
GFEI ‘Accelerator’ meeting in Paris on fuel e� ciency
GFEI addresses UN General Assembly at New York Climate Summit
2013
Updated international comparison of fuel economy published
GFEI presents at UN open working group on new Sustainable Development Goals for energy
GFEI identifi ed as ‘high impact opportunity for Sustainable Energy for All (SE4ALL)
UC Davis joins GFEI
Chile adopts fuel economy label
2012
GFEI launched in Africa
GFEI part of commitments sustainable transport at Rio +20
GFEI launches new work programme for 2012-2015
ICCT joins partnershipPresident Obama’s global climate initiative at the Major Economies Forum backs GFEI
Global Environment Facility supports GFEI
2009
GFEI is launched at Geneva Motorshow
2010
GFEI launches report on fuel economy in South East Asia
GFEI presents at Low Carbon Vehicle Conference, London
GFEI at COP16 in Cancun
2011
GFEI launches report on car scrappage schemes in Europe
GFEI publishes fi rst international comparison of light-duty vehicle fuel economy – presented at Challenge Bibendum in Berlin
GFEI presents policy ideas to Chilean Minister of Environment
Paris Climate Change COP – December 2015
Thailand introduces new fuel economy label
2015
GFEI publishes latest update on fuel economy worldwide (2008-2013)
Government of Kenya announces plans for new fuel economy scheme
UN agrees energy e� ciency and other SDGs in New York - September
GFEI launch 100 countries campaign at Sustainable Energy for All (SE4ALL) Forum in New York
GFEI Global Training, Paris
GFEI timeline
20 21FUEL ECONOMY STATE OF THE WORLD 2016 TIME FOR GLOBAL ACTION
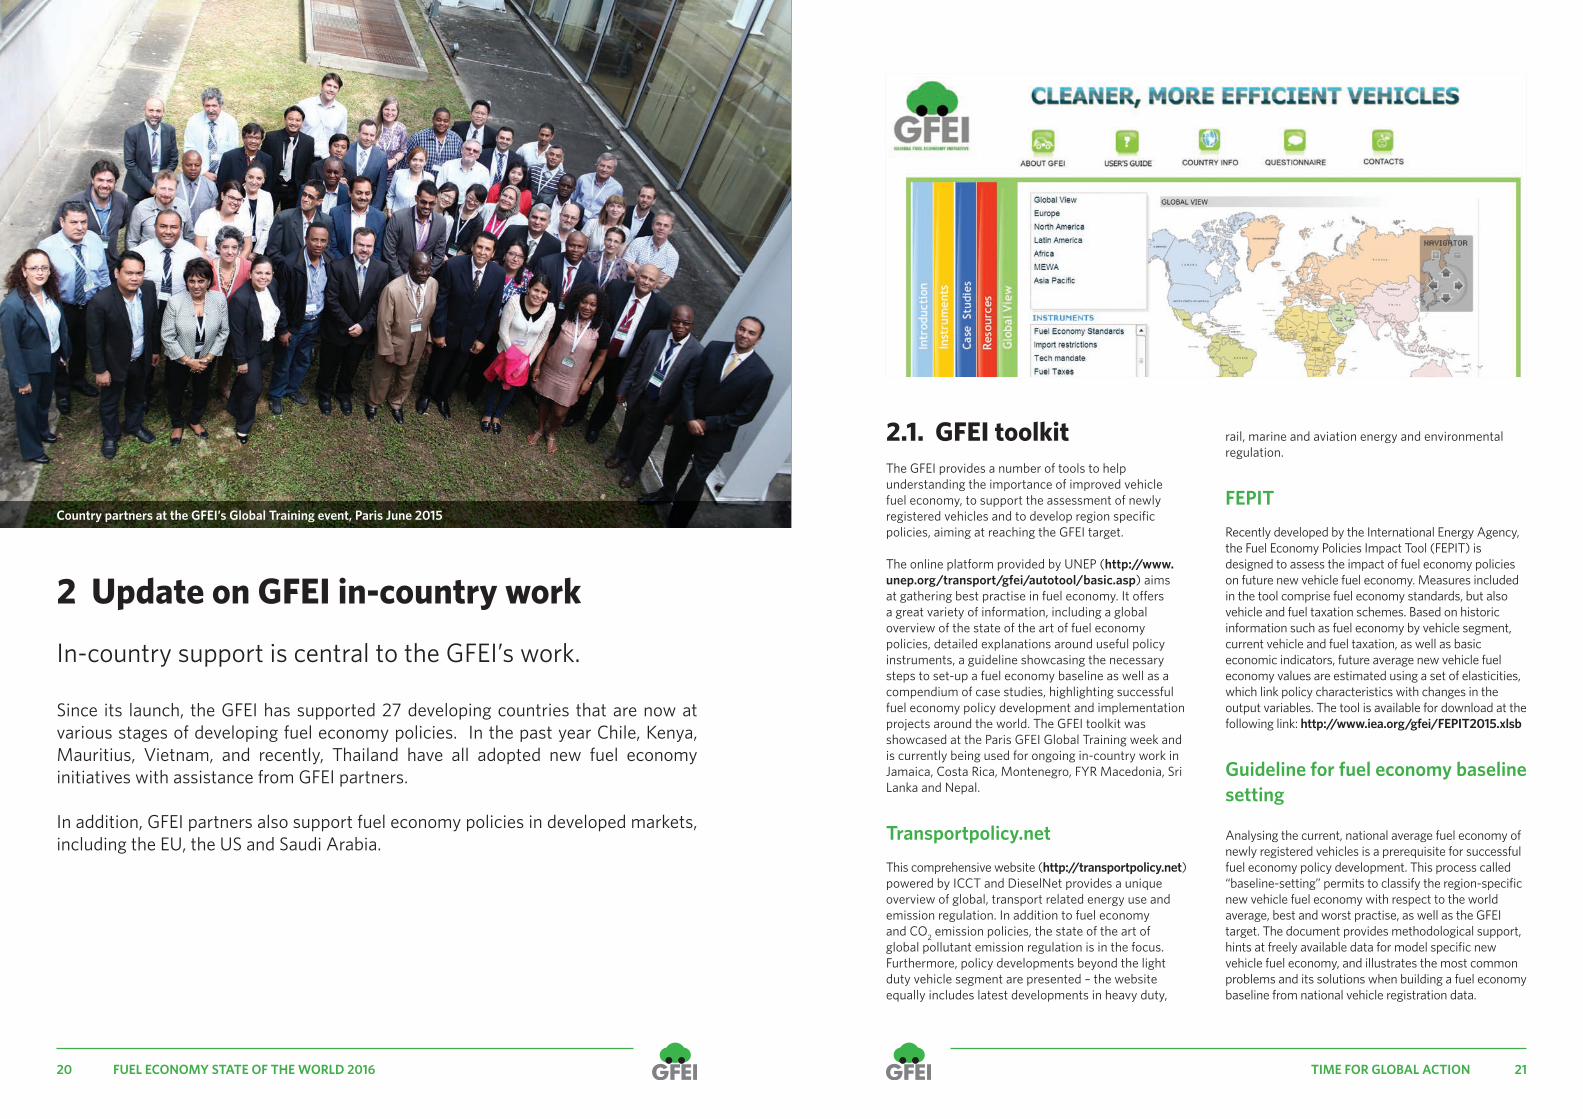
Country partners at the GFEI’s Global Training event, Paris June 2015
2.1. GFEI toolkitThe GFEI provides a number of tools to help understanding the importance of improved vehicle fuel economy, to support the assessment of newly registered vehicles and to develop region specifi c policies, aiming at reaching the GFEI target.
The online platform provided by UNEP (http://www.unep.org/transport/gfei/autotool/basic.asp) aims at gathering best practise in fuel economy. It o¦ ers a great variety of information, including a global overview of the state of the art of fuel economy policies, detailed explanations around useful policy instruments, a guideline showcasing the necessary steps to set-up a fuel economy baseline as well as a compendium of case studies, highlighting successful fuel economy policy development and implementation projects around the world. The GFEI toolkit was showcased at the Paris GFEI Global Training week and is currently being used for ongoing in-country work in Jamaica, Costa Rica, Montenegro, FYR Macedonia, Sri Lanka and Nepal.
Transportpolicy.netThis comprehensive website (http://transportpolicy.net) powered by ICCT and DieselNet provides a unique overview of global, transport related energy use and emission regulation. In addition to fuel economy and CO2 emission policies, the state of the art of global pollutant emission regulation is in the focus. Furthermore, policy developments beyond the light duty vehicle segment are presented – the website equally includes latest developments in heavy duty,
rail, marine and aviation energy and environmental regulation.
FEPITRecently developed by the International Energy Agency, the Fuel Economy Policies Impact Tool (FEPIT) is designed to assess the impact of fuel economy policies on future new vehicle fuel economy. Measures included in the tool comprise fuel economy standards, but also vehicle and fuel taxation schemes. Based on historic information such as fuel economy by vehicle segment, current vehicle and fuel taxation, as well as basic economic indicators, future average new vehicle fuel economy values are estimated using a set of elasticities, which link policy characteristics with changes in the output variables. The tool is available for download at the following link: http://www.iea.org/gfei/FEPIT2015.xlsb
Guideline for fuel economy baseline setting
Analysing the current, national average fuel economy of newly registered vehicles is a prerequisite for successful fuel economy policy development. This process called “baseline-setting” permits to classify the region-specifi c new vehicle fuel economy with respect to the world average, best and worst practise, as well as the GFEI target. The document provides methodological support, hints at freely available data for model specifi c new vehicle fuel economy, and illustrates the most common problems and its solutions when building a fuel economy baseline from national vehicle registration data.
In-country support is central to the GFEI’s work.
Since its launch, the GFEI has supported 27 developing countries that are now at various stages of developing fuel economy policies. In the past year Chile, Kenya, Mauritius, Vietnam, and recently, Thailand have all adopted new fuel economy initiatives with assistance from GFEI partners.
In addition, GFEI partners also support fuel economy policies in developed markets, including the EU, the US and Saudi Arabia.
2 Update on GFEI in-country work

22 23FUEL ECONOMY STATE OF THE WORLD 2016 TIME FOR GLOBAL ACTION
BOX 1:
3 EUROPEAN UNION - DEVELOPMENT OF A POST-2021 FUEL ECONOMY TARGET
In the EU, analysis to prepare the process of setting a vehicle fuel economy target for 2025 is currently carried out. This involves reviewing the costs of complying with existing targets, which has consistently been cheaper than originally anticipated by the manufacturers. The work on an EU technology cost curve assessment for the post-2021 timeframe is ongoing.
2 CHILE – CARBON TAX
Chile introduced a carbon tax in January 2015 to promote vehicle fuel economy. The tax is applied to new car purchases based on both CO2 and NOx emissions, e¦ ectively integrating vehicle emission standards into the scheme. The tax which must be paid at the moment of the purchase, applies to every new light-duty vehicle (LDV) and medium-duty vehicle (MDV). The tax builds on the fuel economy labelling scheme introduced in Chile in 2013.
4 KENYA – AGE-BASED TAX ON SECOND-HAND VEHICLE IMPORTS
In September 2015, Kenya adopted an age-based taxation scheme for imported second-hand vehicles that will raise the tax for imported second-hand vehicles older than 3 years by 150% and reduce tax to 30% for vehicles younger than 3 years. The Bill also provides tax-breaks for vehicles with smaller and more e� cient engines.
7 SAUDI ARABIA – NEW VEHICLE STANDARDS
The Kingdom of Saudi Arabia (KSA) announced new light-duty vehicle (LDV) fuel economy standards in November 2014 for all new and used passenger vehicles and light trucks, whether imported from outside or manufactured in Saudi Arabia. They will be e¦ ective as of January 1, 2016, and will be fully phased in by December 31, 2020. A review of the targets will be carried out by December 2018, at which time targets for 2021–2025 will be set.
6 THAILAND – EXCISE TAX INCENTIVES FOR IMPROVED FUEL ECONOMY
In Thailand, all manufacturers and importers of light-duty vehicles are mandated to display the Eco-Sticker on windshields to inform consumers about the emissions, safety, and fuel economy rating of new cars from October 2015. The Eco-Sticker includes CO2 rating, fuel economy, as well as vehicle pollutant emissions and will be the basis of revised excise tax rates from 1 January 2016 on. The revised taxation scheme will favour passenger vehicles running on alternative fuels, as well as hybrids and other vehicles with emissions of less than 150 gCO2/km.
1 UNITED STATES - REVIEW OF 2022-2025 PROPOSED FUEL ECONOMY STANDARDS
The mid-term review of the proposed fuel economy standards for the 2022 to 2025 time frame is currently being prepared in the US. This includes assessing the rate of technology development since the technology assessments that the Agencies (EPA, CARB, NHTSA) undertook almost 4 years ago for the 2017-25 standards. This research, which will be published in a series of technology briefi ngs will evaluate recent technology developments and progress rates with respect to the targets in the 2025 fuel economy and GHG rule. Each technology brief will evaluate a number of parameters such as technology penetration rates, cost reductions, improvement in vehicle fuel economy, customer acceptance issues, real-world fuel economy, performance, drivability, reliability, and safety.
5 VIETNAM – FUEL ECONOMY LABELLING
In 2015, the Vietnamese government has mandated a fuel economy labelling program for locally assembled and imported cars with up to 7 seats. The car manufacturers or importers are obliged to publish fuel economy data for car models tested in Vietnam or in foreign renowned laboratories.
FUEL ECONOMY POLICY HIGHLIGHTS IN 2015

24 25FUEL ECONOMY STATE OF THE WORLD 2016 TIME FOR GLOBAL ACTION
Policy in Place
FE Policy in Progress
FIGURE 6 Fuel Economy Policy Map
The map shows countries that have adopted policies such as specifi c CO2 emission or fuel economy standards, fi scal measures (for example feebate systems or tax incentives for fuel e� cient vehicles) or information campaigns (for example labelling schemes).
The label “Policy in place” is given when countries are implementing or have already implemented the policies. The label “Policy in Progress” is attributed when concrete activities are undertaken by government and stakeholders to develope these measures. The Principal Secretary of the Ministry of Energy and Petroleum and the Director General of the Energy Regula-
tory Commission (ERC) together with UNEP’s Rob de Jong launch the Kenya Fuel Economy Policy Report.
14 May, 2015. The study, which was carried out by the Makerere University as part of GFEI support to Uganda shows that the average vehicle fuel e� ciency in Uganda is getting worse over time. This is mainly due to the import of older vehicles in recent years. While the average age of diesel vehicles imported into Uganda in 2005 was 10 years, it increased to 18 years in 2014. Identifi ed next steps to improve vehicle fuel e� ciency in Uganda include the preparation of an implementation plan, continued public awareness rising and the provision of additional funding. Furthermore, Uganda also included the GFEI in its Nationally Appropriate Mitigating Action (NAMA) reports.
Middle East and North AfricaIn February, GFEI, through CEDARE and United Nations Environment Program (UNEP) presented the fi ndings of four case studies at an event in Cairo. The studies were conducted to assess fuel economy and carbon emissions of light duty vehicles in Egypt, Tunisia, Bahrain, and Morocco, and to review relevant regulations.
ALGERIA
The Algeria National Agency for the Promotion and Rationalization of Energy Use (APRUE) is promoting
cleaner fuels and more fuel e� cient vehicles in Algeria. A national workshop to discuss policy options to improve vehicle fuel e� ciency was held on June 3-4 2015 in Algiers, Algeria. Average vehicle fuel e� ciency in Algeria improved from 7.5l/100km in 2005 to 7.0l/100km in 2013, which may mostly be attributed to the government’s policy to import new vehicles only.
Eastern Europe and Caucuses FYR MACEDONIA
In FYR Macedonia, a summary of all of relevant automotive fuel economy-related EU Directives has been drafted and currently REC Macedonia is checking the status of transposition with the Ministry of Economy. Furthermore, the baseline data is being updated based on the most representative makes/models.
MONTENEGRO
In Montenegro, a fi rst working group meeting has been held. The roles and responsibilities of the work group members have been allocated, in order to a) provide a review of national legislation and current policy (including taxation) related to fuel economy
2.2. National progress
AfricaCOTE D’IVOIRE
The ICCT have provided technical support to Cote d’Ivoire to analyse their average new vehicle fuel economy data, which due to constraint availability of data is based on the top nine selling models. The average rates for this portion of the market (about a third) are 8.1 liters/100km or roughly 210 g CO2/km. In April, the country signed an agreement for GEF 5 GFEI activities. Under this contract it is proposed that the government develops and implements a vehicle data entry tool that will capture all the parameters necessary for GFEI analysis. In addition to updating the average auto fuel economy trends in the country, the support will include preparation of policy recommendations, an implementation strategy and public outreach campaign to improve the country’s fuel economy.
BENIN
An assessment of the vehicle inventory and import trends is being conducted in order to establish the fuel economy baseline of the vehicle fl eet in Benin.
MAURITIUS
In November 2014, Mauritius fi nalised and presented its vehicle fuel economy baseline to stakeholders. Mauritius fi rst introduced a feebate system in 2011 that taxes ine� cient vehicles and provides a rebate for more fuel economic vehicles. The updated vehicle fuel economy inventory provides evidence that fuel economy policies in developing and transition countries can increase the import of more fuel e� cient vehicles. The average vehicle fuel economy improved from an average of 7 l/100km in 2005 to 6.6 l/100km in 2013, which is particularly important given the country’s vehicle fl eet growth of 60% between 2003 and 2013.
A new agreement has been signed with the Ministry of Environment, Sustainable Development, and Disaster and Beach Management in April 2015 to support the update of the average light and heavy duty vehicle fuel economy for the years 2014 and 2015; review current policies and develop an implementation roadmap for additional policies to encourage import of more fuel e� cient vehicles.
UGANDA
A one-day workshop to present the preliminary results of the GFEI baseline study and proposed policy recommendations was held in Kampala, Uganda on

26 27FUEL ECONOMY STATE OF THE WORLD 2016 TIME FOR GLOBAL ACTION
Source: UNEP analysis for GFEI
FIGURE 7 Baseline Light-Duty Vehicle Fuel Economy and Trends
KEY MESSAGE • NATIONAL AVERAGE FUEL ECONOMIES IN DEVELOPING MARKETS SHOW LARGE DIFFERENCES AMONG THE COUNTRIES. UNLIKE MOST BIG, DEVELOPED MARKETS, FUEL ECONOMY OF NEWLY REGISTERED LIGHT DUTY VEHICLES IS STAGNATING OR EVEN WORSENING OVER THE MONITORED LAST EIGHT YEARS.
A core part of GFEI’s work is to support countries to develop baselines and evidence from which fuel economy policies can be developed. This also helps countries to track progress and evaluate the impact of policy changes to promote fuel economy.
GFEI has supported the development of baseline analysis of vehicle fleets in 17 developing countries. Due to di¦erences in vehicle registration systems and monitoring, there are considerable di¦erences in the data available between countries. For example, the Cote D’Ivoire baseline analysis was based only on the 9 top selling cars, whereas in the Philippines the analysis was only carried out for the year 2013. Nevertheless, Figure 7 shows the range of di¦erent fuel economy performance in between countries, and gives an indication of relative performance and trends.
Similar to big, developed vehicle markets, the national average fuel economies of new light duty vehicles show large di¦erences. These di¦erences can generally be linked to:
• The share of used imported vehicles• The absence or presence of light duty vehicle
production capacity within the country• The average price of fuels• The level of taxation of light duty vehicles
Unlike the big, developed markets, average fuel economies of newly registered cars stagnated over the eight years or even worsened over time, e.g. in Georgia, Kenya and Uganda. While this is often linked to the trend to buy bigger cars, it clearly shows the potential of introducing e¦ective fuel economy policies to reverse this trend over time.
BOX 2:
IN-COUNTRY WORK TO ESTABLISH FUEL ECONOMY BASELINES
The graph shows that countries like the US, the member states of the EU, Japan but also China, have put in place policies and see the e�ciency of their fleets rapidly improving. These countries have also put in place targets (represented by dotted lines) that go beyond 2015. Many of the non-OECD countries see a flat line with little or no fuel economy improvement and no policies as well as long term targets in place. Howev-er, there are a few countries like Mauritius that show improvement after policies have been adopted. Many of the countries that have no policies in place show worsening av-erage fuel economy. The graph also shows, that in some countries like Tunisia and Morocco, the average fuel consumption of vehicles is near the GFEI target of 4L/100km. This is mainly due to the fact that their vehicle fleet is mainly composed of second-hand vehicles coming from Europe, particularly France, which are already fuel e�cient.
Philippines, Sri Lanka, Uganda, and Uruguay are part of the proposed countries in the EC project. Nepal has also undertaken auto fuel economy baseline study, but requires more information to su�ciently set the baseline.
issues; b) identify key stakeholders and potential barriers to implement fuel economy policy; c) analyse the relevant EU Directives that set vehicle emission standards; and d) set up a roadmap for transposition of these EU Directives to national legislation.
GEORGIA
Georgia has completed a fuel economy baseline (2008-2012), and a white paper on taxation has been submitted to government. The white paper stresses the need for taxation reform in order to improve the fuel economy of the automotive fleet. Analysis of the Georgian car fleet (both imported new and used vehicles) from 2008, 2010, 2011 and 2012 using the GFEI Fuel Economy Policies Impact Tool (FEPIT) has been carried out and a list of actions was produced that will inform the development of a national car fuel economy improvement plan in Georgia.
South America and Caribbean PERU
The GFEI and our regional partner Centro Mario Molina Chile are supporting the development of cleaner and more e�cient fuels and vehicle policies in Peru. This involved the development of a fuel economy baseline using data from 2006-2012, as well as presenting a Strategy for Cleaner and More E�cient Vehicles presented to government.
URUGUAY
In Uruguay, GFEI has been helping to complete a fuel economy baseline based on 2012 vehicle data. The findings have been presented to the working group and the stakeholders. As follow-up a labeling scheme as well as fuel economy policies will be developed in corporation with Centro Mario Molina Chile.
JAMAICA
In July, GFEI was launched in Jamaica at an event organised by the University of Technology, Jamaica (UTech) in Kingston, with the financial support of the Global Environmental Fund (GEF). The event marks the first milestone towards strengthening vehicle emission and fuel quality standards and promoting fuel economy to support a more fuel e�cient auto fleet.
COSTA RICA
In September 2015, the Global Fuel Economy Initiative presented a new report on CO2 emissions and fuel economy of new imported light duty vehicles based
on data from 2008-2014. The average vehicle age in Costa Rica is about 15 years, which is a major challenge to the country’s goal of being carbon neutral by 2021. The report recommends the introduction of a vehicle labelling scheme to highlight important information on fuel economy and CO2. Furthermore the report suggests the adoption of emissions standards for new and used vehicles imported into the country, taxation of ine�cient vehicles, as well as to continue with fuel quality improvements in order to being able to take advantage of the best technologies available in the market.
BRAZIL
In Brazil, ICCT have recently released the first analysis comparing technology adoption and vehicle e�ciency between Brazil and other major vehicle markets worldwide. The analysis concludes that Brazil lags behind most other markets in the adoption of such e�ciency technologies. As a result, Brazil has relatively ine�cient vehicles when compared to countries with vehicles of similar and even higher average weight. For example, the average new Brazilian vehicle consumes about 18% more energy than the average new vehicle in Japan, even though Brazilian vehicles are, on average, 8% lighter than the average Japanese car. An upcoming analysis will evaluate the technology potential and costs to align vehicle e�ciency in Brazil with the world leaders.
AsiaINDONESIA
In November 2014, Komite Penghapusan Bensin Bertimbel (KPBB) together with the Ministry of Environment and Energy organised a workshop to facilitate the dialogue between key stakeholders, to initiate binding commitments on fuel economy in Indonesia. A cost-benefit analysis on cleaner fuels and fuel economy has been conducted, highlighting a net benefit of $70 billion from fuel savings for the next 26 years, in case fuel e�ciency standards were adopted.
ASEAN
GFEI also participated in an Experts’ Group on Accelerating Fuel Economy Policies in the ASEAN region. The group discussed strategies to incorporate fuel economy into relevant ASEAN working groups and to develop and harmonise fuel economy policies and measures within the region. Furthermore, the development of a roadmap for fuel economy policies in the ASEAN region, which should provide a comprehensive guide for policymakers has been discussed.

Source: GFEI Working Paper 11 (GFEI 2015)
FIGURE 8 Average new LDV fuel economy by country normalised to the NEDC test cycle, 2005 to 2013
0.0
2.0
4.0
6.0
8.0
10.0
Japa
n
Fran
ce
Italy
Turk
ey
Uni
ted
King
dom
Indi
a
Germ
any
Mac
edon
ia
Peru
Sout
h Ko
rea
Thai
land
Sout
h Af
rica
Arge
ntina
Mal
aysi
a
Egyp
t
Braz
il
Indo
nesi
a
Ukr
aine
Chile
Mex
ico
Chin
a
Phili
ppin
es
Russ
ia
Aust
ralia
Cana
da
USA
Wor
ld
EU 2
8
OEC
D
non-
OEC
D
Lge/
100k
mno
mal
ized
to N
EDC
2005
2008
2010
2011
2012
2013
Sales 201363 000 000
KEY MESSAGE • MOST MARKETS HAVE IMPROVED SINCE 2005, BUT THERE IS STILL ALMOST A FACTOR OF TWO BETWEEN THE MOST AND LEAST EFFICIENT MARKETS.
28 29FUEL ECONOMY STATE OF THE WORLD 2016 TIME FOR GLOBAL ACTION
Good evidence must be the basis of any e¦ ective advocacy and policy development. Tracking country progress in fuel economy improvement is one of GFEI’s key contributions to the global evidence base. This work, which is updated on a regular basis and from which more detailed studies are developed, identifi es average fuel economy of new light duty vehicles sold and assesses progress towards the GFEI goal of reducing average fuel consumption (Lge/100km) of new vehicles by 50% by 2030. The GFEI also sponsors research into several other key areas such as electric vehicle market development, and monitors the latest policy and regulatory developments for both light duty and heavy duty vehicles.
3.1. International light-duty vehicle fuel economy comparison Since 2011, GFEI has produced biannual reports tracking global progress towards the GFEI target of doubling the fuel economy of new light duty vehicles by 2030. The latest research, led by the IEA, and published in January 2015 (GFEI 2015) showcases the sales-weighted average fuel economy for the years 2005 to 2013. The paper draws on data for 26 countries, of which 14 are non-OECD countries (Figure 8). While the weighted average fuel economy for new LDVs for OECD countries like the US or the member states of the European Community are o� cially available, the unique value of this report lies in its additional coverage of non-OECD countries including Brazil, Russia, India, China and South Africa.
Average global fuel economy is improving but more still to be done
The latest tracking report concludes that while the global average fuel economy is improving, more needs to be done to meet the GFEI target to cut by
half the specifi c fuel consumption of new passenger light-duty vehicles (in Lge/100km) by 2030. The global average annual improvement rate of fuel economy has remained close to 2.0% per year since 2005 (Table 2). This represents about two thirds of the 3.1% per year improvement required to reach the GFEI target.
Fuel economy in OECD countries is improving at a much higher rate than in non-OECD countries. OECD countries are improving at a rate of 2.6% on average per year, with more than half of the OECD countries included in the analysis showing improvement rates well above 3.0%. Fuel economy improvement rates in non-OECD countries remain low, with an average improvement of -0.2% annually between 2005 and 2013.
The relative changes in the size of di¦ erent markets have a signifi cant impact on the evolution of the global average fuel economy. The non-OECD passenger car market is now bigger than the OECD market, and has been since 2011. By 2014, the non-OECD market was more than 20% larger than the OECD market (Figure 11). The comparison with 2005 is striking and shows a major shift in the automotive market from OECD to non-OECD countries. While almost 70% of all passenger light duty vehicles were sold in OECD countries in 2005, this share dropped to only 45% in 2014.
3 Update on fuel economy progress

2005 2008 2011 2013 2030
OECD average
average fuel economy(Lge/100km) 8.6 7.9 7.3 6.9
annual improvement rate(% per year)
-2.7% -2.6% -2.6%
-2.6%
Non-OECD
average
average fuel economy(Lge/100km) 7.3 7.4 7.3 7.2
annual improvement rate(% per year)
0.5% -0.4% -0.9%
-0.2%
Global average
average fuel economy(Lge/100km) 8.3 7.7 7.3 7.1
annual improvement rate(% per year)
-2.3% -1.9% -1.8%
-2.0%
GFEI target
average fuel economy(Lge/100km) 8.3 4.2
required annual improvement rate
(% per year)
2005 base year -2.7% 2014 base year -3.1%
Source: GFEI Working Paper 11 (GFEI 2015)
FIGURE 10 Vehicle size evolution, major regions, 2005 to 2013
0%10%20%30%40%50%60%70%80%90%
100%
2005
2008
2010
2011
2012
2013
2005
2008
2010
2011
2012
2013
2005
2008
2010
2011
2012
2013
OECD Non-OECD World
Large SUV
F
E
D
Medium SUV
C
Small SUV
B
A
Vehicle segemetation
Small
Large
Medium
TABLE 2 Fuel economy evolution compared to GFEI target
30 31FUEL ECONOMY STATE OF THE WORLD 2016 TIME FOR GLOBAL ACTION
KEY MESSAGE • THERE IS A GLOBAL TREND TOWARDS MEDIUM SIZED VEHICLES.
OECD countries have a wide range of fuel economy performance
The average fuel economy of the countries covered in this analysis (representing more than 80% of the global market), ranged from 4.9 to 9.0 Litres of gasoline equivalent (Lge) per 100 km (115 to 209 gCO2/km), refl ecting almost a factor of two between the most e� cient and least e� cient markets.
The spectrum of the average fuel economy values is much wider in OECD countries than in non-OECD
countries (Figure 9). The OECD region has both the most and least e� cient markets and contains two main clusters, either well below (Europe, Japan) or well above (North America, Australia) the regional average.
4.0
5.0
6.0
7.0
8.0
9.0
10.0
Lge/
100k
mno
rmal
ized
to N
EDC
OECD Non-OECD
China
US
Japan
India
3 million vehicles
Source: GFEI Working Paper 11 (GFEI 2015)
FIGURE 9 Fuel economy distribution for OECD and non-OECD, 2013
KEY MESSAGE • THE OECD MARKET CONTAINS BOTH THE MOST AND LEAST EFFICIENT MARKETS*. THE DIFFERENCE BETWEEN BOTH ENDS IS ALMOST 100%.
Globally there is convergence towards medium-sized vehicles
Vehicle size is a key factor to determine average fuel economy. Bigger cars tend to be heavier, with a larger frontal area and higher performance, leading to an increased specifi c fuel consumption.
Until 2010, the OECD market, which is historically dominated by medium and large sized vehicles, showed an increasing trend towards smaller vehicles. However, the latest analysis shows a stabilization of sales shares of large vehicles, a growth in the medium-sized vehicle segment and a contraction of the small vehicle segment (Figure 10). In non-OECD countries the share of large vehicles is still signifi cantly lower than within the OECD and the shift in vehicle segmentation from small to medium vehicles is more pronounced than in the OECD. Overall, the share of larger light-duty vehicles is stabilizing, with a constant market share increase for mid-sized sports utility vehicles (SUVs).
An important element behind the recent increase in the share of sports utility vehicles within the OECD is the growing importance of the North American
markets, always characterised by much higher penetration of large passenger vehicles, and the infl uence of shrinking markets in Europe and Japan.
In non-OECD countries, the evolution of consumer preferences, in line with rapidly growing income seems to be the main driver for the increasing sales of larger vehicles. Here, the higher market diversifi cation also plays a signifi cant role with respect to the size shift: more and more models are available over all segments as developing markets grow.
3.2. International policy developments for light-duty vehicle e� ciencyWith Mexico, India and Saudi Arabia adopting fuel economy standards in recent years, the share of markets with fuel economy regulation increased to around 83%. Nonetheless, the remaining 17% of the global car market with no fuel economy regulation in place include growing economies in Southeast Asia and Latin America as well as Africa – vehicle markets, which are likely to see rapid growth in the near and midterm future.

Source: ICCT, 2014a
* Percent reduction in new fl eet fuel consumption estimated from a baseline year (not necessarily fi rst model year of implementation) to the fi nal model year covered by the regulation. Source: TransportPolicy.net ** Total may not appear as the sum of its parts due to rounding.
Source: ICCT, 2014a
FIGURE 12 Global comparison of passenger car e� ciency standards
TABLE 3 Comparison of latest adopted regulations for light-duty vehicle e� ciency
FIGURE 13 Global comparison of light truck e� ciency standards
KEY MESSAGE • MOST OECD MARKETS AS WELL AS MAJOR NON-OECD MARKETS SUCH AS BRAZIL, CHINA AND INDIA HAVE LIGHT DUTY VEHICLE FUEL ECONOMY POLICIES IN PLACE, WHICH ARE TIGHTENING OVER TIME.
Source: ICCT 2014
32 33FUEL ECONOMY STATE OF THE WORLD 2016 TIME FOR GLOBAL ACTION
Fuel economy standards require vehicle manufacturers to meet targets for new vehicle fl eets based on CO2, emissions, fuel consumption, or fuel economy. As of September 2015, ten major markets have adopted LDV e� ciency regulations (Table 3).
Global comparison of passenger vehicle e¦ ciency standards
ICCT tracks and compares corporate average vehicle e� ciency requirements for the new vehicles across countries that have adopted e� ciency standards or comparable fi scal instruments (Figure 12 & Figure 13). To date, the US and Canada have adopted the longest regulatory timeline for LDV GHG standards, extending to 2025. For the EU, China, India, Japan, and South Korea, the stringency of new standards for the 2021-2025 period could determine the global leader in new LDV e� ciency. In Brazil and Mexico, the next several years are a critical period to determine whether these will keep pace with other top vehicle markets.
KEY MESSAGE • ONLY A FEW COUNTRIES HAVE REGULATION FOR LIGHT COMMERCIAL VEHICLES IN PLACE.
Source: OICA, 2015a
FIGURE 11 Market shares of passenger cars (PC) for OECD and non -OECD regions and coverage with fuel economy standards
0%
20%
40%
60%
80%
100%
2005 2014 2005 2014
Market sharewith no FEregulationMarket sharewith FEregulationNon-OECD PLDVmarket
OECD PLDVmarket
KEY MESSAGE • BETWEEN 2005 AND 2013, VEHICLE SALES STRONGLY SHIFTED TO NON-OECD MARKETS. DESPITE THIS SHIFT, WITH INDIA AND SAUDI ARABIA ADOPTING FUEL ECONOMY STANDARDS IN 2014, THE SHARE OF REGULATED MARKETS INCREASED TO ABOUT 83%.

Source: ICCT 2014. ICCT Global Transportation Roadmap Model. http://www.theicct.org/global-transportation-roadmap-model. Percentage reductions in LDV CO2 rates based on ICCT Global Comparison of PV Standards. http://www.theicct.org/info-tools/global-passenger-vehicle-standards. Percentage reductions for India and Brazil include passenger cars only.
FIGURE 14 Progress of adopted light-duty vehicle e�ciency standards towards the 2030 GFEI target
Data labels indicate percentage reduction in new vehicle CO2 rates from 2005 to 2030.
Sales-weighted averages based on projected sales of passenger cars and light commercial vehicles in 2030.
34 35FUEL ECONOMY STATE OF THE WORLD 2016 TIME FOR GLOBAL ACTION
In addition to climate and energy security benefits to society, vehicle e�ciency standards result in fuel savings to vehicle owners and operators that pay back the incremental cost of technologies that improve vehicle e�ciency. The length of time it takes for fuel savings to pay o¦ the initial incremental cost is commonly referred to as the payback period. Regulatory agencies typically publish analyses of regulatory cost-e¦ectiveness in support of their proposed rules, and these analyses are often supplemented by studies from independent research organizations.
Table 4 summarises the findings of cost-e¦ectiveness analyses of light-duty e�ciency standards based on government and ICCT analysis. As shown, the incremental cost of technology has ranged from $400 to $2,100 per vehicle, with payback periods of 1.5 to 5 years. The length of payback is determined by various region-specific factors including technology cost, annual vehicle mileage, fuel prices, and the discount rate used to put future costs and benefits into present value terms.
3.3. International policy developments for heavy-duty vehicle e�ciencyHeavy-duty vehicles (HDVs) encompass a wide range of vehicle types, including large pickups, delivery trucks, long-haul tractors, refuse trucks, urban buses, and coaches. The diversity of heavy-duty fleets – both
in vehicle characteristics and duty cycles – makes regulating their fuel consumption and GHG emissions more challenging than for LDVs. Key components of HDV regulations include the metric for e�ciency or GHG emissions, vehicle types covered (segmentation), test methods for certification, and means of enforcement.
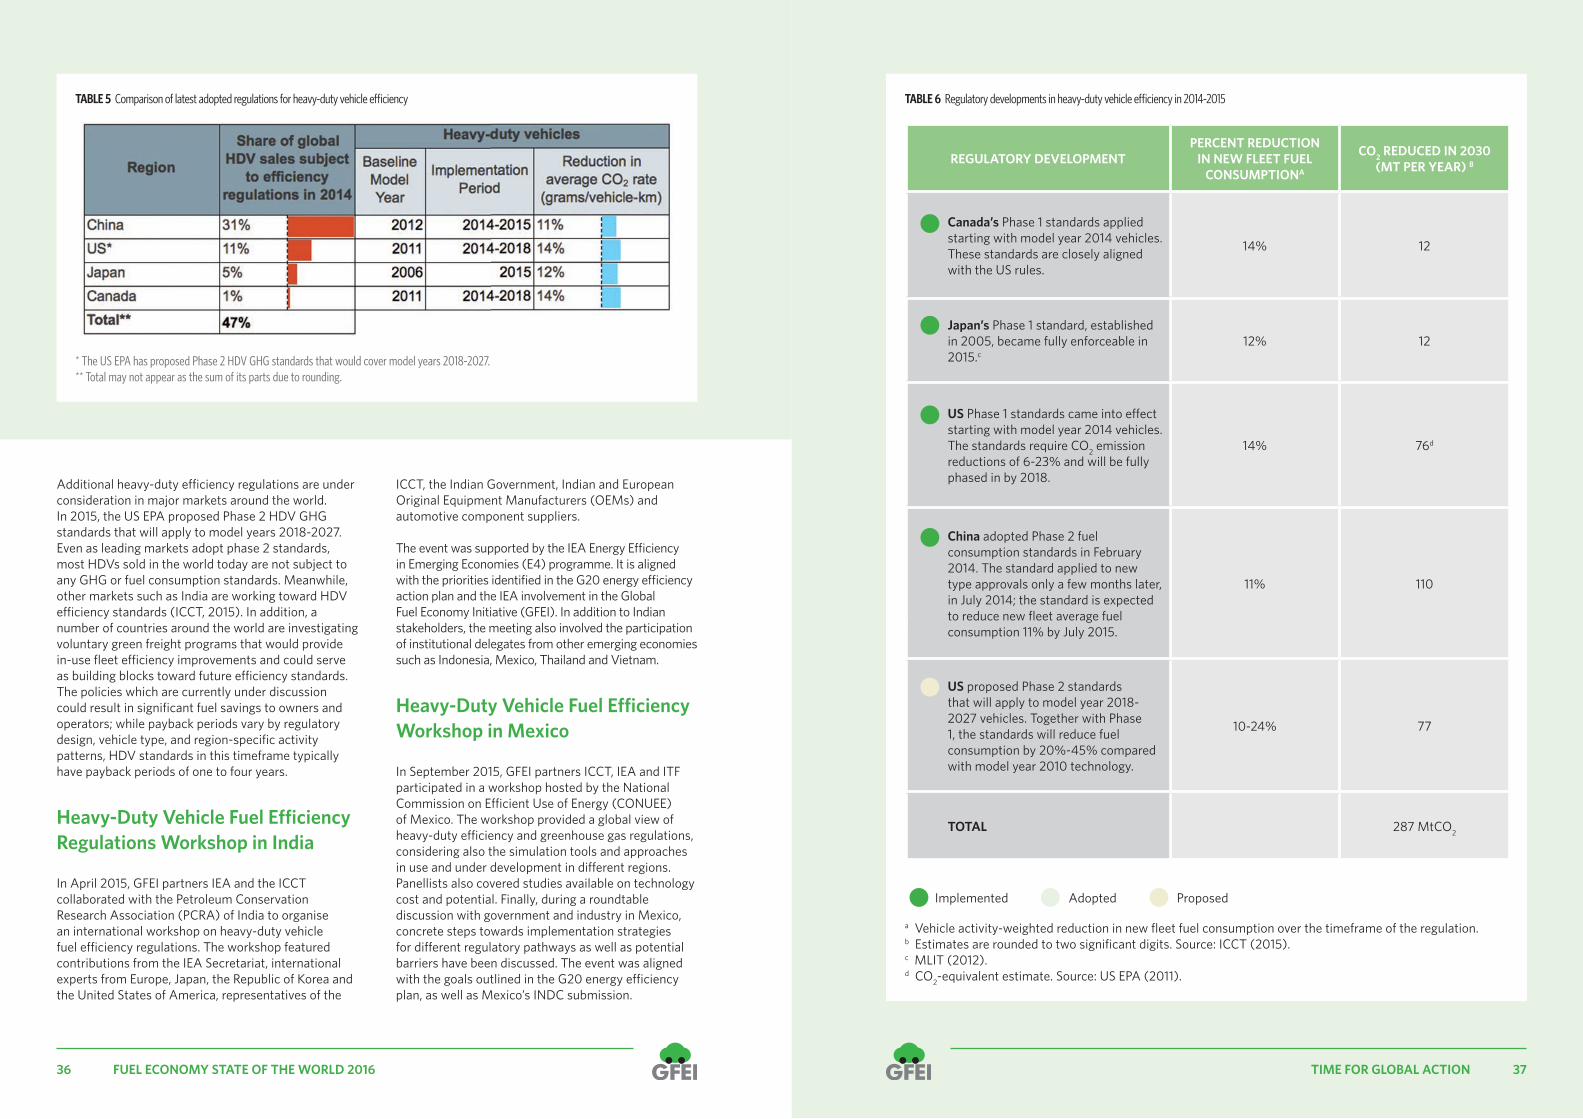
To date, four markets have adopted national e�ciency regulations for heavy-duty trucks and buses (US, Canada, Japan, and China), and each of these regulations has taken e¦ect in the last two years. These four markets covered 47% of new HDVs sold worldwide in 2014 (Table 5).
Studies by the National Academy of Sciences (2010) and TIAX (2009) for the US market and AEA-Ricardo (2011) and TIAX (Law et al., 2011) for the European market have found a technical potential to reduce the fuel consumption of most types of HDVs by 40% to 50% from 2009 to 2020. A comparison of the estimated reductions in fuel consumption indicates that the US, Canada, Japan, and China will capture roughly a third of this potential by 2020 with adopted regulations (Table 6). Drawing on lessons learned from the gap between real-world fuel consumption and laboratory results for LDVs, it is important that markets with adopted HDV standards collect data on the fuel consumption of in-use vehicles to validate the impacts of current policies as they are implemented. With good compliance, recently proposed and implemented regulations could avoid an estimated 287 MtCO2 in 2030.
Impact assessment of light-duty vehicle e¦ciency policies
Figure 14 compares progress under LDV e�ciency standards adopted to date with the 2030 global GFEI target. While some countries are on track to reach a 50% reduction in new LDV fuel consumption by 2030, others would need up to 10 years of continuous
improvement in order to reach a 50% reduction. Among those regions that have adopted LDV e�ciency standards, the sales-weighted average fuel consumption is forecast to be 20% lower in 2030 than in 2005 (without additional standards). Reaching the global GFEI target would require continuous improvements in regions with existing policies and expansion of these policies to cover the remaining 21% of worldwide new LDV sales (forecast in 2030).
KEY MESSAGE • ALMOST 80% OF LIGHT DUTY VEHICLES SOLD IN 2030 WILL BE REGULATED. BASED ON TODAY’S ADOPTED AND ANNOUNCED FUEL ECONOMY TARGETS THEY WILL HAVE ABOUT 27% LOWER SPECIFIC FUEL CONSUMPTION (LGE/100KM) ON AVERAGE, COMPARED TO 2005. THIS IS ABOUT HALF THE IMPROVEMENT NEEDED TO ACHIEVE THE GFEI TARGET OF REDUCING NEW VEHICLES FUEL CONSUMPTION BY 50% COMPARED TO 2005.
Adapted from ICCT, 2015a. Currency units have not been adjusted for inflation.
TABLE 4 Cost-e�ectiveness analyses of light-duty e�ciency standards
RULE PER-VEHICLE COST PAYBACK PERIOD
US LDV 2017-2025 $1,800 3.5 years
US LDV 2012-2016 $950 3 years
California Advanced Clean Cars Program 2017-2025 $1,340 to $1,840 3 years
Canada LDV 2017-2025 $2,095 2-5 years
Canada LDV 2011-2016 $1,195 1.5 years
European 95g CO2/km Standard 2020 €1,300 4-5 years
India LDV 2020 $400 to $600 2-3 years
Source: Lorem ipsum
TABLE 6 Regulatory developments in heavy-duty vehicle e� ciency in 2014-2015
36 37FUEL ECONOMY STATE OF THE WORLD 2016 TIME FOR GLOBAL ACTION
REGULATORY DEVELOPMENTPERCENT REDUCTION
IN NEW FLEET FUEL CONSUMPTIONA
CO2 REDUCED IN 2030 (MT PER YEAR) B
• Canada’s Phase 1 standards applied starting with model year 2014 vehicles. These standards are closely aligned with the US rules.
14% 12
• Japan’s Phase 1 standard, established in 2005, became fully enforceable in 2015.c
12% 12
• US Phase 1 standards came into e¦ ect starting with model year 2014 vehicles. The standards require CO2 emission reductions of 6-23% and will be fully phased in by 2018.
14% 76d
• China adopted Phase 2 fuel consumption standards in February 2014. The standard applied to new type approvals only a few months later, in July 2014; the standard is expected to reduce new fl eet average fuel consumption 11% by July 2015.
11% 110
• US proposed Phase 2 standards that will apply to model year 2018-2027 vehicles. Together with Phase 1, the standards will reduce fuel consumption by 20%-45% compared with model year 2010 technology.
10-24% 77
TOTAL 287 MtCO2
Additional heavy-duty e� ciency regulations are under consideration in major markets around the world. In 2015, the US EPA proposed Phase 2 HDV GHG standards that will apply to model years 2018-2027. Even as leading markets adopt phase 2 standards, most HDVs sold in the world today are not subject to any GHG or fuel consumption standards. Meanwhile, other markets such as India are working toward HDV e� ciency standards (ICCT, 2015). In addition, a number of countries around the world are investigating voluntary green freight programs that would provide in-use fl eet e� ciency improvements and could serve as building blocks toward future e� ciency standards. The policies which are currently under discussion could result in signifi cant fuel savings to owners and operators; while payback periods vary by regulatory design, vehicle type, and region-specifi c activity patterns, HDV standards in this timeframe typically have payback periods of one to four years.
Heavy-Duty Vehicle Fuel E¦ ciency Regulations Workshop in India
In April 2015, GFEI partners IEA and the ICCT collaborated with the Petroleum Conservation Research Association (PCRA) of India to organise an international workshop on heavy-duty vehicle fuel e� ciency regulations. The workshop featured contributions from the IEA Secretariat, international experts from Europe, Japan, the Republic of Korea and the United States of America, representatives of the
ICCT, the Indian Government, Indian and European Original Equipment Manufacturers (OEMs) and automotive component suppliers.
The event was supported by the IEA Energy E� ciency in Emerging Economies (E4) programme. It is aligned with the priorities identifi ed in the G20 energy e� ciency action plan and the IEA involvement in the Global Fuel Economy Initiative (GFEI). In addition to Indian stakeholders, the meeting also involved the participation of institutional delegates from other emerging economies such as Indonesia, Mexico, Thailand and Vietnam.
Heavy-Duty Vehicle Fuel E¦ ciency Workshop in Mexico
In September 2015, GFEI partners ICCT, IEA and ITF participated in a workshop hosted by the National Commission on E� cient Use of Energy (CONUEE) of Mexico. The workshop provided a global view of heavy-duty e� ciency and greenhouse gas regulations, considering also the simulation tools and approaches in use and under development in di¦ erent regions. Panellists also covered studies available on technology cost and potential. Finally, during a roundtable discussion with government and industry in Mexico, concrete steps towards implementation strategies for di¦ erent regulatory pathways as well as potential barriers have been discussed. The event was aligned with the goals outlined in the G20 energy e� ciency plan, as well as Mexico’s INDC submission.
a Vehicle activity-weighted reduction in new fl eet fuel consumption over the timeframe of the regulation.b Estimates are rounded to two signifi cant digits. Source: ICCT (2015).c MLIT (2012).d CO2-equivalent estimate. Source: US EPA (2011).
Implemented Adopted Proposed
* The US EPA has proposed Phase 2 HDV GHG standards that would cover model years 2018-2027.** Total may not appear as the sum of its parts due to rounding.
TABLE 5 Comparison of latest adopted regulations for heavy-duty vehicle e� ciency

38 39FUEL ECONOMY STATE OF THE WORLD 2016 TIME FOR GLOBAL ACTION
FIGURE 15 Market shares of di� erent power train confi gurations by country 2013
Not all work which is of relevance to the wider debate on how to improve fuel economy has been directly sponsored by GFEI, although it is very often conducted by a GFEI partner. The recent period has seen some extremely interesting studies which give important insights into vehicle technologies and trends which a¦ ect fuel economy. The following section contains summaries of new research that has recently been published, or is soon to be released by GFEI partners and other experts.
4.1. Comparison of vehicle technology and fuel e� ciency across countriesGFEI will publish a report in early 2016 analysing vehicle technology and market structure and their impact on light duty vehicle fuel e� ciency across multiple countries. The report, which includes a large number of non-OECD markets, aims at investigating the drivers behind the great range of region-specifi c average fuel economy of new light duty vehicles, reaching from 4.9 Lge/100km in Japan to about 9.0 Lge/100km in the United States. Di¦ erent drivers of vehicle fuel economy like vehicle size, weight and footprint, engine power and displacement, powertrain confi guration, transmission and axle confi guration as well as engine specifi cations like the use of turbo-charging will be set in relation to actual vehicles sales and fuel economy data across various countries in the world.
The results of the report will help to better understand the relation between combinations of market shares of di¦ erent vehicles technologies, power and size with the resulting average national new vehicle fl eet fuel economies. They will thus help illustrating the direct impact of di¦ erent policy measures on fuel economy improvements over time. The report aims at providing clear indications on how to tailor e¦ ective fuel economy
policies across di¦ erent regions in the world. Finally, the document will contribute to understand consumer preferences among di¦ erent world regions – one of the most uncertain variables when developing scenarios on future light duty vehicle fl eets.
Engine technology, vehicle segmentation and power largely determine new average vehicle fuel economy
The analysis is based on vehicles sales data covering the years 2005 to 2013, and including 26 countries, 14 of which are non-OECD countries. Preliminary results indicate that partly, the great variance in average new vehicle fuel economy can be explained by the penetration of di¦ erent engine and powertrain technologies. While, in general, countries with better fuel economy coincide with higher penetration rates of e� cient diesel engines (Figure 15), countries with worse fuel economy show higher shares of conventional gasoline engines. A high penetration of hybridised cars also results in better overall fuel economy: by 2013 almost 18% of all new light duty vehicles sold in Japan were hybrids – in that year Japan was the country with the best fuel economy, averaging at below 5.0 Lge/100km. However, market penetration of di¦ erent powertrain and engine types alone is not su� cient to explain the great di¦ erences in average vehicle fuel economy.
4 Summaries of relevant work
KEY MESSAGE • POWERTRAIN TECHNOLOGY SHARES ARE HETEROGENEOUS AMONGST REGIONS. HIGH DIESELIZATION GENERALLY COINCIDES WITH BETTER FUEL ECONOMY.
Source: IEA analysis for GFEI

In addition, vehicle size obviously has a great impact on average new vehicle fuel economy. Small vehicles are accounting for more than half of all newly registered vehicles in India and Japan, both of them are countries with good national weighted average fuel economy values (Figure 16). On the other side, large and medium
sized vehicles show high market shares in the United States and China. Consequently, both countries are on the less e�cient side of the fuel economy bandwidth. Similar to the impact of powertrain architecture and engine technology, vehicle segmentation alone is not enough to explain di¦erences in average fuel
41TIME FOR GLOBAL ACTION40 FUEL ECONOMY STATE OF THE WORLD 2016
Source: IEA analysis for GFEI
FIGURE 16 Market shares and fuel economy by vehicles segment, selected countries, 2005-2013
0
500,000
1,000,000
1,500,000
2,000,000
2,500,000
3,000,000
3,500,000
4,000,000
4
5
6
7
8
9
10
11
12
2005 2008 2010 2011 2012 2013LD
V sa
les
Fuel
eco
nom
y Lg
e/10
0km
(NED
C)
Brazil
0
2,000,000
4,000,000
6,000,000
8,000,000
10,000,000
12,000,000
14,000,000
16,000,000
4
5
6
7
8
9
10
11
12
2005 2008 2010 2011 2012 2013
LDV
sale
s
Fuel
eco
nom
y Lg
e/10
0km
(NED
C)
China
Sales large
Sales medium
Sales small
FE Total
FE large
FE medium
FE small
Source: IEA analysis for GFEI
FIGURE 17 Vehicle power distribution and fuel economy for selected countries in 2013
0.0
1.0
2.0
3.0
4.0
5.0
6.0
7.0
8.0
9.0
10.0
0%
10%
20%
30%
40%
50%
60%
70%
80%
90%
100%
Japa
n
Fran
ce
Italy
Turk
ey
Uni
ted
King
dom
Indi
a
Ger
man
y
Mac
edon
ia
Sout
h Ko
rea
Thai
land
Sout
h Af
rica
Braz
il
Indo
nesia
Chile
Mex
ico
Chin
a
Russ
ia
Aust
ralia
Cana
da
USA
Fuel
eco
nom
y, L
ge/1
00km
Sum of KW_unspec
Sum of KW>200
Sum of KW151-200
Sum of KW101-150
Sum of KW71-100
Sum of KW51-70
Sum of KW<50
FE
0
500,000
1,000,000
1,500,000
2,000,000
2,500,000
3,000,000
3,500,000
4,000,000
4
5
6
7
8
9
10
11
12
2005 2008 2010 2011 2012 2013
LDV
sale
s
Fuel
eco
nom
y Lg
e/10
0km
(NED
C)
Germany
0
500,000
1,000,000
1,500,000
2,000,000
2,500,000
3,000,000
3,500,000
4
5
6
7
8
9
10
11
12
2005 2008 2010 2011 2012 2013
LDV
sale
s
Fuel
eco
nom
y Lg
e/10
0km
(NED
C)
India
Sales large
Sales medium
Sales small
FE Total
FE large
FE medium
FE small
0
1,000,000
2,000,000
3,000,000
4,000,000
5,000,000
6,000,000
4
5
6
7
8
9
10
11
12
2005 2008 2010 2011 2012 2013
LDV
sale
s
Fuel
eco
nom
y Lg
e/10
0km
(NED
C)
Japan
0
2,000,000
4,000,000
6,000,000
8,000,000
10,000,000
12,000,000
14,000,000
16,000,000
18,000,000
4
5
6
7
8
9
10
11
12
2005 2008 2010 2011 2012 2013
LDV
sale
s
Fuel
eco
nom
y Lg
e/10
0km
(NED
C)
USA
Sales large
Sales medium
Sales small
FE Total
FE large
FE medium
FE small
economy: while the share of medium and large cars is much higher, and the market share of diesel engines is lower in Germany compared to India, overall average new vehicle fleet fuel economy is comparable in both countries. Apparently, vehicle technologies with higher e�ciency are more widespread in Germany, especially in the medium size segment. While in 2013, average fuel economy of medium sized cars accounted for about 5.8 Lge/100km in Germany, cars of the same segment consumed around 6.6 Lge/100km on average in India.
Finally, vehicle power and fuel economy show a strong correlation as well (Figure 17). But again, vehicle power alone is not su�cient to explain fuel economy di¦erences. Germany and India have comparable fuel economies in 2013, nonetheless cars in Germany are significantly more powerful than in India.
Best available vehicle technology deployment
However, neither vehicle powertrain technology, nor vehicle size, nor vehicle power are su�cient to fully explain fuel economy di¦erences among countries. It is therefore necessary to look into more detail such as engine displacement, the use of turbocharging and transmission related di¦erences to fully understand the large bandwidth of fuel economy among countries.
The order of magnitude of the deployment of best available vehicle technologies among region specific markets seems to have a great impact on average new vehicle fuel economy. The analysis suggests that improving the fuel economy of medium sized cars in non-premium markets needs to become a priority. The tightening of fuel economy standards in that segment (i.e. based on footprint or weight) can have a double e¦ect on average fuel economy in non-OECD countries: 1) fuel economy will be improved directly through more e�cient vehicles; and 2) market shift towards bigger cars can be slowed down due to higher vehicle prices.
KEY MESSAGE • VEHICLE SEGMENTATION HAS GREAT IMPACT ON AVERAGE FLEET FUEL ECONOMY
KEY MESSAGE • VEHICLE POWER AND FUEL ECONOMY ARE STRONGLY CORRELATED

43TIME FOR GLOBAL ACTION42 FUEL ECONOMY STATE OF THE WORLD 2016
FIGURE 18 PLDV sales by technology in the IEA 4DS and Technology Improve scenario
BOX 3:
ALTERNATIVE FUELLED VEHICLES - OPPORTUNITIES AND CHALLENGES
BEVs can draw upon existing electricity generation and T&D infrastructure, and their carbon footprint will be reduced with the use of increasingly decarbonised electricity. Nonetheless, batteries still face a trade-o¦ between energy capacity and weight, and range anxiety and recharging time are a¦ ecting consumer choice.
Compared to other low carbon fuels, sustainable, low-carbon biofuels have a high energy density and can be used in conventional cars, their transmission and distribution can largely build on today’s refuelling infrastructure. But large-scale biofuel production raises doubts with regard to sustainability and displacement of food production, particularly as considerable amounts of biofuels will be necessary to decarbonise long-haul road freight, aviation and shipping. Furthermore, economic feasibility on industrial scale is still uncertain to date.
FCEVs can provide transport utility comparable to today’s cars, while meeting low emission targets at the same time (provided that low carbon-footprint hydrogen is used). The primary challenge is to build up an entirely new hydrogen generation, T&D and retail network, which requires high upfront investments. Since market uptake of FCEVs is uncertain, the needed investments show high risk.
The needed subsidies to buy down high initial technology and fuel cost are signifi cantly lower – several studies such as the 2012 IEA Energy Technology Perspectives (IEA 2012), the GFEI working paper on cross-subsidizing the roll-out of plug-in vehicles through savings from reaching the GFEI fuel economy target (GFEI 2013), or the recently published IEA Technology Roadmap on Hydrogen and Fuel Cell technologies (IEA 2015b) provide increasingly robust evidence. It comes down to the question how to secure todays investments based on future savings. Creating the needed confi dence of investors in a low carbon future is much depending on political choices and committed targets.
GFEI sees electrifi cation technology as an important complement to fuel economy improvement in reaching both fuel economy and general sustainability goals. Reaching signifi cant sales and infrastructure levels for EVs by 2030 will play a critical role in beginning the transition to these vehicles, which must be far along by
2050, consistent with deep decarbonisation scenarios in that time frame.
Estimating the market potential of EVs
One GFEI-supported project is being carried out by UC Davis, to estimate the market potential of EVs by 2020, 2025 and 2030, based on trajectories of the number of EV models that are o¦ ered by manufacturers and sales of each model. For example, to reach a sales level of 35 million in 2030 (around 30% of new LDV sales by that year, based on IEA projections), it would require 350 di¦ erent models of plug-in vehicles with sales of 100,000 for each model – a very dramatic increase from today’s situation where around 20 major models are being sold at an average of about 20,000 sales each (for 400,000 world sales).
4.2. Low carbon alternatives: Electric vehicles, hybrids & sustainable biofuels, hydrogen & fuel cell electric vehicles The deep decarbonisation of the transport sector largely depends on the reduction of greenhouse gas emissions from passenger light duty vehicles. Individual motorised transport consistent with a 2 degree scenario is only feasible, if in the longer term a broad portfolio of di¦ erent low carbon vehicle technologies is applied (Figure 18), and if the used fuels are decarbonised to a large extent. While the GFEI target of improving fuel economy to 4 Lge/100km is a necessary prerequisite to achieve a 2 degree world it is not su� cient. By 2050 average fuel economy of new cars needs to be around 3 Lge/100km and switching to low carbon fuels becomes the major factor driving down emissions.
Three di¦ erent technology options can provide very low carbon driving: 1) the use of battery electric vehicles (BEVs) and plug-in hybrid electric vehicles (PHEVs) in combination with low carbon electricity; 2)
the introduction of highly e� cient hybridised internal combustion engine (ICE) vehicles and PHEVs in combination with sustainable, low carbon biofuels; and 3) the use of fuel cell electric vehicles (FCEVs) fuelled with low-carbon hydrogen.
All three options can substantially contribute to reducing greenhouse gas emissions, but hinge on overcoming di¦ erent barriers. The provision of economic on-board energy storage as well as the built-up of the required fuel production, transmission and distribution infrastructure are pivotal to fi nally get to very low carbon driving.
Fuel savings outweigh upfront investment for alternative fuelled vehiclesAlternative fuel vehicles have in common the fact that vehicle costs and/or fuel costs are still much higher compared to best available conventional cars, a fact that is especially true for FCEVs. However, there is increased confi dence that from an economic point of view, the transition is feasible. The tremendous savings from reduced oil use free up funds in the region of several trillion US dollars. Reaching the GFEI target of halving specifi c fuel use of the entire PLDV stock by 2050 might alone lead to cumulative savings of up to $8 trillion between now and 2050.
KEY MESSAGE • A WIDE RANGE OF TECHNOLOGY OPTIONS IS NECESSARY TO REACH THE 2 DEGREE TARGET IN THE TRANSPORT SECTOR.
Source: IEA Energy Technology Perspectives 2012 (IEA 2012)
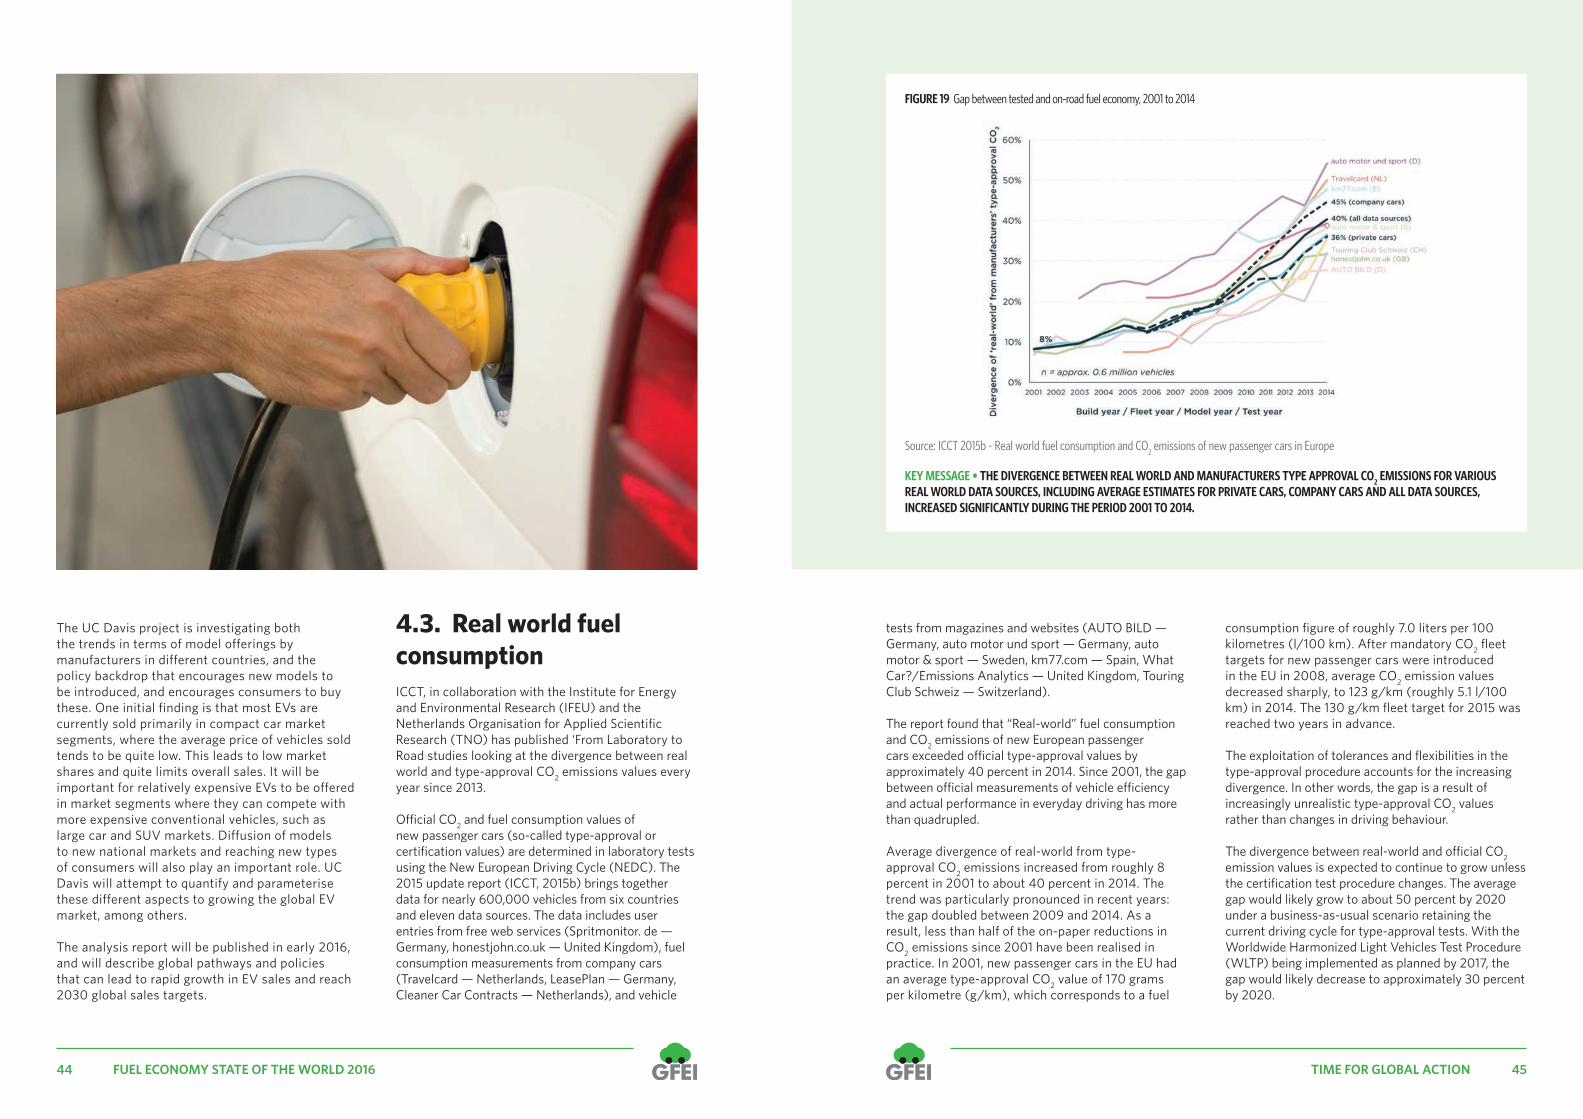
44 45FUEL ECONOMY STATE OF THE WORLD 2016 TIME FOR GLOBAL ACTION
Source: ICCT 2015b - Real world fuel consumption and CO2 emissions of new passenger cars in Europe
FIGURE 19 Gap between tested and on-road fuel economy, 2001 to 2014
The UC Davis project is investigating both the trends in terms of model offerings by manufacturers in different countries, and the policy backdrop that encourages new models to be introduced, and encourages consumers to buy these. One initial finding is that most EVs are currently sold primarily in compact car market segments, where the average price of vehicles sold tends to be quite low. This leads to low market shares and quite limits overall sales. It will be important for relatively expensive EVs to be offered in market segments where they can compete with more expensive conventional vehicles, such as large car and SUV markets. Diffusion of models to new national markets and reaching new types of consumers will also play an important role. UC Davis will attempt to quantify and parameterise these different aspects to growing the global EV market, among others.
The analysis report will be published in early 2016, and will describe global pathways and policies that can lead to rapid growth in EV sales and reach 2030 global sales targets.
4.3. Real world fuel consumptionICCT, in collaboration with the Institute for Energy and Environmental Research (IFEU) and the Netherlands Organisation for Applied Scientific Research (TNO) has published ‘From Laboratory to Road studies looking at the divergence between real world and type-approval CO2 emissions values every year since 2013.
O�cial CO2 and fuel consumption values of new passenger cars (so-called type-approval or certification values) are determined in laboratory tests using the New European Driving Cycle (NEDC). The 2015 update report (ICCT, 2015b) brings together data for nearly 600,000 vehicles from six countries and eleven data sources. The data includes user entries from free web services (Spritmonitor. de — Germany, honestjohn.co.uk — United Kingdom), fuel consumption measurements from company cars (Travelcard — Netherlands, LeasePlan — Germany, Cleaner Car Contracts — Netherlands), and vehicle
tests from magazines and websites (AUTO BILD — Germany, auto motor und sport — Germany, auto motor & sport — Sweden, km77.com — Spain, What Car?/Emissions Analytics — United Kingdom, Touring Club Schweiz — Switzerland).
The report found that “Real-world” fuel consumption and CO2 emissions of new European passenger cars exceeded o�cial type-approval values by approximately 40 percent in 2014. Since 2001, the gap between o�cial measurements of vehicle e�ciency and actual performance in everyday driving has more than quadrupled. Average divergence of real-world from type-approval CO2 emissions increased from roughly 8 percent in 2001 to about 40 percent in 2014. The trend was particularly pronounced in recent years: the gap doubled between 2009 and 2014. As a result, less than half of the on-paper reductions in CO2 emissions since 2001 have been realised in practice. In 2001, new passenger cars in the EU had an average type-approval CO2 value of 170 grams per kilometre (g/km), which corresponds to a fuel
consumption figure of roughly 7.0 liters per 100 kilometres (l/100 km). After mandatory CO2 fleet targets for new passenger cars were introduced in the EU in 2008, average CO2 emission values decreased sharply, to 123 g/km (roughly 5.1 l/100 km) in 2014. The 130 g/km fleet target for 2015 was reached two years in advance.
The exploitation of tolerances and flexibilities in the type-approval procedure accounts for the increasing divergence. In other words, the gap is a result of increasingly unrealistic type-approval CO2 values rather than changes in driving behaviour.
The divergence between real-world and o�cial CO2 emission values is expected to continue to grow unless the certification test procedure changes. The average gap would likely grow to about 50 percent by 2020 under a business-as-usual scenario retaining the current driving cycle for type-approval tests. With the Worldwide Harmonized Light Vehicles Test Procedure (WLTP) being implemented as planned by 2017, the gap would likely decrease to approximately 30 percent by 2020.
KEY MESSAGE • THE DIVERGENCE BETWEEN REAL WORLD AND MANUFACTURERS TYPE APPROVAL CO2 EMISSIONS FOR VARIOUS REAL WORLD DATA SOURCES, INCLUDING AVERAGE ESTIMATES FOR PRIVATE CARS, COMPANY CARS AND ALL DATA SOURCES, INCREASED SIGNIFICANTLY DURING THE PERIOD 2001 TO 2014.
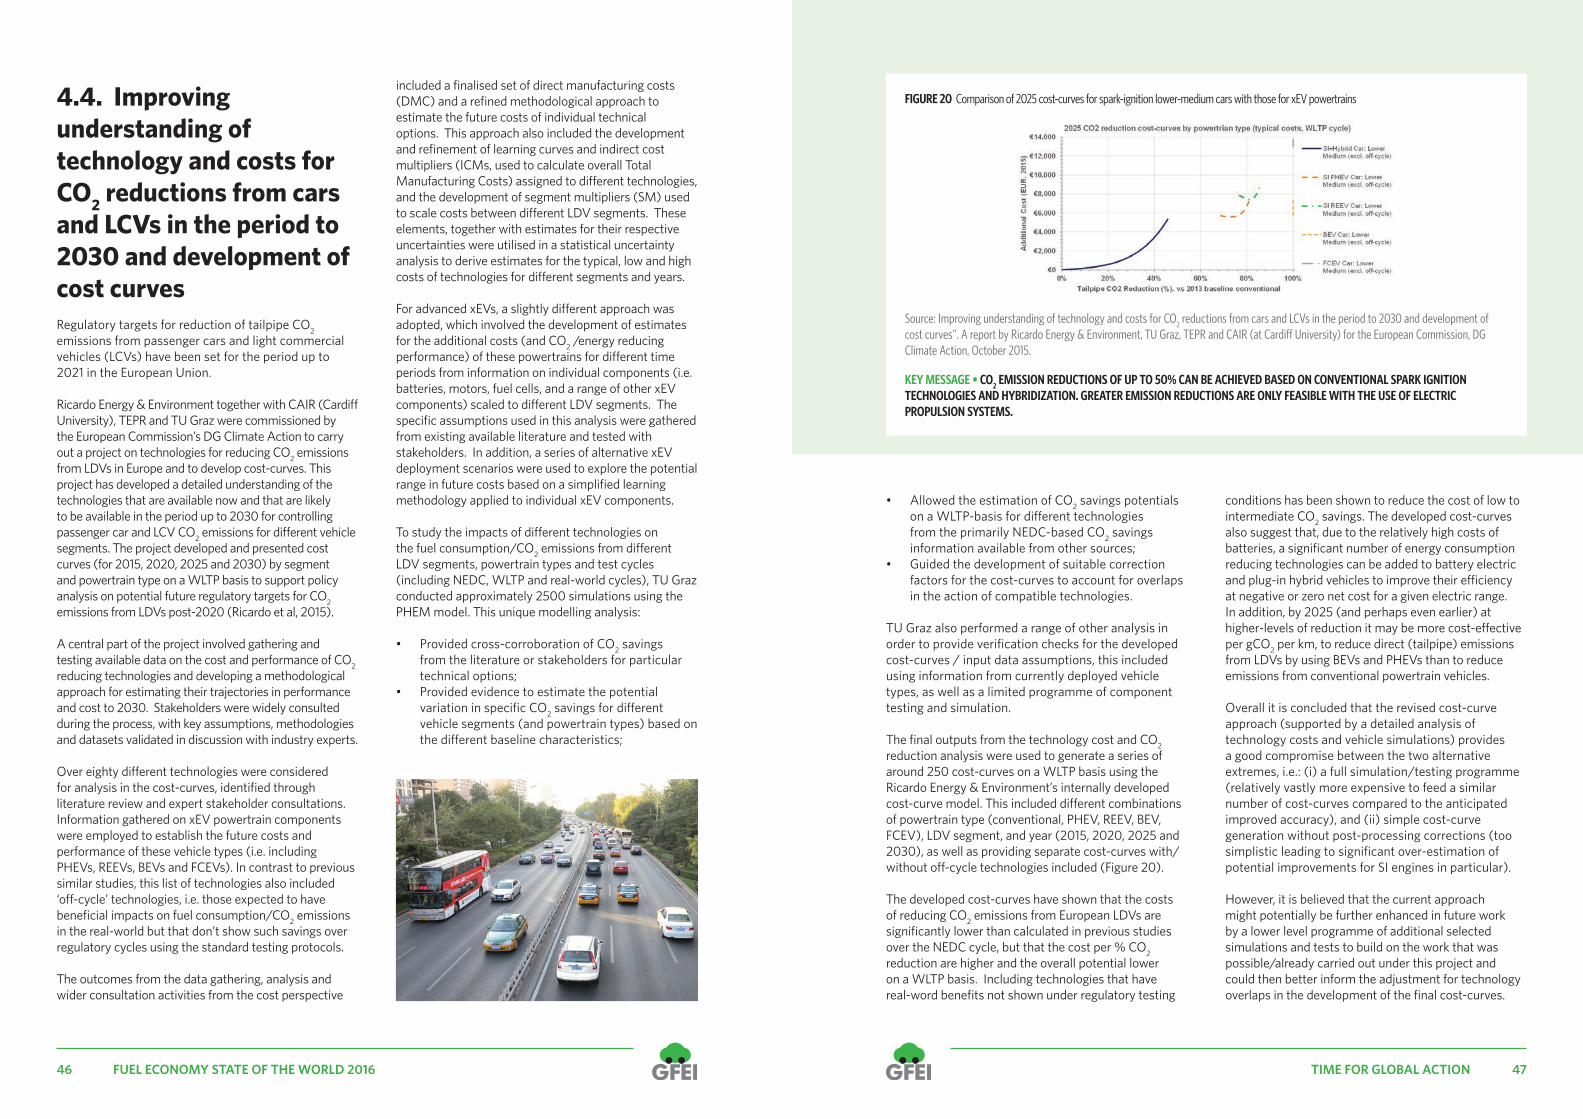
46 47FUEL ECONOMY STATE OF THE WORLD 2016 TIME FOR GLOBAL ACTION
Source: Improving understanding of technology and costs for CO2 reductions from cars and LCVs in the period to 2030 and development of cost curves”. A report by Ricardo Energy & Environment, TU Graz, TEPR and CAIR (at Cardi� University) for the European Commission, DG Climate Action, October 2015.
FIGURE 20 Comparison of 2025 cost-curves for spark-ignition lower-medium cars with those for xEV powertrains
• Allowed the estimation of CO2 savings potentials on a WLTP-basis for di¦erent technologies from the primarily NEDC-based CO2 savings information available from other sources;
• Guided the development of suitable correction factors for the cost-curves to account for overlaps in the action of compatible technologies.
TU Graz also performed a range of other analysis in order to provide verification checks for the developed cost-curves / input data assumptions, this included using information from currently deployed vehicle types, as well as a limited programme of component testing and simulation.
The final outputs from the technology cost and CO2 reduction analysis were used to generate a series of around 250 cost-curves on a WLTP basis using the Ricardo Energy & Environment’s internally developed cost-curve model. This included di¦erent combinations of powertrain type (conventional, PHEV, REEV, BEV, FCEV), LDV segment, and year (2015, 2020, 2025 and 2030), as well as providing separate cost-curves with/without o¦-cycle technologies included (Figure 20).
The developed cost-curves have shown that the costs of reducing CO2 emissions from European LDVs are significantly lower than calculated in previous studies over the NEDC cycle, but that the cost per % CO2 reduction are higher and the overall potential lower on a WLTP basis. Including technologies that have real-word benefits not shown under regulatory testing
conditions has been shown to reduce the cost of low to intermediate CO2 savings. The developed cost-curves also suggest that, due to the relatively high costs of batteries, a significant number of energy consumption reducing technologies can be added to battery electric and plug-in hybrid vehicles to improve their e�ciency at negative or zero net cost for a given electric range. In addition, by 2025 (and perhaps even earlier) at higher-levels of reduction it may be more cost-e¦ective per gCO2 per km, to reduce direct (tailpipe) emissions from LDVs by using BEVs and PHEVs than to reduce emissions from conventional powertrain vehicles.
Overall it is concluded that the revised cost-curve approach (supported by a detailed analysis of technology costs and vehicle simulations) provides a good compromise between the two alternative extremes, i.e.: (i) a full simulation/testing programme (relatively vastly more expensive to feed a similar number of cost-curves compared to the anticipated improved accuracy), and (ii) simple cost-curve generation without post-processing corrections (too simplistic leading to significant over-estimation of potential improvements for SI engines in particular).
However, it is believed that the current approach might potentially be further enhanced in future work by a lower level programme of additional selected simulations and tests to build on the work that was possible/already carried out under this project and could then better inform the adjustment for technology overlaps in the development of the final cost-curves.
4.4. Improving understanding of technology and costs for CO2 reductions from cars and LCVs in the period to 2030 and development of cost curvesRegulatory targets for reduction of tailpipe CO2 emissions from passenger cars and light commercial vehicles (LCVs) have been set for the period up to 2021 in the European Union.
Ricardo Energy & Environment together with CAIR (Cardi¦ University), TEPR and TU Graz were commissioned by the European Commission’s DG Climate Action to carry out a project on technologies for reducing CO2 emissions from LDVs in Europe and to develop cost-curves. This project has developed a detailed understanding of the technologies that are available now and that are likely to be available in the period up to 2030 for controlling passenger car and LCV CO2 emissions for di¦erent vehicle segments. The project developed and presented cost curves (for 2015, 2020, 2025 and 2030) by segment and powertrain type on a WLTP basis to support policy analysis on potential future regulatory targets for CO2 emissions from LDVs post-2020 (Ricardo et al, 2015).
A central part of the project involved gathering and testing available data on the cost and performance of CO2 reducing technologies and developing a methodological approach for estimating their trajectories in performance and cost to 2030. Stakeholders were widely consulted during the process, with key assumptions, methodologies and datasets validated in discussion with industry experts.
Over eighty di¦erent technologies were considered for analysis in the cost-curves, identified through literature review and expert stakeholder consultations. Information gathered on xEV powertrain components were employed to establish the future costs and performance of these vehicle types (i.e. including PHEVs, REEVs, BEVs and FCEVs). In contrast to previous similar studies, this list of technologies also included ‘o¦-cycle’ technologies, i.e. those expected to have beneficial impacts on fuel consumption/CO2 emissions in the real-world but that don’t show such savings over regulatory cycles using the standard testing protocols.
The outcomes from the data gathering, analysis and wider consultation activities from the cost perspective
included a finalised set of direct manufacturing costs (DMC) and a refined methodological approach to estimate the future costs of individual technical options. This approach also included the development and refinement of learning curves and indirect cost multipliers (ICMs, used to calculate overall Total Manufacturing Costs) assigned to di¦erent technologies, and the development of segment multipliers (SM) used to scale costs between di¦erent LDV segments. These elements, together with estimates for their respective uncertainties were utilised in a statistical uncertainty analysis to derive estimates for the typical, low and high costs of technologies for di¦erent segments and years.
For advanced xEVs, a slightly di¦erent approach was adopted, which involved the development of estimates for the additional costs (and CO2 /energy reducing performance) of these powertrains for di¦erent time periods from information on individual components (i.e. batteries, motors, fuel cells, and a range of other xEV components) scaled to di¦erent LDV segments. The specific assumptions used in this analysis were gathered from existing available literature and tested with stakeholders. In addition, a series of alternative xEV deployment scenarios were used to explore the potential range in future costs based on a simplified learning methodology applied to individual xEV components.
To study the impacts of di¦erent technologies on the fuel consumption/CO2 emissions from di¦erent LDV segments, powertrain types and test cycles (including NEDC, WLTP and real-world cycles), TU Graz conducted approximately 2500 simulations using the PHEM model. This unique modelling analysis:
• Provided cross-corroboration of CO2 savings from the literature or stakeholders for particular technical options;
• Provided evidence to estimate the potential variation in specific CO2 savings for di¦erent vehicle segments (and powertrain types) based on the di¦erent baseline characteristics;
KEY MESSAGE • CO2 EMISSION REDUCTIONS OF UP TO 50% CAN BE ACHIEVED BASED ON CONVENTIONAL SPARK IGNITION TECHNOLOGIES AND HYBRIDIZATION. GREATER EMISSION REDUCTIONS ARE ONLY FEASIBLE WITH THE USE OF ELECTRIC PROPULSION SYSTEMS.

48 49FUEL ECONOMY STATE OF THE WORLD 2016 TIME FOR GLOBAL ACTION
Source: Analysis for GFEI based on IEA 2014
FIGURE 21 Road transport emissions until 2050 for a 6 degree and a 2 degree emission trajectory
0
2000
4000
6000
8000
10000
12000
14000
2005 2010 2015 2020 2025 2030 2035 2040 2045 2050Road
tran
spor
t ann
ual G
HG e
mis
sion
s M
tCO
2
Road transport GHG emissions 6DS - 2DS
Non-OECD CV Non-OECD PLDV OECD CV OECD PLDV 6DS 2DS
KEY MESSAGE • ROAD FREIGHT WILL NEED TO CONTRIBUTE ABOUT 50% OF THE ROAD TRANSPORT EMISSIONS REDUCTIONS NECESSARY TO SWITCH FROM A 6 DEGREE TO A 2 DEGREE WORLD.
Helping countries with the development of LDV fuel economy policies remains the main focus of GFEI. Since much of the unregulated 20% of the light duty vehicle market are situated in developing countries with high market growth, this work is an indispensable contribution towards reaching a sustainable transport future. Nonetheless, GFEI intends to broaden its scope beyond LDV fuel economy towards a stronger involvement in heavy duty vehicle fuel economy policy making, electric vehicle target-setting and developing a new, more informative vehicle label - the “Green NCAP”.
5.1. 100 for 50by50The ‘100 countries for 50by50’ campaign is GFEI’s practical contribution to addressing climate change.
Consumers are likely to spend $400 trillion on fuels and vehicles by 2050. It is important that these will be modern, clean and e�cient vehicles. With the right policies in place, major savings can be made in fuel consumption and CO2 emissions. Governments and producers are central to this.
The goal of the GFEI is to have all countries in the world adopt a clean and e�cient vehicles policy. There are many countries that are interested to work with the GFEI to develop these policies. GFEI is currently working in 26 countries, with developing programmes
in at least as many again within one year of COP21 in Paris. This is achievable if:
• improving energy e�ciency through better fuel economy is prioritised – recent developments - SE4ALL, SG Climate Summit, G20 – are helping with this;
• we secure more resources. We have already received major support from the FIA Foundation, UNEP, EU and GEF, as well as from the other GFEI partners but will be seeking additional resources.
GFEI also has an extensive network with around 30 important private and third sector organisations, which we are also seeking to expand.
5.2. GFEI and heavy duty vehiclesFuel economy regulations for heavy duty vehicles have been adopted for less than 50% of the market. They are currently implemented in only four countries: Japan, United States, Canada, and China. The European Union has not yet set a timeline for HDV CO2 standards, but is currently focused on proposing legislation for mandatory certification and reporting of heavy duty vehicle CO2.
5 Next steps

50 51FUEL ECONOMY STATE OF THE WORLD 2016 TIME FOR GLOBAL ACTION
Source: IEA 2015a
Figure 22 Battery electric and plug-in hybrid vehicle sales worldwide, 2010 to 2014
KEY MESSAGE • SINCE 2014 THE ELECTRIC VEHICLE MARKET HAS SHOWN IMPRESSIVE GROWTH – IN 2014 ABOUT 300,000 BATTERY ELECTRIC AND PLUG-IN HYBRID VEHICLES HAVE BEEN SOLD.
Road freight demand is projected to grow much stronger than road passenger travel, and by 2030, road freight emissions are estimated to be almost 40% higher than today. By 2050, there is a good chance that road freight emissions will almost be twice as high compared to today under a business as usual scenario (IEA 2014). To get from a 6 degree to a 2 degree emission trajectory, road freight needs to contribute about half of the total road transport emission reductions (Figure 21). Both, OECD and non-OECD countries will have to play important roles to mitigate heavy duty emissions. The OECD members need to take over the lead to establish e¦ective heavy duty fuel economy regulation. But non-OECD countries will need to follow, especially since most of the future road freight growth is going to happen there.
This provides reason enough for GFEI to get more involved with heavy duty fuel economy policy. Although GFEI partner organizations such as ICCT and IEA are already actively contributing to heavy duty fuel economy policy development, GFEI as a whole will now work towards setting up fuel economy targets for heavy duty vehicles.
A GFEI target would help guide the substantial number of nations that are developing the next set of heavy-
duty vehicle fuel economy standards, notably China, the United States, Canada, Europe, Japan, India, Mexico, and South Korea. Harmonization of heavy-duty vehicle standards is worth considering, but there are significant challenges including the large disparity in vehicle types, roadway conditions, and drive cycles, as well as the industry’s low sales volumes.
5.3. GFEI and electric vehiclesIn 2014, about 300,000 electric vehicles (EVs) have been sold worldwide (Figure 22), including both battery electric and plug-in hybrid cars. Since 2010, the market has shown impressive growth, yet plug-in electric cars still account for less than 1% of the global PLDV market.
EVs will need to play a major role in a sustainable transport system, especially post 2030, when e�cient conventional cars alone will not be su�cient to reach a 2 degree emission trajectory. The recently adopted Sustainable Development Goals (SDG) call for a doubling of the energy e�ciency improvement rate, as well as major reductions of air pollution. EVs can contribute to both goals.
GFEI will become increasingly involved in supporting development of EV related policy, alongside the core fuel economy work in our partner countries. GFEI, together with its partner organizations, will work on key questions such as:
• The needed numbers and types of EVs to meet a climate change mitigation trajectory;
• The cost e¦ectiveness of EV strategies in di¦erent market segments and projected sales;
• Assessments of recharging infrastructure requirements and costs;
• Investigations of appropriate policies for countries, including those that are mainly vehicle importing or that may be potential second hand markets for EVs.
National and global EV sales targets need to be formulated for both the short and the long run. GFEI will proactively contribute to setting and promoting EV sales targets, both on a national and international scale.
GFEI’s active involvement in advancing EVs will strengthen its position as the leading campaign to push vehicle e�ciency – it marks the starting point to carry forward the idea of sustainable, individual motorised transport – which will undoubtedly be based mainly on conventional combustion engines in the near- to mid-term – to a long-term, truly low carbon future.
5.4. The “Green NCAP”The latest adopted LDV standards require reductions in CO2 emission rates of new vehicles (in grams per vehicle-km) between 9% and 35% as measured on laboratory tests. Given the growing gap between laboratory and real-world fuel consumption that has been documented in Europe, strong compliance programs are needed to ensure that regulatory requirements translate to real-world emissions reductions and fuel savings to consumers. While the EU has adopted new test cycle requirements that will go into e¦ect in 2017, these are expected to only partially close the gap (ICCTb, 2015). Measures that could further close the gap include independent re-testing of in-use vehicles and enhanced authority of regulatory agencies to issue fines or require manufacturer recalls; such requirements have been included in US programs but have yet to be adopted across all countries with vehicle e�ciency standards.
Back in 2013, the GFEI together with the International Energy Agency started a process to introduce a new and voluntary vehicle testing program, aiming at providing transparent and real-word driving results to compare the environmental impact of new cars. This new testing program is intended to follow the example of the safety New Car Assessment
Program (NCAP), which to date sets the standard in vehicle crash testing. The “Green NCAP”, which is now pushed forward to being developed, aims to provide a definition of a clean car, taking into account parameters like fuel e�ciency, greenhouse gas and pollutant emissions as well as noise.
In 2015 the topic is more relevant than ever. Not only is the gap between test cycle fuel economy and on-road fuel economy widening over time. Volkswagen, aiming at being the world’s leading car manufacturer, also recently admitted long-time practise of cheating diesel engine pollutant regulation by manipulating the engine configuration during car pollutant emission test procedures.
Therefore, it seems like time is up to introduce a vehicle test procedure, which is:
• Independent – Vehicle tests are conducted by independent laboratories and in-use cars are chosen by the laboratory and not provided by the manufacturers
• Transparent – Testing result needs to be fully transparent and accessible to the public
• Adapted to real word - Test results need to capture or better simulate (e.g. through improved roadload coe�cients) real world driving in order to close the gap between tested and real world fuel economy
• Large scale – A su�cient amount of models across all manufacturers needs to be tested in order to achieve representative market coverage
The introduction of such a “Green NCAP” would provide a powerful mean to e¦ectively close the gap between tested and on-road fuel economy, which finally ensures better consumer information, and, even more importantly, would ensure that emission reductions of new cars contribute to their full extent to greenhouse gas mitigation.

53TIME FOR GLOBAL ACTION52 FUEL ECONOMY STATE OF THE WORLD 2016
BOX 4:
COMPARISON OF TEST BENCH VERSUS PORTABLE EMISSION MEASUREMENT SYSTEM (PEMS) VEHICLE TESTING
In general to principally di¦erent ways of testing fuel economy, CO2 and pollutants emissions of vehicles exist:
1. Testing the vehicle on a chassis dynamometer in a laboratory and;2. Testing the vehicle on a standard route under real world driving conditions using a portable emission
measurement system.
Both systems have several pros and cons, which are summarised in the below table:
Laboratory test on a vehicle chassis dynamometer
PROS CONS
• Good comparability• Reproduction of test results is granted• High accuracy
• High costs• Prone to manipulation• Does not su�ciently cover real world driving
situations
Real world driving with pems unit
PROS CONS
• Better coverage of real world driving• Hard to manipulate• Lower costs
• Lower accuracy• Exact reproduction not granted• Lower comparability

54 55FUEL ECONOMY STATE OF THE WORLD 2016 TIME FOR GLOBAL ACTION
Annex 1: Baselines
BOX 5:
FUEL ECONOMY BASELINE
The overall aim of the baseline-setting exercise is to obtain information on weighted average fuel economy of newly registered cars for at least one historic year. This baseline fuel economy information is required to:
• Evaluate the status quo• Define future average fuel economy targets• Measure progress of weighted average fuel economy of newly registered cars
Once fuel economy data is available for the major part of newly registered vehicles (in general, 85% coverage is targeted), weighted average fuel economy can be calculated using the following equation:
With:FE=weighted average fuel economy
Regi=number of newly registered vehicles of type i FEi=fuel economy of vehicle of type i
The recently published “Guideline for fuel economy baseline-setting”, provides detailed information on methodology, a compendium of hints as well as links to useful data for the baseline setting process.
AEA-Ricardo (2011), Reduction and Testing of Greenhouse Gas (GHG) Emissions from Heavy Duty Vehicles—Lot 1: Strategy. Final Report to the European Commission, DG Climate Action, Brussels
Eads (2011), GFEI Prospects and Progress, Global Fuel Economy Initiative, London
Enerdata (2015) G20 Energy E�ciency Indicators, Available from: http://g20-energy-e¦ciency.enerdata.net/indicators/
GFEI (2013) How vehicle fuel economy improvements can save $2 trillion and help fund a long-term transition to plug-in vehicles Working Paper 9. Global Fuel Economy Initiative, London
GFEI (2015), International comparison of light-duty vehicle fuel economy: Evolution over 8 years from 2005 to 2013. Working Paper 11. Global Fuel Economy Initiative, London
G20 (2014) G20 Energy E�ciency Action Plan Available from: http://www.g20australia.org/sites/default/files/g20_resources/library/g20_energy_e¦ciency_action_plan.pdf
IEA (2012), Energy Technology Perspectives. International Energy Agency, Paris
IEA (2014), Energy Technology Perspectives. International Energy Agency, Paris
IEA (2015), Energy Technology Perspectives. International Energy Agency, Paris
IEA (2015a), Global EV Outlook. International Energy Agency, Paris
ICCT (2014), The State of Clean Transport Policy – A 2014 Synthesis of Vehicle and Fuel Policy Developments. International Council on Clean Transportation, Washington D.C.
ICCT (2014a), Global passenger vehicle standards. The International Council on Clean Transportation, Washington D.C.
ICCT (2015), Cost E¦ectiveness of Engine Technologies for a Potential Heavy Duty Vehicle Fuel E�ciency Regulation in India. Position Brief. International Council on Clean Transportation, Washington D.C.
ICCT (2015a), Policies to Reduce Fuel Consumption, Air Pollution, and Carbon Emissions from Vehicles in G20 Nations. Briefing Paper. International Council on Clean Transportation, Washington D.C.
ICCT (2015b) Factsheet: From laboratory to road: 2015 update. Real-world fuel consumption and CO2 emissions of new passenger cars in Europe, ICCT: Berlin
Law et al (2011), European Union Greenhouse Gas Reduction Potential for Heavy-Duty Vehicles. Prepared by TIAX for the International Council on Clean Transportation, Washington D.C.
National Academy of Sciences (2010), Technologies and Approaches to Reducing the Fuel Consumption of Medium- and Heavy-Duty Vehicles. National Research Council of the National Academies, Washington D.C.
National Research Council (2011), Transition to Alternative Vehicles and Fuels. National Research Council of the National Academies, Washington D.C.
OICA (2015), Sales Statistics 2004-2014. Organisation Internationale de Constructeurs d’Automobiles, http://www.oica.net/category/sales-statistics/sales-statistics-2005-2014/total-sales-2014-2.xlsx
OICA (2015a), Sales Statistics 2004-2014. Organisation Internationale de Constructeurs d’Automobiles, http://www.oica.net/category/sales-statistics/sales-statistics-2005-2014/pc-sales-2014-2.xlsx
Ricardo et al (2015), Improving understanding of technology and costs for CO2 reductions from cars and LCVs in the period to 2030 and development of cost curves Report for the European Commission, DG Climate Action
TIAX (2009), Assessment of Fuel Economy Technologies for Medium- and Heavy-Duty Vehicles. Final Report for the National Academy of Sciences, Washington D.C.
US EPA (2011), Extending the Greenhouse Gas Emissions Standards and Fuel E�ciency Standards for Medium- and Heavy-Duty Engines and Vehicles. Washington D.C.
Annex 2: References
56 57FUEL ECONOMY STATE OF THE WORLD 2016 TIME FOR GLOBAL ACTION
International Energy Agency9, Rue de la Fédération 75739 Paris Cedex 15 France Tel: +33 1 40 57 65 00 Fax: +33 1 40 57 65 09
Website: www.iea.orgEmail: [email protected]
The IEA has been an active partner of GFEI since 2009. The IEA is an international organisation which main activity is to ensure relaible, a¦ordable clean energy for its 28 members countries. The IEA four main areas of work are: energy security, economic development, environmental awareness and engagement worldwide.
The IEA involvement in GFEI over the years comprises the following tasks: technical assistance to define the GFEI goals on the basis of analysis on cost and feasibility of energy e�ciency technologies; improving the quality of international data with GFEI working papers on the international comparison of light-duty vehicle fuel economy; support national and regional policy making e¦orts via the evaluation and review of fuel economy benchmarking and baselines for several countries; development of the Fuel Economy Policies Impact Tool (FEPIT), aiming to help policy makers estimating the impact of fuel economy policies; outreach and awareness raising to stakeholders, especially in global and multi-lateral frameworks (such as the G20) and with vehicle manufacturers. GFEI Contacts: Pierpaolo CazzolaJacob Teter
Pierpaolo CazzolaSenior Transport and Energy AnalystEmail: [email protected]: +33 (1) 40 57 66 88 Pierpaolo Cazzola works as a transport and energy analyst for the IEA, where he co-ordinates the work of the transport unit of the Enegy Technology Policy Division, in the Directorate of Sustainable Energy Policy and Technologies.
Jacob Teter Transport and Energy AnalystEmail: [email protected]
Jacob Teter joined the IEA Energy Technology Policy Division in March 2015, where he is working as an energy analyst in the transport sector.
FIA Foundation for the Automobile and Society60 Trafalgar Square, London, WC2N 5DS, United Kingdom, Tel: +44 (0)207 930 3882 Fax: +44 (0)207 930 3883
Website: www.fiafoundation.orgEmail: [email protected]
The FIA Foundation plays a leading role in the GFEI by hosting the Secretariat. The FIA Foundation has an international reputation for innovative global road safety philanthropy; practical environmental research and interventions to improve air quality and tackle climate change; and high impact strategic advocacy in the areas of road tra�c injury prevention and motor vehicle fuel e�ciency. Our aim is to ensure ‘Safe, Clean, Fair and Green’ mobility for all, playing our part to ensure a sustainable future.
GFEI Contacts: Sheila WatsonBeatrice DumaswalaRichard Clarke
Sheila WatsonDirector of Environment and ResearchEmail: [email protected]: +44 (0) 207 747 5187
Sheila Watson is Director of Environment at the FIA Foundation. She is also Executive Secretary to the Global Fuel Economy Initiative. Sheila has a background in economic and environmental policy development
Beatrice DumaswalaCampaign and Logistics O�cerEmail: [email protected]: +44 (0) 207 930 3882
Beatrice works at the FIA Foundation in the programmes side of the organisation and deal mainly with the logistical planning of the campaigns and events that we launch and host for both our road safety work as well as our environment work.
Richard ClarkeResearcherEmail: [email protected]: +44 (0) 207 747 5199
Richard Clarke is Researcher at the FIA Foundation. His role involves carrying out research relating to safe and sustainable transport and supporting the work of the Global Fuel Economy Initiative.
Annex 3: The GFEI partners

58 59FUEL ECONOMY STATE OF THE WORLD 2016 TIME FOR GLOBAL ACTION
Jane AkumuProgramme O�cer (Africa)Email: [email protected]: 0722 831821
Jane Akumu is responsible for the Africa activities in UNEP’s Transport Unit. She studied Economics in Nairobi and Canada. She was Senior Economic Advisor in the Ministry of Energy in Kenya, working on clean fuels and vehicles issues before she joined UNEP Transport Unit in 2004. Jane also took the lead in the campaign to phase out leaded gasoline in Sub Saharan Africa.
Kamala ErnestProgramme O�cer (MEWA)Email: [email protected]: 0736219875
Kamala Ernest is responsible for transport activities in the Middle East and West Asia (MEWA) region. She also leads the work on promoting public transport and low carbon transport strategies. Prior to joining UNEP in 2005, Kamala was worked in the field energy e�ciency, environmental management and climate change with the Malaysia Energy Centre and PETRONAS where she contributed to various energy related studies in support of the National Energy and Environment Policy of Malaysia.
Elisa DumitrescuProgramme O�cer (CEE)Email: [email protected]: 0724500588/+1 914 861 5107
Elisa Dumitrescu is responsible for the Transport Unit’s activities in Eastern Europe and has worked to promote cleaner fuels and vehicles globally for the past 8 years. She is a graduate of New York University and also holds a master’s degree in Environment and Development from the London School of Economics. Elisa joined the Transport Unit in 2005 and has also been working on project development and the link between transport and climate change - specifically black carbon.
Bert FabianProgramme O�cer (Asia)Email: [email protected]: 0723697288
Bert Fabian coordinates and leads activities in Asia, particularly those of the Partnership for Clean Fuels and Vehicles, the Global Fuel Economy Initiative and the Climate and Clean Air Coalition in Asia. Before joining UNEP, he was the Transport Program Manager at Clean Air Asia, a regional organization established by the World Bank, Asian Development Bank and US AID. He graduated from the University of the Philippines with a B.S. Biology degree and Masters degree on Urban and Regional Planning major in Transportation.
United Nations Environment ProgrammeUnited Nations AvenueGigiriPO Box 3055200100 NairobiKenyaTel: +254 (20) 7621234Fax: +254 (20) 7624489/90
Website: www.unep.orgEmail: [email protected]
The United Nations Environment Programme was established to provide leadership and encourage partnership in caring for the environment by inspiring, informing, and enabling nations and peoples to improve their quality of life without compromising that of future generations.
The Transport Policy and Work Programme of UNEP was established to address externalities from road transport by setting up 3 fold strategies to avoid shift improve approach, these are: The Partnership for Clean Fuels and Vehicles (PCFV), the Global Fuel Economy Initiative (GFEI) and Share the Road all in partnership with the FIA Foundation and other partners.
GFEI Contacts: Rob de JongVeronica Ruiz-StannahJane Akumu,Kamala ErnestElisa Dumitrascu,Bert Fabian
Rob de JongHead Transport UnitEmail: [email protected]: 0733 735 459Mobile: 0710 602 264
Rob de Jong is Head of the Transport Unit in the UNEP. He has degrees in Environmental Engineering and Environmental Policy. Prior to joining UNEP in 1998, he worked as a consultant, with The Netherlands Government, and with the UN Humans Settlements Programme. He set up and headed the Urban Environment Unit in UNEP and over the past 6 years he has been Head of the Transport Unit. His work responsibility includes the PCFV Clearing House in UNEP.
Veronica Ruiz-StannahProgramme O�cer (LAC)Email: [email protected] Tel: 0735-481771
Veronica Ruiz is responsible for activities in Latin America and the Caribbean in the UNEP Transport Unit. She studied Development Studies and Wildlife Conservation Management. Before she joined UNEP in 2009 she was the UNEP liaison for the Colombian Government. Veronica also is involved in communications and information activities within the Transport Unit.
UNEP

60 61FUEL ECONOMY STATE OF THE WORLD 2016 TIME FOR GLOBAL ACTION
The International Council on Clean TransportationWashington 1225 I street NW Suite 900 Washington DC 20005 Tel: +1 202 534 1600
Website: www.theicct.org
The International Council on Clean Transportation is an independent nonprofit organization founded to provide first-rate, unbiased research and technical and scientific analysis to environmental regulators. Our mission is to improve the environmental performance and energy e�ciency of road, marine, and air transportation, in order to benefit public health and mitigate climate change.
GFEI Contacts: Peter MockDrew KodjakJohn GermanAnup BandivadekarZifei Yang
Drew KodjakExecutive DirectorEmail: [email protected]: +1 (202) 534 1608
Drew Kodjak is Executive Director of the International Council on Clean Transportation. Before joining the ICCT in 2005, Mr. Kodjak served an Attorney-Advisor to the United States Environmental Protection Agency’s O�ce of Transportation and Air Quality.
Peter MockManaging Director EuropeEmail: [email protected]: +49 (30) 847 129 102
Peter Mock is Managing Director of ICCT Europe. His main focus is the coordination of ICCT activities in Europe, mostly for the light- and heavy-duty vehicles sectors. This includes compiling well-based, credible data on the vehicle market and vehicle technologies, and making this information easily available to a broad audience.
International Tranport Forum2-4 rue Louis David, 5th Floor, PARIS 16ème, France
Postal Address: 2 rue André Pascal, F-75775 PARIS Cedex 16, FranceTel: +33 (1) 45 24 97 10Fax: +33 (1) 45 24 97 42 / +33 (1) 45 24 13 22
Website: www.internationaltransportforum.org Email: [email protected]
The International Transport Forum at the OECD is an intergovernmental organisation with 54 member countries. It acts as a strategic think tank for transport policy and organises an Annual Summit of ministers.
The ITF goal is to help shape the transport policy agenda on a global level, and ensure that it contributes to economic growth, environmental protection, social inclusion and the preservation of human life and well-being. GFEI Contacts: Stephen PerkinsPhilippe Crist
Stephen PerkinsHead of the Joint Transport Research CentreEmail: [email protected]: +33 (1) 45 24 94 96
Stephen Perkins is the Head of the Joint Transport Research Centre of the International Transport Forum and the OECD.
Philippe CristEconomist AdministratorEmail: [email protected]: +33 (1) 45 24 94 47
Philippe Crist works within the Joint Transport Research Centre as an Economist and Administrator.

62 63FUEL ECONOMY STATE OF THE WORLD 2016 TIME FOR GLOBAL ACTION
Institute of Transporation Studies UC DaviesTransportation and Energy Research Programs 1605 Tilia Street Davis, Calif. 95616Tel: +1 (530) 752-6548
Website: www.its.ucdavis.eduEmail: [email protected]
The Institute of Transportation Studies at UC Davis (ITS-Davis) is the leading university center in the world on sustainable transportation. It is home to more than 60 a�liated faculty and researchers, 120 graduate students, and has roughly $15 million in funding. While our principal focus is research, we also emphasize education and outreach.
The Institute is unique in hosting a graduate program in transportation, matching interdisciplinary research with
interdisciplinary education. Our Transportation Technology and Policy (TTP) graduate curriculum draws from 34 di¦erent academic disciplines. Our more than 225 alumni are becoming leaders in government and industry.
GFEI Contacts: Lew Fulton
Lew Fulton Co-DirectorSTEPS Program Institute of Transportation Studies Email: [email protected]: +1 (530) 752 3004
Lewis Fulton has worked internationally in the field of transport/energy/environment analysis and policy development for over 20 years. He is Co-Director of the STEPS Program within the Institute of Transportation Studies at the University of California, Davis.
John GermanSenior Fellow / US co-leadEmail: [email protected]: +1 (734) 355 1055
John German is a Senior Fellow at ICCT, with a primary focus on vehicle technology. Before joining the ICCT in 2009, Mr. German worked for 11 years at Honda, 13 years at EPA, and 8 years at Chrysler.
Anup BandivadekarProgram Director / India LeadEmail: [email protected]: +1 (415) 202 5754
Dr. Bandivadekar’s interests are focused around developing frameworks and methods to foster innovative solutions towards achieving a more sustainable energy and transportation system. At the ICCT, his work is aimed at reducing air pollution and greenhouse gas emissions from passenger vehicles globally.
Zifei YangResearcherEmail: [email protected]: +1 (202) 407 8346
Zifei Yang is a researcher at ICCT. She is focusing on global fuel e�ciency standards, fiscal and non-fiscal policy comparison for light-duty vehicles and relevant technology trend.
Alexander Körner Transport and Energy Analyst Email: [email protected]: +33 (1) 40 57 66 57
Alex Körner is a consultant in the field of international energy and climate policy making.
Prior to founding his own consultancy, he worked as an energy analyst at the IEA and as research assistant at Potsdam Institute for Climate Impact Research (PIK).

64 65FUEL ECONOMY STATE OF THE WORLD 2016 TIME FOR GLOBAL ACTION
Dr. Fatih Birol, Executive Director, IEA:“The Global Fuel Economy Initiative is helping to reduce oil demand, by supporting the development and uptake of fuel-saving technologies. This is good news for consumers, good news for energy security and good news for the environment. The IEA is proud to be a founding member and commends the initiative to others.”
What others say about GFEI
Dr. Dan Sperling, Founding Director of Institute of Transport Studies, UC Davis:“The Global Fuel Economy Initiative plays an important role in raising the profile of vehicle fuel economy and CO2 emissions in global policy debates. Their target of a doubling new car MPG by 2030 (compared to 2005) has become a widely accepted target. They also bring together some of the leading experts on fuel economy to support improved standards and procedures. It is an honor that ITS-Davis is one of the six partnering organizations ”
Dan Greenbaum, Board Chair, ICCT:“The mission of the ICCT is to help governments to reduce air pollution and improve the e�ciency of motor vehicles. ICCT is pleased to be part of the Global Fuel Economy Initiative (GFEI), a tremendous network of expert organisations supporting governments with evidence and analysis to introduce world-class fuel economy policies. Our work in countries such as China, India, Mexico, and Brazil is helping cut CO2 emissions and save vital resources.”
José Viegas, Secretary-General, International Transport Forum: “The International Transport Forum at the OECD recognises the vital importance of improved fuel economy for reducing emissions and helping tackle climate change. ITF is a founding partner of the GFEI, and we encourage all countries to take action to meet GFEI’s goal of doubling average global fuel economy by 2050.”
Saul Billingsley, Director General, FIA Foundation: “The FIA Foundation is pleased to host the Global Fuel Economy Initiative, and collaborate with world-leading experts. GFEI is making a real impact around the world by working with countries to save fuel, money, and reduce greenhouse gas emissions. It is an important part of our ‘safe, green, clean and fair mobility for all’ agenda.”
Achim Steiner, UNEP Executive Director: “Improving fuel economy has many benefits - air quality, cost savings and climate. Where countries have introduced policies and incentives for cleaner vehicles we find fleets quickly becoming cleaner and more e�cient. That is why UNEP is working with partners in the GFEI to support countries to put in place those policies and incentives - our aim is to go from about 30 country projects to date to 100 in the coming year”
Kandeh Yumkella, Chief Executive, Sustainable Energy for All:
“Fuel e�ciency is crucial for many reasons. Using less energy makes sense, the energy you save is available for use in other things you need to do for development, but more importantly it lowers emissions. So for us this is a winner and we just see that this is the future. GFEI and Sustainable Energy 4 All has been a wonderful partnership.”
Holger Dalkmann, Director, Embarq:“To achieve a realistic target of sustainable mobility, we have to ‘avoid’ and reduce how people are travelling, and ‘shift’ to more low-carbon options. It is also important to ‘improve’, that means improve the fuel economy and here the Global Fuel Economy Initiative is one of the leading initiatives. There is a link to better air, to cleaner and healthier life in cities and GFEI are doing a great job and we are really happy to partner with them. I think it is a great initiative and we need more action from national governments to follow these guidance they are providing.que”ds and procedures. It is an honor that ITS-Davis is one of the six partnering organizations ”
Jos Dings, Director, Transport and Environment:“E¦ective fuel e�ciency standards for vehicles are a cornerstone of the battle to lower transport greenhouse gas emissions. The GFEI initiative to double fuel e�ciency is crucial in building global momentum to reduce emissions.”
Volkmar Denner, CEO, Bosch:“The Global Fuel Economy Initiative brings together decision-makers from around the world with industry representatives, NGOs, academia and other stakeholders. By combining political ambition and technological expertise, all relevant contributors to the goal of raising global fuel economy can be looked at: from the highly-e�cient combustion engine to alternative powertrains, from fuel decarbonisation to eco-innovations and connectivity solutions. Bosch is proud to contribute to these discussions.
GFEI combines political ambition and technological expertise, bringing together decision-makers from around the world with industry, NGOs, and other stakeholders. Bosch is proud to contribute to these discussions.”
Bjarne Pedersen, Executive Director, Clean Air Asia:“GFEI is an essential platform that helps shape fuel economy trajectories around the globe. Such a platform is critical in influencing markets such as those in developing Asia, where even small improvements in vehicle fuel economy can lead to huge cumulative benefits.”
Cornie Huizenga, Secretary General, The partnership for sustainable low carbon transport (SLOCAT):“The cars of the future have to be cleaner and more e�cient. GFEI has taken a strong leadership role in building policy approaches which tell to the vehicle industry that governments are serious about fuel economy.
Ramon Cruz, International Policy Programme Manager, ITDP:“Global Fuel Economy Initiative are leaders in fuel e�ciency worldwide. We have worked in partnership with them to bring these crucial issues to the table.”
Gianni López, Director, Centro Mario Molina Chile:“Centro Mario Molina Chile supports GFEI because it provides a clear answer to the sustainable transport challenge in Latin America. The vehicle fleet in the region is growing rapidly but our regulations and policies are not yet ready to prevent increasing GHG emissions and energy risk. The GFEI approach in Chile has been to conduct a baseline study of vehicle fuel economy in the market and support a mandatory labelling scheme and tax disincentives for new vehicles with poor fuel economy and high emissions. This same successful experience is starting to be adopted for another countries in the region. If we build on these e¦orts we can reach the 50by50 target in Latin America. ”

UNEP
SecretariatGlobal Fuel Economy Initiative60 Trafalgar SquareLondon WC2N 5DSUnited Kingdom+44 (0)207 930 3882 (t) +44 (0)207 930 3883 (f)
@GlobalFuelEcon | #GFEINetwork
Contact usEmail: [email protected]: globalfueleconomy.org
With the support of