Embed Size (px)
Citation preview
university ofgroningen
groningen growth anddevelopment centre
GGDC RESEARCH MEMORANDUM 160
Measuring China’s performance in the world economy:
A Benchmark Comparison between the Economies of China and the UK in the Early Twentieth Century
Ye Ma, Herman de Jong, and Yi XuJune 2016

1
Measuring China’s performance in the world economy:
A Benchmark Comparison between the Economies of China and the UK in
the Early Twentieth Century
Ye Ma, Herman de Jong, and Yi Xu1
Version June 2016
Abstract
This paper provides the first estimates of purchasing power parity (PPP) converters from the production
side between China and the UK for the early 1910s. It gives a new starting point to evaluate the
economic development in pre-modern China during early industrialization since the late 19th century.
The estimated PPPs for manufacturing industries provide relative levels of producer prices in China,
necessary for the calculation of comparative output and labor productivity. These producer prices are
calculated by the authors from an official Chinese industrial census. The 1910s estimate will also be
used to obtain a better understanding of the industrial development during the first four decades of the
20th century. By bringing in prices for the agricultural sector we present a new estimate of the welfare
level for the total economy.
JEL classification codes: E23 E30 N15 N9
1 Ye Ma, University of Groningen, [email protected]; Herman de Jong, University of Groningen, [email protected]; Yi Xu,
Guangxi Normal University, [email protected].

2
1. Introduction
Recent studies of China’s development in the late 19th century support the long-lasting influence of this
era on China’s modern economy. Particularly, China’s post-1949 state-led industrialization can be
traced back by a development path that began in the late 19th century (Wu 2011; Wong 2014). Proper
measures of the pre-modern economic conditions in an internationally comparative framework help to
understand the rapid economic growth of modern China. The best-known international comparison of
long-run economic performance is the work of Angus Maddison. His per capita GDP estimation
indicates countries’ relative stage of economic development in general; however, a specific
measurement for industrialization is necessary to investigate implicit linkages between the modern
Chinese industrialization and its initial stage in the 19th century. For this purpose, Yuan, Fukao, and Wu
(2010) constructed production-side PPPs for manufacturing industries and measured pre-WWII
comparative output and labor productivity for three Asian economies, China, Japan and Korea, setting
the US as the benchmark country. Their comparisons focus on the year 1935. Although this year is
believed to be a representative year to measure pre-WWII levels of economic development, their study
only captures part of the process of China’s industrialization, which was in fact initialized in the 1860s.
This study intends to directly compare China’s early industrialization level on the eve of the First World
War (WWI) relative to that of the highly-developed economy of the UK, by estimating manufacturing
purchasing power parities (PPPs) and calculating the comparative levels of labor productivity between
both countries. We attempt to quantitatively position China’s industrialization level at its early stage,
relative to the contemporary leading international economies. Comparative China/UK labor
productivity measures not only the absolute difference between Chinese and UK manufacturing, but
also the relative development of China’s manufacturing from the 1900s to the 1930s, with the
development of UK manufacturing as the reference. This makes it possible to estimate China’s
industrial level since its first efforts toward industrialization before the end of the Qing Empire and
analyze movements of convergence and divergence in the Chinese manufacturing sector between the
1900s and 1930s. The new manufacturing PPP estimated in this study will finally help us to obtain a
more-detailed comparisons of welfare and productivity for earlier periods, particularly for the pre-WWI
era (Fukao, Ma, and Yuan 2007; Woltjer 2013)
Understanding China’s industrialization has broader implications. As the world’s largest economy in
the past and the second largest today, China always had the power to affect the rest of the world, but it
also has been influenced by global developments. To obtain a complete understanding of world
economic development since industrialization, China’s economic situation in the late 19th century is
important. In general, the uniqueness of China’s industrialization can be used as a special case to show
the important role of the manufacturing sector at the early stage of industrialization and to investigate
the role of the state in promoting industrialization (Wu 2011; Wong 2014).
After we have given a short introduction of the historical context of China’s industrialization in this
section, the paper proceeds as follows. Section 2 provides general information on the Chinese economy
in the first three decades of the 20th century, relative to the UK economy in 1907, in terms of output,
employment, and foreign trade. Section 3 presents the standard industry-of-origin PPP approach applied
in this study (Fremdling, de Jong, and Timmer, 2007). Data and sources are provided in Section 4, in
3
which we introduce the Chinese official yearbook of 1912 in detail. In Section 5, we report the
estimated PPPs and discuss the resulting comparative levels of China/UK labor productivity. Section 6
contains concluding remarks.
1.1 China’s path of industrialization before the 1930s
An important motivation of this study is to evaluate the development of Chinese industrialization in the
period 1840s-1930s. We roughly separate this historical period into two parts, according to the political
regimes. In the first period between the 1840s and 1911, when the country was still ruled by the Qing
Empire, Chinese industrial development was initially motivated by a series of military defeats, such as
the first and second Opium War (1839–42 and 1860, respectively), and severe regime-threatening
domestic uprisings, such as the Taiping Rebellion (1850–64). The second period between 1911 and the
1930s started with the establishment of the Republic of China in 1911. After a decade of social chaos
and recovery, the Chinese economy experienced a so-called ‘‘golden decade” of industrialization
between 1927 and 1937 (Yuan, Fukao, and Wu 2010; Wu 2011).
The uniqueness of China’s industrialization is the role that the state played in driving and shaping the
course of economic development (Wu 2011; Wong 2014). Industrialization in the first period was
promoted by the government’s self-strengthening movement (1861-95) which aimed at catching up
with the more-developed western countries and reinforcing its national defense. This movement was
characterized by the establishment of state-owned factories in capital-intensive industries, such as
China’s first iron and steel factories and the first modern textile factories, together with new
infrastructural outlays, such as the railway- and telegraph system. Government interventions remained
an essential part of the industrialization in the second period, which was even more characterized by
various government plans for industrialization. As summarized by Wu (2011), “Chinese governments,
under different regimes in the past over one and a half centuries intervened, engineered, and hence
shaped the course of China’s industrialization at almost every vital stage.”
The government-directed investments before the 1930s may have been essential for China’s
industrialization in the long run, such as the development of public infrastructures and efforts to
promote and adopt Western technologies and practices. However, its contemporary effect on the private
sector of the economy may have been less so. This depended on the extent and speed of the spill-overs
from the public to the private sector, which are still difficult to measure directly. By focusing on private
manufacturing industry, this study aims to reveal one side of China’s industrialization in its initial stage
and evaluate the development of private industries under the clear policy orientation toward heavy and
capital-intensive industries.
2. The Chinese economy in the early 20th century
Before we assess comparative labor productivity levels between China and the UK, we briefly compare
the general economic conditions of the two countries and describe the development of the Chinese
economy before the 1930s. Based on the comparisons between the Chinese economy and the US
economy in 1935 given by Yuan, Fukao, and Wu (2010), this section compares the Chinese economy of

4
1912 with the UK economy of 1907, and then compares the 1912 Chinese economy with its own 1930s
level. The UK economy of 1907, the 1912 Chinese economy, and the 1930s Chinese economy generally
represent different stages of economic development and industrialization. Here we will look at the
economic structure, the structure of manufacturing, and trade patterns.
2.1 Economic structure
[Table 1]
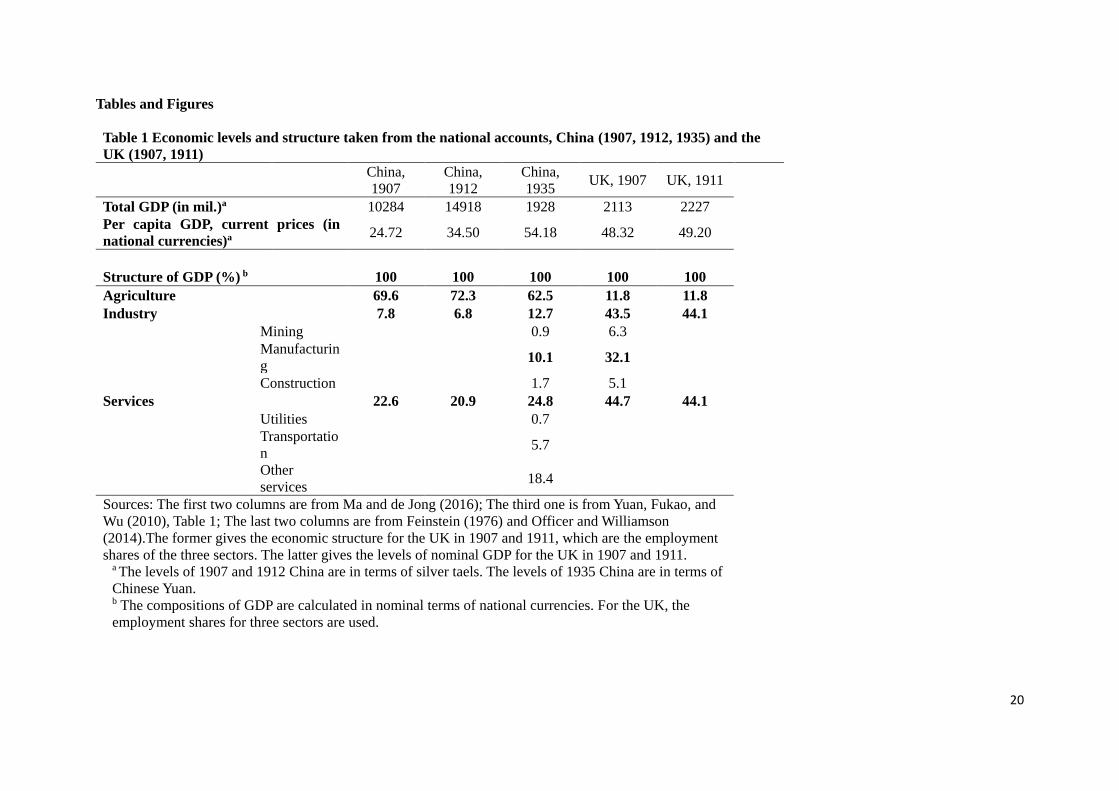
Table 1 presents the level and the structure of GDP for China and the UK in four different years before
the 1930s. In this period, the UK economy left the Chinese economy far behind in per capita GDP,
although the two economies were comparable in total GDP levels. Adjusted by market exchange rates,
the level of per capita GDP for China was £3.5 in 1907 and £5 in 1912, while the level for the UK was
£48.3 in 1907 and £49.2 in 1911, respectively. China’s GDP per capita level was 7.3 percent and 10.4
percent of the UK level in 1907 and 1911, respectively. Using just market exchange rates we may
underestimate the level of per capita GDP for China relative to the UK level. The official exchange rate
is determined by capital flows and by tradable goods, but is not necessarily a good converter for
domestic production and consumption. It is more appropriate to use a PPP-based comparison of per
capita GDP; however, this requires a new estimation of PPP for the whole economy between the two
countries. Based on the manufacturing PPP constructed in this study and prices for agricultural products,
we will provide a general PPP for China and the UK and a new GDP estimate for China in the year
1912.
[Figure 1]
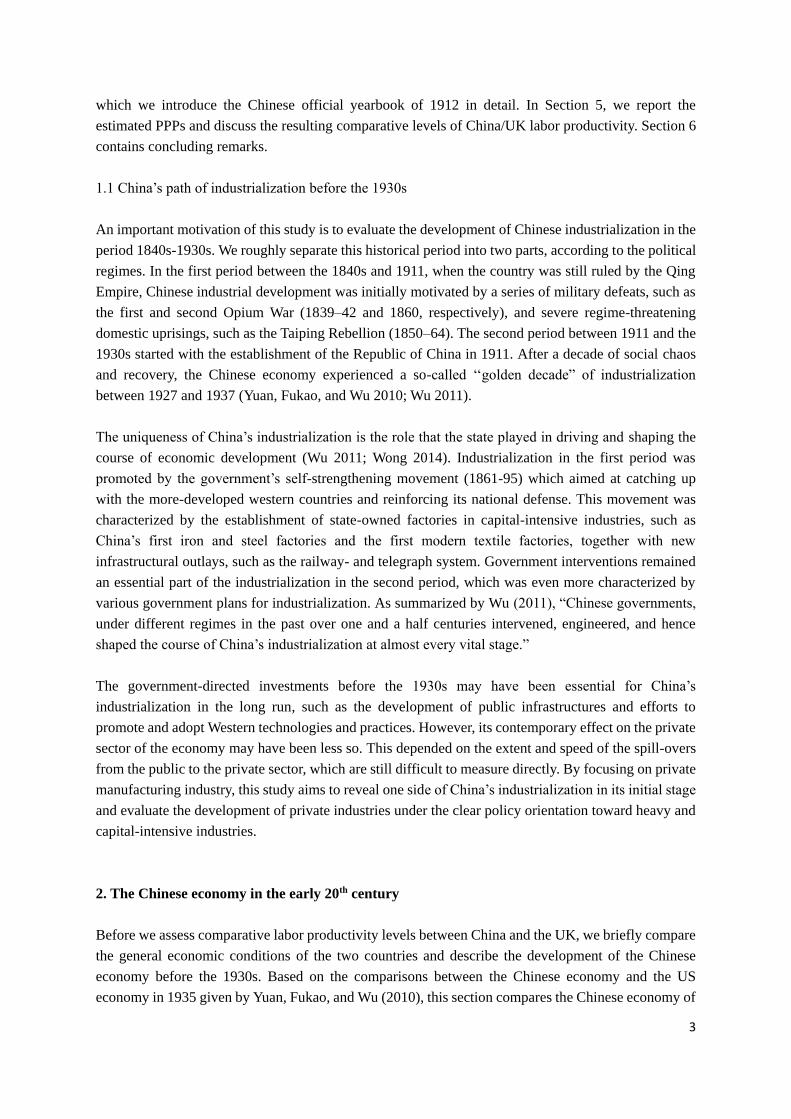
Figure 1 illustrates the difference in GDP structure between the two countries. For both 1912 and 1935,
China had a share in agriculture of more than 60 percent. By contrast, UK GDP in 1911 was produced
mainly in the industrial and service sectors, over 80 percent. As shown in Figure 1, the agricultural
share in total GDP in China decreased substantially in the period 1907-1935. Nevertheless, the size of
the industrial and service sectors was still extremely low compared with the economic structure of the
UK in 1911. Yuan, Fukao, and Wu (2010) also stressed China’s relative inferior position in
industrialization in 1935, as indicated by a low share of utilities and transportation in total GDP,
notwithstanding the government-directed investment in public infrastructure.
2.2 Manufacturing structure
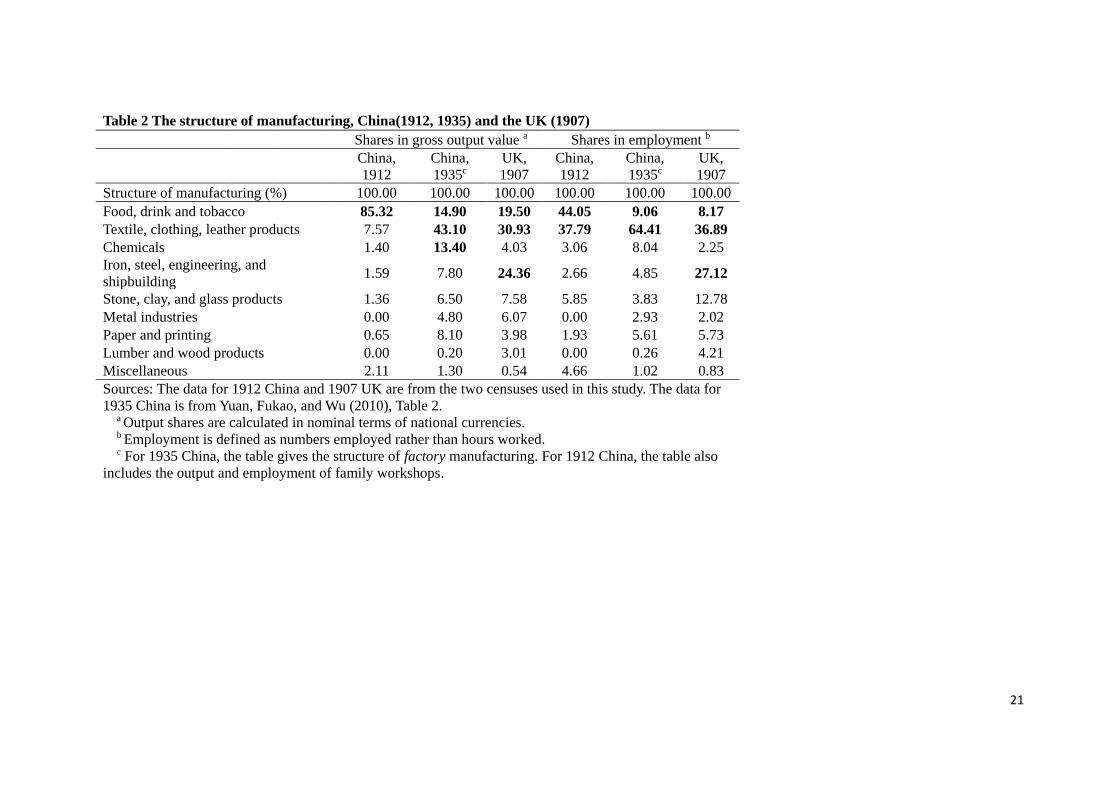
[Table 2]
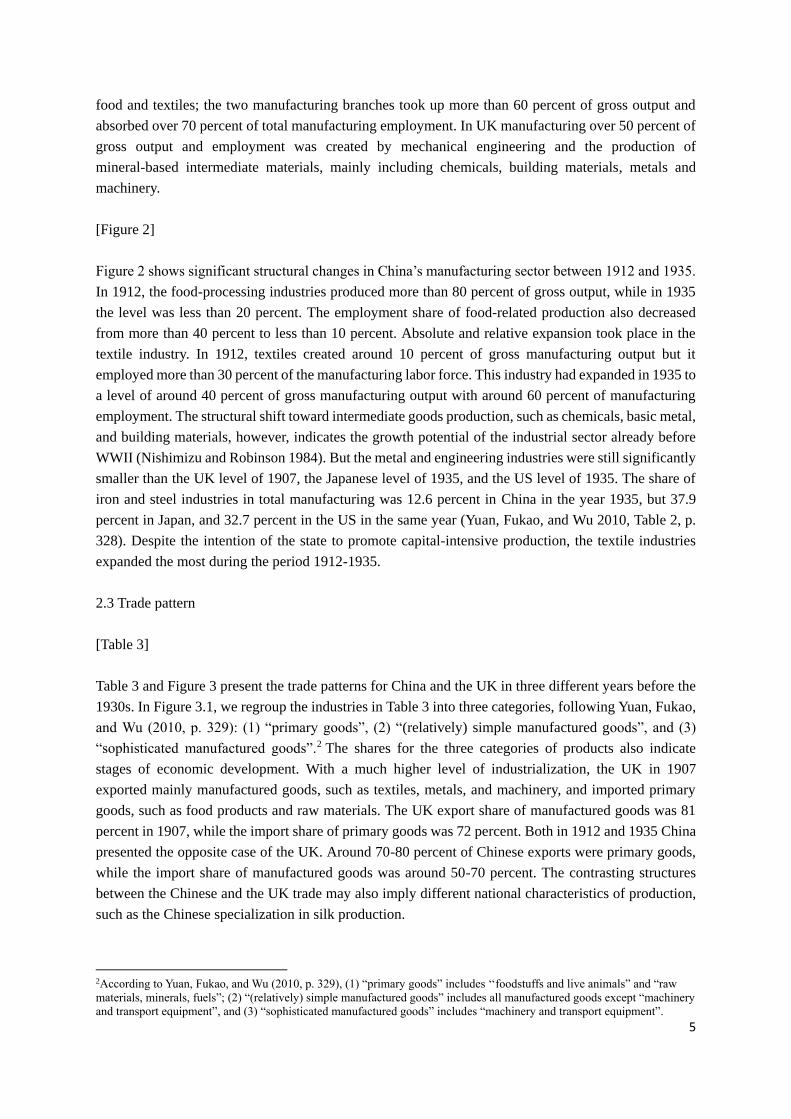
Table 2 and Figure 2 indicate the manufacturing structure for China and the UK in three different years,
which illustrate different stages of industrial development. In general, for both 1912 and 1935, China
was still in the early stage of industrialization, compared with UK manufacturing in 1907. Similar to
Yuan, Fukao, and Wu’s (2010) comparison with the US and Japan, we also regroup manufacturing
roughly into labor-intensive and capital-intensive industries. Chinese manufacturing in both 1912 and
1935 largely concentrated in the production of agricultural or primary resource-based goods, such as
5
food and textiles; the two manufacturing branches took up more than 60 percent of gross output and
absorbed over 70 percent of total manufacturing employment. In UK manufacturing over 50 percent of
gross output and employment was created by mechanical engineering and the production of
mineral-based intermediate materials, mainly including chemicals, building materials, metals and
machinery.
[Figure 2]
Figure 2 shows significant structural changes in China’s manufacturing sector between 1912 and 1935.
In 1912, the food-processing industries produced more than 80 percent of gross output, while in 1935
the level was less than 20 percent. The employment share of food-related production also decreased
from more than 40 percent to less than 10 percent. Absolute and relative expansion took place in the
textile industry. In 1912, textiles created around 10 percent of gross manufacturing output but it
employed more than 30 percent of the manufacturing labor force. This industry had expanded in 1935 to
a level of around 40 percent of gross manufacturing output with around 60 percent of manufacturing
employment. The structural shift toward intermediate goods production, such as chemicals, basic metal,
and building materials, however, indicates the growth potential of the industrial sector already before
WWII (Nishimizu and Robinson 1984). But the metal and engineering industries were still significantly
smaller than the UK level of 1907, the Japanese level of 1935, and the US level of 1935. The share of
iron and steel industries in total manufacturing was 12.6 percent in China in the year 1935, but 37.9
percent in Japan, and 32.7 percent in the US in the same year (Yuan, Fukao, and Wu 2010, Table 2, p.
328). Despite the intention of the state to promote capital-intensive production, the textile industries
expanded the most during the period 1912-1935.
2.3 Trade pattern
[Table 3]
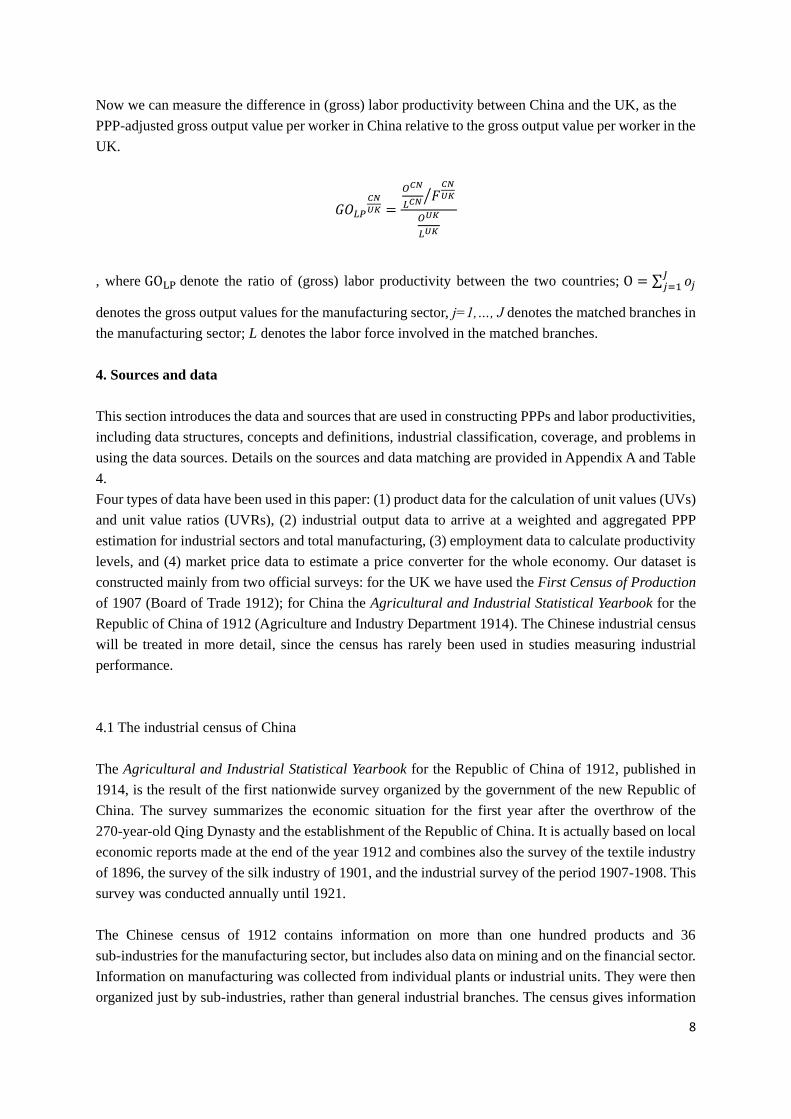
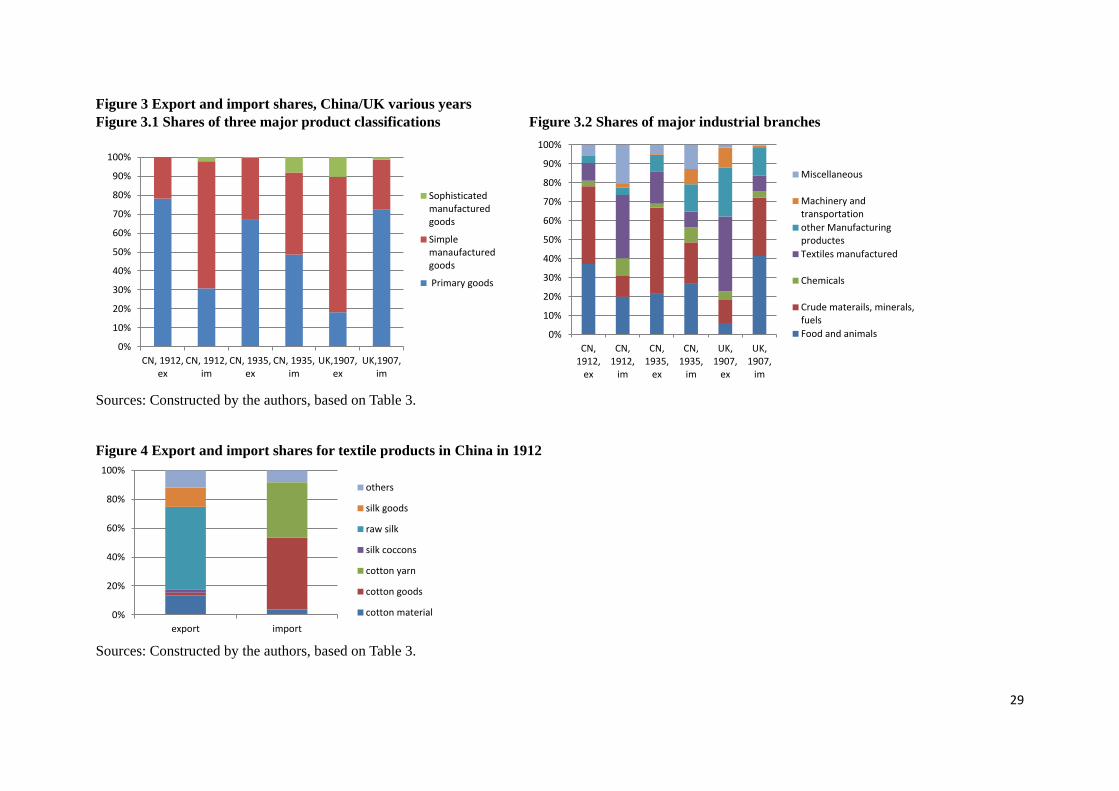
Table 3 and Figure 3 present the trade patterns for China and the UK in three different years before the
1930s. In Figure 3.1, we regroup the industries in Table 3 into three categories, following Yuan, Fukao,
and Wu (2010, p. 329): (1) “primary goods”, (2) “(relatively) simple manufactured goods”, and (3)
“sophisticated manufactured goods”.2 The shares for the three categories of products also indicate
stages of economic development. With a much higher level of industrialization, the UK in 1907
exported mainly manufactured goods, such as textiles, metals, and machinery, and imported primary
goods, such as food products and raw materials. The UK export share of manufactured goods was 81
percent in 1907, while the import share of primary goods was 72 percent. Both in 1912 and 1935 China
presented the opposite case of the UK. Around 70-80 percent of Chinese exports were primary goods,
while the import share of manufactured goods was around 50-70 percent. The contrasting structures
between the Chinese and the UK trade may also imply different national characteristics of production,
such as the Chinese specialization in silk production.
2According to Yuan, Fukao, and Wu (2010, p. 329), (1) “primary goods” includes ‘‘foodstuffs and live animals” and “raw
materials, minerals, fuels”; (2) “(relatively) simple manufactured goods” includes all manufactured goods except “machinery
and transport equipment”, and (3) “sophisticated manufactured goods” includes “machinery and transport equipment”.

6
The change of trade patterns for China between 1912 and 1935 is in conformity with classical theories
on trade patterns and economic development. As a country concentrates more on industrial production,
its exports will shift more towards manufactured goods and its imports more towards primary goods.
[Figure 3]
Compared with its trade shares in 1912, Chinese exports of primary goods decreased by 10 percentage
points, while the import share of primary goods increased by 20 percentage points. Figure 3.2 displays
an industrial classification of the products traded and shows the changes of trade structures in detail.
Food products and raw materials were still the main export goods for China in both 1912 and 1935.
Table 3 also indicates some important export goods in 1912, such as seed oil, hides, raw silk, and cotton,
which all belong to the category of primary goods. Compared with the trade shares in 1912, Chinese
imports of textiles decreased significantly in 1935, while the imports of other manufactured goods
increased, in particular for machinery and transportation equipment.
3. Calculating Purchasing Power Parities
This study follows the standard approach of constructing industry-of-origin PPPs developed by the
International Comparison of Output and Productivity program (ICOP) at the University of Groningen
(Maddison and van Ark, 1988; van Ark, 1993). Recently, the ICOP approach has also been applied to
the period before WWII (Fremdling, de Jong, and Timmer 2007; Yuan, Fukao, and Wu 2010; de Jong
and Woltjer 2011) and also to the period before WWI (Woltjer 2013; Veenstra 2014). These studies not
only prove that it is feasible to apply modern techniques for historical periods, but they also stress the
advantages of the price-based method over the quantity-based method in productivity comparisons.
This study combines the methods used in three studies to estimate a new manufacturing PPP for China
in the 1910swith the UK as a base country: Fremdling, de Jong, and Timmer (2007) give a
Germany/UK comparison for 1935/1936; de Jong and Woltjer (2011) provide a US/UK comparison for
1935; Yuan, Fukao, and Wu (2010) present a CN/US comparison for 1935. Two extensions are made in
this study, based on the new price relatives. First, we will compare (gross) labor productivities between
China and the UK for 1912/1907, using a single deflation procedure. Second, we will construct a
general PPP for the whole economy and then derive a GDP estimate for China in 1912. We can only
give a rough estimation here for the whole economy, by combining the new manufacturing PPP with
market price ratios for agricultural products between China and the UK.
A later improvement for this study is to use double deflation instead of single deflation, which is
considered to be the preferred approach for productivity comparisons, especially for the early 20th
century (Fremdling, de Jong, and Timmer 2007; de Jong and Woltjer 2011). The double deflation
approach helps to capture differences in the technical input-output coefficients for an industry between
two countries, which might be due to, for example, differences in production methods, the type of
materials used, and the amount of imported material. All these differences are essential to understand
the early stage of industrialization in the 1910s Chinese economy. However, both quantity and price
information for inputs is not widely available in the early 20th century production statistics of China,

7
when the newly-established government of Republic China started to organize the first nationwide
census. Another improvement is to adjust for differences in hours worked between the two countries,
instead of only using employment data.3
We first introduce the basic procedure to calculate a new manufacturing PPP. Unit values (uv) are
derived by dividing gross output values (o) by quantities (q) for each matched product i in each country.
𝑢𝑣𝑖 =𝑜𝑖
𝑞𝑖
For each matched product, the unit value ratio (UVR) is given by the following equation.
UVR𝑖
𝐶𝑁
𝑈𝐾 =𝑢𝑣𝑖
𝐶𝑁
𝑢𝑣𝑖𝑈𝐾
In this study, the UK is taken as the base country. The product’s UVR indicates the relative producer
price for the matched product in the two countries. UVRs of individual products need to be aggregated
to derive relative prices for sub-industries, for branches, and for the manufacturing sector. We take
sub-industry j as an example and label the relative price with a superscript j. In general, the PPP for
industry j is given by the following equation.
𝑃𝑃𝑃𝑖
𝐶𝑁
𝑈𝐾 = ∑ 𝑤𝑖𝑗𝑈𝑉𝑅𝑖𝑗
𝐶𝑁
𝑈𝐾
𝐼
𝑖=1
, where i=1,…,I denotes the matched products in industry j; 𝑤𝑖𝑗 = 𝑜𝑖𝑗 𝑜𝑗⁄ denotes the output share of
the ith product in industry j; and 𝑜𝑗 = ∑ 𝑜𝑖𝑗𝐼𝑖=1 denotes the total value of matched output in industry j.
The weights of either the base country (the UK) or the other country (China) can be used, which provide
a Laspeyres and a Paasche type PPP, respectively. The Fisher index, the geometric average of the
Laspeyres and Paasche indices, will be used in the single deflation process, denoted by 𝐹𝐶𝑁 𝑈𝐾⁄ .
In this study, the aggregation of the UVRs are weighted in multiple steps, first according to their output
shares in the sub-industry (Weight III), then according to the industry’s shares in the manufacturing
branch (Weight II), and finally according to the branch shares in manufacturing as a whole (Weight I).
Thus, the new manufacturing PPPs are derived using a ‘‘pyramid” type of approach, which consists of
three steps (Yuan, Fukao, and Wu 2010). The first step derives industry-specific PPPs, using Weight III.
The second step aggregates these industry-specific PPPs to yield branch level PPPs, using Weight II.
The final step aggregates these branch-level PPPs to derive a single PPP for the whole manufacturing
sector, using Weight I. For the last step, we use the branch shares directly from the census data. As a
result, the aggregated PPP in the final step will reflect the actual share of each branch for which UVRs
are available and taken as representatives for their branches. Appendix A shows the detailed calculation
procedure.
3 For state-owned factories in 1912 China, average weekly hours worked were ca 55 hours.
8
Now we can measure the difference in (gross) labor productivity between China and the UK, as the
PPP-adjusted gross output value per worker in China relative to the gross output value per worker in the
UK.
𝐺𝑂𝐿𝑃
𝐶𝑁
𝑈𝐾 =
𝑂𝐶𝑁
𝐿𝐶𝑁 𝐹𝐶𝑁
𝑈𝐾⁄
𝑂𝑈𝐾
𝐿𝑈𝐾
, where GOLP denote the ratio of (gross) labor productivity between the two countries; O = ∑ 𝑜𝑗𝐽𝑗=1
denotes the gross output values for the manufacturing sector, j=1,…, J denotes the matched branches in
the manufacturing sector; L denotes the labor force involved in the matched branches.
4. Sources and data
This section introduces the data and sources that are used in constructing PPPs and labor productivities,
including data structures, concepts and definitions, industrial classification, coverage, and problems in
using the data sources. Details on the sources and data matching are provided in Appendix A and Table
4.
Four types of data have been used in this paper: (1) product data for the calculation of unit values (UVs)
and unit value ratios (UVRs), (2) industrial output data to arrive at a weighted and aggregated PPP
estimation for industrial sectors and total manufacturing, (3) employment data to calculate productivity
levels, and (4) market price data to estimate a price converter for the whole economy. Our dataset is
constructed mainly from two official surveys: for the UK we have used the First Census of Production
of 1907 (Board of Trade 1912); for China the Agricultural and Industrial Statistical Yearbook for the
Republic of China of 1912 (Agriculture and Industry Department 1914). The Chinese industrial census
will be treated in more detail, since the census has rarely been used in studies measuring industrial
performance.
4.1 The industrial census of China
The Agricultural and Industrial Statistical Yearbook for the Republic of China of 1912, published in
1914, is the result of the first nationwide survey organized by the government of the new Republic of
China. The survey summarizes the economic situation for the first year after the overthrow of the
270-year-old Qing Dynasty and the establishment of the Republic of China. It is actually based on local
economic reports made at the end of the year 1912 and combines also the survey of the textile industry
of 1896, the survey of the silk industry of 1901, and the industrial survey of the period 1907-1908. This
survey was conducted annually until 1921.
The Chinese census of 1912 contains information on more than one hundred products and 36
sub-industries for the manufacturing sector, but includes also data on mining and on the financial sector.
Information on manufacturing was collected from individual plants or industrial units. They were then
organized just by sub-industries, rather than general industrial branches. The census gives information

9
on gross output (quantities and values of products) for many individual products and on employment for
sub-industries. The national aggregates in the census are based on provincial information covering 21
provinces and the capital city. Although it has several drawbacks, the Chinese census of 1912 is still the
most important archival record for studying early industrialization in the pre-modern Chinese economy.
It provides not only first-hand information but also a comprehensive and detailed coverage of Chinese
industry in the 1910s.
Chang (1969) and Xu and Wu (2003) question the reliability of the early Chinese industrial census in
the 1910s. They specifically mention the decrease in census coverage from 26 provinces to 10 provinces
after 1914 because of domestic social unrest. This decrease leads to a serious underestimation of total
industrial output. But even with declining coverage, the use of the data source is still possible according
to Xu and Wu (2003). In the present paper we only use the census of 1912. There are a few
shortcomings connected with this census. First, some products were not registered in the records. For
instance, the census provides the numbers of factories and employment for the production of machinery,
ships and vehicles, metal, and electricity power, respectively, but no corresponding information on
output is given. Second, the census misses information about three southwestern provinces, Tibet,
(Inner) Mongolia, and Qinghai which, however, were not heavily industrialized in the 1910s. A recent
re-estimation shows that the census already covered around 65 percent of the total output value in 1912
(Guan, 2011). Thus, the problem of coverage in the census 1912 is in our view not that serious as
previously expected. We therefore believe that the census is suitable to compare real output and
productivity with the UK.4 It is essential to use one and the same source for prices, output and
employment to guarantee internal consistency of the calculation. By matching products in the two
censuses, we were able to include 28 products and 6 branches to estimate PPPs between the countries.
Of course we may underestimate the relative production costs between China and the UK due to the
four missing sub-industries mentioned above. These sectors were mainly newly-established
capital-intensive industries. On the other hand, their impact on the total outcomes is rather small due to
the limited size of their total output.
The Chinese census of 1912 defines a factory as an enterprise that hired at least 7 workers, which is
similar to the definition in the Japanese Census of Factories of 1935.5 However, the Chinese census
actually combines factories with family workshops that hired less than 7 workers. Output data in this
census cover both factories and family workshops. For now, we do not try to separate the output of
family workshops from the total output given by this census. Thus, we may underestimate labor
productivity levels in Chinese manufacturing, if labor productivity in family workshops indeed was
lower than in factories. The UK census excluded “domestic workshops” that hired only family members.
An accurate performance comparison at industrial level depends on how the “modern” and “traditional”
sectors are defined in the official statistics for each country and how we can separate the two. There is a
chance that our comparison overestimates the productivity difference between China and the UK
around the 1910s, because (1) the “traditional” component of the Chinese manufacturing still
4 We have used Xu et al (2015)’s industry GDP estimation to solve the coverage problem. The value shares of sub-sectors in
manufacturing were estimated by this study rather than the shares from the census. This substitution does not affect the final
results in a significant level, however. 5 The Japanese census of factories of 1935 defined a factory as an enterprise that hired five or more workers and used machine
power (Yuan, Fukao, and Wu 2010). The definition of a factory in the Chinese census of 1912 was preliminary and temporary.
Later, China’s first Factory Law, passed in 1929, defined a factory as an enterprise that hired at least 30 workers and also
employed machine power (Lieu, 1955).
10
dominated in size over the “modern sector” in the 1910s; (2) the productivity of the “traditional” sector
was on average lower than that of the “modern” sector; (3) only the “modern” sector is well recorded in
the UK census.
Official surveys may differ in their definitions and concepts, such as gross output and employment,
which can lead to bias in a productivity comparison. We do not find notable differences between the
Chinese census and the UK census on this matter. For instance, the UK census defined employment as
“the average number of persons employed on the last Wednesday in January, April, July, and October in
the factories, together with the number ordinarily employed in the workshops”, while the Chinese
census defined employment as “the average number of persons employed in one year”. The Chinese
census only includes gross output, while the UK census provides data on intermediate inputs and net
output as well.
The census years for the comparison between China and the UK differ by five years; thus, we measure
the productivity level of Chinese manufacturing in 1912 relative to the UK level in 1907. Although the
choice of benchmark years is partly determined by the availability of data sources, we still need to take
account of changes of productivity levels in Chinese manufacturing and to assess the possible effects of
business cycles and of differences in capacity utilization. During the period 1907-1912, Chinese real
GDP did not change significantly, but industrial production might have experienced a rapid increase
driven by inputs of capital and labor and by increasing returns, in particular in this early stage of
development. If we assume that the increase of Chinese manufacturing was faster than that of UK
manufacturing in the period 1907-1912, we may underestimate the gap between the two economies and
this will result in a lower comparative China/UK labor productivity. For now, we do not adjust for the
year difference. By comparing these two census years, we still capture the nature of Chinese industrial
development on the eve of the First World War.
4.2 Data matching and coverage
The starting point for matching products and industries is the industrial classification. This study
follows the classification of the UK census of 1907. We try to reclassify the Chinese manufacturing
sector into 11 branches as presented in Table 4. The Chinese census gives detailed product and industry
information on a lower level of aggregation, which makes it easy to fit the Chinese industries into the
classification used in the UK census. We have moved the seed-crushing industry into the branch Food,
Drink and Tobacco, away from its original branch, Chemicals, in the UK census. Future improvement
on the classification will be based on the two-digit industries as defined in the ISIC (International
Standard of Industrial Classification).
[Table 4]
Following the standard “industry-of-origin” PPP approach, as explained in the methodology section, we
need to match similar products between China and the UK and then derive prices per unit of product, or
unit values (UVs), in the national currency of each country. It would be impossible to match products
shared between two countries, without having detailed information about their characteristics. The
Chinese census of 1912 used in this study lacks detailed explanations on products and industries. Hence,
11
other explanatory sources have been used. For this study we relied on two data sources for the Chinese
industry: (1) D.K. Lieu’s Report on a Survey of China’s Industry (NRC 1937) and (2) Zhen Chen’s
Study Materials of Industrial History in Contemporary China, vol. 4 (Chen 1961). In the UK census,
there is a wealth of information on the product level.
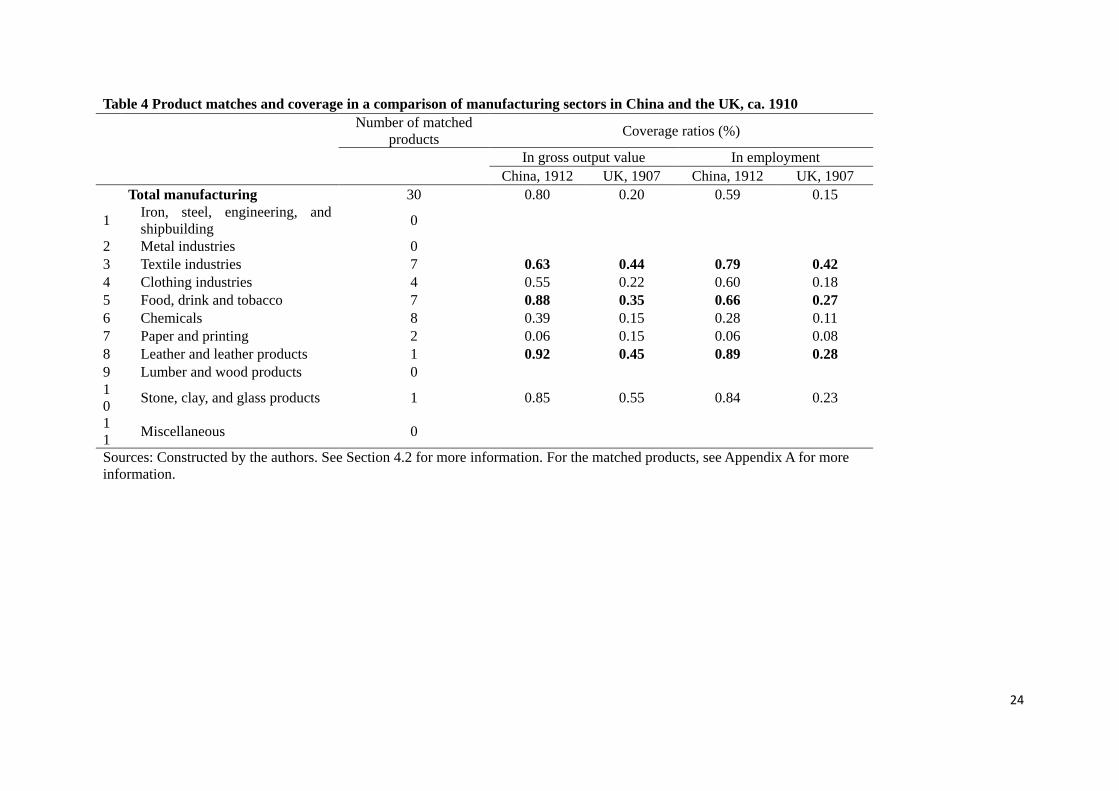
This study presents 30 matches of products and classifies them into 7 branches. The sample of products
ranges from cotton piece goods to various chemical products. A complete list is presented in Appendix
A. Table 4 gives the range of coverage in terms of gross output and employment, which shows to what
extent the Chinese and the UK economies shared similar manufacturing products. We use the number of
matches and the coverage ratios to indicate the range of coverage. The calculated coverage ratios are the
share of total gross output value or employment being covered by products matched in each country.
This study covers 80 percent of the Chinese and 20 percent of the UK manufacturing output. In the
various branches, the ratios for China are generally over 50 percent, while the ratios for the UK are
around 20 percent. There are three branches for which the coverage ratio is higher than or close to 30
percent for both countries: (1) food, drink, and tobacco, (2) textile industries, and (3) leather and leather
products.
The coverage ratios for the manufacturing sector and for each matched branch are quite different
between China and the UK. The differences in coverage ratios are significant in this study, compared
with the coverage ratios in pre-WWII productivity studies (Fremdling, de Jong, and Timmer 2007) and
also pre-WWI productivity studies (Woltjer 2013; Veenstra 2014), in which the differences are usually
below 20 percentage points. However, these are comparisons between developed countries. The
coverage ratio between a less developed country and a more developed country can vary greatly due to
differences in industrial structure and in phases of industrial development. In a China/US
manufacturing comparison for the 1930s, 35.7 percent of Chinese products and 17.2 percent of US
products were covered (Wu 2001). In a China/Japan comparison for 1935, about 72 percent of Chinese
products and 30 percent of Japanese products were covered (Yuan, Fukao, and Wu 2010). In the 1910s,
China was still in an early stage of industrialization, compared with the UK, and was slowly recovering
from previous internal wars. The number of matches also indicates that the industrial structure in China
in the 1910s was still quite basic compared to the UK. As mentioned before, most of the manufacturing
production and employment in China centered on simple food-processing activities.
The difference in coverage ratios can also be explained by the availability of data on products,
heterogeneity of products and of quality across countries, the unique national character of tastes and
output, and differences in quantity specifications (units of measurement). Our China/UK comparison
provides various examples. In Chinese manufacturing, mats and matting production was an important
industry, which can also be found in the Chinese export reports, but the UK census of 1907 only gives
the production value. The Chinese census records gross output of gloves made from textiles, while the
UK census only reports gloves made from leather. We have to leave these two products or
sub-industries out of our comparison. Silk production is another case. The Chinese census of 1912 lists
nine different types of silk products, while there is only one entry of silk products in the UK census of
1907. Thus, we have to use the aggregated silk output in China and compare this with the total silk
output in the UK. Similar procedures have been used to compare oil, liquor, and sugar production
between the two countries. For paper production, we classified the nine different types of paper listed in
12
the Chinese census into two general types as used in the UK census: first-class writing paper and paper
for printing.
5. Analyzing the new levels of prices, productivity and GDP
5.1 New manufacturing PPPs and a new estimate for total real GDP in China in 1912
Table 5 provides the gross output PPPs according to the methodology described above and presents the
Laspeyres, Paasche, and Fisher PPPs from our binary comparisons for manufacturing as a whole and for
all the matched branches. The estimated PPP for total manufacturing in China relative to the UK is 6.61
Yuan/Pound. Compared with the market exchange rate in 1912 (9.99 Yuan/Pound), the PPP-adjusted
relative producer price level for Chinese manufacturing is 0.66. This suggests that the price for the
matched products was 28 percent lower than the UK level than measured by the market exchange rate.
[Table 5]
The lower producer price for China relative to the UK is a reflection of the fact that non-tradable goods
had a lower price level in China than in the UK. This is the standard Balassa-Samuelson effect.
Productivity growth in the tradable goods sector will eventually raise the price of non-tradable goods,
when an economy is more and more involved in foreign trade (Balassa 1964; Samuelson 1964).
Therefore, the relatively lower manufacturing PPP results from different stages of economic
development of the two economies. The UK economy was certainly more developed, industrialized,
and involved in international trade than the Chinese economy in the early 20th century.
A further decomposition of the manufacturing sector offers additional insights into the price structure of
these two economies. First, the relative price (UVRs) differences across manufactured products and
sub-industries were quite substantial. For instance, the UVRs for sugar and oil are over 20, which is far
above the branch average of 9.75 in food processing. In the same branch the UVRs for liquor and
tobacco are below 5. Second, the specific pattern of industrial specialization for a country is reflected in
the relative price structure between the two countries (See Table 2 and Figure 2 for more details).
Chinese manufacturing in 1912 focused on food processing (85 percent), while UK manufacturing in
1907 was concentrated more on textiles (30.4 percent) and engineering (24.4 percent). Even within
these branches considerable structural differences existed, again illustrated by the gap between the
respective Paasche and Laspeyres PPPs for branches, especially for food processing. In China, edible
oil was the main product within the food processing branch, in the UK it was liquor.
Following Yuan, Fukao, and Wu (2010), we can also ask the question how to interpret the gap between
the PPP-implied price level and the market exchange rate. Table 5 shows that the gap is almost
non-existing for the food processing industry, while for textiles, chemicals, and paper production the
gap is quite high. The baseline is that manufactures are generally tradable goods and by nature their
PPPs should be close to the market exchange rates (see Prasada Rao and Timmer 2003). Although it is
still difficult to provide a comprehensive explanation for the gap, a comparison between the import and
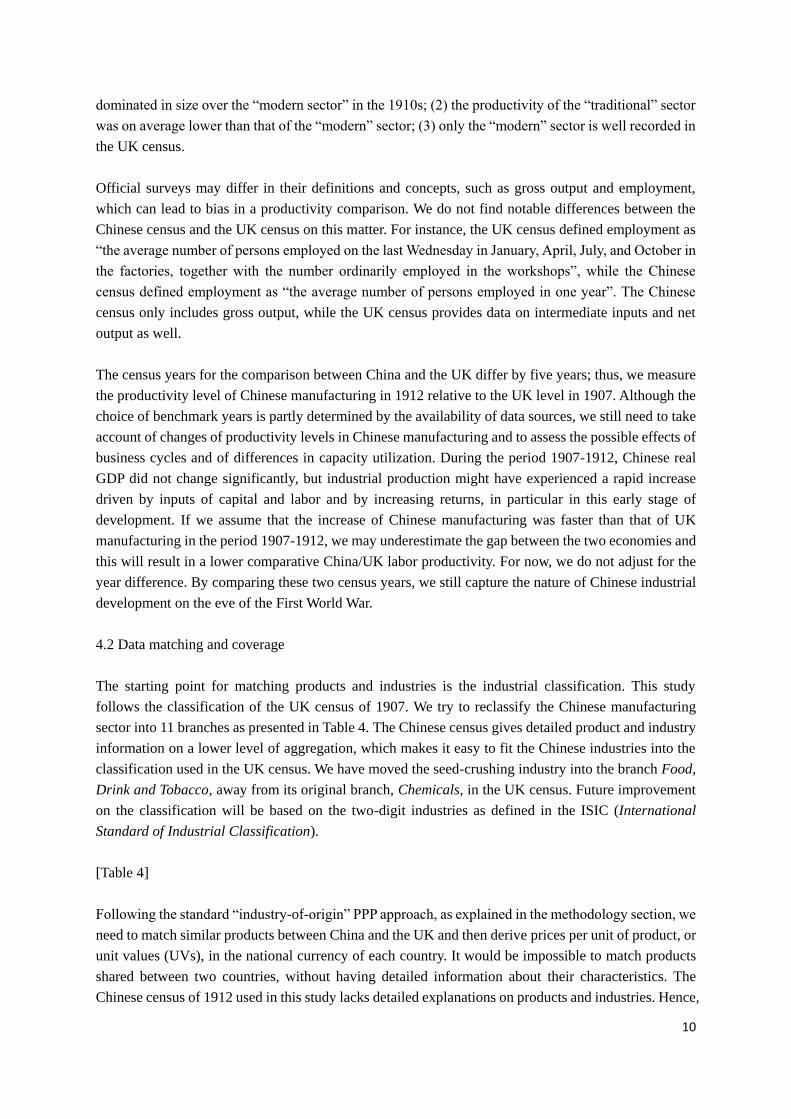
export value of products gives us some clues to understand it. Taking the trade of textile products in

13
China as an example, the import value of textile products was 1.67 times the export value in China in
1912. Figure 4 shows that cotton piece-goods and cottons yarn took up 88 percent of the total import
value of textile products, while cotton materials and raw silk took up 80 percent of the total export value
of textile products. Thus, in 1912 the Chinese economy exchanged intermediate materials for textile
production for textile manufactures. We also find that the import/export ratios for the value of cotton
piece-goods, paper, and chemicals in 1912 were 53, 2.3, and 44, respectively. In general, the Chinese
economy in the 1910s tended to export intermediate inputs for manufacturing, such as cotton materials
and raw silk, and to import final manufactured goods, such as cotton piece-goods . A stronger demand
for imports in China than the foreign demand for exports may have driven up the exchange rate of
foreign currencies. For instance, the PPP-adjusted relative producer price for Chinese textile industry
was 0.64, relative to the market exchange rate in 1912.
[Figure 4]
Appendix B presents the calculation procedure to derive the level of per capita GDP for 1912 in China
in terms of 1990 international dollars. Here we applied the method that has been used by Broadberry,
Gaun, and Li (2014). For the industrial sector we relied on the already presented results. For the
agricultural sector we have used three products, i.e. rice, wheat, and maize, and calculated the market
price ratios between China and the UK for the three products. To estimate the weights for the three
products in the Chinese agricultural sector, we combined market prices in 1912-1913 and output
quantities in 1915 to derive their market value. The resulting agricultural PPP in China relative to the
UK is 9.10 Yuan/Pound, which is actually quite close to the market exchange rate in 1912, 9.99
Yuan/Pound. Because we have no price and volume information on services we have assumed that the
service PPP equals the average of the agricultural and industrial PPPs. Taking the economic structure
for China in 1912 and the UK in 1911 as the weights for the three sectors, we derive the general PPP for
the whole economy, which is 8.02 yuan/£ in the 1910s. With this new PPP our estimate of per capita
GDP for China in 1912 is 545 international dollars (of 1990), which is lower than Maddison’s 1913
estimate, 552 GK dollars. Applying the real growth rates estimated by Ma and De Jong(2016), we can
back-project the level of per capita GDP for China in 1912 to its earlier 1840s level, which is 645
international dollars of 1990. This level is higher than Maddison’s estimate of 600 dollars for 1850 and
Broadberry, Guan, and Li’s (2013) estimation of 594 for the 1840s.
5.2 Labor productivity
Table 6 gives our results of comparative gross labor productivity in China and the UK for different
branches of industry using our industry-specific PPPs, and a total weighted average. Labor productivity,
measured as gross output per worker, reflects the level of capital deepening and the level of efficiency,
compared with the base country. In general, labor productivity in Chinese manufacturing in 1912 was
around 16 percent of the UK level in 1907. For all the matched branches, Chinese labor productivity
levels were substantially lower than the UK levels. We notice that the labor productivity level in the
total weighted average is higher than levels for branches. This reflects the extremely large share of
food-processing industries in total manufacturing in China, compared with the UK, and the high relative
labor productivity level of this branch compared with other Chinese branches.

14
[Table 6]
Did the Chinese economy experience a catch-up phase in manufacturing during the first decades of the
twentieth century, relative to UK manufacturing? To answer this question we constructed comparative
labor productivity in 1935 between China and the UK, based on de Jong and Woltjer (2011) and Yuan,
Fukao, and Wu (2010). The former provides a relative labor productivity level between the US and the
UK (2.24), while the latter provides a relative level between China and the US (0.07). We can derive an
indirect labor productivity level between China and the UK for 1934-35 of 0.1568. Relatively speaking,
we do find catch-up in manufacturing of China against the UK after the 1910s. However, the
catching-up effect is only in a relative form, taking into account the potential underestimation of the
comparative China/UK labor productivity in the 1910s. Labor productivity in the UK manufacturing
also increased during this period; thus, in absolute levels we can hardly see any catch up in
manufacturing of China against the UK.
[Table 7]
Finally we were able to construct comparative labor productivities between regions of China and the
UK (see Table 7). This makes it possible e.g. to compare the labor productivity level in the Yangzi delta
region with that of the UK in the early stage of China’s industrialization. We already discussed that
labor productivity for the whole manufacturing sector may average out extreme values among the
different industrial branches. Likewise labor productivity for the whole country may also average out
extreme values among regions. We regrouped the 21 provinces and the capital city into six larger
regions and repeated the calculation of comparative labor productivity. For the sample comparison
which only includes the matched products and sub-industries, the Guangdong region was the leading
region for manufacturing in 1912; it had higher comparative labor productivity levels than the national
level. For the textile industry, the Yangzi region was still one of the leading regions, but it had lost its
status to the Guangdong region and even to the large middle region. For the food-processing industry,
the middle region was the leading area in 1912, which had always been the main region for agricultural
production. Note however, that the regional comparative labor productivity is only a preliminary
indicator for the difference between a region of China and the UK, since we have not matched the
specific products of the region with the UK but have applied the national manufacturing PPPs.
6. Final remarks
This study fits in the literature on long-term comparative economic performance by providing a new
benchmark estimate between the Chinese economy and the more-developed UK economy in the period
before WWI. The paper also wants to contribute to the general discussion of industrialization by
stressing the importance of structural transformation in the early stages of industrialization. In this final
section, we summarize our findings and point out some limitations that need to be taken up in future
research on the topic.
The benchmark exercise has estimated a Chinese labor productivity level in manufacturing in 1912 that
was around 16 percent of the UK level in 1907. A similar level of comparative labor productivity was

15
found between the two economies in 1935. This leads to the conclusion that the early industrialization
in China during the years between 1912 and 1935 did not narrow the gap with the more-developed
economies. However, one might as well conclude that the efforts towards industrialization at least
stopped the widening of the gap. Second, during this period the focus of Chinese manufacturing shifted
from food-processing to textile manufacturing. Because productivity levels in food production were
much higher than in textiles, structural change in the manufacturing sector did not result in rapid growth.
Third, comparative labor productivities between regions of China and the UK indicate a significant
regional imbalance in the early stage of China’s industrialization. Whereas the Yangzi region started to
decline, the vast middle region and the south coastal region of China began to take off in the 1910s.
Data coverage remains a big challenge in this type of studies. In particular between less-developed and
more-developed economies it is difficult to find large numbers of similar goods necessary to make a
reliable labor productivity comparison. This study compares the Chinese and the UK economy on the
basis of the matched manufactured goods and the matched branches. But there is no one-to-one
relationship with total manufacturing. E.g. for China we also would like to include the productivity
performance of state-owned factories and state-directed investments, which are not in the sample. This
information would help us to get a complete understanding of China’s early industrialization before the
establishment of the Peoples’ Republic of China in 1949.6
However, two major improvements are within reach. The first one is to perform a much closer
investigation into the agricultural sector in the context of China’s early industrialization and to provide
a better PPP-estimator for the total economy. Secondly an estimate of regional manufacturing PPPs for
each of the six regions of China will give a more accurate picture of productivity levels between the
various regions of China which may be compared with the European core and periphery. The improved
PPPs, on both the country and the regional level, may reveal the degree of regional imbalances in the
early stage of China’s industrialization. The degree of dispersion between the regional and
country-level PPPs can tell us whether or not the country-level PPP is a representative indicator for the
whole economy.
6 In 1912 in China the proportion of the employment in state-owned factories to that in private manufacturing enterprises was
0.20 percent.

16
References
Balassa, B. 1964, "The purchasing-power parity doctrine: a reappraisal", The Journal of Political
Economy, vol. 72, no. 6, pp. 584-596.
Bolt, J. & van Zanden, J.L. 2014, "The Maddison Project: collaborative research on historical national
accounts", The Economic History Review, vol. 67, no. 3, pp. 627-651.
Broadberry, S., Guan, H. & Li, D.D. 2014, China, Europe and the Great Divergence: A Study in
Historical National Accounting, working paper edn.
Chang, J.K. 1969, Industrial Development in Pre-Communist Chian: A Quantitative Analysis,
Edinburgh University Press, Edinburgh.
Chen, Z. (ed) 1961, Zhongguo Jindai Gongyeshi Ziliao (Study Materials of Industrial History in
Contemporary China), Shenghuo- Dushu-Xinzhi Sanlian Shudian Press, Beijing.
de Jong, H. & Woltjer, P. 2011, "Depression dynamics: a new estimate of the Anglo-American
manufacturing productivity gap in the interwar period1", The Economic History Review, vol. 64,
no. 2, pp. 472-492.
Feinstein, C. 1976, Statistical Tables of National Income, Expenditure and Output of the UK,
1855–1965, Cambridge University Press, Cambridge.
Fremdling, R., de Jong, H. & Timmer, M. 2007, "British and German manufacturing productivity
compared: a new benchmark for 1935–36 based on double deflated value added", Journal of
Economic History, vol. 67, no. 2, pp. 350-378.
Fukao, K., Ma, D. & Yuan, T. 2007, "Real GDP in Pre-War East Asia: A 1934-36 Benchmark
Purchasing Power Parity Comparison with the US", Review of Income and Wealth, vol. 53, no. 3,
pp. 503-537.
Guan, Q. 2011, "An Estimate of Production Value in China Manufacturing industry in 1910s: an
evaluation and revision of "Statistical Tables of Agriculture and Commerce"", China Review of
Political Economy, vol. 2, no. 4, pp. 121-144.
Hsiao, L. 1974, China’s Foreign Trade Statistics, 1864–1949, East Asian Research Center, Harvard
University : distributed by Harvard University Press, Cambridge, Mass.
Jacks, D.S., O'Rourke, K.H. & Williamson, J.G. 2011, "Commodity Price Volatility and World Market
Integration since 1700", Review of Economics and Statistics, vol. 93, no. 3, pp. 800-813.
Kong, M. & Peng, Z. (eds) 1988, Nankai Jingji zhishu ziliao huibian [collection of Nankai economic
statistics], China Shehuikexue Press, Tianjing.
17
Lieu, D.K. 1955, Industrial Development in Communist China, New York, Sino-American Amity.
Ma, Y. & de Jong, H. 2016, Unfolding the Turbulent Century: A Reconstruction of China’s Economic
Development, 1840-1912, presented in a seminar held at the Hitotsubashi Institute for Advanced
Study, Tokyo.
Maddison, A. & van Ark, B. 1988, Comparisons of Real Output in Manufacturing, Policy, Planning,
and Research Working Papers, International Economics Department, the World Bank,
Washington, DC.
Nishimizu, M. & Robinson, S. 1984, "Trade policies and productivity change in semi-industrialized
countries", Journal of Development Economics, vol. 16, no. 1-2, pp. 177-206.
Officer, L.H. & Williamson, S.H. 2014, What Was the U.K. GDP Then?, Measuring Worth.
Prasada Rao, D.S. & Timmer, M.P., 2003, "Purchasing power parities for manufacturing sector price
comparisons using new multilateral index number methods", Review of Income and Wealth, vol.
49, no. 4, pp. 491-512.
Samuelson, P.A. 1964, "Theoretical notes on trade problems", The review of economics and statistics,
vol. 46, no. 2, pp. 145-154.
van Ark, B. 1993, International Comparisons of Output and Productivity: Manufacturing Productivity
Performance of Ten Countries from 1950 to 1990, Groningen Growth and Development Centre
Monograph Series, No.1 edn, University of Groningen, The Netherlands.
Veenstra, J. 2014, Missed Opportunities? Germany and the Transatlantic Labor-Productivity Gap,
1900-1940, Thesis in Economics and Business edn, University of Groningen, Groningen.
Wang, Y.C. 1992, "Secular trends of rice prices in the Yangzi Delta, 1638–1935" in Chinese history in
economic perspective, eds. T.G. Rawski & L.M. Li, Berkeley, , pp. 35-68.
Woltjer, P.J. 2013, The roaring thirties : productivity growth and technological change in Great Britain
and the United States during the early Twentieth Century, Theses in Economics and Business edn,
University of Groningen, Groningen.
Wong, R.B. 2014, A Century of Chinese State Policies toward Industrialization.
Wu, H.X. 2011, Rethinking China's path of industrialization, Working paper 2011-76 edn, World
Institute for Development Economics Research.
Xu, D. & Wu, C. 2003, Zhongguo zibenzhuyi fazhanshi (History of Capitalist Development in
China, 1840-1920), 2nd edn, Renmin Press, Beijing.
Xu, Y., Shi, Z., van Leeuwen, B., Ni, Y., Zhang, Z. & Ma, Y. 2015, Chinese National Income, ca.
1661–1933, University Library of Munich, Germany.

18
Yang, D. & Hou, H. 1931, Statistics of China's Foreign Trade During the Last Sixty-five Years,
National Research Institute of Social Sciences, Academia Sinica, Shanghai.
Yuan, T., Fukao, K. & Wu, H.X. 2010, "Comparative output and labor productivity in manufacturing
between China, Japan, Korea and the United States for ca. 1935 – A production-side PPP
approach", Explorations in Economic History, vol. 47, no. 3, pp. 325-346.

19
Official Publications and Reports
Agriculture and Industry Department 1914, Agricultural and Industrial Statistical Yearbook for
Republic of China (1912), 1st edn, Zhonghua Press, Shanghai.
Agriculture and Industry Department 1919, Agricultural and Industrial Statistical Yearbook for
Republic of China (1916), 1st edn, Zhonghua Press, Shanghai.
Board of Trade 1912, Final Report on the First Census of Production of the United Kingdom (1907),
H.M. Stationery Office, London.
H. M. Customs and Excise, Annual Statement of the Trade of the United Kingdom, 1907, H.M.
Stationery Office, London.
NRC (National Resource Commission of Nationalist Government) 1937, Chung-kuo
kung-yehtiao-ch’apao-kao (Report on A Survey of China’s Industry), National Resource
Commission of Nationalist Government, Nanjing.
20
Tables and Figures
Table 1 Economic levels and structure taken from the national accounts, China (1907, 1912, 1935) and the
UK (1907, 1911)
China,
1907
China,
1912
China,
1935 UK, 1907 UK, 1911
Total GDP (in mil.)a 10284 14918 1928 2113 2227
Per capita GDP, current prices (in
national currencies)a 24.72 34.50 54.18 48.32 49.20
Structure of GDP (%) b 100 100 100 100 100
Agriculture 69.6 72.3 62.5 11.8 11.8
Industry 7.8 6.8 12.7 43.5 44.1
Mining 0.9 6.3
Manufacturin
g 10.1 32.1
Construction 1.7 5.1
Services 22.6 20.9 24.8 44.7 44.1
Utilities 0.7
Transportatio
n 5.7
Other
services 18.4
Sources: The first two columns are from Ma and de Jong (2016); The third one is from Yuan, Fukao, and
Wu (2010), Table 1; The last two columns are from Feinstein (1976) and Officer and Williamson
(2014).The former gives the economic structure for the UK in 1907 and 1911, which are the employment
shares of the three sectors. The latter gives the levels of nominal GDP for the UK in 1907 and 1911. a The levels of 1907 and 1912 China are in terms of silver taels. The levels of 1935 China are in terms of
Chinese Yuan. b The compositions of GDP are calculated in nominal terms of national currencies. For the UK, the
employment shares for three sectors are used.
21
Table 2 The structure of manufacturing, China(1912, 1935) and the UK (1907)
Shares in gross output value a Shares in employment b
China,
1912
China,
1935c
UK,
1907
China,
1912
China,
1935c
UK,
1907
Structure of manufacturing (%) 100.00 100.00 100.00 100.00 100.00 100.00
Food, drink and tobacco 85.32 14.90 19.50 44.05 9.06 8.17
Textile, clothing, leather products 7.57 43.10 30.93 37.79 64.41 36.89
Chemicals 1.40 13.40 4.03 3.06 8.04 2.25
Iron, steel, engineering, and
shipbuilding 1.59 7.80 24.36 2.66 4.85 27.12
Stone, clay, and glass products 1.36 6.50 7.58 5.85 3.83 12.78
Metal industries 0.00 4.80 6.07 0.00 2.93 2.02
Paper and printing 0.65 8.10 3.98 1.93 5.61 5.73
Lumber and wood products 0.00 0.20 3.01 0.00 0.26 4.21
Miscellaneous 2.11 1.30 0.54 4.66 1.02 0.83
Sources: The data for 1912 China and 1907 UK are from the two censuses used in this study. The data for
1935 China is from Yuan, Fukao, and Wu (2010), Table 2. a Output shares are calculated in nominal terms of national currencies. b Employment is defined as numbers employed rather than hours worked. c For 1935 China, the table gives the structure of factory manufacturing. For 1912 China, the table also
includes the output and employment of family workshops.

22
Table 3 Export and import values and shares, China (1912, 1935) and the UK (1907) in mil. of national currencies
China, 1912 China, 1935 UK, 1907
Export Shares Shares Import Shares Shares Export Shares import Shares Export Shares Shares Import Shares Shares
Total value 555.50 100 709.29 100 520.13 100 669.42 100 426.04 100 488.67 100
Food and animals 206.81 100 37.23 141.55 100. 19.96 111.67 21.47 179.10 26.75 26.16 100 6.14 202.50 100 41.44
Seed oil 53.40 25.82 9.61 4.60 3.25 0.65 3.43 13.11 0.81 19.05 9.41 3.90
Crude
materials,minerals, and
fuels
88.18
100 15.87
68.06
100. 9.60
236.29
45.43
146.29
21.85
48.23
100 11.32
66.27
100 13.56
Hides 18.52 21.00 3.33 0.94 1.37 0.13 1.82 3.77 0.43 5.66 8.54 1.16
Chemicals 16.13 100 2.90 66.53 100. 9.38 10.54 2.03 53.88 8.05 19.40 100 4.55 15.59 100 3.19
Leather 5.36 33.24 0.97 11.81 17.75 1.67 6.60 34.02 1.55 8.07 51.76 1.65
Paper 4.87 30.21 0.88 6.45 9.70 0.91 2.34 12.09 0.55 5.52 35.40 1.13
Textiles 191.08 100 34.40 245.45 100 34.61 87.59 16.84 55.08 8.23 171.71 100 40.30 125.93 100 25.77
Cottonmaterials d
25.86 13.54 4.66
9.27 3.77 1.31
0 0 0
67.99 53.99 13.91
Cotton goods 3.49 1.83 0.63 122.08 49.74 17.21
Cotton yarn 0 0 0 93.95 38.28 13.25 110.44 64.31 22.60 9.31 7.39 1.91
Silk cocoonsd 3.69 1.93 0.66 0 0 0
Raw silk d 109.71 57.42 19.75 0 0
Silk goods 25.51 13.35 4.59 0 0 0
Others 22.82 11.94 4.11 20.16 8.21 2.84
Manufactured products
classified by materialsa 20.61
3.71 29.19
4.12 46.66
8.97 96.32
14.39 110.12
25.85 70.14
14.35
Machinery and
transportation
equipment
0
0.00
15.55
2.19
2.11
0.41
53.88
8.05
44.23
10.38
6.47
1.32
Miscellaneous
manufactured articlesb 32.70
5.89 142.96
20.15 24.98
4.80 84.88
12.68 6.28
1.47 1.77
0.36
of which(total export or import value =1)
Primary goodsc 0.78 0.31 0.67 0.49 0.18 0.72
Simple manufactured
goodsc 0.22 0.67 0.33 0.43 0.71 0.26

23
Sophisticated
manufactured goods c 0.00 0.02 0.00 0.08 0.10 0.01
Sources: The trade data for 1912 China is reorganized from Yang and Hou (1931). The trade data for 1935 China is from Yuan, Fukao, and Wu (2010), Table 3. The trade data for 1907
UK is reorganized from “Annual Statement of the Trade of the United Kingdom, 1907” (London: HMSO).Value shares are calculated in nominal terms of national currencies. a Excluding textiles. Including metal industries b Including other commodities and transactions not classified according to kind. c “Primary goods” includes ‘‘food stuffs and live animals”, ‘‘crude materials, minerals and fuels”; ‘‘simple manufactured goods” includes all manufactured except “machinery and
transport equipment”; ‘‘sophisticated manufactured goods” includes only “machinery and transport equipment”. d These three items will be classified into primary goods when calculating the share.
24
Table 4 Product matches and coverage in a comparison of manufacturing sectors in China and the UK, ca. 1910
Number of matched
products Coverage ratios (%)
In gross output value In employment
China, 1912 UK, 1907 China, 1912 UK, 1907
Total manufacturing 30 0.80 0.20 0.59 0.15
1 Iron, steel, engineering, and
shipbuilding 0
2 Metal industries 0
3 Textile industries 7 0.63 0.44 0.79 0.42
4 Clothing industries 4 0.55 0.22 0.60 0.18
5 Food, drink and tobacco 7 0.88 0.35 0.66 0.27
6 Chemicals 8 0.39 0.15 0.28 0.11
7 Paper and printing 2 0.06 0.15 0.06 0.08
8 Leather and leather products 1 0.92 0.45 0.89 0.28
9 Lumber and wood products 0
1
0 Stone, clay, and glass products 1 0.85 0.55 0.84 0.23
1
1 Miscellaneous 0
Sources: Constructed by the authors. See Section 4.2 for more information. For the matched products, see Appendix A for more
information.

25
Table 5 PPPs in manufacturing, China/UK ca. 1910
Gross output PPP (Yuan/Pounds)
Relative to exchange
ratesb
Paasche Laspeyres Fishera
Total manufacturing 6.67 6.55 6.61 0.66
1 Food, drink, and
tobacco 4.64 14.81 8.29 0.83
2 Textiles 6.27 6.68 6.47 0.65
3 Leather 11.98 11.98 11.98 1.20
4 Clothing 5.09 4.91 5.00 0.50
5 Chemicals 20.79 12.49 16.11 1.61
6 Clay 7.75 7.75 7.75 0.78
6 Paper and printing 9.91 8.87 9.38 0.94
Sources: Estimated by the authors. See Appendix A for more information. a Fisher PPP is a geometric mean of Laspeyres and Paasche PPPs for manufacturing PPPs and for
branch PPPs. b Relative to exchange rates: Fisher gross output PPP/ the exchange rate in 1912.
In 1912, 1 pound =9.99 Chinese Yuan (Hsiao 1974, p. 187).

26
Table 6 Comparative labor productivity levels in manufacturing, China/UK ca. 1910a
Comp. LP
1912/1907b
Comp. LP
ca. 1935c
Sample d 1 2
UK, 1907
=1
UK, 1907
=1 UK, 1935 =1
Total
manufacturing 0.0820 0.0905 0.1568
1 Food, drink, and
tobacco 0.0612 0.0533 0.1520
2 Textiles 0.0267 0.0283 0.1152
3 Leather 0.0300 0.0487 0.1256
4 Clothing 0.1225 0.1531 0.1896
5 Chemicals 0.0236 0.0240 0.2630
6 Clay, stone, glass 0.1010 0.0734 0.3819
7 Paper 0.0343 0.0606 0.2780
Sources: Estimated by the authors. a Employment is defined as numbers employed rather than hours worked. b Fisher PPP in Table 5 is used here. c For the comparative China/UK labor productivities in 1935, we combine two estimates, the comp. LP US/UK ca. 1935 calculated by de Jong and Woltjer
(2011) and the comp. LP China/Us ca. 1935 calculated by Yuan, Fukao, and Wu (2010). d Sample 1 only includes the 27 matched products. Sample 2 includes all the products in the 6 matched industrial branches, including both matched and
non-matched products.

27
Table 7 Comparative labor productivity in manufacturing, regions of China /UK ca. 1910 (UK, 1907=1)
Sources: Estimated by the authors. See Section 5.2. a Only matched products are included. We directly apply the national Fisher PPP to regions of China. “Capital region” covers the capital city, Zhili, Fengtian,
Jilin, and Heilongjiang; “Yangzi region” covers two provinces: Jiangsu and Zhejiang; “Guangdong region” covers three south coastal provinces: Fujian,
Guangdong, and Guangxi; “Sichuan region” covers Sichuan and Yunnan; “Xinjiang region” covers Xinjiang and Gansu; “Middle region” covers the rest seven
provinces, mainly in the middle of China. b Comparative labor productivities for China as a whole is directly from Table 6.
China b
Manchuri
a
Northern
China
Northwestern
China
Lower
Yangzi
Middle
Yangzi
Upper
Yangzi
Southwestern
China
South
China
Southeastern
China
Manufacturin
g 0.0905 0.2259 0.0409 0.0318 0.0433 0.1250 0.0086 0.0489 0.0484 0.0130
Food 0.0533 0.0567 0.1482 0.0134 0.0246 0.1074 0.0049 0.0166 0.0216 0.0030
Textiles 0.0283 0.3768 0.0076 0.0162 0.0441 0.0502 0.0074 0.0353 0.0550 0.0566
Leather 0.0154 0.0625 0.0137 0.0102 0.0040 0.0183 0.0183 0.0055 0.0521 0.0282
Clothing 0.1531 0.3884 0.3046 0.0195 0.1438 0.2542 0.1562 0.3150 0.2396 0.4695
Chemicals 0.0089 0.0874 0.0074 0.0147 0.0070 0.0092 0.0057 0.0208 0.0200 0.0169
Clay products 0.0734 0.2113 0.0734 0.0581 0.1992 0.0771 0.1068 0.0503 0.0365 0.1014
Paper 0.0606 0.2705 0.1772 0.2080 0.0415 0.0804 0.0386 0.0215 0.1500 0.0832

28
Figure 1 Economic structure from the national accounts, China (1912, 1935) and the UK (1911)
Sources: Constructed by the authors, based on Table 1.
Figure 2 Manufacturing structures for China (1912, 1935) and the UK (1907)
Figure 2.1 Shares in the gross output value of manufacturing Figure 2.2 Shares in total manufacturing employment
Sources: Constructed by the authors, based on Table 2.
0%
20%
40%
60%
80%
100%
China, 1912 China, 1935 UK, 1911
Services
Industry
Agriculture
0%
10%
20%
30%
40%
50%
60%
70%
80%
90%
100%
China, 1912 China, 1935 UK, 1907
miscellaneous
lumber and wood products
paper and printing
metal industries
stone, clay, and glassproductiron, steel, engineering,and shipbuildingchemicals
textile, clothing, leatherproductfood, drink and tobacco
0%
10%
20%
30%
40%
50%
60%
70%
80%
90%
100%
China, 1912 China, 1935 UK, 1907
miscellaneous
lumber and woodproductspaper and printing
metal industries
stone, clay, and glassproductiron, steel, engineering,and shipbuildingchemicals
textile, clothing, leatherproductfood, drink and tobacco
29
Figure 3 Export and import shares, China/UK various years
Figure 3.1 Shares of three major product classifications Figure 3.2 Shares of major industrial branches
Sources: Constructed by the authors, based on Table 3.
Figure 4 Export and import shares for textile products in China in 1912
Sources: Constructed by the authors, based on Table 3.
0%
10%
20%
30%
40%
50%
60%
70%
80%
90%
100%
CN, 1912,ex
CN, 1912,im
CN, 1935,ex
CN, 1935,im
UK,1907,ex
UK,1907,im
Sophisticatedmanufacturedgoods
Simplemanaufacturedgoods
Primary goods
0%
10%
20%
30%
40%
50%
60%
70%
80%
90%
100%
CN,1912,
ex
CN,1912,
im
CN,1935,
ex
CN,1935,
im
UK,1907,
ex
UK,1907,
im
Miscellaneous
Machinery andtransportation
other Manufacturingproductes
Textiles manufactured
Chemicals
Crude materails, minerals,fuels
Food and animals
0%
20%
40%
60%
80%
100%
export import
others
silk goods
raw silk
silk coccons
cotton yarn
cotton goods
cotton material
30
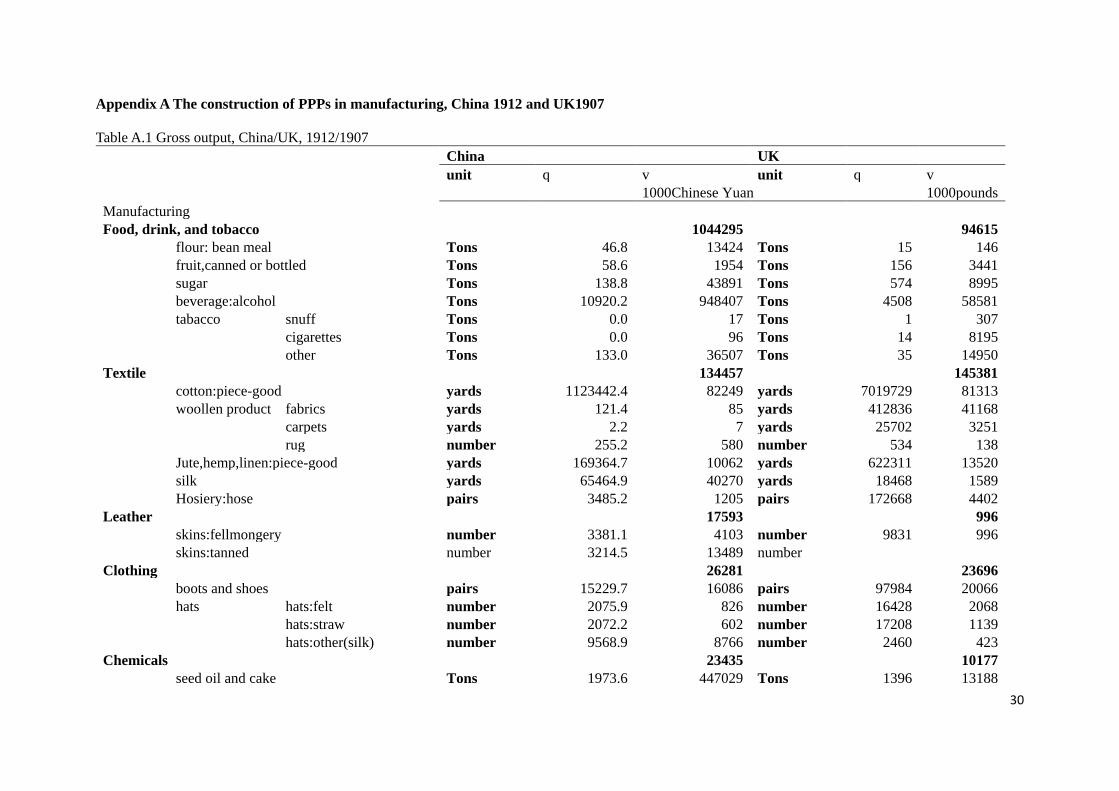
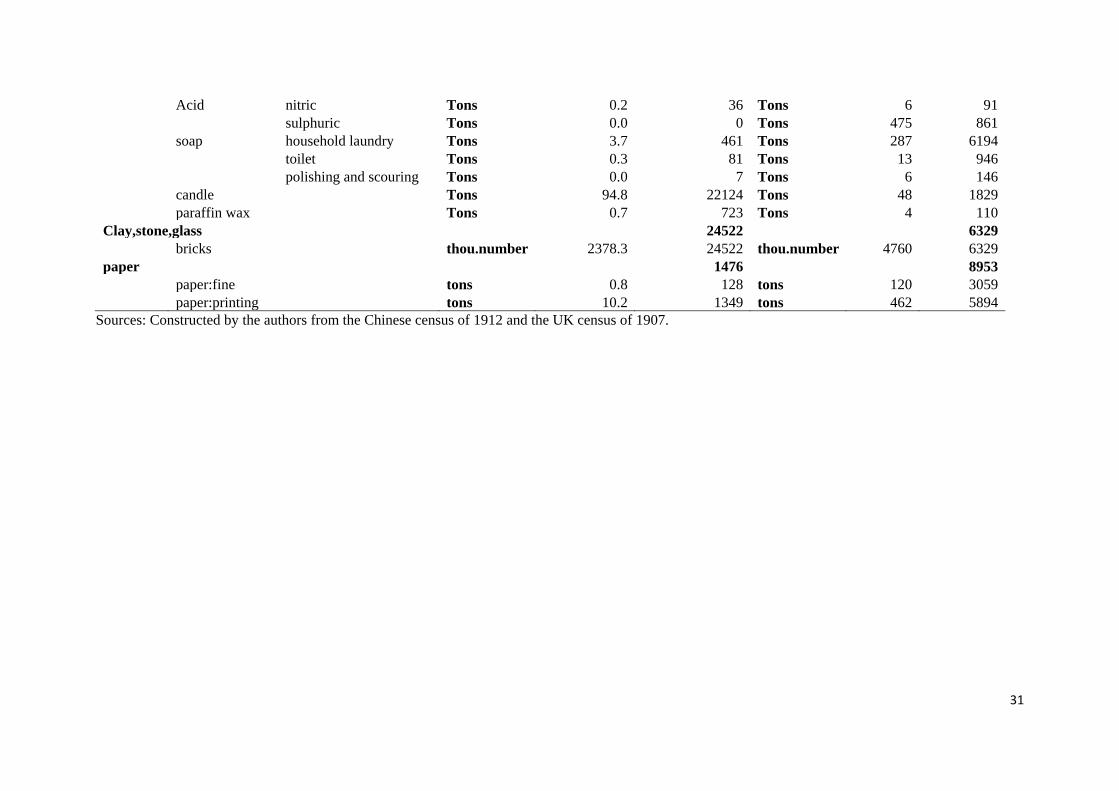
Appendix A The construction of PPPs in manufacturing, China 1912 and UK1907
Table A.1 Gross output, China/UK, 1912/1907
China
UK
unit q v unit q v
1000Chinese Yuan
1000pounds
Manufacturing
Food, drink, and tobacco
1044295
94615
flour: bean meal Tons 46.8 13424 Tons 15 146
fruit,canned or bottled Tons 58.6 1954 Tons 156 3441
sugar
Tons 138.8 43891 Tons 574 8995
beverage:alcohol Tons 10920.2 948407 Tons 4508 58581
tabacco snuff Tons 0.0 17 Tons 1 307
cigarettes Tons 0.0 96 Tons 14 8195
other Tons 133.0 36507 Tons 35 14950
Textile
134457
145381
cotton:piece-good yards 1123442.4 82249 yards 7019729 81313
woollen product fabrics yards 121.4 85 yards 412836 41168
carpets yards 2.2 7 yards 25702 3251
rug number 255.2 580 number 534 138
Jute,hemp,linen:piece-good yards 169364.7 10062 yards 622311 13520
silk
yards 65464.9 40270 yards 18468 1589
Hosiery:hose pairs 3485.2 1205 pairs 172668 4402
Leather
17593
996
skins:fellmongery number 3381.1 4103 number 9831 996
skins:tanned number 3214.5 13489 number
Clothing
26281
23696
boots and shoes pairs 15229.7 16086 pairs 97984 20066
hats hats:felt number 2075.9 826 number 16428 2068
hats:straw number 2072.2 602 number 17208 1139
hats:other(silk) number 9568.9 8766 number 2460 423
Chemicals
23435
10177
seed oil and cake Tons 1973.6 447029 Tons 1396 13188
31
Acid nitric Tons 0.2 36 Tons 6 91
sulphuric Tons 0.0 0 Tons 475 861
soap household laundry Tons 3.7 461 Tons 287 6194
toilet Tons 0.3 81 Tons 13 946
polishing and scouring Tons 0.0 7 Tons 6 146
candle
Tons 94.8 22124 Tons 48 1829
paraffin wax Tons 0.7 723 Tons 4 110
Clay,stone,glass
24522
6329
bricks
thou.number 2378.3 24522 thou.number 4760 6329
paper
1476
8953
paper:fine tons 0.8 128 tons 120 3059
paper:printing tons 10.2 1349 tons 462 5894
Sources: Constructed by the authors from the Chinese census of 1912 and the UK census of 1907.

32
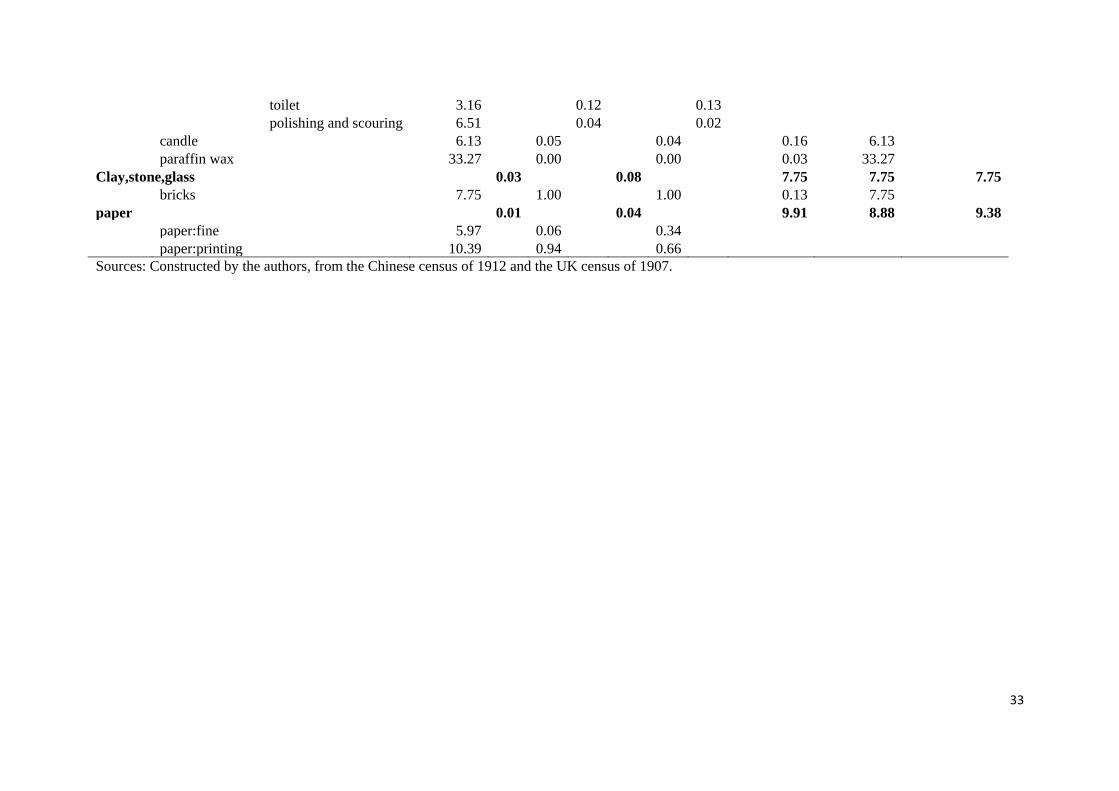
Table A.2 Gross output PPPs in manufacturing, China/UK, 1912/1907
China/UK China weights UK weights Paasche Laspeyres Fisher average
UVR I II III I II III CN weights UK weights
Manufacturing
6.67 6.56 6.61
Food, drink, and tobacco 0.52
0.19
4.64 14.81 8.29
flour
30.12
0.02
0.35
0.03 30.12
fruit,canned or bottled 1.51
0.05
0.09
0.66 1.51
sugar
20.19
0.04
0.07
0.05 20.19
beverage:alcohol 6.68
0.85
0.36
0.15 6.68
tabacco snuff 2.70
0.04 0.00
0.13 0.01 1.49 2.14
cigarettes 4.84
0.05
0.35
other 0.64
0.95
0.64
Textiles
0.10
0.22
6.27 6.68 6.47
cotton:piece-good 6.32
0.45
0.59
0.16 6.32
woollen product fabrics 6.98
0.01 0.12
0.26 0.92 0.09 8.31
carpets 25.09
0.34
0.07
rug 8.79
0.54
0.00
Jute,hemp,linen:piece-good 2.73
0.07
0.11
0.37 2.73
silk
7.15
0.40
0.02
0.14 7.15
Hosiery:hose 13.56
0.06
0.03
0.07 13.56
Leather
0.01
0.02
11.98 11.98 11.98
skins:fellmongery 11.98
1.00
1.00
0.08 11.98
skins:tanned
0.00
0.00
0.00 0.00
Clothing
0.03
0.07
5.09 4.91 5.00
boots and shoes 5.16
0.62
0.82
0.19 5.16
hats hats:felt 3.16
0.38 0.08
0.18 0.57 0.20 3.80
hats:straw 4.39
0.06
0.31
hats:other(silk) 5.33
0.86
0.12
Chemicals
0.23
0.05
20.79 12.49 16.12
seed oil and cake 23.98
0.94
0.27
0.04 23.98
Acid nitric 11.42
0.01 1.00
0.50 0.10 0.09 9.34
sulphuric 9.12
0.00
0.90
soap household laundry 5.74
0.00 0.84
0.18 0.85 0.19 5.42
33
toilet 3.16
0.12
0.13
polishing and scouring 6.51
0.04
0.02
candle
6.13
0.05
0.04
0.16 6.13
paraffin wax 33.27
0.00
0.00
0.03 33.27
Clay,stone,glass
0.03
0.08
7.75 7.75 7.75
bricks
7.75
1.00
1.00
0.13 7.75
paper
0.01
0.04
9.91 8.88 9.38
paper:fine 5.97
0.06
0.34
paper:printing 10.39
0.94
0.66
Sources: Constructed by the authors, from the Chinese census of 1912 and the UK census of 1907.

34
Appendix B An new estimation of per capita GDP for China in 1912
Table B.1 A China/UK PPP for 1912 (Chinese Yuan/ $)
Chinese Yuan
Prices/Ton a
UK £
Prices/Ton b
PPP
Yuan per £
Chinese
weights c
British
weights d
Agriculture 9.10e
Rice 101.85 10.10 10.08 0.89 0
Wheat 71.40 8.14 8.77 0.10 0.80
Maize 46.49 6.88 6.76 0.01 0.20
Agriculture 9.10 0.78 0.118
Industry 6.61 f 0.08 0.441
Service 7.85 g 0.14 0.441
The economy as a whole
China/UK PPP 8.09
China/US PPP 1.33h
Sources: Constructed by the authors. a The Chinese prices for wheat and maize are the wholesale prices in Tianjing in 1913, from the statistical material recollected by Kong and Pend (1988). The
Chinese price for rice is the market price in Yangzi Delta in 1912, from Wang (1992), Table 1.1. b The UK prices are from Jacks, O’Rourke, and Williamson (2011). c The Chinese weights within the agricultural sector are calculated by a combination of market prices in 1912-1913 and output quantities in 1915. The output
data is from the Chinese census of 1915. The Chinese weights of the whole economy are from the estimation of Ma and De Jong (2016). d The UK weights within the agricultural sector are assumed to an opposite of the Chinese weights in general. We also assume that in 1912 the UK output of rice
was negligible. The UK weights of the whole economy are from Feinstein (1976), which are actually employment shares of the three sectors. e Fisher PPP is calculated here. f The industry PPP for 1912 is assumed to equal the manufacturing PPP from Table 5. g The service PPP for 1912 is assumed to be the average of the agriculture and manufacturing PPP. h Using US/UK PPP ($/£), 6.1, from Woltjer (2013), we calculate China/US PPP from China/UK PPP. 8.09/6.1=1.33.

35
Table B.2 A benchmark estimate of GDP per capita in 1912 in 1990 international dollars
China
GDP per capita (Yuan) a 51.75
US
GDP per capita ($) 359.6
Exchange rates in 1912
exchange rate (Yuan per $) 2.06
PPP (Yuan per $) b 1.33
Comparative China/UKGDP per capita (%)
At the exchange rate 0.068
At PPP 0.109
GDP in 1990 international dollars
US c 5017
China 545
Maddison’s estimation for 1913 c 552
Sources: Constructed by the authors. a The per capita GDP in Chinese Yuan is calculated from the level in taels.
In 1912, officially 1 tael=1.5 Chinese Yuan. 34.5 taels×1.5 Chinese Yuan/tael=51.75 Chinese Yuan. b PPP is from Table B.1 in this Appendix. c The estimate of per capita GDP for 1909 US is from Maddison data 2014 version from Bolt and van Zanden (2014).