Embed Size (px)
Citation preview
Carter’s, Inc. 2005 Annual Report
giant steps
we love children We celebrate and support families, and we never
forget that parents need to feel cared for too.
Carter’s, Inc. 1170 Peachtree Street NE, Suite 900, Atlanta, Georgia 30309 404.745.2700 www.carters.com
Carter’s,Inc.2
00
5A
nnual Report

carter’s principles
tell it like it is
Make all communications direct,clear, and honest. Speak the truth and welcome debate.Share information. Collaborate.
trust the power of fewer things
Believe in the growth of our core business and core customers. Giveequal weight to both “do” and “don’t.”Grow by focusing in, not branching out.
keep every promise
Let superb execution reflect a com-petitive spirit. Meet deadlines. Meetor exceed commitments. Exceedexpectations. Count on each other.
live by higher standards
Be honest, modest, responsible, and beyond reproach. Operate withintegrity. Trust each other.
think horizontally
Emphasize cause and effect across functions. Depend on front-end strategies for back-end results.Enhance core competencies with powerful repeating processes.
rely on the best talent
Start with great principles and greatpeople with disciplined egos. Look for character, passion, a will to win,and a strong personal code. Work with coachable individuals who solve problems, teach, and inspire.
tell it like it is
trust the power of fewer things
keep every promise
live by higher standards
think horizontally
rely on the best talent
carter’s principles
1
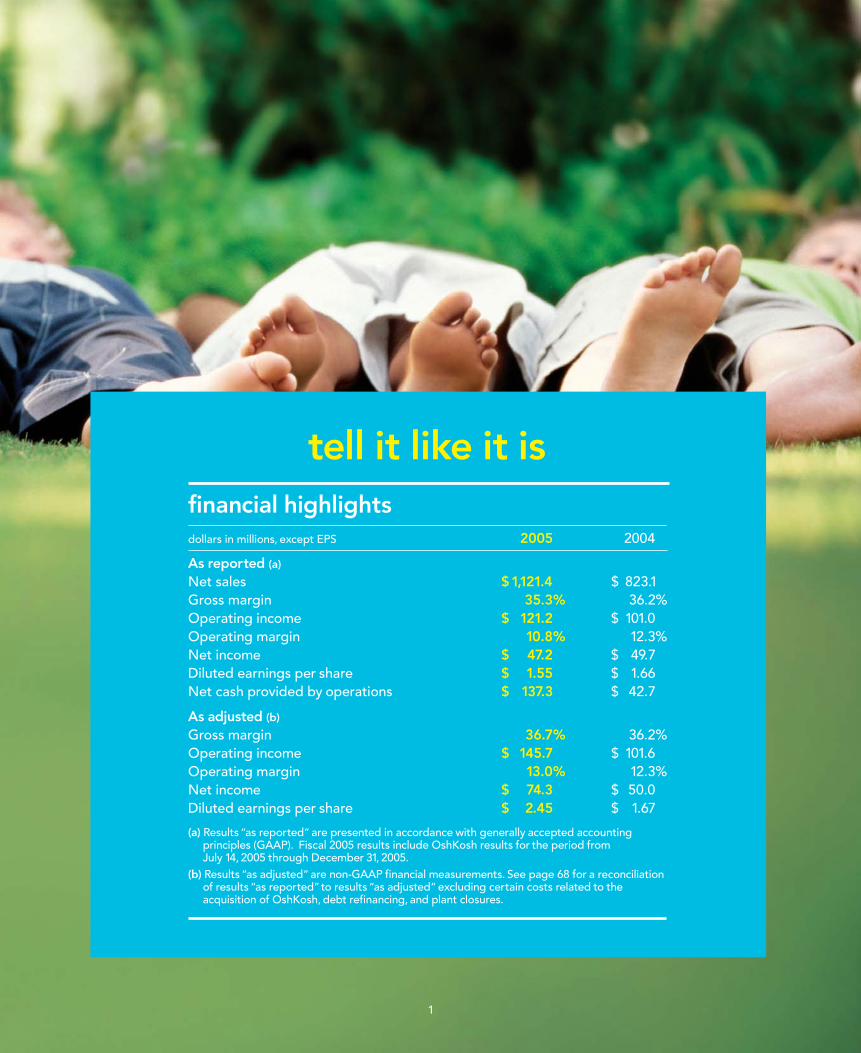
As reported (a)
Net sales $1,121.4 $ 823.1Gross margin 35.3% 36.2%Operating income $ 121.2 $ 101.0Operating margin 10.8% 12.3%Net income $ 47.2 $ 49.7Diluted earnings per share $ 1.55 $ 1.66 Net cash provided by operations $ 137.3 $ 42.7
As adjusted (b)
Gross margin 36.7% 36.2%Operating income $ 145.7 $ 101.6Operating margin 13.0% 12.3%Net income $ 74.3 $ 50.0Diluted earnings per share $ 2.45 $ 1.67
(a) Results “as reported” are presented in accordance with generally accepted accounting principles (GAAP). Fiscal 2005 results include OshKosh results for the period from July 14, 2005 through December 31, 2005.
(b) Results “as adjusted” are non-GAAP financial measurements. See page 68 for a reconciliation of results “as reported”to results “as adjusted” excluding certain costs related to the acquisition of OshKosh, debt refinancing, and plant closures.
dollars in millions, except EPS 2005 2004
financial highlights
tell it like it is
2
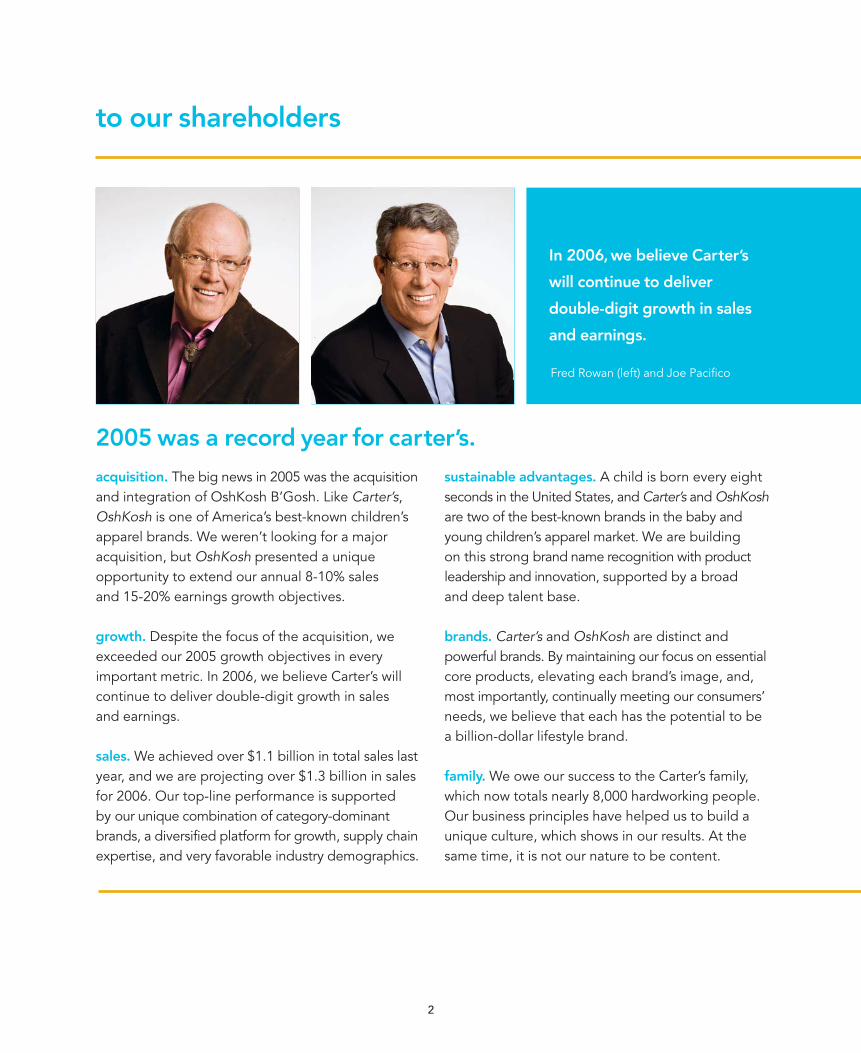
to our shareholders
acquisition. The big news in 2005 was the acquisitionand integration of OshKosh B’Gosh. Like Carter’s,OshKosh is one of America’s best-known children’sapparel brands. We weren’t looking for a majoracquisition, but OshKosh presented a uniqueopportunity to extend our annual 8-10% sales and 15-20% earnings growth objectives.
growth. Despite the focus of the acquisition, weexceeded our 2005 growth objectives in everyimportant metric. In 2006, we believe Carter’s willcontinue to deliver double-digit growth in sales and earnings.
sales. We achieved over $1.1 billion in total sales lastyear, and we are projecting over $1.3 billion in salesfor 2006. Our top-line performance is supported by our unique combination of category-dominant brands, a diversified platform for growth, supply chainexpertise, and very favorable industry demographics.
sustainable advantages. A child is born every eightseconds in the United States, and Carter’s and OshKoshare two of the best-known brands in the baby andyoung children’s apparel market. We are building on this strong brand name recognition with product leadership and innovation, supported by a broad and deep talent base.
brands. Carter’s and OshKosh are distinct and powerful brands. By maintaining our focus on essentialcore products, elevating each brand’s image, and,most importantly, continually meeting our consumers’needs, we believe that each has the potential to bea billion-dollar lifestyle brand.
family. We owe our success to the Carter’s family,which now totals nearly 8,000 hardworking people.Our business principles have helped us to build aunique culture, which shows in our results. At thesame time, it is not our nature to be content.
In 2006, we believe Carter’s
will continue to deliver
double-digit growth in sales
and earnings.
2005 was a record year for carter’s.
Fred Rowan (left) and Joe Pacifico
3
future. In 2006, we plan to make significant investments in key areas, strengthen our product offering, and freshen ourbrands to ensure that we have the resources to sustain ourgrowth objectives for years to come. We are confident in our ability to deliver superior results for our customers, our consumers, and you, our shareholders.
Fred Rowan Chairman and CEO
Joe PacificoPresident
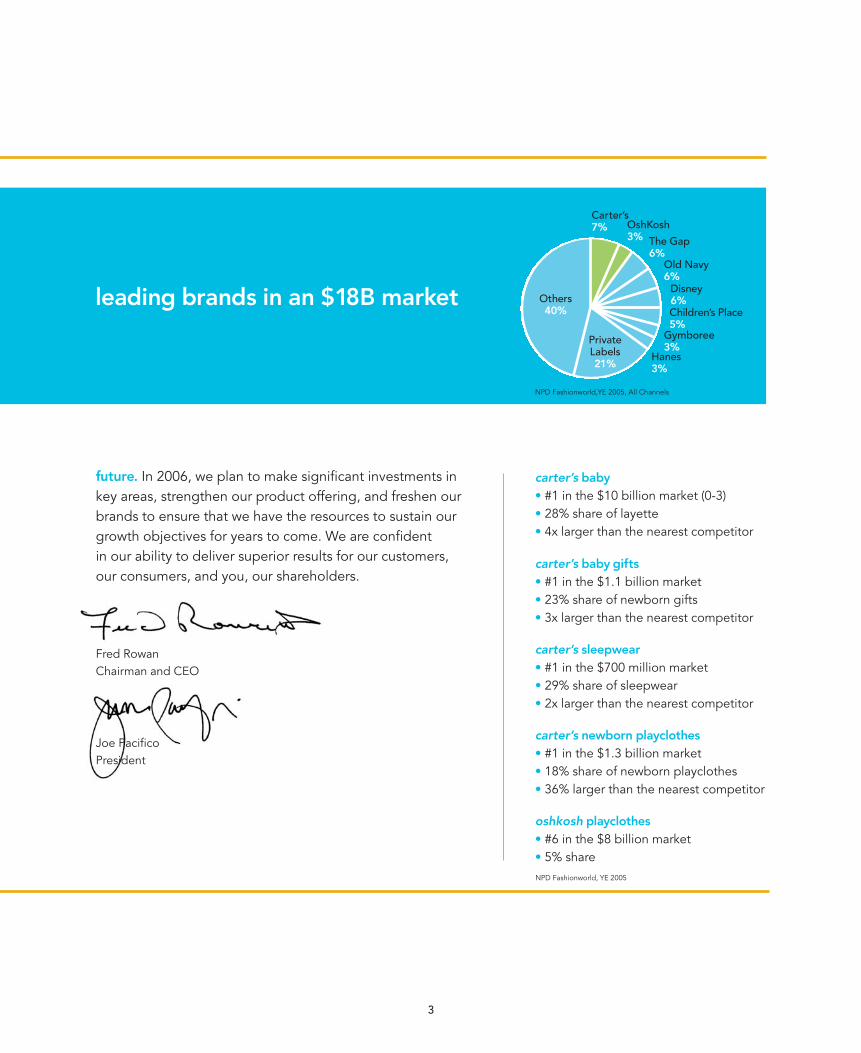
leading brands in an $18B market
Carter’s7% OshKosh
3% The Gap6%
Old Navy6%
Disney6%Children’s Place5%
Others40%
PrivateLabels21%
carter’s baby
• #1 in the $10 billion market (0-3)• 28% share of layette• 4x larger than the nearest competitor
carter’s baby gifts
• #1 in the $1.1 billion market • 23% share of newborn gifts• 3x larger than the nearest competitor
carter’s sleepwear
• #1 in the $700 million market • 29% share of sleepwear• 2x larger than the nearest competitor
carter’s newborn playclothes
• #1 in the $1.3 billion market • 18% share of newborn playclothes• 36% larger than the nearest competitor
oshkosh playclothes
• #6 in the $8 billion market • 5% share
Gymboree3%
Hanes3%
NPD Fashionworld, YE 2005
NPD Fashionworld,YE 2005, All Channels

4
trust the powerof fewer thingsturning oshkosh around
the brand: focused, fresh and relevant. OshKoshin 2004 resembled Carter’s in 1992: a strong butunderperforming brand. While OshKosh wasextremely well-known, its sales were less than half the size of Carter’s. Given our successful track record and the power of OshKosh, we believe we can grow its share of the $18 billionbaby and young children’s market to be as large or even larger than Carter’s.
the business: streamlined. We made significantchanges to OshKosh by closing unprofitable stores and exiting the unsuccessful adult apparel
product line. In contrast to Carter’s, where 10 babyand sleepwear core products account for over 80%of those sales, OshKosh had a complex assortmentof products and brands. We eliminated two of thefour OshKosh brands and shifted fashion collectionsto a new focus on essential core products.
the outlook: growth. To turn OshKosh around, weare leveraging our management expertise and ourproven formula for core product marketing that hasproduced over a decade of double-digit top-lineand earnings growth for Carter’s.

5
is something we take seriously at Carter’s.
It’s how children learn, grow, wonder,
and dream. When you think about it, a
child’s work is play.
play
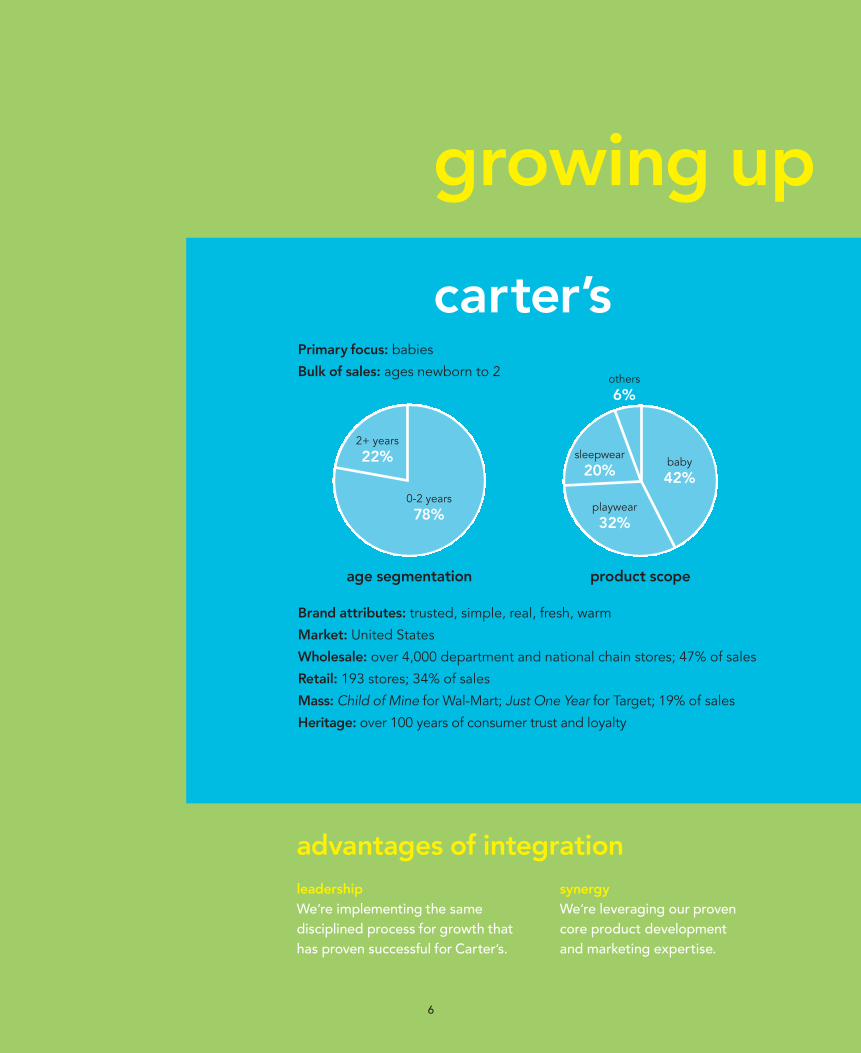
Primary focus: babies
Bulk of sales: ages newborn to 2
Brand attributes: trusted, simple, real, fresh, warm
Market: United States
Wholesale: over 4,000 department and national chain stores; 47% of sales
Retail: 193 stores; 34% of sales
Mass: Child of Mine for Wal-Mart; Just One Year for Target; 19% of sales
Heritage: over 100 years of consumer trust and loyalty
6
carter’s
advantages of integration
leadership
We’re implementing the same disciplined process for growth thathas proven successful for Carter’s.
synergy
We’re leveraging our proven core product development and marketing expertise.
0-2 years
78%
2+ years
22%
age segmentation product scope
growing up
baby
42%
playwear
32%
others
6%
sleepwear
20%
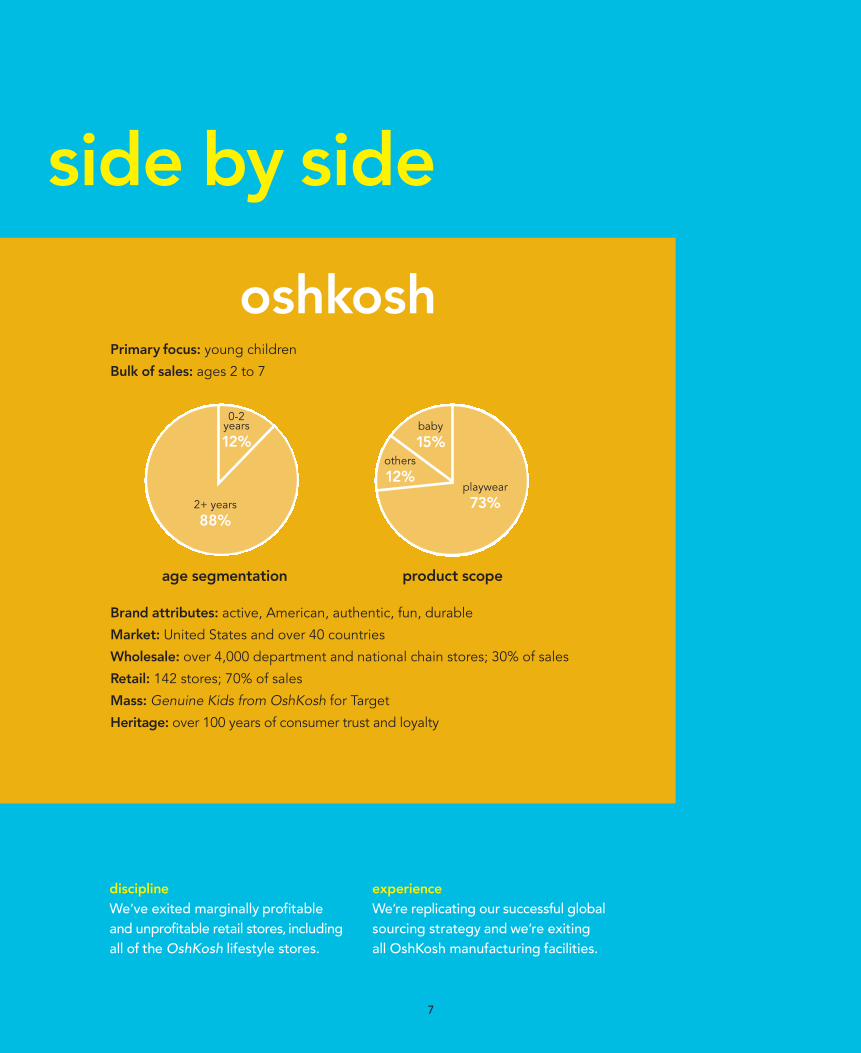
Primary focus: young children
Bulk of sales: ages 2 to 7
Brand attributes: active, American, authentic, fun, durable
Market: United States and over 40 countries
Wholesale: over 4,000 department and national chain stores; 30% of sales
Retail: 142 stores; 70% of sales
Mass: Genuine Kids from OshKosh for Target
Heritage: over 100 years of consumer trust and loyalty
oshkosh
7
baby
15%
discipline
We’ve exited marginally profitableand unprofitable retail stores, includingall of the OshKosh lifestyle stores.
experience
We’re replicating our successful global sourcing strategy and we’re exiting all OshKosh manufacturing facilities.
2+ years
88%
0-2 years
12%
playwear
73%
others
12%
age segmentation product scope
side by side

easyto see why it’s a great time to be Carter’s:
4 million children born annually
28 million children under age 7
78 million baby boomers becoming grandparents
$23 billion spent on grandchildren annually
8

9
keep everypromisefocusing on growth
growing organically. In 2005, we successfully upgraded our Carter’s Starters product line,which comprises 66% of our baby sales, and completed moving sleepwear production to full-package sourcing. Since launching playwear in 1999, Carter’s average annual sales growth hasbeen over 20%, and our 2005 share increased to 6% of the playwear market. Adding OshKoshto our brand portfolio gives us an additional growth driver in the $8 billion playwear market.
serving our wholesale customers. In the wholesale channel, we have resources that enable us to continually exceed customer expectations with innovative products, on-time deliveries,frequency of new offerings, quick replenishment, and marketing support.
expanding in the mass channel. Carter’s has successfully grown in the mass channel with itsJust One Year brand for Target and its Child of Mine brand for Wal-Mart. In 2005, mass channelsales were $178 million, or 16% of consolidated sales. Genuine Kids from OshKosh, which islicensed to Target, contributes meaningfully to our royalty income.

10
live by higherstandardsputting our consumers first
relevant brands. We have made a significant invest-ment in our Carter’s brand, and have spent countlesshours interviewing,observing and listening to mothers,to ensure that we put their needs first.
available products. Our diverse platform for growthprovides our consumers with multiple locations tofind our products: our wholesale customers includingKohl’s, JCPenney, Federated, and Babies ‘R’ Us; ourmass channel customers,Wal-Mart and Target; andour retail stores.
direct connections. Every day, we get invaluablefeedback from consumers in over 190 Carter’s and140 OshKosh retail stores. In 2005, Carter’s storesgenerated a same store sales increase of 4.8%, and our new Carter’s brand stores, in high-traffic stripcenters, had a same store sales increase of 10.7%.We have 41 Carter’s brand stores, and we plan toexpand our brand store base with new locations for both Carter’s and OshKosh.

11
and shopping aren’t synonymous for most moms, so we’ve got kid-friendly stores
with specially trained staff, wider aisles for
strollers, and newpackaging that makes
sizes easier to see.
fun

and trusted brands are the result of years
of experience. Carter’s and OshKosh have met the needs of
generations of babies and young children.
authentic
12

13
the business of children’s apparel
collaborative management. Our success is driven by cross-functional management thatfocuses on developing essential core products.This in turn supports consistency in productperformance, an efficient and responsive supply chain, and reduced costs and complexitiesthroughout our business.
responsive sourcing. In 2005, we successfully completed the Carter’s transition to 100% full-package sourcing. We plan to transition OshKosh in the first half of 2006, which will allowus to leverage our global sourcing capabilities to improve product and lower cost.
scope and flexibility. Carter’s is the largest branded marketer in the United States focusedexclusively on apparel for babies and young children. As the retail industry consolidates andretailers rely on fewer and larger brands, we are well positioned for continued growth.
think horizontally

14
Chairman &
Chief Executive Officer
Fred RowanPresident
Joe PacificoExecutive Vice President &
Chief Operations Officer
Dave BrownSenior Vice President of
Strategic Business Development
Suzanne Calkins
rely on the best talent

15
strong teams, inside and outside
a culture of performance. We have focused on attracting top talent in every key area of our business,which has enabled us to achieve strong organic growth while integrating and turning OshKosh around. We are fortunate to have the deep bench strength, skills, and commitment to help us reach our next goal: $2 billion in annual sales.
Executive Vice President &
Chief Financial Officer
Mike CaseyPresident of Retail Stores
Patti DeRosaExecutive Vice President &
General Manager of OshKosh
Jim MartinExecutive Vice President &
Chief Sourcing Officer
Charlie Whetzel
16
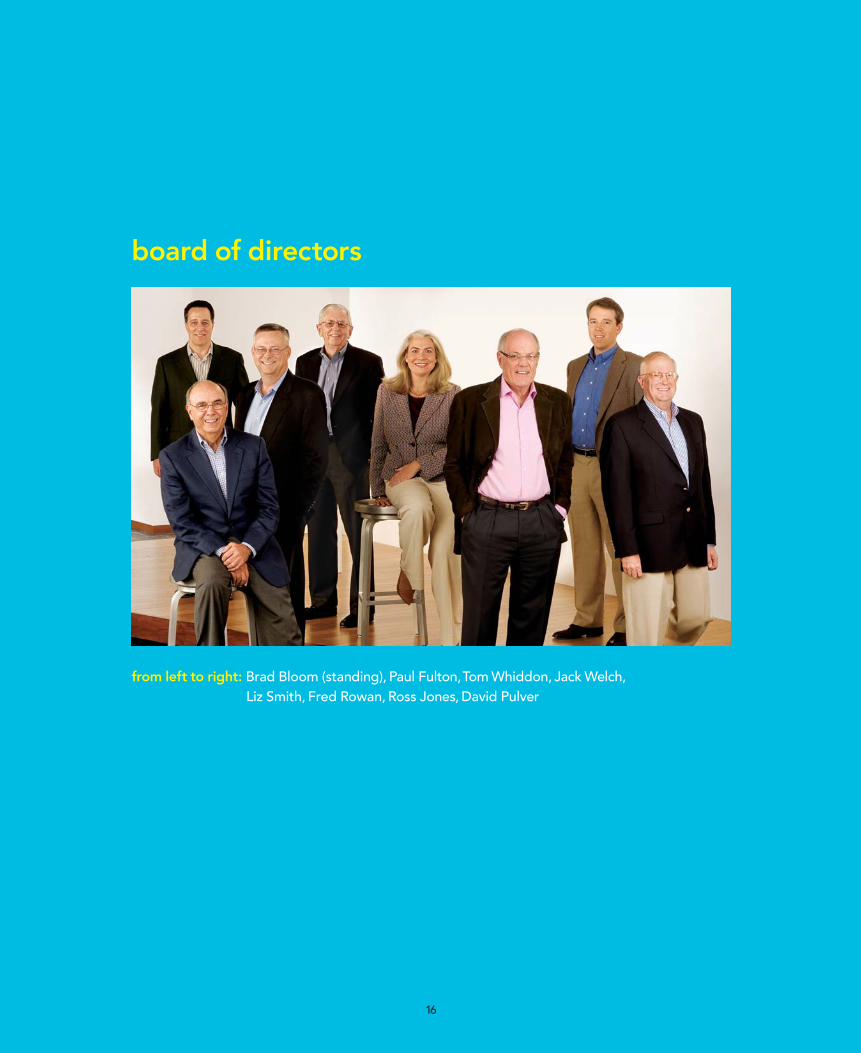
from left to right: Brad Bloom (standing), Paul Fulton,Tom Whiddon, Jack Welch,Liz Smith, Fred Rowan, Ross Jones, David Pulver
board of directors
18 Business and Financial Overview
22 Management’s Discussion and Analysis of Financial Condition and Results of Operations
36 Report of Independent Registered Public Accounting Firm
37 Management’s Report on Internal Control overFinancial Reporting
38 Consolidated Balance Sheets
39 Consolidated Statements of Operations
40 Consolidated Statements of Cash Flows
41 Consolidated Statements of Changes in Stockholders’ Equity
42 Notes to Consolidated Financial Statements
66 Stock Price, Dividend Information, and Related Stockholder Matters
67 Equity Compensation Plan Information
68 Reconciliation of the Company’s Use of Non-GAAP Financial Measures
69 Leadership Team
70 Corporate Information
financialreview
17

businessand
financialoverview
18 Carter’s, Inc.
The following table sets forth selected financial and other data as of and for the five fiscal years ended December 31,2005 (fiscal 2005). On August 15, 2001, investment funds affiliated with Berkshire Partners LLC purchased control of Carter’s, Inc. from Investcorp S.A. (the “2001 Acquisition”), which had been our controlling stockholder sinceacquiring us in 1996. Financing for the 2001 Acquisition and related transactions totaled $468.2 million and was provided by: the Company’s senior credit facility (“former senior credit facility”) including $24.0 million in revolving loan facility borrowings and $125.0 million in term loan borrowings; $173.7 million from the sale by The William Carter Company (“TWCC”) of 10.875% Senior Subordinated Notes; and $145.5 million of capitalinvested by investment funds affiliated with Berkshire Partners LLC and other investors, which included rolloverequity by our management of $18.3 million.
The proceeds from the 2001 Acquisition and refinancing were used to purchase our existing equity ($252.5 million),pay for selling stockholders’ transactions expenses ($19.1 million), pay for buyers’ transaction expenses ($4.0 million),pay debt issuance costs ($13.4 million), and to retire all outstanding balances on previously outstanding long-termdebt, including accrued interest thereon ($174.8 million). In addition, $4.4 million of proceeds were held as cash for temporary working capital purposes.
As a result of certain adjustments made in connection with the 2001 Acquisition, the results of operations for fiscal2005, 2004, 2003, and 2002 and the period from August 15, 2001 through December 29, 2001 (the “Successor”periods) are not comparable to prior periods (the “Predecessor” periods).
As a result of the 2001 Acquisition, our assets and liabilities were adjusted to their estimated fair values as ofAugust 15, 2001. The seven and one-half month period prior to the 2001 Acquisition includes certain acquisition-related charges, principally sellers’ expenses, such as management bonuses and professional fees, debtextinguishment charges for debt redemption premiums, and the write-off of deferred debt issuance costs on debt retired as a result of the 2001 Acquisition and refinancing. The Predecessor periods include amortizationexpense on our tradename and goodwill. The Successor periods reflect increased interest expense, the amortiza-tion of licensing agreements, and cessation of amortization on our tradename and goodwill due to the adoption of Statements of Financial Accounting Standards (“SFAS”) No. 141, “Business Combinations” (“SFAS 141”) andSFAS No. 142, “Goodwill and Other Intangible Assets” (“SFAS 142”). Accordingly, the results of operations for the Predecessor and Successor periods are not comparable.
On October 29, 2003, we completed an initial public offering of Carter’s, Inc. (the ”Company“) common stockincluding the sale of 5,390,625 shares by us and 1,796,875 shares by the selling stockholders, primarily BerkshirePartners LLC and its affiliates. Net proceeds to us from the offering totaled $93.9 million. On November 28, 2003,we used approximately $68.7 million of the proceeds to redeem approximately $61.3 million in outstanding10.875% Senior Subordinated Notes and pay a redemption premium of approximately $6.7 million and relatedaccrued interest charges of $0.7 million. We used approximately $2.6 million of the net proceeds to terminate theBerkshire Partners LLC management agreement and used approximately $11.3 million to prepay amountsoutstanding under the term loan as required by the senior credit facility. The remaining proceeds were used forworking capital and other general corporate purposes.
2005 Annual Report 19
businessand
financialoverview
continued
On July 14, 2005, Carter’s, Inc., through TWCC, acquired all of the outstanding common stock of OshKosh B‘Gosh,Inc. (”OshKosh“) for a purchase price of $312.1 million, which includes payment for vested stock options (the“Acquisition”). As part of financing the Acquisition, the Company refinanced its existing debt (the “Refinancing”),including its former senior credit facility and its $113.8 million 10.875% Senior Subordinated Notes due 2011(together with the Acquisition, the “Transaction”).
Financing for the Transaction was provided by a new $500 million Term Loan B and a $125 million revolving creditfacility (including a sub-limit for letters of credit of $80 million, the “Revolver”) entered into by TWCC with Bank ofAmerica, N.A., as administrative agent, Credit Suisse, and certain other financial institutions (the “Senior Credit Facility”).
The proceeds of the financing were used to purchase the outstanding common stock and vested stock options ofOshKosh ($312.1 million), pay transaction expenses ($6.2 million), refinance the Company’s former senior creditfacility ($36.2 million), repurchase the Company’s 10.875% Senior Subordinated Notes ($113.8 million), pay aredemption premium on the Company’s 10.875% Senior Subordinated Notes ($14.0 million), along with accruedand unpaid interest ($5.1 million), and pay debt issuance costs ($10.6 million). Other Transaction expenses paidprior and subsequent to the closing of the Transaction totaled $1.4 million, including $0.2 million in debt issuance costs.
As a result of the Refinancing, we wrote off $4.5 million in unamortized debt issuance costs related to the formersenior credit facility and 10.875% Senior Subordinated Notes and expensed $0.5 million related to the debtdiscount on the 10.875% Senior Subordinated Notes. Additionally, we expensed approximately $1.1 million ofdebt issuance costs associated with the Senior Credit Facility in accordance with Emerging Issues Task Force(“EITF”) No. 96-19, “Debtor’s Accounting for a Modification or Exchange of Debt Instruments.”
On March 1, 2006, we announced our intention to split the Company’s common stock on a two-for-one basisthrough a stock dividend entitling each stockholder of record to receive one additional share of common stock for every one share owned. To accomplish the stock split, the Board of Directors has recommended that theCompany’s stockholders approve an amendment to the Company’s certificate of incorporation increasing thenumber of authorized shares of the Company’s common stock from 40,000,000 to 150,000,000 at the Company’sMay 11, 2006 annual stockholders meeting. Following stockholder approval and subject to then-current marketconditions, the Company intends to announce the specific timing of the stock split and declare the stock dividend.The Board of Directors, however, may determine not to declare the stock dividend.
The selected financial data for the five fiscal years ended December 31, 2005 were derived from our AuditedConsolidated Financial Statements. Our fiscal year ends on the Saturday in December or January nearest to the lastday of December. Consistent with this policy, fiscal 2005 ended on December 31, 2005 and fiscal 2004 ended onJanuary 1, 2005. Fiscal 2005 and fiscal 2004 each contained 52 weeks of financial results.
businessand
financialoverview
continued
20 Carter’s, Inc.
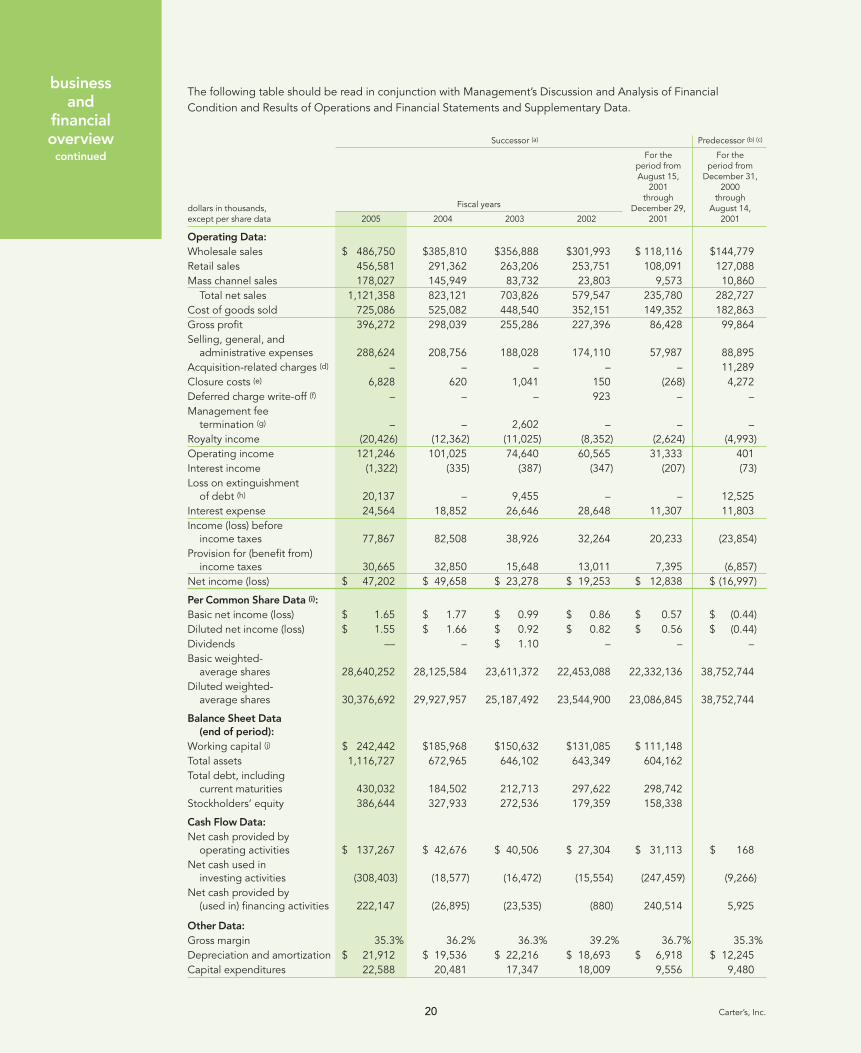
The following table should be read in conjunction with Management’s Discussion and Analysis of FinancialCondition and Results of Operations and Financial Statements and Supplementary Data.
Successor (a) Predecessor (b) (c)
For the For theperiod from period fromAugust 15, December 31,
2001 2000through through
dollars in thousands, Fiscal years December 29, August 14,except per share data 2005 2004 2003 2002 2001 2001
Operating Data:
Wholesale sales $ 486,750 $385,810 $356,888 $301,993 $ 118,116 $144,779Retail sales 456,581 291,362 263,206 253,751 108,091 127,088Mass channel sales 178,027 145,949 83,732 23,803 9,573 10,860
Total net sales 1,121,358 823,121 703,826 579,547 235,780 282,727Cost of goods sold 725,086 525,082 448,540 352,151 149,352 182,863Gross profit 396,272 298,039 255,286 227,396 86,428 99,864Selling, general, and
administrative expenses 288,624 208,756 188,028 174,110 57,987 88,895Acquisition-related charges (d) – – – – – 11,289Closure costs (e) 6,828 620 1,041 150 (268) 4,272Deferred charge write-off (f) – – – 923 – –Management fee
termination (g) – – 2,602 – – –Royalty income (20,426) (12,362) (11,025) (8,352) (2,624) (4,993)Operating income 121,246 101,025 74,640 60,565 31,333 401Interest income (1,322) (335) (387) (347) (207) (73)Loss on extinguishment
of debt (h) 20,137 – 9,455 – – 12,525Interest expense 24,564 18,852 26,646 28,648 11,307 11,803Income (loss) before
income taxes 77,867 82,508 38,926 32,264 20,233 (23,854)Provision for (benefit from)
income taxes 30,665 32,850 15,648 13,011 7,395 (6,857)Net income (loss) $ 47,202 $ 49,658 $ 23,278 $ 19,253 $ 12,838 $ (16,997)
Per Common Share Data (i):
Basic net income (loss) $ 1.65 $ 1.77 $ 0.99 $ 0.86 $ 0.57 $ (0.44)Diluted net income (loss) $ 1.55 $ 1.66 $ 0.92 $ 0.82 $ 0.56 $ (0.44)Dividends — – $ 1.10 – – –Basic weighted-
average shares 28,640,252 28,125,584 23,611,372 22,453,088 22,332,136 38,752,744Diluted weighted-
average shares 30,376,692 29,927,957 25,187,492 23,544,900 23,086,845 38,752,744
Balance Sheet Data (end of period):
Working capital (j) $ 242,442 $185,968 $150,632 $131,085 $ 111,148Total assets 1,116,727 672,965 646,102 643,349 604,162Total debt, including
current maturities 430,032 184,502 212,713 297,622 298,742Stockholders’ equity 386,644 327,933 272,536 179,359 158,338
Cash Flow Data:
Net cash provided by operating activities $ 137,267 $ 42,676 $ 40,506 $ 27,304 $ 31,113 $ 168
Net cash used in investing activities (308,403) (18,577) (16,472) (15,554) (247,459) (9,266)
Net cash provided by (used in) financing activities 222,147 (26,895) (23,535) (880) 240,514 5,925
Other Data:
Gross margin 35.3% 36.2% 36.3% 39.2% 36.7% 35.3%Depreciation and amortization $ 21,912 $ 19,536 $ 22,216 $ 18,693 $ 6,918 $ 12,245Capital expenditures 22,588 20,481 17,347 18,009 9,556 9,480
2005 Annual Report 21
notes to selected financial data(a) As a result of the 2001 Acquisition, we adjusted our assets and liabilities to their estimated fair values as of August 15, 2001. In addition,
we entered into new financing arrangements and changed our capital structure in connection with the 2001 Acquisition. At the time ofthe 2001 Acquisition, we adopted the provisions of SFAS 141 and SFAS 142, which affect the amortization of goodwill and other intangibles.Accordingly, the results as of the end of and for the Successor period from August 15, 2001 through December 29, 2001 and theSuccessor fiscal years 2002, 2003, 2004, and 2005 are not comparable to prior periods.
(b) On a pro forma basis, assuming SFAS 142 was in effect for all periods presented, pro forma loss before income taxes would have been $21.8 million for the Predecessor period from December 31, 2000 through August 14, 2001. Pro forma net loss would have been $15.5 million for the Predecessor period from December 31, 2000 through August 14, 2001.
(c) In the first quarter of fiscal 2003, we adopted the provisions of SFAS No. 145, “Rescission of FASB Statements No. 4, 44, and 64,Amendment of FASB Statement No. 13, and Technical Corrections” (“SFAS 145”). SFAS 145 rescinds Financial Accounting StandardsBoard (“FASB”) Statement No. 4, which required all gains and losses from extinguishment of debt to be aggregated and, if material,classified as an extraordinary item, net of the related income tax effect. As a result, the criteria in Accounting Principles Board Opinion 30will now be used to classify those gains and losses. Accordingly, charges related to the extinguishment of debt during the Predecessorperiod from December 31, 2000 through August 14, 2001, as more fully described in note (h) below, have been reclassified to conformto the provisions of SFAS 145.
(d) The Acquisition-related charges for the Predecessor period from December 31, 2000 through August 14, 2001 include $4.5 million inmanagement bonuses and $6.8 million in other seller expenses.
(e) The $4.3 million in closure costs for the Predecessor period from December 31, 2000 through August 14, 2001 relate to closure costsassociated with two domestic manufacturing facilities, including a $3.2 million write-down of long-lived assets. The $1.0 million in closurecosts for the Successor 2003 fiscal year relate to the closure of our two sewing facilities located in Costa Rica. The $0.6 million in closurecosts for fiscal 2004 relate to closure costs associated with the closure of our Costa Rica facilities and our distribution facility in Leola,Pennsylvania. The $6.8 million in closure costs for fiscal 2005 relate to the closure of our Mexico sewing facilities.
(f) The deferred charge write-off in the Successor fiscal year 2002 reflects the write-off of $0.9 million of previously deferred costs associated with the filing of a registration statement on Form S-1 in August 2002, to register an initial public offering of Carter’s, Inc.common stock.
(g) The $2.6 million reflects the payment to terminate the Berkshire Partners LLC management agreement upon completion of our initialpublic offering of Carter’s, Inc. common stock on October 29, 2003.
(h) Debt extinguishment charges for the Predecessor period December 31, 2000 through August 14, 2001 reflect the write-off of debtissuance costs of approximately $4.7 million and a debt redemption premium of approximately $7.8 million. Debt extinguishmentcharges for the Successor 2003 fiscal year reflect the write-off of $2.4 million of debt issuance costs resulting from the redemption of $61.3 million of our 10.875% Senior Subordinated Notes and the prepayment of $11.3 million in term loan indebtedness, a debtredemption premium of approximately $6.7 million, and a $0.4 million write-off of the related note discount. Debt extinguishmentcharges for the Successor 2005 fiscal year reflect the payment of a $14.0 million redemption premium on the 10.875% Senior Subordi-nated Notes, the write-off of $4.5 million in unamortized debt issuance costs related to the former senior credit facility and 10.875%Senior Subordinated Notes, and $0.5 million related to the debt discount on the 10.875% Senior Subordinated Notes. Additionally, weexpensed approximately $1.1 million of debt issuance costs associated with our new Senior Credit Facility in accordance with EmergingIssuance Task Force (“EITF”) No. 96-19, “Debtor’s Accounting for a Modification or Exchange of Debt Instruments.”
(i) As a result of the 2001 Acquisition, our capital structure and the number of outstanding shares were changed. Accordingly, earnings pershare in Predecessor periods are not comparable to earnings per share in Successor periods.
(j) Represents total current assets less total current liabilities.
businessand
financialoverview
continued
management’sdiscussion
and analysisof financialcondition
and resultsof operations
22 Carter’s, Inc.
The following is a discussion of our results of operations and current financial condition. You should read thisdiscussion in conjunction with our consolidated historical financial statements and notes included elsewhere in this annual report. Our discussion of our results of operations and financial condition includes various forward-looking statements about our markets, the demand for our products and services, and our future results. We basedthese statements on assumptions that we consider reasonable. Actual results may differ materially from those sug-gested by our forward-looking statements for various reasons including those discussed in the “Risk Factors” section.Those risk factors expressly qualify all subsequent oral and written forward-looking statements attributable to us or persons acting on our behalf. Except for any ongoing obligations to disclose material information as required by the federal securities laws, we do not have any intention or obligation to update forward-looking statementsafter we file this annual report.
overviewOver the past 141 years, Carter’s has become one of the most highly recognized and most trusted brand names in the children’s apparel industry. On July 14, 2005, we acquired OshKosh for a purchase price of $312.1 million,which included payment for vested stock options (the “Acquisition”). Established in 1895, our OshKosh brand isalso highly recognized and well known for its high-quality apparel for children sizes newborn to 16. The Acquisitionhas increased our market share in the wholesale and retail channels of distribution.
We sell our products under various Carter’s and OshKosh brands in the wholesale channel, which includes approxi-mately 330 department store, national chain, and specialty store accounts. Additionally, we currently operate 193Carter’s and 142 OshKosh brand retail stores located primarily in outlet and strip centers throughout the UnitedStates and sell our products in the mass channel under our Just One Year brand to approximately 1,400 Targetstores and under our Child of Mine brand to approximately 3,200 Wal-Mart stores nationwide. We also extend our brand reach by licensing our Carter’s, Child of Mine, Just One Year, and OshKosh B’Gosh and related brandnames through domestic licensing arrangements, including licensing of our Genuine Kids from OshKosh brand to Target stores nationwide. Our OshKosh B’Gosh brand name is also licensed through international licensingarrangements. During fiscal 2005, we earned approximately $20.4 million in licensing income, including $6.6 million from our OshKosh B’Gosh and Genuine Kids from OshKosh brands for the period from July 14, 2005 through December 31, 2005.
We are currently in the process of integrating the OshKosh business. Our plans are to integrate and grow ourOshKosh brand by implementing our core product development and marketing disciplines, leveraging Carter’srelationships with key wholesale accounts, closing unprofitable stores, leveraging Carter’s infrastructure and supplychain, and improving the productivity of our OshKosh brand retail stores.
We have reduced the number of OshKosh sub-brands and are in the process of simplifying the number of productofferings under our OshKosh brand. This should allow us to reduce product complexity, focus our efforts on essen-tial, core products, and streamline operations. Since the Acquisition, we have closed 15 unprofitable OshKoshlifestyle stores, 14 OshKosh brand retail stores, and plan to close an additional three OshKosh brand retail stores in fiscal 2006. We plan to implement various retail store productivity improvements that have been successful in our Carter’s brand retail stores. Such improvements include more impactful window displays and better productplacement and in-store marketing programs.
We are also leveraging our existing infrastructure and supply chain expertise to reduce costs. In December 2005,we closed the OshKosh Choloma, Honduras sewing facility and recently announced our plans to close the OshKoshUman, Mexico sewing facility during the first half of fiscal 2006. We intend to place such production primarily withour vendors in the Far East. We are also in the process of integrating retail store operations and various othersupport functions throughout the Company.
As part of financing the Acquisition, we refinanced our existing debt (the “Refinancing”), including our formersenior credit facility and our outstanding 10.875% Senior Subordinated Notes due 2011 (together with theAcquisition, the “Transaction”). In connection with the Refinancing, we paid a $14.0 million redemption premiumon the Company’s 10.875% Senior Subordinated Notes, we wrote off $4.5 million in unamortized debt issuancecosts related to the former senior credit facility and repayment of the 10.875% Senior Subordinated Notes, and
2005 Annual Report 23
management’sdiscussion
and analysisof financialcondition
and resultsof operations
continued
expensed $0.5 million related to the debt discount on the 10.875% Senior Subordinated Notes. Additionally, weexpensed approximately $1.1 million of debt issuance costs associated with our new Senior Credit Facility in accor-dance with Emerging Issues Task Force (“EITF”) No. 96-19, “Debtor’s Accounting for a Modification or Exchange ofDebt Instruments.”
As a result of the Transaction, we have had a significant increase in interest costs with average borrowings of$169.1 million at an effective interest rate of 9.9% for the period from January 2, 2005 through July 14, 2005 andaverage borrowings of $472.7 million at an effective interest rate of 5.9% subsequent to the Transaction. Additionally,we have acquired certain indefinite-lived intangible assets in connection with the Acquisition of OshKosh includ-ing licensing agreements and leasehold interests which will result in annual amortization expense of $4.7 million in fiscal 2006, $4.5 million in fiscal 2007, $4.1 million in fiscal 2008, $3.7 million in fiscal 2009, and $1.8 million infiscal 2010.
Effective January 1, 2006, we will adopt the provisions of SFAS No. 123 (revised 2004), “Share-Based Payment”(“SFAS 123R”), which is estimated to result in a reduction in fiscal 2006 net income of approximately $3.0 million,or approximately $0.10 per diluted share. The impact of adopting SFAS 123R is discussed further under “RecentAccounting Pronouncements.”
Our fiscal year ends on the Saturday, in December or January, nearest the last day of December. Consistent with this policy, fiscal 2005 ended on December 31, 2005 and as a result, contained 52 weeks of financial results.Fiscal 2004 ended on January 1, 2005 and also contained 52 weeks of financial results. Fiscal 2003 ended onJanuary 3, 2004 and contained 53 weeks of financial results.
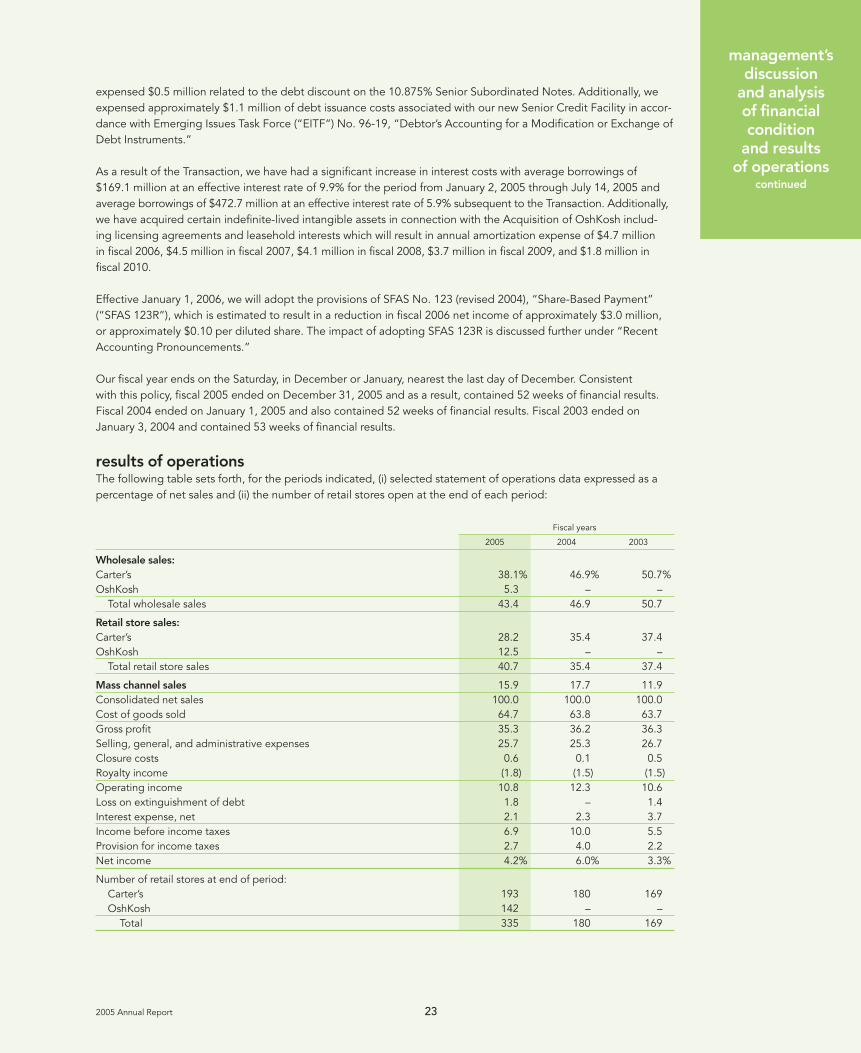
results of operationsThe following table sets forth, for the periods indicated, (i) selected statement of operations data expressed as apercentage of net sales and (ii) the number of retail stores open at the end of each period:
Fiscal years
2005 2004 2003
Wholesale sales:
Carter’s 38.1% 46.9% 50.7%OshKosh 5.3 – –
Total wholesale sales 43.4 46.9 50.7
Retail store sales:
Carter’s 28.2 35.4 37.4OshKosh 12.5 – –
Total retail store sales 40.7 35.4 37.4
Mass channel sales 15.9 17.7 11.9Consolidated net sales 100.0 100.0 100.0Cost of goods sold 64.7 63.8 63.7Gross profit 35.3 36.2 36.3Selling, general, and administrative expenses 25.7 25.3 26.7Closure costs 0.6 0.1 0.5Royalty income (1.8) (1.5) (1.5)Operating income 10.8 12.3 10.6Loss on extinguishment of debt 1.8 – 1.4Interest expense, net 2.1 2.3 3.7Income before income taxes 6.9 10.0 5.5Provision for income taxes 2.7 4.0 2.2Net income 4.2% 6.0% 3.3%
Number of retail stores at end of period:Carter’s 193 180 169OshKosh 142 – –
Total 335 180 169
management’sdiscussion
and analysisof financialcondition
and resultsof operations
continued
24 Carter’s, Inc.
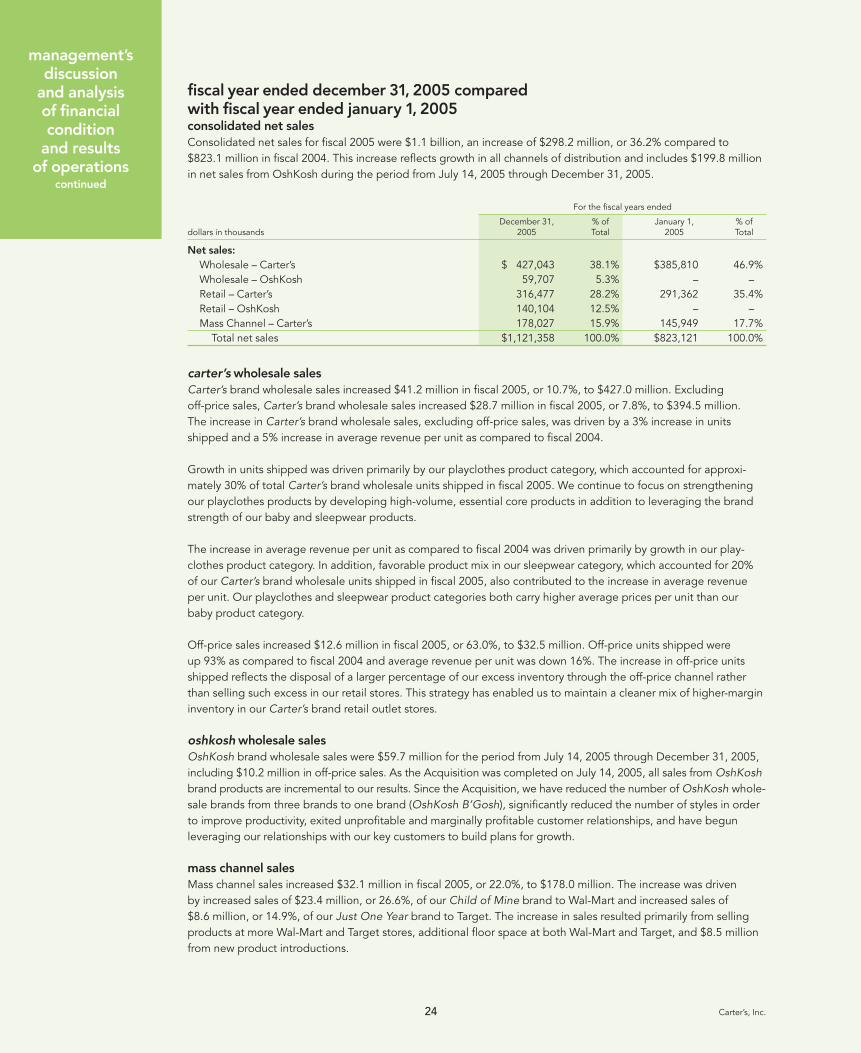
fiscal year ended december 31, 2005 compared with fiscal year ended january 1, 2005consolidated net sales
Consolidated net sales for fiscal 2005 were $1.1 billion, an increase of $298.2 million, or 36.2% compared to$823.1 million in fiscal 2004. This increase reflects growth in all channels of distribution and includes $199.8 millionin net sales from OshKosh during the period from July 14, 2005 through December 31, 2005.
For the fiscal years ended
December 31, % of January 1, % ofdollars in thousands 2005 Total 2005 Total
Net sales:
Wholesale – Carter’s $ 427,043 38.1% $385,810 46.9%Wholesale – OshKosh 59,707 5.3% – –Retail – Carter’s 316,477 28.2% 291,362 35.4%Retail – OshKosh 140,104 12.5% – –Mass Channel – Carter’s 178,027 15.9% 145,949 17.7%
Total net sales $1,121,358 100.0% $823,121 100.0%
carter’s wholesale sales
Carter’s brand wholesale sales increased $41.2 million in fiscal 2005, or 10.7%, to $427.0 million. Excluding off-price sales, Carter’s brand wholesale sales increased $28.7 million in fiscal 2005, or 7.8%, to $394.5 million. The increase in Carter’s brand wholesale sales, excluding off-price sales, was driven by a 3% increase in unitsshipped and a 5% increase in average revenue per unit as compared to fiscal 2004.
Growth in units shipped was driven primarily by our playclothes product category, which accounted for approxi-mately 30% of total Carter’s brand wholesale units shipped in fiscal 2005. We continue to focus on strengtheningour playclothes products by developing high-volume, essential core products in addition to leveraging the brandstrength of our baby and sleepwear products.
The increase in average revenue per unit as compared to fiscal 2004 was driven primarily by growth in our play- clothes product category. In addition, favorable product mix in our sleepwear category, which accounted for 20%of our Carter’s brand wholesale units shipped in fiscal 2005, also contributed to the increase in average revenueper unit. Our playclothes and sleepwear product categories both carry higher average prices per unit than ourbaby product category.
Off-price sales increased $12.6 million in fiscal 2005, or 63.0%, to $32.5 million. Off-price units shipped were up 93% as compared to fiscal 2004 and average revenue per unit was down 16%. The increase in off-price unitsshipped reflects the disposal of a larger percentage of our excess inventory through the off-price channel ratherthan selling such excess in our retail stores. This strategy has enabled us to maintain a cleaner mix of higher-margininventory in our Carter’s brand retail outlet stores.
oshkosh wholesale sales
OshKosh brand wholesale sales were $59.7 million for the period from July 14, 2005 through December 31, 2005,including $10.2 million in off-price sales. As the Acquisition was completed on July 14, 2005, all sales from OshKoshbrand products are incremental to our results. Since the Acquisition, we have reduced the number of OshKosh whole-sale brands from three brands to one brand (OshKosh B’Gosh), significantly reduced the number of styles in orderto improve productivity, exited unprofitable and marginally profitable customer relationships, and have begunleveraging our relationships with our key customers to build plans for growth.
mass channel sales
Mass channel sales increased $32.1 million in fiscal 2005, or 22.0%, to $178.0 million. The increase was driven by increased sales of $23.4 million, or 26.6%, of our Child of Mine brand to Wal-Mart and increased sales of $8.6 million, or 14.9%, of our Just One Year brand to Target. The increase in sales resulted primarily from sellingproducts at more Wal-Mart and Target stores, additional floor space at both Wal-Mart and Target, and $8.5 millionfrom new product introductions.
2005 Annual Report 25
carter’s brand retail stores
Carter’s brand retail store sales increased $25.1 million in fiscal 2005, or 8.6%, to $316.5 million. Such growth wasdriven by incremental sales of $12.2 million generated by new store openings and a comparable store sales increaseof $13.8 million, or 4.8%, based on 174 locations. This growth was partially offset by the impact of four store closuresof $0.9 million.
The Company’s comparable store sales calculations include sales for all stores that were open during the com-parable fiscal period, including remodeled stores and certain relocated stores. If a store relocates within the samecenter with no business interruption or material change in square footage, the sales for such store will continue tobe included in the comparable store calculation. If a store relocates to another center or there is a material changein square footage, such store is treated as a new store. Stores, which are closed, are included in the comparablestore sales calculation up to the date of closing.
The increase in comparable store sales was led by a comparable store sales increase of 10.7% in our “brand”stores. Our “brand” stores are generally located in high-traffic strip centers located in or near major cities. As ofDecember 31, 2005, we had 41 “brand” stores as compared to 27 stores as of January 1, 2005. Our “drive to”outlet stores, of which there were 71 as of December 31, 2005, had a comparable store sales increase of 2.8% and were impacted by rising fuel prices as these locations are generally located within 20 to 30 minutes outside of densely populated areas. Across the chain, comparable store sales have been driven by converting all stores toour new format beginning May of 2004, including moving baby products to the front of the store, more impactfulwindow displays, and more effective in-store merchandising and marketing. All stores were converted to the newstore format as of April 2005.
There were a total of 193 Carter’s brand retail stores as of December 31, 2005. During fiscal 2005, we opened 17 stores and closed 4 stores. We plan to open 31 and close 10 stores during fiscal 2006.
oshkosh brand retail stores
OshKosh brand retail stores contributed $140.1 million in net sales from the period from July 14, 2005 throughDecember 31, 2005. During the period from July 14, 2005 through December 31, 2005, we closed 29 OshKoshbrand retail stores, including 15 OshKosh brand lifestyle stores. Liabilities for these store closures have been pro-vided for in purchase accounting as described in Note 15 to the accompanying consolidated financial statements.
There were a total of 142 OshKosh brand retail stores as of December 31, 2005. We plan to open 14 and close 3OshKosh brand retail stores during fiscal 2006.
gross profit
Our gross profit increased $98.2 million, or 33.0%, to $396.3 million in fiscal 2005. Gross profit as a percentage ofnet sales was 35.3% in fiscal 2005 as compared to 36.2% in fiscal 2004.
The decrease in gross margin as a percentage of net sales reflects:
(i) an amortization charge of $13.9 million related to a fair value step-up of inventory acquired from OshKoshand sold during the period;
(ii) growth in our lower margin mass channel business;
(iii) the impact of lower margin OshKosh brand wholesale sales relative to Carter’s brand wholesale sales; and
(iv) $1.6 million of accelerated depreciation recorded in connection with our decision to close two sewing facilities in Mexico.
management’sdiscussion
and analysisof financialcondition
and resultsof operations
continued

management’sdiscussion
and analysisof financialcondition
and resultsof operations
continued
26 Carter’s, Inc.
Partially offsetting these decreases were:
(i) a reduction in product costs resulting from leveraging our full package sourcing network and completing thetransition of Carter’s brand products to full package sourcing;
(ii) significant growth in our higher margin retail business, resulting from the Acquisition of the OshKosh brandretail stores (consolidated retail sales increased from 35% of total sales to 41% of total sales); and
(iii) a decrease of $2.5 million in charges related to excess inventory.
The Company includes distribution costs in its selling, general, and administrative expenses. Accordingly, theCompany’s gross margin may not be comparable to other companies that include such distribution costs in theircost of goods sold.
selling, general, and administrative expenses
Selling, general, and administrative expenses in fiscal 2005 increased $79.9 million, or 38.3%, to $288.6 million. As a percentage of net sales, selling, general, and administrative expenses in fiscal 2005 increased to 25.7% ascompared to 25.3% in fiscal 2004.
The increase in selling, general, and administrative expenses as a percentage of net sales was led primarily by:
(i) the impact of a higher retail store cost structure at OshKosh as retail store selling, general, and adminis-trative expenses, which comprise approximately 39% of consolidated selling, general, and administrativeexpenses, grew from 23.6% of retail sales in fiscal 2004 to 24.8% of retail sales in fiscal 2005; and
(ii) amortization of OshKosh intangible assets including a charge of $2.2 million related to the OshKosh licensing agreements and leasehold interests capitalized in connection with the Acquisition.
Partially offsetting these increases were:
(i) a decline in distribution costs as a percentage of sales from 4.9% in fiscal 2004 to 4.2% in fiscal 2005, drivenprimarily by efficiencies gained with our distribution center in Stockbridge, Georgia;
(ii) effectively managing growth in spending to a rate lower than the growth in net sales, most notably in themass channel; and
(iii) cessation of amortization of our Carter’s licensing agreements, which were fully amortized on August 15,2004. Amortization expense in fiscal 2004 related to these agreements was approximately $3.1 million.
closure costs
In May 2005, we decided to exit two Carter’s brand sewing facilities in Mexico. We have developed alternativecapabilities to source comparable products in the Far East at lower costs. As a result of these closures, we haverecorded total costs of $8.4 million, including $4.6 million of severance charges, $1.3 million of lease terminationcosts, $1.6 million of accelerated depreciation (included in cost of goods sold), $0.1 million of asset impairmentcharges, and $0.8 million of other exit costs during fiscal 2005.
We anticipate additional charges to be incurred during the first half of fiscal 2006 to include severance charges andother exit costs of approximately $0.5 million.

2005 Annual Report 27
royalty income
Our royalty income increased $8.1 million, or 65.2%, to $20.4 million in fiscal 2005.
We license the use of our Carter’s, Carter’s Classics, Just One Year, and Child of Mine names. Royalty income fromthese brands was approximately $13.8 million in fiscal 2005, an increase of 11.8% or $1.5 million as compared tofiscal 2004. This increase was driven primarily by increased sales of our Carter’s and Just One Year brand licensees.
As a result of the Acquisition, as discussed in Note 1 to the accompanying consolidated financial statements, welicense the use of our OshKosh B’Gosh, OshKosh Est. 1895, and Genuine Kids from OshKosh brand names.Royalty income from these brands was approximately $6.6 million for the period from July 14, 2005 throughDecember 31, 2005, including $2.6 million in international royalty income.
operating income
Operating income increased $20.2 million, or 20.0%, to $121.2 million in fiscal 2005. The increase in operatingincome was due to the factors described above.
loss on extinguishment of debt
As described in Note 1 to the accompanying consolidated financial statements, as a result of the Refinancing, weincurred a $14.0 million redemption premium in connection with the repurchase of our 10.875% Senior Subordi-nated Notes, wrote off $4.5 million in debt issuance costs associated with our former senior credit facility and10.875% Senior Subordinated Notes, expensed $0.5 million related to the debt discount on the 10.875% SeniorSubordinated Notes, and wrote off $1.1 million in new debt issuance costs associated with our new Senior CreditFacility in accordance with Emerging Issues Task Force No. 96-19, “Debtor’s Accounting for a Modification orExchange of Debt Instruments.”
interest expense, net
Interest expense in fiscal 2005 increased $4.7 million, or 25.5%, to $23.2 million. This increase is attributable to the impact of additional borrowings associated with the Transaction as described in Note 1 to the accompanyingconsolidated financial statements. Weighted-average borrowings in fiscal 2005 prior to the Transaction were$169.1 million at an effective interest rate of 9.9%. Subsequent to the Transaction, weighted-average borrowingswere $472.7 million at an effective interest rate of 5.9%. In fiscal 2004, weighted-average borrowings were $204.6 million at an effective interest rate of 8.6%.
income taxes
Our effective tax rate was 39.4% for fiscal 2005 and 39.8% for fiscal 2004. Our effective tax rate was slightly higherin 2004 due primarily to the impact of certain non-deductible costs. See Note 8 to the accompanying consolidatedfinancial statements for the reconciliation of the statutory rate to our effective tax rate.
net income
Our fiscal 2005 net income decreased $2.5 million to $47.2 million as compared to $49.7 million in fiscal 2004 as aresult of the factors described above.
fiscal year ended january 1, 2005 compared with fiscal year ended january 3, 2004net sales
Consolidated net sales for fiscal 2004 were $823.1 million, an increase of $119.3 million, or 16.9%, compared to $703.8 million in fiscal 2003. Revenue growth in all channels has been driven by the success of our focus onhigh-quality essential core products. Revenue growth has also been driven by retail store growth, productivityimprovements in our retail stores, and a full year of revenue from our Child of Mine brand which launched in June of 2003.
management’sdiscussion
and analysisof financialcondition
and resultsof operations
continued
management’sdiscussion
and analysisof financialcondition
and resultsof operations
continued
28 Carter’s, Inc.
Total wholesale sales increased $28.9 million, or 8.1%, to $385.8 million in fiscal 2004 from $356.9 million in fiscal 2003. In fiscal 2004, wholesale sales, excluding off-price sales, increased $30.7 million, or 9.2%, to $365.9 million from $335.2 million in fiscal 2003. The increase in wholesale sales, excluding off-price sales, was driven by a 17% increase in units shipped offset by a 6% decrease in revenue per dozen as compared to fiscal 2003. Growth in units shipped was driven by increased sales in all product categories driven by our focus on consistently improving the value of our baby, playclothes, and sleepwear products and our focus on improvingcustomer service levels. The decrease in revenue per dozen was driven by product mix in all product categories.
Mass channel sales increased $62.2 million in fiscal 2004, or 74.3%, to $145.9 million. This increase was driven byincreased sales of $50.7 million of our Child of Mine brand to Wal-Mart and increased sales of $11.6 million, or25%, of our Just One Year brand to Target. The growth in Child of Mine sales of $50.7 million to $88.0 million in fiscal 2004 from $37.4 million in fiscal 2003 reflects a full year of sales as we began shipping our Child of Minebrand to Wal-Mart in June of 2003. Also contributing to growth in the mass channel was new door growth andadditional floor space at both Wal-Mart and Target stores.
Retail store sales increased $28.2 million, or 10.7%, to $291.4 million in fiscal 2004 from $263.2 million in fiscal2003. The driver of the revenue increase in fiscal 2004 was incremental revenue of $16.2 million generated fromnew store openings offset by the impact of store closures of $0.8 million and a comparable store sales increase of$15.9 million, or 6.2%, based on 166 locations. The increase in comparable store sales was driven by our focus onimproving the productivity of the stores. Such improvement was driven by converting approximately 100 stores to a new format, including moving baby products to the front of the store, more impactful window displays, and moreeffective in-store merchandising and marketing.
gross profit
In fiscal 2004, gross profit increased $42.8 million, or 16.7%, to $298.0 million compared to $255.3 million infiscal 2003. Gross profit as a percentage of net sales was 36.2% in fiscal 2004 and 36.3% in fiscal 2003. The impacton gross margin from a higher mix of mass channel sales was largely offset by product cost reduction. Results forfiscal 2003 also included approximately $1.3 million in accelerated depreciation related to the closure of our CostaRica sewing facilities.
selling, general, and administrative expenses
In fiscal 2004, selling, general, and administrative expenses increased $20.7 million, or 11.0%, to $208.8 millionfrom $188.0 million in fiscal 2003. As a percentage of net sales, these expenses decreased to 25.3% in fiscal 2004from 26.7% in fiscal 2003. The decrease, relative to sales, reflects the benefit of leveraging operating expenses,most notably in the mass channel, against higher levels of revenue. The decrease, relative to sales, also reflects the cessation of the amortization of our licensing agreements as of August 15, 2004. During fiscal 2004, werecorded approximately $3.1 million in amortization related to these agreements as compared to $5.0 million in fiscal 2003. Results for fiscal 2003 included the payment of a $2.5 million special bonus to vested option holders in July 2003.
closure costs
In June of 2004, we exited our distribution facility in Leola, Pennsylvania in order to consolidate our distributionoperations and reduce costs. We recorded approximately $175,000 of severance and other exit costs related tothis closure during fiscal 2004.
In July of 2003, we decided to exit our Costa Rican sewing facilities, given our ability to obtain lower costs fromthird-party suppliers. During fiscal 2003, we recorded approximately $1,041,000 in severance and other exit costsrelated to these closures. During fiscal 2004, we recorded approximately $74,000 and $371,000 in severance andother exit costs related to these closures.
management fee termination
In the fourth quarter of 2003, upon completion of our initial public offering on October 29, 2003, we paid $2.6 millionto terminate the Berkshire Partners LLC management agreement. Under the agreement, which was scheduled toexpire in fiscal 2005, we paid an annual fee of $1.65 million.
2005 Annual Report 29
royalty income
We license the use of the Carter’s, Carter’s Classics, Just One Year, and Child of Mine names and sublicensed the Tykes name to certain licensees. In fiscal 2004, royalty income increased 12.1% to $12.4 million compared to $11.0 million in fiscal 2003. This increase primarily reflects increased licensed sales of our Child of Mine brand by our licensee partners who began shipping their products during the third quarter of fiscal 2003.
operating income
Operating income for fiscal 2004 increased $26.4 million, or 35.3%, to $101.0 million compared to $74.6 million in fiscal 2003. Operating income, as a percentage of net sales, was 12.3% in fiscal 2004 as compared to 10.6% infiscal 2003 as a result of the factors described above.
interest expense, net
Interest expense in fiscal 2004 decreased $7.7 million, or 29.5%, to $18.5 million from $26.3 million in fiscal 2003.This decrease is attributable to the redemption of approximately $61.3 million of our 10.875% Senior SubordinatedNotes on November 28, 2003, reduced levels of term loan indebtedness, and the additional week of interest expensein fiscal 2003.
loss on extinguishment of debt
On November 28, 2003, we used the proceeds of the initial public offering to redeem $61.3 million of our 10.875% Senior Subordinated Notes. In connection with this redemption, we incurred redemption premiums of approximately $6.7 million, wrote off $2.2 million of deferred debt issuance costs, and expensed $0.4 millionrelated to the note discount. We also prepaid $11.3 million in term loan indebtedness and subsequently wrote off$0.2 million of deferred debt issuance costs.
income taxes
Our effective tax rate was 39.8% for fiscal 2004 and 40.2% for fiscal 2003. Our effective tax rates in fiscal 2004 and 2003 were higher than the statutory rates, due primarily to the impact of certain non-deductible costs. SeeNote 8 to the accompanying consolidated financial statements for the reconciliation of the statutory tax rate to our effective tax rate.
net income
Our fiscal 2004 net income increased to $49.7 million, compared to $23.3 million in fiscal 2003, as a result of thefactors described above.
liquidity and capital resourcesOur primary cash needs are working capital, capital expenditures, and debt service. Historically, we have financedthese needs through operating cash flow and funds borrowed under our former senior credit facility. Our primarysource of liquidity will be cash flow from operations and borrowings under our new Revolver, and we expect thatthese sources will fund our ongoing requirements for debt service and capital expenditures. These sources ofliquidity may be impacted by continued demand for our products and our ability to meet debt covenants under our new Senior Credit Facility, described below.
Net accounts receivable at December 31, 2005 were $96.1 million, compared to $80.4 million at January 1, 2005.This increase primarily reflects $13.3 million of OshKosh receivables and higher levels of wholesale and mass channel revenue in the latter part of fiscal 2005, compared to the latter part of fiscal 2004.
Inventory levels at December 31, 2005 were $188.5 million, compared to $120.8 million at January 1, 2005.Increased inventory levels as of December 31, 2005 include $57.6 million of OshKosh brand inventory and anincrease in Carter’s brand inventory of $10.1 million, due primarily to increases in forecasted demand. ExcludingOshKosh, average inventory levels increased 3.7% to $133.9 million in fiscal 2005, compared to $129.1 million infiscal 2004. Average inventory levels are expected to be higher in fiscal 2006 due to the Acquisition of OshKoshand increases in forecasted demand.
management’sdiscussion
and analysisof financialcondition
and resultsof operations
continued
management’sdiscussion
and analysisof financialcondition
and resultsof operations
continued
30 Carter’s, Inc.
Net cash provided by operating activities during fiscal 2005 and fiscal 2004 was $137.3 million and $42.7 million.This increase in net cash flow provided by operating activities in fiscal 2005 as compared to fiscal 2004 was drivenby the growth in earnings, adjusted for non-cash charges related to the Transaction, increases in accounts payableand other current liabilities, and reductions in OshKosh brand inventory since the date of Acquisition. Net cashprovided by our operating activities in fiscal 2003 was approximately $40.5 million. The increase in net cash flowprovided by operating activities in fiscal 2004 as compared to fiscal 2003 was driven by the growth in earnings and reductions in prepaid expenses, partially offset by increased levels of inventory to support demand andincreased levels of accounts receivable resulting from growth in revenue and the timing of shipments.
As a result of the decision to close our sewing facilities in Mexico, we have recorded total charges of $8.4 million including approximately $4.6 million of severance charges, $1.3 million in lease termination charges, $1.6 million of accelerated depreciation (included in cost of goods sold), $0.1 million of asset impairment charges, and $0.8 million of other exit costs during fiscal 2005. Additional charges expected to be incurred during the first half of fiscal 2006 primarily include severance charges and other exit costs of approximately $0.5 million.
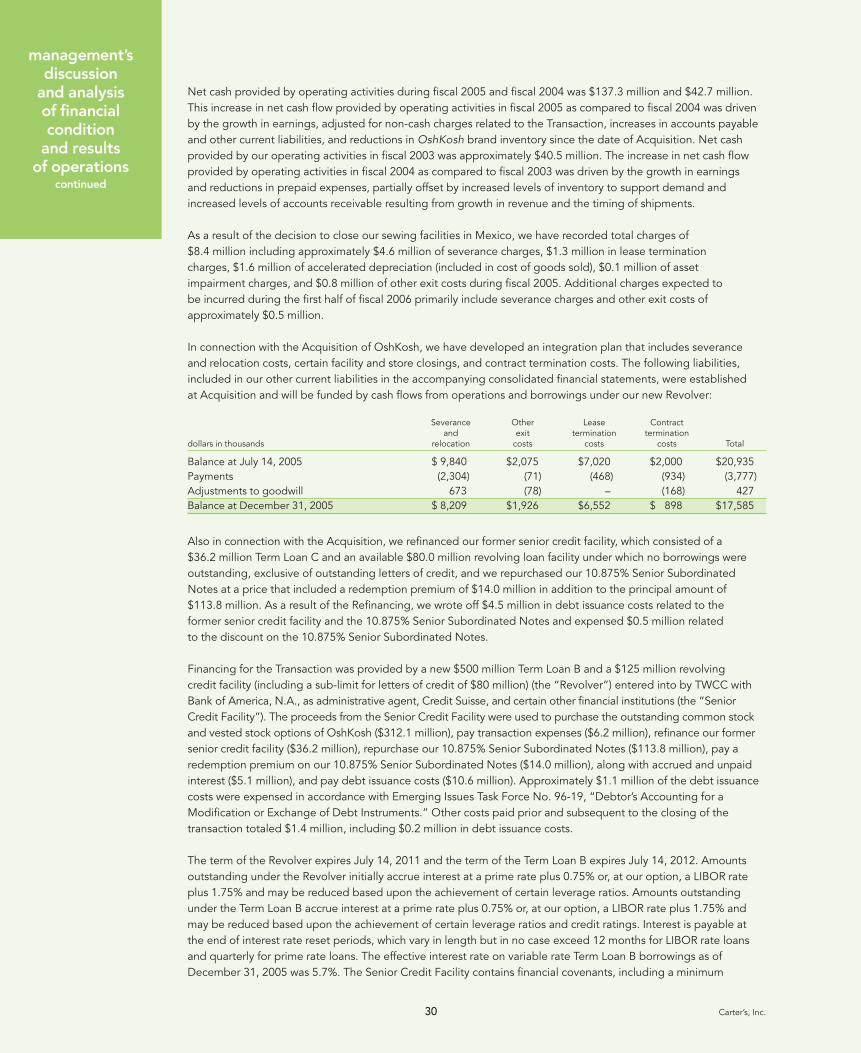
In connection with the Acquisition of OshKosh, we have developed an integration plan that includes severance and relocation costs, certain facility and store closings, and contract termination costs. The following liabilities,included in our other current liabilities in the accompanying consolidated financial statements, were established at Acquisition and will be funded by cash flows from operations and borrowings under our new Revolver:
Severance Other Lease Contractand exit termination termination
dollars in thousands relocation costs costs costs Total
Balance at July 14, 2005 $ 9,840 $2,075 $7,020 $2,000 $20,935Payments (2,304) (71) (468) (934) (3,777)Adjustments to goodwill 673 (78) – (168) 427Balance at December 31, 2005 $ 8,209 $1,926 $6,552 $ 898 $17,585
Also in connection with the Acquisition, we refinanced our former senior credit facility, which consisted of a $36.2 million Term Loan C and an available $80.0 million revolving loan facility under which no borrowings wereoutstanding, exclusive of outstanding letters of credit, and we repurchased our 10.875% Senior SubordinatedNotes at a price that included a redemption premium of $14.0 million in addition to the principal amount of $113.8 million. As a result of the Refinancing, we wrote off $4.5 million in debt issuance costs related to the former senior credit facility and the 10.875% Senior Subordinated Notes and expensed $0.5 million related to the discount on the 10.875% Senior Subordinated Notes.
Financing for the Transaction was provided by a new $500 million Term Loan B and a $125 million revolving credit facility (including a sub-limit for letters of credit of $80 million) (the “Revolver”) entered into by TWCC withBank of America, N.A., as administrative agent, Credit Suisse, and certain other financial institutions (the “SeniorCredit Facility”). The proceeds from the Senior Credit Facility were used to purchase the outstanding common stockand vested stock options of OshKosh ($312.1 million), pay transaction expenses ($6.2 million), refinance our formersenior credit facility ($36.2 million), repurchase our 10.875% Senior Subordinated Notes ($113.8 million), pay aredemption premium on our 10.875% Senior Subordinated Notes ($14.0 million), along with accrued and unpaidinterest ($5.1 million), and pay debt issuance costs ($10.6 million). Approximately $1.1 million of the debt issuance costs were expensed in accordance with Emerging Issues Task Force No. 96-19, “Debtor’s Accounting for aModification or Exchange of Debt Instruments.” Other costs paid prior and subsequent to the closing of the transaction totaled $1.4 million, including $0.2 million in debt issuance costs.
The term of the Revolver expires July 14, 2011 and the term of the Term Loan B expires July 14, 2012. Amountsoutstanding under the Revolver initially accrue interest at a prime rate plus 0.75% or, at our option, a LIBOR rateplus 1.75% and may be reduced based upon the achievement of certain leverage ratios. Amounts outstandingunder the Term Loan B accrue interest at a prime rate plus 0.75% or, at our option, a LIBOR rate plus 1.75% andmay be reduced based upon the achievement of certain leverage ratios and credit ratings. Interest is payable at the end of interest rate reset periods, which vary in length but in no case exceed 12 months for LIBOR rate loansand quarterly for prime rate loans. The effective interest rate on variable rate Term Loan B borrowings as ofDecember 31, 2005 was 5.7%. The Senior Credit Facility contains financial covenants, including a minimum

2005 Annual Report 31
interest coverage ratio, maximum leverage ratio, and fixed charge coverage ratio. The Senior Credit Facility alsosets forth mandatory and optional prepayment conditions, including an annual excess cash flow requirement, asdefined, that may result in our use of cash to reduce our debt obligations. There is no excess cash flow paymentrequired in fiscal 2006. Our obligations under the Senior Credit Facility are collateralized by a first priority lien onsubstantially all of our assets, including the assets of our domestic subsidiaries.
The Senior Credit Facility requires us to hedge at least 25% of our variable rate debt under the term loan. OnSeptember 22, 2005, we entered into a swap agreement to receive floating rate interest and pay fixed interest. This swap agreement is designated as a cash flow hedge of the variable interest payments on a portion of our variable rate Term Loan B debt. The swap agreement matures July 30, 2010.
Principal borrowings under the Term Loan B are due and payable in quarterly installments of $1.1 million fromMarch 31, 2006 through June 30, 2012 with the remaining balance of $401.9 million due on July 14, 2012.
In addition to scheduled amortization payments made during the third and fourth quarters of fiscal 2005, weprepaid an additional $67.6 million of Term Loan B indebtedness.
Our former senior credit facility, as amended, set forth mandatory and optional prepayment conditions thatresulted in our use of cash to reduce our debt obligations. Accordingly, we made an excess cash flow principalprepayment of approximately $2.4 million on March 22, 2004. No such prepayment was required in fiscal 2005.
In June 2005, March 2005, December 2004, and March 2004, we prepaid an additional $15.0 million, $20.0 million,$20.0 million, and $5.0 million, respectively, of term loan indebtedness under our former senior credit facility.
At December 31, 2005, we had approximately $430.0 million in term loan borrowings and no borrowings under our Revolver, exclusive of approximately $20.2 million of outstanding letters of credit. At January 1, 2005, under our former senior credit facility, we had approximately $184.5 million of debt outstanding, consisting of $113.2 million of 10.875% Senior Subordinated Notes, $71.3 million in term loan borrowings under our former senior credit facility and no revolving loan facility borrowings, exclusive of approximately $6.8 million of outstanding letters of credit.
The following table summarizes as of December 31, 2005, the maturity or expiration dates of mandatory contrac-tual obligations and commitments for the following fiscal years:
dollars in thousands 2006 2007 2008 2009 2010 Thereafter Total
Long-term debt $ 3,241 $ 4,322 $ 5,402 $ 4,322 $ 4,322 $408,423 $430,032Interest on debt:
Variable rate (a) 23,744 23,744 23,744 23,744 23,744 35,615 154,335Operating leases
(see Note 9 to the Consolidated Financial Statements) 37,719 30,572 25,065 19,648 14,841 40,716 168,561Total financial obligations 64,704 58,638 54,211 47,714 42,907 484,754 752,928
Letters of credit 20,179 – – – – – 20,179Purchase obligations (b) 116,138 – – – – – 116,138
Total financial obligations and commitments $201,021 $58,638 $54,211 $47,714 $42,907 $484,754 $889,245
(a) Reflects estimated variable rate interest on obligations outstanding on our term loan as of December 31, 2005 using an interest rate of5.7% (rate in effect at December 31, 2005).
(b) Unconditional purchase obligations are defined as agreements to purchase goods or services that are enforceable and legally binding onus and that specify all significant terms, including fixed or minimum quantities to be purchased; fixed, minimum, or variable price provi-sions; and the approximate timing of the transaction. The purchase obligations category above relates to commitments for inventorypurchases. Amounts reflected on the accompanying consolidated balance sheets in accounts payable or other current liabilities areexcluded from the table above.
management’sdiscussion
and analysisof financialcondition
and resultsof operations
continued
management’sdiscussion
and analysisof financialcondition
and resultsof operations
continued
32 Carter’s, Inc.
In addition to the total contractual obligations and commitments in the preceding table, we have post-retirementbenefit obligations, included in other current and other long-term liabilities, as further described in Note 7 to the accompanying consolidated financial statements.
Based on our current level of operations, we believe that cash generated from operations and available cash,together with amounts available under our new Revolver, will be adequate to meet our debt service require-ments, capital expenditures, and working capital needs for the foreseeable future, although no assurance can be given in this regard. We may, however, need to refinance all or a portion of the principal amount of amountsoutstanding under our Revolver on or before July 14, 2011 and amounts outstanding under our Term Loan B on or before July 14, 2012.
effects of inflation and deflationWe are affected by inflation and changing prices primarily through the purchase of raw materials, increased operat-ing costs and expenses, and fluctuations in interest rates. The effects of inflation on our net sales and operations havenot been material in recent years. In recent years, there has been deflationary pressure on selling prices. While wehave been successful in offsetting such deflationary pressures through product improvements and lower costs withthe expansion of our global sourcing network, if deflationary price trends outpace our ability to obtain further pricereductions from our global suppliers, our profitability may be affected.
seasonalityWe experience seasonal fluctuations in our sales and profitability, with generally lower sales and gross profit in thefirst and second quarters of our fiscal year. Excluding the impact of the Acquisition, over the past five fiscal years,approximately 57% of our consolidated net sales were generated in the second half of our fiscal year. With a fullyear of OshKosh net sales in fiscal 2006, we expect this trend to continue. Accordingly, our results of operations for the first and second quarters of any year are not indicative of the results we expect for the full year.
As a result of this seasonality, our inventory levels and other working capital requirements generally begin toincrease during the second quarter and into the third quarter of each fiscal year. During these peak periods, we hadhistorically borrowed under our former revolving credit facility. We had no borrowings under our former revolvingcredit facility or new Revolver during fiscal 2005 as compared to peak borrowings of $25.3 million in fiscal 2004.
critical accounting policies and estimatesOur discussion and analysis of our financial condition and results of operations are based upon our consolidatedfinancial statements, which have been prepared in accordance with accounting principles generally accepted in theUnited States of America. The preparation of these financial statements requires us to make estimates and judgmentsthat affect the reported amounts of assets, liabilities, revenues, expenses, and related disclosure of contingent assetsand liabilities. We base our estimates on historical experience and on various other assumptions that we believe arereasonable under the circumstances, the results of which form the basis for making judgments about the carryingvalues of assets and liabilities that are not readily apparent from other sources. Actual results may differ from theseestimates under different assumptions or conditions.
Our significant accounting policies are described in Note 2 to the accompanying consolidated financial statements.The following discussion addresses our critical accounting policies and estimates, which are those that requiremanagement’s most difficult and subjective judgments, often as a result of the need to make estimates about the effect of matters that are inherently uncertain.
Revenue recognition: We recognize wholesale and mass channel revenue after shipment of products to customers,when title passes, and when all risks and rewards of ownership have transferred. In certain cases, in which we retainthe risk of loss during shipment, revenue recognition does not occur until the goods have reached the specifiedcustomer. We consider revenue realized or realizable and earned when the product has been shipped and when all risks and rewards of ownership have transferred, the sales price is fixed or determinable, and collectibility isreasonably assured. In the normal course of business, we grant certain accommodations and allowances to ourwholesale and mass channel customers. We provide accommodations and allowances to our key wholesale andmass channel customers in order to assist these customers with inventory clearance and promotions. Such amounts are reflected as a reduction of net sales and are recorded based upon historical trends and annual
2005 Annual Report 33
forecasts. Retail store revenues are recognized at the point of sale. We reduce revenue for customer returns anddeductions. We also maintain an allowance for doubtful accounts for estimated losses resulting from the inability of our customers to make payments and other actual and estimated deductions. If the financial condition of our customers were to deteriorate, resulting in an impairment of their ability to make payments, an additionalallowance could be required. Past due balances over 90 days are reviewed individually for collectibility. Our creditand collections department reviews all other balances regularly. Account balances are charged off against theallowance when we feel it is probable the receivable will not be recovered.
We contract with a third-party service to provide us with the fair value of cooperative (“co-op”) advertising arrange-ments entered into with certain of our major wholesale and mass channel customers. Such fair value is determinedbased upon, among other factors, comparable market analysis for similar advertisements. In accordance withEmerging Issues Task Force Issue No. 01-09, “Accounting for Consideration Given by a Vendor to a Customer/Reseller”(“EITF 01-09”), we have included the fair value of these arrangements of approximately $4.8 million in fiscal 2005as a component of selling, general, and administrative expenses on the accompanying consolidated statement ofoperations rather than as a reduction of revenue. Amounts determined to be in excess of the fair value of thesearrangements are recorded as a reduction of net sales.
Inventory: We provide reserves for slow-moving inventory equal to the difference between the cost of inventoryand the estimated market value based upon assumptions about future demand and market conditions. If actualmarket conditions are less favorable than those we project, additional write-downs may be required.
Goodwill and tradename: As of December 31, 2005, we had approximately $606.4 million in goodwill and trade-name assets. The fair value of the Carter’s tradename was estimated at the 2001 Acquisition to be approximately$220 million using a discounted cash flow analysis, which examined the hypothetical cost savings that accrue as aresult of our ownership of the tradename. The fair value of our OshKosh tradename was estimated as of the date of the Acquisition to be approximately $102 million, also using a discounted cash flow analysis. The cash flows,which incorporated both historical and projected financial performance, were discounted using a discount rate often and twelve percent for Carter’s and OshKosh, respectively. The tradenames were determined to have indefinitelives. The carrying value of these assets is subject to annual impairment reviews as of the last day of each fiscal year. Factors affecting such impairment reviews include the continued market acceptance of our products and thedevelopment of new products. Impairment reviews may also be triggered by any significant events or changes incircumstances. Our impairment review of goodwill is based on the estimated fair values of the underlying busi-nesses. These estimated fair values are based on estimates of the future cash flows of the businesses.
Accrued expenses: Accrued expenses for health insurance, workers’ compensation, incentive compensation,professional fees, and other outstanding obligations are assessed based on actual commitments, statistical trends,and estimates based on projections and current expectations, and these estimates are updated periodically asadditional information becomes available.
Accounting for income taxes: As part of the process of preparing our consolidated financial statements, we arerequired to estimate our actual current tax exposure (state, federal, and foreign), together with assessing perma-nent and temporary differences resulting from differing bases and treatment of items for tax and accountingpurposes, such as the carrying value of intangibles, deductibility of expenses, depreciation of property, plant, and equipment, and valuation of inventories. Temporary differences result in deferred tax assets and liabilities,which are included within our consolidated balance sheets. We must then assess the likelihood that our deferredtax assets will be recovered from future taxable income. Actual results could differ from this assessment if sufficienttaxable income is not generated in future periods. To the extent we determine the need to establish a valuationallowance or increase such allowance in a period, we must include an expense within the tax provision in theaccompanying consolidated statements of operations.
Stock-based compensation arrangements: We account for stock-based compensation on stock options under theintrinsic value method, whereby we record compensation expense equal to the difference between the exerciseprice of the stock option and the fair market value of the underlying stock at the date of the option grant. Fordisclosure purposes only, we also estimate the impact on our net income of applying the fair value method ofmeasuring compensation cost on stock options with the fair value, prior to our initial public offering, determinedunder the minimum value method as provided by SFAS No. 123, “Accounting for Stock-Based Compensation”
management’sdiscussion
and analysisof financialcondition
and resultsof operations
continued
management’sdiscussion
and analysisof financialcondition
and resultsof operations
continued
34 Carter’s, Inc.
(“SFAS 123”) as amended by SFAS No. 148, “Accounting for Stock-Based Compensation-Transition and Disclosure”(“SFAS 148”). Stock options granted subsequent to our initial public offering have been valued using the Black-Scholes option pricing model. For stock issued or sold outright to employees, directors, or third parties, wemeasure expense as the difference between the price paid by the recipient, if any, and the fair market value of the stock on the date of issuance or sale.
recent accounting pronouncementsIn December 2004, the Financial Accounting Standards Board (“FASB”) issued SFAS No. 123 (revised 2004),“Share-Based Payment” (“SFAS 123R”), which replaces SFAS 123, “Accounting for Stock-Based Compensation”and supercedes Accounting Principles Board Opinion No. 25, “Accounting for Stock Issued to Employees.” SFAS 123R requires all share-based awards to employees, including grants of employee stock options, to be recognized in the financial statements based on their fair values. The pro forma disclosures previously permittedunder SFAS 123, will no longer be an alternative to financial statement recognition. We have selected the modifiedprospective method of adoption which requires that compensation expense be recorded for all unvested stock-based compensation awards, as they vest, beginning with the first quarter of adoption of SFAS 123R and for allsubsequent stock-based compensation awards granted thereafter. We will continue to use the Black-Scholesmethod to determine the fair value of stock options at the date of grant. SFAS 123R is effective for public com-panies for annual periods that begin after June 15, 2005. The impact of adoption beginning January 1, 2006, isestimated to result in a reduction in fiscal 2006 net income of approximately $3.0 million, or $0.10 per diluted share.
In March 2005, the Securities and Exchange Commission (“SEC”) issued Staff Accounting Bulletin No.107, “Share-Based Payment” (“SAB 107”). The interpretations in SAB 107 express views of the staff regarding the interactionbetween SFAS 123R and certain SEC rules and regulations and provide the staff’s views regarding the valuation of share-based payment arrangements for public companies. In particular, SAB 107 provides guidance related to share-based payment transactions with non-employees, the transition from non-public to public entity status,valuation methods (including assumptions such as expected volatility and expected term), the accounting forcertain redeemable financial instruments issued under share-based payment arrangements, the classification of compensation expense, non-GAAP financial measures, first-time adoption of SFAS 123R in an interim period,capitalization of compensation cost related to share-based payment arrangements, the accounting for income taxeffects of share-based payment arrangements upon adoption of SFAS 123R, the modification of employee shareoptions prior to adoption of SFAS 123R, and disclosures in Management’s Discussion and Analysis subsequent toadoption of SFAS 123R.
forward-looking statementsStatements contained herein that relate to our future performance, including, without limitation, statements withrespect to our anticipated results of operations or level of business for fiscal 2006 or any other future period, areforward-looking statements within the meaning of the safe harbor provisions of the Private Securities LitigationReform Act of 1995. Such statements are based on current expectations only, and are subject to certain risks,uncertainties, and assumptions. Should one or more of these risks or uncertainties materialize, or should under-lying assumptions prove incorrect, actual results may vary materially from those anticipated, estimated, orprojected. The factors that could cause actual results to materially differ include a decrease in sales to, or the loss of one or more of our key customers, the acceptance of our products in the marketplace, deflationary pres-sures on our prices, disruptions in foreign supply sources, negative publicity, increased competition in the baby and young children’s apparel market, our substantial leverage which increases our exposure to interest rate risk and could require us to dedicate a substantial portion of our cash flow to repay principal, the impact of govern-mental regulations and environmental risks applicable to our business, our ability to identify new locations andnegotiate appropriate lease terms for our retail stores, our ability to attract and retain key individuals within the organization, and seasonal fluctuations in the children’s apparel business. These risks are described under the heading “Risk Factors.” We undertake no obligation to publicly update or revise any forward-looking statements, whether as a result of new information, future events, or otherwise.
2005 Annual Report 35
quantitative and qualitative disclosures about market riskIn the operation of our business, we have market risk exposures including those related to foreign currency risk andinterest rates. These risks and our strategies to manage our exposure to them are discussed below.
We contract for production with third parties, primarily in the Far East and South and Central America. While thesecontracts are stated in United States dollars, there can be no assurance that the cost for the future production ofour products will not be affected by exchange rate fluctuations between the United States dollar and the localcurrencies of these contractors. Due to the number of currencies involved, we cannot quantify the potential impactof future currency fluctuations on net income in future years. In order to manage this risk, we source products fromapproximately 100 vendors worldwide, providing us with flexibility in our production should significant fluctua-tions occur between the United States and various local currencies. To date, such exchange fluctuations have nothad a material impact on our financial condition or results of operations. We do not hedge foreign currencyexchange rate risk.
The Senior Credit Facility requires us to hedge at least 25% of our variable rate debt under the term loan. OnSeptember 22, 2005, we entered into a swap agreement to receive floating rate interest and pay fixed interest. Thisswap agreement is designated as a cash flow hedge of the variable interest payments on a portion of our variablerate Term Loan B debt. The swap agreement matures July 30, 2010. The unrealized gain, net of taxes, related tothe interest rate swap was $1.4 million for the fiscal year ended December 31, 2005 and is included within accumu-lated other comprehensive income on the accompanying consolidated balance sheet.
Our operating results are subject to risk from interest rate fluctuations on our new Senior Credit Facility, which carriesvariable interest rates. At December 31, 2005, our outstanding debt aggregated approximately $430.0 million, ofwhich $261.7 million bore interest at a variable rate. An increase of 1% in the applicable rate would increase ourannual interest cost by $2.6 million, exclusive of variable rate debt subject to our swap agreement described above,and could have an adverse effect on our net income and cash flow.
other risksThere also are other risks in the operation of our business specifically related to our global sourcing network.
We source substantially all of our production from third-party manufacturers located in foreign countries. As aresult, we may be adversely affected by political instability resulting in the disruption of trade from foreign coun-tries, the imposition of new regulations relating to imports, duties, taxes, and other charges on imports, includingthe China safeguards, any significant decreases in the value of the dollar against foreign currencies, and restrictionson the transfer of funds. These and other factors could result in the interruption of production, delay receipt of theproducts into the United States, or affect our sales and profitability. Our future performance may be subject to suchfactors, which are beyond our control, and there can be no assurance that such factors would not have a materialadverse affect on our financial condition and results of operations. We carefully select our sourcing agents, and inan effort to mitigate the possible disruption in product flow, we place production in various countries we believe to be of lower risk.
We enter into various purchase order commitments with our suppliers. We can cancel these arrangements, althoughin some instances, we may be subject to a termination charge reflecting a percentage of work performed prior tocancellation. Historically, such cancellations and related termination charges have occurred infrequently and havenot had a material impact on our business. However, as we expand the use of this global sourcing network, we mayincur more of these termination charges, which could increase our cost of goods sold.
management’sdiscussion
and analysisof financialcondition
and resultsof operations
continued
report ofindependent
registered publicaccounting firm
36 Carter’s, Inc.
To the Board of Directors and Stockholders of Carter’s, Inc.:
We have completed integrated audits of Carter’s, Inc. and its subsidiaries’ fiscal 2005 and 2004 consolidated finan-cial statements and of its internal control over financial reporting as of December 31, 2005, and an audit of its fiscal2003 consolidated financial statements in accordance with the standards of the Public Company AccountingOversight Board (United States). Our opinions, based on our audits, are presented below.
consolidated financial statements In our opinion, the consolidated financial statements listed in the accompanying index present fairly, in all materialrespects, the financial position of Carter’s, Inc. and its subsidiaries (the “Company”) at December 31, 2005 andJanuary 1, 2005, and the results of their operations and their cash flows for each of the three fiscal years in theperiod ended December 31, 2005 in conformity with accounting principles generally accepted in the United Statesof America. These financial statements are the responsibility of the Company’s management. Our responsibility isto express an opinion on these financial statements based on our audits. We conducted our audits of these state-ments in accordance with the standards of the Public Company Accounting Oversight Board (United States). Thosestandards require that we plan and perform the audit to obtain reasonable assurance about whether the financialstatements are free of material misstatement. An audit of financial statements includes examining, on a test basis,evidence supporting the amounts and disclosures in the financial statements, assessing the accounting principlesused and significant estimates made by management, and evaluating the overall financial statement presentation.We believe that our audits provide a reasonable basis for our opinion.
internal control over financial reportingAlso, in our opinion, management’s assessment, included in Management’s Report on Internal Control Over FinancialReporting appearing on page 37, that the Company maintained effective internal control over financial reporting asof December 31, 2005 based on criteria established in Internal Control – Integrated Framework issued by theCommittee of Sponsoring Organizations of the Treadway Commission (COSO), is fairly stated, in all material respects,based on those criteria. Furthermore, in our opinion, the Company maintained, in all material respects, effectiveinternal control over financial reporting as of December 31, 2005, based on criteria established in Internal Control –Integrated Framework issued by the COSO. The Company’s management is responsible for maintaining effectiveinternal control over financial reporting and for its assessment of the effectiveness of internal control over financialreporting. Our responsibility is to express opinions on management’s assessment and on the effectiveness of theCompany’s internal control over financial reporting based on our audit. We conducted our audit of internal controlover financial reporting in accordance with the standards of the Public Company Accounting Oversight Board(United States). Those standards require that we plan and perform the audit to obtain reasonable assurance aboutwhether effective internal control over financial reporting was maintained in all material respects. An audit of internalcontrol over financial reporting includes obtaining an understanding of internal control over financial reporting,evaluating management’s assessment, testing and evaluating the design and operating effectiveness of internalcontrol, and performing such other procedures as we consider necessary in the circumstances. We believe that our audit provides a reasonable basis for our opinions.
A company’s internal control over financial reporting is a process designed to provide reasonable assurance regardingthe reliability of financial reporting and the preparation of financial statements for external purposes in accordancewith generally accepted accounting principles. A company’s internal control over financial reporting includes thosepolicies and procedures that (i) pertain to the maintenance of records that, in reasonable detail, accurately and fairlyreflect the transactions and dispositions of the assets of the company; (ii) provide reasonable assurance that trans-actions are recorded as necessary to permit preparation of financial statements in accordance with generally acceptedaccounting principles, and that receipts and expenditures of the company are being made only in accordance withauthorizations of management and directors of the company; and (iii) provide reasonable assurance regardingprevention or timely detection of unauthorized acquisition, use, or disposition of the company’s assets that couldhave a material effect on the financial statements.
Because of its inherent limitations, internal control over financial reporting may not prevent or detect misstatements.Also, projections of any evaluation of effectiveness to future periods are subject to the risk that controls may becomeinadequate because of changes in conditions, or that the degree of compliance with the policies or proceduresmay deteriorate.
PricewaterhouseCoopers LLPStamford, ConnecticutMarch 15, 2006
2005 Annual Report 37
Our management is responsible for establishing and maintaining adequate internal control over financial reporting,as such term is defined in Exchange Act Rule 13a-15(f). Under the supervision and with the participation of ourmanagement, including our Chief Executive Officer and Chief Financial Officer, we conducted evaluations of theeffectiveness of Carter’s, Inc. and its subsidiaries’ internal control over financial reporting based on the frameworkin Internal Control – Integrated Framework issued by the Committee of Sponsoring Organizations of the TreadwayCommission (“COSO”). Based on our evaluations under the framework in Internal Control – Integrated Frameworkissued by the COSO, our management concluded that Carter’s, Inc. and its subsidiaries’ internal control over financialreporting was effective as of December 31, 2005.
Because of its inherent limitations, internal control over financial reporting may not prevent or detect misstatements.Also, projections of any evaluation of effectiveness to future periods are subject to the risk that controls may becomeinadequate because of changes in conditions, or that the degree of compliance with the policies or proceduresmay deteriorate.
Our management’s assessment of the effectiveness of Carter’s, Inc. and its subsidiaries’ internal control over financialreporting as of December 31, 2005 has been audited by PricewaterhouseCoopers LLP, an independent registeredpublic accounting firm, as stated in their report which appears herein.
management’sreport on
internal controlover
financialreporting
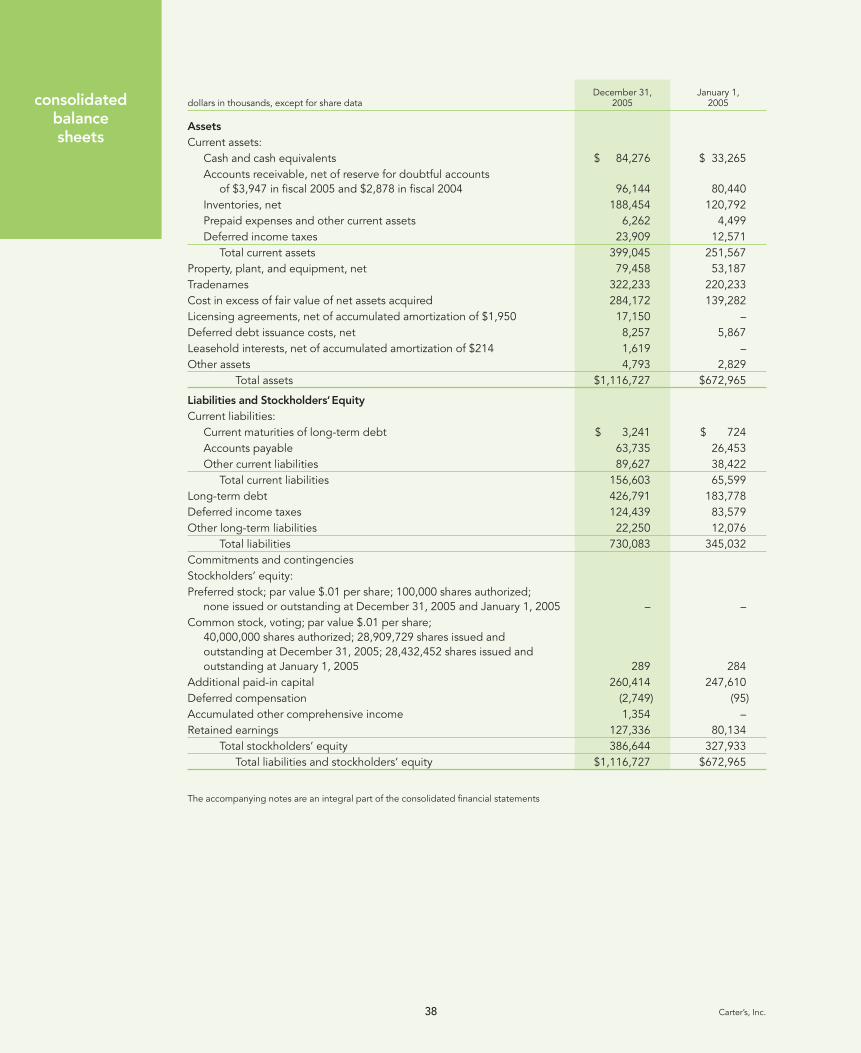
consolidatedbalance sheets
38 Carter’s, Inc.
December 31, January 1,dollars in thousands, except for share data 2005 2005
Assets
Current assets:Cash and cash equivalents $ 84,276 $ 33,265Accounts receivable, net of reserve for doubtful accounts
of $3,947 in fiscal 2005 and $2,878 in fiscal 2004 96,144 80,440Inventories, net 188,454 120,792Prepaid expenses and other current assets 6,262 4,499Deferred income taxes 23,909 12,571
Total current assets 399,045 251,567Property, plant, and equipment, net 79,458 53,187Tradenames 322,233 220,233Cost in excess of fair value of net assets acquired 284,172 139,282Licensing agreements, net of accumulated amortization of $1,950 17,150 –Deferred debt issuance costs, net 8,257 5,867Leasehold interests, net of accumulated amortization of $214 1,619 –Other assets 4,793 2,829
Total assets $1,116,727 $672,965
Liabilities and Stockholders’ Equity
Current liabilities:Current maturities of long-term debt $ 3,241 $ 724Accounts payable 63,735 26,453Other current liabilities 89,627 38,422
Total current liabilities 156,603 65,599Long-term debt 426,791 183,778Deferred income taxes 124,439 83,579Other long-term liabilities 22,250 12,076
Total liabilities 730,083 345,032Commitments and contingenciesStockholders’ equity:Preferred stock; par value $.01 per share; 100,000 shares authorized;
none issued or outstanding at December 31, 2005 and January 1, 2005 – –Common stock, voting; par value $.01 per share;
40,000,000 shares authorized; 28,909,729 shares issued and outstanding at December 31, 2005; 28,432,452 shares issued and outstanding at January 1, 2005 289 284
Additional paid-in capital 260,414 247,610Deferred compensation (2,749) (95)Accumulated other comprehensive income 1,354 –Retained earnings 127,336 80,134
Total stockholders’ equity 386,644 327,933Total liabilities and stockholders’ equity $1,116,727 $672,965
The accompanying notes are an integral part of the consolidated financial statements
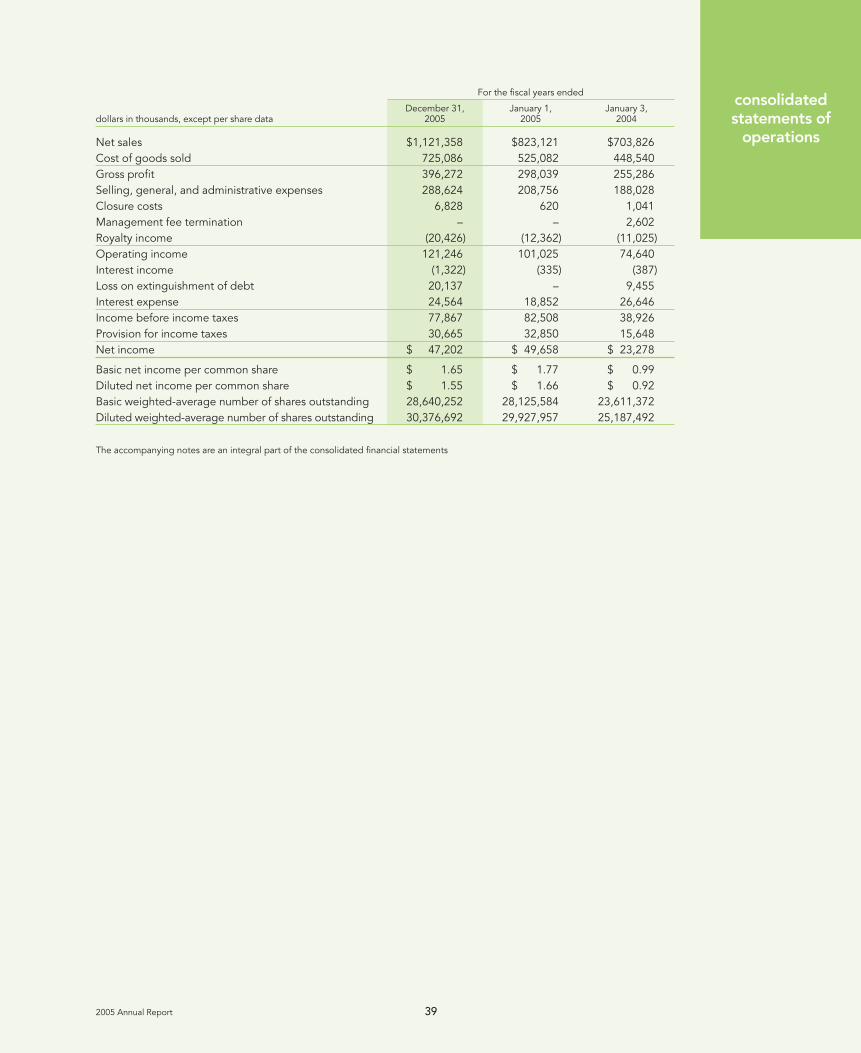
2005 Annual Report 39
consolidatedstatements of
operations
For the fiscal years ended
December 31, January 1, January 3,dollars in thousands, except per share data 2005 2005 2004
Net sales $1,121,358 $823,121 $703,826Cost of goods sold 725,086 525,082 448,540Gross profit 396,272 298,039 255,286Selling, general, and administrative expenses 288,624 208,756 188,028Closure costs 6,828 620 1,041Management fee termination – – 2,602Royalty income (20,426) (12,362) (11,025)Operating income 121,246 101,025 74,640Interest income (1,322) (335) (387)Loss on extinguishment of debt 20,137 – 9,455Interest expense 24,564 18,852 26,646Income before income taxes 77,867 82,508 38,926Provision for income taxes 30,665 32,850 15,648Net income $ 47,202 $ 49,658 $ 23,278
Basic net income per common share $ 1.65 $ 1.77 $ 0.99Diluted net income per common share $ 1.55 $ 1.66 $ 0.92Basic weighted-average number of shares outstanding 28,640,252 28,125,584 23,611,372Diluted weighted-average number of shares outstanding 30,376,692 29,927,957 25,187,492
The accompanying notes are an integral part of the consolidated financial statements
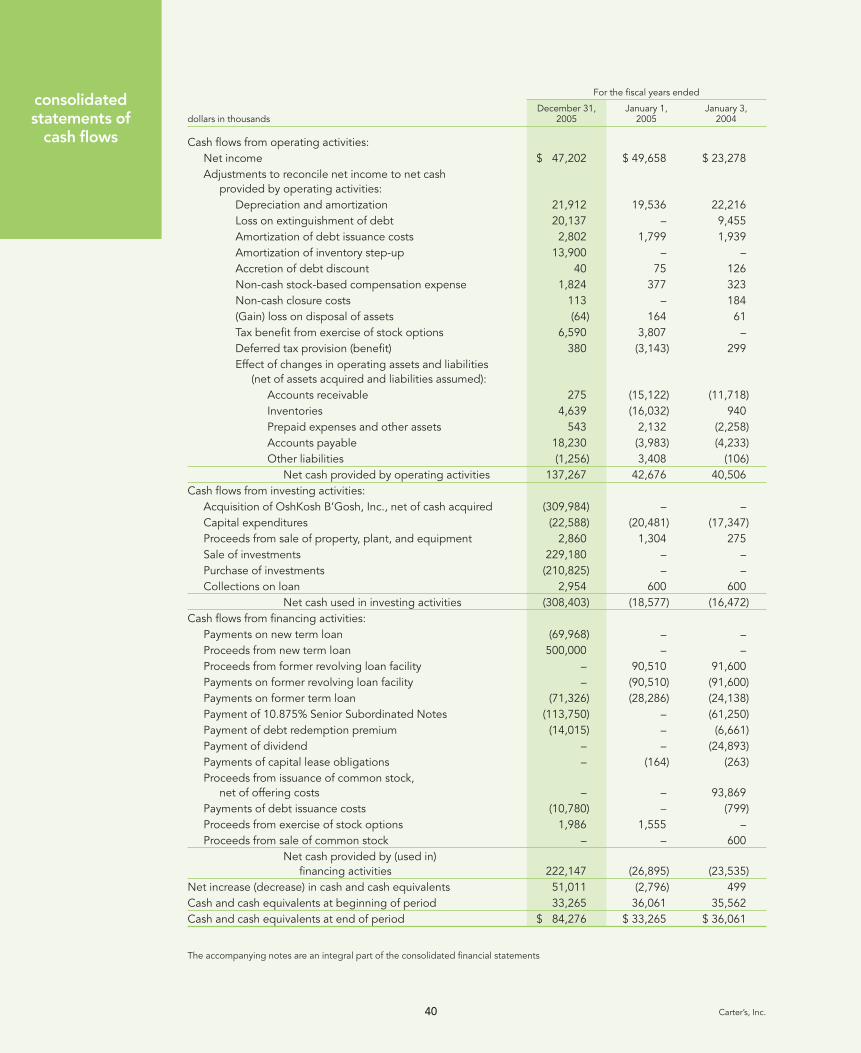
consolidatedstatements of
cash flows
40 Carter’s, Inc.
For the fiscal years ended
December 31, January 1, January 3,dollars in thousands 2005 2005 2004
Cash flows from operating activities:Net income $ 47,202 $ 49,658 $ 23,278Adjustments to reconcile net income to net cash
provided by operating activities:Depreciation and amortization 21,912 19,536 22,216Loss on extinguishment of debt 20,137 – 9,455Amortization of debt issuance costs 2,802 1,799 1,939Amortization of inventory step-up 13,900 – –Accretion of debt discount 40 75 126Non-cash stock-based compensation expense 1,824 377 323Non-cash closure costs 113 – 184(Gain) loss on disposal of assets (64) 164 61Tax benefit from exercise of stock options 6,590 3,807 –Deferred tax provision (benefit) 380 (3,143) 299Effect of changes in operating assets and liabilities
(net of assets acquired and liabilities assumed):Accounts receivable 275 (15,122) (11,718)Inventories 4,639 (16,032) 940Prepaid expenses and other assets 543 2,132 (2,258)Accounts payable 18,230 (3,983) (4,233)Other liabilities (1,256) 3,408 (106)
Net cash provided by operating activities 137,267 42,676 40,506Cash flows from investing activities:
Acquisition of OshKosh B’Gosh, Inc., net of cash acquired (309,984) – –Capital expenditures (22,588) (20,481) (17,347)Proceeds from sale of property, plant, and equipment 2,860 1,304 275Sale of investments 229,180 – –Purchase of investments (210,825) – –Collections on loan 2,954 600 600
Net cash used in investing activities (308,403) (18,577) (16,472)Cash flows from financing activities:
Payments on new term loan (69,968) – –Proceeds from new term loan 500,000 – –Proceeds from former revolving loan facility – 90,510 91,600Payments on former revolving loan facility – (90,510) (91,600)Payments on former term loan (71,326) (28,286) (24,138)Payment of 10.875% Senior Subordinated Notes (113,750) – (61,250)Payment of debt redemption premium (14,015) – (6,661)Payment of dividend – – (24,893)Payments of capital lease obligations – (164) (263)Proceeds from issuance of common stock,
net of offering costs – – 93,869Payments of debt issuance costs (10,780) – (799)Proceeds from exercise of stock options 1,986 1,555 –Proceeds from sale of common stock – – 600
Net cash provided by (used in) financing activities 222,147 (26,895) (23,535)
Net increase (decrease) in cash and cash equivalents 51,011 (2,796) 499Cash and cash equivalents at beginning of period 33,265 36,061 35,562Cash and cash equivalents at end of period $ 84,276 $ 33,265 $ 36,061
The accompanying notes are an integral part of the consolidated financial statements

2005 Annual Report 41
consolidatedstatements of
changes instockholders‘
equity
AccumulatedAdditional other Total
Common paid-in Deferred comprehensive Retained stockholders’dollars in thousands, except for share data stock capital compensation income earnings equity
Balance at December 28, 2002 $225 $147,043 $ – $ – $ 32,091 $179,359Sales and issuances of
common stock (45,975 shares) 1 805 806Public offering of common stock,
net of offering costs (5,390,625 shares) 54 93,815 93,869Compensation expense on
stock options 117 117Dividends (24,893) (24,893)Net income 23,278 23,278Balance at January 3, 2004 280 241,780 – – 30,476 272,536Tax benefit from exercise
of stock options 3,807 3,807Exercise of stock options
(444,057 shares) 4 1,551 1,555Compensation expense
on stock options 372 372Issuance of restricted
stock (3,035 shares) 100 (100)Amortization of
deferred compensation 5 5Net income 49,658 49,658Balance at January 1, 2005 284 247,610 (95) – 80,134 327,933Tax benefit from exercise
of stock options 6,590 6,590Exercise of stock options
(403,000 shares) 5 1,981 1,986Compensation expense on
stock options 725 725Compensation expense on
share grant (9,177 shares) 420 420Issuance of restricted
stock (65,100 shares) 3,088 (3,088)Amortization of deferred compensation 434 434Comprehensive income:Net income 47,202 47,202Unrealized gain on interest rate swap,
net of tax of $795 1,354 1,354Total comprehensive income – – – 1,354 47,202 48,556Balance at December 31, 2005 $289 $260,414 $(2,749) $ 1,354 $127,336 $386,644
The accompanying notes are an integral part of the consolidated financial statements
notes toconsolidated
financialstatements
42 Carter’s, Inc.
note 1: the companyOn September 30, 2003, Carter Holdings, Inc., a Massachusetts corporation, re-incorporated in Delaware andchanged its name by forming and subsequently merging with and into its new wholly-owned Delaware subsidiary.The surviving company is named Carter’s, Inc. In connection with the re-incorporation, Carter’s, Inc. effected a 4-for-1 split of its common stock.
On July 14, 2005, Carter’s, Inc., through its wholly-owned subsidiary, The William Carter Company (“TWCC”)acquired all of the outstanding common stock of OshKosh B’Gosh, Inc. (“OshKosh”) for a purchase price of $312.1 million, which included payment for vested stock options (the “Acquisition”). Established in 1895, OshKosh designs, sources, manufactures, and markets apparel for children sizes newborn to 16. The consoli-dated statement of operations for the fiscal year ended December 31, 2005 reflects the financial results ofOshKosh for the period from July 14, 2005 through December 31, 2005.
Carter’s, Inc., and its wholly-owned subsidiaries (collectively, the “Company,” “we,” “us,” “its,” and “our”) design,source, manufacture, and market branded childrenswear under the Carter’s, Child of Mine, Just One Year, OshKoshB’Gosh, and related labels. Our products are sourced through contractual arrangements with manufacturers world-wide and through production at a Company-managed sewing facility in Mexico for certain OshKosh brand products(see Note 15 regarding the closure of this facility). Products are manufactured for wholesale distribution to majordomestic retailers, including the mass channel, and for our 193 Carter’s brand and 142 OshKosh brand retail storesthat market our brand name merchandise and other licensed products manufactured by other companies.
As part of financing the Acquisition, the Company refinanced its existing debt (the “Refinancing”), including itssenior credit facility (“former senior credit facility”) and its $113.8 million 10.875% Senior Subordinated Notes due 2011 (together with the Acquisition, the “Transaction”).
Financing for the Transaction was provided by a new $500 million Term Loan B and a $125 million revolving creditfacility (including a sub-limit for letters of credit of $80 million, the “Revolver”) entered into by TWCC with Bank ofAmerica, N.A., as administrative agent, Credit Suisse, and certain other financial institutions (the “Senior CreditFacility,” see Note 5).
The proceeds of the financing were used to purchase the outstanding common stock and vested stock options ofOshKosh ($312.1 million), pay transaction expenses ($6.2 million), refinance the Company’s former senior creditfacility ($36.2 million), repurchase the Company’s 10.875% Senior Subordinated Notes ($113.8 million), pay aredemption premium on the Company’s 10.875% Senior Subordinated Notes ($14.0 million), along with accruedand unpaid interest ($5.1 million), and pay debt issuance costs ($10.6 million). Other Transaction expenses paidprior to and subsequent to the closing of the Transaction totaled $1.4 million, including $0.2 million in debtissuance costs.
As a result of the Refinancing, we wrote off $4.5 million in unamortized debt issuance costs related to the formersenior credit facility and 10.875% Senior Subordinated Notes and expensed $0.5 million related to the debtdiscount on the 10.875% Senior Subordinated Notes. Additionally, we expensed approximately $1.1 million ofdebt issuance costs associated with the Senior Credit Facility in accordance with Emerging Issues Task Force(“EITF”) No. 96-19, “Debtor’s Accounting for a Modification or Exchange of Debt Instruments.”
The Acquisition was accounted for under the purchase method of accounting. The purchase price for the Acquisition,including related fees and expenses, was allocated to the fair value of tangible and identifiable intangible assetsand liabilities acquired with the remainder allocated to goodwill.
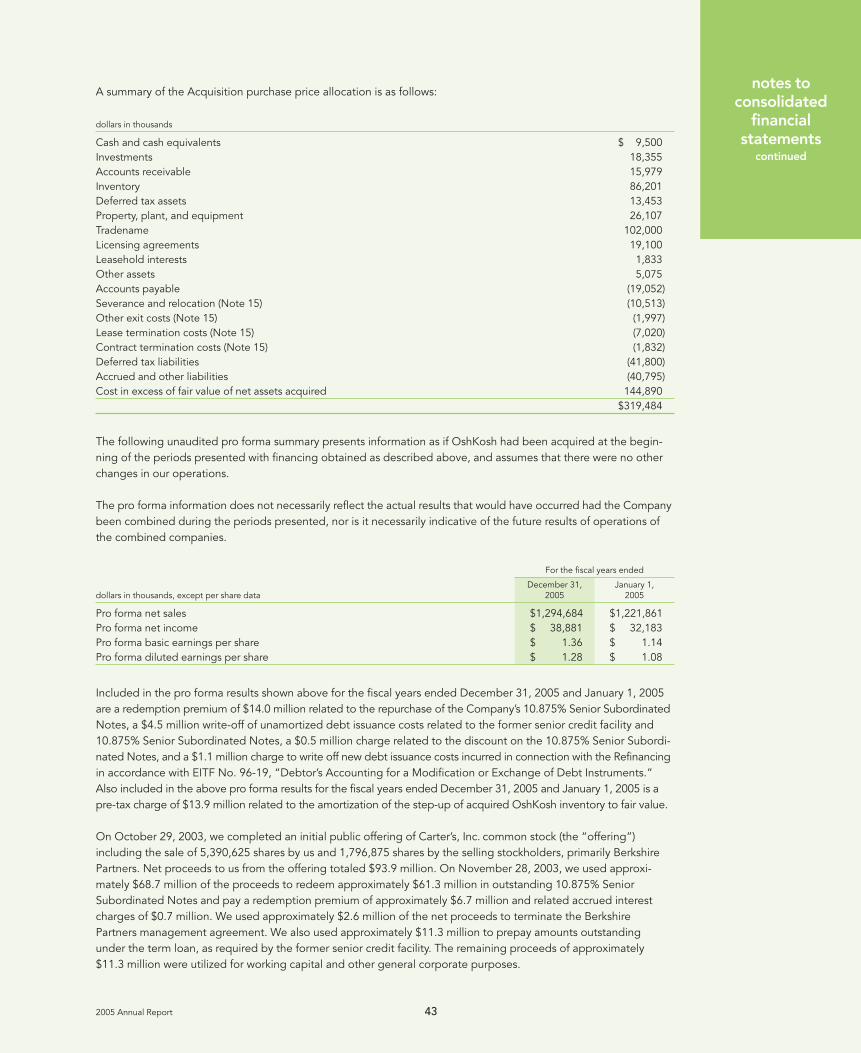
2005 Annual Report 43
notes toconsolidated
financialstatements
continued
A summary of the Acquisition purchase price allocation is as follows:
dollars in thousands
Cash and cash equivalents $ 9,500Investments 18,355Accounts receivable 15,979Inventory 86,201Deferred tax assets 13,453Property, plant, and equipment 26,107Tradename 102,000Licensing agreements 19,100Leasehold interests 1,833Other assets 5,075Accounts payable (19,052)Severance and relocation (Note 15) (10,513)Other exit costs (Note 15) (1,997)Lease termination costs (Note 15) (7,020)Contract termination costs (Note 15) (1,832)Deferred tax liabilities (41,800)Accrued and other liabilities (40,795)Cost in excess of fair value of net assets acquired 144,890
$319,484
The following unaudited pro forma summary presents information as if OshKosh had been acquired at the begin-ning of the periods presented with financing obtained as described above, and assumes that there were no otherchanges in our operations.
The pro forma information does not necessarily reflect the actual results that would have occurred had the Companybeen combined during the periods presented, nor is it necessarily indicative of the future results of operations ofthe combined companies.
For the fiscal years ended
December 31, January 1,dollars in thousands, except per share data 2005 2005
Pro forma net sales $1,294,684 $1,221,861Pro forma net income $ 38,881 $ 32,183Pro forma basic earnings per share $ 1.36 $ 1.14Pro forma diluted earnings per share $ 1.28 $ 1.08
Included in the pro forma results shown above for the fiscal years ended December 31, 2005 and January 1, 2005are a redemption premium of $14.0 million related to the repurchase of the Company’s 10.875% Senior SubordinatedNotes, a $4.5 million write-off of unamortized debt issuance costs related to the former senior credit facility and10.875% Senior Subordinated Notes, a $0.5 million charge related to the discount on the 10.875% Senior Subordi-nated Notes, and a $1.1 million charge to write off new debt issuance costs incurred in connection with the Refinancingin accordance with EITF No. 96-19, “Debtor’s Accounting for a Modification or Exchange of Debt Instruments.”Also included in the above pro forma results for the fiscal years ended December 31, 2005 and January 1, 2005 is apre-tax charge of $13.9 million related to the amortization of the step-up of acquired OshKosh inventory to fair value.
On October 29, 2003, we completed an initial public offering of Carter’s, Inc. common stock (the “offering”) including the sale of 5,390,625 shares by us and 1,796,875 shares by the selling stockholders, primarily BerkshirePartners. Net proceeds to us from the offering totaled $93.9 million. On November 28, 2003, we used approxi-mately $68.7 million of the proceeds to redeem approximately $61.3 million in outstanding 10.875% SeniorSubordinated Notes and pay a redemption premium of approximately $6.7 million and related accrued interestcharges of $0.7 million. We used approximately $2.6 million of the net proceeds to terminate the BerkshirePartners management agreement. We also used approximately $11.3 million to prepay amounts outstanding under the term loan, as required by the former senior credit facility. The remaining proceeds of approximately$11.3 million were utilized for working capital and other general corporate purposes.

notes toconsolidated
financialstatements
continued
44 Carter’s, Inc.
On July 12, 2001, a special purpose entity formed by Berkshire Partners entered into a stock purchase agreementwith Carter’s, Inc. and all of Carter’s, Inc. stockholders to acquire substantially all of the stock of Carter’s, Inc. exceptfor some equity interests held by our management (the “2001 Acquisition”). The Acquisition was consummated onAugust 15, 2001 and was accounted for under the purchase method of accounting.
note 2: summary of significant accounting policies
principles of consolidation
The accompanying consolidated financial statements include the accounts of Carter’s, Inc. and its wholly-ownedsubsidiaries. Total net assets (primarily property, plant, and equipment and inventory) at our international subsidiarieswere approximately $0.6 million at December 31, 2005 and $4.6 million at January 1, 2005. All intercompany transactions and balances have been eliminated in consolidation.
reclassifications
Certain prior year amounts have been reclassified for comparative purposes.
fiscal year
Our fiscal year ends on the Saturday in December or January nearest to the last day of December. The accompany-ing consolidated financial statements reflect our financial position as of December 31, 2005 and January 1, 2005and results of operations for the fiscal years ended December 31, 2005, January 1, 2005, and January 3, 2004. The fiscal years ended December 31, 2005 (fiscal 2005) and January 1, 2005 (fiscal 2004), each contain 52 weeks.The fiscal year ended January 3, 2004 (fiscal 2003) contains 53 weeks.
cash and cash equivalents
We consider all highly liquid investments that have original maturities of three months or less to be cash equivalents.We had cash deposits, in excess of deposit insurance limits, in ten banks at December 31, 2005 and three banks atJanuary 1, 2005.
accounts receivable
Approximately 81% of our gross accounts receivable at December 31, 2005 and 85% at January 1, 2005 were from our ten largest wholesale and mass channel customers. Of these customers, three have individual receivablebalances in excess of 10% of our gross accounts receivable (but not more than 19%) at December 31, 2005 andJanuary 1, 2005. Sales to these customers represent comparable percentages to total wholesale and mass channelnet sales. In fiscal 2005, two customers each accounted for 10% of our consolidated net sales.
Components of accounts receivable as of December 31, 2005 and January 1, 2005 are as follows:
December 31, January 1,dollars in thousands 2005 2005
Trade receivables, net $87,675 $76,939Royalties receivable 6,639 3,056Other 1,830 445
Total $96,144 $80,440
inventories
Inventories are stated at the lower of cost (first-in, first-out basis for wholesale and mass channel inventory andaverage cost for retail inventories) or market. We provide reserves for slow-moving inventory equal to the differ-ence between the cost of inventory and the estimated market value based upon assumptions about future demandand market conditions.
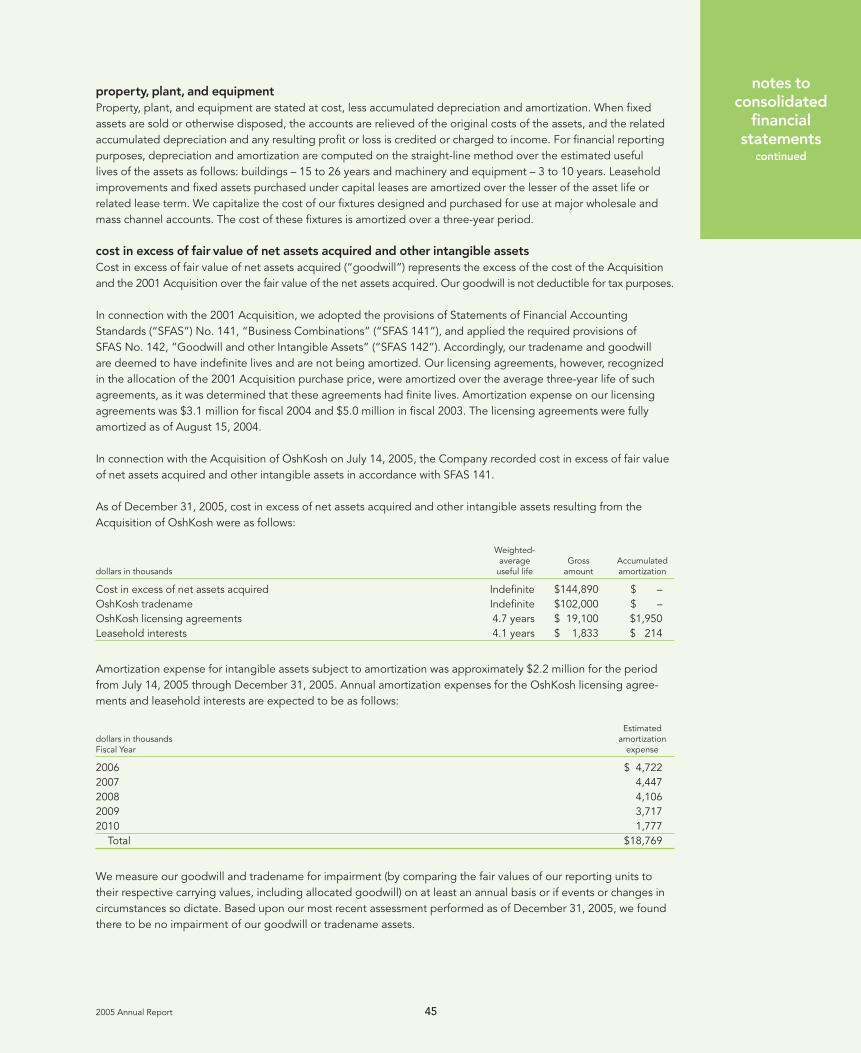
2005 Annual Report 45
property, plant, and equipment
Property, plant, and equipment are stated at cost, less accumulated depreciation and amortization. When fixedassets are sold or otherwise disposed, the accounts are relieved of the original costs of the assets, and the relatedaccumulated depreciation and any resulting profit or loss is credited or charged to income. For financial reportingpurposes, depreciation and amortization are computed on the straight-line method over the estimated useful lives of the assets as follows: buildings – 15 to 26 years and machinery and equipment – 3 to 10 years. Leaseholdimprovements and fixed assets purchased under capital leases are amortized over the lesser of the asset life orrelated lease term. We capitalize the cost of our fixtures designed and purchased for use at major wholesale andmass channel accounts. The cost of these fixtures is amortized over a three-year period.
cost in excess of fair value of net assets acquired and other intangible assets
Cost in excess of fair value of net assets acquired (“goodwill”) represents the excess of the cost of the Acquisitionand the 2001 Acquisition over the fair value of the net assets acquired. Our goodwill is not deductible for tax purposes.
In connection with the 2001 Acquisition, we adopted the provisions of Statements of Financial AccountingStandards (“SFAS”) No. 141, “Business Combinations” (“SFAS 141”), and applied the required provisions of SFAS No. 142, “Goodwill and other Intangible Assets” (“SFAS 142”). Accordingly, our tradename and goodwill are deemed to have indefinite lives and are not being amortized. Our licensing agreements, however, recognizedin the allocation of the 2001 Acquisition purchase price, were amortized over the average three-year life of suchagreements, as it was determined that these agreements had finite lives. Amortization expense on our licensingagreements was $3.1 million for fiscal 2004 and $5.0 million in fiscal 2003. The licensing agreements were fullyamortized as of August 15, 2004.
In connection with the Acquisition of OshKosh on July 14, 2005, the Company recorded cost in excess of fair valueof net assets acquired and other intangible assets in accordance with SFAS 141.
As of December 31, 2005, cost in excess of net assets acquired and other intangible assets resulting from theAcquisition of OshKosh were as follows:
Weighted-average Gross Accumulated
dollars in thousands useful life amount amortization
Cost in excess of net assets acquired Indefinite $144,890 $ –OshKosh tradename Indefinite $102,000 $ –OshKosh licensing agreements 4.7 years $ 19,100 $1,950Leasehold interests 4.1 years $ 1,833 $ 214
Amortization expense for intangible assets subject to amortization was approximately $2.2 million for the periodfrom July 14, 2005 through December 31, 2005. Annual amortization expenses for the OshKosh licensing agree-ments and leasehold interests are expected to be as follows:
Estimateddollars in thousands amortizationFiscal Year expense
2006 $ 4,7222007 4,4472008 4,1062009 3,7172010 1,777
Total $18,769
We measure our goodwill and tradename for impairment (by comparing the fair values of our reporting units totheir respective carrying values, including allocated goodwill) on at least an annual basis or if events or changes incircumstances so dictate. Based upon our most recent assessment performed as of December 31, 2005, we foundthere to be no impairment of our goodwill or tradename assets.
notes toconsolidated
financialstatements
continued
notes toconsolidated
financialstatements
continued
46 Carter’s, Inc.
impairment of other long-lived assets
We review other long-lived assets, including property, plant, and equipment and licensing agreements, for impair-ment whenever events or changes in circumstances indicate that the carrying amount of such an asset may not berecoverable. Management will determine whether there has been a permanent impairment on such assets held foruse in the business by comparing anticipated undiscounted future cash flows from the use and eventual dispositionof the asset or asset group to the carrying value of the asset. The amount of any resulting impairment will be calcu-lated by comparing the carrying value to fair value, which may be estimated using the present value of the samecash flows. Long-lived assets that meet the definition of held for sale are valued at the lower of carrying amount or fair value, less costs to sell.
deferred debt issuance costs
Debt issuance costs are deferred and amortized to interest expense using the straight-line method, which approxi-mates the effective interest method, over the lives of the related debt. Amortization approximated $2,802,000 forthe fiscal year ended December 31, 2005, $1,799,000 for the fiscal year ended January 1, 2005, and $1,939,000 for the fiscal year ended January 3, 2004.
cash flow hedges
On September 22, 2005, we entered into a swap agreement to receive floating rate interest and pay fixed rateinterest. This swap agreement is designated as a cash flow hedge of the variable interest payments on a portion of our variable rate Term Loan B debt. The unrealized gain, net of taxes, related to the interest rate swap was $1.4 million for the period from September 22, 2005 to December 31, 2005 and is included within accumulatedother comprehensive income on the accompanying consolidated balance sheet.
accumulated other comprehensive income
Accumulated other comprehensive income, shown as a component of stockholders’ equity on the accompanyingconsolidated balance sheet, reflects unrealized gains or losses on the Company’s interest rate swap, net of tax, whichare not included in the determination of net income. These unrealized gains and losses are recorded directly intoaccumulated other comprehensive income and are referred to as comprehensive income items.
revenue recognition
Revenues consist of sales to customers, net of returns, accommodations, deductions, and cooperative (“co-op”)advertising. We recognize wholesale and mass channel revenue after shipment of products to customers, when titlepasses and when all risks and rewards of ownership have transferred. In certain cases, in which we retain the risk ofloss during shipment, revenue recognition does not occur until the goods have reached the specified customer. Weconsider revenue realized or realizable and earned when the product has been shipped and when all risks and rewardsof ownership have transferred, the sales price is fixed or determinable, and collectibility is reasonably assured. In thenormal course of business, we grant certain accommodations and allowances to our wholesale and mass channelcustomers. We provide accommodations and allowances to our key wholesale and mass channel customers in orderto assist these customers with inventory clearance and promotions. Such amounts are reflected as a reduction of netsales and are recorded based on annual trends and annual forecasts. Retail store revenues are recognized at the pointof sale. We reduce revenue for customer returns and deductions. We also maintain an allowance for doubtful accountsfor estimated losses resulting from the inability of our customers to make payments and other actual and estimateddeductions. If the financial condition of our customers were to deteriorate, resulting in an impairment of their abilityto make payments, an additional allowance could be required. Past due balances over 90 days are reviewed indi-vidually for collectibility. Our credit and collections department reviews all other balances regularly. Account balancesare charged off against the allowance when we feel it is probable the receivable will not be recovered.
We contract with a third-party service to provide us with the fair value of co-op advertising arrangements entered intowith certain of our major wholesale and mass channel customers. Such fair value is determined based upon, amongother factors, comparable market analysis for similar advertisements. In accordance with Emerging Issues Task ForceIssue No. 01-09, “Accounting for Consideration Given by a Vendor to a Customer/Reseller” (“EITF 01-09”), we haveincluded the fair value of these arrangements of approximately $4.8 million in fiscal 2005 and $3.3 million in fiscal2004 as a component of selling, general, and administrative expenses on the accompanying consolidated state-ment of operations rather than as a reduction of revenue. Amounts determined to be in excess of fair value arerecorded as a reduction of revenue.
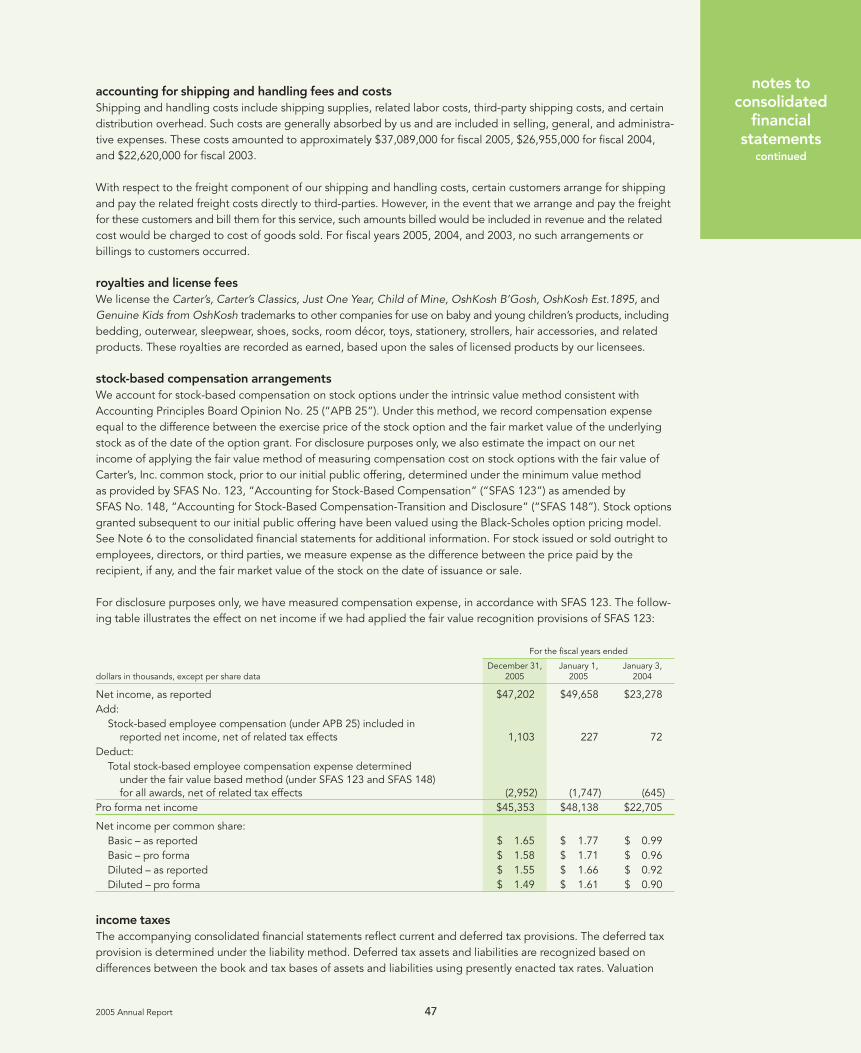
2005 Annual Report 47
notes toconsolidated
financialstatements
continued
accounting for shipping and handling fees and costs
Shipping and handling costs include shipping supplies, related labor costs, third-party shipping costs, and certaindistribution overhead. Such costs are generally absorbed by us and are included in selling, general, and administra-tive expenses. These costs amounted to approximately $37,089,000 for fiscal 2005, $26,955,000 for fiscal 2004,and $22,620,000 for fiscal 2003.
With respect to the freight component of our shipping and handling costs, certain customers arrange for shippingand pay the related freight costs directly to third-parties. However, in the event that we arrange and pay the freightfor these customers and bill them for this service, such amounts billed would be included in revenue and the relatedcost would be charged to cost of goods sold. For fiscal years 2005, 2004, and 2003, no such arrangements orbillings to customers occurred.
royalties and license fees
We license the Carter’s, Carter’s Classics, Just One Year, Child of Mine, OshKosh B’Gosh, OshKosh Est.1895, andGenuine Kids from OshKosh trademarks to other companies for use on baby and young children’s products, includingbedding, outerwear, sleepwear, shoes, socks, room décor, toys, stationery, strollers, hair accessories, and relatedproducts. These royalties are recorded as earned, based upon the sales of licensed products by our licensees.
stock-based compensation arrangements
We account for stock-based compensation on stock options under the intrinsic value method consistent withAccounting Principles Board Opinion No. 25 (“APB 25”). Under this method, we record compensation expenseequal to the difference between the exercise price of the stock option and the fair market value of the underlyingstock as of the date of the option grant. For disclosure purposes only, we also estimate the impact on our net income of applying the fair value method of measuring compensation cost on stock options with the fair value ofCarter’s, Inc. common stock, prior to our initial public offering, determined under the minimum value method as provided by SFAS No. 123, “Accounting for Stock-Based Compensation” (“SFAS 123”) as amended by SFAS No. 148, “Accounting for Stock-Based Compensation-Transition and Disclosure” (“SFAS 148”). Stock optionsgranted subsequent to our initial public offering have been valued using the Black-Scholes option pricing model.See Note 6 to the consolidated financial statements for additional information. For stock issued or sold outright toemployees, directors, or third parties, we measure expense as the difference between the price paid by the recipient, if any, and the fair market value of the stock on the date of issuance or sale.
For disclosure purposes only, we have measured compensation expense, in accordance with SFAS 123. The follow-ing table illustrates the effect on net income if we had applied the fair value recognition provisions of SFAS 123:
For the fiscal years ended
December 31, January 1, January 3,dollars in thousands, except per share data 2005 2005 2004
Net income, as reported $47,202 $49,658 $23,278Add:
Stock-based employee compensation (under APB 25) included in reported net income, net of related tax effects 1,103 227 72
Deduct:Total stock-based employee compensation expense determined
under the fair value based method (under SFAS 123 and SFAS 148) for all awards, net of related tax effects (2,952) (1,747) (645)
Pro forma net income $45,353 $48,138 $22,705
Net income per common share:Basic – as reported $ 1.65 $ 1.77 $ 0.99Basic – pro forma $ 1.58 $ 1.71 $ 0.96Diluted – as reported $ 1.55 $ 1.66 $ 0.92Diluted – pro forma $ 1.49 $ 1.61 $ 0.90
income taxes
The accompanying consolidated financial statements reflect current and deferred tax provisions. The deferred taxprovision is determined under the liability method. Deferred tax assets and liabilities are recognized based ondifferences between the book and tax bases of assets and liabilities using presently enacted tax rates. Valuation
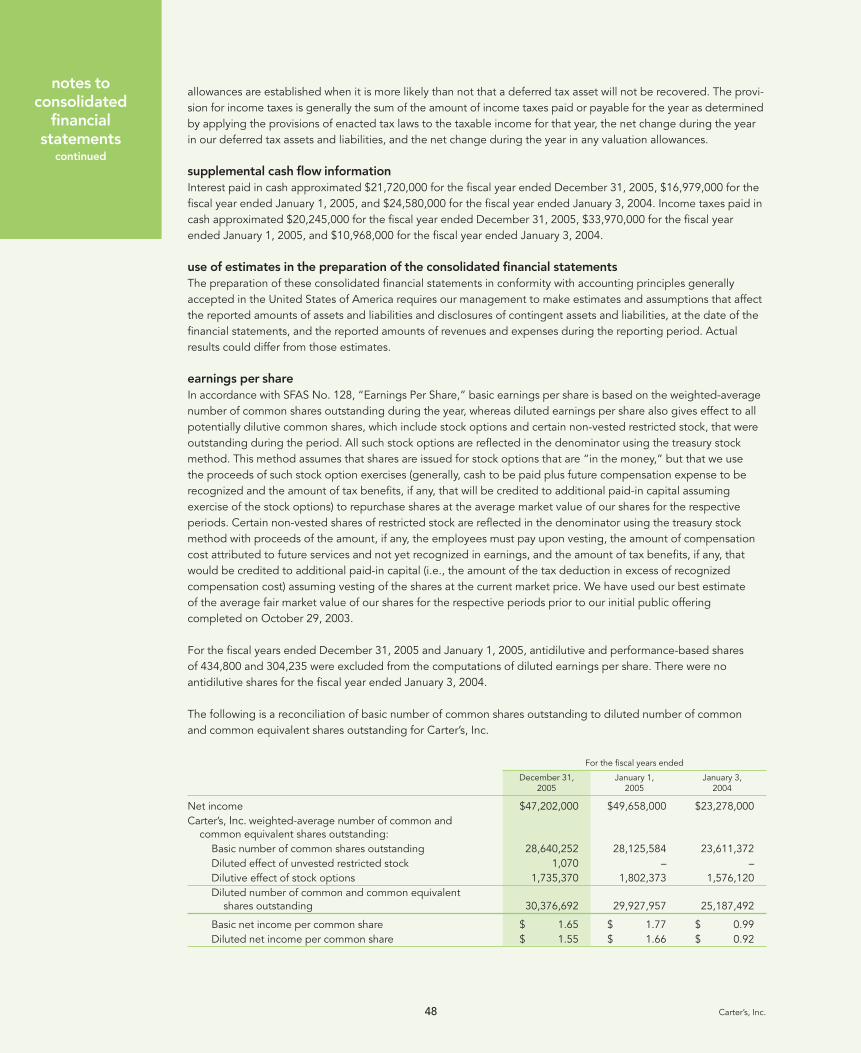
notes toconsolidated
financialstatements
continued
48 Carter’s, Inc.
allowances are established when it is more likely than not that a deferred tax asset will not be recovered. The provi-sion for income taxes is generally the sum of the amount of income taxes paid or payable for the year as determinedby applying the provisions of enacted tax laws to the taxable income for that year, the net change during the yearin our deferred tax assets and liabilities, and the net change during the year in any valuation allowances.
supplemental cash flow information
Interest paid in cash approximated $21,720,000 for the fiscal year ended December 31, 2005, $16,979,000 for thefiscal year ended January 1, 2005, and $24,580,000 for the fiscal year ended January 3, 2004. Income taxes paid incash approximated $20,245,000 for the fiscal year ended December 31, 2005, $33,970,000 for the fiscal yearended January 1, 2005, and $10,968,000 for the fiscal year ended January 3, 2004.
use of estimates in the preparation of the consolidated financial statements
The preparation of these consolidated financial statements in conformity with accounting principles generallyaccepted in the United States of America requires our management to make estimates and assumptions that affectthe reported amounts of assets and liabilities and disclosures of contingent assets and liabilities, at the date of thefinancial statements, and the reported amounts of revenues and expenses during the reporting period. Actualresults could differ from those estimates.
earnings per share
In accordance with SFAS No. 128, “Earnings Per Share,” basic earnings per share is based on the weighted-averagenumber of common shares outstanding during the year, whereas diluted earnings per share also gives effect to allpotentially dilutive common shares, which include stock options and certain non-vested restricted stock, that wereoutstanding during the period. All such stock options are reflected in the denominator using the treasury stockmethod. This method assumes that shares are issued for stock options that are “in the money,” but that we use the proceeds of such stock option exercises (generally, cash to be paid plus future compensation expense to berecognized and the amount of tax benefits, if any, that will be credited to additional paid-in capital assuming exercise of the stock options) to repurchase shares at the average market value of our shares for the respectiveperiods. Certain non-vested shares of restricted stock are reflected in the denominator using the treasury stockmethod with proceeds of the amount, if any, the employees must pay upon vesting, the amount of compensationcost attributed to future services and not yet recognized in earnings, and the amount of tax benefits, if any, thatwould be credited to additional paid-in capital (i.e., the amount of the tax deduction in excess of recognizedcompensation cost) assuming vesting of the shares at the current market price. We have used our best estimate of the average fair market value of our shares for the respective periods prior to our initial public offeringcompleted on October 29, 2003.
For the fiscal years ended December 31, 2005 and January 1, 2005, antidilutive and performance-based shares of 434,800 and 304,235 were excluded from the computations of diluted earnings per share. There were no antidilutive shares for the fiscal year ended January 3, 2004.
The following is a reconciliation of basic number of common shares outstanding to diluted number of common and common equivalent shares outstanding for Carter’s, Inc.
For the fiscal years ended
December 31, January 1, January 3,2005 2005 2004
Net income $47,202,000 $49,658,000 $23,278,000Carter’s, Inc. weighted-average number of common and
common equivalent shares outstanding:Basic number of common shares outstanding 28,640,252 28,125,584 23,611,372Diluted effect of unvested restricted stock 1,070 – –Dilutive effect of stock options 1,735,370 1,802,373 1,576,120Diluted number of common and common equivalent
shares outstanding 30,376,692 29,927,957 25,187,492
Basic net income per common share $ 1.65 $ 1.77 $ 0.99Diluted net income per common share $ 1.55 $ 1.66 $ 0.92
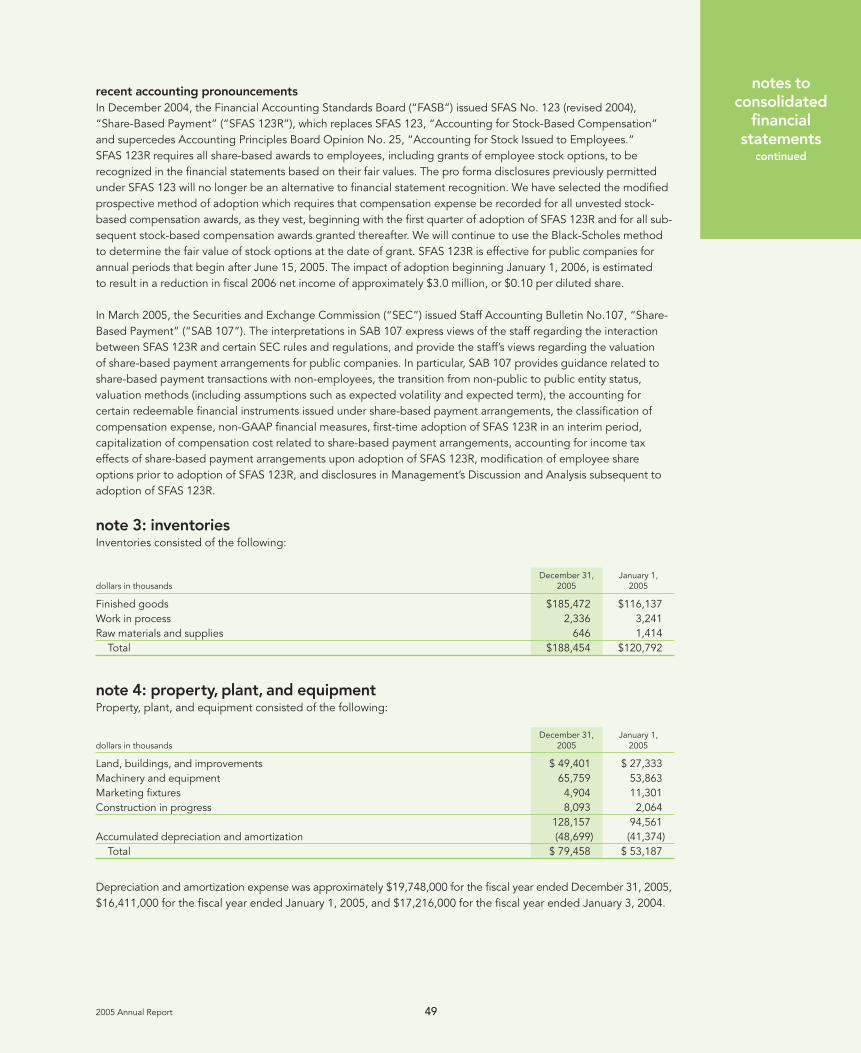
2005 Annual Report 49
notes toconsolidated
financialstatements
continued
recent accounting pronouncements
In December 2004, the Financial Accounting Standards Board (“FASB”) issued SFAS No. 123 (revised 2004),“Share-Based Payment” (“SFAS 123R”), which replaces SFAS 123, “Accounting for Stock-Based Compensation”and supercedes Accounting Principles Board Opinion No. 25, “Accounting for Stock Issued to Employees.” SFAS 123R requires all share-based awards to employees, including grants of employee stock options, to be recognized in the financial statements based on their fair values. The pro forma disclosures previously permittedunder SFAS 123 will no longer be an alternative to financial statement recognition. We have selected the modifiedprospective method of adoption which requires that compensation expense be recorded for all unvested stock-based compensation awards, as they vest, beginning with the first quarter of adoption of SFAS 123R and for all sub-sequent stock-based compensation awards granted thereafter. We will continue to use the Black-Scholes methodto determine the fair value of stock options at the date of grant. SFAS 123R is effective for public companies forannual periods that begin after June 15, 2005. The impact of adoption beginning January 1, 2006, is estimated to result in a reduction in fiscal 2006 net income of approximately $3.0 million, or $0.10 per diluted share.
In March 2005, the Securities and Exchange Commission (“SEC”) issued Staff Accounting Bulletin No.107, “Share-Based Payment” (“SAB 107”). The interpretations in SAB 107 express views of the staff regarding the interactionbetween SFAS 123R and certain SEC rules and regulations, and provide the staff’s views regarding the valuation of share-based payment arrangements for public companies. In particular, SAB 107 provides guidance related toshare-based payment transactions with non-employees, the transition from non-public to public entity status, valuation methods (including assumptions such as expected volatility and expected term), the accounting forcertain redeemable financial instruments issued under share-based payment arrangements, the classification ofcompensation expense, non-GAAP financial measures, first-time adoption of SFAS 123R in an interim period, capitalization of compensation cost related to share-based payment arrangements, accounting for income taxeffects of share-based payment arrangements upon adoption of SFAS 123R, modification of employee shareoptions prior to adoption of SFAS 123R, and disclosures in Management’s Discussion and Analysis subsequent toadoption of SFAS 123R.
note 3: inventoriesInventories consisted of the following:
December 31, January 1,dollars in thousands 2005 2005
Finished goods $185,472 $116,137Work in process 2,336 3,241Raw materials and supplies 646 1,414
Total $188,454 $120,792
note 4: property, plant, and equipmentProperty, plant, and equipment consisted of the following:
December 31, January 1,dollars in thousands 2005 2005
Land, buildings, and improvements $ 49,401 $ 27,333Machinery and equipment 65,759 53,863Marketing fixtures 4,904 11,301Construction in progress 8,093 2,064
128,157 94,561Accumulated depreciation and amortization (48,699) (41,374)
Total $ 79,458 $ 53,187
Depreciation and amortization expense was approximately $19,748,000 for the fiscal year ended December 31, 2005,$16,411,000 for the fiscal year ended January 1, 2005, and $17,216,000 for the fiscal year ended January 3, 2004.
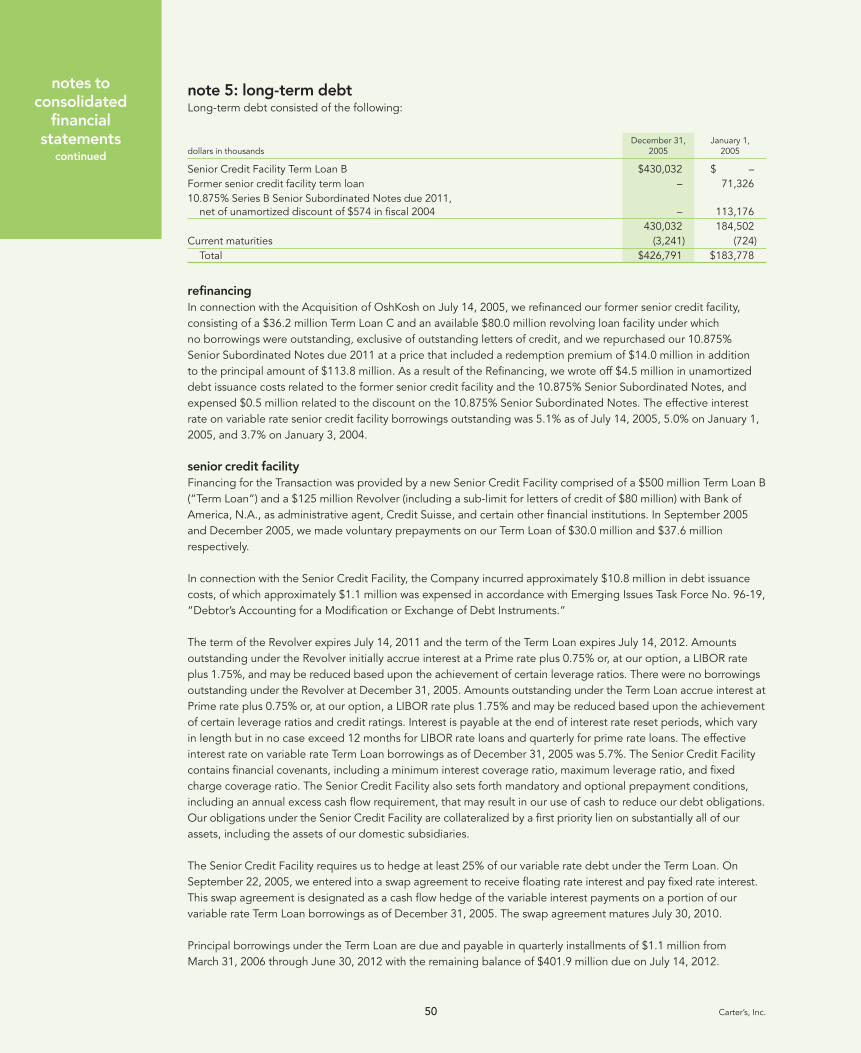
notes toconsolidated
financialstatements
continued
50 Carter’s, Inc.
note 5: long-term debtLong-term debt consisted of the following:
December 31, January 1,dollars in thousands 2005 2005
Senior Credit Facility Term Loan B $430,032 $ –Former senior credit facility term loan – 71,32610.875% Series B Senior Subordinated Notes due 2011,
net of unamortized discount of $574 in fiscal 2004 – 113,176430,032 184,502
Current maturities (3,241) (724)Total $426,791 $183,778
refinancing
In connection with the Acquisition of OshKosh on July 14, 2005, we refinanced our former senior credit facility,consisting of a $36.2 million Term Loan C and an available $80.0 million revolving loan facility under which no borrowings were outstanding, exclusive of outstanding letters of credit, and we repurchased our 10.875%Senior Subordinated Notes due 2011 at a price that included a redemption premium of $14.0 million in addition to the principal amount of $113.8 million. As a result of the Refinancing, we wrote off $4.5 million in unamortizeddebt issuance costs related to the former senior credit facility and the 10.875% Senior Subordinated Notes, andexpensed $0.5 million related to the discount on the 10.875% Senior Subordinated Notes. The effective interestrate on variable rate senior credit facility borrowings outstanding was 5.1% as of July 14, 2005, 5.0% on January 1,2005, and 3.7% on January 3, 2004.
senior credit facility
Financing for the Transaction was provided by a new Senior Credit Facility comprised of a $500 million Term Loan B(“Term Loan”) and a $125 million Revolver (including a sub-limit for letters of credit of $80 million) with Bank ofAmerica, N.A., as administrative agent, Credit Suisse, and certain other financial institutions. In September 2005and December 2005, we made voluntary prepayments on our Term Loan of $30.0 million and $37.6 million respectively.
In connection with the Senior Credit Facility, the Company incurred approximately $10.8 million in debt issuancecosts, of which approximately $1.1 million was expensed in accordance with Emerging Issues Task Force No. 96-19,“Debtor’s Accounting for a Modification or Exchange of Debt Instruments.”
The term of the Revolver expires July 14, 2011 and the term of the Term Loan expires July 14, 2012. Amountsoutstanding under the Revolver initially accrue interest at a Prime rate plus 0.75% or, at our option, a LIBOR rateplus 1.75%, and may be reduced based upon the achievement of certain leverage ratios. There were no borrowingsoutstanding under the Revolver at December 31, 2005. Amounts outstanding under the Term Loan accrue interest atPrime rate plus 0.75% or, at our option, a LIBOR rate plus 1.75% and may be reduced based upon the achievementof certain leverage ratios and credit ratings. Interest is payable at the end of interest rate reset periods, which varyin length but in no case exceed 12 months for LIBOR rate loans and quarterly for prime rate loans. The effectiveinterest rate on variable rate Term Loan borrowings as of December 31, 2005 was 5.7%. The Senior Credit Facilitycontains financial covenants, including a minimum interest coverage ratio, maximum leverage ratio, and fixedcharge coverage ratio. The Senior Credit Facility also sets forth mandatory and optional prepayment conditions,including an annual excess cash flow requirement, that may result in our use of cash to reduce our debt obligations.Our obligations under the Senior Credit Facility are collateralized by a first priority lien on substantially all of ourassets, including the assets of our domestic subsidiaries.
The Senior Credit Facility requires us to hedge at least 25% of our variable rate debt under the Term Loan. OnSeptember 22, 2005, we entered into a swap agreement to receive floating rate interest and pay fixed rate interest.This swap agreement is designated as a cash flow hedge of the variable interest payments on a portion of our variable rate Term Loan borrowings as of December 31, 2005. The swap agreement matures July 30, 2010.
Principal borrowings under the Term Loan are due and payable in quarterly installments of $1.1 million from March 31, 2006 through June 30, 2012 with the remaining balance of $401.9 million due on July 14, 2012.
2005 Annual Report 51
note 6: stockholders’ equityThe total amount of Carter’s, Inc. authorized capital stock consists of 40,000,000 shares of common stock, $0.01 par value per share, and 100,000 shares of preferred stock, $0.01 par value per share. As of December 31,2005, Carter’s, Inc. had outstanding 28,909,729 shares of common stock and no shares of preferred stock.
The issued and outstanding shares of common stock are validly issued, fully paid, and nonassessable. Holders ofCarter’s, Inc. common stock are entitled to share equally, share for share, if dividends are declared on Carter’s, Inc.common stock, whether payable in cash, property, or our securities. The shares of common stock are not convert-ible and the holders thereof have no preemptive or subscription rights to purchase any of our securities. Uponliquidation, dissolution, or winding up of our Company, the holders of common stock are entitled to share equally,share for share, in our assets that are legally available for distribution, after payment of all debts and other liabilitiesand subject to the prior rights of any holders of any series of preferred stock then outstanding. Each outstandingshare of common stock is entitled to one vote on all matters submitted to a vote of stockholders. There is no cumulative voting. Except as otherwise required by law or the certificate of incorporation, the holders of commonstock vote together as a single class on all matters submitted to a vote of stockholders.
Our Board of Directors may issue preferred stock from time to time. Subject to the provisions of our certificate ofincorporation and limitations prescribed by law, the Board of Directors is expressly authorized to adopt resolutionsto issue the shares, to fix the number of shares, to change the number of shares constituting any series, and toprovide for or change the voting powers, designations, preferences and relative participating, optional or otherspecial rights, qualifications, limitations or restrictions thereof, including dividend rights (including whether divi-dends are cumulative), dividend rates, terms of redemption (including sinking fund provisions), redemption prices,conversion rights, and liquidation preferences of the shares constituting any series of the preferred stock, in eachcase without any further action or vote by the shareholders.
stock option plans and stock issuances
At the time of the 2001 Acquisition, as described in Note 1 to the consolidated financial statements, we terminatedour existing Management Stock Incentive Plan (the “Former Plan”), which had been formed to provide incentivesto our employees and directors. All outstanding stock options under the Former Plan are subsequently covered bythe basic component of the 2001 Equity Incentive Plan, which was amended and restated on October 10, 2003 andrenamed as our 2003 Equity Incentive Plan (the “Plan”) described below, and expire on August 15, 2011. Stockoptions awarded under the Former Plan and retained by management after the Acquisition (“retained stockoptions”) entitle recipients to purchase Carter’s, Inc. common stock. The exercise price of all stock options grantedunder the Former Plan was $1.50 per share, which was deemed to be the fair market value of the stock at the timethe stock options were granted. Accordingly, no compensation expense was recognized on the stock optionsgranted. All stock options granted under the Former Plan vested immediately upon the 2001 Acquisition.
At the time of the 2001 Acquisition, we adopted the 2001 Equity Incentive Plan in order to provide incentives toour employees and directors. Awards under the 2001 Equity Incentive Plan provided recipients with options topurchase shares of Carter’s, Inc. common stock. There were 4,344,196 shares, as amended and described below, of Carter’s, Inc. common stock made available under the 2001 Equity Incentive Plan. Two types of stock optionawards were issued under the Plan — basic stock options and performance stock options. Basic stock options vest ratably over a five-year period, but immediately vest upon a change in control, as defined. Under the plan,performance stock options vest after eight years, but may vest earlier, either all or in part, upon our achievement of certain defined performance objectives as of approximately five years after the grant date or the occurrence ofone of several events, including a change of control, as defined, or termination of employment. Coincident withthe completion of a secondary offering of Carter’s, Inc. common stock in September 2004, certain performanceobjectives had been met and a determination event, as defined, had occurred. Accordingly, performance stockoptions now vest ratably over a five-year period from the grant date and are now classified as basic options, asthere are no longer any performance conditions tied to these awards.
notes toconsolidated
financialstatements
continued
notes toconsolidated
financialstatements
continued
52 Carter’s, Inc.
On October 10, 2003, we amended and restated the 2001 Equity Incentive Plan and renamed it the 2003 EquityIncentive Plan. Under the Plan, as amended, the compensation committee of our Board of Directors may awardincentive stock options (ISOs and non-ISOs), stock appreciation rights (SARs), restricted stock, unrestricted stock,stock deliverable on a deferred basis, performance-based stock awards, and cash payments intended to helpdefray the cost of awards. On May 12, 2005, our Board of Directors adopted, and the stockholders approved, anamendment to the plan to increase the number of shares available to be delivered under the plan by 1,400,000 to 5,744,196, with no more than 630,000 of such additional shares able to be used for awards other than stockoptions, and to reduce the number of shares for which stock options may be granted to any individual or which can be subject to SARs granted to any individual in any calendar year from 4,000,000 to 1,000,000. As ofDecember 31, 2005, there are 1,244,628 shares available for grant under the Plan. The amended and restated Plan makes provision for the treatment of awards upon termination of service or in the case of a merger or similarcorporate transaction. Participation in the amended and restated Plan is limited to those key employees and others who are selected by the compensation committee. The limit on shares available under the Plan, the individual limits, and other award terms are subject to adjustment to reflect stock splits or stock dividends, combinations, and certain other events.
With the exception of certain performance stock options issued during fiscal 2005, discussed below, the number of shares and the exercise price per share are known at the time of grant, and basic stock options and retainedstock options qualify for fixed plan accounting. All stock options issued under the Plan expire ten years from thedate of grant. The exercise price of the basic options issued at the time of the 2001 Acquisition was $6.16 pershare, which was deemed to be the fair market value of Carter’s, Inc. common stock at the time the stock options were granted, based upon the purchase price of common stock in the 2001 Acquisition. These were the only stock options granted during fiscal 2001.
In fiscal 2002, we issued 117,000 stock options and recognized approximately $14,500 in compensation expenserelated to these stock option grants, based upon the difference in the estimated fair value of Carter’s, Inc. commonstock at the time the stock options were granted and the exercise price. During fiscal 2002, we also sold shares ofCarter’s, Inc. common stock to two of our directors and issued shares of Carter’s, Inc. common stock to a consultant.
In fiscal 2003, we issued 398,000 stock options, 321,200 of which were issued at an exercise price that was belowthe fair value at the date of grant. In connection with these issuances, we recognized approximately $116,800 incompensation expense based upon the difference in the estimated fair value of Carter’s, Inc. common stock at thetime the stock options were granted and the exercise price. The weighted-average exercise price and weighted-average fair value for the stock options issued below fair value were $13.95 and $19.00, respectively. For theremaining stock options issued during fiscal 2003, for which the exercise price was equal to the fair value, theweighted-average exercise price and weighted-average fair value were $9.88. During fiscal 2003, we also soldshares of Carter’s, Inc. common stock to two of our directors for cash proceeds of $600,000. In connection withthese transactions, as well as the stock option grants to certain employees, we recorded compensation expense of $206,000 and additional paid-in capital in the amount of $600,000.
In fiscal 2004, we issued 396,200 stock options to purchase Carter’s, Inc. common stock to certain employees. No compensation expense was recorded during fiscal 2004 as a result of stock options granted during that period, as the stock options were issued as of the date of grant with an exercise price equal to the fair market value of a share of stock. The weighted-average exercise price and weighted-average fair value were $29.47.During fiscal 2004, certain employees exercised 444,057 stock options for cash proceeds to the Company ofapproximately $1.6 million.
2005 Annual Report 53
In fiscal 2004, we issued 3,035 shares of restricted stock to one of our directors on November 4, 2004 with a fairmarket value of $32.95 on the date of the grant. We received no proceeds from the issuance of restricted stock. In connection with this issuance, we recognized $5,000 in compensation expense in fiscal 2004 and $33,000 incompensation expense in fiscal 2005. These restricted shares vest over 3 years.
In fiscal 2005, we issued 143,200 stock options to purchase Carter’s, Inc. common stock to certain employees. Nocompensation expense was recorded during fiscal 2005 as a result of issuing these stock options, as the stock optionswere issued as of the date of grant with an exercise price equal to the fair market value of a share of Carter’s, Inc.common stock. The weighted-average exercise price and weighted-average fair value of these stock options were$49.80. During fiscal 2005, certain employees exercised stock options for cash proceeds to the Company ofapproximately $2.0 million. None of the options issued during fiscal 2005 were exercisable at December 31, 2005.
During the second quarter of fiscal 2005, we approved the grant of 200,000 options to purchase Carter’s, Inc.common stock to our Chief Executive Officer at an exercise price equal to the fair market value of Carter’s, Inc.common stock at the date of grant. Vesting of these stock options is contingent upon meeting specific perfor-mance targets through fiscal 2008. If such performance targets are not achieved, the stock options will not vest.Currently, management believes that these performance targets will be achieved. Accordingly, under variable stockoption accounting treatment, we have recognized approximately $475,000 of compensation expense during fiscal2005 for this stock option grant.
During the fourth quarter of fiscal 2005, we approved the grant of 100,000 options to purchase Carter’s, Inc.common stock to our President at an exercise price equal to the fair market value of Carter’s, Inc. common stock atthe date of grant. Vesting of these stock options is contingent upon meeting specific performance targets throughfiscal 2009. If such performance targets are not achieved, the stock options will not vest. Currently, managementbelieves that these performance targets will be achieved. Accordingly, under variable stock option accountingtreatment, we have not recognized any compensation expense during fiscal 2005 for this stock option grant as thefair market value of Carter’s, Inc. common stock as of December 31, 2005 did not exceed the grant date price.
In fiscal 2005, we issued 65,100 restricted shares of Carter’s, Inc. common stock to employees. Of the 65,100restricted shares issued, 6,000 shares were issued when the fair market value of Carter’s, Inc. common stock was$45.25, 40,000 shares were issued when the fair market value was $44.01, 8,500 shares were issued when the fairmarket value was $62.85, 10,000 shares were issued when the fair market value was $52.46, and 600 shares wereissued when the fair market value was $64.10. We received no proceeds from the issuances of restricted stock.Forty-thousand of these restricted shares cliff-vest four years following the date of grant. The remainder of therestricted shares vest in equal annual installments over a period of four years following the date of grant. In con-nection with these issuances, we recognized approximately $401,000 in compensation expense during fiscal 2005.
During the second quarter of fiscal 2005, we issued 9,177 shares of Carter’s, Inc. common stock to our non-management directors. The fair market value of Carter’s, Inc. common stock at the time of issuance was $45.75.Accordingly, we recognized $420,000 in compensation expense in fiscal 2005. We received no proceeds from theissuance of these shares.
notes toconsolidated
financialstatements
continued

notes toconsolidated
financialstatements
continued
54 Carter’s, Inc.
A summary of stock option activity under this Plan (in number of shares that may be purchased) is as follows (including options retained by management, which were all originally issued under the Former Plan):
Weighted- Weighted- Weighted-average average average
Basic exercise Performance exercise Retained exercisestock price stock price stock price
options per share options per share options per share
Outstanding,December 28, 2002 2,108,812 $ 6.19 – $ – 1,379,620 $1.50
Granted 398,000 $13.16 – $ – – $ –Exercised – $ – – $ – – $ –Forfeited (52,000) $ 6.16 – $ – – $ –Expired – $ – – $ – – $ –Outstanding,
January 3, 2004 2,454,812 $ 7.33 – $ – 1,379,620 $1.50Granted 396,200 $29.47 – $ – – $ –Exercised (187,471) $ 6.24 – $ – (256,585) $1.50Forfeited (113,677) $ 8.05 – $ – – $ –Expired – $ – – $ – – $ –Outstanding,
January 1, 2005 2,549,864 $10.81 – $ – 1,123,035 $1.50Granted 143,200 $49.80 300,000 $50.12 – $ –Exercised (134,100) $11.80 – $ – (268,900) $1.50Forfeited (136,900) $21.76 – $ – – $ –Expired – $ – – $ – – $ –Outstanding,
December 31, 2005 2,422,064 $12.45 300,000 $50.12 854,135 $1.50
Exercisable,December 31, 2005 1,496,841 $ 7.54 – $ – 854,135 $1.50
Retained stock options relate to stock options that were outstanding prior to the 2001 Acquisition and became fullyvested in connection with the 2001 Acquisition.
A summary of basic stock options outstanding and exercisable at December 31, 2005 is as follows:
Outstanding Exercisable
Weighted- Weighted- Weighted-average average average
Range of remaining exercise exerciseexercise prices Number contractual life price Number price
$ 6 – $10 1,789,484 5.78 years $ 6.30 1,372,241 $ 6.23$13 – $14 175,680 7.71 years $13.95 61,360 $13.95$27 – $33 316,200 8.35 years $29.73 63,240 $29.73$44 – $53 120,000 9.55 years $47.63 – $ –$62 – $65 20,700 9.60 years $62.92 – $ –
2,422,064 6.47 years $12.45 1,496,841 $ 7.54
A summary of performance stock options outstanding and exercisable at December 31, 2005 is as follows:
Outstanding Exercisable
Weighted- Weighted- Weighted-average average average
Range of remaining exercise exerciseexercise prices Number contractual life price Number price
$44 – $63 300,000 9.53 years $50.12 – $ –
There were 854,135 retained stock options outstanding and exercisable as of December 31, 2005 with a weighted-average exercise price of $1.50 and weighted-average contractual life of 5.63 years.
2005 Annual Report 55
notes toconsolidated
financialstatements
continued
The weighted-average contractual life for the retained and basic stock options in aggregate as of December 31, 2005is approximately 6.53 years.
For disclosure purposes only, we have measured compensation expense, in accordance with SFAS 123, “Accountingfor Stock-Based Compensation.” The following table illustrates the effect on net income if we had applied the fairvalue recognition provisions of SFAS 123:
For the fiscal years ended
December 31, January 1, January 3,dollars in thousands, except per share data 2005 2005 2004
Net income, as reported $47,202 $49,658 $23,278Add:
Stock-based employee compensation (under APB 25) included in reported net income, net of related tax effects 1,103 227 72
Deduct:Total stock-based employee compensation expense determined under
the fair value based method (under SFAS 123 and SFAS 148) for all awards, net of related tax effects (2,952) (1,747) (645)
Pro forma net income $45,353 $48,138 $22,705
Net income per common share:Basic – as reported $ 1.65 $ 1.77 $ 0.99Basic – pro forma $ 1.58 $ 1.71 $ 0.96Diluted – as reported $ 1.55 $ 1.66 $ 0.92Diluted – pro forma $ 1.49 $ 1.61 $ 0.90
For basic stock options, using a minimum value method, the fair value of each stock option as of the date of grantwas estimated to range from $3.08 to $9.76 per share for stock options granted in fiscal 2003, and $2.44 to $3.95 pershare for stock options granted in fiscal 2002. For basic stock options, using the Black-Scholes method, the fair valueof each stock option at the date of the grant was estimated to range from $17.42 to $26.14 per share for stock optionsgranted in fiscal 2005, $12.67 to $15.41 per share for stock options granted in fiscal 2004, $6.40 to $13.55 per sharefor stock options granted in fiscal 2003, and $6.31 per share for stock options granted from August 23, 2002 toDecember 28, 2002.
For performance stock options, using the Black-Scholes method, the fair value of each stock option at the date ofgrant has been estimated to range from $15.51 to $22.56 per share for stock options granted in fiscal 2005.
We have determined that the effect on pro forma net income would have been immaterial had compensationexpense for our stock option grants, for periods prior to our initial public offering calculated using the minimumvalue method, been determined based on the fair value method as of the grant date using the Black-Scholesoption pricing model.
The fair value of options granted subsequent to August 23, 2002 was estimated at the date of grant using theBlack-Scholes method with the following weighted-average assumptions:
For the fiscal years ended
December 31, January 1, January 3,2005 2005 2004
Volatility 38.33% 36.80% 49.58%Risk-free interest rate 4.06% 3.66% 4.03%Expected lives (years) 4 7 10Dividend yield – – –
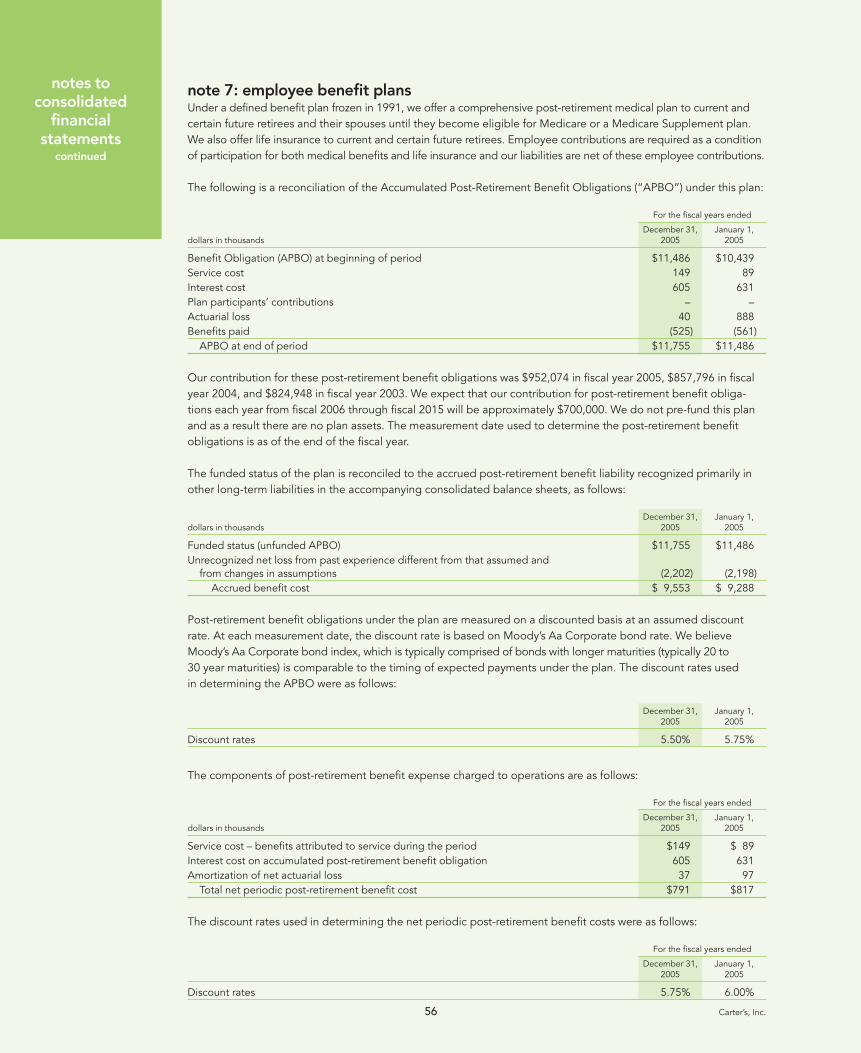
notes toconsolidated
financialstatements
continued
56 Carter’s, Inc.
note 7: employee benefit plansUnder a defined benefit plan frozen in 1991, we offer a comprehensive post-retirement medical plan to current andcertain future retirees and their spouses until they become eligible for Medicare or a Medicare Supplement plan.We also offer life insurance to current and certain future retirees. Employee contributions are required as a conditionof participation for both medical benefits and life insurance and our liabilities are net of these employee contributions.
The following is a reconciliation of the Accumulated Post-Retirement Benefit Obligations (“APBO”) under this plan:
For the fiscal years ended
December 31, January 1,dollars in thousands 2005 2005
Benefit Obligation (APBO) at beginning of period $11,486 $10,439Service cost 149 89Interest cost 605 631Plan participants’ contributions – –Actuarial loss 40 888Benefits paid (525) (561)
APBO at end of period $11,755 $11,486
Our contribution for these post-retirement benefit obligations was $952,074 in fiscal year 2005, $857,796 in fiscalyear 2004, and $824,948 in fiscal year 2003. We expect that our contribution for post-retirement benefit obliga-tions each year from fiscal 2006 through fiscal 2015 will be approximately $700,000. We do not pre-fund this planand as a result there are no plan assets. The measurement date used to determine the post-retirement benefit obligations is as of the end of the fiscal year.
The funded status of the plan is reconciled to the accrued post-retirement benefit liability recognized primarily inother long-term liabilities in the accompanying consolidated balance sheets, as follows:
December 31, January 1,dollars in thousands 2005 2005
Funded status (unfunded APBO) $11,755 $11,486Unrecognized net loss from past experience different from that assumed and
from changes in assumptions (2,202) (2,198)Accrued benefit cost $ 9,553 $ 9,288
Post-retirement benefit obligations under the plan are measured on a discounted basis at an assumed discountrate. At each measurement date, the discount rate is based on Moody’s Aa Corporate bond rate. We believeMoody’s Aa Corporate bond index, which is typically comprised of bonds with longer maturities (typically 20 to 30 year maturities) is comparable to the timing of expected payments under the plan. The discount rates used in determining the APBO were as follows:
December 31, January 1,2005 2005
Discount rates 5.50% 5.75%
The components of post-retirement benefit expense charged to operations are as follows:
For the fiscal years ended
December 31, January 1,dollars in thousands 2005 2005
Service cost – benefits attributed to service during the period $149 $ 89Interest cost on accumulated post-retirement benefit obligation 605 631Amortization of net actuarial loss 37 97
Total net periodic post-retirement benefit cost $791 $817
The discount rates used in determining the net periodic post-retirement benefit costs were as follows:
For the fiscal years ended
December 31, January 1,2005 2005
Discount rates 5.75% 6.00%
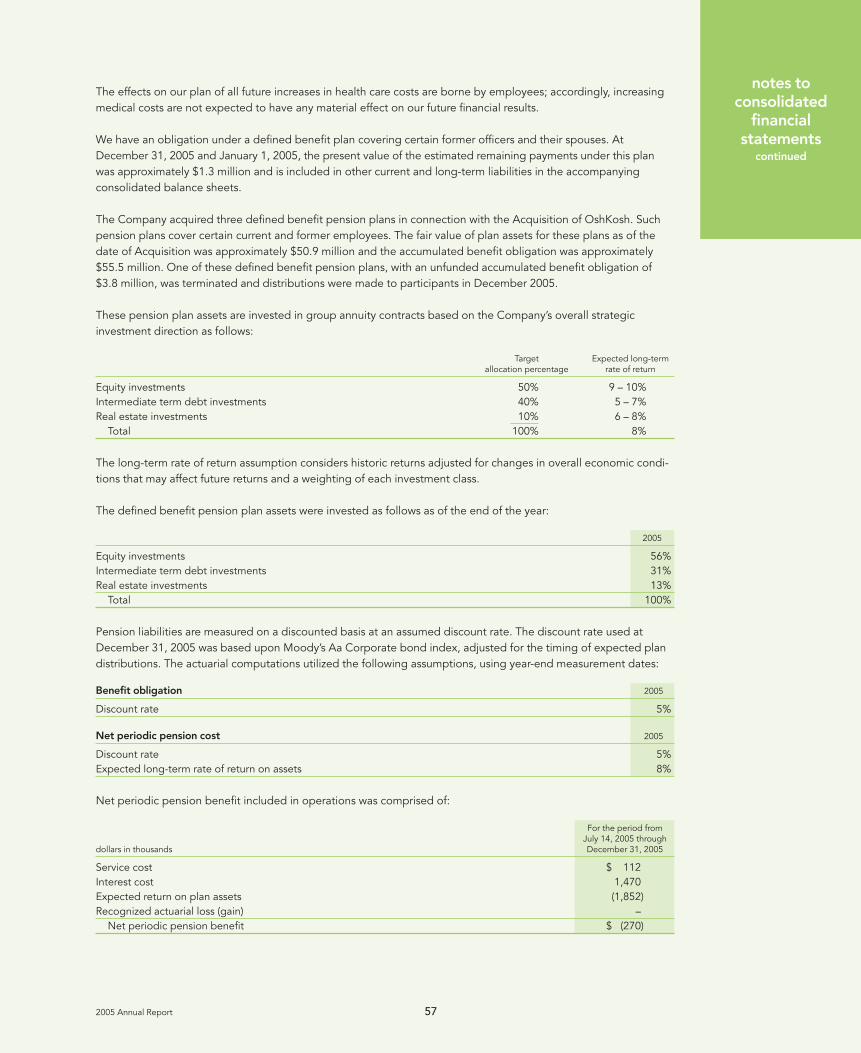
2005 Annual Report 57
notes toconsolidated
financialstatements
continued
The effects on our plan of all future increases in health care costs are borne by employees; accordingly, increasingmedical costs are not expected to have any material effect on our future financial results.
We have an obligation under a defined benefit plan covering certain former officers and their spouses. AtDecember 31, 2005 and January 1, 2005, the present value of the estimated remaining payments under this planwas approximately $1.3 million and is included in other current and long-term liabilities in the accompanyingconsolidated balance sheets.
The Company acquired three defined benefit pension plans in connection with the Acquisition of OshKosh. Suchpension plans cover certain current and former employees. The fair value of plan assets for these plans as of thedate of Acquisition was approximately $50.9 million and the accumulated benefit obligation was approximately$55.5 million. One of these defined benefit pension plans, with an unfunded accumulated benefit obligation of$3.8 million, was terminated and distributions were made to participants in December 2005.
These pension plan assets are invested in group annuity contracts based on the Company’s overall strategic investment direction as follows:
Target Expected long-termallocation percentage rate of return
Equity investments 50% 9 – 10%Intermediate term debt investments 40% 5 – 7%Real estate investments 10% 6 – 8%
Total 100% 8%
The long-term rate of return assumption considers historic returns adjusted for changes in overall economic condi-tions that may affect future returns and a weighting of each investment class.
The defined benefit pension plan assets were invested as follows as of the end of the year:
2005
Equity investments 56%Intermediate term debt investments 31%Real estate investments 13%
Total 100%
Pension liabilities are measured on a discounted basis at an assumed discount rate. The discount rate used atDecember 31, 2005 was based upon Moody’s Aa Corporate bond index, adjusted for the timing of expected plandistributions. The actuarial computations utilized the following assumptions, using year-end measurement dates:
Benefit obligation 2005
Discount rate 5%
Net periodic pension cost 2005
Discount rate 5%Expected long-term rate of return on assets 8%
Net periodic pension benefit included in operations was comprised of:
For the period fromJuly 14, 2005 through
dollars in thousands December 31, 2005
Service cost $ 112Interest cost 1,470Expected return on plan assets (1,852)Recognized actuarial loss (gain) –
Net periodic pension benefit $ (270)
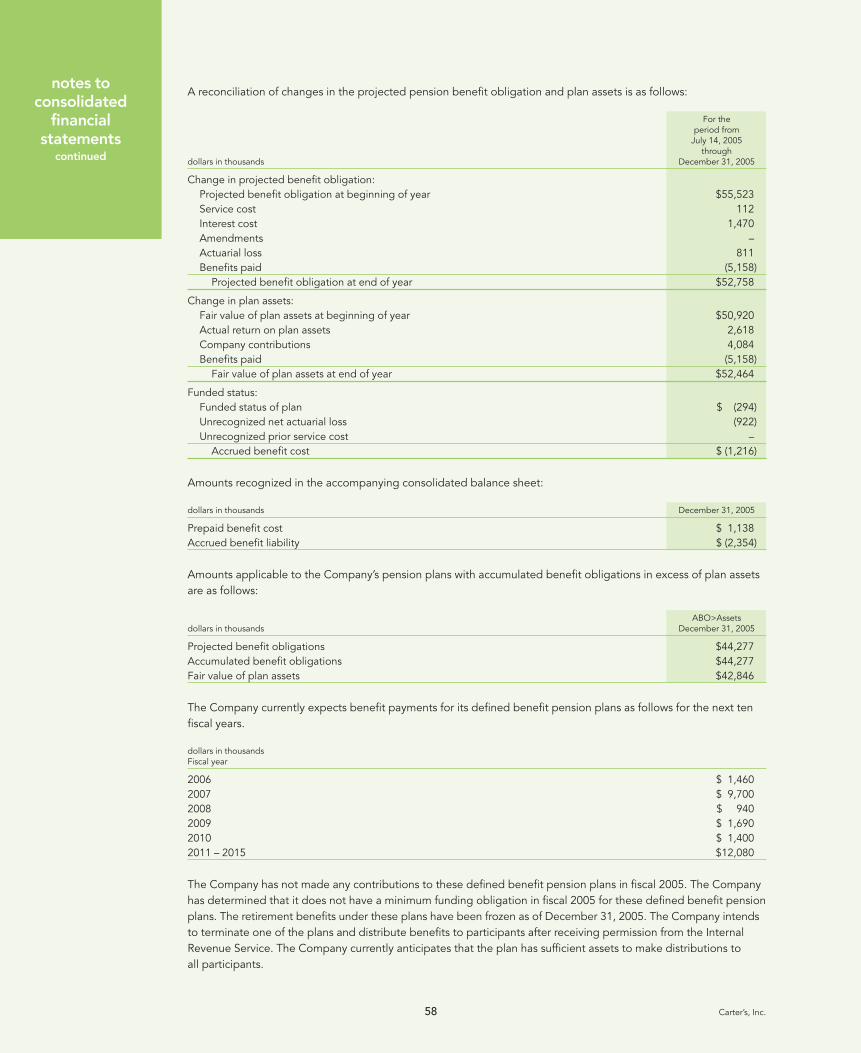
notes toconsolidated
financialstatements
continued
58 Carter’s, Inc.
A reconciliation of changes in the projected pension benefit obligation and plan assets is as follows:
For theperiod from
July 14, 2005through
dollars in thousands December 31, 2005
Change in projected benefit obligation:Projected benefit obligation at beginning of year $55,523Service cost 112Interest cost 1,470Amendments –Actuarial loss 811Benefits paid (5,158)
Projected benefit obligation at end of year $52,758
Change in plan assets:Fair value of plan assets at beginning of year $50,920Actual return on plan assets 2,618Company contributions 4,084Benefits paid (5,158)
Fair value of plan assets at end of year $52,464
Funded status:Funded status of plan $ (294)Unrecognized net actuarial loss (922)Unrecognized prior service cost –
Accrued benefit cost $ (1,216)
Amounts recognized in the accompanying consolidated balance sheet:
dollars in thousands December 31, 2005
Prepaid benefit cost $ 1,138Accrued benefit liability $ (2,354)
Amounts applicable to the Company’s pension plans with accumulated benefit obligations in excess of plan assetsare as follows:
ABO>Assetsdollars in thousands December 31, 2005
Projected benefit obligations $44,277Accumulated benefit obligations $44,277Fair value of plan assets $42,846
The Company currently expects benefit payments for its defined benefit pension plans as follows for the next tenfiscal years.
dollars in thousandsFiscal year
2006 $ 1,4602007 $ 9,7002008 $ 9402009 $ 1,6902010 $ 1,4002011 – 2015 $12,080
The Company has not made any contributions to these defined benefit pension plans in fiscal 2005. The Companyhas determined that it does not have a minimum funding obligation in fiscal 2005 for these defined benefit pensionplans. The retirement benefits under these plans have been frozen as of December 31, 2005. The Company intendsto terminate one of the plans and distribute benefits to participants after receiving permission from the InternalRevenue Service. The Company currently anticipates that the plan has sufficient assets to make distributions to all participants.
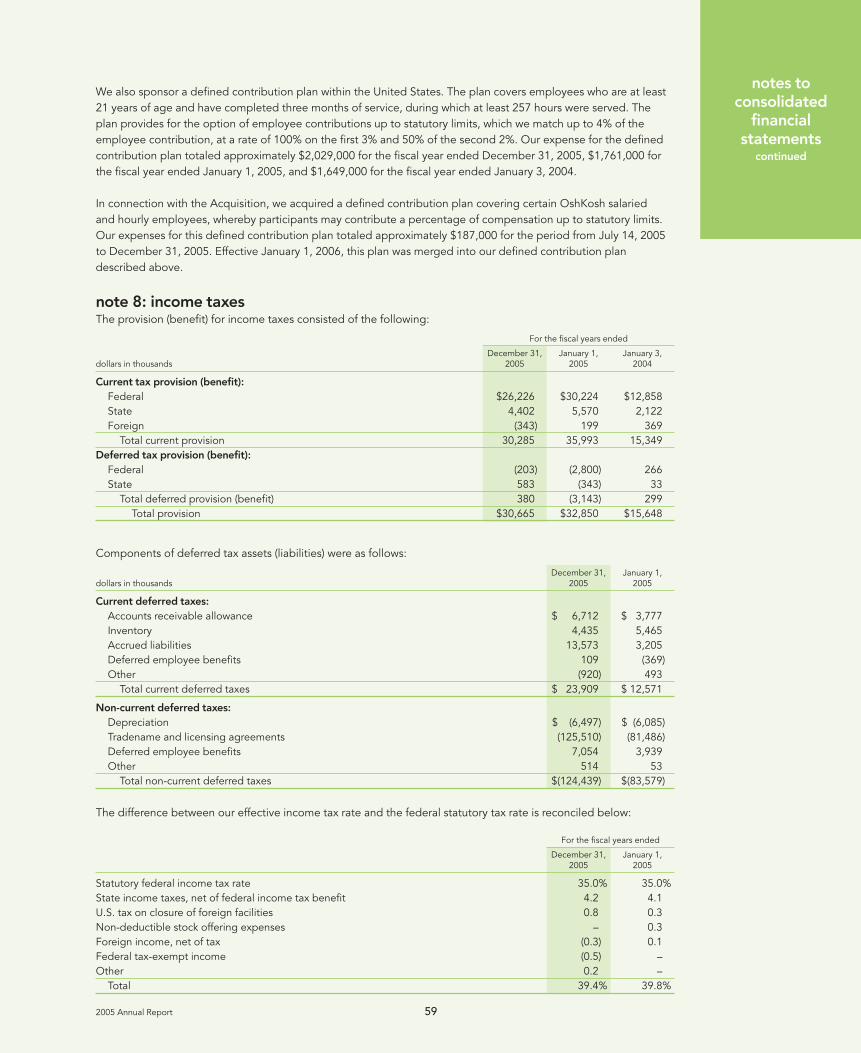
2005 Annual Report 59
notes toconsolidated
financialstatements
continued
We also sponsor a defined contribution plan within the United States. The plan covers employees who are at least21 years of age and have completed three months of service, during which at least 257 hours were served. Theplan provides for the option of employee contributions up to statutory limits, which we match up to 4% of theemployee contribution, at a rate of 100% on the first 3% and 50% of the second 2%. Our expense for the definedcontribution plan totaled approximately $2,029,000 for the fiscal year ended December 31, 2005, $1,761,000 forthe fiscal year ended January 1, 2005, and $1,649,000 for the fiscal year ended January 3, 2004.
In connection with the Acquisition, we acquired a defined contribution plan covering certain OshKosh salaried and hourly employees, whereby participants may contribute a percentage of compensation up to statutory limits.Our expenses for this defined contribution plan totaled approximately $187,000 for the period from July 14, 2005to December 31, 2005. Effective January 1, 2006, this plan was merged into our defined contribution plandescribed above.
note 8: income taxesThe provision (benefit) for income taxes consisted of the following:
For the fiscal years ended
December 31, January 1, January 3,dollars in thousands 2005 2005 2004
Current tax provision (benefit):
Federal $26,226 $30,224 $12,858State 4,402 5,570 2,122Foreign (343) 199 369
Total current provision 30,285 35,993 15,349Deferred tax provision (benefit):
Federal (203) (2,800) 266State 583 (343) 33
Total deferred provision (benefit) 380 (3,143) 299Total provision $30,665 $32,850 $15,648
Components of deferred tax assets (liabilities) were as follows:
December 31, January 1,dollars in thousands 2005 2005
Current deferred taxes:
Accounts receivable allowance $ 6,712 $ 3,777Inventory 4,435 5,465Accrued liabilities 13,573 3,205Deferred employee benefits 109 (369)Other (920) 493
Total current deferred taxes $ 23,909 $ 12,571
Non-current deferred taxes:
Depreciation $ (6,497) $ (6,085)Tradename and licensing agreements (125,510) (81,486)Deferred employee benefits 7,054 3,939Other 514 53
Total non-current deferred taxes $(124,439) $(83,579)
The difference between our effective income tax rate and the federal statutory tax rate is reconciled below:
For the fiscal years ended
December 31, January 1,2005 2005
Statutory federal income tax rate 35.0% 35.0%State income taxes, net of federal income tax benefit 4.2 4.1U.S. tax on closure of foreign facilities 0.8 0.3Non-deductible stock offering expenses – 0.3Foreign income, net of tax (0.3) 0.1Federal tax-exempt income (0.5) –Other 0.2 –
Total 39.4% 39.8%
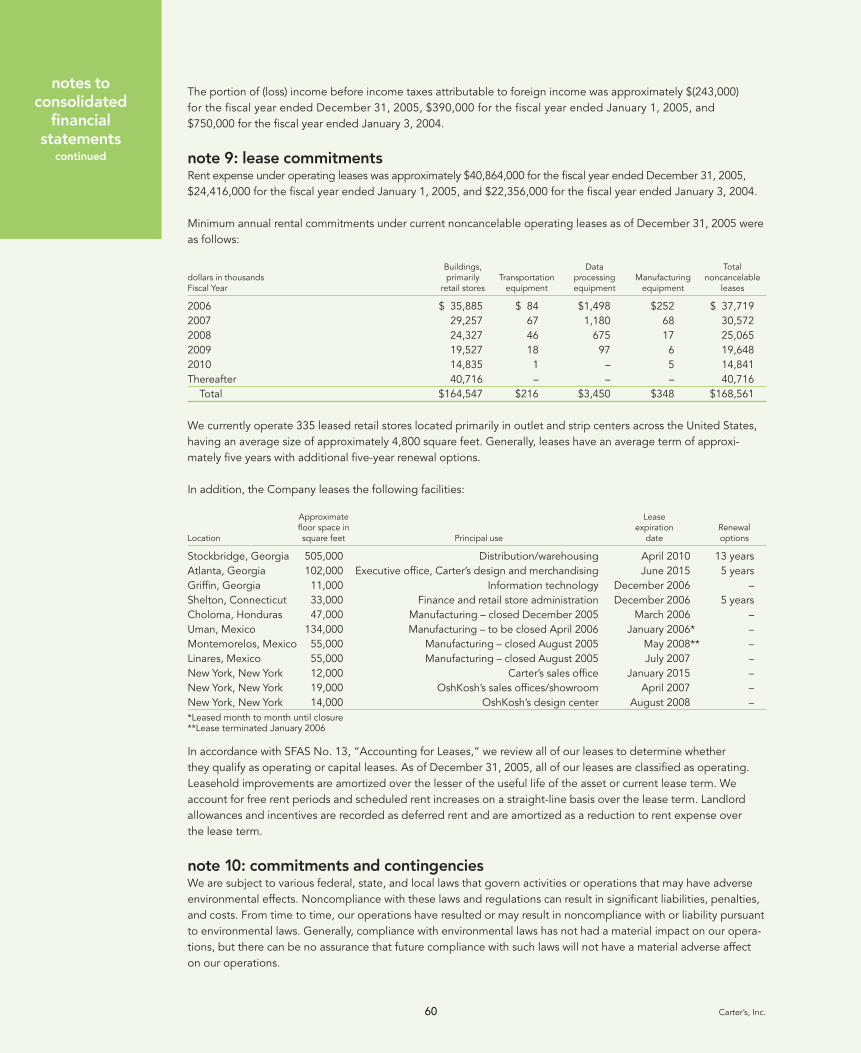
notes toconsolidated
financialstatements
continued
60 Carter’s, Inc.
The portion of (loss) income before income taxes attributable to foreign income was approximately $(243,000) for the fiscal year ended December 31, 2005, $390,000 for the fiscal year ended January 1, 2005, and $750,000 for the fiscal year ended January 3, 2004.
note 9: lease commitmentsRent expense under operating leases was approximately $40,864,000 for the fiscal year ended December 31, 2005,$24,416,000 for the fiscal year ended January 1, 2005, and $22,356,000 for the fiscal year ended January 3, 2004.
Minimum annual rental commitments under current noncancelable operating leases as of December 31, 2005 wereas follows:
Buildings, Data Totaldollars in thousands primarily Transportation processing Manufacturing noncancelableFiscal Year retail stores equipment equipment equipment leases
2006 $ 35,885 $ 84 $1,498 $252 $ 37,7192007 29,257 67 1,180 68 30,5722008 24,327 46 675 17 25,0652009 19,527 18 97 6 19,6482010 14,835 1 – 5 14,841Thereafter 40,716 – – – 40,716
Total $164,547 $216 $3,450 $348 $168,561
We currently operate 335 leased retail stores located primarily in outlet and strip centers across the United States,having an average size of approximately 4,800 square feet. Generally, leases have an average term of approxi-mately five years with additional five-year renewal options.
In addition, the Company leases the following facilities:
Approximate Leasefloor space in expiration Renewal
Location square feet Principal use date options
Stockbridge, Georgia 505,000 Distribution/warehousing April 2010 13 yearsAtlanta, Georgia 102,000 Executive office, Carter’s design and merchandising June 2015 5 yearsGriffin, Georgia 11,000 Information technology December 2006 –Shelton, Connecticut 33,000 Finance and retail store administration December 2006 5 yearsCholoma, Honduras 47,000 Manufacturing – closed December 2005 March 2006 –Uman, Mexico 134,000 Manufacturing – to be closed April 2006 January 2006* –Montemorelos, Mexico 55,000 Manufacturing – closed August 2005 May 2008** –Linares, Mexico 55,000 Manufacturing – closed August 2005 July 2007 –New York, New York 12,000 Carter’s sales office January 2015 –New York, New York 19,000 OshKosh’s sales offices/showroom April 2007 –New York, New York 14,000 OshKosh’s design center August 2008 –*Leased month to month until closure**Lease terminated January 2006
In accordance with SFAS No. 13, “Accounting for Leases,” we review all of our leases to determine whether they qualify as operating or capital leases. As of December 31, 2005, all of our leases are classified as operating.Leasehold improvements are amortized over the lesser of the useful life of the asset or current lease term. Weaccount for free rent periods and scheduled rent increases on a straight-line basis over the lease term. Landlordallowances and incentives are recorded as deferred rent and are amortized as a reduction to rent expense over the lease term.
note 10: commitments and contingenciesWe are subject to various federal, state, and local laws that govern activities or operations that may have adverseenvironmental effects. Noncompliance with these laws and regulations can result in significant liabilities, penalties,and costs. From time to time, our operations have resulted or may result in noncompliance with or liability pursuantto environmental laws. Generally, compliance with environmental laws has not had a material impact on our opera-tions, but there can be no assurance that future compliance with such laws will not have a material adverse affecton our operations.
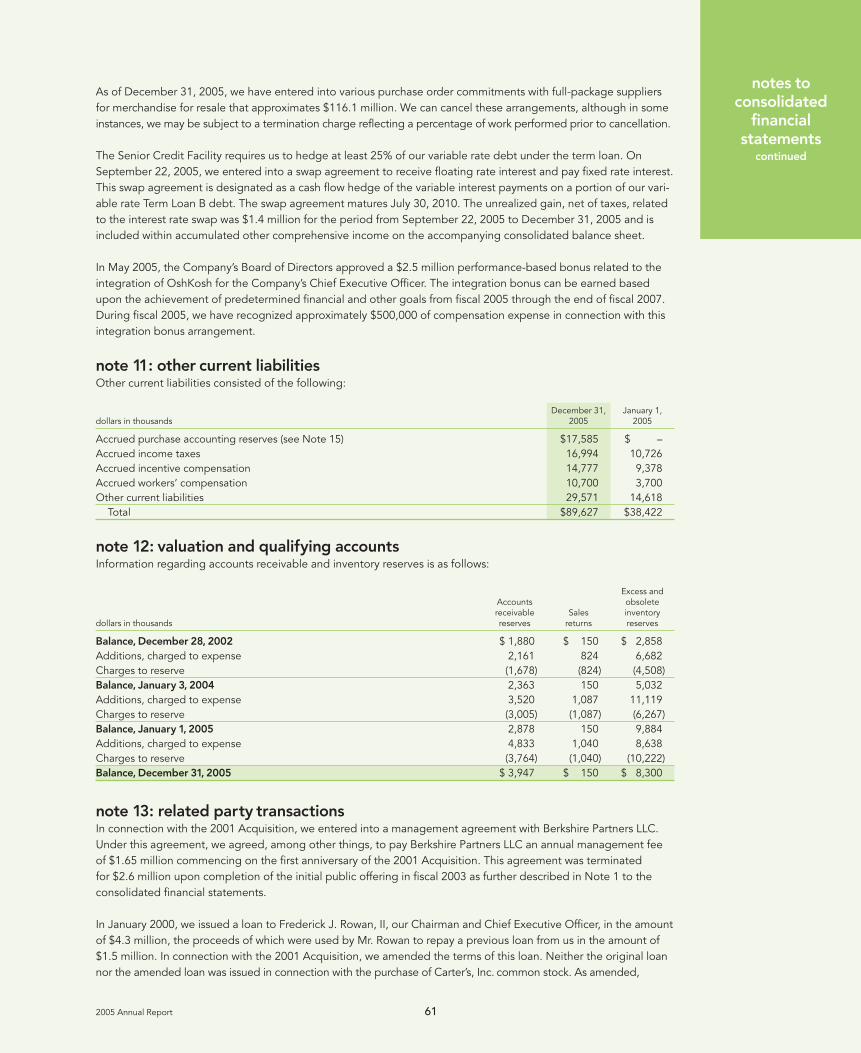
2005 Annual Report 61
notes toconsolidated
financialstatements
continued
As of December 31, 2005, we have entered into various purchase order commitments with full-package suppliersfor merchandise for resale that approximates $116.1 million. We can cancel these arrangements, although in someinstances, we may be subject to a termination charge reflecting a percentage of work performed prior to cancellation.
The Senior Credit Facility requires us to hedge at least 25% of our variable rate debt under the term loan. OnSeptember 22, 2005, we entered into a swap agreement to receive floating rate interest and pay fixed rate interest.This swap agreement is designated as a cash flow hedge of the variable interest payments on a portion of our vari-able rate Term Loan B debt. The swap agreement matures July 30, 2010. The unrealized gain, net of taxes, relatedto the interest rate swap was $1.4 million for the period from September 22, 2005 to December 31, 2005 and isincluded within accumulated other comprehensive income on the accompanying consolidated balance sheet.
In May 2005, the Company’s Board of Directors approved a $2.5 million performance-based bonus related to theintegration of OshKosh for the Company’s Chief Executive Officer. The integration bonus can be earned basedupon the achievement of predetermined financial and other goals from fiscal 2005 through the end of fiscal 2007.During fiscal 2005, we have recognized approximately $500,000 of compensation expense in connection with thisintegration bonus arrangement.
note 11: other current liabilitiesOther current liabilities consisted of the following:
December 31, January 1,dollars in thousands 2005 2005
Accrued purchase accounting reserves (see Note 15) $17,585 $ –Accrued income taxes 16,994 10,726Accrued incentive compensation 14,777 9,378Accrued workers’ compensation 10,700 3,700Other current liabilities 29,571 14,618
Total $89,627 $38,422
note 12: valuation and qualifying accountsInformation regarding accounts receivable and inventory reserves is as follows:
Excess andAccounts obsoletereceivable Sales inventory
dollars in thousands reserves returns reserves
Balance, December 28, 2002 $ 1,880 $ 150 $ 2,858Additions, charged to expense 2,161 824 6,682Charges to reserve (1,678) (824) (4,508)Balance, January 3, 2004 2,363 150 5,032Additions, charged to expense 3,520 1,087 11,119Charges to reserve (3,005) (1,087) (6,267)Balance, January 1, 2005 2,878 150 9,884Additions, charged to expense 4,833 1,040 8,638Charges to reserve (3,764) (1,040) (10,222)Balance, December 31, 2005 $ 3,947 $ 150 $ 8,300
note 13: related party transactionsIn connection with the 2001 Acquisition, we entered into a management agreement with Berkshire Partners LLC. Under this agreement, we agreed, among other things, to pay Berkshire Partners LLC an annual management fee of $1.65 million commencing on the first anniversary of the 2001 Acquisition. This agreement was terminated for $2.6 million upon completion of the initial public offering in fiscal 2003 as further described in Note 1 to theconsolidated financial statements.
In January 2000, we issued a loan to Frederick J. Rowan, II, our Chairman and Chief Executive Officer, in the amountof $4.3 million, the proceeds of which were used by Mr. Rowan to repay a previous loan from us in the amount of$1.5 million. In connection with the 2001 Acquisition, we amended the terms of this loan. Neither the original loannor the amended loan was issued in connection with the purchase of Carter’s, Inc. common stock. As amended,
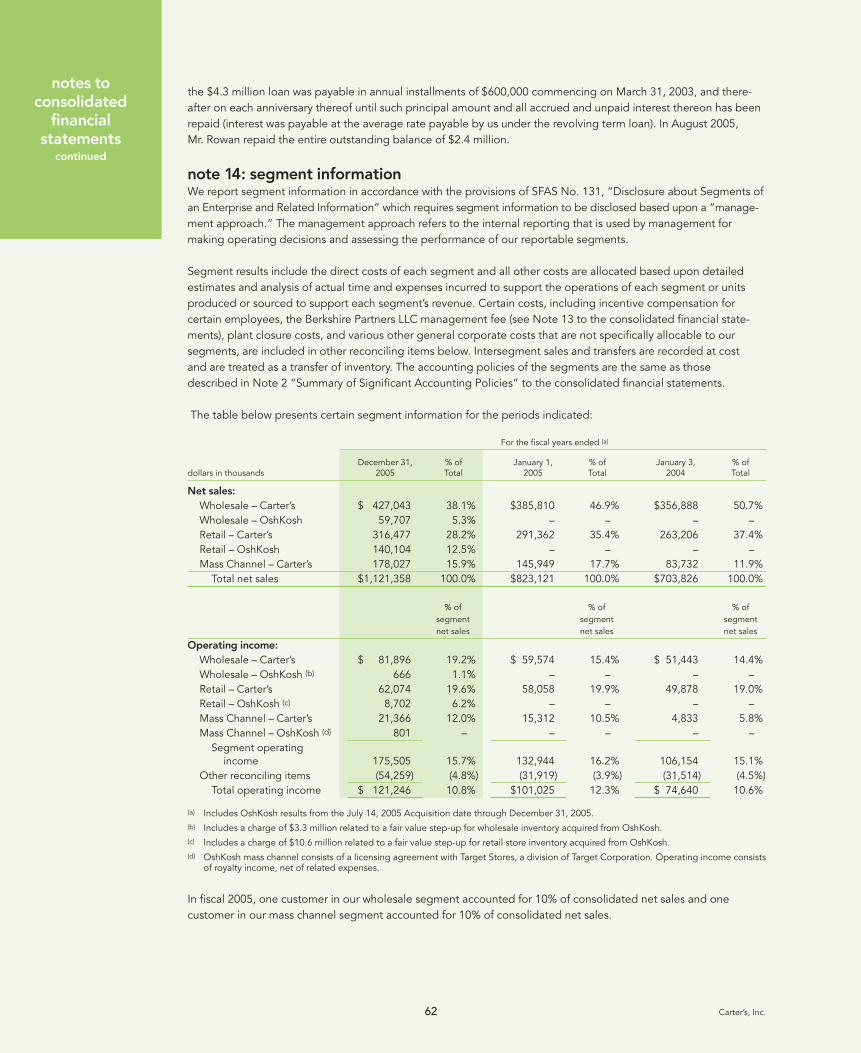
notes toconsolidated
financialstatements
continued
62 Carter’s, Inc.
the $4.3 million loan was payable in annual installments of $600,000 commencing on March 31, 2003, and there-after on each anniversary thereof until such principal amount and all accrued and unpaid interest thereon has beenrepaid (interest was payable at the average rate payable by us under the revolving term loan). In August 2005, Mr. Rowan repaid the entire outstanding balance of $2.4 million.
note 14: segment informationWe report segment information in accordance with the provisions of SFAS No. 131, “Disclosure about Segments ofan Enterprise and Related Information” which requires segment information to be disclosed based upon a “manage-ment approach.” The management approach refers to the internal reporting that is used by management formaking operating decisions and assessing the performance of our reportable segments.
Segment results include the direct costs of each segment and all other costs are allocated based upon detailedestimates and analysis of actual time and expenses incurred to support the operations of each segment or unitsproduced or sourced to support each segment’s revenue. Certain costs, including incentive compensation forcertain employees, the Berkshire Partners LLC management fee (see Note 13 to the consolidated financial state-ments), plant closure costs, and various other general corporate costs that are not specifically allocable to oursegments, are included in other reconciling items below. Intersegment sales and transfers are recorded at cost and are treated as a transfer of inventory. The accounting policies of the segments are the same as those described in Note 2 “Summary of Significant Accounting Policies” to the consolidated financial statements.
The table below presents certain segment information for the periods indicated:
For the fiscal years ended (a)
December 31, % of January 1, % of January 3, % ofdollars in thousands 2005 Total 2005 Total 2004 Total
Net sales:
Wholesale – Carter’s $ 427,043 38.1% $385,810 46.9% $356,888 50.7%Wholesale – OshKosh 59,707 5.3% – – – –Retail – Carter’s 316,477 28.2% 291,362 35.4% 263,206 37.4%Retail – OshKosh 140,104 12.5% – – – –Mass Channel – Carter’s 178,027 15.9% 145,949 17.7% 83,732 11.9%
Total net sales $1,121,358 100.0% $823,121 100.0% $703,826 100.0%
% of % of % ofsegment segment segmentnet sales net sales net sales
Operating income:
Wholesale – Carter’s $ 81,896 19.2% $ 59,574 15.4% $ 51,443 14.4%Wholesale – OshKosh (b) 666 1.1% – – – –Retail – Carter’s 62,074 19.6% 58,058 19.9% 49,878 19.0%Retail – OshKosh (c) 8,702 6.2% – – – –Mass Channel – Carter’s 21,366 12.0% 15,312 10.5% 4,833 5.8%Mass Channel – OshKosh (d) 801 – – – – –
Segment operating income 175,505 15.7% 132,944 16.2% 106,154 15.1%
Other reconciling items (54,259) (4.8%) (31,919) (3.9%) (31,514) (4.5%)Total operating income $ 121,246 10.8% $101,025 12.3% $ 74,640 10.6%
(a) Includes OshKosh results from the July 14, 2005 Acquisition date through December 31, 2005.(b) Includes a charge of $3.3 million related to a fair value step-up for wholesale inventory acquired from OshKosh.(c) Includes a charge of $10.6 million related to a fair value step-up for retail store inventory acquired from OshKosh.(d) OshKosh mass channel consists of a licensing agreement with Target Stores, a division of Target Corporation. Operating income consists
of royalty income, net of related expenses.
In fiscal 2005, one customer in our wholesale segment accounted for 10% of consolidated net sales and onecustomer in our mass channel segment accounted for 10% of consolidated net sales.

2005 Annual Report 63
notes toconsolidated
financialstatements
continued
The table below represents inventory, net, by segment:
December 31, January 1,dollars in thousands 2005 2005
Wholesale – Carter’s $ 63,401 $ 70,435Wholesale – OshKosh 37,195 –Retail – Carter’s 28,470 25,116Retail – OshKosh 20,397 –Mass Channel – Carter’s 38,991 25,241
Total $188,454 $120,792
Wholesale inventories include inventory produced and warehoused for the retail segment.
The following represents property, plant, and equipment, net, by geographic area:
December 31, January 1,dollars in thousands 2005 2005
United States $78,902 $51,055International 556 2,132
Total $79,458 $53,187
Our international operations consist of sewing facilities and, accordingly, no revenues are recorded at these locations.
The following represents goodwill by segment:
December 31, January 1,dollars in thousands 2005 2005
Wholesale – Carter’s $ 52,843 $ 52,843Wholesale – OshKosh 36,500 –Retail – Carter’s 83,654 83,654Retail – OshKosh 108,390 –Mass channel – Carter’s 2,785 2,785
Total $284,172 $139,282
note 15: restructuring and closure costsIn connection with the Acquisition of OshKosh on July 14, 2005, management has formulated a plan to restructureand integrate the operations of OshKosh. In accordance with emerging Issuance Task Force (“EITF”) No. 95-3,“Recognition of Liabilities in Connection with a Purchase Business Combination,” liabilities have been establishedfor OshKosh severance and relocation, lease termination costs associated with the closure of OshKosh’s 15 Lifestylestores and 14 outlet stores, contract termination costs, and other exit costs. These liabilities also cover costs relatedto the closure of the OshKosh Choloma, Honduras sewing facility, the Uman, Mexico sewing facility, and Liberty,Kentucky distribution center. The Choloma, Honduras and Liberty, Kentucky facilities were closed during the fourthquarter of fiscal 2005. The Uman, Mexico facility is scheduled to be closed during the first half of fiscal 2006. Weexpect to pay these liabilities during fiscal 2006.
The following table summarizes restructuring activity related to the Acquisition in fiscal 2005:
Severance Other Lease Contractand exit termination termination
dollars in thousands relocation costs costs costs Total
Balance at July 14, 2005 $9,840 $2,075 $7,020 $2,000 $20,935Payments (2,304) (71) (468) (934) (3,777)Adjustments to goodwill 673 (78) – (168) 427
Balance at December 31, 2005 $8,209 $1,926 $6,552 $ 898 $17,585
In May 2005, we decided to exit two Carter’s sewing facilities in Mexico. We have developed alternative capabili-ties to source comparable products in Asia at lower costs. For the majority of the affected employees, severancebenefits were communicated on June 21, 2005. Our Board of Directors approved the closure plans on June 15,2005. The total number of employees terminated is approximately 1,124, and 36 employees are expected to beretained through April 2006. Production at these facilities ceased on August 5, 2005.
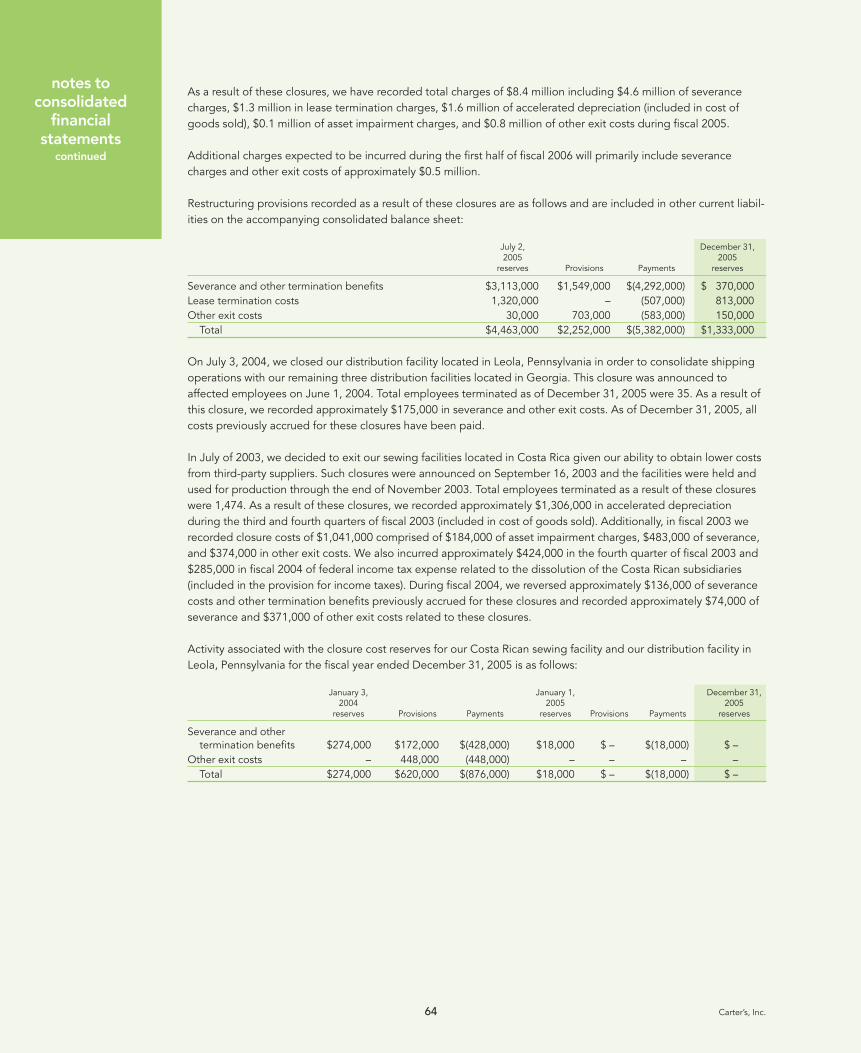
notes toconsolidated
financialstatements
continued
64 Carter’s, Inc.
As a result of these closures, we have recorded total charges of $8.4 million including $4.6 million of severancecharges, $1.3 million in lease termination charges, $1.6 million of accelerated depreciation (included in cost ofgoods sold), $0.1 million of asset impairment charges, and $0.8 million of other exit costs during fiscal 2005.
Additional charges expected to be incurred during the first half of fiscal 2006 will primarily include severancecharges and other exit costs of approximately $0.5 million.
Restructuring provisions recorded as a result of these closures are as follows and are included in other current liabil-ities on the accompanying consolidated balance sheet:
July 2, December 31,2005 2005
reserves Provisions Payments reserves
Severance and other termination benefits $3,113,000 $1,549,000 $(4,292,000) $ 370,000Lease termination costs 1,320,000 – (507,000) 813,000Other exit costs 30,000 703,000 (583,000) 150,000
Total $4,463,000 $2,252,000 $(5,382,000) $1,333,000
On July 3, 2004, we closed our distribution facility located in Leola, Pennsylvania in order to consolidate shippingoperations with our remaining three distribution facilities located in Georgia. This closure was announced toaffected employees on June 1, 2004. Total employees terminated as of December 31, 2005 were 35. As a result ofthis closure, we recorded approximately $175,000 in severance and other exit costs. As of December 31, 2005, allcosts previously accrued for these closures have been paid.
In July of 2003, we decided to exit our sewing facilities located in Costa Rica given our ability to obtain lower costsfrom third-party suppliers. Such closures were announced on September 16, 2003 and the facilities were held andused for production through the end of November 2003. Total employees terminated as a result of these closureswere 1,474. As a result of these closures, we recorded approximately $1,306,000 in accelerated depreciationduring the third and fourth quarters of fiscal 2003 (included in cost of goods sold). Additionally, in fiscal 2003 werecorded closure costs of $1,041,000 comprised of $184,000 of asset impairment charges, $483,000 of severance,and $374,000 in other exit costs. We also incurred approximately $424,000 in the fourth quarter of fiscal 2003 and$285,000 in fiscal 2004 of federal income tax expense related to the dissolution of the Costa Rican subsidiaries(included in the provision for income taxes). During fiscal 2004, we reversed approximately $136,000 of severancecosts and other termination benefits previously accrued for these closures and recorded approximately $74,000 ofseverance and $371,000 of other exit costs related to these closures.
Activity associated with the closure cost reserves for our Costa Rican sewing facility and our distribution facility inLeola, Pennsylvania for the fiscal year ended December 31, 2005 is as follows:
January 3, January 1, December 31,2004 2005 2005
reserves Provisions Payments reserves Provisions Payments reserves
Severance and other termination benefits $274,000 $172,000 $(428,000) $18,000 $ – $(18,000) $ –
Other exit costs – 448,000 (448,000) – – – –Total $274,000 $620,000 $(876,000) $18,000 $ – $(18,000) $ –
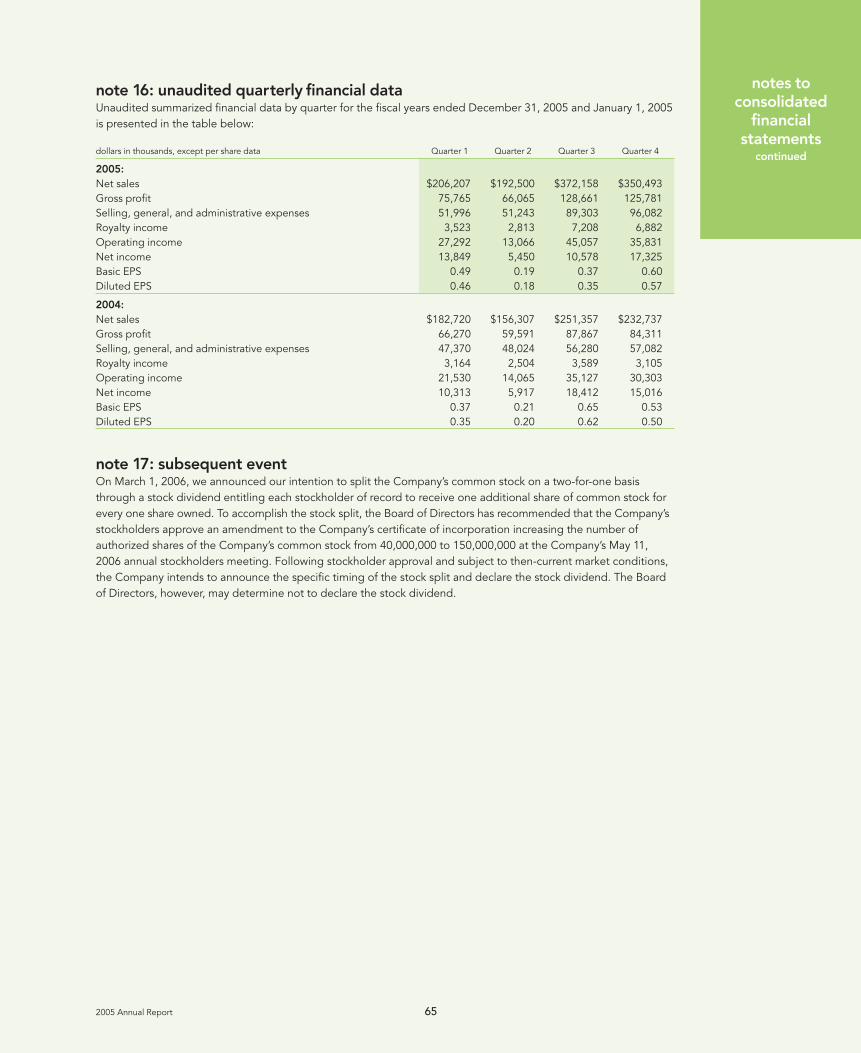
2005 Annual Report 65
notes toconsolidated
financialstatements
continued
note 16: unaudited quarterly financial dataUnaudited summarized financial data by quarter for the fiscal years ended December 31, 2005 and January 1, 2005is presented in the table below:
dollars in thousands, except per share data Quarter 1 Quarter 2 Quarter 3 Quarter 4
2005:
Net sales $206,207 $192,500 $372,158 $350,493Gross profit 75,765 66,065 128,661 125,781Selling, general, and administrative expenses 51,996 51,243 89,303 96,082Royalty income 3,523 2,813 7,208 6,882Operating income 27,292 13,066 45,057 35,831Net income 13,849 5,450 10,578 17,325Basic EPS 0.49 0.19 0.37 0.60Diluted EPS 0.46 0.18 0.35 0.57
2004:
Net sales $182,720 $156,307 $251,357 $232,737Gross profit 66,270 59,591 87,867 84,311Selling, general, and administrative expenses 47,370 48,024 56,280 57,082Royalty income 3,164 2,504 3,589 3,105Operating income 21,530 14,065 35,127 30,303Net income 10,313 5,917 18,412 15,016Basic EPS 0.37 0.21 0.65 0.53Diluted EPS 0.35 0.20 0.62 0.50
note 17: subsequent eventOn March 1, 2006, we announced our intention to split the Company’s common stock on a two-for-one basisthrough a stock dividend entitling each stockholder of record to receive one additional share of common stock forevery one share owned. To accomplish the stock split, the Board of Directors has recommended that the Company’sstockholders approve an amendment to the Company’s certificate of incorporation increasing the number ofauthorized shares of the Company’s common stock from 40,000,000 to 150,000,000 at the Company’s May 11,2006 annual stockholders meeting. Following stockholder approval and subject to then-current market conditions,the Company intends to announce the specific timing of the stock split and declare the stock dividend. The Boardof Directors, however, may determine not to declare the stock dividend.

stock price,dividend
information,and relatedstockholder
matters
66 Carter’s, Inc.
Carter’s, Inc. common stock trades on the New York Stock Exchange under the symbol CRI. The last reported saleprice per share of Carter’s, Inc. common stock on March 8, 2006 was $65.55. On that date there were approxi-mately 7,090 holders of record of Carter’s, Inc. common stock.
The following table sets forth for the period indicated the high and low sales prices per share of common stock asreported by the New York Stock Exchange:
2005 High Low
First quarter $41.20 $32.46Second quarter $60.50 $37.30Third quarter $65.65 $52.84Fourth quarter $65.00 $51.38
2004 High Low
First quarter $31.35 $24.90Second quarter $31.72 $27.75Third quarter $29.64 $24.67Fourth quarter $35.59 $27.89
No purchases of Carter’s, Inc. common stock were made by or on behalf of the Company or any affiliated purchaserduring the fourth quarter of fiscal 2005.
dividendsProvisions in our Senior Credit Facility currently restrict the ability of our operating subsidiary, TWCC, from payingcash dividends to our parent company, Carter’s, Inc., in excess of $15.0 million, which thereby materially restrictsCarter’s, Inc. from paying cash dividends on our Carter’s, Inc. common stock. We do not anticipate paying cash dividends on Carter’s, Inc. common stock in the foreseeable future but intend to retain future earnings, if any, forreinvestment in the future operation and expansion of our business and related development activities. Any futuredecision to pay cash dividends will be at the discretion of our Board of Directors and will depend upon our financialcondition, results of operations, terms of financing arrangements, capital requirements, and such other factors asour Board of Directors deems relevant.

2005 Annual Report 67
equitycompensation
planinformation
The following table provides information about our equity compensation plan as of our last fiscal year:
Equity Compensation Plan Information
Number of securitiesremaining available forfuture issuance under
Number of securities to Weighted-average equity compensationbe issued upon exercise exercise price of plans (excludingof outstanding options, outstanding options, securities reflected
Plan Category warrants, and rights warrants, and rights in first column)
Equity compensation plans approved by security holders (1) 3,576,199 $12.99 1,244,628
Equity compensation plans not approved by security holders – – –
Total 3,576,199 $12.99 1,244,628
(1) Represents stock options that are outstanding or that are available for future issuance pursuant to the Carter’s, Inc. Amended andRestated 2003 Equity Incentive Plan.
recent sales of unregistered securitiesNot applicable.
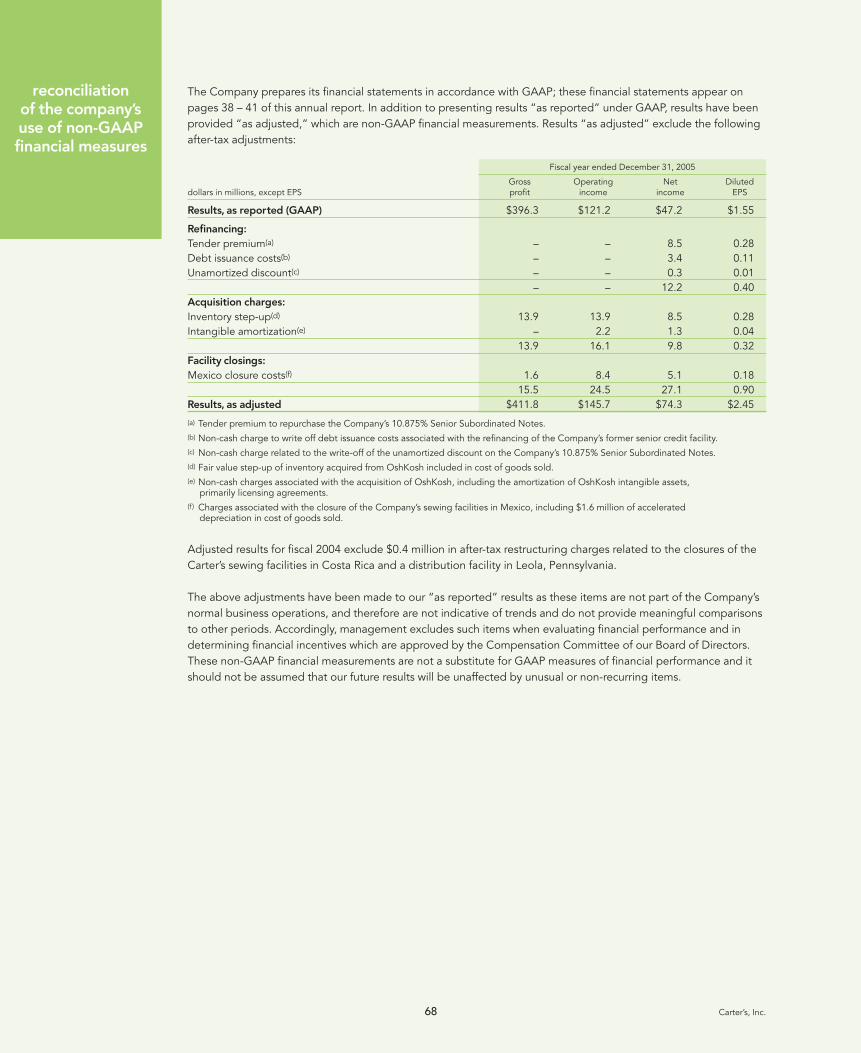
reconciliation of the company’suse of non-GAAPfinancial measures
68 Carter’s, Inc.
The Company prepares its financial statements in accordance with GAAP; these financial statements appear onpages 38 – 41 of this annual report. In addition to presenting results “as reported” under GAAP, results have beenprovided “as adjusted,” which are non-GAAP financial measurements. Results “as adjusted” exclude the followingafter-tax adjustments:
Fiscal year ended December 31, 2005
Gross Operating Net Diluteddollars in millions, except EPS profit income income EPS
Results, as reported (GAAP) $396.3 $121.2 $47.2 $1.55
Refinancing:
Tender premium(a) – – 8.5 0.28Debt issuance costs(b) – – 3.4 0.11Unamortized discount(c) – – 0.3 0.01
– – 12.2 0.40Acquisition charges:
Inventory step-up(d) 13.9 13.9 8.5 0.28Intangible amortization(e) – 2.2 1.3 0.04
13.9 16.1 9.8 0.32Facility closings:
Mexico closure costs(f) 1.6 8.4 5.1 0.1815.5 24.5 27.1 0.90
Results, as adjusted $411.8 $145.7 $74.3 $2.45
(a) Tender premium to repurchase the Company’s 10.875% Senior Subordinated Notes. (b) Non-cash charge to write off debt issuance costs associated with the refinancing of the Company’s former senior credit facility.(c) Non-cash charge related to the write-off of the unamortized discount on the Company’s 10.875% Senior Subordinated Notes.(d) Fair value step-up of inventory acquired from OshKosh included in cost of goods sold.(e) Non-cash charges associated with the acquisition of OshKosh, including the amortization of OshKosh intangible assets,
primarily licensing agreements.(f ) Charges associated with the closure of the Company’s sewing facilities in Mexico, including $1.6 million of accelerated
depreciation in cost of goods sold.
Adjusted results for fiscal 2004 exclude $0.4 million in after-tax restructuring charges related to the closures of theCarter’s sewing facilities in Costa Rica and a distribution facility in Leola, Pennsylvania.
The above adjustments have been made to our “as reported” results as these items are not part of the Company’snormal business operations, and therefore are not indicative of trends and do not provide meaningful comparisonsto other periods. Accordingly, management excludes such items when evaluating financial performance and indetermining financial incentives which are approved by the Compensation Committee of our Board of Directors.These non-GAAP financial measurements are not a substitute for GAAP measures of financial performance and itshould not be assumed that our future results will be unaffected by unusual or non-recurring items.
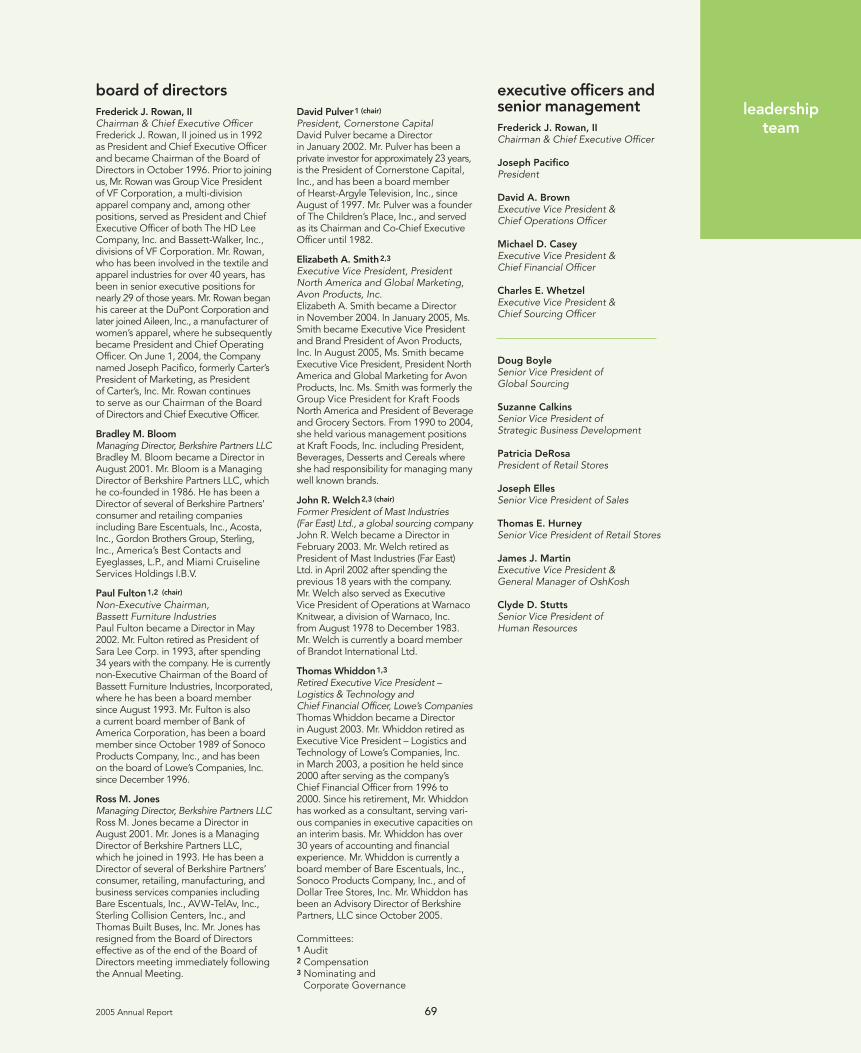
2005 Annual Report 69
leadershipteam
board of directorsFrederick J. Rowan, IIChairman & Chief Executive OfficerFrederick J. Rowan, II joined us in 1992as President and Chief Executive Officerand became Chairman of the Board ofDirectors in October 1996. Prior to joiningus, Mr. Rowan was Group Vice Presidentof VF Corporation, a multi-divisionapparel company and, among otherpositions, served as President and ChiefExecutive Officer of both The HD LeeCompany, Inc. and Bassett-Walker, Inc.,divisions of VF Corporation. Mr. Rowan,who has been involved in the textile andapparel industries for over 40 years, hasbeen in senior executive positions fornearly 29 of those years. Mr. Rowan beganhis career at the DuPont Corporation andlater joined Aileen, Inc., a manufacturer ofwomen’s apparel, where he subsequentlybecame President and Chief OperatingOfficer. On June 1, 2004, the Companynamed Joseph Pacifico, formerly Carter’sPresident of Marketing, as President of Carter’s, Inc. Mr. Rowan continues to serve as our Chairman of the Board of Directors and Chief Executive Officer.
Bradley M. BloomManaging Director, Berkshire Partners LLCBradley M. Bloom became a Director inAugust 2001. Mr. Bloom is a ManagingDirector of Berkshire Partners LLC, whichhe co-founded in 1986. He has been aDirector of several of Berkshire Partners’consumer and retailing companiesincluding Bare Escentuals, Inc., Acosta,Inc., Gordon Brothers Group, Sterling,Inc., America’s Best Contacts andEyeglasses, L.P., and Miami CruiselineServices Holdings I.B.V.
Paul Fulton1,2 (chair)
Non-Executive Chairman, Bassett Furniture IndustriesPaul Fulton became a Director in May2002. Mr. Fulton retired as President ofSara Lee Corp. in 1993, after spending34 years with the company. He is currentlynon-Executive Chairman of the Board ofBassett Furniture Industries, Incorporated,where he has been a board membersince August 1993. Mr. Fulton is also a current board member of Bank ofAmerica Corporation, has been a boardmember since October 1989 of SonocoProducts Company, Inc., and has beenon the board of Lowe’s Companies, Inc.since December 1996.
Ross M. JonesManaging Director, Berkshire Partners LLCRoss M. Jones became a Director inAugust 2001. Mr. Jones is a ManagingDirector of Berkshire Partners LLC, which he joined in 1993. He has been aDirector of several of Berkshire Partners’consumer, retailing, manufacturing, andbusiness services companies includingBare Escentuals, Inc., AVW-TelAv, Inc.,Sterling Collision Centers, Inc., andThomas Built Buses, Inc. Mr. Jones hasresigned from the Board of Directorseffective as of the end of the Board ofDirectors meeting immediately followingthe Annual Meeting.
David Pulver1 (chair)
President, Cornerstone CapitalDavid Pulver became a Director in January 2002. Mr. Pulver has been aprivate investor for approximately 23 years,is the President of Cornerstone Capital,Inc., and has been a board member of Hearst-Argyle Television, Inc., sinceAugust of 1997. Mr. Pulver was a founderof The Children’s Place, Inc., and servedas its Chairman and Co-Chief ExecutiveOfficer until 1982.
Elizabeth A. Smith2,3
Executive Vice President, PresidentNorth America and Global Marketing,Avon Products, Inc.Elizabeth A. Smith became a Director in November 2004. In January 2005, Ms.Smith became Executive Vice Presidentand Brand President of Avon Products,Inc. In August 2005, Ms. Smith becameExecutive Vice President, President NorthAmerica and Global Marketing for AvonProducts, Inc. Ms. Smith was formerly theGroup Vice President for Kraft FoodsNorth America and President of Beverageand Grocery Sectors. From 1990 to 2004,she held various management positionsat Kraft Foods, Inc. including President,Beverages, Desserts and Cereals whereshe had responsibility for managing manywell known brands.
John R. Welch2,3 (chair)
Former President of Mast Industries (Far East) Ltd., a global sourcing companyJohn R. Welch became a Director inFebruary 2003. Mr. Welch retired asPresident of Mast Industries (Far East)Ltd. in April 2002 after spending theprevious 18 years with the company. Mr. Welch also served as Executive Vice President of Operations at WarnacoKnitwear, a division of Warnaco, Inc. from August 1978 to December 1983.Mr. Welch is currently a board member of Brandot International Ltd.
Thomas Whiddon1,3
Retired Executive Vice President –Logistics & Technology and Chief Financial Officer, Lowe’s CompaniesThomas Whiddon became a Director in August 2003. Mr. Whiddon retired asExecutive Vice President – Logistics andTechnology of Lowe’s Companies, Inc. in March 2003, a position he held since2000 after serving as the company’sChief Financial Officer from 1996 to2000. Since his retirement, Mr. Whiddonhas worked as a consultant, serving vari-ous companies in executive capacities onan interim basis. Mr. Whiddon has over30 years of accounting and financialexperience. Mr. Whiddon is currently aboard member of Bare Escentuals, Inc.,Sonoco Products Company, Inc., and ofDollar Tree Stores, Inc. Mr. Whiddon hasbeen an Advisory Director of BerkshirePartners, LLC since October 2005.
Committees:1 Audit2 Compensation3 Nominating and
Corporate Governance
executive officers and senior managementFrederick J. Rowan, IIChairman & Chief Executive Officer
Joseph PacificoPresident
David A. BrownExecutive Vice President & Chief Operations Officer
Michael D. CaseyExecutive Vice President & Chief Financial Officer
Charles E. WhetzelExecutive Vice President & Chief Sourcing Officer
Doug BoyleSenior Vice President of Global Sourcing
Suzanne CalkinsSenior Vice President of Strategic Business Development
Patricia DeRosaPresident of Retail Stores
Joseph EllesSenior Vice President of Sales
Thomas E. HurneySenior Vice President of Retail Stores
James J. MartinExecutive Vice President & General Manager of OshKosh
Clyde D. StuttsSenior Vice President of Human Resources

corporateinformation
70 Carter’s, Inc.
company address
Carter’s, Inc.1170 Peachtree Street NE, Suite 900Atlanta, Georgia 30309Web site: www.carters.com
annual meeting
The Annual Meeting of Stockholders is scheduled for 9:00 a.m., Thursday, May 11 at The Four Seasons Hotel, 75 Fourteenth Street NE, Atlanta, Georgia 30309
stock exchange listing
New York Stock Exchange (Trading Symbol “CRI”)
independent registered public accounting firm
PricewaterhouseCoopers LLP300 Atlantic StreetStamford, Connecticut 06901
legal counsel
Ropes & Gray LLPOne International PlaceBoston, Massachusetts 02110
transfer agent
American Stock Transfer and Trust Company59 Maiden LaneNew York, New York 10038
investor relations
For further information on Carter’s, Inc., additional copies of this report, Form 10-K, or other financial information, contact:Eric MartinVice President, Investor Relations1170 Peachtree Street NE, Suite 900Atlanta, Georgia 30309404.745.2700
References to market share in this annual report reflect our estimated share of a market expressed as a percentageof total retail revenues, derived from NPD Fashionworld data issued February 3, 2006. Carter’s revised the NPDmarket definitions to better reflect the nature of the childrenswear business.
Des
ign:
ww
w.c
rittg
raha
m.c
om
Cop
y: M
imi B
ean

carter’s principles
tell it like it is
Make all communications direct,clear, and honest. Speak the truth and welcome debate.Share information. Collaborate.
trust the power of fewer things
Believe in the growth of our core business and core customers. Giveequal weight to both “do” and “don’t.”Grow by focusing in, not branching out.
keep every promise
Let superb execution reflect a com-petitive spirit. Meet deadlines. Meetor exceed commitments. Exceedexpectations. Count on each other.
live by higher standards
Be honest, modest, responsible, and beyond reproach. Operate withintegrity. Trust each other.
think horizontally
Emphasize cause and effect across functions. Depend on front-end strategies for back-end results.Enhance core competencies with powerful repeating processes.
rely on the best talent
Start with great principles and greatpeople with disciplined egos. Look for character, passion, a will to win,and a strong personal code. Work with coachable individuals who solve problems, teach, and inspire.
tell it like it is
trust the power of fewer things
keep every promise
live by higher standards
think horizontally
rely on the best talent
carter’s principles

Carter’s, Inc. 2005 Annual Report
giant steps
we love children We celebrate and support families, and we never
forget that parents need to feel cared for too.
Carter’s, Inc. 1170 Peachtree Street NE, Suite 900, Atlanta, Georgia 30309 404.745.2700 www.carters.com
Carter’s,Inc.2
00
5A
nnual Report