Embed Size (px)
Citation preview
TlsiAtt
FmMowGFKBATM
2
Journal of the American College of Cardiology Vol. 54, No. 2, 2009© 2009 by the American College of Cardiology Foundation ISSN 0735-1097/09/$36.00P
Heart Rhythm Disorders
Giant T–U Waves PrecedeTorsades de Pointes in Long QT SyndromeA Systematic Electrocardiographic Analysis inPatients With Acquired and Congenital QT Prolongation
Paulus Kirchhof, MD,* Michael R. Franz, MD, PHD,† Abdennasser Bardai, MD,‡Arthur M. Wilde, MD‡
Washington, DC; Münster, Germany; and Amsterdam, the Netherlands
Objectives This study sought to identify electrocardiographic (ECG) criteria that are associated with initiation of torsades depointes (TdP) in patients with acquired (a-) and congenital (c-) long QT syndrome (LQTS).
Background Electrocardiographic criteria used as risk predictors for TdP commonly rely on a prolonged QT interval but rarelyconsider abnormal T–U waves.
Methods We analyzed ECG recordings with TdP from 35 LQTS patients (15 c-LQTS and 20 a-LQTS) and compared themwith premature ventricular complexes (PVCs) from 40 patients with normal QT intervals and with PVCs in 24 ofthe 35 LQTS patients not related to TdP.
Results Abnormal T–U waves (6.2 � 0.9 mm) directly preceded TdP in 34 of 35 LQTS patients and were larger thanT-wave amplitude (2.8 � 0.2 mm) in control patients and larger than the largest T–U-wave in LQTS without TdP(4.7 � 0.8 mm). The TdP-initiating beat emerged from a T–U-wave in 27 of 35 LQTS patients and in none of 40control patients. The QRS duration of the first TdP beat (175 � 12 ms) was longer than in control PVCs (145 �
4 ms) and in PVCs in LQTS patients not related to TdP (138 � 22 ms). The QRS angle was less steep before TdPthan in other PVCs (all p � 0.05).
Conclusions Abnormal, giant T–U waves separate TdP initiation in LQTS patients from PVCs in other heart disease and fromother PVCs in LQTS patients. These ECG analyses suggest that early afterdepolarizations initiate TdP and, ifpresent, may help to identify an imminent risk for TdP. (J Am Coll Cardiol 2009;54:143–9) © 2009 by theAmerican College of Cardiology Foundation
ublished by Elsevier Inc. doi:10.1016/j.jacc.2009.03.043
ms(t
liaoihtfgtutE
he acquired long QT syndrome (a-LQTS) and congenitalong QT syndrome (c-LQTS) predispose patients to tor-ades de pointes arrhythmias (TdP). The mechanisms thatnitiate TdP in LQTS patients are not well understood.lthough abnormal prolongation of the QT interval iden-
ifies patients at increased risk for TdP (1–3), many patientsolerate marked QT prolongation without TdP. Thus, there
rom the *VA Medical Center/Georgetown University, Washington, DC; †Depart-ent of Cardiology and Angiology, University Hospital Münster, and IZKFünster, Münster, Germany; and the ‡Heart Failure Research Centre, Department
f Cardiology, Academic Medical Centre, Amsterdam, the Netherlands. This studyas funded in part by Deutsche Forschungsgemeinschaft (DFG, Ki/713/1-1), by theerman Ministry for Research and Education (BMBF, AFNET, 01Gi0204), and byondation LeDucq (Alliance Against Sudden Cardiac Death and ENAFRA). Dr.irchhof has received consulting fees or honoraria from 3M Medica, AstraZeneca,ayer Healthcare, Boehringer Ingelheim, MEDA Pharma, Medtronic, Sanofi-ventis, Siemens, Sorvier, and Takeda; and research grants from Cardiovascularherapeutics, 3M Medica/MEDA Pharma, Medtronic, Omron, and St. Judeedical. Drs. Kirchhof and Franz contributed equally to this work.
mManuscript received November 25, 2008; revised manuscript received March 5,
009, accepted March 10, 2009.
ust be other factors that cause TdP. In experimentalettings, early afterdepolarizations (EADs) initiate TdP4–6), which may be reflected by abnormal T–U waves inhe electrocardiogram (ECG) (5,7,8).
A common feature of drug-induced TdP and of TdP inong QT syndrome type 2 (LQTS2) is that the TdP-nitiating beat is preceded by a premature beat followed bypause. Often, this pattern of premature beats and pauses,r short-long-short interval, repeats for several cycles in anncremental fashion, with TdP occurring when the pauseas reached a critical length (9). A comprehensive publica-ion from 2 decades ago (5) reviewed these ECG featuresrom both experimental and clinical observations and sug-ested an eminent role of abnormal T–U waves in theriggering of TdP. In that and other subsequent studies, these of monophasic action potential recordings showed thathe U-wave in LQTS patients closely correlated with earlyADs at the cellular level (10). This not only makes correct
easurements of the QT interval more difficult but may also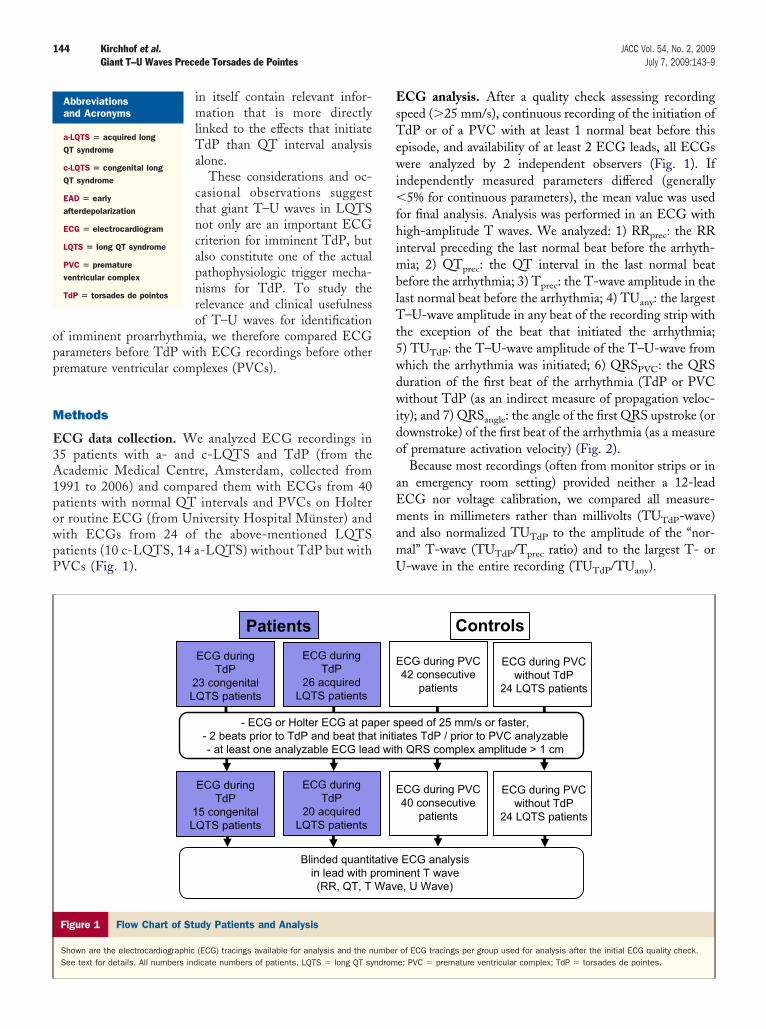
opp
M
E3A1powpP
EsTewi�fhimblTt5wdwido
aEmamU
144 Kirchhof et al. JACC Vol. 54, No. 2, 2009Giant T–U Waves Precede Torsades de Pointes July 7, 2009:143–9
in itself contain relevant infor-mation that is more directlylinked to the effects that initiateTdP than QT interval analysisalone.
These considerations and oc-casional observations suggestthat giant T–U waves in LQTSnot only are an important ECGcriterion for imminent TdP, butalso constitute one of the actualpathophysiologic trigger mecha-nisms for TdP. To study therelevance and clinical usefulnessof T–U waves for identification
f imminent proarrhythmia, we therefore compared ECGarameters before TdP with ECG recordings before otherremature ventricular complexes (PVCs).
ethods
CG data collection. We analyzed ECG recordings in5 patients with a- and c-LQTS and TdP (from thecademic Medical Centre, Amsterdam, collected from991 to 2006) and compared them with ECGs from 40atients with normal QT intervals and PVCs on Holterr routine ECG (from University Hospital Münster) andith ECGs from 24 of the above-mentioned LQTSatients (10 c-LQTS, 14 a-LQTS) without TdP but withVCs (Fig. 1).
ECG duringTdP
23 congenitalLQTS patients
ECG duringTdP
26 acquiredLQTS patients
- ECG or Holter ECG at pa- 2 beats prior to TdP and beat tha- at least one analyzable ECG lea
ECG duringTdP
15 congenitalLQTS patients
ECG duringTdP
20 acquiredLQTS patients
Patients
Blinded quantitin lead with p(RR, QT, T
Figure 1 Flow Chart of Study Patients and Analysis
Shown are the electrocardiographic (ECG) tracings available for analysis and the nSee text for details. All numbers indicate numbers of patients. LQTS � long QT sy
Abbreviationsand Acronyms
a-LQTS � acquired longQT syndrome
c-LQTS � congenital longQT syndrome
EAD � earlyafterdepolarization
ECG � electrocardiogram
LQTS � long QT syndrome
PVC � prematureventricular complex
TdP � torsades de pointes
CG analysis. After a quality check assessing recordingpeed (�25 mm/s), continuous recording of the initiation ofdP or of a PVC with at least 1 normal beat before this
pisode, and availability of at least 2 ECG leads, all ECGsere analyzed by 2 independent observers (Fig. 1). If
ndependently measured parameters differed (generally5% for continuous parameters), the mean value was used
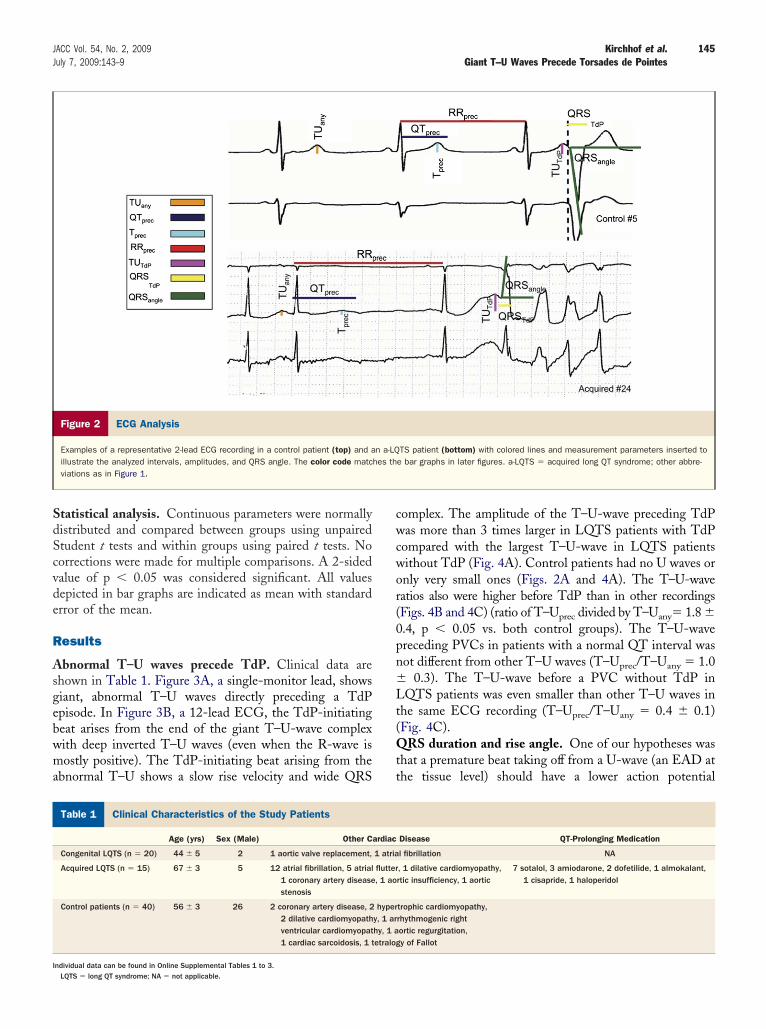
or final analysis. Analysis was performed in an ECG withigh-amplitude T waves. We analyzed: 1) RRprec: the RR
nterval preceding the last normal beat before the arrhyth-ia; 2) QTprec: the QT interval in the last normal beat
efore the arrhythmia; 3) Tprec: the T-wave amplitude in theast normal beat before the arrhythmia; 4) TUany: the largest–U-wave amplitude in any beat of the recording strip with
he exception of the beat that initiated the arrhythmia;) TUTdP: the T–U-wave amplitude of the T–U-wave fromhich the arrhythmia was initiated; 6) QRSPVC: the QRSuration of the first beat of the arrhythmia (TdP or PVCithout TdP (as an indirect measure of propagation veloc-
ty); and 7) QRSangle: the angle of the first QRS upstroke (orownstroke) of the first beat of the arrhythmia (as a measuref premature activation velocity) (Fig. 2).Because most recordings (often from monitor strips or in
n emergency room setting) provided neither a 12-leadCG nor voltage calibration, we compared all measure-ents in millimeters rather than millivolts (TUTdP-wave)
nd also normalized TUTdP to the amplitude of the “nor-al” T-wave (TUTdP/Tprec ratio) and to the largest T- or-wave in the entire recording (TUTdP/TUany).
CG during PVC 42 consecutive
patients
ECG during PVC without TdP
24 LQTS patients
peed of 25 mm/s or faster, tes TdP / prior to PVC analyzable
h QRS complex amplitude > 1 cm
CG during PVC 40 consecutive
patients
ECG during PVC without TdP
24 LQTS patients
ECG analysisnent T wavee, U Wave)
Controls
of ECG tracings per group used for analysis after the initial ECG quality check.e; PVC � premature ventricular complex; TdP � torsades de pointes.
E
per st initiad wit
E
ativeromiWav
umberndrom
SdScvde
R
Asgebwma
cwcwor(0pn�Lt(Qtt
C
I
145JACC Vol. 54, No. 2, 2009 Kirchhof et al.July 7, 2009:143–9 Giant T–U Waves Precede Torsades de Pointes
tatistical analysis. Continuous parameters were normallyistributed and compared between groups using unpairedtudent t tests and within groups using paired t tests. Noorrections were made for multiple comparisons. A 2-sidedalue of p � 0.05 was considered significant. All valuesepicted in bar graphs are indicated as mean with standardrror of the mean.
esults
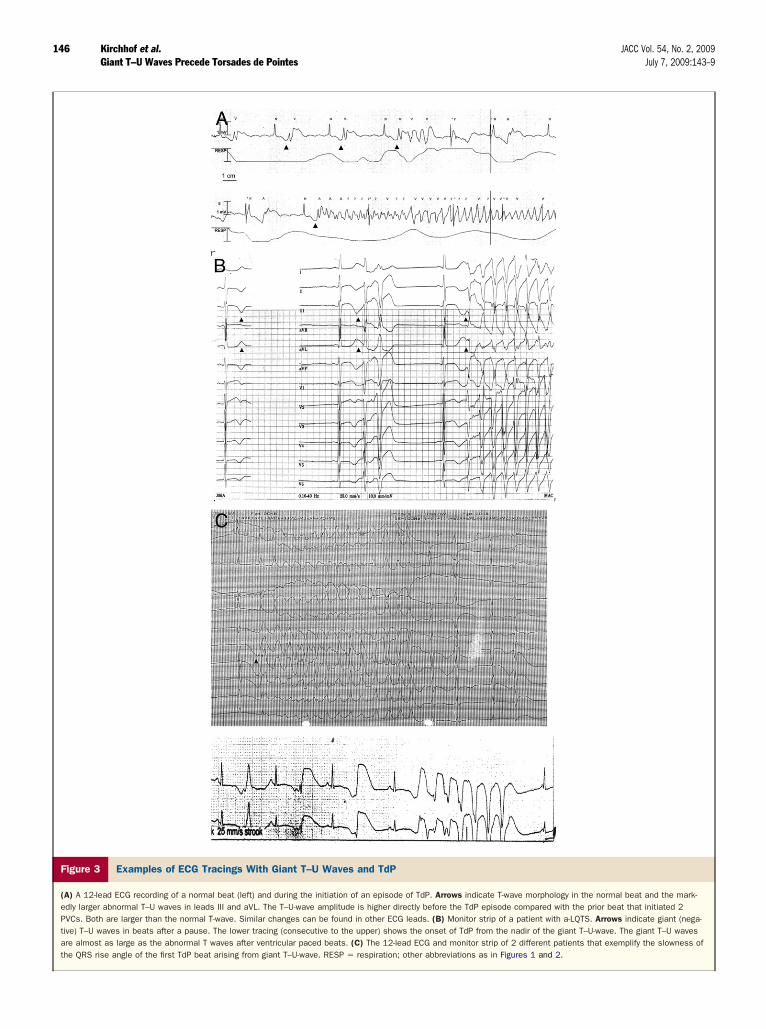
bnormal T–U waves precede TdP. Clinical data arehown in Table 1. Figure 3A, a single-monitor lead, showsiant, abnormal T–U waves directly preceding a TdPpisode. In Figure 3B, a 12-lead ECG, the TdP-initiatingeat arises from the end of the giant T–U-wave complexith deep inverted T–U waves (even when the R-wave isostly positive). The TdP-initiating beat arising from the
bnormal T–U shows a slow rise velocity and wide QRS
Figure 2 ECG Analysis
Examples of a representative 2-lead ECG recording in a control patient (top) and aillustrate the analyzed intervals, amplitudes, and QRS angle. The color code matcviations as in Figure 1.
linical Characteristics of the Study Patients
Table 1 Clinical Characteristics of the Study Patients
Age (yrs) Sex (Male) Other C
Congenital LQTS (n � 20) 44 � 5 2 1 aortic valve replacement,
Acquired LQTS (n � 15) 67 � 3 5 12 atrial fibrillation, 5 atrial1 coronary artery diseasestenosis
Control patients (n � 40) 56 � 3 26 2 coronary artery disease, 22 dilative cardiomyopathventricular cardiomyopat1 cardiac sarcoidosis, 1 t
ndividual data can be found in Online Supplemental Tables 1 to 3.LQTS � long QT syndrome; NA � not applicable.
omplex. The amplitude of the T–U-wave preceding TdPas more than 3 times larger in LQTS patients with TdP
ompared with the largest T–U-wave in LQTS patientsithout TdP (Fig. 4A). Control patients had no U waves ornly very small ones (Figs. 2A and 4A). The T–U-waveatios also were higher before TdP than in other recordingsFigs. 4B and 4C) (ratio of T–Uprec divided by T–Uany� 1.8 �.4, p � 0.05 vs. both control groups). The T–U-wavereceding PVCs in patients with a normal QT interval wasot different from other T–U waves (T–Uprec/T–Uany � 1.0
0.3). The T–U-wave before a PVC without TdP inQTS patients was even smaller than other T–U waves in
he same ECG recording (T–Uprec/T–Uany � 0.4 � 0.1)Fig. 4C).
RS duration and rise angle. One of our hypotheses washat a premature beat taking off from a U-wave (an EAD athe tissue level) should have a lower action potential
TS patient (bottom) with colored lines and measurement parameters inserted toe bar graphs in later figures. a-LQTS � acquired long QT syndrome; other abbre-
Disease QT-Prolonging Medication
l fibrillation NA
, 1 dilative cardiomyopathy,rtic insufficiency, 1 aortic
7 sotalol, 3 amiodarone, 2 dofetilide, 1 almokalant,1 cisapride, 1 haloperidol
trophic cardiomyopathy,rhythmogenic rightortic regurgitation,y of Fallot
n a-LQhes th
ardiac
1 atria
flutter, 1 ao
hypery, 1 arhy, 1 aetralog
146 Kirchhof et al. JACC Vol. 54, No. 2, 2009Giant T–U Waves Precede Torsades de Pointes July 7, 2009:143–9
Figure 3 Examples of ECG Tracings With Giant T–U Waves and TdP
(A) A 12-lead ECG recording of a normal beat (left) and during the initiation of an episode of TdP. Arrows indicate T-wave morphology in the normal beat and the mark-edly larger abnormal T–U waves in leads III and aVL. The T–U-wave amplitude is higher directly before the TdP episode compared with the prior beat that initiated 2PVCs. Both are larger than the normal T-wave. Similar changes can be found in other ECG leads. (B) Monitor strip of a patient with a-LQTS. Arrows indicate giant (nega-tive) T–U waves in beats after a pause. The lower tracing (consecutive to the upper) shows the onset of TdP from the nadir of the giant T–U-wave. The giant T–U wavesare almost as large as the abnormal T waves after ventricular paced beats. (C) The 12-lead ECG and monitor strip of 2 different patients that exemplify the slowness ofthe QRS rise angle of the first TdP beat arising from giant T–U-wave. RESP � respiration; other abbreviations as in Figures 1 and 2.
uQdlPQPiLpitT
D
MlE
wflEPldscnGtThieOTtsicTm
147JACC Vol. 54, No. 2, 2009 Kirchhof et al.July 7, 2009:143–9 Giant T–U Waves Precede Torsades de Pointes
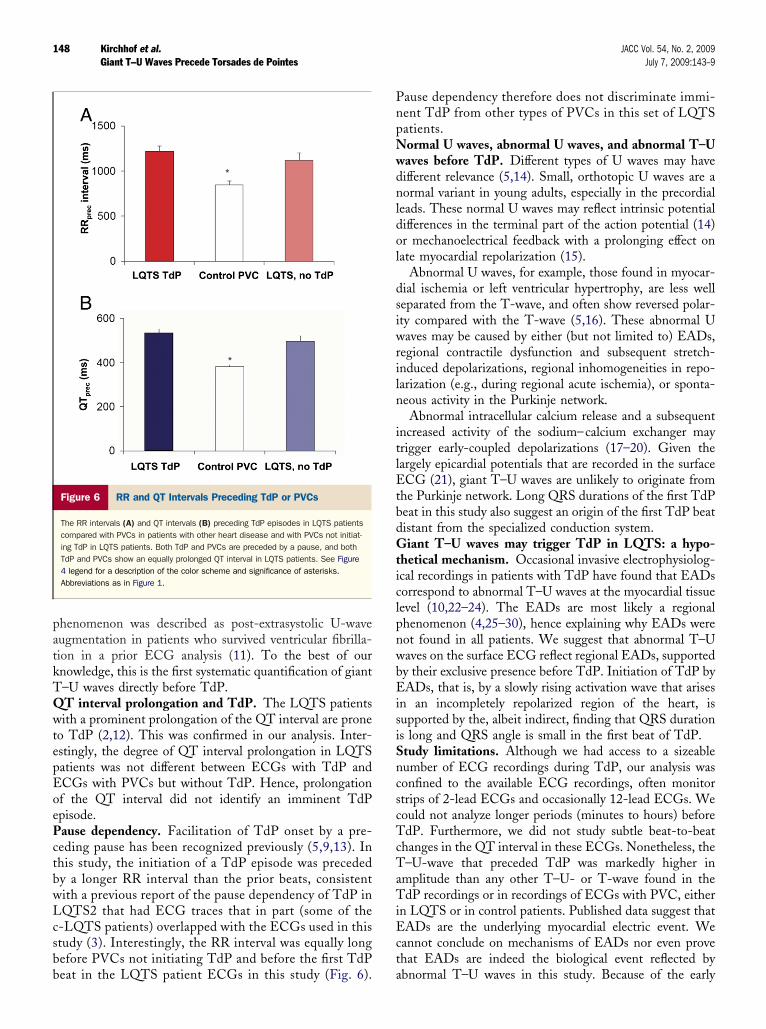
pstroke velocity and thus translate into a slower initialRS rise (or descent) angle, as well as a longer QRS
uration. Indeed, QRS duration of the first TdP beat wasonger, and QRS angle lower, before TdP than that ofVCs in patients with LQTS or in patients with a normalT interval (Fig. 5).ause dependency of TdP? The RR intervals and QT
ntervals preceding either TdP or PVC were longer inQTS patients than RR intervals preceding PVCs inatients with other heart disease. Of note, neither RRnterval nor QT interval were more prolonged before TdPhan RR interval or QT interval before PVCs not inducingdP in LQTS patients (Fig. 6).
iscussion
ain findings. Our ECG analysis in a prospectively col-ected ECG database of LQTS patients identified several
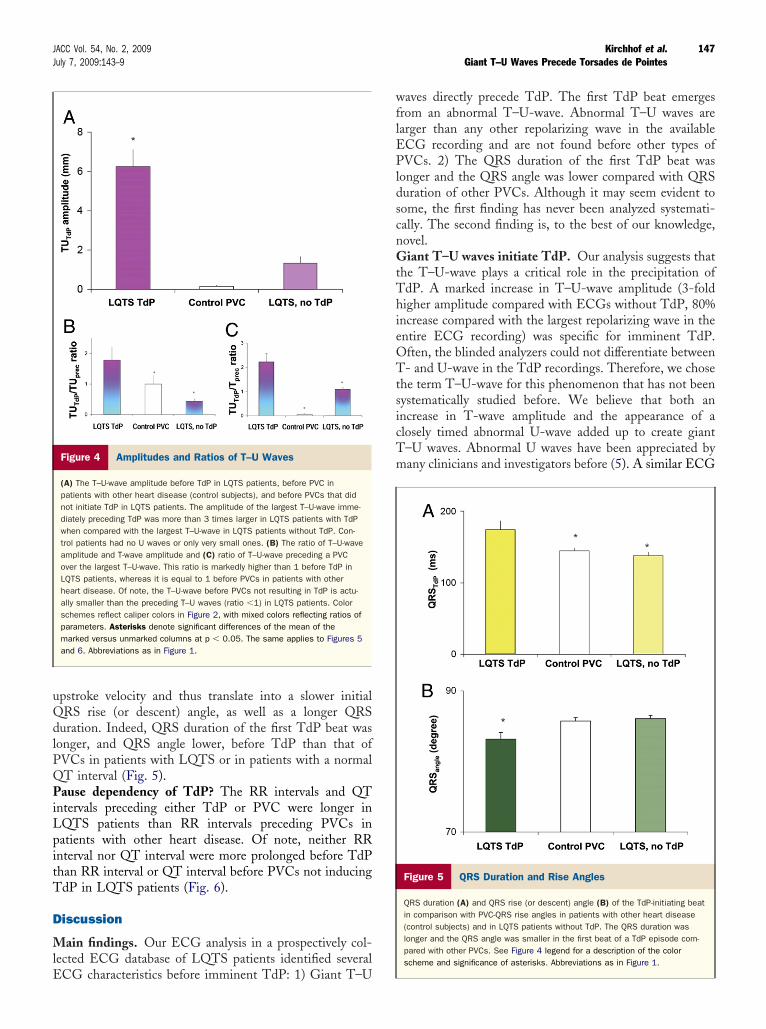
Figure 4 Amplitudes and Ratios of T–U Waves
(A) The T–U-wave amplitude before TdP in LQTS patients, before PVC inpatients with other heart disease (control subjects), and before PVCs that didnot initiate TdP in LQTS patients. The amplitude of the largest T–U-wave imme-diately preceding TdP was more than 3 times larger in LQTS patients with TdPwhen compared with the largest T–U-wave in LQTS patients without TdP. Con-trol patients had no U waves or only very small ones. (B) The ratio of T–U-waveamplitude and T-wave amplitude and (C) ratio of T–U-wave preceding a PVCover the largest T–U-wave. This ratio is markedly higher than 1 before TdP inLQTS patients, whereas it is equal to 1 before PVCs in patients with otherheart disease. Of note, the T–U-wave before PVCs not resulting in TdP is actu-ally smaller than the preceding T–U waves (ratio �1) in LQTS patients. Colorschemes reflect caliper colors in Figure 2, with mixed colors reflecting ratios ofparameters. Asterisks denote significant differences of the mean of themarked versus unmarked columns at p � 0.05. The same applies to Figures 5and 6. Abbreviations as in Figure 1.
CG characteristics before imminent TdP: 1) Giant T–U
aves directly precede TdP. The first TdP beat emergesrom an abnormal T–U-wave. Abnormal T–U waves arearger than any other repolarizing wave in the availableCG recording and are not found before other types ofVCs. 2) The QRS duration of the first TdP beat was
onger and the QRS angle was lower compared with QRSuration of other PVCs. Although it may seem evident toome, the first finding has never been analyzed systemati-ally. The second finding is, to the best of our knowledge,ovel.iant T–U waves initiate TdP. Our analysis suggests that
he T–U-wave plays a critical role in the precipitation ofdP. A marked increase in T–U-wave amplitude (3-foldigher amplitude compared with ECGs without TdP, 80%
ncrease compared with the largest repolarizing wave in thentire ECG recording) was specific for imminent TdP.ften, the blinded analyzers could not differentiate between- and U-wave in the TdP recordings. Therefore, we chose
he term T–U-wave for this phenomenon that has not beenystematically studied before. We believe that both anncrease in T-wave amplitude and the appearance of alosely timed abnormal U-wave added up to create giant–U waves. Abnormal U waves have been appreciated byany clinicians and investigators before (5). A similar ECG
Figure 5 QRS Duration and Rise Angles
QRS duration (A) and QRS rise (or descent) angle (B) of the TdP-initiating beatin comparison with PVC-QRS rise angles in patients with other heart disease(control subjects) and in LQTS patients without TdP. The QRS duration waslonger and the QRS angle was smaller in the first beat of a TdP episode com-pared with other PVCs. See Figure 4 legend for a description of the colorscheme and significance of asterisks. Abbreviations as in Figure 1.
patkTQwtepEoePctbwLcsbb
PnpNwdnldol
dsiwriln
itlEtbdGticlpnwbEisiSncscTcTaTiEct
148 Kirchhof et al. JACC Vol. 54, No. 2, 2009Giant T–U Waves Precede Torsades de Pointes July 7, 2009:143–9
henomenon was described as post-extrasystolic U-waveugmentation in patients who survived ventricular fibrilla-ion in a prior ECG analysis (11). To the best of ournowledge, this is the first systematic quantification of giant–U waves directly before TdP.T interval prolongation and TdP. The LQTS patientsith a prominent prolongation of the QT interval are prone
o TdP (2,12). This was confirmed in our analysis. Inter-stingly, the degree of QT interval prolongation in LQTSatients was not different between ECGs with TdP andCGs with PVCs but without TdP. Hence, prolongationf the QT interval did not identify an imminent TdPpisode.ause dependency. Facilitation of TdP onset by a pre-eding pause has been recognized previously (5,9,13). Inhis study, the initiation of a TdP episode was precededy a longer RR interval than the prior beats, consistentith a previous report of the pause dependency of TdP inQTS2 that had ECG traces that in part (some of the-LQTS patients) overlapped with the ECGs used in thistudy (3). Interestingly, the RR interval was equally longefore PVCs not initiating TdP and before the first TdP
Figure 6 RR and QT Intervals Preceding TdP or PVCs
The RR intervals (A) and QT intervals (B) preceding TdP episodes in LQTS patientscompared with PVCs in patients with other heart disease and with PVCs not initiat-ing TdP in LQTS patients. Both TdP and PVCs are preceded by a pause, and bothTdP and PVCs show an equally prolonged QT interval in LQTS patients. See Figure4 legend for a description of the color scheme and significance of asterisks.Abbreviations as in Figure 1.
eat in the LQTS patient ECGs in this study (Fig. 6). a
ause dependency therefore does not discriminate immi-ent TdP from other types of PVCs in this set of LQTSatients.ormal U waves, abnormal U waves, and abnormal T–Uaves before TdP. Different types of U waves may haveifferent relevance (5,14). Small, orthotopic U waves are aormal variant in young adults, especially in the precordial
eads. These normal U waves may reflect intrinsic potentialifferences in the terminal part of the action potential (14)r mechanoelectrical feedback with a prolonging effect onate myocardial repolarization (15).
Abnormal U waves, for example, those found in myocar-ial ischemia or left ventricular hypertrophy, are less welleparated from the T-wave, and often show reversed polar-ty compared with the T-wave (5,16). These abnormal Uaves may be caused by either (but not limited to) EADs,
egional contractile dysfunction and subsequent stretch-nduced depolarizations, regional inhomogeneities in repo-arization (e.g., during regional acute ischemia), or sponta-eous activity in the Purkinje network.Abnormal intracellular calcium release and a subsequent
ncreased activity of the sodium–calcium exchanger mayrigger early-coupled depolarizations (17–20). Given theargely epicardial potentials that are recorded in the surfaceCG (21), giant T–U waves are unlikely to originate from
he Purkinje network. Long QRS durations of the first TdPeat in this study also suggest an origin of the first TdP beatistant from the specialized conduction system.iant T–U waves may trigger TdP in LQTS: a hypo-
hetical mechanism. Occasional invasive electrophysiolog-cal recordings in patients with TdP have found that EADsorrespond to abnormal T–U waves at the myocardial tissueevel (10,22–24). The EADs are most likely a regionalhenomenon (4,25–30), hence explaining why EADs wereot found in all patients. We suggest that abnormal T–Uaves on the surface ECG reflect regional EADs, supportedy their exclusive presence before TdP. Initiation of TdP byADs, that is, by a slowly rising activation wave that arises
n an incompletely repolarized region of the heart, isupported by the, albeit indirect, finding that QRS durations long and QRS angle is small in the first beat of TdP.tudy limitations. Although we had access to a sizeableumber of ECG recordings during TdP, our analysis wasonfined to the available ECG recordings, often monitortrips of 2-lead ECGs and occasionally 12-lead ECGs. Weould not analyze longer periods (minutes to hours) beforedP. Furthermore, we did not study subtle beat-to-beat
hanges in the QT interval in these ECGs. Nonetheless, the–U-wave that preceded TdP was markedly higher in
mplitude than any other T–U- or T-wave found in thedP recordings or in recordings of ECGs with PVC, either
n LQTS or in control patients. Published data suggest thatADs are the underlying myocardial electric event. We
annot conclude on mechanisms of EADs nor even provehat EADs are indeed the biological event reflected by
bnormal T–U waves in this study. Because of the early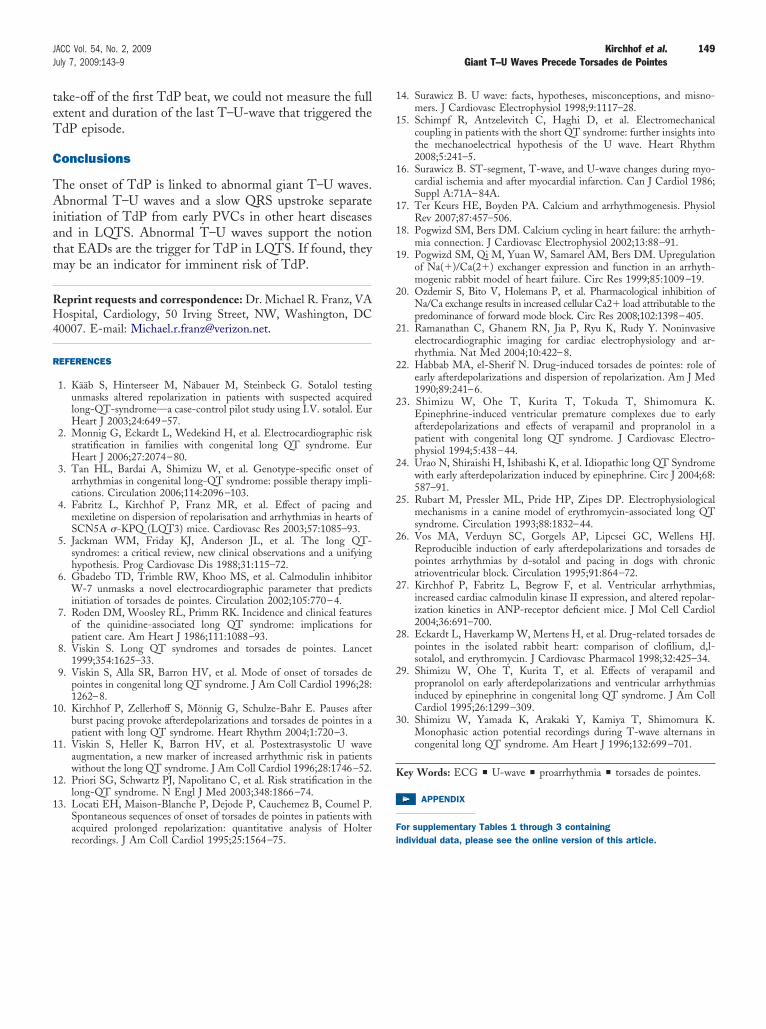
teT
C
TAiatm
RH4
R
1
1
1
1
1
1
1
1
1
1
2
2
2
2
2
2
2
2
2
2
3
K
F
149JACC Vol. 54, No. 2, 2009 Kirchhof et al.July 7, 2009:143–9 Giant T–U Waves Precede Torsades de Pointes
ake-off of the first TdP beat, we could not measure the fullxtent and duration of the last T–U-wave that triggered thedP episode.
onclusions
he onset of TdP is linked to abnormal giant T–U waves.bnormal T–U waves and a slow QRS upstroke separate
nitiation of TdP from early PVCs in other heart diseasesnd in LQTS. Abnormal T–U waves support the notionhat EADs are the trigger for TdP in LQTS. If found, theyay be an indicator for imminent risk of TdP.
eprint requests and correspondence: Dr. Michael R. Franz, VAospital, Cardiology, 50 Irving Street, NW, Washington, DC
0007. E-mail: [email protected].
EFERENCES
1. Kääb S, Hinterseer M, Näbauer M, Steinbeck G. Sotalol testingunmasks altered repolarization in patients with suspected acquiredlong-QT-syndrome—a case-control pilot study using I.V. sotalol. EurHeart J 2003;24:649–57.
2. Monnig G, Eckardt L, Wedekind H, et al. Electrocardiographic riskstratification in families with congenital long QT syndrome. EurHeart J 2006;27:2074–80.
3. Tan HL, Bardai A, Shimizu W, et al. Genotype-specific onset ofarrhythmias in congenital long-QT syndrome: possible therapy impli-cations. Circulation 2006;114:2096–103.
4. Fabritz L, Kirchhof P, Franz MR, et al. Effect of pacing andmexiletine on dispersion of repolarisation and arrhythmias in hearts ofSCN5A �-KPQ (LQT3) mice. Cardiovasc Res 2003;57:1085–93.
5. Jackman WM, Friday KJ, Anderson JL, et al. The long QT-syndromes: a critical review, new clinical observations and a unifyinghypothesis. Prog Cardiovasc Dis 1988;31:115–72.
6. Gbadebo TD, Trimble RW, Khoo MS, et al. Calmodulin inhibitorW-7 unmasks a novel electrocardiographic parameter that predictsinitiation of torsades de pointes. Circulation 2002;105:770–4.
7. Roden DM, Woosley RL, Primm RK. Incidence and clinical featuresof the quinidine-associated long QT syndrome: implications forpatient care. Am Heart J 1986;111:1088–93.
8. Viskin S. Long QT syndromes and torsades de pointes. Lancet1999;354:1625–33.
9. Viskin S, Alla SR, Barron HV, et al. Mode of onset of torsades depointes in congenital long QT syndrome. J Am Coll Cardiol 1996;28:1262–8.
0. Kirchhof P, Zellerhoff S, Mönnig G, Schulze-Bahr E. Pauses afterburst pacing provoke afterdepolarizations and torsades de pointes in apatient with long QT syndrome. Heart Rhythm 2004;1:720–3.
1. Viskin S, Heller K, Barron HV, et al. Postextrasystolic U waveaugmentation, a new marker of increased arrhythmic risk in patientswithout the long QT syndrome. J Am Coll Cardiol 1996;28:1746–52.
2. Priori SG, Schwartz PJ, Napolitano C, et al. Risk stratification in thelong-QT syndrome. N Engl J Med 2003;348:1866–74.
3. Locati EH, Maison-Blanche P, Dejode P, Cauchemez B, Coumel P.Spontaneous sequences of onset of torsades de pointes in patients with
acquired prolonged repolarization: quantitative analysis of Holterrecordings. J Am Coll Cardiol 1995;25:1564–75. i4. Surawicz B. U wave: facts, hypotheses, misconceptions, and misno-mers. J Cardiovasc Electrophysiol 1998;9:1117–28.
5. Schimpf R, Antzelevitch C, Haghi D, et al. Electromechanicalcoupling in patients with the short QT syndrome: further insights intothe mechanoelectrical hypothesis of the U wave. Heart Rhythm2008;5:241–5.
6. Surawicz B. ST-segment, T-wave, and U-wave changes during myo-cardial ischemia and after myocardial infarction. Can J Cardiol 1986;Suppl A:71A–84A.
7. Ter Keurs HE, Boyden PA. Calcium and arrhythmogenesis. PhysiolRev 2007;87:457–506.
8. Pogwizd SM, Bers DM. Calcium cycling in heart failure: the arrhyth-mia connection. J Cardiovasc Electrophysiol 2002;13:88–91.
9. Pogwizd SM, Qi M, Yuan W, Samarel AM, Bers DM. Upregulationof Na(�)/Ca(2�) exchanger expression and function in an arrhyth-mogenic rabbit model of heart failure. Circ Res 1999;85:1009–19.
0. Ozdemir S, Bito V, Holemans P, et al. Pharmacological inhibition ofNa/Ca exchange results in increased cellular Ca2� load attributable to thepredominance of forward mode block. Circ Res 2008;102:1398–405.
1. Ramanathan C, Ghanem RN, Jia P, Ryu K, Rudy Y. Noninvasiveelectrocardiographic imaging for cardiac electrophysiology and ar-rhythmia. Nat Med 2004;10:422–8.
2. Habbab MA, el-Sherif N. Drug-induced torsades de pointes: role ofearly afterdepolarizations and dispersion of repolarization. Am J Med1990;89:241–6.
3. Shimizu W, Ohe T, Kurita T, Tokuda T, Shimomura K.Epinephrine-induced ventricular premature complexes due to earlyafterdepolarizations and effects of verapamil and propranolol in apatient with congenital long QT syndrome. J Cardiovasc Electro-physiol 1994;5:438–44.
4. Urao N, Shiraishi H, Ishibashi K, et al. Idiopathic long QT Syndromewith early afterdepolarization induced by epinephrine. Circ J 2004;68:587–91.
5. Rubart M, Pressler ML, Pride HP, Zipes DP. Electrophysiologicalmechanisms in a canine model of erythromycin-associated long QTsyndrome. Circulation 1993;88:1832–44.
6. Vos MA, Verduyn SC, Gorgels AP, Lipcsei GC, Wellens HJ.Reproducible induction of early afterdepolarizations and torsades depointes arrhythmias by d-sotalol and pacing in dogs with chronicatrioventricular block. Circulation 1995;91:864–72.
7. Kirchhof P, Fabritz L, Begrow F, et al. Ventricular arrhythmias,increased cardiac calmodulin kinase II expression, and altered repolar-ization kinetics in ANP-receptor deficient mice. J Mol Cell Cardiol2004;36:691–700.
8. Eckardt L, Haverkamp W, Mertens H, et al. Drug-related torsades depointes in the isolated rabbit heart: comparison of clofilium, d,l-sotalol, and erythromycin. J Cardiovasc Pharmacol 1998;32:425–34.
9. Shimizu W, Ohe T, Kurita T, et al. Effects of verapamil andpropranolol on early afterdepolarizations and ventricular arrhythmiasinduced by epinephrine in congenital long QT syndrome. J Am CollCardiol 1995;26:1299–309.
0. Shimizu W, Yamada K, Arakaki Y, Kamiya T, Shimomura K.Monophasic action potential recordings during T-wave alternans incongenital long QT syndrome. Am Heart J 1996;132:699–701.
ey Words: ECG y U-wave y proarrhythmia y torsades de pointes.
APPENDIX
or supplementary Tables 1 through 3 containing
ndividual data, please see the online version of this article.