Embed Size (px)
Citation preview
Rationale Optimism
Issues Driving Explosive Growth in Latin America
GIL Latin America 2013
January 2013

“Only those who will risk going too far can possibly find out how far one can go.” – T.S. Eliot
2
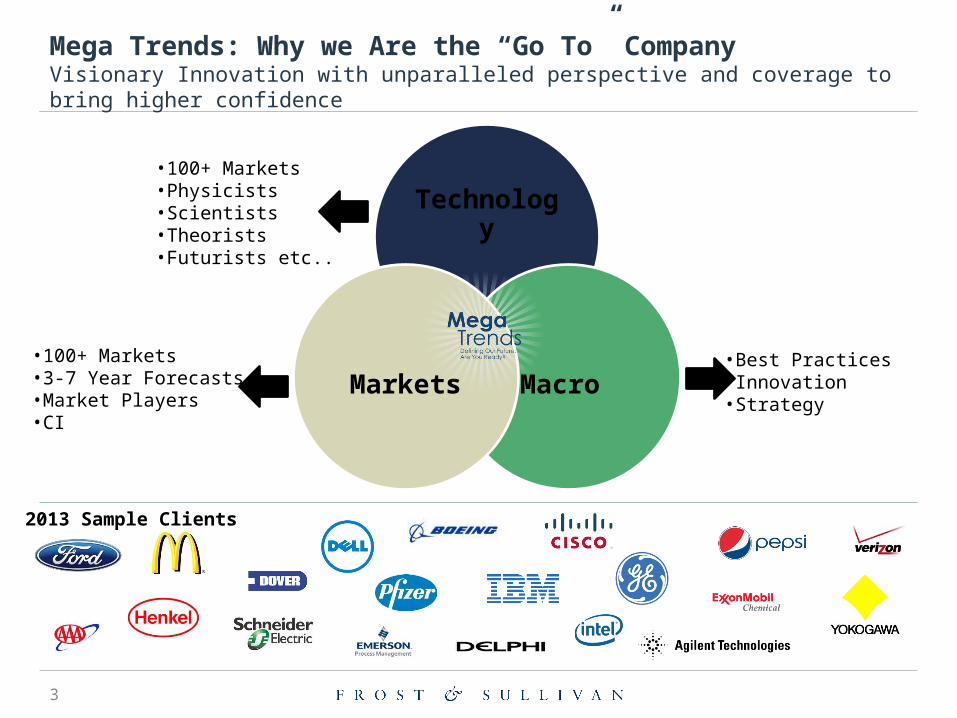
Mega Trends: Why we Are the “Go To” CompanyVisionary Innovation with unparalleled perspective and coverage to bring higher confidence
3
Technology
Macro Markets
•100+ Markets•Physicists•Scientists•Theorists•Futurists etc..
•100+ Markets•3-7 Year Forecasts•Market Players•CI
•Best Practices•Innovation•Strategy
2013 Sample Clients
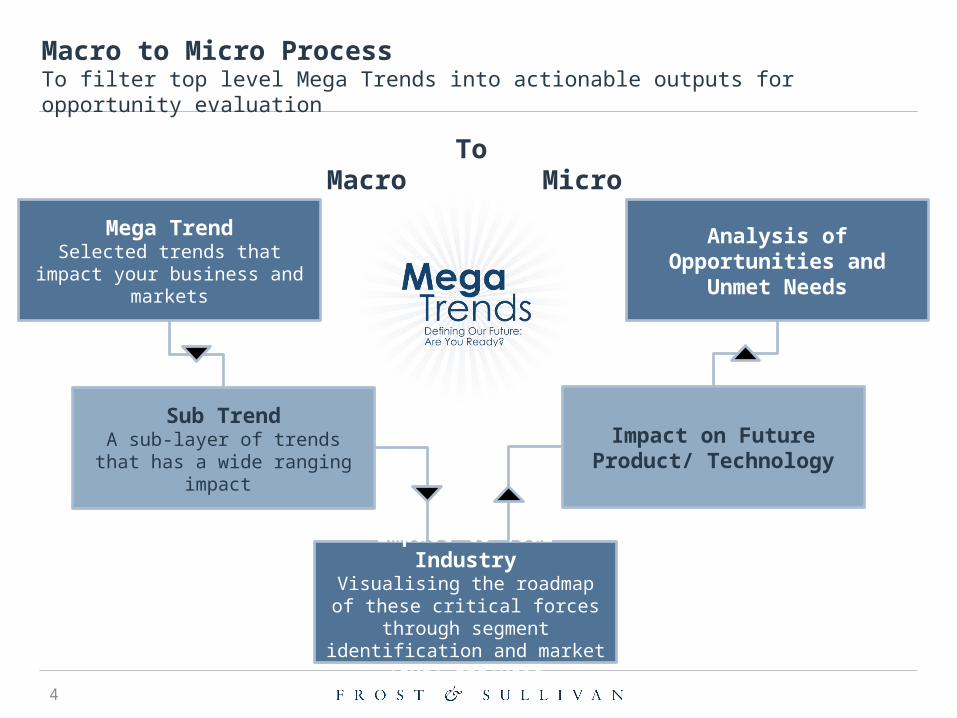
Macro to Micro ProcessTo filter top level Mega Trends into actionable outputs for opportunity evaluation
4
Macro Micro
Mega TrendSelected trends that impact your
business and markets
Sub TrendA sub-layer of trends that has a
wide ranging impact
Impact to Your IndustryVisualising the roadmap of these critical forces through segment identification and market level
analysis
Impact on Future Product/ Technology
Analysis of Opportunities and Unmet Needs
To

Definition of Mega Trends
Our Mega Trend Definition? Impact of Mega Trends on Key
Organizational Functions
“Mega Trends are global, sustained forces of
development that are transformational to
business, economy, society, cultures and personal lives”
Marketing and Strategy
R&D Budget Spending
Product Planning and Development
Technology Planning
Innovation Scouting
5
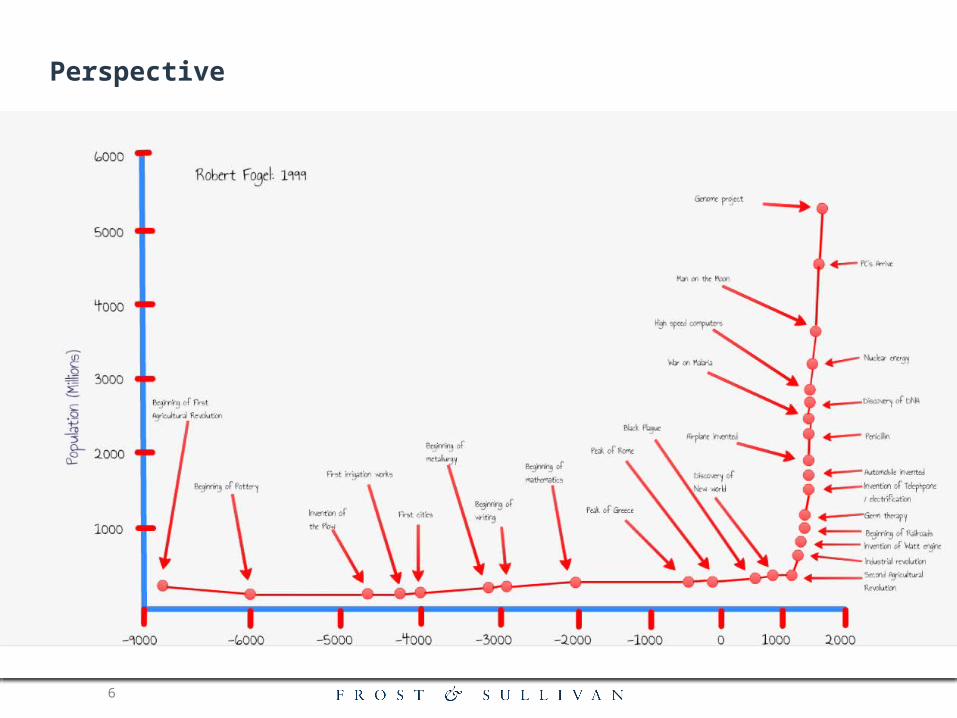
Perspective
6

Motivation
7
Motivation Infrastructure
Business

MOTIVATION
8
MOTIVATION

Gen YGeo Socialization
“She-conomy”
Aging Population
Reverse Brain Drain
Middle Bulge
Generational Political
Shift
Surge in Asian Work
Pool
9

10
2.6%5.5%
6.7%
8.4%(17.2)
18.4%(37.7)
31.9%(65.4)
26.5%(54.3)
Generation Y - Latin America to Have Almost 31% of Its Population (204.9 million) in Gen Y (15–34 years) in 2025
Total Population = 661 million
65 years and above 35–64 years 15–34 years 0–14 yearsChileVenezuela
Argentina
Colombia
Mexico
Brazil
Rest of LA
Note: Figures in brackets denote million of people Source: CEPALSTAT 2012, Frost & Sullivan Analysis.
Total Population = 577 million
Population Breakdown by Age, Latin America, 2010
Population Breakdown by Age, Latin America, 2025
Gen Y : Breakdown by Country, Latin America, 2025
27.7% (159.8)
34.2%
(197.3)
31.2%
(180.0)
6.9%
(39.8) 22.0% (145.4)
31.0% (204.9)
36.5% (241.3)
10.5% (69.4)
Personalization and Individualization
Techno Savvy and Connected 24 X 7
Civic and Environmentally
Friendly
Demanding and Impatient – “Fast and the Furious”
Gen Y Consumption Behaviour
(11.3)
(13.7)
(5.3)
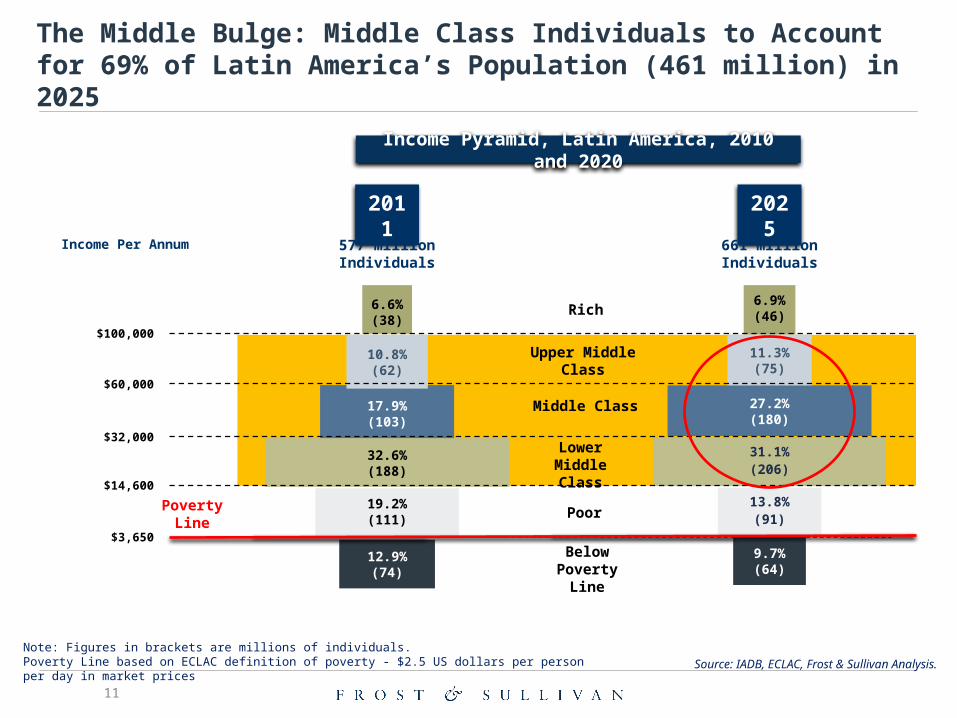
The Middle Bulge: Middle Class Individuals to Account for 69% of Latin America’s Population (461 million) in 2025
Source: IADB, ECLAC, Frost & Sullivan Analysis.Note: Figures in brackets are millions of individuals.Poverty Line based on ECLAC definition of poverty - $2.5 US dollars per person per day in market prices
2025
661 million Individuals
2011
577 million Individuals
$32,000
$14,600
$60,000
$3,650
$100,000
10.8%(62)
Below Poverty Line
Poor
Lower Middle Class
Middle Class
Upper Middle Class
Rich
31.1%(206)
9.7%(64)
13.8%(91)
27.2%(180)
11.3%(75)
Income Per Annum
Poverty Line
12.9%(74)
32.6%(188)
6.6%(38)
19.2%(111)
17.9%(103)
6.9%(46)
Income Pyramid, Latin America, 2010 and 2020
11

12
Informal Settlements- Over 163 million people living in Informal Settlements in Latin America needing $3 trillion investments in housing by 2020
Sanitation
Telecom&Energy
Macro to Micro Implications
Banking the unbanked
Retail
Consumer goods
Education -
Micro credit and pre-paid credit card
Sewage collection and tratment
Low cost and formal Pay TV adn energy services
Public financing for higher education
- Economic size, same quality less design
- Mini-stores and check out appreciation
1990 2001 2010 20200
200
400
600
800
1,000
111 128 143 163123 188
271
419420
533649
807
Asia Africa Latin America
Population Living in Informal Settlements, Selected Regions, 1990 - 2020
Source: ECLAC, Frost & Sullivan
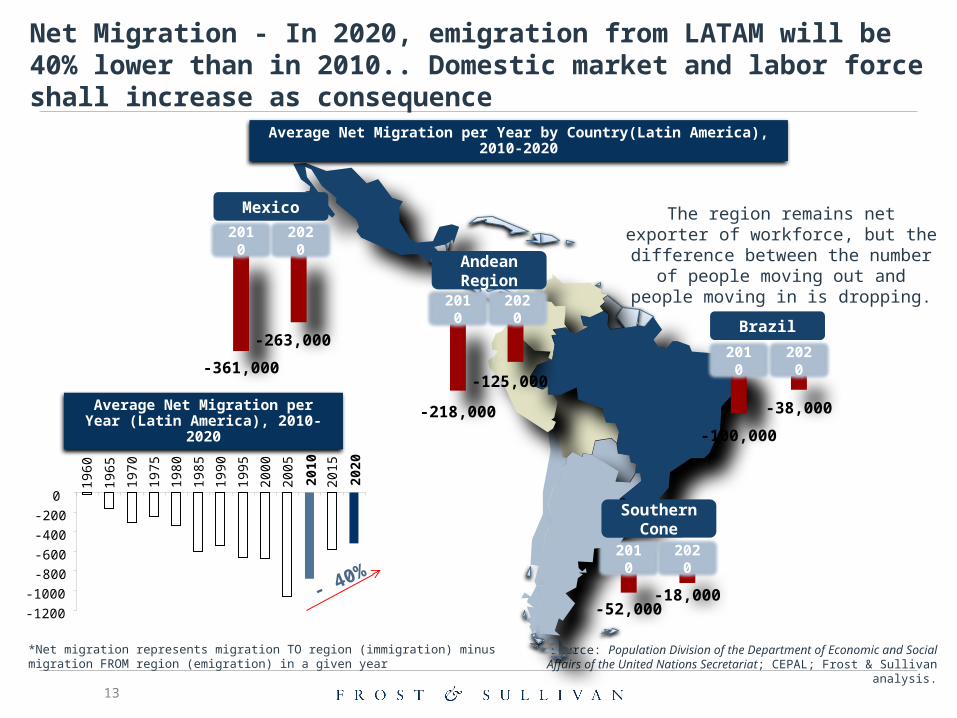
Source: Population Division of the Department of Economic and Social Affairs of the United Nations Secretariat; CEPAL; Frost & Sullivan analysis.
The region remains net exporter of workforce, but the difference between the number of people moving out and
people moving in is dropping.
Net Migration - In 2020, emigration from LATAM will be 40% lower than in 2010.. Domestic market and labor force shall increase as consequence
*Net migration represents migration TO region (immigration) minus migration FROM region (emigration) in a given year
-1200
-1000
-800
-600
-400
-200
0
1960
1965
1970
1975
1980
1985
1990
1995
2000
2005
2010
2015
2020
Mexico
2010 2020
-361,000
-263,0002010 2020
-100,000
-38,000
2010 2020
-218,000
-125,000
2010 2020
-52,000-18,000
Brazil
Andean Region
Southern Cone
- 40%
Average Net Migration per Year by Country(Latin America), 2010-2020
Average Net Migration per Year (Latin America), 2010-2020
13

14
INFRASTRUCTUREINFRASTRUCTURE

Mega Cities: By 2025, it is expected that 85.7% of the population (566.5 million people) in Latin America will be living in urban areas
People per Square Kilometre
Highly Urban Countries More than 200 people
Medium-High Urban Countries 100 – 200 people
Medium Urban Countries 50 – 100 people
Low-Medium Urban Countries 10 – 50 people
Low Urban Countries Less than 10 people
Mexico CityPopulation
2025:24.6 millionGDP 2025:
$713.5 billion
BogotaPopulation
2025:11.4 millionGDP 2025:
$298.0 billion
Rio de JaneiroPopulation
2025:13.6 millionGDP 2025:
$327.1 billion
Buenos Aires
Population 2025:
15.5 millionGDP 2025:
$327.1 billion
Sao PauloPopulation
2025:23.2 millionGDP 2025:
$643.9 billion
Mega Cities in 2025
Emerging Mega Cities (4-8 million population in 2025)
SantiagoPopulation
2025:7.1 million
Belo HorizontePopulation
2025:6.6 million
GuadalajaraPopulation
2025:5.7 million
Source: United Nations, Department of Economic and Social Affairs Statistics, Frost & Sullivan and other regional and country level statistics bureau
LimaPopulation
2025:11.5 million
15

Mega Corridors: Latin America to See 3 Mega Corridors by 2025 with almost 80 million inhabitants
Photo credits: Google MapsSource: Frost & Sullivan
Rio de Janeiro - Sao Paulo – Campinas
Corridor
Distance: 511 km
Population: 44.3 million
GDP Contribution: 57% of Brazil’s GDP
Toluca - Mexico City – Puebla Corridor
Distance: 198 Km
Population: 31.8 million
GDP Contribution: 39% of Mexico’s GDP
Buenos Aires – Rosario – Cordoba Corridor
Distance: 710 Km
Population: 21.1 million
GDP Contribution: 49% of Argentina’s GDP
Mega Corridors in 2025Emerging Mega Corridors in 2025
16

Infrastructure in Latin America: Latin America’s infrastructure is significantly behind OECD countries, demanding significant investments
Broadband density per 100 people
Electric power consumption (kWh per capita)
1907 8376
6.6 23.8
Improved water as % urban population 97.1% 99.6%
Improved sanitation as % population 87.0% 94.0%
Roads, paved (% of total roads) 33.3% 86.5%
Latin American countries
OECD countries*
Latin America has a large infrastructure deficit…
Country / Region % of GDP
Argentina 4.0%
Brazil 8.0%
Chile 5.0%
Colombia 9.0%
Costa Rica 3.0%
Mexico 2.0%
Peru 11.0%
Venezuela 4.0%
Total LatAm 6.0%
Annual investment in infrastructure over 20 years to equal the same level of South Korea (as % of GDP)
And significant amounts need to be spent
Rail lines (total route-km)
Air transport, registered carrier departures (million)
562,410 km93,454 km
1,838,212 18,639,951
* Includes Chile and MexicoSource: The Worldbank WDI database, 2010; WHO World Health Statistics 2011
Oil & Gas Pipelines (length in km) 26,500 All continent
17

Source: Central Intelligence Agency, DNIT, Frost & Sullivan analysis
Latin America 2010
• The lowest percentage of highway in total transportation (which is cheaper than other modals)
• Low pipeline system integrating countries
• Countries with low integration
Latin America 2025
• Focus on railroad• Extensive pipeline system increasing
the exports of liquid fuels• More balanced distribution among
modals• More integrated countries
Evolution of Latin America
Transportation
58%
33%25%
32%
13%
29%
4% 5%0.4% 1%
2005 2025
highway railroad hidroway pipeline aerial
Investments in Infrastructure: Investments in alternate modes of transportation in Brazil are expected to drop the utilization of highways from 58% to 33% by 2025
**BRIC (without Brazil)*Europe (Germany, UK and Italy)
Infrastructure: Distribution of Modals by Region (Global), 2010
Expected Distribution of Modal Transportation (Brazil), 2005-2025
18

City as a Customer – Concept and Definition
City as A Customer is an implication of urbanisationwherein cities (and not countries) are looked as potential customers and hubs of investment, wealth creation and economic growth .Every city will be highly unique in its infrastructure demands offering cross-sectoral micro implications and opportunities in following industries:
• Mobility• Building• Healthcare• Energy• Materials• Automation • Security• Retail
This in turn will drive:• Companies to internally revamp in house-competencies
and products/services portfolio to target cities as customers
• City Infrastructure market to develop into a new industry offering new white space market opportunities
• Highly customized and innovative city solutions and new urban business models
• Cities to wield economic and investment clout on par with countries
City as A Customer
Source: Frost & Sullivan analysis
19

HEALTH
20
BUSINESS
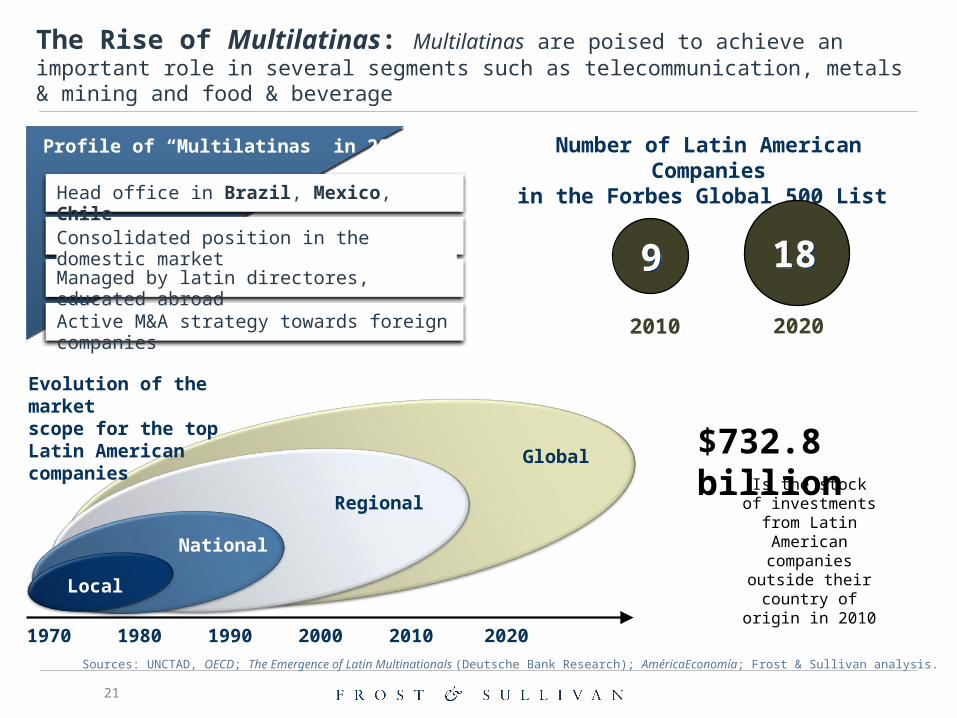
The Rise of Multilatinas: Multilatinas are poised to achieve an important role in several segments such as telecommunication, metals & mining and food & beverage
Sources: UNCTAD, OECD; The Emergence of Latin Multinationals (Deutsche Bank Research); AméricaEconomía; Frost & Sullivan analysis.
Local
National
Regional
Global
20202010200019901970 1980
Evolution of the market scope for the top Latin American companies
Profile of “Multilatinas” in 2020
Head office in Brazil, Mexico, Chile
Consolidated position in the domestic market
Managed by latin directores, educated abroad
Active M&A strategy towards foreign companies
Number of Latin American Companiesin the Forbes Global 500 List
20202010
99 1818
Is the stock of investments from
Latin American companies outside
their country of origin in 2010
$732.8 billion
21

Reverse Brain Drain: By 2020, the flow of people is likely to have become intra region with the development of the countries such as Mexico and Argentina
Hot Spot: Brazil People coming mainly from USA, UK.
Source: Frost & Sullivan Analysis
2010
Hot Spots: Mexico, Argentina and Chile.Increase on the intra region flow of people
2020
The countries are expected to become specialized in some specifics areas (E.g: Mexico as a software developer and contact center hub)
22

Income Redistribution Programs: The most important programs for income redistribution in Latin America are expected to grow at a 3.3 per cent average annual rate to reach 190 million of beneficiaries by 2020
Sources: Miguel Niño-Zarazúa, Brooks World Poverty Institute; Julia Johannsen, BID; ILO; SEDESOL (Mexico); Ministério do Desenvolvimento Social e Combate à Fome (Brasil); Frost & Sullivan analysis.
Argentina
Programa Familias para la Inclusión Social (Families for Social Inclusion): 7.5 million Regimen de Asignaciones Familiares (Scheme of Family Allowances): 5.7 million Pensiones Asistenciales (Social Pension): 0.3 million
Brazil
Bolsa Família (Family Assistance Program): 52 million Previdência Rural (Rural Pension): 11 million BPC (Benefit of Continuous Grant for Old Age and Disability) and RMV (Monthly Life Income for Old Age and Disability): 3.7 million
Bolivia
Bono “Juancito Pinto”: 9 million Bono Dignidad (Dignity): 3.4 million Bono “Madre Niño” and “Bono Juana Azurduy de Padilla”: 1.2 million
Colombia
Familias en Accion (Families in Action): 7.5 million Juntos (Together): 1.7 million
Mexico
Oportunidades (Opportunities, former “Progresa”): 27.5 million Programa de Apoyo Alimentario (Food Support Program): 4.1 million 70 y mas (70 and Over): 4 million
*An extended compilation of income redistribution programs for Latin American countries is available in the appendix section
23

New Business Models: Latin American companies are now turning to new business models that will maximize the value added of their product and services
The Rise of Mobile Solutions
Personalization and Individualization
Collaborative Thinking and Crowd Sourcing
Source: Frost & Sullivan
Value for Many
24

We will be witnessing
robots in homes
Digital assistants will guide our
lives
Cars to have autonomous
functions
Your health will be driven
Considerable Settlement Evolution
Designer drugs begin to emerge
Latin America is viewed as a
growth engine
Virtual world will threaten
Innovating to 2020 – a few careful predictions to come
25

Contact Details
Richard SearVice President – Visionary Innovation
(210) 247-3840
26
Join Our Mega Trend Group On
Mega Trends: Strategic Planning and Innovation Based on Frost & Sullivan Research
@searrichard