Embed Size (px)
Citation preview

GILA RIVER INDIAN COMMUNITY DEPARTMENT OF ENVIRONMENTAL QUALITY
Post Office Box 97 • Sacaton, Arizona 85147 • (520) 562-2234 • FAX: (520) 562-2245
August 25, 2014 Meredith Kurpius E-mail: [email protected] Chief, Air Quality Analysis EPA Region 9 Air Division 75 Hawthorne St. San Francisco, CA 94105 Re: 2013 GRIC Air Monitoring Network Review Gila River Indian Community Dear Ms. Kurpius: The Gila River Indian Community (GRIC or Community) Department of Environmental Quality (DEQ) has developed the 2013 Ambient Air Monitoring Network Review document for the three ambient air quality monitoring sites within the Community. A copy of the document was made available to members of the Community for review. The GRIC DEQ also presented a summary of the information contained document to the members of the Community through district community meetings. The presentations were well received by the Community members. The 2013 Ambient Air Monitoring Network Review is attached for your review and approval of the recommendations within the document. If you have any questions please contact me at [email protected] or (520) 796-3781. Sincerely, Ryan Eberle, P.E. Air Quality Program Manager, GRIC DEQ
Cc w/ attachment: Ondrea Barber, Director GRIC DEQ Leroy Williams, GRIC DEQ AQ Program Michael Flagg, EPA Region 9 Colleen McKaughan, EPA Region 9

2013AMBIENTAIRMONITORINGNETWORKREVIEW
Gila River Indian Community
Department of Environmental Quality Air Quality Air Monitoring Program
August 2014

2013 GRIC Network Review ii August 2014
TABLEOFCONTENTS
Definition of Terms ....................................................................................................................... 1
1 Introduction ........................................................................................................................... 4
2 Air Monitoring Network Design .......................................................................................... 6
2.1 Monitoring Objectives .................................................................................................................. 6
2.2 Spacial Scales ................................................................................................................................ 6
3 Gila River Indian Community Ambient Air Monitoring Network .................................. 8
3.1 General .......................................................................................................................................... 8
3.2 Ozone Monitoring Network ........................................................................................................ 10
3.2.1 Background ............................................................................................................................................ 10
3.2.2 2013 Monitoring Results Summary ....................................................................................................... 11
3.3 PM10 Particulate Monitoring Network ....................................................................................... 12
3.3.1 Background ............................................................................................................................................ 12
3.3.2 2013 Monitoring Results Summary ....................................................................................................... 12
3.4 Changes to the Network in 2013 ................................................................................................. 13
3.5 Proposed Network Changes and Improvements ......................................................................... 13
4 Compliance Discussion ....................................................................................................... 15
4.1 Minimum Monitoring Requirements .......................................................................................... 16
4.2 Data Submission Requirements .................................................................................................. 17
4.3 Air Quality Data .......................................................................................................................... 18
4.4 Audits .......................................................................................................................................... 18
5 Public Notice ........................................................................................................................ 20
5.1 News Release .............................................................................................................................. 20
5.2 District Meeting Presentations .................................................................................................... 20
Figures
Figure 3-1: Map of Ambient Air Monitoring Stations on Gila River Indian Community ..............8
Tables
Table 2-1. Relationship Among Monitoring Site Types And Scales Of Representativeness. ....... 7
Table 3-1. Ambient Air Quality Parameters Monitored at Each Station ....................................... 9
Table 3-2. National Ambient Air Quality Standards Monitored for Pollutants by GRIC ............. 9
Table 3-3. Site Types for Each Monitoring Station ..................................................................... 10

2013 GRIC Network Review iii August 2014
Table 3-4. 2013* 8-Hour Average Ozone Summary ................................................................... 11
Table 3-5. Three-Year* Average of 8-Hour Ozone ..................................................................... 11
Table 3-6. 2013 24-Hour Average PM10 Summary .................................................................... 13
Table 4-1. Cross-Reference of 40 CFR 58 Requirements ........................................................... 15
Table 4-2. Ozone Monitoring Requirements for SLAMS (Number of Stations per MSA) ........ 16
Table 4-3. PM10 Monitoring Requirements for SLAMS (Number of Stations per MSA) ......... 16
Table 4-4. Minimum Monitoring Requirements for GRIC Ozone Monitors .............................. 17
Table 4-5. Minimum Monitoring Requirements for GRIC PM10 Monitors ............................... 17
Table 4-6. Sources of Ambient Air Quality Data ........................................................................ 18
Table 4-7. Monthly Audit Dates for Ozone Monitors ................................................................. 18
Table 4-8. Semi-Annual Flow Rate Audit Dates for Filter-Based PM10 Monitor ...................... 19
Table 4-9. Monthly Flow Rate Audit Dates for Continuous TEOM PM10 Monitor .................. 19
Table 5-1. Summary of Comments and Questions Received at District Meetings ..................... 21
Appendices
A Detailed Monitoring Site Information and Photographs
B District Meeting Presentation Slides

2013 GRIC Network Review 1 August 2014
DEFINITIONOFTERMS
AQMP: Air Quality Management Plan. The AQMP is a collection of tribal regulations and plans to achieve healthy air quality under the Clean Air Act. For GRIC, the AQMP is synonymous with the Tribal Implementation Plan (TIP).
AQP: Air Quality Program within the Gila River Indian Community’s Department of Environmental Quality.
AQS: Environmental Protection Agency’s Air Quality System
Attainment: This refers to the NAAQS used to comply with the federal Clean Air Act. After several years of no violations of the NAAQS, the EPA can classify the area as in attainment for that pollutant.
CFR: Code of Federal Regulations.
Community: Gila River Indian Community
Continuous monitoring: A method of monitoring air pollutants that is continually measuring the quantity of the pollutant, either gaseous or particulate. Continuous monitors can be used to obtain real-time or short-term averages of pollutants.
Criteria Pollutants: Six pollutants (Carbon Monoxide, Lead, Nitrogen Dioxide, Ozone, Particulates, and Sulfur Dioxide) that have NAAQS established by the US EPA.
DEQ: Gila River Indian Community’s Department of Environmental Quality
Design Value: A design value is a statistic that describes the air quality status of a given area relative to the level of the NAAQS. For a concentration-based standard, the air quality design value is simply the standard-related test statistic. The design value of a pollutant monitoring network is the highest sample value in the network used to compare to the NAAQS; e.g. the 8-hour ozone design value for the network is the monitor with the highest 3-year average of the 4th highest concentrations each year.
EPA: U. S. Environmental Protection Agency.
Exceptional Events: An uncontrollable event caused by natural sources of pollution or an event that is not expected to recur at a given location. The AQP makes the determination of which events to classify as exceptional

2013 GRIC Network Review 2 August 2014
and those events are then flagged in the AQS. If the EPA concurs with the AQP’s determination, the measured pollution event will not be used in determination of compliance with the NAAQS.
FEM: Federal Equivalency Method. An official method, i.e. equipment and procedure, of monitoring air pollution that has been determined to produce results similar to the Federal Reference Method (FRM).
Filter-based Monitor: A method of monitoring particulate pollution that involves exposing a pre- weighed filter to a specific flow volume of air to capture the particulates in the air. The filters are then post-weighed to determine the weight of particulates per volume, e.g. µg/m3. Filter-based monitors used by GRIC are all FRM monitors.
FRM: Federal Reference Method. An official method (i.e. equipment and procedure) of monitoring air pollution that has been tested and determined to produce results that accurately measure air pollution with acceptable precision. These methods are the baseline that all other methods (i.e., FEMs) refer to.
GRIC: Gila River Indian Community
µg/m3: Microgram per cubic meter.
MSA: Metropolitan Statistical Area. A geographical area designated by the federal government based on the concept of a core area with a large population nucleus, plus adjacent communities having a high degree of economic and social integration with that core. It is unclear in Appendix D 40 CFR 58 how MSAs apply to sovereign tribes. Although the areas within the Community are geographically part of the Phoenix-Mesa-Scottsdale MSA. For purposes of the administration of Section 107 of the Clean Air Act (42 U.S.C. § 7407), except where a specific designation has been otherwise made by the Administrator, the air quality control region for the Community is all land within the exterior boundaries of the Community. Therefore, for the purposes of this document, the MSA principle does not apply to the GRIC Air Monitoring Network.
NAAQS: National Ambient Air Quality Standards. A health and welfare-based standard that is set by the US EPA to qualify allowable levels of criteria pollutants.
NO2: Nitrogen dioxide.
NOX: Nitrogen oxides. Sum of nitric oxide (NO), NO2, and other nitrogen-containing compounds.
PM: Particulate matter. Material suspended in the air in the form of

2013 GRIC Network Review 3 August 2014
minute solid particles or liquid droplets.
PM10: Particulate matter of 10 microns in diameter or smaller.
PPM: Parts per million.
Primary Standard: One portion of the NAAQS. These standards are designed to protect the public health.
Secondary Standard: One portion of the NAAQS. These standards are designed to protect the environment.
SIP: State Implementation Plan. SIPs are a collection of state and local regulations and plans to achieve healthy air quality under the Clean Air Act.
SLAMS: State and Local Air Monitoring Station. The SLAMS consist of a network of approximately 5,000 monitoring stations nationwide whose size and distribution is largely determined by the needs of State, and local air pollution control agencies to meet their respective SIP requirements. The GRIC monitors operated by the AQP are not part of the SLAMS network, but the AQP operates the monitors in accordance with the requirements for SLAMS.
TEOM: Tapered Element Oscillating Microbalance. A continuous particulate measuring instrument used by the AQP to measure PM10.
TIP: Tribal Implementation Plan. The TIP is a collection of tribal regulations and plans to achieve healthy air quality under the Clean Air Act. For GRIC, the TIP is incorporated into and synonymous with the Air Quality Management Plan (AQMP).
VOC: Volatile organic compounds. VOCs are chemical compounds that can easily vaporize and enter the atmosphere. There are many natural and artificial sources of VOCs; solvents and gasoline make up some of the largest artificial sources. VOCs will react with NOx in the presence of sunlight to create ground-level ozone pollution.

2013 GRIC Network Review 4 August 2014
1 INTRODUCTION
The Code of Federal Regulations (CFR) Title 40 Part 58.10 (40 CFR 58.10) requires an annual monitoring network plan to summarize the air quality surveillance system consisting of State and Local Air Monitoring Stations (SLAMS) and Special Purpose Monitors (SPM) operated under state and local authorities. The annual monitoring network plan must identify the purpose of each monitor and provide evidence that both the siting and the operation of each monitor meet the requirements in 40 CFR Part 58 appendices A, C, D, and E below:
Appendix A Quality Assurance Requirements for SLAMS, SPMs, and PSD (Prevention of Significant Deterioration) Air Monitoring
Appendix C Ambient Air Quality Monitoring Methodology
Appendix D Network Design Criteria for Ambient Air Quality Monitoring
Appendix E Probe and Monitoring Path Siting Criteria for Ambient Air Quality Monitoring
The Gila River Indian Community (GRIC or Community) Department of Environmental Quality (DEQ) Air Quality Program (AQP) operates air quality monitors that record ambient concentrations of two criteria pollutants - particulate matter less than or equal to 10 microns (PM10) and ozone. Criteria pollutants are those that the United States Environmental Protection Agency (EPA) has defined as a potential risk to health, and correspondingly defined a National Ambient Air Quality Standard (NAAQS). The NAAQS are intended to protect public health and welfare by setting limits on the allowable level of each pollutant in the ambient air. The other criteria pollutants with established NAAQS that are not monitored by the AQP are particulate matter less than or equal to 2.5 microns (PM2.5), carbon monoxide (CO), sulfur dioxide (SO2), nitrogen dioxide (NO2), and lead (Pb).
The GRIC air quality monitors are tribal monitors and are most closely related to SLAMS monitors. The United States Environmental Protection Agency (EPA) works closely with GRIC to adhere to the requirements for SLAMS networks with appropriate flexibility as stated in the Tribal Authority Rule (TAR).
The purpose of this document is to fulfill the requirements of 40 CFR 58.10, and has been prepared in accordance with EPA Region 9’s Annual Monitoring Network Plans Memorandum dated May 8, 2012. Therefore, this document contains the following sections:
Air Monitoring Network Design – Describes the design requirements for an air monitoring network in accordance with Appendix D of 40 CFR 58.
GRIC Air Monitoring Network – Describes the air monitoring network for the Community including monitor types, background information, summary of 2013 monitoring results, changes to the monitoring network in 2013, and proposed changes to the monitoring network.
Compliance Discussion – Includes a discussion of compliance with 40 CFR 58, including a cross-reference table of requirements for Network Review, minimum monitoring requirements, precision and accuracy certifications, data submittals, and audits.

2013 GRIC Network Review 5 August 2014
Public Notice – Includes information on public notices and community outreach for review and presentation of this document.
Appendices – Contains the detailed monitoring site information and photographs, and a copy of the presentation that was prepared for the District meetings.

2013 GRIC Network Review 6 August 2014
2 AIRMONITORINGNETWORKDESIGN
2.1 MonitoringObjectives
Appendix D of 40 CFR 58 states that monitoring networks must be designed to meet three basic monitoring objectives:
1. Provide air pollution data to the general public in a timely manner;
2. Support compliance with ambient air quality standards and emissions strategy development; and
3. Support air pollution research studies.
Furthermore, Appendix D states that in order to support air quality management work indicated in the three basic objectives above, monitoring networks must be designed with a variety of the following types of monitoring sites:
Highest Concentration – Sites to determine the highest concentration expected to occur in the area covered by the network;
Population Exposure – Sites to determine representative concentrations in areas of high population density;
Source Impacts – Sites to determine the impact on ambient pollution levels of significant sources or source categories;
Background Concentrations – Sites to determine general background concentration levels;
Regional Transport – Sites to determine the extent of regional pollutant transport among populated areas, and in support of secondary standards; and
Welfare Impacts – Sites to determine the welfare-related impacts in more rural and remote areas (such as visibility impairment and effects on vegetation).
2.2 SpacialScales
The goal in designing a monitoring network is to establish monitoring stations that will provide data to meet the above monitoring objectives. The physical siting of the air monitoring station must achieve a spatial scale of representativeness that is consistent with the monitoring site type, air pollutant to be measured, and the monitoring objective. The spatial scale results from the physical location of the site with respect to the pollutant sources and categories by estimating the size of the area surrounding the monitoring site that experiences uniform pollutant concentrations. The categories of spatial scale are:
Microscale - An area of uniform pollutant concentrations ranging from several meters up to 100 meters.
Middle Scale – Uniform pollutant concentrations in an area of about 110 meters to 0.5 kilometer.

2013 GRIC Network Review 7 August 2014
Neighborhood Scale – An area with dimensions in the 0.5 to 4 kilometer range.
Urban Scale – Citywide pollutant conditions with dimensions of from 4 to 50 kilometers.
Regional Scale – An entire rural area of the same general geography (that ranges from tens to hundreds of kilometers).
The appropriate spatial scale for each of the monitoring site types is shown in Table 2-1.
Table 2-1. Relationship Among Monitoring Site Types And Scales Of Representativeness.
Monitoring Objective
Appropriate Spatial Scale
Micro Middle Neighborhood Urban Regional
Highest concentration X X X X
Population Exposure X X
Source Impacts X X X
Background Concentrations X X X
Regional Transport X X
Welfare Impacts X X
2013 GRIC Network Review 8 August 2014
3 GILARIVERINDIANCOMMUNITYAMBIENTAIRMONITORINGNETWORK
3.1 General
There are currently three permanent ambient air monitoring stations within the Community – St. Johns, Casa Blanca, and Sacaton (see Figure 1). All three monitoring stations are tribal monitors, but follow the requirements of SLAMS networks with appropriate flexibility as stated in the TAR.
Figure 3-1: Map of Ambient Air Monitoring Stations on Gila River Indian Community

2013 GRIC Network Review 9 August 2014
Table 3-1 lists these stations and the pollutant and meteorological parameters that are monitored at each location.
Table 3-1. Ambient Air Quality Parameters Monitored at Each Station
Parameter
Monitoring Station
St. Johns Casa Blanca Sacaton
Ozone X X
PM10 (FRM) X
PM10 (TEOM) X X X
Wind Speed X X X
Wind Direction X X X
Ambient Temperature X X X
Ambient Barometric Pressure X X X
Precipitation X X X
Relative Humidity X X X
Camera (Visibility) X
Table Notes: PM10 - Particulate Matter ≤ 10 microns FRM - Federal Referenced Method, Filter-based sampler (two samplers – 1-in-3 day and 1-in-6 day, 24 hour average) TEOM - Tapered Elemental Oscillating Microbalance. Continuous measuring monitor (1 hr averages).
Table 3-2 shows the National Ambient Air Quality Standards (NAAQS) for pollutants that are currently monitored by GRIC, including ozone and particulate matter equal to and less than 10 microns (PM10). Additional pollutants for which EPA has established NAAQS and that are not currently monitored by GRIC include sulfur dioxide, nitrogen dioxide, carbon monoxide, PM2.5, and lead. EPA periodically reviews and revises these standards based on new public health and scientific information. These revisions often require changes to air monitoring networks and methodologies.
Table 3-2. National Ambient Air Quality Standards Monitored for Pollutants by GRIC
Pollutant Primary/ Secondary
Averaging Time
Level Form
Ozone primary and secondary
8-hour 0.075 ppm Annual fourth-highest daily maximum 8-hr concentration, averaged over 3 years
PM10 primary and secondary
24-hour 150 µg/m3 Not to be exceeded more than once per year on average over 3 years

2013 GRIC Network Review 10 August 2014
The site types represented by each air quality monitor are shown in Table 3-3.
Table 3-3. Site Types for Each Monitoring Station
Site Type Ozone Particulate Matter <10 Microns (PM10)
St. Johns Sacaton St. Johns Casa Blanca Sacaton
Highest Concentration
Population Exposure X X X
Source Impacts X
Background Concentrations X X X X X
Regional Transport X X X X X
Welfare Impacts
Detailed site information for each of the monitoring locations in presented in Tables A-1, A-2, and A-3 in Appendix A.
3.2 OzoneMonitoringNetwork
Beginning in 2002, the Community started monitoring for ozone at two locations - one in Sacaton (District 3) and one in St Johns (District 6). In 2013, both ozone monitors were reported as operational in AQS. Per an exemption granted by EPA to the annual ozone monitoring requirement, these monitors were only operated during ozone season (April to October 2013).
3.2.1 Background
The following subsections provide background information on the two ozone monitoring locations. Additional detailed information for each monitor is provided in Appendix A.
3.2.1.1 Sacaton
Operated by the AQP since 2002, this site provides background and regional transport ozone monitoring on a regional scale. This site is located near the central GRIC government and business district of Sacaton, which includes four schools and a community hospital. It also provides a measurement of representative area ozone concentration for the community of Sacaton and surrounding areas. The monitor generally measures background levels of ozone during prevailing West or East winds. However, under the right wind conditions, the monitor can also detect ozone and ozone precursor transport from the Phoenix Metropolitan Area (PMA), north of the Community, in the form of elevated ozone readings. Measured concentrations at this site are often similar to those recorded at Pinal County’s Casa Grande monitor (approximately 9 miles south of Sacaton).
3.2.1.2 StJohns
Initially operated by the AQP at Vee Quiva Casino (AQS ID 7002) in 2002 and then relocated 2 miles south to Gila Crossing Middle School (AQS ID 7003) in September 2004. This site is

2013 GRIC Network Review 11 August 2014
located in District 6 on the southwest side of the South Mountain Range near the City of Phoenix and provides background and regional transport ozone monitoring on a regional scale. Ozone concentrations at this site exhibit strong diurnal fluctuations caused by oxides of nitrogen (NOx) from nearby neighboring jurisdictions in the City of Phoenix. The monitor generally measures background levels of ozone during prevailing West or East winds. However, under the right wind conditions, the monitor can also detect ozone and ozone precursor transport from the PMA, north and east of the monitor location, in the form of elevated ozone readings.
3.2.2 2013MonitoringResultsSummary
The 1-hour average ozone standard was revoked by the EPA on June 15, 2005, and has been replaced by the 8-hour average standard for compliance purposes. On March 12, 2008, the EPA lowered the eight-hour ozone NAAQS from 0.080 to 0.075 ppm. Compliance with the standard is determined by averaging the 4th highest eight-hour average over a three-year period. This three-year average must be less than or equal to 0.075 ppm.
There was one exceedance of the 8-hour primary standard (NAAQS) for ozone in 2013. Table 3-4 presents the four highest 8-hour average ozone readings for each monitor during the 2013 monitoring season (April – October).
Table 3-4. 2013* 8-Hour Average Ozone Summary
Site Max (PPM)
Date
2nd High (PPM) Date
3rd High (PPM) Date
4th High (PPM) Date
Number of Days >0.075
Sacaton 0.076 0.067 0.066 0.065
1 7/17/2013 5/2/2013 5/13/2013 5/12/2013
St Johns 0.075 0.071 0.070 0.068
0 7/17/2013 7/18/2013 5/2/2013 5/12/2013
Table Notes: * - Ozone monitors only operate during ozone season (April through October)
In 2013, there were no violations of the 8-hour average NAAQS for ozone (the 8-hour average NAAQS for ozone is violated when the three-year average of the fourth highest values for each year is greater than 0.075 ppm). The fourth highest 8-hour average ozone reading for each of the past three years and the 3-year average is shown in Table 3-5.
Table 3-5. Three-Year* Average of 8-Hour Ozone
Site 2011 4th High
(PPM) 2012 4th High
(PPM)2013 4th High
(PPM)3-Year Average of
4th High (PPM)
Sacaton 0.073 0.072 0.065 0.070
St Johns 0.072 0.072 0.068 0.070
Table Notes: * - Ozone monitors only operate during ozone season (April through October)

2013 GRIC Network Review 12 August 2014
3.3 PM10ParticulateMonitoringNetwork
Beginning in 2002, the Community started monitoring for PM10 at one location (Casa Blanca) using a Federal Reference Method (FRM), filter-based, monitor operating on a 1-in-3 day schedule. In 2013, the Community began continuous monitoring for PM10 at all three monitoring stations (St. Johns, Casa Blanca, and Sacaton) using Federal Equivalent Method (FEM) Tapered Element Oscillating Microbalance (TEOM) monitors that provide hourly PM10 averages. In 2013, all three TEOM and both FRM monitors were reported as operational in AQS.
3.3.1 Background
The following subsections provide background information on the three PM10 monitoring locations. Additional detailed information for each monitor is provided in Appendix A.
3.3.1.1 CasaBlanca
This site has been operated by the AQP since 2002. This monitoring site is a neighborhood scale and representative of particulate concentrations in District 5, Casa Blanca. The site consists of two collocated FRM samplers (two identical monitors that sample separately) and one TEOM monitor, providing important precision measurements for the PM10 monitoring program.
This monitoring site was originally placed in one of the three most populated areas of the Community to measure source impacts from agricultural areas. Although located in a neighborhood of agricultural operations, it can be representative of other areas beyond the local jurisdictions. This monitoring station is located approximately 4 to 5 miles northeast of other PM10 sources (e.g., agricultural areas and dairy operations) that are outside of the Community’s boundaries and control, and may be influenced by PM10 generated from those sources.
3.3.1.2 SacatonandStJohns
These two sites started reporting PM10 data to the AQS database beginning January 1, 2013. Both sites are currently set up to monitor PM10 concentrations using continuous TEOM monitors. These two sites have been approved for monitoring and reporting as established within the GRIC Quality Assurance Project Plan (QAPP).
3.3.2 2013MonitoringResultsSummary
The 24-hour Primary standard for PM10 is 150 μg/m3 (155 μg/m3 with mathematical rounding). This standard is violated when the expected number of exceedances at a monitor is more than one per year on average over three years. A formula, as detailed in 40 CFR 50, is used to determine the expected number of exceedances. The formula takes into account the number of days sampling occurred and the number of valid samples collected. A 3-year average of these estimated days is then used to determine compliance.
There were 14 exceedances of the 24-hour primary standard (NAAQS) for PM10 in 2013.

2013 GRIC Network Review 13 August 2014
However, GRIC has flagged all 14 of the exceedances as exceptional events (see Definitions of Terms). In accordance with the EPA’s exceptional events policy, once approved these data are not used in determining compliance with the NAAQS. Table 3-6 presents a summary of the 24-hour average PM10 readings for each monitor in 2013.
Exceedances of the 24-hour PM10 NAAQS at the GRIC monitors also occurred in 2011 and 2012 and were flagged as Exceptional Events by GRIC. The EPA has not issued an official concurrence with the 2011 and 2012 data. Therefore, a determination of compliance with the 24-hour PM10 NAAQS cannot be made at this time.
Table 3-6. 2013 24-Hour Average PM10 Summary
Site Name (Monitor Type)
24-hr Average
Max (μg/m3)
24-hr Average 2nd High (μg/m3)
Number of 24-hr
NAAQS Exceedances
Expected Exceedances (Including
Exceptional Events)
Annual Average(μg/m3)
No. of Exceptional
Events
No. of valid days
/ days possible
Sacaton (TEOM)
315* 251* 5* 5.4 39 5 342 / 365
5/3/2013 4/8/2013
St Johns (TEOM)
257* 216* 4* 4 29 4 358 / 365
4/8/2013 8/26/2013
Casa Blanca (FRM –POC1)
253* 120 1* 3 52 1 114 / 122
6/30/2013 8/26/2013
Casa Blanca (FRM-POC2)
106 102 0 0 42 0 55 / 62
5/4/2013 7/15/2013
Casa Blanca (TEOM-POC3)
329* 242* 4* 4 44 4 359 / 365
4/8/2013 6/30/2013
* Data has been flagged by GRIC as an Exceptional Event
3.4 ChangestotheNetworkin2013
The following changes were made to the monitoring network in 2013:
The GRIC QAPP for PM10 was conditionally approved in January 2013. The GRIC Air Monitoring Network officially started monitoring for PM10 at all three sites which are continuous, hourly TEOM monitors.
GRIC continues to monitor hourly ozone at Sacaton and St Johns sites. The ozone monitoring instruments were upgraded to the latest model by same manufacturer in March 2014 (beginning of GRIC 2014 Ozone Monitoring Season)
3.5 ProposedNetworkChangesandImprovements
The following monitoring network changes are proposed for the next 18 months (July 2014 – December 2015):

2013 GRIC Network Review 14 August 2014
The AQP is currently upgrading the air monitoring network’s data management system and reporting functions for AQS. This change is scheduled to be completed by December 2014.
The AQP is currently assessing the need for the FRM PM10 filter-based samplers at the Casa Blanca Site now that the continuous PM10 TEOM monitor is operating at this site.
The AQP moved office buildings, so the building where the monitoring equipment is located (Sacaton) is no longer occupied. The AQP is in the planning process for the relocation of the Sacaton monitoring equipment into a more secure structure/environment that will be located near the existing equipment location. The relocation of the Sacaton monitoring equipment is currently scheduled for 2015.
The AQP is also in the process of procuring and installing a remote visibility camera to be collocated with the Sacaton monitoring equipment. The installation of this system is scheduled to be completed by September 30, 2014.

2013 GRIC Network Review 15 August 2014
4 COMPLIANCEDISCUSSION
In accordance with 40 CFR 58.10(a)(1), the following sections provide information on compliance with the requirements of Appendices A, C, D, and E of 40 CFR 58. A cross-reference of the requirements of Appendices A, C, D, and E of 40 CFR 58 and the section(s) of this report that address those requirements is included in Table 4-1 below.
Table 4-1. Cross-Reference of 40 CFR 58 Requirements
40 CFR 58 Appendix Requirement Response
A Were Precision/Accuracy reports submitted to AQS for data year covered by the plan?
Yes (see Section 4.2)
Was an annual data certification package submitted for the data year covered by the plan?
Yes (see Section 4.2)
What was the frequency of flow rate verification for manual (FRM) PM sampler audits?
Monthly (See Appendix A)
What was the frequency of flow rate verification for automated PM analyzer audits? Bi-Weekly (See Appendix A)
What was the frequency of one-point QC checks for gaseous instruments? Bi-Weekly (See Appendix A)
When was the last Annual Performance Evaluation conducted for gaseous instruments?
See Appendix A Tables A-1 & A-3
When were the last two semi-annual flow rate audits for PM monitors? See Section 4.4
When did PEP audits occur during the data year covered by the plan? See Section 4.4
When did NPAP audits occur during the data year covered by the plan? 4/16/13
C What is the instrument manufacturer and model used for each monitor? See Appendix A
What is the start date of each monitor? See Appendix A
D What is the sampling season for each parameter? See Sections 3.2 & 3.3
Does the network meet minimum number of monitors required? Yes (see Section 4.1)
E For each site: Distance from nearest road in meters? Traffic count of nearest road? Surrounding groundcover (e.g. paved, vegetated, gravel, etc.)?
See Appendix A
For each monitor: Probe height in meters? If applicable, distance from the nearest supporting structure in meters? If applicable, distance from the nearest obstruction on the roof in meters? If applicable, distance from the nearest obstruction not on the roof in meters? Nearest distance from an obstructive tree in meters? If applicable, distance from the nearest furnace or incinerator flue in meters? If applicable, distance between collocated monitors? Unrestricted airflow in degrees? Probe material for reactive gases (i.e. O3, NO2, and SO2)? Residence time for reactive gases?
See Appendix A

2013 GRIC Network Review 16 August 2014
4.1 MinimumMonitoringRequirements
Tables D-2 and D-4 in Appendix D of 40 CFR Part 58 define minimum monitoring requirements for ozone and PM10, respectively. Tables D-2 and D-4 are reproduced as Tables 4-2 and 4-3, respectively, below. The minimum monitoring requirements are based on the population of the Metropolitan Statistical Area (MSA) and the design value for each NAAQS.
Table 4-2. Ozone Monitoring Requirements for SLAMS (Number of Stations per MSA)
MSA Population Most recent 3-year design value
≥85% NAAQS (≥ 0.0638) Most recent 3-year design value
<85% NAAQS (< 0.0638)
>10 million 4 2
4-10 million 3 1
350,000-<4 million 2 1
50,000-<350,000 1 0
Table 4-3. PM10 Monitoring Requirements for SLAMS (Number of Stations per MSA)
MSA Population
High concentration Exceeds NAAQS by 20% or more
(>180 µg/m3)
Medium concentration >80% of NAAQS
(>120 µg/m3)
Low concentration < 80% of NAAQS
(<120 µg/m3)
>1,000,000 6-10 4-8 2-4
500,000-1,000,000 4-8 2-4 1-2
250,000-500,000 3-4 1-2 0-1
100,000-250,000 1-2 0-1 0
It is unclear in Appendix D 40 CFR 58 how MSAs and the minimum monitoring requirements in Tables D-2 and D-4 (Tables 4-2 and 4-3) apply to sovereign tribes. Although the areas within the Community are geographically part of the Phoenix-Mesa-Scottsdale MSA. For purposes of the administration of Section 107 of the Clean Air Act (42 U.S.C. § 7407), except where a specific designation has been otherwise made by the Administrator, the air quality control region for the Community is all land within the exterior boundaries of the Community. Therefore, for the purposes of this document, the AQP is using the data in Tables D-2 and D-4 as guidance.
The design value is a calculated value based upon the highest recorded concentration at a site in the attainment or nonattainment area. The process for computing the design value for each criteria pollutant is described in the appendices of 40 CFR Part 50. For the purpose of this document, the design values listed are the highest calculated concentrations recorded in the Community.
The minimum monitoring requirements of 40 CFR 58 Appendix D for the ozone and PM10 monitors within the Community are presented in Tables 4-4 and 4-5, respectively. The GRIC Air Quality Management Plan (AQMP) does not require a minimum number of monitors for the Community.

2013 GRIC Network Review 17 August 2014
Table 4-4. Minimum Monitoring Requirements for GRIC Ozone Monitors
MSA Monitor Site:
County
Population (GRIC
Census 2013)
8-hour Design Value for 2011-2013
(ppm) Site
(AQS ID)
Minimum Monitors Required
Number of Active Monitors
Monitors Needed
NA1 St. Johns: Maricopa Sacaton: Pinal
21,277 0.070
St. Johns (04-013-7003)
0A 2 0 0.070
Sacaton (04-021-7001)
Table Notes:
1. It is unclear in Appendix D 40 CFR 58 how MSAs apply to Tribal agencies. Although the areas within the Community are geographically part of the Phoenix-Mesa-Scottsdale MSA, for purposes of the administration of Section 107 of the Clean Air Act (42 U.S.C. § 7407), the air quality control region for the Community is all land within the exterior boundaries of the Community. Therefore, for the purposes of this document, the MSA is not applicable to GRIC.
A. A 3-year design value greater than 0.0638 would require one monitor for a population between 50,000 and 350,000 (smallest population group in Table 4-2). Since the GRIC population is below the lowest population range in Table 4-2 and Tribal requirements are unclear, the minimum monitoring requirements was assumed to be zero. For comparison, the population of the Phoenix-Mesa-Scottsdale MSA in 2010 was 4,192,887 (according to the 2010 census), which would require a minimum of 3 monitors.
Table 4-5. Minimum Monitoring Requirements for GRIC PM10 Monitors
MSA Monitor Site:
County
Population (GRIC
Census 2013)
Max Concentration
(µg/m3) Site
(AQS ID)
Minimum Monitors Required
Number of Active Monitors
Monitors Needed
NA1 St. Johns: Maricopa Casa Blanca: Pinal
Sacaton: Pinal 21,277
329A Casa Blanca
(04-021-7004 POC3)
0C 5D 0
143B Sacaton
(04-021-7001 POC1)
Table Notes:
1. It is unclear in Appendix D 40 CFR 58 how MSAs apply to Tribal agencies. Although the areas within the Community are geographically part of the Phoenix-Mesa-Scottsdale MSA, for purposes of the administration of Section 107 of the Clean Air Act (42 U.S.C. § 7407), the air quality control region for the Community is all land within the exterior boundaries of the Community. Therefore, for the purposes of this document, the MSA is not applicable to GRIC.
A. Max concentration including data flagged as exceptional events
B. Max concentration excluding data flagged as exceptional events
C. A maximum concentration greater than 180 µg/m3 would require 1-2 monitors for a population between 100,000 and 250,000 (smallest population group in Table 4-3). A maximum concentration between 120 and 180 µg/m3 would require 0-1 monitors for a population between 100,000 and 250,000. Since the GRIC population is below the lowest population range in Table 4-3 and Tribal requirements are unclear, the minimum monitoring requirements was assumed to be zero. For comparison, the population of the Phoenix-Mesa-Scottsdale MSA in 2010 was 4,192,887 (according to the 2010 census), which would require a minimum of 6-10 monitors for maximum concentrations >180 µg/m3 and 4-8 monitors for maximum concentrations between 120 and 180 µg/m3.
D. Three of the five monitors are collocated at one site (Casa Blanca).
Based on the information contained in Tables 4-4 and 4-5, the GRIC monitoring network meets the minimum monitoring requirements for all criteria pollutants measured (i.e., ozone and PM10) as established in 40 CFR 58 Appendix D, Tables D-2 and D-4.
4.2 DataSubmissionRequirements
Federal regulations (Appendix A of 40 CFR 58 and 40 CFR 58.15) require air monitoring

2013 GRIC Network Review 18 August 2014
organizations to submit precision and accuracy data for the data reported to the federal database. The air monitoring precision and accuracy data for the GRIC monitors are submitted to the USEPA AIRS/AQS database on a quarterly basis and are up to date as of the publication of this report.
Federal regulations (40 CFR 58.15) also require the air monitoring organization to annually submit a letter certifying that data has been submitted for that year to the EPA AIRS/AQS database and that the data accurately represents the air quality in the Community. The AQP certified and submitted the 2013 ozone and PM10 data for the Community to USEPA Region 9 Administrator on April 23, 2014 via Email and FedEx Letter Delivery.
4.3 AirQualityData
All of the GRIC ambient air monitoring stations are registered with the EPA and regularly report NAAQS criteria pollutant data to the EPA’s Air Quality Systems (AQS) database. The data generated at these stations are public information and are available in various formats from the respective agencies. Table 4-6 below lists some popular sources for air quality data.
Table 4-6. Sources of Ambient Air Quality Data
Agency Address For Data
Requests Email / Internet address Data Available
GRIC DEQ AQP
P.O. Box 97 Sacaton, AZ
85147 attn: Ondrea Barber, Director
[email protected] GRIC Air
Monitoring Data
United States Environmental
Protection Agency
Ariel Rios Building 1200 Pennsylvania
Avenue, N.W. Washington, DC 20460
www.epa.gov www.epa.gov/ttn/airs/airsaqs/index
National Air Monitoring
Data, including GRIC data
4.4 Audits
The AQP performed audits of the monitoring equipment in 2013. The monthly audit dates for the ozone monitors are shown in Table 4-7, the semi-annual audit dates for the FRM filter-based PM10 monitors are shown in Table 4-8, and the monthly audits dates for the continuous TEOM PM10 monitors are shown in Table 4-9.
Table 4-7. Monthly Audit Dates for Ozone Monitors
Site AQS ID Parameter 2013 Audit Dates1
Sacaton 04-021-7001 Ozone 4/15, 4/18, 5/30, 6/25, 7/16, 9/5, 9/16, 10/8, 11/1
St Johns 04-013-7003 Ozone 5/30, 6/25, 7/17, 9/5, 9/16, 9/27, 10/8, 11/1
Table Notes: 1. Ozone monitors are only operated during ozone season (April through October)

2013 GRIC Network Review 19 August 2014
Table 4-8. Semi-Annual Flow Rate Audit Dates for Filter-Based PM10 Monitor
Site AQS ID Parameter 2013 Audit Dates
Casa Blanca (Primary) 04-021-7004 POC1 PM10 4/26, 7/31, 12/17
Casa Blanca (Collocated) 04-021-7004 POC2 PM10 4/26, 7/31, 12/17
Table 4-9. Monthly Flow Rate Audit Dates for Continuous TEOM PM10 Monitor
Site AQS ID Parameter 2013 Audit Dates
Sacaton (TEOM) 04-021-7001 PM10 1/30, 4/25, 8/1, 9/5, 9/23, 12/19
St Johns (TEOM) 04-013-7003 PM10 1/29, 2/27, 4/26, 9/5, 9/23, 12/17
Casa Blanca (TEOM) 04-021-7004 POC3 PM10 1/29, 2/27, 4/26, 7/31, 9/5, 9/23, 12/17

2013 GRIC Network Review 20 August 2014
5 PUBLICNOTICE
In accordance with 40 CFR 58.10, the annual monitoring network plan must be made available for public inspection (website, hardcopy posting in libraries and public offices, and/or newspaper listing) for at least 30 days prior to submission to EPA. If an opportunity for public comment had been provided, comments received must be included in the annual network plan submission.
The Gila River Indian Community DEQ made a draft copy of this Network Review available to the public on May 16, 2014. In an effort to notify the public of the Network Review, the AQP published information through the following outlets:
• Public Notice posted in the Gila River Indian Newspaper, a newspaper of general circulation in Gila River Indian Community.
• Presentations at Community District Meetings.
5.1 NewsRelease
The following news release was advertised in the Gila River Indian Newspaper, VOL. 17, No. 10 Edition (dated May 16, 2014):
PUBLIC NOTICE OF AMBIENT AIR MONITORING NETWORK REVIEW
Pursuant to 40 Code of Federal Regulations (CFR) §58.10 Gila River Indian Community Department of Environmental Quality (DEQ) Air Program will make its annual monitoring network plan available for public inspection prior to submission to the United States Environmental Protection Agency. The Annual Ambient Monitoring Network Review and Data Summary present changes to and data collected from the air quality monitoring network. This document will also be available for review at the GRIC DEQ office located at 35 Pima Street, Sacaton, AZ 85147. Additionally, presentations will be provided at all GRIC district monthly meetings from May thru June 2014.
Public comments may be submitted in writing to GRIC DEQ Air Quality, P.O. Box 97, Sacaton, Arizona, 85147, or comments may be given orally at the scheduled community meetings. Additional information is available from GRIC DEQ Air Quality, 35 Pima Street, Sacaton, Arizona or by calling 520-562-2234.
No requests to review the document were received.
5.2 DistrictMeetingPresentations
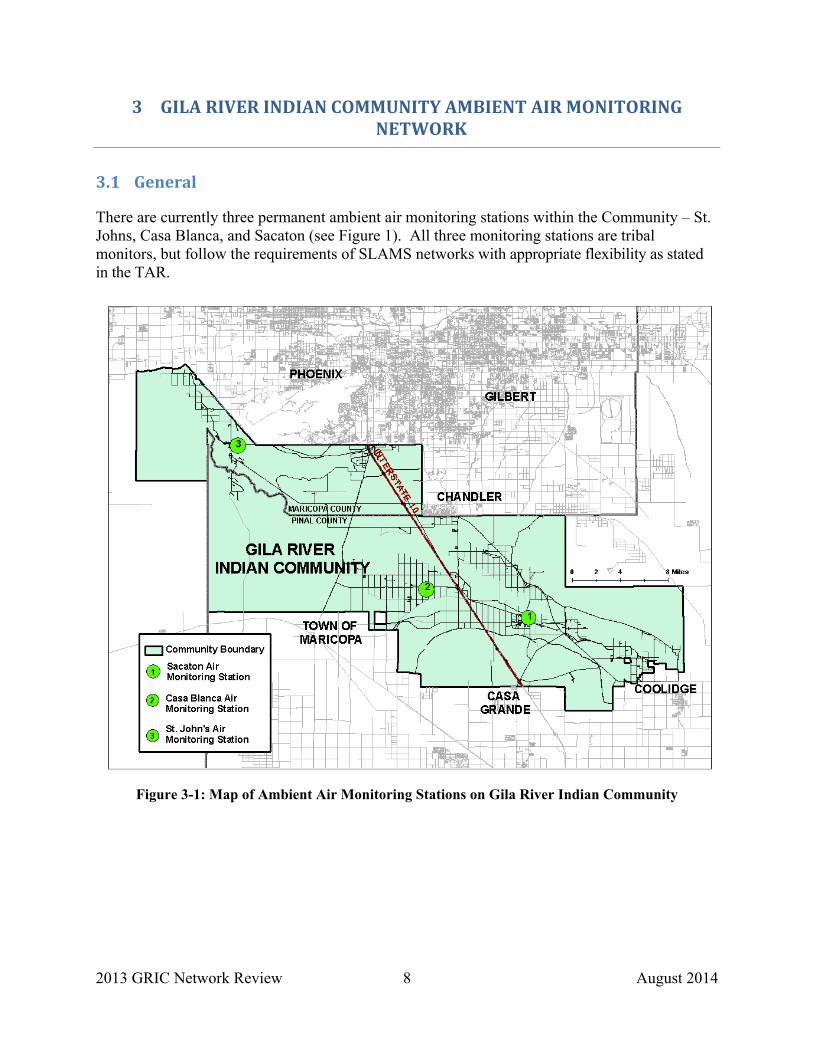
The AQP also presented a summary of the content of this document during one of the bi-monthly meetings for each of the seven GRIC Districts. A copy of the presentation slides is included as Appendix B. The district presentation dates along with some of the comments and questions received from the Community members at the District meetings is included in Table 5-1 below.
2013 GRIC Network Review 21 August 2014
Table 5-1. Summary of Comments and Questions Received at District Meetings
District Meeting
Date Comments / Questions Received
1 05/19/2014 GRIC DEQ has a mobile monitoring trailer – can you monitor in areas like State Route 587 and Interstate 10 to understand more about pollution sources? Like July 17th ozone data that exceeded the standard.
2 06/02/2014 How many people have asthma?
We should have more vegetation.
How can we control dust?
Farmers in field during certain times at night kick up a lot of dust.
Questions about indoor air quality - How do we prevent dust & mold from affecting the community?
A construction company was building a new house. I complained for 2-3 weeks until I called air quality then Air Quality staff came out to inspect dust problem. Thank you.
GRIC DEQ Air Quality enforcement staff should attend initial construction meeting and bi-weekly meetings during project construction activities.
3 05/20/2014 What about water, shouldn’t we be more focused on our water? The water here on the community is more important?
Is our air on the Community any different from the air in the city?
How about the no fly zone over the Community? There have been sightings of a military cargo plane/carrier flying over community at a very low altitude. (Around the time that the military aircraft crashed by Riggs and I10 on May9th.)
4 06/30/2014 How can we assist in ensuring better air quality?
What can we do to fix the issue of dirt roads and all the dust they kick up? Issue has been mentioned multiple times, but nothing has ever been done. Community Member feels she complains about the issue too much.
What effects does crop dusting have on our air quality?
Shouldn’t we be notified when applications will occur around residence? Do not like the drift and fear my residence, animals, and family are at risk.
5 06/30/2014 Since the 10 years data have we seen any changes?
1st time they were trying to include Cowtown, but DEQ worked hard not to include it.
Is DEQ air quality data consistent with surrounding entities around the valley?
An elder was very pleased with this report. He stated that he never knew nothing about this kind of data ever existed in our Community.
Is GRIC DEQ under the air quality act?
If the air quality changes what happens?

2013 GRIC Network Review 22 August 2014
Table 5-1. Summary of Comments and Questions Received at District Meetings
District Meeting
Date Comments / Questions Received
6 07/14/2014 Interest in recycling information
Question about freeway pollution – if freeway will add pollution
Is the monitoring data shared with other departments (e.g., hospital)?
School monitoring/flag program
Does the monitoring equipment breakdown ozone contributors?
How does 2013 data compare with past years?
Comment about mobile monitoring capability
7 06/16/2014 Is the ozone that you mentioned the same as the ozone that’s up in the atmosphere? Isn’t that what keeps out the radiation?
When the county (Maricopa) Issues “No Burn” days can they cite Community members for burning?
What about increased ozone coming from the proposed South Mountain freeway (when it is built)? We’ve always been told that air quality in D6 is bad but according to the presentation it is good.
When the EIS (for South Mountain Freeway) is complete even though we give comments, aren’t the federal agencies ultimately responsible for what happens?
When the freeway is built, will it become as bad as LA (Los Angeles)? (Smog days kids can’t play outside)
Will the EPA standards help to improve our air? Can we get a mobile air monitoring station that can check the quality of the air near the reservation boundaries in order to track what the neighbors do?
Will the proposed I-10 re-alignment (increased traffic) cause us to be in non-attainment (the proposed South Mountain Freeway)?

2013 GRIC Network Review August 2014
AppendixADetailed Monitoring Site Information and Photographs
St. Johns Casa Blanca Sacaton

2013 GRIC Network Review August 2014
Table A-1. Detailed Site Information for St. Johns
Site Name St Johns
AQS ID 04-021-7001
GIS Coordinates N33 18 49.676134, W112 09 34.620808
Location Top of Building
Address 4208 W. Pecos Rd Laveen, AZ
Distance to Road 92 meters
Traffic Count 374 (2003)
Groundcover Gravel
Representative Area St Johns, AZ
Pollutant Ozone PM 10
Site Type / Objective Population Exposure Population Exposure
Spatial Scale Urban Urban/Neighborhood
Sampling Method Teledyne-API 400E TEOM 1400AB
TEOM 1405
Analysis Method UV photometric Gravimetric
Instrument Manufacturer Teledyne-API Thermo Scientific
Start Date 7/2/2002 1/1/2013 ( TEOM1400AB)
3/3/2014 (TEOM 1405)
Operation Schedule Continuous Continuous
Sampling Season April-October All year
Probe Height 4 meters 4 meters
Distance From Supporting Structure 2 meters n/a
Distance From Obstructions On Roof n/a n/a
Distance From Obstructions Not On Roof n/a n/a
Distance from trees n/a n/a
Distance to Furnace or incinerator flue n/a n/a
Distance between collocated monitors n/a n/a
Unrestricted airflow 360 deg 360 deg
Probe material Teflon n/a
Residence time 6 sec n/a
Will there be changes within the next 18 months No No
Frequency of flow rate verification for PM analyzers n/a Monthly
Frequency of one-point QC check (gases) Bi-weekly n/a
Last annual performance evaluation (gases) 4/16/2013 n/a

2013 GRIC Network Review August 2014
Table A-2. Detailed Site Information for Casa Blanca
Site Name Casa Blanca
AQS ID 04-021-7004
GIS Coordinates N3307”06’, W11153”22’
Location Top of Building
Address Casa Blanca/ Preschool Road, Bapchule, AZ 85221
Distance to Road 30 meters
Traffic Count 2620 (daily average 2003)
Groundcover Paved/gravel
Representative Area Casa Blanca, AZ
Pollutant PM 10 PM 10 PM 10
Monitoring Objective Population Exposure
Population Exposure
Population Exposure
Spatial Scale Urban Urban Urban
Sampling Method Low-Vol FRM Low-Vol FRMTEOM 1400AB
TEOM 1405
Analysis Method Gravimetric Gravimetric Gravimetric
Instrument Manufacturer Rupprecht and
Patashnick Rupprecht and
Patashnick Thermo Scientific
Start Date 2002 2002 1/1/2013 (TEOM 1400AB)
9/9/2013 (TEOM 1405)
Operation Schedule 1 in 3 1 in 6 Continuous
Sampling Season All year All year All year
Probe Height 5 meters 5 meters 5 meters
Distance From Supporting Structure n/a n/a n/a
Distance From Obstructions On Roof n/a n/a n/a
Distance From Obstructions Not On Roof n/a n/a n/a
Distance from trees n/a n/a n/a
Distance to Furnace or incinerator flue n/a n/a n/a
Distance between collocated monitors 2-3 meters 2-3 meters 2-3 meters
Unrestricted airflow 360 deg 360 deg 360 deg
Probe material n/a n/a n/a
Residence time n/a n/a n/a
Will there be changes within the next 18 months No No No
Frequency of flow rate verification for PM analyzers Monthly Monthly Bi-weekly
Frequency of one-point QC check (gases) n/a n/a n/a
Last annual performance evaluation (gases) n/a n/a n/a

2013 GRIC Network Review August 2014
Table A-3. Detailed Site Information for Sacaton
Site Name Sacaton
AQS ID 04-021-7001
GIS Coordinates N33 04 52.622859, W111 44 17.067146”
Location Top of Building
Address 35 Pima Street, PO Box 97, Sacaton, AZ 85147
Distance to Road 200 meters
Traffic Count 1122 (2003)
Groundcover Paved
Representative Area Sacaton, AZ
Pollutant Ozone PM 10
Monitoring Objective Population Exposure Population Exposure
Spatial Scale Urban Urban
Sampling Method Teledyne-API 400E TEOM 1400AB
TEOM 1405
Analysis Method UV photometric Gravimetric
Instrument Manufacturer Teledyne-API Thermo Scientific
Start Date 7/2/2002 1/1/2013 (TEOM 1400AB) 9/17/2013 (TEOM 1405)
Operation Schedule Continuous Continuous
Sampling Season April-October All year
Probe Height 4 meters 4 meters
Distance From Supporting Structure 2 meters n/a
Distance From Obstructions On Roof n/a n/a
Distance From Obstructions Not On Roof n/a n/a
Distance from trees n/a n/a
Distance to Furnace or incinerator flue n/a n/a
Distance between collocated monitors n/a n/a
Unrestricted airflow 360 deg 360 deg
Probe material Teflon n/a
Residence time 9 sec n/a
Will there be changes within the next 18 months Yes No
Frequency of flow rate verification for PM analyzers n/a Monthly
Frequency of one-point QC check (gases) Bi-weekly n/a
Last annual performance evaluation (gases) 4/29/2014 n/a

2013 GRIC Network Review August 2014
St. Johns Air Monitoring Site Photographs
Figure B7. St Johns Air Monitoring Station, view to the southwest direction.
Figure B8. St Johns Site, view to the south Figure B9. St Johns Site, view to the south.

2013 GRIC Network Review August 2014
Casa Blanca Air Monitoring Site Photographs
Figure A-1. Casa Blanca Site, view from west side.
Figure B3. Casa Blanca Site, view to southeast direction. Figure A-2. Casa Blanca Site, view from east side.

2013 GRIC Network Review August 2014
Sacaton Air Monitoring Site Photographs
Figure B4. Sacaton Site, east side of building.
Figure B5. Sacaton Site, north side of building. Figure B6. Sacaton Site, top of building, southeast direction.

2013 GRIC Network Review August 2014
AppendixBDistrict Meeting Presentation Slides

Leroy WilliamsyGRIC DEQ Air Quality Program
July 14, 2014
1

Permitting Compliance & EnforcementCo p a ce & o ce e t Ambient Air Monitoring
2

Sacaton Site• PM10 Weather station at all sites• Ozone
Casa Blanca SitePM10
• Wind direction• Wind speed• Ambient Temperature• Relative Humidity
• PM10
St. Johns Site• PM10
• Ambient Pressure• Precipitation
PM10 • Ozone
Approved Quality Assurance Project Approved Quality Assurance Project Plan
Started monitoring July 2002g J y
3

Gila River Indian CommunityMonitoring StationsIndustrial ParksSand & Gravel

5

6

7

8

Casa Blanca SiteCasa Blanca Site
Sacaton SiteSacaton Site
St Johns SiteSt. Johns Site
9

Contact Contact Information:Information:
GRIC DEQ Air ProgramGRIC DEQ Air ProgramP.O. Box 97P.O. Box 97P.O. Box 97P.O. Box 97SacatonSacaton, Arizona , Arizona 8514785147Phone: (Phone: (520) 562520) 562--22342234Fax: (Fax: (520) 562520) 562--22452245
07-14-2014 lw10