Embed Size (px)
Citation preview

1 GIS in Prevention, County Profiles, Series 4 (2007)
6. Risk Factors: Community Risk Factors – Laws & Norms; Transitions and Mobility
Indiana Prevention Resource Center GIS in Prevention
County Profiles Series, No. 4
Elkhart County, Indiana
Barbara Seitz de Martinez, PhD, MLS, CPP, Project Director
The Indiana Prevention Resource Center at Indiana University is funded, in part, by a contract with the Indiana Family and Social Services Administration, Division of Mental Health and Addiction, financially supported through HHS/Substance Abuse Mental Health Services Administration, Center for Substance Abuse Prevention, Substance Abuse Prevention and Treatment Block Grant. The IPRC is operated by the Department of Applied Health Science and The School of Health, Physical Education and Recreation.

GIS in Prevention, County Profiles, Series 4 (2007)
6. Risk Factors: Community Risk Factors – Laws & Norms; Transitions and Mobility
GIS in Prevention County Profile Series, No. 4
Elkhart County, Indiana
Barbara Seitz de Martinez, PhD, MLS, CPPProject Director
Project Staff:
Indiana Prevention Resource Center
Opinions expressed herein are those of the authors, and not necessarily those of the Trustees of Indiana University or the Division of Mental Health and Addiction. Indiana University accepts full Responsibility for the content of this publication. ©2005 The Trustees of Indiana University. Permission is extended to reproduce this County Profile for non-profit educational purposes. All other rights reserved.
Ritika Bhawal, MPHRyan Chopra, MPHKyoungsun Heo, MPATuba M. Pervin Altay, MPH

GIS in Prevention, County Profiles, Series 4 (2007)
6. Risk Factors: Community Risk Factors – Laws & Norms; Transitions and Mobility
Elkhart County Map
The maps and tables in this publication were prepared using PCensusfor MapInfo and MapInfo Professional.

GIS in Prevention, County Profiles, Series 4 (2007)
6. Risk Factors: Community Risk Factors – Laws & Norms; Transitions and Mobility
6.6 - 6.15 Archival Risk Factors
Community Risk Factors: Laws & Norms
• Introduction: Community Laws/Norms• HH Spending on Alcohol• HH Spending on Tobacco• Adult Tobacco Behavior• Tobacco Production • Intensity of Inspection (TRIP)• Gambling Locations• Adult Gambling Behaviors• Hoosier Lottery Statistics
Community Risk Factors: Transitions & Mobility
• Crime Statistics: Introduction
• Crime Indices: Main Categories
• Crime Indices: Specific Crimes
• FBI UCR – All Arrests
• FBI UCR – Juvenile Arrests
• Alcohol Related Crashes
• More Alcohol Related Crashes
• Net Migration (Domestic and International)

GIS in Prevention, County Profiles, Series 4 (2007)
6. Risk Factors: Community Risk Factors – Laws & Norms; Transitions and Mobility
Introduction: Community Risk Factors
A child’s view of normal is critically impacted by the child’s environment: the sights, sounds, tastes, textures, and smells of the child’s world: “Infants participate, from birth on, in sociocultural activities that are committed to cultural goals and values . . .” (Keller, et al. 2004) If the child grows up seeing drugs and drug use portrayed in a positive manner on local billboards and local television and modeled at home and elsewhere in the child’s community, the presence of drugs (and hence potential availability) and use of drugs easily becomes the child’s norm. In this circumstance logic suggests it would be “norm-al” for the child to have the expectation that later in life he or she, too, for better or worse, may use drugs. As success tends to beget success, and good parenting practices tend to be replicated by the children raised in that environment, so unfortunately, those who are abused are more likely to become abusers, and those raised in a climate of drug use are more likely to become users.
The smell of cigarettes, the feel of icy beer bottles and of delicate wine glasses, song lyrics glamorizing drug use, and the over-use of over-the-counter or prescription medications to eliminate every small discomfort creates a notion of normal that impacts the child’s expectations of human behavior, including his or her own. In some instances, it can be difficult to separate family norms and community norms. Many factors contribute to the creation of community norms, including family traditions, public policies, and law enforcement practices. In general, community norms will be the outcome of the beliefs and practices of all the community’s governmental, educational, social, religious, and business enterprises.
Drug use modeling by adults in a community creates an environment that is more hospitable and encouraging of drug use by youth. This modeling takes place within and outside of the home. Since the statistics don’t separate adults from family settings from other adults, we have included adult behaviors with regard to drugs as a community indicator and simply mention it again in the context of family indicators. Still, clearly, this information from a community has strong implications for family settings as well, since one could assume that a significant number of those adults live in family settings. Each County Profile contains several maps and tables comparing the block groups in a county for the counts and percents of adults who smoke cigarettes or cigars, drink alcohol, or gamble. Where possible, indicator data is given in terms of per household amounts.
Heide Keller, et al., 2004 “The Bio-Culture of Parenting: Evidence from Five Cultural Communities,” Parenting: Science and Practice
4/1 (2004):25-50.

GIS in Prevention, County Profiles, Series 4 (2007)
6. Risk Factors: Community Risk Factors – Laws & Norms; Transitions and Mobility
6.6 Household Spending on Alcohol
The following table presents average estimated spending in dollars per household per year on alcohol products for consumption at home and away from home, for this county with comparisons to Indiana and the nation. This has implications for DUI risks.
Table 6.6: Per Household Spending on Alcohol (AGS, Consumer Spending, 2005, 2006)
Per Household Spending on Alcohol, 2005 est. (AGS, 2006)
Elkhart Indiana U.S.
Consumer spending on alcoholic beverages 517 501 545
Spending on Alcohol for Consumption outside the Home 230 222 242
Beer and ale away from home 72 70 76
Wine away from home 35 34 37
Whiskey away from home 59 57 62
Alcohol On Out-Of-Town Trips 64 61 67
Spending on Alcohol for Consumption in the Home 286 277 301
Beer and ale at home 153 149 162
Wine at home 83 80 87
Whiskey and other liquor at home 50 48 52
Total Spending per HH as % of Median HH Income 0.94% 1.09% 1.17%
Rank for Spending as % of Median HH Income 3 49th of 51
Median Family Income 54,930

GIS in Prevention, County Profiles, Series 4 (2007)
6. Risk Factors: Community Risk Factors – Laws & Norms; Transitions and Mobility
Map: Spending on Beer/Ale for Home
AGS, Consumer Spending,2005 est., 2006
Indiana Prevention Resource Center
GIS in Prevention, County Profiles, Series 4 (2007)
6. Risk Factors: Community Risk Factors – Laws & Norms; Transitions and Mobility
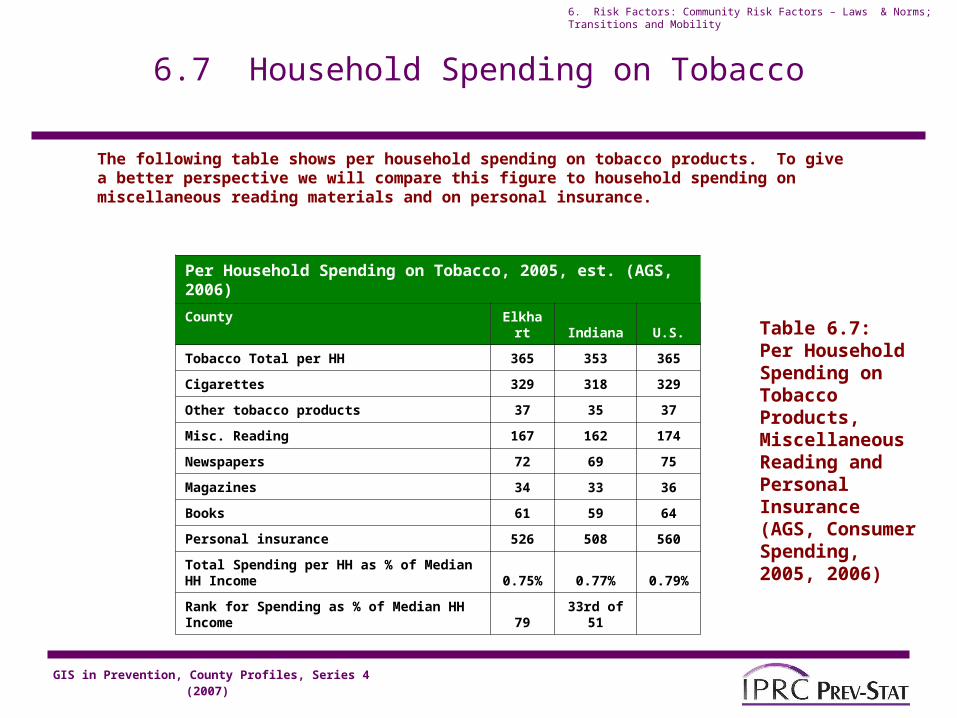
6.7 Household Spending on Tobacco
The following table shows per household spending on tobacco products. To give a better perspective we will compare this figure to household spending on miscellaneous reading materials and on personal insurance.
Table 6.7: Per Household Spending on Tobacco Products, Miscellaneous Reading and Personal Insurance (AGS, Consumer Spending, 2005, 2006)
Per Household Spending on Tobacco, 2005, est. (AGS, 2006)
County Elkhart Indiana U.S.
Tobacco Total per HH 365 353 365
Cigarettes 329 318 329
Other tobacco products 37 35 37
Misc. Reading 167 162 174
Newspapers 72 69 75
Magazines 34 33 36
Books 61 59 64
Personal insurance 526 508 560
Total Spending per HH as % of Median HH Income 0.75% 0.77% 0.79%
Rank for Spending as % of Median HH Income 79 33rd of 51

GIS in Prevention, County Profiles, Series 4 (2007)
6. Risk Factors: Community Risk Factors – Laws & Norms; Transitions and Mobility
6.8 Tobacco Production
Many counties in Indiana produce tobacco. Economic dependence upon tobacco influences community norms regarding smoking. It is therefore important to take into account which counties produce tobacco, the prevalence of production, and the extent of economic dependence. Below are relevant statistics.
If this county does not produce tobacco, the rest of this page will be empty.
Table 6.8b: Tobacco Production, 2002 (Department of Agriculture, Census 2002, http://www.nass.usda.gov/census/census02/volume1/in/st18_2_023_023.pdf Accessed 5/24/2007.

GIS in Prevention, County Profiles, Series 4 (2007)
6. Risk Factors: Community Risk Factors – Laws & Norms; Transitions and Mobility
6.9 Youth Access to Tobacco
The IPRC is grateful to Sergeant Poindexter, State Director of the Indiana Tobacco Retailer Inspection Program (TRIP) and to Aaron Jones, Coordinator of TRIP at the Indiana Prevention Resource Center, and to the staff and police officers of TRIP for all the support they have given to this project.
The IPRC has studied the TRIP data generously made available by the Indiana State Excise Police and has created two additional statistical measurements:
1) for the intensity of inspections (the number of inspections relative to the total number of outlets);
2) for the number of inspections per capita for the population of youth most likely to seek access to tobacco, (i.e., youth ages 10-17).
Intensity of inspection is one of many possible indicators of the degree of a county’s involvement in activities to create or maintain a community norm that says “youth access to tobacco is not tolerated in our community.” Where inspection failure rates are high, high intensity of inspections shows the community is responding to the problem and gives reason for optimism that rates will go down. Where failure rates are already low, it shows determination to maintain excellence and the intensity level may be lower since the problem is under control.
Where failure rates are high and intensity of inspection low, this could indicate lack of community readiness to address the problem. Or it could be that the community has an alternative prevention method.
Enforcement of the law communicates to youth and others that the community regards smoking as unhealthy and supports a norm of no sales to youth, discouraging youth smoking.

GIS in Prevention, County Profiles, Series 4 (2007)
6. Risk Factors: Community Risk Factors – Laws & Norms; Transitions and Mobility
6.9 Intensity of Inspection (TRIP)
Table 6.9: Intensity of TRIP Inspections and Related Statistics, Calculations for 2005 Based on Data from the TRIP Program (ATC, Indiana State Excise Police, 2006)
TRIP Inspection Data (using data for 2005 from IN State Excise Police), ATC 2006
Elkhart Indiana
Intensity of Inspection 1 1
No, Insp per 1,000 Youth 10-17 8 12
Population 10-17 24,079 726,218
Total Population 192,614 6,270,352
Total No. of Tobacco Retail Outlets 2005 182 6,401
Total inspections Completed 183 8,503
Total Failed Inspections 42 1,076
Percent, Failed Inspections 23 13
Percent, Passed Inspections 77 87
Ranking (1-81) for % Failed Inspections 15
Ranking (1-81) for % Passed Inspections 69

GIS in Prevention, County Profiles, Series 4 (2007)
6. Risk Factors: Community Risk Factors – Laws & Norms; Transitions and Mobility
6.10 Gambling Casinos & Race Tracks
The presence of gambling establishments -- like the presence of tobacco and alcohol outlets, billboards and other forms of advertising – provides information on community environment and would appear to be an indicator of risk for ATOD problems in a community. Below is a listing of casinos and no horse-racing establishments located in this county.
If this page is blank, there were no gambling establishments identified for this county.

GIS in Prevention, County Profiles, Series 4 (2007)
6. Risk Factors: Community Risk Factors – Laws & Norms; Transitions and Mobility
6.11a Adult Gambling Behavior
Like the modeling of smoking and drinking, gambling by adults sets a tone for youth expectations about what it means to be an adult. This report includes maps and tables detailing gambling behaviors by persons 18 and older. The following table reports on the number and percent of persons ages 18 and over who gambled in a casino six or more times in the past year and who played the lottery six or more times in the past 30 days. These gambling statistics were projected based on sophisticated demographic analysis by MediaMark Research, Inc.
Table 6.11a: Adult Gambling Behaviors (Casino and Lottery) (MRI, Consumer Behavior Lifestyle 2005, 2006)
Adult Gambling Behaviors, 2005 est. (2006) Percent of Households
Elkhart Indiana U.S.
Casino Gambling (Any) 35.9 35.3 37.2
Atlantic City gambling 5.1 4.6 6.1
Las Vegas gambling 7.8 8.4 11
Mississippi Gulf Coast gambling 2.1 2.6 2.6
Reno gambling 1.6 1.6 2.2
Other gambling 21.8 21.5 18.1
RANK, Any Casino Gambling 17 24th of 51

GIS in Prevention, County Profiles, Series 4 (2007)
6. Risk Factors: Community Risk Factors – Laws & Norms; Transitions and Mobility
6.11b Household Leisure Activities
The following table compares the percent of households which engaged in leisure activities related to gambling (playing bingo, playing cards, and attending horseraces) in this county compared to the state and nation.
Table 6.11b: Leisure Activities by Household (bingo, playing cards, attending horse races) (MRI, Consumer Behavior Lifestyle 2005, 2006)
Leisure Activities, 2005 est. (2006) Percent of Households
Elkhart Indiana U.S.
Current Year Estimated Households 70,785 2,359,291 110,228,304
Play bingo 10.2 9.9 8.6
Play cards 49.4 49.1 45.4
Attend Horse Races 5.5 5.2 5.1

GIS in Prevention, County Profiles, Series 4 (2007)
6. Risk Factors: Community Risk Factors – Laws & Norms; Transitions and Mobility
6.11c Gambling: Hoosier Lottery Sales
The following statistics show Hoosier Lottery sales by county for this county from the fiscal year.
Table 6.11b: Hoosier Lottery Sales by county, Fiscal Year 2005 (Hoosier Lottery, 2006)
Lottery Sales Fiscal Year 2005,2006
Elkhart Indiana
FY 2005 Total Sales (7/1/04-6/30/05) $ 23,194,642 $ 740,842,975
FY 2006 Total Sales (7/1/05-6/30/06) $ 25,458,136 $ 819,648,513

GIS in Prevention, County Profiles, Series 4 (2007)
6. Risk Factors: Community Risk Factors – Laws & Norms; Transitions and Mobility
6.12 Crime Statistics: Introduction
People prefer to reside and businesses prefer to locate where they feel safe to move about, to study and to work. Levels of criminal activity in an area constitute an environmental influence on many aspects of life. People plan their lives taking into account levels of danger associated with activities. How late at night is it safe to be out? on foot? by car? alone? with a group?
For a child, the nature of their environment and the behaviors of their family, friends, neighbors, classmates, and community members strongly contribute to the child’s view of the world and of human nature, and to the child’s expectations for his or her own future behaviors and fate. If people close to the child model criminal behaviors or are often victims of the same, the child will likely hold expectations, including fears, of encountering similar future circumstances.
Hence crime statistics are a useful insight into the character of a place and are important to consider in prevention planning. A prevention program needs to be conducted in a safe place and at a time when it is safe for people to attend. The prevention professionals planning the program could consider specific activities designed to confront, enhance, or offer alternatives to norms and role modeling prevalent in the child’s world.
Data about crimes, arrests and convictions is not collected in any one central location in the state of Indiana at this time.

GIS in Prevention, County Profiles, Series 4 (2007)
6. Risk Factors: Community Risk Factors – Laws & Norms; Transitions and Mobility
6.12a Crime Indices
One of the best sources of data available for Indiana at this time is the Crime Risk database published by AGS, who use the FBI’s Uniform Crime Report. Because the level and methods of reporting information to the FBI vary by jurisdiction, information about specific crimes should be viewed as a general indicator rather than for exact precision or exact comparisons.
The AGS Crime Risk Index describes the risk of various types of crime in a given geographic area (e.g., city or state) by comparing the rate of crime in that location to the rate of crime in the nation as a whole. The crime rate for the U.S. is set to 100 for all crimes. Hence a rate of 200 means that the risk of crime in that place is twice as high as for the nation as a whole. (Think of these numbers not as counts of criminal incidents, but as degrees of risk. Hence, an index of 200 means that while the risk of this crime is x per 1000 persons for the nation as a whole, it is 2x per 1000 for the community in question). The following table shows the Crime Indices for Total Crime, Property Crime and Personal Crime. This table shows indices for this county compared to Indiana and the nation. The limitations of this data are the same as for the FBI UCR.
Table 6.12a: Total Crime, Property Crime, and Personal Crime Indices, 2005. (AGS Crime Risk 2005, 2006)
Crime Indices, 2005 (AGS, 2006, based on FBI UCR)
Elkhart Indiana US
IN Rank in US
Total Crime Index 103 90 100 31st of 51
Personal Crime Index 74 73 100 28th of 51
Property Crimes 120 93 100 31st of 51

GIS in Prevention, County Profiles, Series 4 (2007)
6. Risk Factors: Community Risk Factors – Laws & Norms; Transitions and Mobility
Map: Total Crime Indices
Bottom Quarter, Middle Range, Highest Quarter (above __, above IN & over US)
Above US (),
Above IN (),
Top Quarter (),
Mid Range (),
Lowest Quarter (),
AGS, Crime Indices2005 (2006)Indiana Prevention Resource Center

GIS in Prevention, County Profiles, Series 4 (2007)
6. Risk Factors: Community Risk Factors – Laws & Norms; Transitions and Mobility
Map: Personal Crime IndicesBottom Quarter; Mid Range (); Top Quarter (above __, above IN, above US)
AGS, Crime Indices2005 (2006)Indiana Prevention Resource Center
Above US (),
Above IN (),
Top Quarter (),
Mid Range (),
Lowest Quarter (),

GIS in Prevention, County Profiles, Series 4 (2007)
6. Risk Factors: Community Risk Factors – Laws & Norms; Transitions and Mobility
Map: Property Crime IndicesBottom Quarter, Mid Range, Top Quarter (includes over IN & over US)
AGS, Crime Indices2005 (2006)Indiana Prevention Resource Center
Above US (),
Above IN (),
Top Quarter (),
Mid Range (),
Lowest Quarter (),

GIS in Prevention, County Profiles, Series 4 (2007)
6. Risk Factors: Community Risk Factors – Laws & Norms; Transitions and Mobility
6.12b Crime Indices – Specific Crimes
The following table shows the Crime Indices for specific property and personal crimes. The method is to compare the risk in a given location to the general crime risk for the nation as a whole. We see that in the context of the U.S., Indiana is generally safer than other places for risk of robbery, but is more dangerous for risk of murder. See the Appendix Glossary for definitions of these crimes. This table shows indices for this county, compared to Indiana and the nation (which is the point of comparison).
Table 6.12b: Specific Crimes, Indices (AGS Crime Risk 2005, 2006)
Crime Indices 2005 (AGS, 2006) -- Rankings (among counties and states)
Elkhart IN Rank in US
Rank Personal Crime 8 28 of 51
Rank Murder 13 21
Rank Rape 7 34
Rank Robbery 8 25
Rank Assault 7 27
Rank Property Crime 7 31 of 51
Rank Burglary 6 28
Rank Larceny 6 30
Rank Motor Vehicle Theft 7 28

GIS in Prevention, County Profiles, Series 4 (2007)
6. Risk Factors: Community Risk Factors – Laws & Norms; Transitions and Mobility
6.13a. FBI UCR: All Arrests
The following data is from the FBI Uniform Crime Report as published by the University of Virginia Library website. (There is a all arrests for crimes, including drug arrests, for the indicated year.
Table 6.13a: All Arrests, including Drug Arrests, 2002 (FBI Uniform Crime Reports, 2005)
FBI UCR All Arrests, 2002: Elkhart
Coverage 100
Alcohol-Related Arrests
Liquor Law Violation 442
Driving Under the Influence 1127
Drunkenness 415
Drug Possession: 652
Marijuana 498
Opium/Cocaine 98
Other Drug Possession 5
Other Dangerous Narcotic 1
Synthetic Drug Possession 51

GIS in Prevention, County Profiles, Series 4 (2007)
6. Risk Factors: Community Risk Factors – Laws & Norms; Transitions and Mobility
6.13b. FBI UCR: Juvenile Arrests
The following data is from the FBI Uniform Crime Report as published by the University of Virginia Library website. (There is a link from the PREV-STAT™ County/Local Data Page on the Indiana Prevention Resource Center web site.) This table presents juvenile arrests for crimes, including drug arrests, for the indicated year.
Table 6.13b: Juvenile Arrests, including Drug Arrests, 2002 (FBI Uniform Crime Reports, 2005)
FBI UCR All Arrests, 2002: Elkhart
Sale/Manufacturing of Drugs 37
Marijuana Sale/Manufacture 11
Opium/Cocaine Sale/Manufacture 18
Synthetic Drug Sale/Manufacture 7
Gambling 0
Sexual Offenses
Prostitution & Communication 13
Sex Offenses 74
Select Behaviors
Disorderly Conduct 267
Runaway Juveniles 265
Weapons Violations 65

GIS in Prevention, County Profiles, Series 4 (2007)
6. Risk Factors: Community Risk Factors – Laws & Norms; Transitions and Mobility
6.14a Alcohol-Related CrashesPersons Killed and Highest BAC in Crash
Table 6.14a: Persons Killed and Highest Blood Alcohol Concentration in Crashes, 2005 (Fatality Analysis Reporting System, FARS, 2007) (www-fars.nhtsa.dot.gov)
The following data from the Fatality Analysis Reporting System (FARS) regarding persons killed and highest blood alcohol concentration in the crash. Persons involved in an alcohol-related crash may or may not have been drinking. The highest blood alcohol concentration (BAC) involved in a crash may be: zero, some impairment but below the legal limit, or legally impaired (.08). It reports the total number of alcohol-related deaths and what percent they represent of all deaths from these accidents. The last two rows provide data on all (100%) of deaths in these crashes. All persons in the car were not necessarily driving at the time of the alcohol-related crash.
Alcohol Related Crashes, FARS, 2005 data (2007)
County ELKHART IN
BAC 0 (No.) 27 618
BAC 0 (%) 71 66
BAC .01-.07(No.) 5 47
BAC .01-.07(%) 14 5
BAC .08 (No.) 6 273
BAC .08 (%) 15 29
Total Alc-Related Killed (No.) 11 320
Total Alc-Related Killed (%) 29 34
Total Killed (No.) 38 938
Total Killed (%) 100 100

GIS in Prevention, County Profiles, Series 4 (2007)
6. Risk Factors: Community Risk Factors – Laws & Norms; Transitions and Mobility
6.14b Alcohol-Related CrashesDrivers Involved in Fatal Crashes by BAC of Driver
Table 6.14b: Drivers Involved in Fatal Crashes by Blood Alcohol Content of the Driver, 2005 (Fatality Analysis Reporting System, FARS, 2007) (www-fars.nhtsa.dot.gov)
The following data from the Fatality Analysis Reporting System (FARS) regarding drivers involved in fatal crashes by blood alcohol concentration. This table distinguishes between drivers involved in fatal crashes and those with any alcohol in their system. Looking at tables 16.a and 16.b you can see how many non-drinking persons were killed by drinking drivers.
Drivers Involved in Fatal Crashes by Blood Alcohol Concentration, FARS, 2005 data (2006)
County Elkhart Indiana
BAC 0 (No.) 49 1,033
BAC 0 (%) 86 79
BAC .01-.07(No.) 3 46
BAC .01-.07(%) 6 4
BAC .08 (No.) 5 234
BAC .08 (%) 8 18
Any Alcohol (BAC=0.01+) No. 8 280
Any Alcohol (BAC=0.01+) % 14 21
Total Drivers involved in fatal Crash (No.) 57 1313
Total Drivers involved in fatal Crash % 100 100

GIS in Prevention, County Profiles, Series 4 (2007)
6. Risk Factors: Community Risk Factors – Laws & Norms; Transitions and Mobility
6.14c Fatalities (all causes) in Crashes
The following data from the Fatality Analysis Reporting System (FARS) reports on the number of fatalities (from all causes) in vehicle crashes in this county and the change from last year. Stat and national trend data is also included for both change in number of deaths and rate of deaths per 100,000 population. Note that while the number of fatalities may increase, the rate of fatalities (per 100,000 population) could decrease, due to growth in population.
Table 6.14c: ……
Trend: Indiana
Number of
Fatalities
Rate per
100,000
1994 869 16.90
2004 857 15.18
2005 855 NA
Change 2004-2005 -0.2% NA
Change 1994-2005 -1.6% -1.72
Trend: U.S.
Number of
FatalitiesRate per 100,000
1994 40,716 15.64
2004 42,836 14.59
2005 43,443 NA
Change 2004-2005 1.4% NA
Change 1994-2005 6.3% -1.05
6-14c Fatalities and Rate of Change, FARS (2007)
ELKHART (39) Indiana U.S.
2004 29 947 42836
2005 38 938 43443
Difference 2004-2005 31.0% -1.0% 1.4%
Difference 1994-2005 22.6% -3.4% 6.3%

GIS in Prevention, County Profiles, Series 4 (2007)
6. Risk Factors: Community Risk Factors – Laws & Norms; Transitions and Mobility
6.15 Net Migration
For studies of a local neighborhood, the Department of Education web site offers information on retention and drop-out or transfers from neighborhood schools. The IYI web site offers data for the county on graduation rates, drop out rates, etc.
Table 6.15: Net Migration, 2004 to 2005 (U.S. Census Bureau, 2006)
Community Risk Factors: Transitions & Migration
An excellent indicator of the “transitions and mobility” indicator is the figure for net migration. Data for domestic and international migration from the U.S. Census Bureau is summarized in the following table.
Net Migration (2004 to 2005) (U.S. Census Bureau)
Elkhart Indiana U.S.
Natural Increase (Births Minus Deaths) 1,769 30,731 1,704,036
Net Domestic Migration (change July 2003 to July 2004) 785 9,062 n/a
Net International Migration (change July 2003 to July 2004) 1,148 5,061 1,049,526
Net Migration (change July 2003 to July 2004) 1,933 14,123 1,049,526