Embed Size (px)
Citation preview
GKB Ophthalmics Ltd
Enhancing investment decisions
Q3FY11 Result Update
Explanation of CRISIL Fundamental and Valuation (CFV) matrix
The CFV Matrix (CRISIL Fundamental and Valuation Matrix) addresses the two important analysis of an investment making process –
Analysis of Fundamentals (addressed through Fundamental Grade) and Analysis of Returns (Valuation Grade) The fundamental
grade is assigned on a five-point scale from grade 5 (indicating Excellent fundamentals) to grade 1 (Poor fundamentals) The
valuation grade is assigned on a five-point scale from grade 5 (indicating strong upside from the current market price (CMP)) to
grade 1 (strong downside from the CMP).
CRISIL Fundamental Grade
Assessment CRISIL Valuation Grade
Assessment
5/5 Excellent fundamentals 5/5 Strong upside (>25% from CMP)
4/5 Superior fundamentals 4/5 Upside (10-25% from CMP)
3/5 Good fundamentals 3/5 Align (+-10% from CMP)
2/5 Moderate fundamentals 2/5 Downside (- 10-25% from CMP)
1/5 Poor fundamentals 1/5 Strong downside (<-25% from CMP)
Analyst Disclosure Each member of the team involved in the preparation of the grading report, hereby affirms that there exists no conflict of interest
that can bias the grading recommendation of the company. Additional Disclosure This report has been sponsored by NSE - Investor Protection Fund Trust (NSEIPFT). Disclaimer: This Exchange-commissioned Report (Report) is based on data publicly available or from sources considered reliable by CRISIL
(Data). However, CRISIL does not guarantee the accuracy, adequacy or completeness of the Data / Report and is not responsible for
any errors or omissions or for the results obtained from the use of Data / Report. The Data / Report are subject to change without
any prior notice. Opinions expressed herein are our current opinions as on the date of this Report. Nothing in this Report constitutes
investment, legal, accounting or tax advice or any solicitation, whatsoever. The Report is not a recommendation to buy / sell or hold
any securities of the Company. CRISIL especially states that it has no financial liability, whatsoever, to the subscribers / users of this
Report. This Report is for the personal information only of the authorized recipient in India only. This Report should not be
reproduced or redistributed or communicated directly or indirectly in any form to any other person – especially outside India or
published or copied in whole or in part, for any purpose.
CRISIL EQUITIES | 1
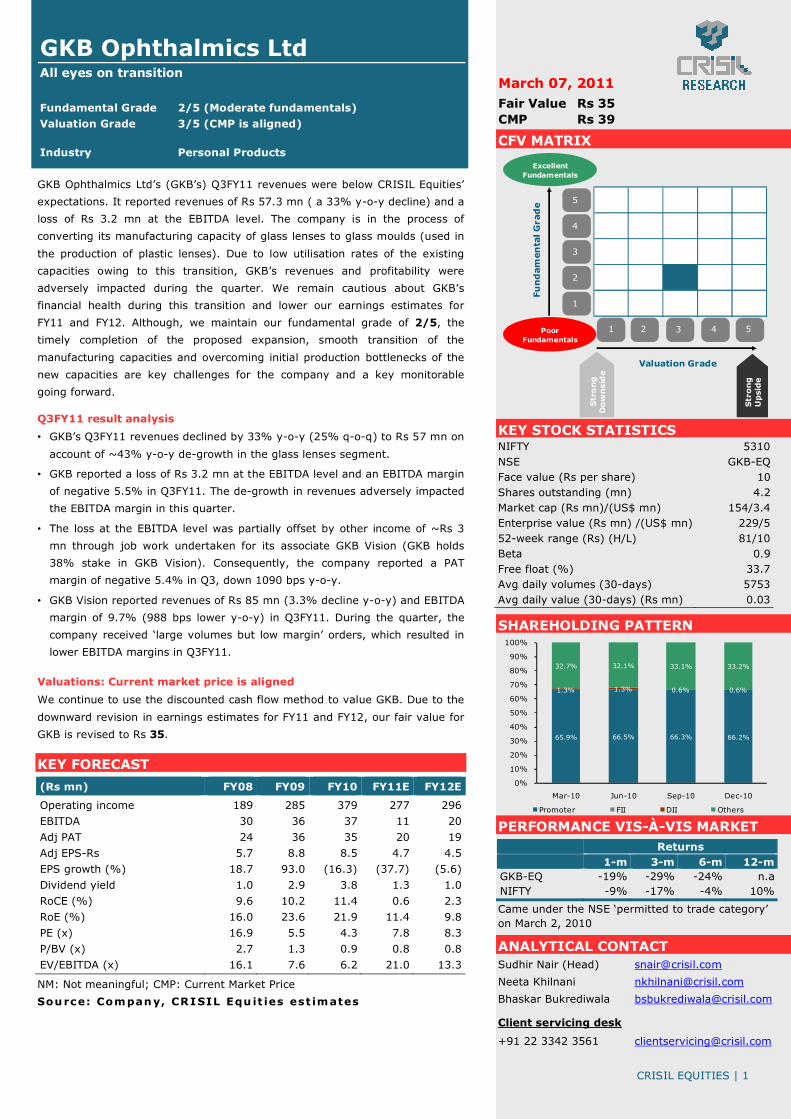
GKB Ophthalmics Ltd All eyes on transition
Fundamental Grade 2/5 (Moderate fundamentals)
Valuation Grade 3/5 (CMP is aligned) Industry Personal Products
Fair Value Rs 35 CMP Rs 39
March 07, 2011
GKB Ophthalmics Ltd’s (GKB’s) Q3FY11 revenues were below CRISIL Equities’
expectations. It reported revenues of Rs 57.3 mn ( a 33% y-o-y decline) and a
loss of Rs 3.2 mn at the EBITDA level. The company is in the process of
converting its manufacturing capacity of glass lenses to glass moulds (used in
the production of plastic lenses). Due to low utilisation rates of the existing
capacities owing to this transition, GKB’s revenues and profitability were
adversely impacted during the quarter. We remain cautious about GKB’s
financial health during this transition and lower our earnings estimates for
FY11 and FY12. Although, we maintain our fundamental grade of 2/5, the
timely completion of the proposed expansion, smooth transition of the
manufacturing capacities and overcoming initial production bottlenecks of the
new capacities are key challenges for the company and a key monitorable
going forward. Q3FY11 result analysis
• GKB’s Q3FY11 revenues declined by 33% y-o-y (25% q-o-q) to Rs 57 mn on
account of ~43% y-o-y de-growth in the glass lenses segment.
• GKB reported a loss of Rs 3.2 mn at the EBITDA level and an EBITDA margin
of negative 5.5% in Q3FY11. The de-growth in revenues adversely impacted
the EBITDA margin in this quarter.
• The loss at the EBITDA level was partially offset by other income of ~Rs 3
mn through job work undertaken for its associate GKB Vision (GKB holds
38% stake in GKB Vision). Consequently, the company reported a PAT
margin of negative 5.4% in Q3, down 1090 bps y-o-y.
• GKB Vision reported revenues of Rs 85 mn (3.3% decline y-o-y) and EBITDA
margin of 9.7% (988 bps lower y-o-y) in Q3FY11. During the quarter, the
company received ‘large volumes but low margin’ orders, which resulted in
lower EBITDA margins in Q3FY11.
Valuations: Current market price is aligned
We continue to use the discounted cash flow method to value GKB. Due to the
downward revision in earnings estimates for FY11 and FY12, our fair value for
GKB is revised to Rs 35.
KEY FORECAST
(Rs mn) FY08 FY09 FY10 FY11E FY12E
Operating income 189 285 379 277 296
EBITDA 30 36 37 11 20
Adj PAT 24 36 35 20 19
Adj EPS-Rs 5.7 8.8 8.5 4.7 4.5
EPS growth (%) 18.7 93.0 (16.3) (37.7) (5.6)
Dividend yield 1.0 2.9 3.8 1.3 1.0
RoCE (%) 9.6 10.2 11.4 0.6 2.3
RoE (%) 16.0 23.6 21.9 11.4 9.8
PE (x) 16.9 5.5 4.3 7.8 8.3
P/BV (x) 2.7 1.3 0.9 0.8 0.8
EV/EBITDA (x) 16.1 7.6 6.2 21.0 13.3
NM: Not meaningful; CMP: Current Market Price
Source: Company, CRISIL Equ it ies est imates
CFV MATRIX
KEY STOCK STATISTICS NIFTY 5310 NSE GKB-EQ Face value (Rs per share) 10 Shares outstanding (mn) 4.2 Market cap (Rs mn)/(US$ mn) 154/3.4 Enterprise value (Rs mn) /(US$ mn) 229/5 52-week range (Rs) (H/L) 81/10 Beta 0.9 Free float (%) 33.7 Avg daily volumes (30-days) 5753 Avg daily value (30-days) (Rs mn) 0.03
SHAREHOLDING PATTERN
PERFORMANCE VIS-À-VIS MARKET
Returns
1-m 3-m 6-m 12-m
GKB-EQ -19% -29% -24% n.a NIFTY -9% -17% -4% 10%
Came under the NSE ‘permitted to trade category’ on March 2, 2010
ANALYTICAL CONTACT Sudhir Nair (Head) [email protected]
Neeta Khilnani [email protected]
Bhaskar Bukrediwala [email protected]
Client servicing desk
+91 22 3342 3561 [email protected]
1 2 3 4 5
1
2
3
4
5
Valuation Grade
Fu
nd
am
en
tal G
rad
e
Poor Fundamentals
ExcellentFundamentals
Str
on
gD
ow
nsid
e
Str
on
gU
psi
de
65.9% 66.5% 66.3% 66.2%
1.3% 1.3% 0.6% 0.6%
32.7% 32.1% 33.1% 33.2%
0%
10%
20%
30%
40%
50%
60%
70%
80%
90%
100%
Mar-10 Jun-10 Sep-10 Dec-10
Promoter FII DII Others
CRISIL EQUITIES | 2
GKB Ophthalmics Ltd
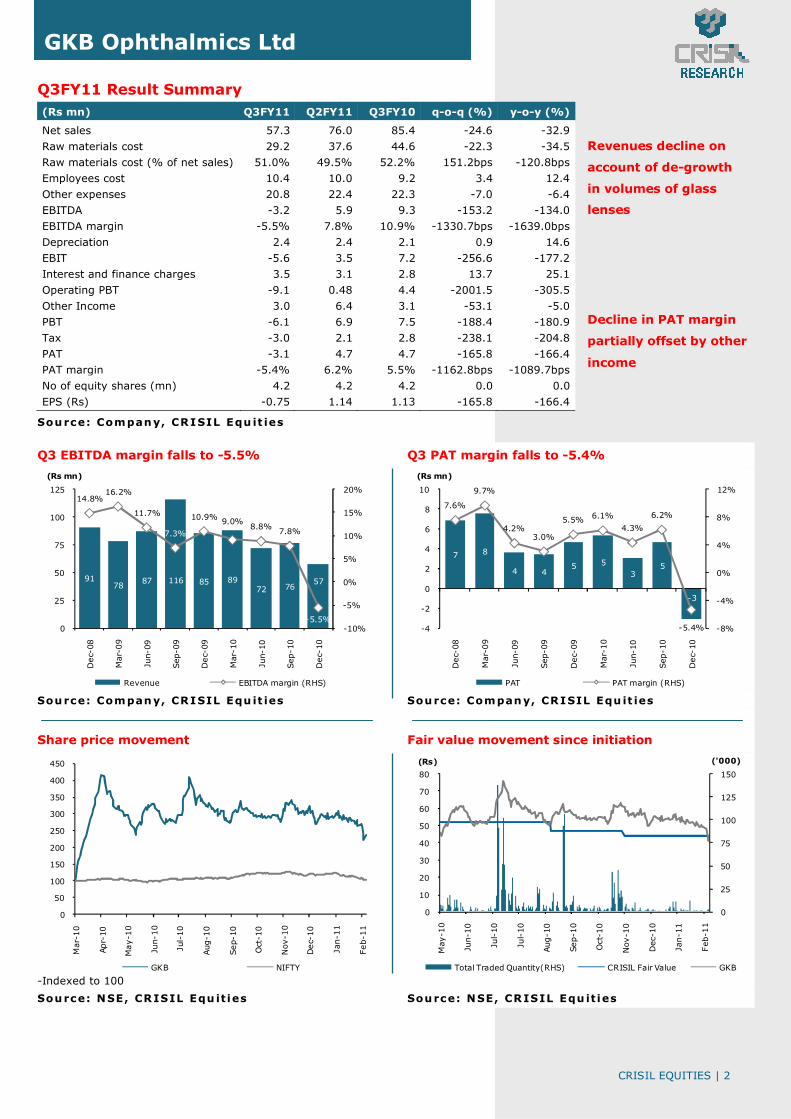
Q3FY11 Result Summary (Rs mn) Q3FY11 Q2FY11 Q3FY10 q-o-q (%) y-o-y (%)
Net sales 57.3 76.0 85.4 -24.6 -32.9
Raw materials cost 29.2 37.6 44.6 -22.3 -34.5
Raw materials cost (% of net sales) 51.0% 49.5% 52.2% 151.2bps -120.8bps
Employees cost 10.4 10.0 9.2 3.4 12.4
Other expenses 20.8 22.4 22.3 -7.0 -6.4
EBITDA -3.2 5.9 9.3 -153.2 -134.0
EBITDA margin -5.5% 7.8% 10.9% -1330.7bps -1639.0bps
Depreciation 2.4 2.4 2.1 0.9 14.6
EBIT -5.6 3.5 7.2 -256.6 -177.2
Interest and finance charges 3.5 3.1 2.8 13.7 25.1
Operating PBT -9.1 0.48 4.4 -2001.5 -305.5
Other Income 3.0 6.4 3.1 -53.1 -5.0
PBT -6.1 6.9 7.5 -188.4 -180.9
Tax -3.0 2.1 2.8 -238.1 -204.8
PAT -3.1 4.7 4.7 -165.8 -166.4
PAT margin -5.4% 6.2% 5.5% -1162.8bps -1089.7bps
No of equity shares (mn) 4.2 4.2 4.2 0.0 0.0
EPS (Rs) -0.75 1.14 1.13 -165.8 -166.4
Source: Company, CRISIL Equ it ies
Q3 EBITDA margin falls to -5.5% Q3 PAT margin falls to -5.4%
Source: Company, CRISIL Equ it ies Source: Company, CRISIL Equ it ies
Share price movement Fair value movement since initiation
-Indexed to 100
Source: NSE, CRISIL Equ ities Source: NSE, CRISIL Equ ities
9178 87 116 85 89
72 7657
14.8%16.2%
11.7%
7.3%
10.9% 9.0%8.8% 7.8%
-5.5%-10%
-5%
0%
5%
10%
15%
20%
0
25
50
75
100
125
Dec-
08
Mar
-09
Jun-
09
Sep
-09
Dec-
09
Mar
-10
Jun-
10
Sep
-10
Dec-
10
(Rs mn)
Revenue EBITDA margin (RHS)
7 8
4 45 5
35
-3
7.6%
9.7%
4.2%3.0%
5.5% 6.1%
4.3%
6.2%
-5.4% -8%
-4%
0%
4%
8%
12%
-4
-2
0
2
4
6
8
10
Dec-
08
Mar
-09
Jun-
09
Sep
-09
Dec-
09
Mar
-10
Jun-
10
Sep
-10
Dec-
10
(Rs mn)
PAT PAT margin (RHS)
0
50
100
150
200
250
300
350
400
450
Mar
-10
Apr-
10
May-1
0
Jun-
10
Jul-
10
Aug
-10
Sep-
10
Oct
-10
Nov
-10
Dec-
10
Jan-1
1
Feb-1
1
GKB NIFTY
0
25
50
75
100
125
150
0
10
20
30
40
50
60
70
80
May
-10
Jun-1
0
Jul-
10
Jul-
10
Aug
-10
Sep-1
0
Oct
-10
Nov
-10
Dec
-10
Jan-1
1
Feb
-11
('000)(Rs)
Total Traded Quantity(RHS) CRISIL Fair Value GKB
Revenues decline on
account of de-growth
in volumes of glass
lenses
Decline in PAT margin
partially offset by other
income
CRISIL EQUITIES | 3
GKB Ophthalmics Ltd
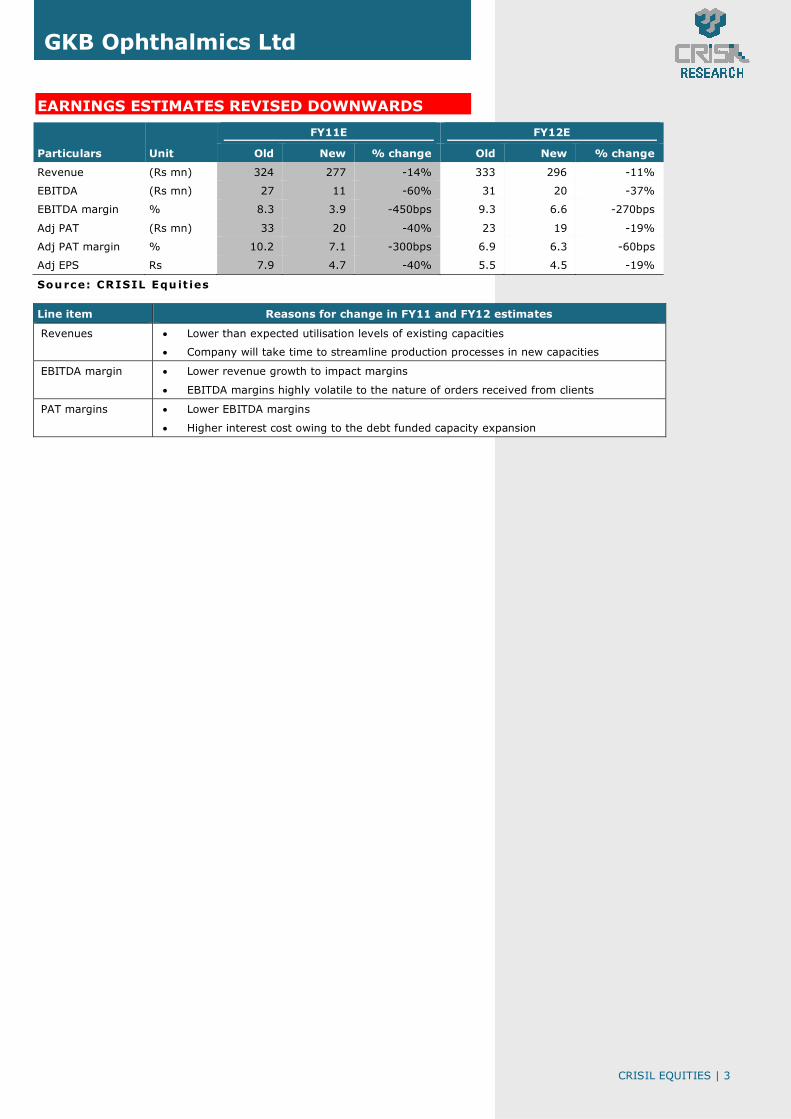
EARNINGS ESTIMATES REVISED DOWNWARDS
Particulars Unit
FY11E FY12E
Old New % change Old New % change
Revenue (Rs mn) 324 277 -14% 333 296 -11%
EBITDA (Rs mn) 27 11 -60% 31 20 -37%
EBITDA margin % 8.3 3.9 -450bps 9.3 6.6 -270bps
Adj PAT (Rs mn) 33 20 -40% 23 19 -19%
Adj PAT margin % 10.2 7.1 -300bps 6.9 6.3 -60bps
Adj EPS Rs 7.9 4.7 -40% 5.5 4.5 -19%
Source: CRISIL Equ it ies
Line item Reasons for change in FY11 and FY12 estimates
Revenues • Lower than expected utilisation levels of existing capacities
• Company will take time to streamline production processes in new capacities
EBITDA margin • Lower revenue growth to impact margins
• EBITDA margins highly volatile to the nature of orders received from clients
PAT margins • Lower EBITDA margins
• Higher interest cost owing to the debt funded capacity expansion
CRISIL EQUITIES | 4
GKB Ophthalmics Ltd
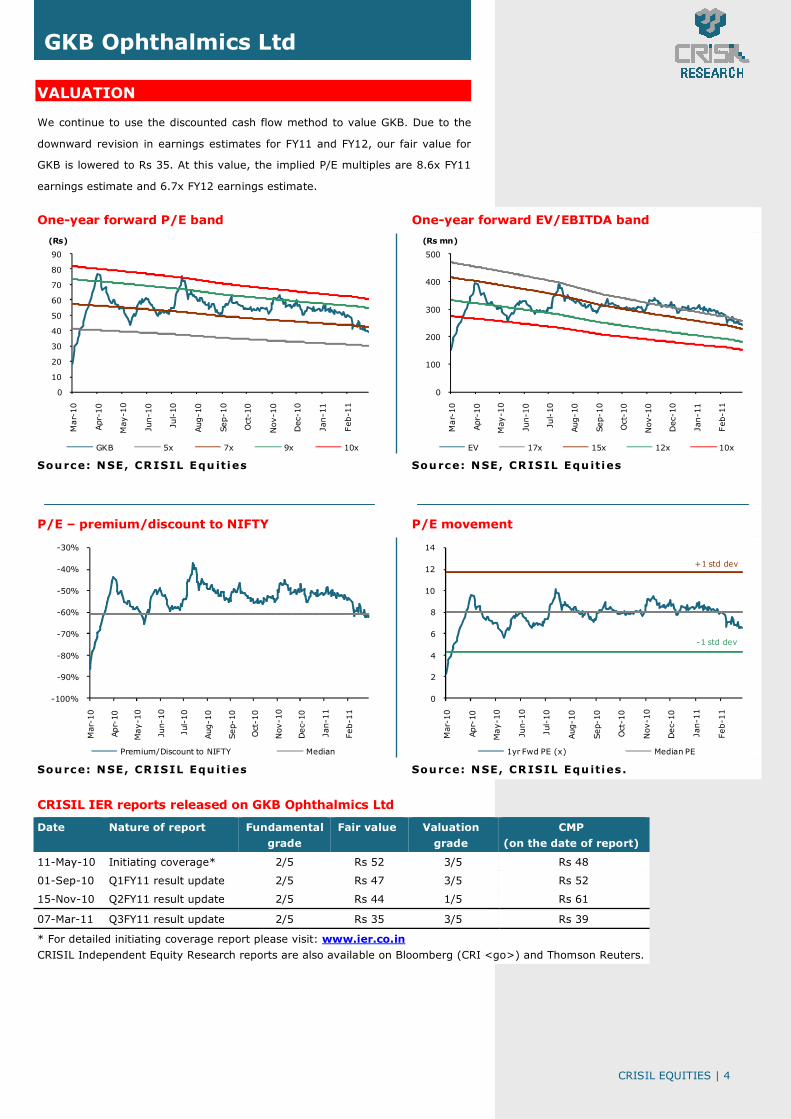
VALUATION
We continue to use the discounted cash flow method to value GKB. Due to the
downward revision in earnings estimates for FY11 and FY12, our fair value for
GKB is lowered to Rs 35. At this value, the implied P/E multiples are 8.6x FY11
earnings estimate and 6.7x FY12 earnings estimate.
One-year forward P/E band One-year forward EV/EBITDA band
Source: NSE, CRISIL Equ ities Source: NSE, CRISIL Equ ities
P/E – premium/discount to NIFTY P/E movement
Source: NSE, CRISIL Equ ities Source: NSE, CRISIL Equ ities.
CRISIL IER reports released on GKB Ophthalmics Ltd
Date Nature of report Fundamental
grade
Fair value Valuation
grade
CMP
(on the date of report)
11-May-10 Initiating coverage* 2/5 Rs 52 3/5 Rs 48
01-Sep-10 Q1FY11 result update 2/5 Rs 47 3/5 Rs 52
15-Nov-10 Q2FY11 result update 2/5 Rs 44 1/5 Rs 61
07-Mar-11 Q3FY11 result update 2/5 Rs 35 3/5 Rs 39
* For detailed initiating coverage report please visit: www.ier.co.in
CRISIL Independent Equity Research reports are also available on Bloomberg (CRI <go>) and Thomson Reuters.
0
10
20
30
40
50
60
70
80
90
Mar-
10
Apr
-10
May
-10
Jun-1
0
Jul-
10
Aug
-10
Sep-1
0
Oct
-10
Nov
-10
Dec
-10
Jan-1
1
Feb
-11
(Rs)
GKB 5x 7x 9x 10x
0
100
200
300
400
500
Mar-
10
Apr
-10
May
-10
Jun-1
0
Jul-
10
Aug
-10
Sep-1
0
Oct
-10
Nov
-10
Dec
-10
Jan-1
1
Feb
-11
(Rs mn)
EV 17x 15x 12x 10x
-100%
-90%
-80%
-70%
-60%
-50%
-40%
-30%
Mar
-10
Apr-
10
May-1
0
Jun-
10
Jul-
10
Aug
-10
Sep-
10
Oct
-10
Nov
-10
Dec-
10
Jan-1
1
Feb-1
1
Premium/Discount to NIFTY Median
0
2
4
6
8
10
12
14
Mar
-10
Apr-
10
May-1
0
Jun-
10
Jul-
10
Aug
-10
Sep-
10
Oct
-10
Nov
-10
Dec-
10
Jan-1
1
Feb-1
1
1yr Fwd PE (x) Median PE
+1 std dev
-1 std dev
CRISIL EQUITIES | 5
GKB Ophthalmics Ltd
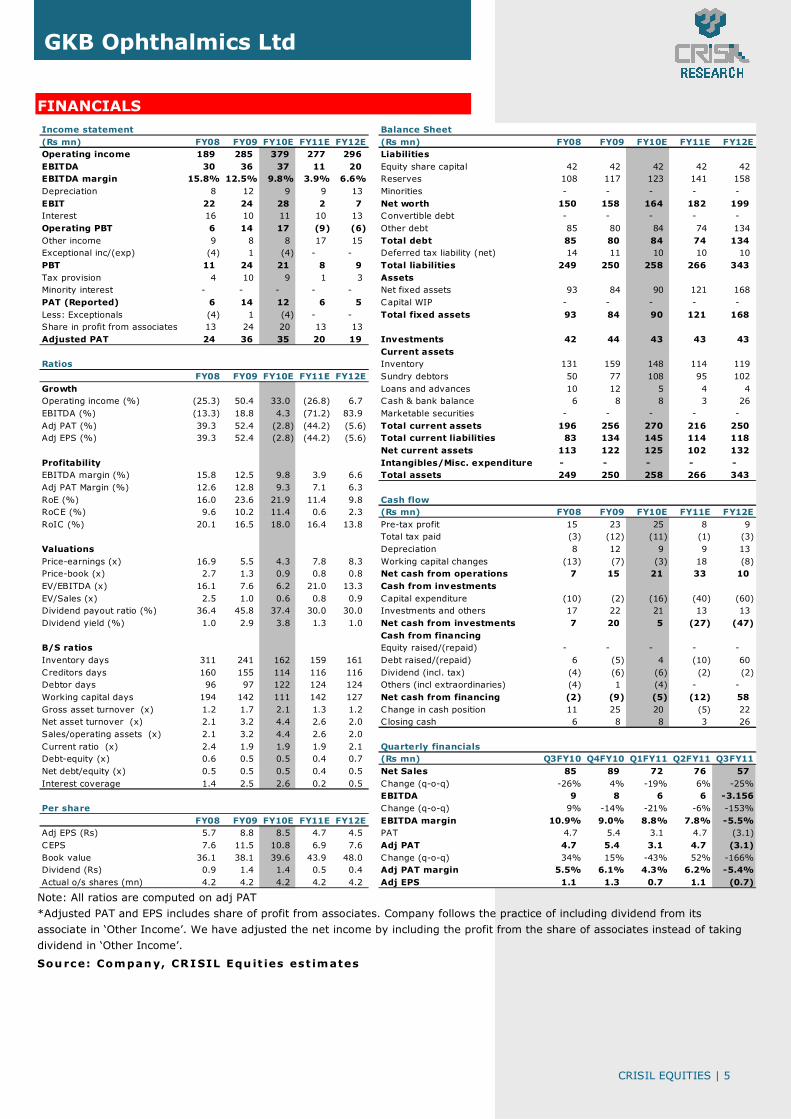
FINANCIALS
Note: All ratios are computed on adj PAT
*Adjusted PAT and EPS includes share of profit from associates. Company follows the practice of including dividend from its
associate in ‘Other Income’. We have adjusted the net income by including the profit from the share of associates instead of taking
dividend in ‘Other Income’.
Source: Company, CRISIL Equ it ies est imates
Income statement Balance Sheet(Rs mn) FY08 FY09 FY10E FY11E FY12E (Rs mn) FY08 FY09 FY10E FY11E FY12EOperating income 189 285 379 277 296 LiabilitiesEBITDA 30 36 37 11 20 Equity share capital 42 42 42 42 42 EBITDA margin 15.8% 12.5% 9.8% 3.9% 6.6% Reserves 108 117 123 141 158 Depreciation 8 12 9 9 13 Minorities - - - - - EBIT 22 24 28 2 7 Net worth 150 158 164 182 199 Interest 16 10 11 10 13 Convertible debt - - - - - Operating PBT 6 14 17 (9) (6) Other debt 85 80 84 74 134 Other income 9 8 8 17 15 Total debt 85 80 84 74 134 Exceptional inc/(exp) (4) 1 (4) - - Deferred tax liability (net) 14 11 10 10 10 PBT 11 24 21 8 9 Total liabilities 249 250 258 266 343 Tax provision 4 10 9 1 3 AssetsMinority interest - - - - - Net fixed assets 93 84 90 121 168 PAT (Reported) 6 14 12 6 5 Capital WIP - - - - - Less: Exceptionals (4) 1 (4) - - Total fixed assets 93 84 90 121 168 Share in profit from associates 13 24 20 13 13 Adjusted PAT 24 36 35 20 19 Investments 42 44 43 43 43
Current assetsRatios Inventory 131 159 148 114 119
FY08 FY09 FY10E FY11E FY12E Sundry debtors 50 77 108 95 102 Growth Loans and advances 10 12 5 4 4 Operating income (%) (25.3) 50.4 33.0 (26.8) 6.7 Cash & bank balance 6 8 8 3 26 EBITDA (%) (13.3) 18.8 4.3 (71.2) 83.9 Marketable securities - - - - - Adj PAT (%) 39.3 52.4 (2.8) (44.2) (5.6) Total current assets 196 256 270 216 250 Adj EPS (%) 39.3 52.4 (2.8) (44.2) (5.6) Total current liabilities 83 134 145 114 118
Net current assets 113 122 125 102 132 Profitability Intangibles/Misc. expenditure - - - - - EBITDA margin (%) 15.8 12.5 9.8 3.9 6.6 Total assets 249 250 258 266 343 Adj PAT Margin (%) 12.6 12.8 9.3 7.1 6.3 RoE (%) 16.0 23.6 21.9 11.4 9.8 Cash flowRoCE (%) 9.6 10.2 11.4 0.6 2.3 (Rs mn) FY08 FY09 FY10E FY11E FY12ERoIC (%) 20.1 16.5 18.0 16.4 13.8 Pre-tax profit 15 23 25 8 9
Total tax paid (3) (12) (11) (1) (3) Valuations Depreciation 8 12 9 9 13 Price-earnings (x) 16.9 5.5 4.3 7.8 8.3 Working capital changes (13) (7) (3) 18 (8) Price-book (x) 2.7 1.3 0.9 0.8 0.8 Net cash from operations 7 15 21 33 10 EV/EBITDA (x) 16.1 7.6 6.2 21.0 13.3 Cash from investmentsEV/Sales (x) 2.5 1.0 0.6 0.8 0.9 Capital expenditure (10) (2) (16) (40) (60) Dividend payout ratio (%) 36.4 45.8 37.4 30.0 30.0 Investments and others 17 22 21 13 13 Dividend yield (%) 1.0 2.9 3.8 1.3 1.0 Net cash from investments 7 20 5 (27) (47)
Cash from financingB/S ratios Equity raised/(repaid) - - - - - Inventory days 311 241 162 159 161 Debt raised/(repaid) 6 (5) 4 (10) 60 Creditors days 160 155 114 116 116 Dividend (incl. tax) (4) (6) (6) (2) (2) Debtor days 96 97 122 124 124 Others (incl extraordinaries) (4) 1 (4) - - Working capital days 194 142 111 142 127 Net cash from financing (2) (9) (5) (12) 58 Gross asset turnover (x) 1.2 1.7 2.1 1.3 1.2 Change in cash position 11 25 20 (5) 22 Net asset turnover (x) 2.1 3.2 4.4 2.6 2.0 C losing cash 6 8 8 3 26 Sales/operating assets (x) 2.1 3.2 4.4 2.6 2.0 Current ratio (x) 2.4 1.9 1.9 1.9 2.1 Quarterly financialsDebt-equity (x) 0.6 0.5 0.5 0.4 0.7 (Rs mn) Q3FY10 Q4FY10 Q1FY11 Q2FY11 Q3FY11Net debt/equity (x) 0.5 0.5 0.5 0.4 0.5 Net Sales 85 89 72 76 57 Interest coverage 1.4 2.5 2.6 0.2 0.5 Change (q-o-q) -26% 4% -19% 6% -25%
EBITDA 9 8 6 6 -3.156Per share Change (q-o-q) 9% -14% -21% -6% -153%
FY08 FY09 FY10E FY11E FY12E EBITDA margin 10.9% 9.0% 8.8% 7.8% -5.5%Adj EPS (Rs) 5.7 8.8 8.5 4.7 4.5 PAT 4.7 5.4 3.1 4.7 (3.1) CEPS 7.6 11.5 10.8 6.9 7.6 Adj PAT 4.7 5.4 3.1 4.7 (3.1) Book value 36.1 38.1 39.6 43.9 48.0 Change (q-o-q) 34% 15% -43% 52% -166%Dividend (Rs) 0.9 1.4 1.4 0.5 0.4 Adj PAT margin 5.5% 6.1% 4.3% 6.2% -5.4%Actual o/s shares (mn) 4.2 4.2 4.2 4.2 4.2 Adj EPS 1.1 1.3 0.7 1.1 (0.7)
CRISIL Independent Equity Research Team
Mukesh Agarwal Director +91 (22) 3342 3035 [email protected]
Tarun Bhatia Director, Capital Markets +91 (22) 3342 3226 [email protected]
Chetan Majithia Head, Equities +91 (22) 3342 4148 [email protected]
Sudhir Nair Head, Equities +91 (22) 3342 3526 [email protected]
Nagarajan Narasimhan Director, Research +91 (22) 3342 3536 [email protected]
Ajay D'Souza Head, Research +91 (22) 3342 3567 [email protected]
Aparna Joshi Head, Research +91 (22) 3342 3540 [email protected]
Manoj Mohta Head, Research +91 (22) 3342 3554 [email protected]
Sridhar C Head, Research +91 (22) 3342 3546 [email protected] CRISIL’s Equity Offerings The Equity Group at CRISIL Research provides a wide range of services including:
Independent Equity Research IPO Grading White Labelled Research Valuation on companies for use of Institutional Investors, Asset Managers, Corporate
Other Services by the Research group include
CRISINFAC Industry research on over 60 industries and Economic Analysis Customised Research on Market sizing, Demand modelling and Entry strategies Customised research content for Information Memorandum and Offer documents
About CRISIL
CRISIL is India's leading Ratings, Research, Risk and Policy Advisory Company.
About CRISIL Research CRISIL Research is India's largest independent, integrated research house. We leverage our unique, integrated
research platform and capabilities spanning the entire economy-industry-company spectrum to deliver superior
perspectives and insights to over 750 domestic and global clients, through a range of subscription products and
customised solutions.
Ashish Sethi – Head, Business Development Email : [email protected] I Phone : 9920807575
To know more about CRISIL IER, please contact our team members:
Sagar Sawarkar – Senior Manager, Business Development
Email : [email protected] I Phone : 9821638322
Regional Contacts:
Head Office: CRISIL House, Central Avenue, Hiranandani Business Park, Powai, Mumbai - 400 076 Phone : 91-22-3342 3000 Web: www.crisil.com Download reports from: www.ier.co.in
Vinaya Dongre – Head, Business Development Email : [email protected] I Phone : 9920225174
Kolkata Priyanka Agarwal - Manager, Business Development Email : [email protected] I Phone : 9903060685 New Delhi Vipin Saboo - Manager, Business Development Email : [email protected] I Phone : 9820779873
Ahmedabad / Mumbai / Pune Vishal Shah - Manager, Business Development Email : [email protected] I Phone : 9820598908 Bengaluru / Chennai Anand Krishnamoorthy - Manager, Business Development Email : [email protected] I Phone : 9884704111 Hyderabad Kaliprasad Ponnuru - Manager, Business Development Email : [email protected] I Phone : 9642004668