Embed Size (px)
Citation preview

Glasgow City Council
Land Services
KINGSTON BRIDGE
APPROACH VIADUCTS
ASSESSMENT AND INSPECTION
EXECUTIVE INTRODUCTION
DOCUMENT A
Revision 2
February 2007
Client Prepared by

KINGSTON BRIDGE APPROACH VIADUCTS
ASSESSMENT AND INSPECTION
EXECUTIVE INTRODUCTION
DOCUMENT A
Revision 2
February 2007
Signed Date
Author
Checked
Approved

Kingston Bridge Approach Viaducts Assessment and Inspection Executive Introduction Document A
S100489 / 92AJG / 92CJG February 2007 Page 1
CONTENTS
1. INTRODUCTION 4
1.1 General 4
1.2 Form of Reporting 4
1.3 Report Relationships and Structure 5
1.4 Articulation, Global Loading, Half Joint and Substructure Assessment 8
1.4.1 Original Assessment (1992 to 2001) 8
1.4.1.1 As-Built Assessment 10
1.4.1.2 As-Designed Assessment 10
1.4.1.3 As-Proposed Assessment 10
1.4.1.4 Report N1: Volume 6. Abnormal Displacements at the Stobcross Street On Ramp
Continuous Structure. 11
1.4.2 Post Works Re-Assessment (2004 to 2006) 11
1.5 Report N2: Selected Half Joint Condition Survey and Structural Assessment 12
1.6 Reports N3, N6 and S2: Principal Inspections and Inspection for Assessment 13
1.7 Reports N4 and S3: Structural Assessment 16
1.8 Report N5: Stobcross Street On Ramp Repair/Replacement/ Strengthening Options -
Feasibility Study 17
1.9 Report N6: Inspection for Assessment and Structural Condition 17
1.10 Report N7: Articulation Re-design - Feasibility Study 18
1.11 Documents B and C: Executive Summaries for the North and South Approaches 18
1.12 Database 18
1.13 Summing Up 19
2. ASSESSMENT CRITERIA AND LIMIT STATES 20
2.1 Limit States 20
2.2 Assessment Criteria and Prestressed Member Classification 20
2.2.1 Serviceability Limit State 20
2.2.2 Prestressed Members Classification - Stress Limits 21
2.2.3 Ultimate Limit State 22
2.3 Material Strengths 22
2.4 Condition Factor Fc 23
3. ASSESSMENT LOADING 24
3.1 General Discussion 24
3.2 Specific Application of Assessment Loading 24
4. INTERPRETATION OF ASSESSMENT RESULTS - METHOD 26
4.1 General 26
4.2 Element Group A: Cantilever and Continuous Spans 28
4.2.1 Steps 1 and 2: ULS and SLS Longitudinal Compressive Stress 28
4.2.2 Step 3: SLS Longitudinal Tension 28
4.2.3 Steps 4 and 5: SLS Transverse Stress and Cracking 29
4.2.4 Step 6: General Condition 29
4.2.5 Step 7: Condition of Prestress System 30
4.2.6 Derivation of Assessment Code and Assessment Value Total 31
4.3 Element Group B: Suspended Spans 32
4.3.1 Step 1: ULS Generally 32
4.3.2 Step 2: Moment of Resistance on Webs Iyy 32
4.3.3 Steps 3 and 4: SLS Stress and Cracking 33

Kingston Bridge Approach Viaducts Assessment and Inspection Executive Introduction Document A
S100489 / 92AJG / 92CJG February 2007 Page 2
4.3.4 Step 5: General Condition 33
4.3.5 Derivation of Assessment Code and Assessment Value Total 34
4.4 Element Group C: Half Joints 35
4.4.1 Step 1a: ULS Vertical Capacity 35
4.4.2 Step 1b: ULS Horizontal Capacity (Hinge Dowel Bars) 35
4.4.3 Steps 2 and 3: SLS Stress and Cracking 36
4.4.4 Step 4: General Condition 36
4.4.5 Step 5: Condition of the Prestress System 37
4.4.6 Derivation of Assessment Code and Assessment Value Total 37
4.5 Element Group D: Columns 38
4.5.1 Step 1a: ULS 38
4.5.2 Step 1b: Temperature Assessment (Articulation Effects) 38
4.5.3 Steps 2 and 3: SLS Stress and Cracking 39
4.5.4 Step 4: Column General Condition 39
4.5.5 Derivation of Assessment Code and Assessment Value Total for Columns 40
4.6 Element Group E: Pile Caps 41
4.6.1 Step 1a: ULS 41
4.6.2 Step 1b: ULS Assessment Temperature 41
4.6.3 Steps 2 and 3: SLS Stress and Cracking 42
4.6.4 Derivation of Assessment Code and Assessment Value Total for Pile Caps 42
4.7 Element Group F: Piles 43
4.7.1 Step 1a: Working Loads 43
4.7.2 Step 1b: Working Load Temperature Assessment 43
4.7.3 Derivation of Assessment Code and Assessment Value Total for Piles 44
5. TECHNICAL MEMORANDA 45
5.1 Technical Memoranda Included in the Original Brief 45
6. TESTING HOUSES 46
6.1 Testing Houses Employed in the Assessment and Inspection 46
7. INSPECTION AND ASSESSMENT CHRONOLOGY 47
List of Figures
Figure 1.1: Plan of Kingston Bridge and North and South Approaches 6
Figure 1.2: Report Interrelationships 7
List of Tables
Table 1.1: Report N1 structure 8
Table 1.2: Report S1 structure 9
Table 1.3: Report N2 structure 12
Table 1.4: Report N3 structure 13
Table 1.5: Report N6 structure 13
Table 1.6: Report S2 structure 14
Table 1.7: Report N4 structure 16
Table 1.8: Report S3 structure 16
Table 1.9: Equivalence between SORD and DMRB Technical Memoranda 16
Table 1.10: Report N5 structure 17
Table 1.11: Report N7 structure 18
Table 4.1: Structural element groups and assessment criteria 27

Kingston Bridge Approach Viaducts Assessment and Inspection Executive Introduction Document A
S100489 / 92AJG / 92CJG February 2007 Page 3
Table 4.2: Assessment capacity codes and values for ULS and SLS (compression) 28
Table 4.3: Assessed capacity codes and values for prestress SLS (tension - cracking) 28
Table 4.4: Assessment capacity codes and values for SLS transverse stress and cracking 29
Table 4.5: Assessment codes and values for general condition 30
Table 4.6: Assessment codes and values for the prestressing system 30
Table 4.7: Example: derivation of capacity code and total assessment value for a typical Cantilever Span
CSx 31
Table 4.8: Assessment capacity codes and values for ULS 32
Table 4.9: Assessment capacity codes and values for ULS Iyy moments 32
Table 4.10: Assessment capacity codes and values for SLS stress and cracking 33
Table 4.11: Assessment codes and values for general condition 33
Table 4.12: Example: derivation of capacity code and total assessment value for a typical Suspended Span
SSx 34
Table 4.13: Assessment capacity codes and values for ULS vertical capacity 35
Table 4.14: ULS horizontal capacity (vertical hinge dowels) 35
Table 4.15: Assessment capacity codes and values for SLS stress and cracking 36
Table 4.16: Assessment codes and values for general half joint condition 36
Table 4.17: Assessment codes and values for the prestressing system at half joints 37
Table 4.18: Example: derivation of capacity code and total assessment value for a typical half joint N(A to
H)x 37
Table 4.19: Assessment capacity codes and values for ULS 38
Table 4.20: Column temperature assessment codes and values 38
Table 4.21: Assessment capacity codes and values for SLS stress and cracking 39
Table 4.22: Assessment codes and values for column general condition 39
Table 4.23: Example: derivation of capacity code and total assessment value for a typical column N(A to
H)x 40
Table 4.24: Assessment capacity codes and values for ULS 41
Table 4.25: Pile cap assessment temperatures 41
Table 4.26: Assessment capacity codes and values for SLS stress and cracking 42
Table 4.27: Example: derivation of capacity code and total assessment value for typical pile cap
N(A to H)x 42
Table 4.28: Assessment capacity codes and values for working loads 43
Table 4.29: Working load temperature assessment codes for piles 43
Table 4.30: Example: derivation of capacity code and total assessment value for typical piles N(A to H)x 44
Table 6.1: Summary and location of testing house reports 46
Appendix A1
References
Index

Kingston Bridge Approach Viaducts Assessment and Inspection Executive Introduction Document A
S100489 / 92AJG / 92CJG February 2007 Page 4
1. INTRODUCTION
1.1 GENERAL
Scott Wilson (SW) was commissioned by Strathclyde Regional Council (SRC) in January 1992, to carry out a
Principal Inspection and Structural Assessment of the system of viaducts forming the North Approaches to the
Kingston Bridge in Glasgow. With local government reorganisation in April 1996, responsibility for the Kingston
Bridge Complex transferred to the Secretary of State for Scotland when the M8 through Glasgow was trunked. The
Scottish Office National Roads Directorate appointed the new unitary Glasgow City Council to act as Agent for the
maintenance of the bridge and its approaches.
A transcript of the letter from SRC, dated 20 February 1992, setting out the original Brief is given in Appendix A1.
The commission was later extended in October 1992, to include the viaducts of the South Approaches.
Since these original assessments, a variety of repair, reconstructive and remedial works have been carried out to
both the Bridge and the Approaches. In particular, the following major items of work were carried out which were
likely to have significant effects on the articulation and assessment status of the Approaches:
• Strengthening of the Bridge, including installation of additional external prestressing
• Replacement of Bridge pier elements and bearings, and a permanent shift south (PSS) of the Bridge
• Replacement of the North and South Comb Joints with new elastomeric expansion joints
• Partial demolition and reconstruction of both the Stobcross Street Off and On Ramps on the North Approaches
(column lines E and F respectively).
Advances in analytical techniques and the available computing power since the original assessments also presented
an opportunity to review the assessed capacity of the half-joints. As a result, in November 2004, SW was
commissioned by GCC to undertake a further assessment of the following elements of the Approaches:
• Concrete half joints (using non-linear analysis techniques)
• Articulation system
• Columns
The layout of the entire bridge and viaduct complex is shown in Figure 1.1.
1.2 FORM OF REPORTING
The reporting on the assessment and inspection of the North and South Approach viaducts is set out in a number of
documents. A particular terminology has been adopted:
“Reports”: These contain the main factual information relating to the assessments. The original assessments
(1992 to 2001) are contained in Reports prefixed “N” for north or “S” for south as appropriate.
The recent reassessment (2004 to 2006) is contained in two reports1,2
.
“Documents”: Documents differ from Reports in that they contain either summaries for the North and South
Approaches extracted from the Reports or general discussion involving the project in its entirety.
Documents are lettered rather than numbered and are not prefixed to denote north or south. The
Reports are introduced by this Document, “A”, and summarised in Document B for the North
Approaches. No document summarising the South Approaches assessment has been prepared
1 Scott Wilson – “Kingston Bridge Approaches Re-assessment of Half Joints Using Non-Linear Analysis”
(February 2006).
2 Scott Wilson – “Kingston Bridge Approaches Articulation Review and Column Assessment” (February 2006),
with associated Addendum No. 1 including Executive Summary (November 2006).
Kingston Bridge Approach Viaducts Assessment and Inspection Executive Introduction Document A
S100489 / 92AJG / 92CJG February 2007 Page 5
(previously it was intended to produce Document C for this purpose), as it was agreed with GCC
that it was no longer necessary in view of the relatively satisfactory assessment of the South
Approaches. Cost estimates for various options for strengthening and repair were set out in
Document E, which has now been superseded by the recent review of Target Standards3.
The North Approach viaducts inspection and assessment formed, in part, the basis of legal action against the original
designer. Document D set out the then estimated costs of strengthening, repair or replacement due to faults in the
North Approaches attributable to the subjects of legal action. This Document D is now superseded by time and is
therefore only of historical interest at this time.
The cost estimates in Document D were set out in two parts:-
(a) Costs attributable to faults in the North Approaches consequent upon the articulation failure of the main
Kingston Bridge.
(b) Costs attributable to other faults, the causes of which are not related to the Kingston Bridge.
In 2006, updated cost estimates were prepared for the remaining outstanding works to achieve specified Target
Standards as discussed in Document B and the August 2006 report3.
After initial discussions between SW and SRC, the objectives of the assessment and inspection were formed. During
the course of the exercise, and as knowledge of the structure has grown, the objectives have been adapted to the
discovered conditions.
1.3 REPORT RELATIONSHIPS AND STRUCTURE
The SW Reports and Documents included in the overall inspection and assessment project are inter-related and are
graphically represented in Figure 1.2 (page 7). The box shading styles in this Figure reflect the current status of
each Report / Document.
Each of the original assessment Reports contains a preface within which a similar graphic is presented with the
Report or Document in hand shown shaded. Two shading styles are used to denote Reports that have been submitted
in draft form prior to the current issue. In such cases, the current issue generally completely supersedes the prior
edition.
The Report and Document naming convention was maintained throughout the original inspection and assessment
period, for example N1, N4, S2 etc. The sequence of production of updated versions for each report or Document
was denoted by Draft, Final Draft and Final Issue although for the last of these “Final Issue” is shown only on the
first page heading. Final Issue was used to indicate the ultimate edition of the Report or Document.
3 Scott Wilson – “Kingston Bridge Approaches Review of Target Standards and Estimated Costs” (Issue No. 2,
August 2006).

Kingston Bridge Approach Viaducts Assessment and Inspection Executive Introduction Document A
S100489 / 92AJG / 92CJG February 2007 Page 6
Figure 1.1: Plan of Kingston Bridge and North and South Approaches
River Clyde
South Approaches
Kingston Bridge
North Approaches

Kingston Bridge Approach Viaducts Assessment and Inspection Executive Introduction Document A
S100489 / 92AJG / 92CJG February 2007 Page 7
SUMMARISING / CONCLUDING REPORTS:
INTRODUCTION / BASIS OF WORK:
INSPECTION AND ASSESSMENT REPORTS:
DOCUMENT A
Kingston Bridge Approach Viaducts
Assessment and Inspection Executive Introduction
REPORT N1
Articulation, Global Loading,
Half Joint and Substructure
Assessment
REPORT S1
Articulation, Global Loading,
Half Joint and Substructure
Assessment
KB APPROACHES
ARTICULATION REVIEW &
COLUMN ASSESSMENT
(Feb 2006)
KB APPROACHES
REASSESSMENT OF HALF-
JOINTS USING NON-LINEAR
ANALYSIS (Feb 2006)
REPORT N2
Selected Half Joint
Condition Survey and
Structural Assessment
REPORT N3
Principal Inspection and
Inspection for Assessment
REPORT N4
Structural Assessment
(superstructure)
REPORT N5
Stobcross St On Ramp
Strengthening / Repair /
Replacement Feasibility Study
REPORT N6
Inspection for
Assessment and
Structural Condition
REPORT N7
KB Approach Viaducts
Re-articulation Feasibility
Study (ARTIC-RE)
DOCUMENT D
Legal Interface
DOCUMENT B
Executive Summary
Conclusions and
Recommendations
DOCUMENT C
(NOT REQUIRED)
Executive Summary,
Conclusions and
Recommendations
DOCUMENT E
Defect Summary and
Estimated Costs
DOCUMENT F
Report Outlines and
General Index
REPORT S2
Principal Inspection and
Inspection for Assessment
REPORT S3
Structural Assessment
(superstructure)
NORTH APPROACHES SOUTH APPROACHESNORTH & SOUTH APPROACHES
CURRENT
RECORD
SUPERSEDED
Documents with information relevant to current status of structures. Some are partially
superseded.
Documents which are of historical interest only or not relevant to current status of structures.
No outstanding actions to be implemented.
Documents which are wholly superseded by subsequent events and/or documents.
KEY TO DIAGRAM:
NOT REQUIRED Documents included in the original assessment reporting plan, but which are no longer considered
necessary.
Figure 1.2: Report Interrelationships

Kingston Bridge Approach Viaducts Assessment and Inspection Executive Introduction Document A
S100489 / 92AJG / 92CJG February 2007 Page 8
1.4 ARTICULATION, GLOBAL LOADING, HALF JOINT AND SUBSTRUCTURE ASSESSMENT
Four reports are relevant to this aspect of the assessment:
• Original Assessment – Reports N1 and S1
• Kingston Bridge Approaches Re-assessment of Half Joints Using Non-Linear Analysis (February 2006).
• Kingston Bridge Approaches Articulation Review and Column Assessment (February 2006), with associated
Addendum No. 1 including Executive Summary (November 2006).
These are described in more detail below.
1.4.1 Original Assessment (1992 to 2001)
Report N1 in 7 Volumes comprises the following:
Volume 1: Articulation Modelling (partially superseded – see Note 1)
Volume 2: Model Force Calibration and Design Input for Bridge Strengthening
Addendum 1: P-force update for 1997
Volume 3: Articulation Assessment (superseded – see Note 1)
Half Joint Assessment (partially superseded – see Note 1)
Volume 4: Column Assessment (superseded – see Note 1)
Volume 5: Foundation Assessment
Volume 6:
Introduction to the Articulation Faults on the Stobcross Street On-Ramp Continuous
Structure (superseded – see Note 2)
Volume 7: Summary, Conclusions and Recommendations for Report N1 (partially superseded – see
Note 1)
Addendum 1: Stobcross Street Off Ramp – Specimen Design assessment
Table 1.1: Report N1 structure
Notes:
1. As indicated in the table, some of the parts and conclusions of Report N1 are superseded (or partially
superseded) by the findings of the re-assessment reports published in 2006 and discussed in Section
1.4.2 below.
2. Volume 6 of Report N1 is now of historical interest only, since the Stobcross Street On Ramp has been
subject to extensive reconstruction and remedial works to address the defects and deficiencies
identified in the Inspection and original Assessment.

Kingston Bridge Approach Viaducts Assessment and Inspection Executive Introduction Document A
S100489 / 92AJG / 92CJG February 2007 Page 9
Report S1 in 4 Volumes comprises:
Volume 1: Articulation Modelling (partially superseded – see Note 1)
Volume 2: Results 1: Articulation Assessment (superseded – see Note 1)
Results 2: Half Joint Assessment (partially superseded – see Note 1)
Volume 3: Results 3: Column Assessment (superseded – see Note 1)
Results 4: Foundation Assessment
Volume 4: Conclusions and Recommendations for Report S1 (partially superseded – see Note 1)
Table 1.2: Report S1 structure
Notes:
1. As indicated in the table, some of the parts and conclusions of Report S1 are superseded (or partially
superseded) by the findings of the re-assessment reports published in 2006 and discussed in Section
1.4.2 below.
The original Brief required that:-
(a) The articulation mode of the approach viaducts is established. Within this heading, two features of the
articulation behaviour were studied:-
1. identification of null points (elastic centres)
2. determination of displacement rates with respect to temperature (mm/°C)
(b) The load effects were determined for the structural elements. The approach adopted in Reports N1 and S1
was to construct three dimensional computer simulation models of the viaducts including the supporting
elements and foundations.
The validity of the North Approach model was then tested by comparing predicted behaviour with that observed on
site. Originally, the basis for this comparison was a survey of column verticality that was carried out in summer
1992. For reasons discussed in Report S1, the calibration method adopted for the North Approaches was not suited
to the south.
In 1995, a system of jacks was installed at the North Comb Joint (at Line 0). Load transmission between the Bridge
and Approaches was diverted through these jacks by inflating the jacks. A second “calibration” was then made
possible using the results from this exercise. This exercise derived the so-called P-force, the interaction force
between Bridge and viaducts and forms the subject of Report N1 Volume 2.
In order to complete the simulation, it was necessary to re-create the construction sequence of the viaducts and this
was done almost entirely based on progress photographs, taken during construction, and supplied by SRC.
Load effects were calculated for BD37/884, Load Combinations 1, 3 and 4, to include for the effects of temperature
range, braking and traction. Additional load effects were derived from the analysis of the Kingston Bridge
Assessment5.
The elements directly affected by articulation load effects are the half joints, the columns and the foundations.
Because of this, the results for the assessment of these elements are contained in Reports N1 and S1.
4 Department of Transport Technical Memorandum BD37/88 (DMRB 1.3) “Loads for Highway Bridges”. Since
updated to BD 37/01.
5 Scott Wilson Kirkpatrick & Company (Scotland) Limited “Kingston Bridge 1990’s Assessment”
Kingston Bridge Approach Viaducts Assessment and Inspection Executive Introduction Document A
S100489 / 92AJG / 92CJG February 2007 Page 10
1.4.1.1 As-Built Assessment
Originally, the object was to assess the articulation behaviour of the structures as they existed prior to any
strengthening work having been carried out to the Kingston Bridge. This was designated the “As-Built” condition in
previous reports. This allowed for the malfunction of the Kingston Bridge and its effect on the North Approaches.
This malfunction manifested itself in a northward displacement of the columns on the North Approaches by a
combination of the sway movement of the Bridge, temperature displacements and to a variable extent, the live
loading on the central span of Kingston Bridge.
1.4.1.2 As-Designed Assessment
As the original design of the North Approaches did not intend that they should interact with the Kingston Bridge,
another analysis was carried out to assess the adequacy of the viaducts’ articulation if the influence of the bridge had
never occurred. This “As-Designed” analysis did however demonstrate the general adequacy of the viaducts’
original articulation design for temperature range and longitudinal traffic loadings as implemented at the time of the
design.
However, it was found that the action of the Bridge in the current As-Built state, had resulted in overloading of
vertical dowels in hinged half joints on the North Approaches. Therefore, the removal of the forces by re-
articulating the Bridge and thus removing the excessive forces in the dowels, would not necessarily have returned
the viaducts to their originally intended As-Designed condition as the dowels may already have been damaged.
Therefore prior to the permanent shift south (PSS) of the Bridge, external steelwork bracing was fixed to the web
elevations across the half joints on Lines 1 to 4 (inclusive), to prevent longitudinal movements of these hinge joints
whilst still allowing rotation.
The global analysis of the South Approach viaducts was more straightforward. These viaducts remain unaffected by
the articulation effect of the Bridge. The analysis did not distinguish between “As-Built” and “As-Designed”. As in
the North Approach viaducts, the assessment of the South viaducts included analyses in Combinations 1, 3 and 4.
1.4.1.3 As-Proposed Assessment
The As-Built assessment, that is prior to any remedial measures on the Bridge or Approaches, forms the basis of
Report N1, dated July 1998. However, as the primary cause of many of the problems on the North Approaches
derives from the interaction with the Kingston Bridge, the scope of the assessment was extended to assess the “As-
Proposed” state. This was the anticipated condition of the Approaches after the Stage 1 strengthening works took
place on the Bridge.
A crucial part of the design of the strengthening measures on the Bridge was the accurate determination and
understanding of the force transmitted between the North Approaches and the Kingston Bridge. This force had been
estimated in the original Draft of Report N1, of February 1993, and in the subsequent Addendum and updates
culminating in the Final Issue of Report N1 in July 1998.
Following the installation of the jack system at the North Comb Joint, an extensive study was made into the
magnitude, nature and cause of the force operating through the joint. This force, previously referred to as “the net
compressive force” in the earlier N1 reports later became known as “the P-force”.
The P-force was fundamental to the design of the systems of jacks employed throughout the re-articulation operation
carried out as Stage 1 strengthening and to the design of the Bridge’s south substructure.
Following the analysis of the measured P-force, the articulation models were updated and on the basis of these, the
As-Built and As-Proposed assessments were revised. Consequently, Report N1 contains all of the updated
information found during the analysis of the P-force and the As-Proposed assessment.
In summary, three scenarios were investigated during the assessment:
(a) The As-Built case: as existed prior to strengthening
(b) The As-Designed case: as originally intended
(c) The As-Proposed case: the predicted situation after strengthening

Kingston Bridge Approach Viaducts Assessment and Inspection Executive Introduction Document A
S100489 / 92AJG / 92CJG February 2007 Page 11
1.4.1.4 Report N1: Volume 6. Abnormal Displacements at the Stobcross Street On Ramp Continuous Structure.
During the Principal Inspection carried out in 1992, it was observed that five columns, NF10 to NF14, were
deflected in a direction and magnitude not expected from articulation effects alone. These columns support the
superstructure of the Stobcross Street On Ramp continuous structure. Volume 6 of Report N1 described the cause of
the deflections and discussed the effect of these on the structure’s assessed capacity. It also suggested options for
remedial action.
The discussion in Report N1, Volume 6, was limited to the cause of the deflections and was supported by a
reasonably rigorous but approximate analysis. However, as work progressed, a feasibility study of the options for
strengthening the Stobcross Street On Ramp was carried out. Additionally, an inspection for assessment was carried
out in 1994. A primary objective of the inspection was to determine the stress regime in the two curved structures;
the Stobcross Street On Ramp and the Bothwell Street Off Ramp.
The considerations contained under these headings are fairly extensive and are discussed in the separate Reports,
N4, N5 and N6.
Subsequent to preparation of Reports N1, N4, N5 and N6, the Stobcross Street On Ramp was subject to extensive
reconstruction and additional prestressing works carried out during 2005 and 2006. These works were designed to
achieve modern standards for traffic loading, and to restore an acceptable articulation behaviour, and therefore the
assessment discussed above is now of historical interest only.
1.4.2 Post Works Re-Assessment (2004 to 2006)
Following completion of the Bridge Strengthening works, and with the reconstruction of the Stobcross Street Off
and On Ramps on the North Approaches, a re-assessment of the Approaches’ articulation, columns and half joints
was carried out.
1.4.2.1 Re-Assessment of Half Joints using Non-Linear Analysis
In Report N1, a number of half joints on the Approaches were assessed as sub-standard at the Ultimate Limit State
(ULS). However the assessment calculations were necessarily based on certain assumptions which were expected to
be conservative, and it was anticipated that some reserve of strength beyond the assessed capacities would exist.
To estimate the likely reserves of strength in the half joints, further data and more sophisticated analytical
techniques were required. To provide physical evidence and data to support the conjecture that additional reserves
of strength existed, a physical load test6 was carried out on half joint NE12 on the Stobcross Street Off Ramp, prior
to its demolition.
The data obtained in the course of this load test was used to develop non-linear computer models, which in turn
allowed a re-assessment of the capacities of the sub-standard half joints. Details of the development of the models
and findings of the re-assessment are contained in the February 2006 Non-Linear analysis report1. The findings of
this Report partially supersede those contained in Volume 3 of Report N1, and Volume 2 of Report S1.
1.4.2.2 Articulation Review and Column Assessment
As the Bridge Strengthening works also included a permanent shift south (PSS), with the aim of restoring an
expansion gap between the Bridge and North Approaches, a review of the articulation behaviour was also
undertaken, together with a re-assessment of the columns on the Approach viaducts both north and south of the
river.
This drew on monitoring data from the Approach viaducts, and the articulation models utilised in Reports N1 and S1
were modified and calibrated to match the observed behaviour. The load effects over the design temperature range
were estimated using the calibrated models and the columns re-assessed for these effects at ULS. A small number
of columns were found to be theoretically non-compliant with the standards at high and/or low effective
temperatures.
6 Morgan Est Civil Engineering Division – “Kingston Bridge Complex Stobcross Off Ramp Half Joint Load Test
Final Report”, Document No. 7156/LT/001 rev A (October 2003).

Kingston Bridge Approach Viaducts Assessment and Inspection Executive Introduction Document A
S100489 / 92AJG / 92CJG February 2007 Page 12
The methodology of the review and assessment, and the findings thereof, are discussed in the February 2006
Articulation Review and Column Assessment report2, and Addendum No. 1 to that report (November 2006). These
findings supersede those in Volumes 3 and 4 or Report N1, and Volumes 2 and 3 of Report S1.
1.5 REPORT N2: SELECTED HALF JOINT CONDITION SURVEY AND STRUCTURAL ASSESSMENT
As part of the overall inspection of half joints, a sample were selected for special intensive examination. Initially six
were selected, with a further two added later.
Report N2 is set out as follows:
Volume 1: Selected Half Joint Condition Survey and Structural Assessment
Volume 1:
Appendix 1
Selected Half Joint Condition Survey and Structural Assessment - Contractors Report -
CAPCIS
Volume 2: Special Inspection - Joint NC16
Volume 3: Special Inspection - Joint ND8
Volume 4: Special Inspection - Joint ND7
Volume 5: Special Inspection - Joint NE7
Volume 6: Special Inspection - Joint NE12
Volume 7: Special Inspection - Joint SA21
Volume 8 Special Inspection - Joint NF10
Volume 9: Special Inspection - Joint NF14
Table 1.3: Report N2 structure
The joints were:-
(a) Hinge joints: ND8, NE7, NE12, ND7, NC16, SA21
(b) Expansion joints: NF10, NF14. SRC requested the following aspects to be of particular interest in the
inspection:-
(i) Magnitude and extent of cracking in the concrete
(ii) Position of reinforcement
(iii) Condition of reinforcement
(iv) Magnitude and extent of chloride penetration into the concrete
(v) Condition of bearings
(vi) The strength of concrete.
Report N2 includes the results of all site tests and measurements performed on the half joints. The causes and effects
of all observed defects are discussed and conclusions are drawn.
Report N2 is closely related to N1 in that data from the articulation modelling was used to assess the joints dealt
with in Report N2.
Kingston Bridge Approach Viaducts Assessment and Inspection Executive Introduction Document A
S100489 / 92AJG / 92CJG February 2007 Page 13
The report discusses the poor quality of half joint construction, the leakage at expansion joints and the general
chloride contamination. Electrochemical testing within concrete cores was carried out in addition to more
conventional surface testing.
Close inspection revealed that some hinge joints have displaced longitudinally and this observation supported the
articulation model which had predicted an overloading in the affected joints.
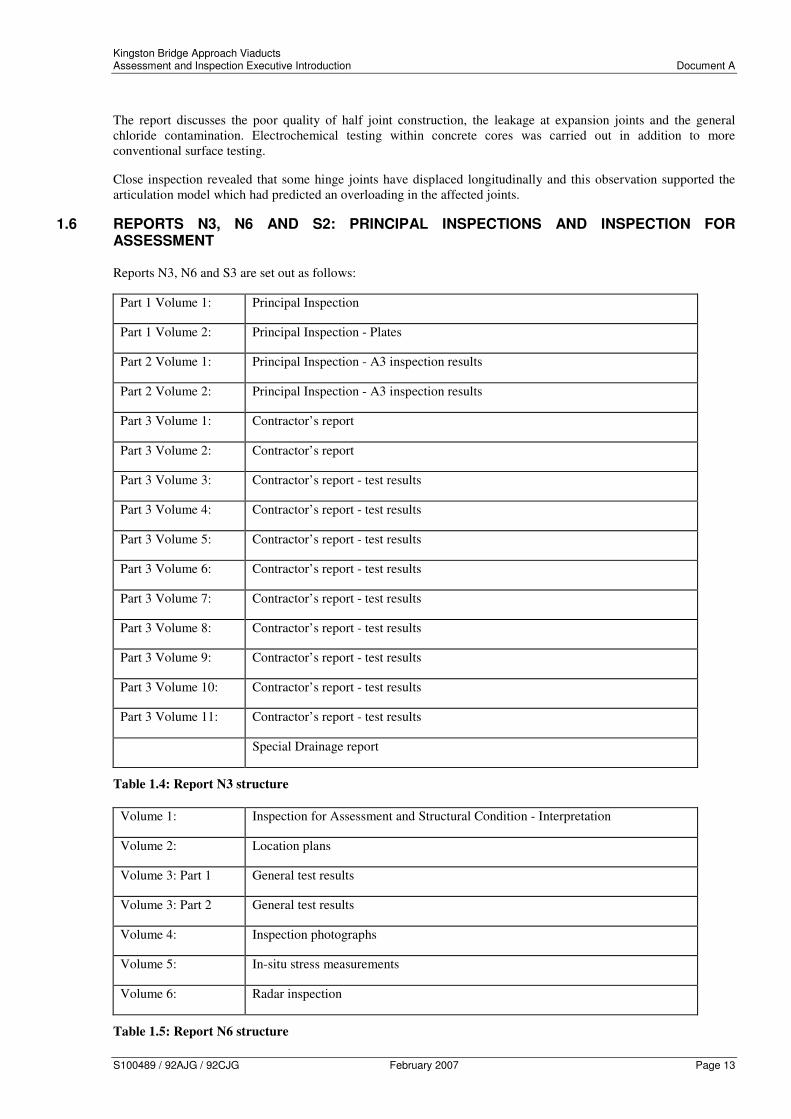
1.6 REPORTS N3, N6 AND S2: PRINCIPAL INSPECTIONS AND INSPECTION FOR ASSESSMENT
Reports N3, N6 and S3 are set out as follows:
Part 1 Volume 1: Principal Inspection
Part 1 Volume 2: Principal Inspection - Plates
Part 2 Volume 1: Principal Inspection - A3 inspection results
Part 2 Volume 2: Principal Inspection - A3 inspection results
Part 3 Volume 1: Contractor’s report
Part 3 Volume 2: Contractor’s report
Part 3 Volume 3: Contractor’s report - test results
Part 3 Volume 4: Contractor’s report - test results
Part 3 Volume 5: Contractor’s report - test results
Part 3 Volume 6: Contractor’s report - test results
Part 3 Volume 7: Contractor’s report - test results
Part 3 Volume 8: Contractor’s report - test results
Part 3 Volume 9: Contractor’s report - test results
Part 3 Volume 10: Contractor’s report - test results
Part 3 Volume 11: Contractor’s report - test results
Special Drainage report
Table 1.4: Report N3 structure
Volume 1: Inspection for Assessment and Structural Condition - Interpretation
Volume 2: Location plans
Volume 3: Part 1 General test results
Volume 3: Part 2 General test results
Volume 4: Inspection photographs
Volume 5: In-situ stress measurements
Volume 6: Radar inspection
Table 1.5: Report N6 structure

Kingston Bridge Approach Viaducts Assessment and Inspection Executive Introduction Document A
S100489 / 92AJG / 92CJG February 2007 Page 14
Part 1 Volume 1: Principal Inspection - text
Part 1 Volume 2: Plates
Part 2 Volume 1: Superstructure examination records
Part 2 Volume 2: Superstructure examination records
Part 3 Volume 1: Test results
Part 3 Volume 2: Test results
Part 3 Volume 3: Test results
Part 3 Volume 4: Test results
Part 3 Volume 5: Test results
Part 3 Volume 6: Test results
Part 3 Volume 7: Test results
Part 3 Volume 8: Test results
Part 3 Volume 9: Test results
Table 1.6: Report S2 structure
The Brief required Principal Inspections be carried out in accordance with Technical Memorandum SB1/787 in
addition to advice given in the Bridge Inspection Guide8.
Also required, was an extension of the testing to supply data necessary for the execution of structural assessments.
The formats of Reports N3 and S2, resemble those of the previously submitted Kingston Bridge report9. The special
inspection of the eight selected half joints fell within the scope of the Principal Inspection but was reported on
separately in Report N2.
At an early stage on the North Approaches, it was decided that the inspection works would be approached in two
ways. A Principal Inspection as such does not involve the intrusive testing required by an Inspection for
Assessment. The very large volume of concrete in the approaches, together with the difficult access to most of the
superstructure elements, suggested that widespread blanket inspections for assessment would be efficient neither in
cost nor in their ability to record representative results. As the majority of the superstructure consists of grouted duct
post-tensioned box beams, direct access to the pre-stressing system is difficult. The two approaches adopted were
therefore as follows:-
(a) Principal Inspections, Reports N3 and S2: To carry out Principal Inspections covering all concrete areas
that could be accessed by reasonably non-destructive methods. This includes the great majority of the
superstructure area on the lower surface of the decks. One notable exception is the Stobcross Street On
Ramp continuous structure between columns NF12 and NF14. This structure spans the main carriageway of
the M8 north approaches and could not be accessed from above (by under-spanning mobile platform) or
from below, without significant disruption to the motorway traffic. This section is therefore dealt with in
(b) below.
7 Scottish Office Roads Directorate Technical Memorandum SB1/78 “The Inspection of Highway Structures”:
July 1978 Amendment No.1 1990
8 Department of Transport “Bridge Inspection Guide” HMSO 1983
9 Scott Wilson Kirkpatrick & Company (Scotland) Limited “Kingston Bridge Principal Inspection Report” Apr.
1991

Kingston Bridge Approach Viaducts Assessment and Inspection Executive Introduction Document A
S100489 / 92AJG / 92CJG February 2007 Page 15
The Principal Inspections included complete visual records of the underside of the superstructure and
columns (with the exception noted previously). This is presented in a series of plans in Report N3.
Additionally, the structure was extensively photographed.
The visual examination included fingertip recording of crack length and width, surface staining and
blemishing and corrosion induced concrete disruption.
Bearings were inspected at a limited number of locations. In order to inspect hinge and single point plate
bearings, it was necessary to break out concrete and inspect remotely using a borescope. This was carried
out at a small sample of locations.
To allow the calibration of the north articulation model, approximately 75% of the total number of columns
on the North Approaches were surveyed for verticality. A similar proportion of the South Approach viaduct
columns was also surveyed. However, calibration using the column verticality has now been superseded by
a more reliable calibration employing the P-force measurement at the North Comb Joint.
Deck drainage was surveyed using direct visual methods and CCTV and this is discussed in a Special
Drainage Report10
.
Concrete condition was tested at representative panels of 2 metres × 1 metre. At each panel, testing was
carried out for chloride content, half cell potential, reinforcement depth, carbonation and to a limited extent,
concrete strength. The results were recorded to allow comparisons to be made with testing already carried
out in recent years and for future monitoring.
(b) Inspection for Assessment, Report N6: The second approach adopted included the work associated with an
Inspection for Assessment where in obtaining representative results, considerable disruption and cost may
have to be tolerated. The structural assessment of the superstructures ran concurrently with the Principal
Inspection under (a).
It was intended that vulnerable areas would be identified by studying the results of the assessment and
comparing the low capacity areas with areas exhibiting any significant deterioration, including the risk of
corrosion determined from half cell testing. Intrusive testing, including direct visual inspection and stress
measurement of tendons, would then be targeted more efficiently.
This dual approach lead to the assessment project being termed Phase I and Phase II. Phase I included all
work connected with a “first pass” assessment and Principal Inspection. Phase II included the Inspection for
Assessment along with re-analysis (assessment) as required. The requirement for a special inspection of the
prestressing system is set out in BD54/9311
. The methods and procedures required for such an inspection
are laid out in BD50/9312
Document B describes the results of the overall assessment project for the North Approach viaducts. The
equivalent for the South Approaches (Document C) has not been prepared, by agreement with GCC, as
there is little value in this at the current time.
10 Scott Wilson Kirkpatrick & Company (Scotland) Limited “Kingston Bridge North Approaches - Special
Drainage Report” Jun. 1993
11 Department of Transport Technical Memorandum BD54/93 (DMRB 3.1) “Post Tensioned Concrete Bridges:
Prioritisation of Special Inspections”
12 Department of Transport Technical Memorandum BA50/93 (DMRB 3.1) “Post Tensioned Concrete Bridges.
Planning, Organisation and Methods for Carrying Out Special Inspections”

Kingston Bridge Approach Viaducts Assessment and Inspection Executive Introduction Document A
S100489 / 92AJG / 92CJG February 2007 Page 16
1.7 REPORTS N4 AND S3: STRUCTURAL ASSESSMENT
Reports N4 and S3 are set out as follows:
Volume 1: Structural Assessment
Volume 2: Structural Assessment
Table 1.7: Report N4 structure
Volume 1: Structural Assessment
Volume 2: Structural Assessment
Table 1.8: Report S3 structure
The Brief required a full structural assessment to Technical Memoranda SB3/8413
[BD21/9314
] and SB2/9115
[BD44/9016
] within the technical requirements prescribed by SB1/9117
[BD34/9018
]. Since the start of the project,
the Design Manual for Roads and Bridges (DMRB) has been issued containing technical memoranda implemented
in Scotland. Where technical memoranda formerly issued by the Scottish Office Roads Directorate (SORD) are
superseded by the DMRB, the new technical memorandum numbers are noted throughout Document A in square
brackets along with the DMRB index number. In all other Reports, reference is made only to the DMRB documents.
Reference can also be made to Table 1.9 where memorandum equivalencies are listed.
All SORD Technical Memoranda and British
Standards referred to in the reports
DMRB equivalents
SB1/78
SB3/84 Annex 1
SB1/78
BD21/93 [DMRB 3.4]
SB2/91
SB1/91
BD44/90 [DMRB 3.4]
BD34/90 [DMRB 3.4]
Table 1.9: Equivalence between SORD and DMRB Technical Memoranda
13 Scottish Office Roads Directorate Technical Memorandum SB3/84 “The Assessment of Highway Bridges and
Structures” (Revised Edition incorporating amendment No 1: 1988 and Amendment No.2 1990 together with
Annex 1 Advice Note. 3.2 Recently Published Technical Memoranda.)
14 Department of Transport Technical Memorandum BD21/93 (DMRB 3.4) “The Assessment of Highway Bridges
and Structures” since twice updated to BD21/97 and BD21/01.
15 Scottish Office Roads Directorate Technical Memorandum SB2/91 “The Assessment of Concrete Highway
Bridges and Structures”
16 Department of Transport Technical Memorandum BD44/90 (DMRB 3.4) “The Assessment of Concrete
Highway Bridges and Structures” since updated to BD44/95
17 Scottish Office Roads Directorate Technical Memorandum SB1/91 “Technical Requirements for the Assessment
and Strengthening Programme for Highway Structures. Stage 1 - Older Short Span Bridges and Retaining
Structures”: 1991 and Amendment No 1.
18 Department of Transport Technical Memorandum BD34/90 (DMRB 3.4) “Technical Requirements for the
Assessment and Strengthening Programme for Highway Structures. Stage 1 - Older Short Span Bridges and
Retaining Structures”

Kingston Bridge Approach Viaducts Assessment and Inspection Executive Introduction Document A
S100489 / 92AJG / 92CJG February 2007 Page 17
The magnitude of the viaducts is such that care was required to ensure that the assessment results were presented in
such a way so that the overall impression of inadequacy was neither overstated nor understated. One potential risk of
imprecision exists in the requirements for Serviceability Limit State (SLS) assessment in SB1/91 [BD34/90].
SB1/91 requires that the acceptable prestress classification is Class 1: that is, for no flexural tension to exist within
the section.* This is rarely achieved (if at all) in any of the post-tensioned superstructure components on the
approach viaducts. It was decided that the assessment at SLS should be extended to determine the achieved prestress
classification. Decisions regarding durability and remedial action could then be made for specific locations if
necessary.
An assessment was carried out for Assessment Live Loading (ALL) and for 40 tonne ALL combined with HB
loading.
Report N4 is a result of Phases I and II of the assessment project. Results from Phase I were based on linear elastic
analysis using characteristic material strengths.
Within Report N4, deficiencies in structural strength are discussed individually. In several cases, the assessment
results were modified by the use of data collected from the Phase II Inspection for Assessment and Structural
Condition, Report N6.
1.8 REPORT N5: STOBCROSS STREET ON RAMP REPAIR / REPLACEMENT / STRENGTHENING OPTIONS - FEASIBILITY STUDY
Report N5 is set out as follows:
Volume 1: Stobcross Street On-Ramp Repair/Replacement/Strengthening Options Feasibility Study
Table 1.10: Report N5 structure
Report N5 derives from the articulation assessment in Report N1, the structural assessment in Report N4 and the
Inspection for Assessment in Report N6. To some extent the deliberations concerning the re-articulation of the entire
viaduct system set out in Report N7 also bear on the conclusions in Report N5.
The Stobcross Street On Ramp continuous structure articulated in a manner that could not be accommodated by the
designed geometry. This led to abnormal loading of the substructure elements. Following the Phase I assessment, a
feasibility study was carried out to identify the options available for the repair, strengthening or replacement of the
structure. Originally, the draft version of this report was written with remedial action in 1994 in mind. This report
was later revised so as not to indicate any particular commencement year and to include the most recent results
gained in the Inspection for Assessment.
A significant proportion of the total effort put into the Inspection for Assessment in 1994 was concentrated on the
Stobcross Street On Ramp. In particular, the stress regime was determined by employing in-situ testing in both the
concrete and the prestressing tendons. The result was that of all the components on the approach viaducts, the
assessment of the Stobcross Street On Ramp is likely to be the most accurate.
Subsequent to issue of Report N5, extensive works were carried out to Stobcross Street On Ramp during 2005-06.
These included demolition and reconstruction of the greater part of the superstructure, and external prestressing of
the continuous section between columns NF12 and NF14. Therefore the findings reported in N5 are superseded by
events and are now of historical interest only.
1.9 REPORT N6: INSPECTION FOR ASSESSMENT AND STRUCTURAL CONDITION
The structure of Report N6 is shown in Table 1.5 on page 13.
* Strictly, Class 1 should only be required under load combination 1. The design code allows Class 2 under
combinations 2 to 5 but no mention is made in SB1/91 of prestress classes under combinations other than Class
1.

Kingston Bridge Approach Viaducts Assessment and Inspection Executive Introduction Document A
S100489 / 92AJG / 92CJG February 2007 Page 18
In Summer 1994, an Inspection for Assessment was carried out. Report N6 sets out the results of the inspection.
Also included is a location specific re-assessment of deficient elements identified in the “first pass” assessment,
Phase I. The report contains data on the prestressing system including its condition and the actual level of prestress
force present. Data from Report N6 was used in the preparation of Reports N4 and N5.
1.10 REPORT N7: ARTICULATION RE-DESIGN - FEASIBILITY STUDY
Report N7 is set out as follows:
Volume 1: Kingston Bridge Approach Viaducts - Re-Articulation Feasibility Study
Volume 2: Kingston Bridge Approach Viaducts - Re-Articulation Feasibility Study
Table 1.11: Report N7 structure
Report N7 derives from many aspects of the inspection and assessment but especially from Report N1. As discussed
in Report N1, the articulation failure of the Kingston Bridge has permanently damaged numerous half joints on the
North Approach viaducts. In addition, there is a recommendation (by the Department of Transport) that, where
practically and financially feasible, half joints should be eliminated during any strengthening or refurbishment
works. Report N7 is the result of a feasibility study into alternative articulation arrangements on the north
approaches which, as far as possible, would dispense with half joints. The conclusions of this report “feed back” into
Report N1, where the joint gap at the North Comb Joint is discussed.
During the reconstructions of the Stobcross Street Off and On Ramps, advantage was taken of the opportunity to
dispense with several of the existing half joints. However, at this time there is no proposal to further pursue the
option of rearticulation of the North Approaches. Report N7 is therefore currently considered to be of historical
interest only.
1.11 DOCUMENTS B AND C: EXECUTIVE SUMMARIES FOR THE NORTH AND SOUTH APPROACHES
Document B summarises the main assessment Reports for the North Approaches. It is not intended that it should be
self contained or exhaustive as many of the problems on the North Approach viaducts require a detailed discussion,
which is contained in the main technical reports.
The principal feature of these Documents is the essential summary of results distilled from the technical reports.
Towards this end, a system of attaching gradings and numerical values to each structural element was developed. It
is intended that inspection of the assessment “Codes and Values” for each structural element will indicate the
relative priority of that element as against others of a similar type. This system is set out in Section 4 of this
document. However, it should be noted that the assessment codes and values are intended as guides only. Specific
technical assessments are contained within the technical reports.
The equivalent for the South Approaches (Document C) has not been prepared. It was agreed with GCC that at this
time this document would add little value.
1.12 DATABASE
Document A, Addendum 1 describes the function of a computer database application for the Kingston Bridge
Complex. The document is a descriptive narrative to be read in conjunction with the database application running on
a personal computer.
The prototype described in Appendix A1 is intended to allow appraisal of such a device and to promote further
discussion of the data management of results.
Primarily, its purpose is to illustrate a form of results processing that would enable future testing to be targeted more
efficiently and for results to be compared with previous results over a time period. Being interactive, the database
application aims to allow results to be accessed more easily and for bridge management decisions to be made based
on maximum information.

Kingston Bridge Approach Viaducts Assessment and Inspection Executive Introduction Document A
S100489 / 92AJG / 92CJG February 2007 Page 19
1.13 SUMMING UP
This ends the introduction to the assessment project structure. The following Sections 2 to 7 set out various loading
and assessment criteria, relevant Technical Memoranda, a sub-contractor document index and a project chronology.
However of most importance, Section 4 sets out a form of coding for the assessment of all of the viaduct elements; a
method employed throughout the assessment project.

Kingston Bridge Approach Viaducts Assessment and Inspection Executive Introduction Document A
S100489 / 92AJG / 92CJG February 2007 Page 20
2. ASSESSMENT CRITERIA AND LIMIT STATES
2.1 LIMIT STATES
All structural elements have been assessed for the ultimate limit state (ULS). The need to assess at serviceability
limit state (SLS) was agreed with SRC. Subsequently, all members were subject to assessment at SLS.
The degree to which concern is raised for any given result varies depending on the limit state. Clearly a structural
element that fails to satisfy a cracking criterion at SLS is of less immediate concern that an element whose moment
of resistance, for example, is very deficient at the ULS. The published codes for assessment give no guidance on a
form of weighting, clearly because no set of rules could be formulated that would satisfactorily apply to all bridges.
Therefore, a system of weighting is set out in this report that attempts to quantify the relative significance of the
combined assessment results. This is described in Section 4. It is not proposed that the numerical method developed
is relied upon wholly to plan the future management of the viaducts but rather to distinguish between areas of higher
and lower priority.
The assessed capacities of the viaducts were weighted in relation to the consequences of failure at SLS and ULS
throughout the assessment project. Broadly, SLS deficiencies point to durability and maintenance concerns where
ULS deficiencies are of more immediate concern, or at least suggest the need for strengthening.
2.2 ASSESSMENT CRITERIA AND PRESTRESSED MEMBER CLASSIFICATION
Assessment criteria were set for both serviceability and ultimate limit state. Calculation of structural strength was
carried out in accordance with Technical Memorandum SB2/91 [BD44/90]. Prestress classifications are not referred
to in this code, but are referred to in BS5400: Part 419
, Clauses 4.1.1 and 6.3.2. However, BA44/90 DMRB 3.420
,
Clause 4.1.1, states that it may be possible to relax the serviceability criteria compared with the BS5400 Part 4
values, in association with changes in the future management of the Bridge. Increased frequency of inspection is
cited as an example.
2.2.1 Serviceability Limit State
SB1/91 [BD34/90] Clause 7.2 states that Class 1 should be used for assessment. However, initial calculations
showed that in the majority of viaduct elements, Class 1 could not be achieved for the 40 tonne ALL. In light of the
relaxation suggested in the previous paragraph this requirement appears onerous.
If the Class 1 requirement had been adopted as the sole serviceability criterion, the assessed capacity of each
element would have been far less than 40 tonne ALL. The principal purpose of the assessment exercise is to enable
the structure to be managed correctly, that is, to allow loading and maintenance requirements to be identified. On
such a large structure, comprising numerous separate parts, the adoption of a single assessment criterion would have
resulted in an extensive low capacity at SLS. This would not be of assistance in identifying the most vulnerable parts
of the structure.
It was therefore decided to augment the minimum requirements of the assessment code to assess not only for Class
1, but to assess into which prestress class the structure would fall under 40 tonne ALL. In this manner, it would be
possible to identify areas that were of most concern. This approach also adheres to the bridge management
philosophy suggested by the code.
Particularly in post-tensioned structures, serviceability failures such as excessive crack widths suggest a
vulnerability to chloride ingress to prestress tendons. Clearly, an immediate durability problem may, in time,
jeopardise the ultimate strength of the structure.
In many cases the assessment results indicated that the structure in question could carry
40 tonne ALL only if classified as Class 3 (refer to Report N4). An alternative approach is that at these particular
19 British Standards Institution BS5400: “Steel, Concrete and Composite Bridges, Part 4: Code of Practice for
Design of Concrete Bridges” 1990
20 Department of Transport Advice Note BA44/90 [DMRB 3.4] “The Use of BD44/90 for the Assessment of
Concrete Highway Bridges and Structures”, later updated to BD44/95.
Kingston Bridge Approach Viaducts Assessment and Inspection Executive Introduction Document A
S100489 / 92AJG / 92CJG February 2007 Page 21
locations, 40 tonne ALL could be accommodated provided it is accepted that the stresses exceed the crack width
limits for Class 3.
The significance of the SLS assessment is that durability rather than strength may be the limiting criterion on many
of the post-tensioned elements. The results from SLS cracking assessment weighed heavily on the choice of location
of Phase II, Inspection for Assessment testing (Report N6).
2.2.2 Prestressed Members Classification - Stress Limits
Prestressed members are classified by reference to flexural tensile limitations. The categories are specified in
BS5400: Part 4, Clause 4.1.1.1(b):-
Class 1: no tensile stress permitted
Class 2: tensile stresses permitted, in accordance with Table 24 (of the Code BS5400:
Part 4) but no visible cracking.
That is; tensile stresses are permitted if they are less than the design flexural tensile strength of
concrete.
Class 3: tensile stresses permitted, in accordance with Table 25 (of the Code BS5400:
Part 4) but with design crack widths limited to the values of Table 1 (of the code).
Throughout, a maximum crack width of 0.25 millimetres has been adopted.
The code states that crack widths are theoretical in Table 25. Allowable stresses are modified by the depth of the
section in Table 26 which reduces the allowable tensile stress for sections greater than 400 millimetres in depth.
The code also allows additional reinforcement positioned near to the tensile face to be taken into account in reducing
crack widths. The percentage of this reinforcement area to the area of tensile concrete is used to increase the
allowable Class 3 tensile stress. For design, BS5400: Part 4 Clause 4.2.2 states that prestressed members should be
designed as Class 1 for Load Combination 1 and Class 2 or 3 for Load Combinations 2 to 5. The Technical
Approval Authority normally confirms the choice between Class 2 or 3 in the latter. Normally, Class 2 is chosen to
obviate any actual cracking. This has been adopted as the desirable standard in the assessment for Combinations 3.
The structural element assessment considered loads only in Combination 1 and in Combination 3 except in the
articulation and global loading assessment where Combination 4 was also considered. Impact loading was
considered also for local loading on parapets and columns. Combination 3 includes load effects due to temperature
difference and range and partial safety factors for live loads are changed as appropriate.
For the assessment, the adopted approach was that the required 40 tonne ALL was imposed and the member
classification determined at SLS. Members were reported to have 40 tonne ALL capacity if, either in Combinations
1 or 3, the tensile stresses fell within the allowable limits. If this were not the case, and tensile stresses exceeded
even Class 3 limits, the ALL value was reduced in accordance with Figure 7.3 of Technical Memorandum SB3/84
[BD21/93 Figure 5/2]. Note: subsequent revisions to Report N4 reported that assessment as a result of the altered
ALL standards in BD 21/97.
Compressive stresses are also limited by the code and where these limits govern, assessed loading was reduced.
A classification that is below standard for the design requirements stated in BS5400: Part 4, Clause 4.2.2 indicates
that on-going maintenance and monitoring are required at the deficient sections. In the case of post-tensioning
systems, actual flexural cracking in Class 3 is undesirable, especially if this occurs in hogging moment regions. The
majority of Class 3 assessments occurred in hogging moment regions where cracking potentially provides direct
ingress paths for chlorides on and below road surfacing materials.
The limited approach suggested by the code where Class 1 only would be assessed would have led to low assessed
SLS capacities. If load restrictions were contemplated this would only have the effect of increasing the durability of
the structure from the date of the measures.

Kingston Bridge Approach Viaducts Assessment and Inspection Executive Introduction Document A
S100489 / 92AJG / 92CJG February 2007 Page 22
In some locations, it has been calculated that crack widths will exceed 0.25 mm at less than the 40 tonne ALL and
there is, therefore, a possibility that throughout the structures 35 year history, accelerated chloride ingress has
occurred.
2.2.3 Ultimate Limit State
In addition to SLS assessment, all structural elements were assessed at the ultimate limit state. Deficiencies at this
limit state are of more immediate concern.
In each case, the ULS deficiencies are discussed in Reports N4 and S3. HB loading and 40 tonne ALL with 45 HB
caused some section capacities to be exceeded.
2.3 MATERIAL STRENGTHS
As discussed in Section 1.6(b), Inspection for Assessment, the reports are based mainly upon an initial, though
rigorous, assessment carried out in Phase I. Design of new structures is based on a characteristic strength approach
where 95% of material samples will not deviate from a prescribed tolerance. The design code then gives a material
partial safety factor γmc to be used with this strength.
The assessment code, SB2/91 [BD44/90] has retained the characteristic strength approach and has added an
alternative, available only in assessment, termed the worst credible strength. Because worst credible strength is
based on actual site testing, the degree of increased confidence is reflected in the reduced material partial safety
factor γmc from 1.5 for characteristic strength to 1.2 for the worst credible strength at the ultimate limit state.
The worst credible strength (WCS) is the value of that strength that the engineer, based on his experience and
knowledge of the material, realistically believes could be obtained in the structure or element under consideration.
This value could be greater or less than the characteristic strength but is generally the lower bound of the estimated
cube strengths for the element under consideration.
The approach adopted with regard to WCS’s for the assessment of the Approach viaducts has been as follows:-
SB2/91 Appendix B clause 2.1.3.1(b) (Appendix A of BA44/90 provides a commentary on Appendix A of
BD44/90) suggests that, in order to obtain a single WCS for the whole structure, one core should be taken for every
10 cubic metres of concrete and the WCS taken as the least of the values obtained.
The viaducts were constructed between February 1968 and September 1969, over some 18 months using site
batched concrete. The North Approach viaducts comprise some 22 unique superstructure types excluding the
cellular structures. A similar number of types exist on the South Approaches where, unlike on the North
Approaches, many cantilever spans are skewed at joints. Many of the cantilever and suspended span forms are
employed several times.
There is a high likelihood that somewhere on the structure, a low cube strength would be recorded. This single low
result (or series of low results obtained from a poor volume of concrete) if applied universally through the
assessment, would unnecessarily prejudice the assessed strength of other structures with acceptably high concrete
strength. A low strength was recorded for one of the half joints discussed in Report N2. This core was taken in a
small area wholly unrepresentative of the whole structure but specifically chosen to illustrate the local deterioration
of the concrete. The value of some 29 N/mm2 could not reasonably be applied to the whole assessment. In contrast,
cores exceeding 50 N/mm2
have also been recorded.
Appendix A of BA44/90 gives an alternative. WCS’s can be determined for locations in a structure. A location is
defined as a region which, for practical purposes, is assumed to be of uniform quality. It can be assumed that
uniform quality extends throughout one superstructure stage in the construction sequence (refer to Report N1 Figure
4.1). Thus, the WCS can be properly used as a device to increase the assessed capacity at locations where a global
assessment using characteristic strengths indicates that capacity is low. This is true only if:-
(a) The possible decrease in strength at the location obtained from cores does not counter the benefit of γmc
moving from 1.5 to 1.2.
(b) The material governing section capacity is concrete. Increasing concrete strength has a limited effect in
increasing section capacity where the problem is insufficient reinforcement.

Kingston Bridge Approach Viaducts Assessment and Inspection Executive Introduction Document A
S100489 / 92AJG / 92CJG February 2007 Page 23
In summary, the Phase I assessment was based on characteristic strengths. The sections identified as being below
capacity were declared to be locations within which specific material testing was carried out in the Phase II
Inspection for Assessment on the North Approaches during summer, 1994. These locations were then analysed
using the worst credible strengths obtained from either concrete or reinforcement. Reinforcement can also be subject
to a WCS calculation. However, the benefit of increased confidence is not pronounced as γms moves from 1.15 to
1.1. (1.05 if actual depths to reinforcement are known).
Two points remain:-
(a) BA44/90 Appendix A notes that where advantage is taken of a WCS exceeding the characteristic value care
should be taken to ensure that the anchorage bond lengths are sufficient for the increased stress, although γm
reduces for bond also.
(b) A reduced condition factor Fc applied to sections assessed using the characteristic strength of materials
should be altered to allow for the fact that now WCS values of a material are input to the assessed capacity
calculation. The observed deteriorated condition of the concrete, for example, may have prompted a
reduction in Fc. When WCS values are adopted, the deterioration is taken into account and accordingly, Fc
should be increased.
Characteristic strengths for materials have been used as follows:-
Concrete fcu = 41 N/mm2 (equivalent to the specified concrete grade Y
3/4 with minimum works
strength of 6000 psi).
Steel reinforcement fy = 250 N/mm2 (mild steel throughout)
Tendon forces are as specified on drawings. The assessment of prestress assumes that the forces stated on original
drawings are equivalent to the 70% jacking force and that all losses are deductible from this value.
2.4 CONDITION FACTOR Fc
At present, the condition factor is set at Fc = 1.0 for the whole structure. The value of Fc is an estimate to account
for the deficiencies noted in the inspection but not allowed for in the calculation of resistance. The use of a single
condition based strength reduction factor is not well suited to most of the structural element assessments in hand. In
almost all cases, structural strength is provided by the interaction between steel and concrete either of which could
exist in varying conditions.
In the case of half joints, for example, strength derives principally from “strut and tie” action. To some extent, the
arrangement of reinforcement operates in two separate systems as described in BD44/90 Clause 7.2.4.2. Interaction
diagrams formed for all half joints demonstrate that a blanket reduction of capacity is very difficult to justify. As an
alternative, far more weight is attached to the assessment codes and values system employed throughout the reports.
Within this system, there is ample scope for the assessing engineer to apply the judgement required to determine the
likely influence that condition has on the overall capacity.
However, the code and value system allows relative comparisons to be made rather than arbitrary numerical
assessment reductions. Nevertheless, for the avoidance of doubt, all interaction diagrams (mainly employed in
Report N1) show Fc = 1.0.

Kingston Bridge Approach Viaducts Assessment and Inspection Executive Introduction Document A
S100489 / 92AJG / 92CJG February 2007 Page 24
3. ASSESSMENT LOADING
3.1 GENERAL DISCUSSION
SB3/84 [BD21/93] states that assessment loading will generally be limited to the application of dead and
superimposed dead load and type HA live load which is modified to obtain Assessment Live Loading (ALL).
In addition to these minimum loading requirements, the assessment includes for the effects of temperature difference
and temperature restraint. The former has a direct influence on the deck components, whilst the latter affects the
articulation as a whole and is fully discussed in Reports N1 and S1, and in the subsequent Articulation Review and
Column Assessment Report (February 2006).
3.2 SPECIFIC APPLICATION OF ASSESSMENT LOADING
Assessment loading has been derived from SB3/84 [BD21/93]. Where it was judged that loads other than given in
SB3/84 should be applied, these were derived from SB6/8821
[BD37/88].
The following summarises the loading:-
(a) SB3/84: Figure 7.3 [BD21/93: Figure 5/2]. Each deck component or assessment package has been assessed
individually and its assessed prestress member classification has been found for an imposed 40 tonne ALL.
(b) SB3/84: Clause 7.2.1 [BD21/93: Clause 5.6]. Where actual marked traffic lanes are wider than 3.65 metres,
the carriageway width has been divided into notional lanes. For example the five marked lanes on the
approach to Kingston Bridge, Lines 0 to 6 were treated as six notional lanes for assessment. The apparent
increase in loading intensity that this might cause is mitigated by the lane width reduction factors, β.
(c) SB3/84: Clause 7.4.3 [BD21/93: Clause 5.21]. HA Load intensities are not given for loaded lengths in
excess of 50 metres. In such circumstances, the load intensity was derived from SB6/88 [BD37/88] as:-
HA UDL = 36 (1/L)0.1
kN/m of loaded lane factored as appropriate in accordance with Figure 7.3
of SB3/84 [BD21/93: Figure 5/2] to obtain the ALL.
(d) Assessment document SB3/84 does not cater for HB type loading.
HB loading is allowed for in the following manner:-
(i) 45 units of HB acting alone.
(ii) 40 tonne ALL in combination with HB loading: the number of HB units to be determined
Case (i) was considered first with case (ii) following if case (i) was satisfactory.
Note that where HB loading is applied for cracking in prestressed concrete, BS5400: Part 4 requires that a
45 HB vehicle is modified to 25 HB in Combination 1. It remains as 45 HB for cracking in Combination 3.
For reinforced concrete HB is similarly modified for cracking but is checked in Combination 1 only.
Annex 1 to BD24/9222
specifies that the modification to 25 units of HB is no longer required and that (for
cracking) “Live loading should generally comprise Type HA only”. The implementation document
BD24/92 was issued after the completion of the Phase I assessment and updates to the results have not been
made. However, it is not thought that significant alterations would be made to the final outcome of the
assessment.
(e) SB3/84 : Clause 7.1 [BD21/93: Clause 5.2]. HA type loading does not satisfactorily model the effect of
vehicles on decks with main members that span transversely. This was the case for the cellular structures
21Scottish Office Roads Directorate Technical Memorandum SB6/88 “Loads for Highway Bridges” 1989
22 Department of Transport Technical memorandum BD24/92 (DMRB 1.3) “Design of Concrete Bridges. Use of
BS5400 part 4: 1990”

Kingston Bridge Approach Viaducts Assessment and Inspection Executive Introduction Document A
S100489 / 92AJG / 92CJG February 2007 Page 25
that consist of long rigidly restrained reinforced concrete portals. The deck slab spans principally in the
transverse direction between cell walls. This also occurred on the wide transverse slabs spanning between
boxes on the main viaducts. Assessment Live Loading was derived from SB3/84 Appendix DS/D
[BD21/93 Appendix D, D3] for this situation. This appendix replaced the HA type loading that consists of a
formula derived uniformly distributed load and a separate knife edge load, with a series of critical vehicles
that are listed in Table D1 of the Code appendix.

Kingston Bridge Approach Viaducts Assessment and Inspection Executive Introduction Document A
S100489 / 92AJG / 92CJG February 2007 Page 26
4. INTERPRETATION OF ASSESSMENT RESULTS - METHOD
4.1 GENERAL
Section 0 introduced the intention of treating the assessment results differently depending on the seriousness of the
consequences of any given assessment criterion being exceeded.
The primary objective of an assessment is to enable decisions to be made concerning the future management of the
structure. A method is proposed in this section to weight the consequence of failure of each assessment criterion by
attaching a value to each failure, the magnitude of which is related to the seriousness of the deficiency.
Table 4.1 shows the main structural elements assessed and the criteria under which the assessment was made. The
structural elements are separated into element groups according to the criteria employed. Thus, for example,
cantilever spans and curved continuous superstructures were assessed as follows:-
(a) at ultimate limit state
(b) at serviceability limit state - compressive stress limits
(c) at serviceability limit state - tension stress and cracking
(d) general condition
(e) condition of prestressing system
The cantilever spans and continuous spans are grouped under Element Group A (EGA). By attaching values to the
numerous superstructure elements in EGA, each value depending on the assessment result, one can judge the
priorities within that group.
The totals of the values derived within different element groups, A to F, cannot be compared directly; that is,
priorities cannot be set for cantilever spans as compared to columns, for instance.
Nevertheless, the values attached to each structural element and group form a concise method of expressing the
assessment results. The conclusions in the executive summary, Document B, employ the codes and values to
illustrate the general assessed state of the North Approaches.

Kingston Bridge Approach Viaducts Assessment and Inspection Executive Introduction Document A
S100489 / 92AJG / 92CJG February 2007 Page 27
Elmt
group
Description ULS SLS Condition
(a)
(b)
Long.
compn.
(c)
Long.
tension
(d)
Trans
stress
(d)
Trans
crack
(f)
General
(g)
Prestress
Prestress
A Cantilever
spans • • • • • • •
Continuous
spans • • • • •
B Suspended
spans • • • • • •
(b) (c) (d) (e) Cracking Stress
C Half joints
• • • • •
D
Columns
• • • •
E Pile caps
• • •
Working loads
F Piles
• •(1)
G Cellular
Structures • • •
Table 4.1: Structural element groups and assessment criteria
Note: 1. for pile loading. SLS ≡ working loads; γfl = 1.0
The codes and values for each criterion are then assembled and added together to give combined codes and
numerical totals: the structures with the most adverse codes or highest totals should be given earlier attention. The
nature of the additional attention required is discussed in each Report.
Throughout the technical reports, assessment codes and values are attached to the various structural elements. It is
intended that this section is used as a common reference when reading the other reports and for this reason, this
document contains the key descriptions and criteria for the assessment codes and values.

Kingston Bridge Approach Viaducts Assessment and Inspection Executive Introduction Document A
S100489 / 92AJG / 92CJG February 2007 Page 28
4.2 ELEMENT GROUP A: CANTILEVER AND CONTINUOUS SPANS
Element Group A comprises the superstructure elements of the cantilever spans and continuous spans. The
assessment capacity codes and total assessment values are derived by following Steps 1 to 7 through Tables 4.2 to
4.6. Each step relates to one of the columns in Table 4.1. An example of the way in which the assessment codes and
values are assembled is shown in Table 4.7 (page 31).
4.2.1 Steps 1 and 2: ULS and SLS Longitudinal Compressive Stress
Cantilever Spans
Continuous Spans
ALL
(tonnes)
HB alone
(units)
40 tonne ALL
+HB (units)
ULS SLS (compression)
Code Value Code Value
38-40 45 45 A 0 A 0
38-40 45 30-45 B 5 B 1
38-40 45 <30 C 10 C 2
38-40 30-45 - D 15 D 3
38-40 <30 - E 20 E 4
17-25 45 N/A F 25 F 5
17-25 30-45 G 30 G 6
17-25 <30 H 35 H 7
3-7.5 45 N/A I 40 I 8
3-7.5 30-45 J 45 J 9
3-7.5 <30 K 50 K 10
<3 30-45 N/A L 55 L 11
<3 <30 M 60 M 12
Table 4.2: Assessment capacity codes and values for ULS and SLS (compression)
4.2.2 Step 3: SLS Longitudinal Tension
SLS (tension) assessment Code Value
Class assessed is Class required A 0
Class assessed is one below
Class required
B 3
Class assessed is two below
Class required
C 6
Table 4.3: Assessed capacity codes and values for prestress SLS (tension - cracking)
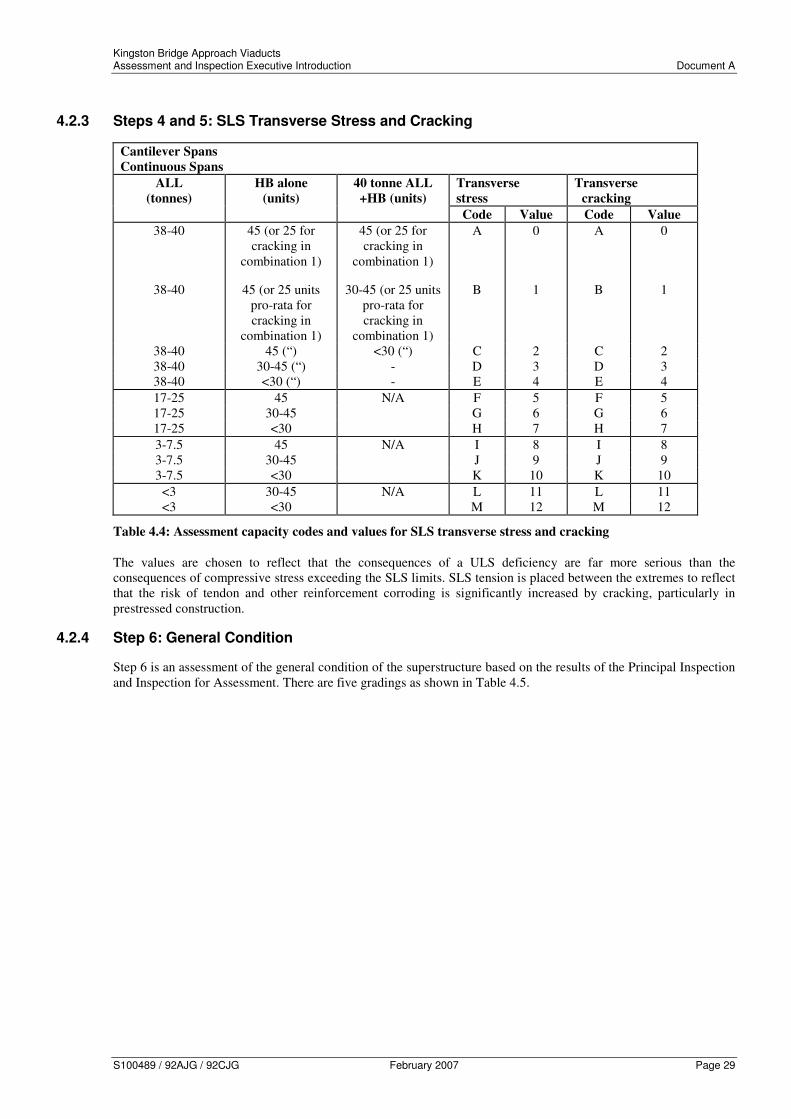
Kingston Bridge Approach Viaducts Assessment and Inspection Executive Introduction Document A
S100489 / 92AJG / 92CJG February 2007 Page 29
4.2.3 Steps 4 and 5: SLS Transverse Stress and Cracking
Cantilever Spans
Continuous Spans
ALL
(tonnes)
HB alone
(units)
40 tonne ALL
+HB (units)
Transverse
stress
Transverse
cracking
Code Value Code Value
38-40 45 (or 25 for
cracking in
combination 1)
45 (or 25 for
cracking in
combination 1)
A 0 A 0
38-40 45 (or 25 units
pro-rata for
cracking in
combination 1)
30-45 (or 25 units
pro-rata for
cracking in
combination 1)
B 1 B 1
38-40 45 (“) <30 (“) C 2 C 2
38-40 30-45 (“) - D 3 D 3
38-40 <30 (“) - E 4 E 4
17-25 45 N/A F 5 F 5
17-25 30-45 G 6 G 6
17-25 <30 H 7 H 7
3-7.5 45 N/A I 8 I 8
3-7.5 30-45 J 9 J 9
3-7.5 <30 K 10 K 10
<3 30-45 N/A L 11 L 11
<3 <30 M 12 M 12
Table 4.4: Assessment capacity codes and values for SLS transverse stress and cracking
The values are chosen to reflect that the consequences of a ULS deficiency are far more serious than the
consequences of compressive stress exceeding the SLS limits. SLS tension is placed between the extremes to reflect
that the risk of tendon and other reinforcement corroding is significantly increased by cracking, particularly in
prestressed construction.
4.2.4 Step 6: General Condition
Step 6 is an assessment of the general condition of the superstructure based on the results of the Principal Inspection
and Inspection for Assessment. There are five gradings as shown in Table 4.5.

Kingston Bridge Approach Viaducts Assessment and Inspection Executive Introduction Document A
S100489 / 92AJG / 92CJG February 2007 Page 30
General condition grading (excluding half joints) Grade Value
based on
local
testing
global
testing
No defects e.g. no visible defects of any kind A 0 5
Superficial
defects
e.g. limited staining, non structural cracking. Some
limited chloride contamination with low half cell
values.
B 5 10
Moderate
defects
e.g. some structural cracking less than 0.25 mm width.
Moderate chloride and half cell values. Limited
spalling at corners with few exposures of reinforcement
C 10 15
Severe
defects
e.g. high chloride and/or half cells, crack widths >0.25
mm, staining with leakage (stalactites), frequent
spalling with significant exposed and corroded
reinforcement. Observed or suspected loss of
reinforcement section in critical areas. Leakage at
construction joints and anchorages but with no
observed or suspected corrosion of prestressing system.
D 15 20
Very severe
defects
e.g. wide cracks accompanied by reinforcement
corrosion and spalling/disruption of concrete. Observed
or suspected corrosion risk at tendons including
anchorages. Leakage at construction joints with
observed or suspected corrosion risk to prestressing
system.
E 20 25
Table 4.5: Assessment codes and values for general condition
4.2.5 Step 7: Condition of Prestress System
Step 7 is an assessment of the condition of the prestress system and is based on the Inspection for Assessment. The
grading scheme is shown in Table 4.6.
Prestressing system grading Grade Value
based on
local
testing
global
testing
No defects e.g. no visible defects of any kind, fully grouted duct,
correct prestress
A 5 10
Superficial
defects
e.g. limited depth voids, strands covered, no corrosion,
correct prestress
B 10 15
Moderate
defects
e.g. whole depth voids, surface corrosion on tendons,
empty anchorages and/or coupler boxes.
C 15 20
Severe
defects
e.g. observed or suspected corrosion on tendons
resulting in some loss of section. Prestress in strands
slightly less than expected.
D 20 25
Very severe
defects
e.g. observed or suspected pitting corrosion on tendons,
conditions likely to promote corrosion of tendons,
deficient prestress force.
E 25 30
Table 4.6: Assessment codes and values for the prestressing system

Kingston Bridge Approach Viaducts Assessment and Inspection Executive Introduction Document A
S100489 / 92AJG / 92CJG February 2007 Page 31
4.2.6 Derivation of Assessment Code and Assessment Value Total
Once the 7 steps have been followed, the codes are assembled and the values added in Table 4.7.
Cantilever Span CSx (span code as used in Report N4) Coding and values from Tables 4.2 to 4.6
Step ALL
HB
alone
40 tonne
ALL +HB
Assessment
(tonnes) (units) (units) Code Value
1 Ultimate Limit State 40 45 18 C 10
2 SLS Long. compression 40 45 45 A 0
3 SLS Long. tension Class difference = 2 C 6
4 SLS trans. stress 40 45 30 B 1
5 SLS trans. cracking 40 25 25 A 0
Estimated from local testing • B 5 6 General condition (excluding
half joints)
Estimated from global testing
7 Prestress system Estimated from local testing
Estimated from global testing • X 15
Structural element code
Assessment value total
CACBABX
37
Table 4.7: Example: derivation of capacity code and total assessment value for a typical Cantilever Span CSx
Note, from Tables 4.2 to 4.6, the code for a structure passing all criteria would be “AAAAAAA”. None of the
structures on the North Approach viaducts attain this level. Note also that the assessment value total can never be
zero. The values for code A in Step 7 are non zero because some uncertainty will always exist regarding the
condition of the prestressing system. This is also numerically emphasised by attaching higher values where
judgements are based on test results from remote but similar structural elements.
Finally, an assessment code “X” is used where meaningful information about the particular assessment criterion is
not available. X is employed where the appropriate assessment code is inferred rather than obtained by direct
observation or calculation. Direct testing of the prestress system was very limited in relation to the total number of
prestressing elements in the viaducts. Most commonly, X is used to indicate that the assessment value attached has
been arrived at by a judgement taking into account the position, condition and knowledge of other known similarly
affected elements.

Kingston Bridge Approach Viaducts Assessment and Inspection Executive Introduction Document A
S100489 / 92AJG / 92CJG February 2007 Page 32
4.3 ELEMENT GROUP B: SUSPENDED SPANS
Element group B comprises the suspended spans. The assessment capacity code and total assessment values are
derived by following Steps 1 to 5 in Tables 4.8 to 4.11.
4.3.1 Step 1: ULS Generally
Suspended Spans
ALL
(tonnes)
HB alone
(units)
40 tonne ALL
+HB (units)
ULS
Code Value
38-40 45 45 A 0
38-40 45 30-45 B 5
38-40 45 <30 C 10
38-40 30-45 - D 15
38-40 <30 - E 20
17-25 45 N/A F 25
17-25 30-45 G 30
17-25 <30 H 35
3-7.5 45 N/A I 40
3-7.5 30-45 J 45
3-7.5 <30 K 50
<3 30-45 N/A L 55
<3 <30 M 60
Table 4.8: Assessment capacity codes and values for ULS
4.3.2 Step 2: Moment of Resistance on Webs Iyy
Suspended Spans
ALL
(tonnes)
HB alone
(units)
40 tonne ALL
+HB (units)
ULS
Code Value
38-40 45 45 A 0
38-40 45 30-45 B 5
38-40 45 <30 C 10
38-40 30-45 - D 15
38-40 <30 - E 20
17-25 45 N/A F 25
17-25 30-45 G 30
17-25 <30 H 35
3-7.5 45 N/A I 40
3-7.5 30-45 J 45
3-7.5 <30 K 50
<3 30-45 N/A L 55
<3 <30 M 60
Table 4.9: Assessment capacity codes and values for ULS Iyy moments
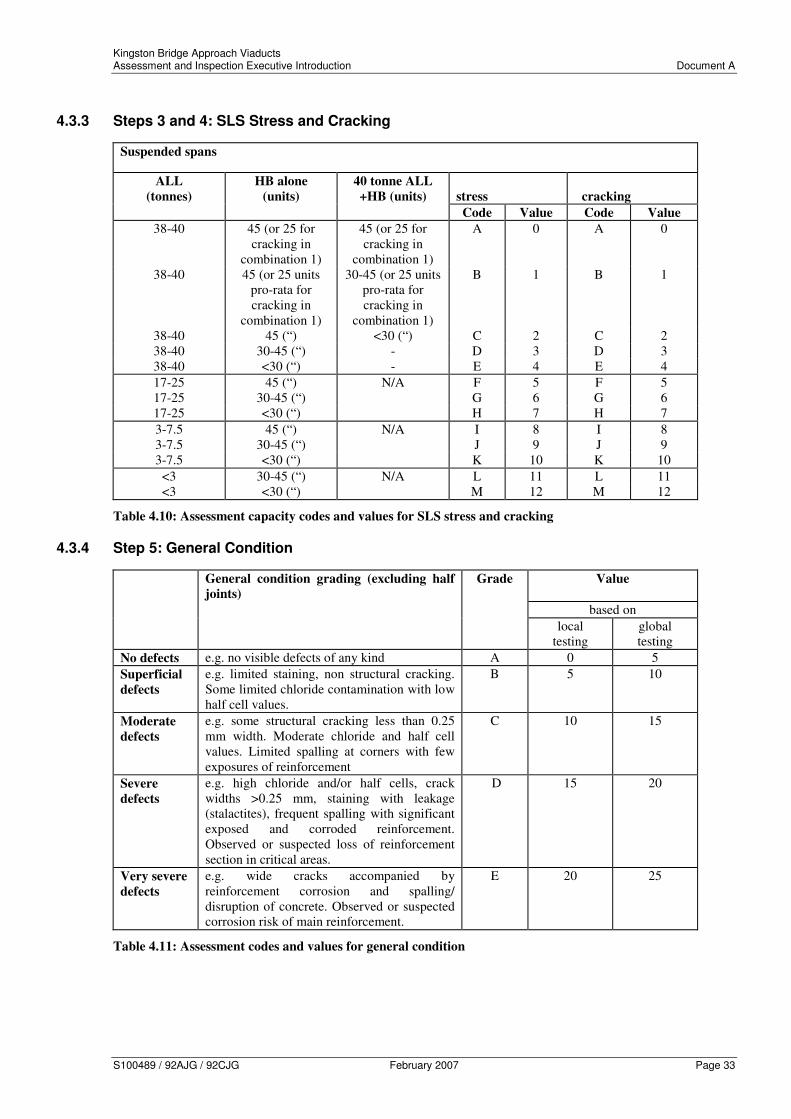
Kingston Bridge Approach Viaducts Assessment and Inspection Executive Introduction Document A
S100489 / 92AJG / 92CJG February 2007 Page 33
4.3.3 Steps 3 and 4: SLS Stress and Cracking
Suspended spans
ALL
(tonnes)
HB alone
(units)
40 tonne ALL
+HB (units)
stress
cracking
Code Value Code Value
38-40 45 (or 25 for
cracking in
combination 1)
45 (or 25 for
cracking in
combination 1)
A 0 A 0
38-40 45 (or 25 units
pro-rata for
cracking in
combination 1)
30-45 (or 25 units
pro-rata for
cracking in
combination 1)
B 1 B 1
38-40 45 (“) <30 (“) C 2 C 2
38-40 30-45 (“) - D 3 D 3
38-40 <30 (“) - E 4 E 4
17-25 45 (“) N/A F 5 F 5
17-25 30-45 (“) G 6 G 6
17-25 <30 (“) H 7 H 7
3-7.5 45 (“) N/A I 8 I 8
3-7.5 30-45 (“) J 9 J 9
3-7.5 <30 (“) K 10 K 10
<3 30-45 (“) N/A L 11 L 11
<3 <30 (“) M 12 M 12
Table 4.10: Assessment capacity codes and values for SLS stress and cracking
4.3.4 Step 5: General Condition
General condition grading (excluding half
joints)
Grade Value
based on
local
testing
global
testing
No defects e.g. no visible defects of any kind A 0 5
Superficial
defects
e.g. limited staining, non structural cracking.
Some limited chloride contamination with low
half cell values.
B 5 10
Moderate
defects
e.g. some structural cracking less than 0.25
mm width. Moderate chloride and half cell
values. Limited spalling at corners with few
exposures of reinforcement
C 10 15
Severe
defects
e.g. high chloride and/or half cells, crack
widths >0.25 mm, staining with leakage
(stalactites), frequent spalling with significant
exposed and corroded reinforcement.
Observed or suspected loss of reinforcement
section in critical areas.
D 15 20
Very severe
defects
e.g. wide cracks accompanied by
reinforcement corrosion and spalling/
disruption of concrete. Observed or suspected
corrosion risk of main reinforcement.
E 20 25
Table 4.11: Assessment codes and values for general condition

Kingston Bridge Approach Viaducts Assessment and Inspection Executive Introduction Document A
S100489 / 92AJG / 92CJG February 2007 Page 34
4.3.5 Derivation of Assessment Code and Assessment Value Total
Suspended Span SSx (span code as used in Report N4)
Coding and values from Tables 4.8 and 4.11
Step ALL
HB
alone
40 tonne
ALL +HB
Assessment
(tonnes) (units) (units) Code Value
1 Ultimate Limit State 40 45 18 C 10
2 ULS Iyy MoR 40 45 0 D 15
3 SLS stress 40 45 26 C 2
4 SLS cracking 40 45 20 B 1
5 Estimated from local testing • B 5
General condition (excluding
half joints)
Estimated from global testing
Structural element code
Assessment value total
CDCBB
33
Table 4.12: Example: derivation of capacity code and total assessment value for a typical Suspended Span
SSx

Kingston Bridge Approach Viaducts Assessment and Inspection Executive Introduction Document A
S100489 / 92AJG / 92CJG February 2007 Page 35
4.4 ELEMENT GROUP C: HALF JOINTS
Element group C comprises the half joints. Half joints clearly influence the capacity of the cantilever spans, the
continuous spans and the suspended spans. However, from the earliest stages of the assessment project, they have
been treated as a distinct entity. The assessment capacity codes and total assessment values are derived by following
Steps 1 to 5 in Table 4.13 to Table 4.17.
4.4.1 Step 1a: ULS Vertical Capacity
Half Joints
ALL
(tonnes)
HB alone
(units)
40 tonne ALL
+HB (units)
ULS vertical
capacity
Code Value
38-40 45 45 A 0
38-40 45 30-45 B 5
38-40 45 <30 C 10
38-40 30-45 - D 15
38-40 <30 - E 20
17-25 45 N/A F 25
17-25 30-45 G 30
17-25 <30 H 35
3-7.5 45 N/A I 40
3-7.5 30-45 J 45
3-7.5 <30 K 50
<3 30-45 N/A L 55
<3 <30 M 60
Table 4.13: Assessment capacity codes and values for ULS vertical capacity
4.4.2 Step 1b: ULS Horizontal Capacity (Hinge Dowel Bars)
ULS Horizontal Capacity
(expressed in °°°°C)
Code Value
can resist effects arising from:
te ≤ -9°C, te ≥ 33°C
-9°C < te < 33°C
0°C ≤ te ≤ 22°C
0°C ≤ te ≤ 15°C
A
B
C
D
0
3
6
9
Table 4.14: ULS horizontal capacity (vertical hinge dowels)

Kingston Bridge Approach Viaducts Assessment and Inspection Executive Introduction Document A
S100489 / 92AJG / 92CJG February 2007 Page 36
4.4.3 Steps 2 and 3: SLS Stress and Cracking
Half joints
ALL
(tonnes)
HB alone
(units)
40 tonne ALL
+HB (units)
stress
cracking
Code Value Code Value
38-40 45 (or 25 for
cracking in
combination 1)
45 (or 25 for
cracking in
combination 1)
A 0 A 0
38-40 45 (or 25 units
pro-rata for
cracking in
combination 1)
30-45 (or 25 units
pro-rata for
cracking in
combination 1)
B 1 B 1
38-40 45 (“) <30 (“) C 2 C 2
38-40 30-45 (“) - D 3 D 3
38-40 <30 (“) - E 4 E 4
17-25 45 (“) N/A F 5 F 5
17-25 30-45 (“) G 6 G 6
17-25 <30 (“) H 7 H 7
3-7.5 45 (“) N/A I 8 I 8
3-7.5 30-45 (“) J 9 J 9
3-7.5 <30 (“) K 10 K 10
<3 30-45 (“) N/A L 11 L 11
<3 <30 (“) M 12 M 12
Table 4.15: Assessment capacity codes and values for SLS stress and cracking
4.4.4 Step 4: General Condition
Half Joint general condition grading Grade Value
based on
local
testing
global
testing
No
defects
e.g. no visible defects of any kind A 0 5
Superficial
defects
e.g. limited staining, non structural cracking.
Some limited chloride contamination with low
half cell values.
B 5 10
Moderate
defects
e.g. some structural cracking less than 0.25
mm width. Moderate chloride and half cell
values. Limited spalling or disruption at
corners with few exposures of reinforcement
C 10 15
Severe
defects
e.g. high chloride and/or half cells, crack
widths >0.25 mm or significant fragmentation,
staining with leakage, soffit spalling with
significant exposed and corroded
reinforcement. Observed or suspected loss of
reinforcement section in critical areas.
Leakage at anchorages but with no observed
or suspected corrosion of prestressing system.
D 15 20
Very
severe
defects
e.g. wide cracks accompanied by
reinforcement corrosion and spalling/
disruption of concrete. Observed or suspected
corrosion risk at tendons including
anchorages. Leakage at construction joints
with observed or suspected corrosion risk to
prestressing system.
E 20 25
Table 4.16: Assessment codes and values for general half joint condition

Kingston Bridge Approach Viaducts Assessment and Inspection Executive Introduction Document A
S100489 / 92AJG / 92CJG February 2007 Page 37
4.4.5 Step 5: Condition of the Prestress System
Prestressing system at half joints Grade Value
grading based on
local
testing
global
testing
No
defects
e.g. no visible defects of any kind, fully
grouted duct and anchorage, intact anchor
plate cover concrete
A 5 10
Super-
ficial
defects
e.g. limited voids in anchorage, strands
covered, no corrosion.
B 10 15
Moderate
defects
e.g. surface corrosion on tendons, empty
anchorages.
C 15 20
Severe
defects
e.g. observed or suspected corrosion on
tendons resulting in some loss of section.
D 20 25
Very
severe
defects
e.g. observed or suspected pitting corrosion on
tendons, conditions likely to promote
corrosion of tendons.
E 25 30
Table 4.17: Assessment codes and values for the prestressing system at half joints
4.4.6 Derivation of Assessment Code and Assessment Value Total
Half Joint N(A to H)x Coding and values from Tables 4.13 to 4.17
Step ALL
HB
alone
40 tonne
ALL +HB
Assessment
(tonnes) (units) (units) Code Value
1a Ultimate Limit State (vertical) 40 45 18 C 10
1b Ultimate Limit State (hinge
dowels)
Assessment temperature
26°C
B 3
2 Stress 40 45 45 A 0
3 Cracking 40 25 25 A 0
2 Estimated from local testing
General condition at half
joints Estimated from global testing • X 10
3 Estimated from local testing
Prestressing system at half
joints Estimated from global testing • X 15
Structural element code
Assessment value total
CBAAXX
38
Table 4.18: Example: derivation of capacity code and total assessment value for a typical half joint N(A to
H)x

Kingston Bridge Approach Viaducts Assessment and Inspection Executive Introduction Document A
S100489 / 92AJG / 92CJG February 2007 Page 38
4.5 ELEMENT GROUP D: COLUMNS
Element group D comprises the columns. The assessment capacity codes and total assessment values are derived by
following Steps 1 to 4 in Tables 4.19 to 4.22. Each step relates to one of the table columns in Table 4.1.
4.5.1 Step 1a: ULS
Columns
ALL
(tonnes)
HB alone
(units)
40 tonne ALL
+HB (units)
ULS
Code Value
38-40 45 45 A 0
38-40 45 30-45 B 5
38-40 45 <30 C 10
38-40 30-45 - D 15
38-40 <30 - E 20
17-25 45 N/A F 25
17-25 30-45 G 30
17-25 <30 H 35
3-7.5 45 N/A I 40
3-7.5 30-45 J 45
3-7.5 <30 K 50
<3 30-45 N/A L 55
<3 <30 M 60
Table 4.19: Assessment capacity codes and values for ULS
4.5.2 Step 1b: Temperature Assessment (Articulation Effects)
ULS Temperature Assessment
(expressed in °°°°C)
Code Value
can resist effects arising from:
te ≤ -9°C, te ≥ 33°C
-9°C < te < 33°C
0°C ≤ te ≤ 22°C
0°C ≤ te ≤ 15°C
A
B
C
D
0
3
6
9
Table 4.20: Column temperature assessment codes and values

Kingston Bridge Approach Viaducts Assessment and Inspection Executive Introduction Document A
S100489 / 92AJG / 92CJG February 2007 Page 39
4.5.3 Steps 2 and 3: SLS Stress and Cracking
Columns
ALL
(tonnes)
HB alone
(units)
40 tonne ALL
+HB (units)
stress
cracking
Code Value Code Value
38-40 45 (or 25 for
cracking in
combination 1)
45 (or 25 for
cracking in
combination 1)
A 0 A 0
38-40 45 (or 25 units
pro-rata for
cracking in
combination 1)
30-45 (or 25 units
pro-rata for
cracking in
combination 1)
B 1 B 1
38-40 45 (“) <30 (“) C 2 C 2
38-40 30-45 (“) - D 3 D 3
38-40 <30 (“) - E 4 E 4
17-25 45 (“) N/A F 5 F 5
17-25 30-45 (“) G 6 G 6
17-25 <30 (“) H 7 H 7
3-7.5 45 (“) N/A I 8 I 8
3-7.5 30-45 (“) J 9 J 9
3-7.5 <30 (“) K 10 K 10
<3 30-45 (“) N/A L 11 L 11
<3 <30 (“) M 12 M 12
Table 4.21: Assessment capacity codes and values for SLS stress and cracking
4.5.4 Step 4: Column General Condition
Column general condition grading Grade Value
based on
local
testing
global
testing
No defects e.g. no visible defects of any kind A 0 5
Superficial
defects
e.g. limited staining, non structural cracking.
Some limited chloride contamination with low
half cell values.
B 5 10
Moderate
defects
e.g. some structural cracking less than 0.25
mm width. Moderate chloride and half cell
values. Limited spalling with few exposures of
reinforcement
C 10 15
Severe
defects
e.g. high chloride and/or half cells, crack
widths >0.25 mm or significant fragmentation,
staining with leakage at column top (e.g. due
to broken drain), edge spalling with significant
exposed and corroded reinforcement.
Observed or suspected loss of reinforcement
section in critical areas. Column top
grounding due to articulation effects of
superstructure.
D 15 20
Very severe
defects
e.g. wide cracks accompanied by
reinforcement corrosion and spalling/
disruption of concrete. Flexural cracking at
base. Column top grounding due to
articulation effects of superstructure resulting
in cracking or disruption of concrete.
E 20 25
Table 4.22: Assessment codes and values for column general condition

Kingston Bridge Approach Viaducts Assessment and Inspection Executive Introduction Document A
S100489 / 92AJG / 92CJG February 2007 Page 40
4.5.5 Derivation of Assessment Code and Assessment Value Total for Columns
Column N(A to H)x
Coding and values from Tables 4.19 to 4.22
Step ALL
HB
alone
40 tonne
ALL +HB
Assessment
(tonnes) (units) (units) Code Value
1a Ultimate Limit State 40 45 18 C 10
1b Ultimate Limit State Assessment temperature
26°C
B 3
2 Stress 40 45 45 A 0
3 Cracking 40 25 25 A 0
4 General condition Estimated from local testing • B 5
Estimated from global testing
Structural element code
Assessment value total
CBAAB
18
Table 4.23: Example: derivation of capacity code and total assessment value for a typical column
N(A to H)x

Kingston Bridge Approach Viaducts Assessment and Inspection Executive Introduction Document A
S100489 / 92AJG / 92CJG February 2007 Page 41
4.6 ELEMENT GROUP E: PILE CAPS
Element group E comprises the pile caps. The assessment capacity codes and total assessment values are derived by
following Steps 1 to 3 in Tables 4.24 to 4.26. Each step relates to one of the table columns in Table 4.1.
4.6.1 Step 1a: ULS
Pile caps
ALL
(tonnes)
HB alone
(units)
40 tonne ALL
+HB (units)
ULS
Code Value
38-40 45 45 A 0
38-40 45 30-45 B 5
38-40 45 <30 C 10
38-40 30-45 - D 15
38-40 <30 - E 20
17-25 45 N/A F 25
17-25 30-45 G 30
17-25 <30 H 35
3-7.5 45 N/A I 40
3-7.5 30-45 J 45
3-7.5 <30 K 50
<3 30-45 N/A L 55
<3 <30 M 60
Table 4.24: Assessment capacity codes and values for ULS
4.6.2 Step 1b: ULS Assessment Temperature
ULS Temperature Assessment
(expressed in °°°°C)
Code Value
can resist effects arising from:
te ≤ -9°C, te ≥ 33°C
-9°C ≤ te ≤ 33°C
0°C ≤ te ≤ 22°C
0°C ≤ te ≤ 15°C
A
B
C
D
0
3
6
9
Table 4.25: Pile cap assessment temperatures

Kingston Bridge Approach Viaducts Assessment and Inspection Executive Introduction Document A
S100489 / 92AJG / 92CJG February 2007 Page 42
4.6.3 Steps 2 and 3: SLS Stress and Cracking
Pile caps
ALL
(tonnes)
HB alone
(units)
40 tonne ALL
+HB (units)
stress
cracking
Code Value Code Value
38-40 45 (or 25 for
cracking in
combination 1)
45 (or 25 for
cracking in
combination 1)
A 0 A 0
38-40 45 (or 25 units
pro-rata for
cracking in
combination 1)
30-45 (or 25 units
pro-rata for
cracking in
combination 1)
B 1 B 1
38-40 45 (“) <30 (“) C 2 C 2
38-40 30-45 (“) - D 3 D 3
38-40 <30 (“) - E 4 E 4
17-25 45 (“) N/A F 5 F 5
17-25 30-45 (“) G 6 G 6
17-25 <30 (“) H 7 H 7
3-7.5 45 (“) N/A I 8 I 8
3-7.5 30-45 (“) J 9 J 9
3-7.5 <30 (“) K 10 K 10
<3 30-45 (“) N/A L 11 L 11
<3 <30 (“) M 12 M 12
Table 4.26: Assessment capacity codes and values for SLS stress and cracking
4.6.4 Derivation of Assessment Code and Assessment Value Total for Pile Caps
Pile Cap N(A to H)x Coding and values from Tables 4.24 and 4.26
Step ALL
HB
alone
40 tonne
ALL +HB
Assessment
(tonnes) (units) (units) Code Value
1a Ultimate Limit State 40 45 18 C 10
2 Stress 40 45 45 A 0
3 Cracking 40 25 25 A 0
1b Ultimate Limit State Assessment temperature
26°C
B 3
Structural element code
Assessment value total
CAAB
13
Table 4.27: Example: derivation of capacity code and total assessment value for typical pile cap N(A to H)x

Kingston Bridge Approach Viaducts Assessment and Inspection Executive Introduction Document A
S100489 / 92AJG / 92CJG February 2007 Page 43
4.7 ELEMENT GROUP F: PILES
Element group F comprises the piles. The assessment capacity codes and total assessment values are derived by
following Steps 1a and 1b in Tables 4.28 and 4.29.
4.7.1 Step 1a: Working Loads
Piles
ALL
(tonnes)
HB alone
(units)
40 tonne ALL
+HB (units)
Working loads
(≡≡≡≡SLS γγγγfL =1.0)
Code Value
38-40 45 45 A 0
38-40 45 30-45 B 5
38-40 45 <30 C 10
38-40 30-45 - D 15
38-40 <30 - E 20
17-25 45 N/A F 25
17-25 30-45 G 30
17-25 <30 H 35
3-7.5 45 N/A I 40
3-7.5 30-45 J 45
3-7.5 <30 K 50
<3 30-45 N/A L 55
<3 <30 M 60
Table 4.28: Assessment capacity codes and values for working loads
4.7.2 Step 1b: Working Load Temperature Assessment
Working Load Temperature
Assessment (expressed in °°°°C)
Code Value
can resist effects arising from:
te ≤ -9°C, te ≥ 33°C
-9°C < te < 33°C
0°C ≤ te ≤ 22°C
0°C ≤ te ≤ 15°C
A
B
C
D
0
3
6
9
Table 4.29: Working load temperature assessment codes for piles

Kingston Bridge Approach Viaducts Assessment and Inspection Executive Introduction Document A
S100489 / 92AJG / 92CJG February 2007 Page 44
4.7.3 Derivation of Assessment Code and Assessment Value Total for Piles
Piles on N(A to H)x
Coding and values from Tables 4.28 and 4.29
Step ALL
HB
alone
40 tonne
ALL +HB
Assessment
(tonnes) (units) (units) Code Value
1a Working load 40 45 18 C 10
1b Working load Assessment temperature
26°C
B 3
Structural element code
Assessment value total
CB
13
Table 4.30: Example: derivation of capacity code and total assessment value for typical piles N(A to H)x

Kingston Bridge Approach Viaducts Assessment and Inspection Executive Introduction Document A
S100489 / 92AJG / 92CJG February 2007 Page 45
5. TECHNICAL MEMORANDA
5.1 TECHNICAL MEMORANDA INCLUDED IN THE ORIGINAL BRIEF
The following is a list of memoranda that are applicable including the memoranda specifically mentioned in the
original Brief (DMRB equivalents are indicated thus [....] and are summarised in Table 1.9 on Page 16)
Technical Memoranda included in the original Brief:-
(a) SB1/78 The Inspection of Highway Structures: July 1978 Amendment No 1 - 1990.
(b) SB1/91 Technical Requirements for the Assessment and Strengthening Programme for Highway Structures.
Stage 1 - Older Short Span Bridges and Retaining Structures: 1991 and Amendment No 1. [BD34/90
DMRB 3.4: Scottish Addendum applicable for use in Scotland]
(c) SB2/91 The Assessment of Concrete Highway Bridges and Structures: 1991. [BD44/90 DMRB 3.4]
(d) SB3/84 The Assessment of Highway Bridges and Structures (Revised Edition incorporating amendment No
1): 1988 and Amendment No 2 1990 together with Annex 1 Advice Note. 3.2 Recently Published Technical
Memoranda. [BD21/93]
In addition to the foregoing, the following technical memoranda are relevant and are included in the
DMRB:-
(e) BD46/92 DMRB 3.4 Technical Requirements for the Assessment and Strengthening Programme for
Highway Structures. Stage 2 - Modern Short Span Bridges: August 1992. The majority of the individual
superstructure components fell within the scope of this memorandum rather than the Stage 1 group defined
in SB1/91 [BD34/90]. However, this memorandum complements rather than replaces the primary
assessment documents BD21/93 and BA16/93 DMRB 3.4, which are equivalent to SB3/84 and Annex 1
respectively.
This assessment was used to identify vulnerable areas for the tendon special Inspection for Assessment
(Refer to (g) below).
For cracking, BD46/92 refers directly to crack widths and sets 0.3 mm as a guide to the maximum
acceptable width above which special consideration is given to corrosion. Crack widths were considered for
those parts of the structure exceeding Class 2 stresses.
(f) BD50/92 DMRB 3.4.2 Technical Requirements for the Assessment and Strengthening Programme for
Highway Structures Stage 3 - Long Span Bridges. Structures falling into this category are the four
continuous ramps on the north approach viaducts and the Carnoustie Street and West Street On Ramps on
the south approach viaducts. BD21/93 (equivalent to SB3/84) is the primary assessment document but the
application of Assessment Live Load is modified. In the course of the assessment thus far, intermediate
ULS and SLS Assessment Live Load capacity according to SB3/84 Figure 7.3 [BD21/93 Figure 5/2] have
been calculated. BD50/92 eliminates all intermediate load levels below 40 tonne ALL except 7.5 tonne
ALL. The assessment results reflect this requirement.
(g) BD54/93 DMRB 3.1.2 Post-tensioned Concrete Bridges. Prioritisation of Special Inspections, January
1993. The application of this memorandum to the special Inspection for Assessment of the prestressing
system at the north and, in due course, the south viaducts was considered as part of Phase II of the
assessment. Although the memorandum is intended as a guide to prioritisation throughout a roads network,
there is sufficient variation in structural form, traffic flow and prestress detailing for the several “Ratings”
to be applied to the numerous individual spans on the viaducts. These can be weighed against what is
already known about the viaducts, particularly with respect to highly stressed areas.
(h) Draft Advice Note BA50/93 DMRB 3.1 “Post-Tensioned Concrete Bridges - The Planning, Organisation
and Methods of Carrying Out Special Inspections”.

Kingston Bridge Approach Viaducts Assessment and Inspection Executive Introduction Document A
S100489 / 92AJG / 92CJG February 2007 Page 46
6. TESTING HOUSES
6.1 TESTING HOUSES EMPLOYED IN THE ASSESSMENT AND INSPECTION
Throughout the Structural Assessment and Principal Inspection, various testing houses have been employed. Each
has submitted a report to SW. Their individual reports are presented with the relevant SW Report either as additional
volumes or as appendices.
In all cases, testing house reports have been interpreted and discussed in detail in the SW Reports.
An overall index to the location of testing house documents within the structure of the SW Reports submitted to date
is given in Table 6.1.
Report Testing House Title of Report(s) Part (P)
Volume (V)
Appendix (A)
North approaches
N2 Capcis Ltd. Half Joint Condition Survey:
Kingston Bridge North Approaches
V1 A1
N2 Stanger Consultants Joint NC16 Hinge Joint
Joint ND8 Hinge Joint
Joint ND7 Hinge Joint
Joint NE7 Hinge Joint
Joint NE12 Hinge Joint
Joint SA21 Hinge Joint
Joint NF10 Hinge Joint
Joint NF14 Hinge Joint
V2
V3
V4
V5
V6
V7
V8
V9
N3 Site Services Report on the Investigation of
Kingston Bridge North Approaches
V3 - V11
N3 Inspectahire Borescope photographic records V4 A11
N6 CWM Saynor Report on the Inspection for
Assessment of Kingston Bridge
North Approaches
V3 P1
V3 P2
North Approaches
N6 GB Geotechnics Report on the Inspection for
Assessment of Kingston Bridge
North Approaches
V6
N6 Strainstall Engineering
services Ltd.
Report on the Inspection for
Assessment of Kingston Bridge
North Approaches
V5
South approaches
S2 Site Services Report on the Investigation of
Kingston Bridge South Approaches
P3 V1-9
Table 6.1: Summary and location of testing house reports

Kingston Bridge Approach Viaducts Assessment and Inspection Executive Introduction Document A
S100489 / 92AJG / 92CJG February 2007 Page 47
7. INSPECTION AND ASSESSMENT CHRONOLOGY
The assessment chronology is shown on the attached programme. The programme sets out to indicate the
approximate sequence of preparation of the various inspection and assessment Reports, together with the
implementation of the remedial works to the Stobcross Street On and Off Ramps. It does not, in any detail, indicate
issue dates of the specific reports or their status. Nor does it include the various remedial works to the Bridge itself.

KINGSTON BRIDGE APPROACH VIADUCTS
DOCUMENT A - Assessment and Inspection Executive Introduction
PROJECT CHRONOLOGY
Task Q1 Q2 Q3 Q4 Q1 Q2 Q3 Q4 Q1 Q2 Q3 Q4 Q1 Q2 Q3 Q4 Q1 Q2 Q3 Q4 Q1 Q2 Q3 Q4 Q1 Q2 Q3 Q4 Q1 Q2 Q3 Q4 Q1 Q2 Q3 Q4 Q1 Q2 Q3 Q4 Q1 Q2 Q3 Q4 Q1 Q2 Q3 Q4 Q1 Q2 Q3 Q4 Q1 Q2 Q3 Q4 Q1 Q2 Q3 Q4 Q1 Q2 Q3 Q4
Project Brief
Executive Documents
ORIGINAL ASSESSMENTS:
North Approaches
Special Reports
Interim Measures & Strengthening
Report N1
Report N2
Report N3
Report N4
Report N5
Report N6
Report N7
South Approaches
Report S1
Report S2
Report S3
DECK REPLACEMENT WORKS
Stobcross St Off Ramp
Stobcross St On Ramp
POST-WORKS REVIEWS / REASSESSMENTS
Articulation Review & Column Assessment
Reassessment of Half Joints
Monitoring
KEY TO CHART:
Milestone
Executive & Summary Reports
Assessment / Inspection Reports
Remedial Works Projects
Monitoring
1992 1993 1994 1995 1996 1997 1998 1999 2000 2001 2002 2003 2004 2005 2006 2007
S100489 / 92AJG / 92CJG February 2007

Kingston Bridge Approach Viaducts Assessment and Inspection Executive Introduction Document A
S100489 / 92AJG / 92CJG February 2007 Page A1.1
Appendix A1
Transcript of SRC Brief to SW on 20 February 1992

Kingston Bridge Approach Viaducts Assessment and Inspection Executive Introduction Document A
S100489 / 92AJG / 92CJG February 2007 Page A1.2
Transcript
KINGSTON BRIDGE SRC Ref. JB/DC/R8/4/15/1
NORTH APPROACHES
I refer to your letter of 15 January 1992.
I confirm that your existing commission on Kingston Bridge, as defined in letters to you dated 18 September 1990
and 20 September 1990, is hereby extended to cover the following work on the north approaches:-
A. Analysis of Articulation.
B. Principal Inspection.
C. Structural Assessment.
Following a meeting (McGowan/Bremner/Swan/Coutts) on 20 December 1991, a draft brief (copy attached hereto)
was passed to you on 31 December 1991.
Subsequent meetings took place on 7 January 1992 (McGowan/Bremner/Swan/Coutts), 8 January 1992
(McGowan/Redpath/Swan/Merriman/Kewley) and 6 February 1992 (Redpath/Coutts).
The following points are intended to firm up your commission and to gather together the salient points from these
meetings:-
1. Analysis and Articulation
Point 2 in your letter of 15 January refers
The objectives of this work are to:-
i) Establish the articulation mode of the north approaches.
ii) Determine the forces, moments, shears, etc. in the structural components.
You outline that you will do this by preparing a mathematical computer model of the articulation of the
north approaches structural system and applying to it the effects of temperature, braking and any other
relevant effects.
As discussed (Redpath/Coutts), you may feel it appropriate to include the effects of permanent movements
(creep, shrinkage, etc.) which have already taken place and
are built into the structural components of the north approaches in its standing state. I have some data,
which may be of use to you, on the out-of-plumbness of the pier columns on the first set of table-tops
immediately north of Kingston Bridge. Please contact D. Coutts if you wish to have this data.
I confirm that, at our meeting on 20 December, you received a copy of Drawing No. R8/4/15/1/003 which
indicated deck joint types and column top details. As discussed (Redpath/Coutts), this information has been
extracted from Fairhurst’s as-built drawings and should be confirmed as part of your Principal Inspection.
At this meeting, you also received a copy of Sketch Nos. SK001 to 010.
2. Principal Inspection
Point 4 in your letter of 15 January refers.
As you have noted, the Principal Inspection is to be carried out in accordance with SB1/78.

Kingston Bridge Approach Viaducts Assessment and Inspection Executive Introduction Document A
S100489 / 92AJG / 92CJG February 2007 Page A1.3
Additionally:-
i) Cognisance shall be taken, as appropriate, of ‘Bridge Inspection Guide” published by the Scottish
Development Department.
ii) The Principal Inspection shall be extended, as appropriate, to provide data for a structural assessment as
outlined in SB3/84 and SB1/91.
It is envisaged that the Principal Inspection will be reported in similar format to that already provided by
yourselves for Kingston Bridge.
Further to our meeting on 8 January, you are aware of six half joints which I wish to be reported on as a
matter of priority.
The condition of the half joints is of particular interest to me and should include, inter-alia:-
a) Magnitude and extent of cracking in concrete.
b) Cover to reinforcement, with particular emphasis on reinforcement which is significant in terms of
reinforced and post-tensioned half joint behaviour.
c) Condition of reinforcement, with particular emphasis on the dowels and on reinforcement which is
significant in terms of reinforced and post-tensioned half joint behaviour.
d) Magnitude and extent of chloride penetration into the concrete, with particular emphasis on the bearing
ledges.
e) Condition of bearings.
f) Strength of concrete.
I should be pleased if your testing work for this extended Principal Inspection can be done without cutting
reinforcement. Please do not reinforcement without, first, getting my agreement.
I confirm that all work done to date by Strathclyde Roads will be made available to you and, as appropriate,
will be incorporated into your Principal Inspection report.
3. Structural Assessment
Points 1 and 3 in your letter of 15 January refer.
You have noted that a full assessment will be carried out in accordance with SB2/91.
Inter-alia, SB3/84, and Annex 1 and SB1/91 are also relevant.
As Client options exist in the application of the assessment documents, it is emphasised that very close
liaison should be maintained throughout.
I have outlined, in 2 above, that the condition of the half joints is of particular interest to me. It follows that
the analytical assessment of the half joints is also of particular interest. This is outlined in point 1 of your
letter but I would highlight that the intensity of the detailed in-depth analytical and physical investigation
will necessarily be reduced on completion of your work on the six half joints exhibit the worst signs of
distress.
4. Materials Testing and Specialist Inspection
Further to our meeting on 6 February, I have give some thought to materials testing and specialist
inspection for this work.

Kingston Bridge Approach Viaducts Assessment and Inspection Executive Introduction Document A
S100489 / 92AJG / 92CJG February 2007 Page A1.4
As has been outlined in 2 above, the condition of the half joints is of particular interest to me. It is not
going to be easy to report on the condition of these but, as discussed (Redpath/Coutts), it is essential that
the reporting covers, inter-alia, the aspects outlined in 2 above.
As access to certain parts of the half joints will require some ingenuity, I have, as promised, researched the
names of firms, outwith the five S’s, who may be able to offer a service in the field of specialist inspection.
Possibilities are CAN (UK) Ltd., CAPCIS-UMIST and the Concrete Advisory Service and, if you so wish,
I will contact these organisations. In any event, I should be pleased to have your recommendation, prior to
any appointment being made.
5. Programme
The programme for this work is, broadly, as outlined in your letter of 15 January 1992.
6. Referencing System for Half Joints and Pier Columns
I confirm that you have received, and will adopt, my referencing system for the half joints and columns.
7. Reinforcement
I confirm my understanding that the reinforcement is all mild steel.
I have not removed a sample for testing and hence cannot confirm its properties.
8. Contacts in Strathclyde Roads
Your contact for this work will be the Kingston Project Manager (D. Coutts).
The exceptions to this will be for obtaining factual information and access, where the contact will be
through D. Merriman.
9. Progress Reporting
i) Progress.
ii) Current activity.
iii) Programme.

Kingston Bridge Approach Viaducts Assessment and Inspection Executive Introduction Document A
S100489 / 92AJG / 92CJG February 2007
References
1. Department of Transport Technical Memorandum BD37/88 (DMRB 1.3) “Loads for Highway Bridges”, since
updated to BD 37/01.
2. Scott Wilson Kirkpatrick & Company (Scotland) Limited “Kingston Bridge 1990’s Assessment”
3. Scottish Office Roads Directorate Technical Memorandum SB1/78 “The Inspection of Highway Structures”:
July 1978 Amendment No.1 1990
4. Department of Transport “Bridge Inspection Guide” HMSO 1983
5. Scott Wilson Kirkpatrick & Company (Scotland) Limited “Kingston Bridge Principal Inspection Report” Apr.
1991
6. Scott Wilson Kirkpatrick & Company (Scotland) Limited “Kingston Bridge North Approaches - Special
Drainage Report” Jun. 1993
7. Department of Transport Technical Memorandum BD54/93 (DMRB 3.1) “Post Tensioned Concrete Bridges:
Prioritisation of Special Inspections”
8. Department of Transport Technical Memorandum BA50/93 (DMRB 3.1) “Post Tensioned Concrete Bridges.
Planning, Organisation and Methods for Carrying Out Special Inspections”
9. Scottish Office Roads Directorate Technical Memorandum SB3/84 “The Assessment of Highway Bridges and
Structures” (Revised Edition incorporating amendment No 1: 1988 and Amendment No.2 1990 together with
Annex 1 Advice Note. 3.2 Recently Published Technical Memoranda.)
10. Department of Transport Technical Memorandum BD21/93 (DMRB 3.4) “The Assessment of Highway Bridges
and Structures” since twice updated to BD21/97 and BD 21/01.
11. Scottish Office Roads Directorate Technical Memorandum SB2/91 “The Assessment of Concrete Highway
Bridges and Structures”
12. Department of Transport Technical Memorandum BD44/90 (DMRB 3.4) “The Assessment of Concrete
Highway Bridges and Structures” since updated to BD44/95
13. Scottish Office Roads Directorate Technical Memorandum SB1/91 “Technical Requirements for the
Assessment and Strengthening Programme for Highway Structures. Stage 1 - Older Short Span Bridges and
Retaining Structures”: 1991 and Amendment No 1.
14. Department of Transport Technical Memorandum BD34/90 (DMRB 3.4) “Technical Requirements for the
Assessment and Strengthening Programme for Highway Structures. Stage 1 - Older Short Span Bridges and
Retaining Structures”
15. British Standards Institution BS5400: “Steel, Concrete and Composite Bridges, Part 4: Code of Practice for
Design of Concrete Bridges” 1990
16. Department of Transport Advice Note BA44/90 [DMRB 3.4] “The Use of BD44/90 for the Assessment of
Concrete Highway Bridges and Structures”, since updated to BA 44/96.
17. Scottish Office Roads Directorate Technical Memorandum SB6/88 “Loads for Highway Bridges” 1989
18. Department of Transport Technical memorandum BD24/92 (DMRB 1.3) “Design of Concrete Bridges. Use of
BS5400 part 4: 1990”

Kingston Bridge Approach Viaducts Assessment and Inspection Executive Introduction Document A
S100489 / 92AJG / 92CJG February 2007
Index
#
γmc · 22
γms · 23
A
articulation behaviour · 9, 10
articulation failure · 5, 18
articulation mode · 9, 10, 12, 13, 15, 2
As-Built · 10
As-Designed · 10
As-Proposed · 10
B
BA16/93
reference to · 45
BA44/90
reference to · 20, 22, 23, 1
BD21/93
reference to · 16, 21, 24, 25, 45, 1
BD24/92
reference to · 24
BD34/90
reference to · 16, 17, 20, 45, 1
BD37/88
reference to · 9, 24, 1
BD44/90
reference to · 16, 20, 22, 23, 45, 1
BD46/92
reference to · 45
BD50/92
reference to · 45
BD50/93
reference to · 15, 1
BD54/93
reference to · 15, 45, 1
bearings · 12, 15, 3
blemishing · 15
Bothwell Street Off Ramp · 11
Bridge Inspection Guide
reference to · 14, 3, 1
bridge management · 18, 20, 26
Brief
original · 4, 9, 14, 16, 45, 1
BS5400
reference to · 20, 21, 24, 1
C
Cantilever spans · 27
Capcis · 46
CCTV · 15
cellular structures · 22, 24
code X · 31
Codes and Values · 18
columns · 9, 11, 14, 15, 26, 28, 38, 41, 2, 4
verticality · 9, 15
Combination 1 · 21, 24
Combination 3 · 21, 24
Combination 4 · 21
condition factor · 23. See Fc
construction joint · 30, 36

Kingston Bridge Approach Viaducts Assessment and Inspection Executive Introduction Document A
S100489 / 92AJG / 92CJG February 2007
construction sequence · 9, 22
corrosion
chloride induced · 12, 13, 15, 20, 21, 22, 30, 33, 36, 39,
3
concrete disruption · 15
cost estimates · 5
cracking · 12, 15, 20, 21, 24, 26, 28, 29, 30, 33, 36, 39, 45,
3
crack widths · 20, 21, 22, 30, 33, 36, 39, 45
D
database · 18
deflections · 11
Department of Transport · 9, 14, 15, 16, 18, 20, 1
displacement rate · 9
DMRB 3.1
reference to · 15, 45, 1
DMRB 3.4
reference to · 16, 17, 20, 45, 1
Document A
reference to · 4, 16, 18
Document B
reference to · 4, 15, 18, 26
Document C
reference to · 4, 18, 26
Document D
reference to · 5
dowels · 10, 35, 37, 3
drainage · 15
durability · 17, 20, 21
E
elastic centres · See null point
Element Group · 26, 28, 32, 35, 38, 41, 43
expansion joints · 13
F
first pass · See Phase I
flexural tensile limitations · 21
foundations · 9
G
GB Geotechnics · 46
global analysis · 10
H
half joint · 9, 10, 12, 13, 14, 18, 22, 23, 30, 31, 33, 34, 35,
36, 37, 3, 4
Half Joint Condition Survey · 12
half joints
elimination of · 18
NC16 · 12, 46
ND7 · 12, 46
ND8 · 12, 46
NE12 · 12, 46
NE7 · 12, 46
NF10 · 11, 12, 46
NF12 · 14
NF14 · 11, 12, 14, 46
SA21 · 12, 46
I
Inspectahire · 46
Inspection for Assessment · 14, 15, 17, 18, 21, 22, 23, 29,
30, 45, 46
interaction · 9, 10, 23
intrusive testing · 14
J
jacking · 9, 10, 23

Kingston Bridge Approach Viaducts Assessment and Inspection Executive Introduction Document A
S100489 / 92AJG / 92CJG February 2007
L
lane width reduction factors, β · 24
leakage · 13, 30, 33, 36, 39
legal action · 5
load combinations · 9, 10, 21
load effects · 9
load restrictions · 21
load test · 11
loaded lane · 24
loaded length · 24
loads
Assessment Live Loading · 17, 24, 25
braking and traction · 9, 2
HA loading · 24
HA UDL · 24
HB loading · 17, 22, 24
live loading · 10
temperature difference · 21, 24
temperature range · 9, 10
location specific · 18, 22
loss of reinforcement · 30, 33, 36, 39
M
M8 motorway · 4, 14
material srengths
worst credible strength · 22, 23
material strengths
characteristic · 17
concrete · 12
cube strength · 22
fcu · 23
fy · 17, 20, 23, 45
tensile strength of concrete · 21
model
calibration · 9, 15
modelling · 9
moment of resistance · 20
monitoring · 15, 21
N
Non-Linear Analysis
Re-assessment using · 8, 11
north comb joint · 9, 10, 15, 18
notional lanes · 24
null point · 9
O
objectives · 5, 2
original design · 5, 10
P
partial safety factor · 21, 22
P-force · 9, 10, 15
Phase I · 15, 17, 18, 21, 22, 23, 45
Phase II · 15, 17
pile caps · 41, 42
Pile caps · 27, 41
Piles · 27, 43, 44
post-tensioning system · 14, 17, 20, 21, 3
losses · 23
tendon forces · 23
prestress classification · 17
Class 1 · 17, 20, 21
Class 3 · 20, 21
principal inspection · 4, 11, 13, 14, 15, 29, 46, 2, 3, 1
priority · 18, 20, 3
progress photographs
original · 9

Kingston Bridge Approach Viaducts Assessment and Inspection Executive Introduction Document A
S100489 / 92AJG / 92CJG February 2007
project chronology · 19
R
reinforcement
condition · 12
depth · 15
position · 12
repair · 5, 17
Report N1
reference to · 9, 10, 11, 12, 17, 18, 22, 23, 24
Report N2
reference to · 12, 14, 22
Report N3
reference to · 13, 14, 15
Report N4
reference to · 11, 16, 17, 20, 31, 34
Report N5
reference to · 11, 17
Report N6
reference to · 11, 13, 15, 17, 18, 21
Report N7
reference to · 17, 18
report relationships · 5
Report S1
reference to · 9, 24
Report S2
reference to · 13, 14
Report S3
reference to · 16
report terminology · 4
S
Saynors · 46
SB1/78
reference to · 14, 16, 45, 2, 1
SB1/91
reference to · 16, 17, 20, 45, 3, 1
SB2/91
reference to · 16, 20, 22, 45, 3, 1
SB3/84
reference to · 16, 21, 24, 25, 45, 3, 1
Scottish Office Roads Directorate · 14, 16, 24, 1
Serviceability Limit State · 17, 20, 26
Site Services · 46
SLS · 17, 20, 21, 22, 27, 28, 29, 31, 43, 45
spalling · 30, 33, 36, 39
Special Drainage Report
reference to · 15
staining · 15, 30, 33, 36, 39
Stanger Consultants · 46
Stobcross Street On Ramp · 11, 14, 17
Strainstall · 46
strengthening · 5, 10, 11, 17, 18, 20
structural assessment · 4, 12, 16, 46, 2, 3
suspended spans · 22, 32, 35
sway movement · 10
T
temperature displacements · 10
tendons · 15, 17, 20, 30, 36, 37
tensile stress · 21
test panel · 15
test techniques
borescope · 15
carbonation · 15
half cell potential · 15
the net compressive force · See P-force
traffic lanes · 24

Kingston Bridge Approach Viaducts Assessment and Inspection Executive Introduction Document A
S100489 / 92AJG / 92CJG February 2007
U
ULS · See Ultimate Limit State
Ultimate Limit State · 20, 22, 26
W
weighting · 20