Embed Size (px)
Citation preview
GLIMPSEI - v2.0 Data Release
by Marilyn R. Meade, Barbara A. Whitney, Brian L. Babler, Remy Indebetouw, Steve
Bracker, Martin Cohen, Tom Robitaille, Bob Benjamin, Mark Wolfire, Ed Churchwell
Version 2.0
May 11, 2007
Contents
1 Quick Start 2
2 Overview 2
2.1 GLIMPSEI Survey and Data Products . . . . . . . . . . . . . . . . . . . . . . . . . . 2
2.2 v1.0 Data Release . . . . . . . . . . . . . . . . . . . . . . . . . . . . . . . . . . . . . 4
2.3 v2.0 Data Release . . . . . . . . . . . . . . . . . . . . . . . . . . . . . . . . . . . . . 4
2.4 v3.0 Data Products - Background Matched Mosaic Images . . . . . . . . . . . . . . . 6
2.5 Complementary Datasets . . . . . . . . . . . . . . . . . . . . . . . . . . . . . . . . . 7
3 Pipeline Processing 7
3.1 Image Processing, Photometry, and Bandmerging . . . . . . . . . . . . . . . . . . . . 7
3.2 Source Selection for Catalog and Archive . . . . . . . . . . . . . . . . . . . . . . . . 9
4 Source List Validation 10
4.1 False sources/Asteroids . . . . . . . . . . . . . . . . . . . . . . . . . . . . . . . . . . 10
4.2 Astrometric Accuracy . . . . . . . . . . . . . . . . . . . . . . . . . . . . . . . . . . . 11
4.3 Photometric Accuracy . . . . . . . . . . . . . . . . . . . . . . . . . . . . . . . . . . . 11
4.4 Color-Color and Color-Magnitude Plots . . . . . . . . . . . . . . . . . . . . . . . . . 14
4.5 Other checks . . . . . . . . . . . . . . . . . . . . . . . . . . . . . . . . . . . . . . . . 14
1
5 Data Products Description 14
5.1 Catalog and Archive Fields and Flags . . . . . . . . . . . . . . . . . . . . . . . . . . 14
5.2 GLIMPSEI Image Atlas . . . . . . . . . . . . . . . . . . . . . . . . . . . . . . . . . . 20
5.3 Web Infrared Tool Shed . . . . . . . . . . . . . . . . . . . . . . . . . . . . . . . . . . 20
5.4 YSO Grid and Fitter . . . . . . . . . . . . . . . . . . . . . . . . . . . . . . . . . . . . 21
5.5 Complementary Datasets . . . . . . . . . . . . . . . . . . . . . . . . . . . . . . . . . 23
6 Product Formats 24
6.1 Catalog and Archive . . . . . . . . . . . . . . . . . . . . . . . . . . . . . . . . . . . . 24
6.2 GLIMPSEI Image Atlas . . . . . . . . . . . . . . . . . . . . . . . . . . . . . . . . . . 26
6.3 Web Infrared Tool Shed . . . . . . . . . . . . . . . . . . . . . . . . . . . . . . . . . . 29
6.4 YSO Grid and Fitter . . . . . . . . . . . . . . . . . . . . . . . . . . . . . . . . . . . . 29
7 APPENDIX A - Improvements/Fixes in the v2.0 Data Products 30
8 APPENDIX B - Source Quality Flag Bit Descriptions 33
1 Quick Start
GLIMPSEI and GLIMPSEII data products are available at the Spitzer Science Center (SSC)(see http://ssc.spitzer.caltech.edu/legacy/glimpsehistory.html) and the Infrared Science Archive(IRSA) (e.g. http://irsa.ipac.caltech.edu/data/SPITZER/). For scientists who want to immedi-ately use the GLIMPSEI data, §2.1 briefly describes the survey and data products; and §6 de-scribes the source list entries and the images. The Web Infrared Tool Shed (WITS) is located athttp://dustem.astro.umd.edu. The Young Stellar Objects (YSO) Grid and Fitter can be found athttp://caravan.astro.wisc.edu/protostars/.
2 Overview
2.1 GLIMPSEI Survey and Data Products
The Galactic Legacy Infrared Mid-Plane Survey Extraordinaire (GLIMPSEI)1, using the SpitzerSpace Telescope (SST) (Werner et al. 2004) Infrared Array Camera (IRAC) (Fazio et al. 2004)surveyed approximately 220 square degrees of the Galactic plane, covering a latitude range of ±1◦,and a longitude range of |l| =10◦−65◦, plus the Observation Strategy Validation (OSV) region atl=284◦. IRAC has four bands, centered at approximately 3.6, 4.5, 5.8 and 8.0 µm respectively. Wewill refer to them as bands 1 - 4 in this document. The observations consisted of two 1.2 secondintegrations at each position, for a total of over 77,000 pointings and ∼310,000 IRAC frames in 400hours total survey time. The survey is producing approximately 266 Giga Bytes (GB) of data in
1Although originally known as GLIMPSE, we will use the acronym GLIMPSEI to avoid confusion between it,GLIMPSEII and GLIMPSE-3D
2
the form of a point source Catalog, a point source Archive, and mosaicked images. See Benjaminet al. (2003) and the GLIMPSE web site (www.astro.wisc.edu/glimpse/) for more description ofthe GLIMPSEI project.
This document describes the data products from the GLIMPSEI Survey, specifically the v2.0 dataproducts delivered in early 2007. The organization of this document is as follows: §2 gives anoverview of the GLIMPSEI survey and data products, §3 briefly describes the data processing; §4discusses the validation of the source lists; §5 provides a detailed description of the data products;and §6 describes the format. Appendix A discusses the differences between the GLIMPSEI v2.0 andv1.0 data products, and Appendix B gives details about the Source Quality Flag. This documentcontains numerous acronyms, a glossary of which is given at the end.
The GLIMPSEI enhanced data products consist of a highly reliable Point Source Catalog (GLMIC),a more complete Point Source Archive (GLMIA), and mosaic images covering the survey area. Alsoprovided to the astronomical community are web tools for modeling infrared data. The enhanceddata products are:
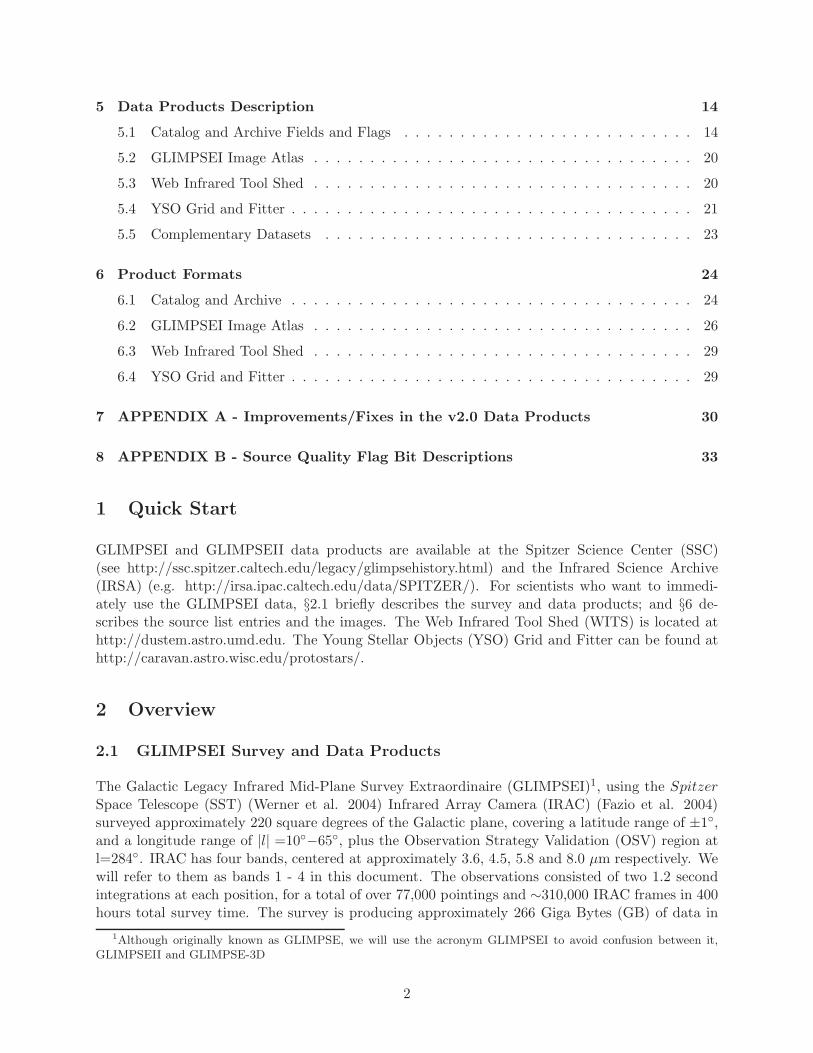
1. The GLIMPSEI Catalog (GLMIC, or the “Catalog”), consisting of point sources whose selec-tion criteria (§3.2) are determined by the requirement that the reliability be ≥99.5%. Figure1 shows the number of GLIMPSEI (and GLIMPSEII) Catalog sources as a function of magni-tude for each IRAC band and various longitudes. This figure shows there is a range of limitingmagnitudes depending on whether the source is in a sparsely populated or low backgroundregion or in a region of high diffuse background or high source density. The photometricuncertainty is typically < 0.2 mag. For each IRAC band the Catalog provides fluxes (withuncertainties), positions (with uncertainties), the areal density of local point sources, the lo-cal sky brightness, and a flag that provides information on source quality and any anomaliespresent in the data. Sources were bandmerged with the Two Micron All Sky Survey PointSource Catalog (2MASS; Skrutskie et al. 2006). 2MASS provides images at similar reso-lution to IRAC, in the J (1.25 µm), H (1.65 µm), and Ks (2.17 µm) bands. The 2MASSinformation we include from the 2MASS PSC is designation, counter (a unique identificationnumber), fluxes, signal-to-noise, and a limited source quality flag. Users should refer backto the 2MASS Point Source Catalog for the complete 2MASS information about the source.The GLIMPSEI Catalog format is ASCII, using the IPAC Tables convention(irsa.ipac.caltech.edu/applications/DDGEN/Doc/ipac tbl.html). The v2.0 Catalog occupies∼21 GB of storage, and contains ∼ 31 million sources.
2. The GLIMPSEI Archive (GLMIA or the “Archive”), consisting of point sources with a signal-to-noise > 5 in at least one band and less stringent selection critera than the Catalog (§3.2).The photometric uncertainty is typically < 0.3 mag. The information provided is in the sameformat as the Catalog. The number of GLIMPSEI v2.0 Archive sources as a function ofmagnitude for each IRAC band in various longitude regions (with differing background levelsand source density) is shown in Figure 2. The Archive occupies ∼ 34 GB of storage, andcontains about 49 million sources. The GLIMPSEI Catalog is a subset of the Archive, butnote that the entries for a particular source might not be the same due to additional nullingof magnitudes in the Catalog because of the more stringent requirements (§3.2).
3. The GLIMPSEI Image Atlas. Mosaicked Images for each band, each covering 1.1◦×0.8◦. 1344of these 32-bit IEEE floating point single extension FITS formatted images cover the entiresurvey area. These images, in units of surface brightness MJy/sr, occupy ∼170 GB of diskspace, with a pixel size of 0.6′′ . Mosaics of each band are made for larger 3.1◦×2.4◦ areas,
3
with a pixel size of 1.2′′ . There are 164 of these 3.1◦×2.4◦ mosaics, totalling ∼ 42 GB. Alsoincluded are quicklook 3-color jpeg images of the same size as the FITS images.
4. The Web Infrared Tool Shed (WITS), a web interface to a collection of models of IR spectraof dusty envelopes and photodissociation regions (PDRs), updated for IRAC and MIPS bandpasses.
5. The YSO Model Grid and Fitter, a web-based home of a large grid of YSO model spectralenergy distributions (SEDs). To date, 20073 YSO radiation transfer models of YSOs, each atten viewing angles, spanning a large range of evolutionary stages and stellar masses have beencomputed. The model grid browser allows users to examine SED variations as a function of arange of physical parameters. The fitting tool will fit input SED data from the grid of modelSEDs.
GLIMPSEI source lists and mosaics are served by the SSC (see http://ssc.spitzer.caltech.edu/legacy/)and IRSA (http://irsa.ipac.caltech.edu/data/SPITZER/). The Web Infrared Tool Shed is locatedat the University of Maryland (http://dustem.astro.umd.edu) and the YSO Grid and Fitter isserved by the University of Wisconsin (http://caravan.astro.wisc.edu/protostars/).
2.2 v1.0 Data Release
v1.0 source lists for the entire GLIMPSEI survey region derived from data from SSC pipelineprocessing versions S10.5 and earlier were delivered to the SSC in April 2005. Image delivery wascompleted in August 2006. See the GLIMPSEI Data Products Description v1.5(http://www.astro.wisc.edu/glimpse/docs.html) for more information about the v1.0 data.www.astro.wisc.edu/glimpse/glimpsedata.html gives the links to the location of the GLIMPSEIv1.0 data products at the SSC.
2.3 v2.0 Data Release
The v2.0 data products consist of point source Catalogs and Archives and mosaic images for theentire survey region. The v2.0 data products incorporate improvements in the SSC processing andthe Wisconsin IRAC pipeline and include small amounts of new data taken to fill gaps in surveycoverage. As in the v1.0 processing, photometry is performed on individual IRAC frames using amodified version of DAOPHOT (Stetson 1987) and combined in the bandmerger stage to producethe source lists. For the v2.0 data release, we are also providing 2MASS fluxes with the IRACdata, when available. We don’t provide 2MASS sources that lack an IRAC counterpart. We didnot attempt to match instrumental background variations between the images during the mosaicstage but plan to for the v3.0 mosaics.
Our v2.0 processing uses SSC pipeline processing version S13.2 (corrected for jailbar) and later,which has improved pointing refinement to 2MASS positions and a new flux calibration as discussedin Reach et al. 2005.
The Wisconsin IRAC pipeline enhancements for the v2.0 processing include: muxbleed correction;better banding correction for band 3; more information included in the source quality flag; com-bining of sources within 2′′ in the in-band and cross-band merging (to lessen flux sharing betweenclose sources); photometric correction applied (a function of position of the source in the frame);and a close source flag implemented (set if a nearby Archive source is within 3′′ ).
4
Figure 1: GLIMPSEI and GLIMPSEII Catalog source counts versus magnitude. GLIMPSEI Ob-servation Strategy Validation (OSV) data (galactic longitude approximately l=284◦) is plotted inthe solid black line. 1 degree of GLIMPSEI data from |l| = 55.5◦ is plotted in the solid blue line, 1degree of GLIMPSEI data from |l| = 40.5◦ is plotted in the solid green line, 1 degree of GLIMPSEIdata from |l| = 25.5◦ is plotted in the solid yellow line, 1 degree of GLIMPSEII data from |l| =9.5◦ is plotted in the solid red line, and ± 1 degree of GLIMPSEII data at l = 0◦ is plotted in thedashed red line. This plot shows both the increase in source counts as one approaches the Galacticcenter as well as the falloff of completeness as one approaches the Galactic center.
Appendix A gives more details about the differences between the v2.0 and v1.0 processing of theGLIMPSEI data products.
5
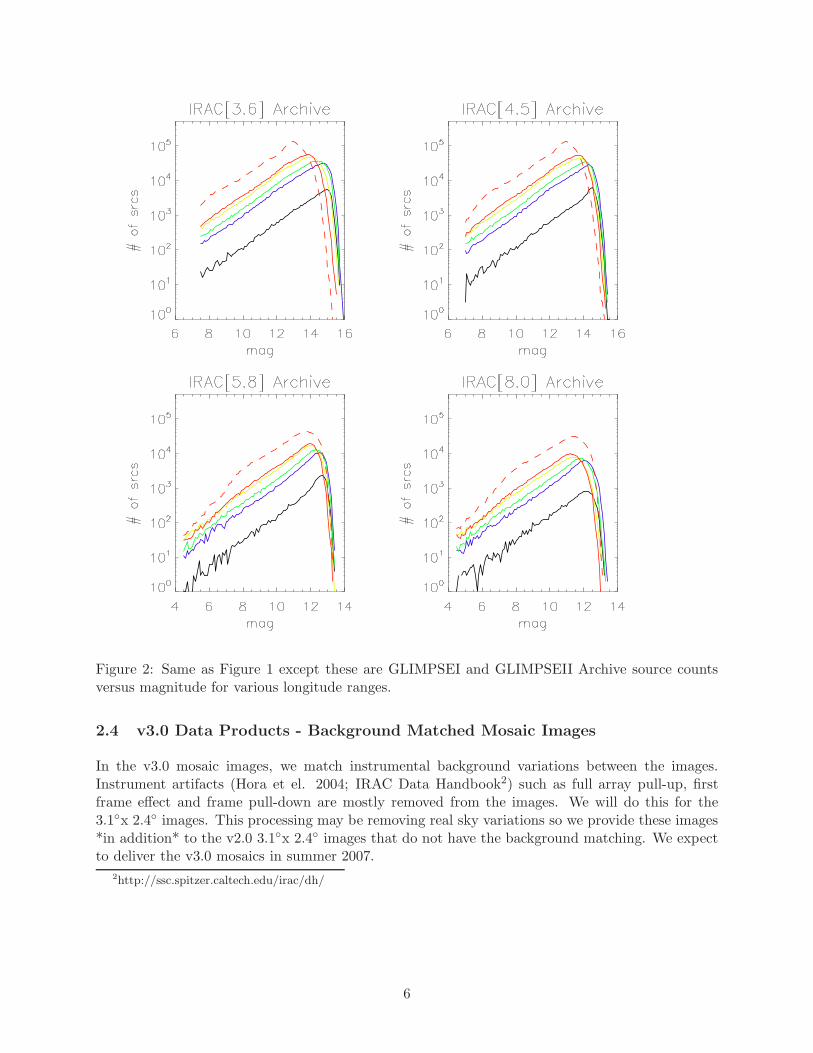
Figure 2: Same as Figure 1 except these are GLIMPSEI and GLIMPSEII Archive source countsversus magnitude for various longitude ranges.
2.4 v3.0 Data Products - Background Matched Mosaic Images
In the v3.0 mosaic images, we match instrumental background variations between the images.Instrument artifacts (Hora et el. 2004; IRAC Data Handbook2) such as full array pull-up, firstframe effect and frame pull-down are mostly removed from the images. We will do this for the3.1◦x 2.4◦ images. This processing may be removing real sky variations so we provide these images*in addition* to the v2.0 3.1◦x 2.4◦ images that do not have the background matching. We expectto deliver the v3.0 mosaics in summer 2007.
2http://ssc.spitzer.caltech.edu/irac/dh/
6
2.5 Complementary Datasets
Numerous complementary datasets will increase the scientific impact of the GLIMPSE survey.2MASS provides imaging at similar resolution to IRAC, in the J (1.25 µm), H (1.65 µm), and Ks
(2.17 µm) bands. The Midcourse Space Experiment (MSX) (Price et al. 2001) also observed theGalactic plane in several mid-IR wavebands (from 4.2 to 26 µm) with 18′′ resolution at 8 µm. Thefollowing additional datasets can be accessed by the astronomical community through links fromthe GLIMPSE web site (www.astro.wisc.edu/glimpse/complementary.html):
1. Arecibo and Green Bank Telescope (GBT) surveys of IR-color selected H II Regions in theGLIMPSE survey region: a dataset that resolves distance ambiguities to massive star forma-tion regions. This dataset includes > 100 objects and can be found on the GLIMPSE website.
2. Milky Way Galactic Ring Survey (GRS) (www.bu.edu/galacticring), a Boston University andFive College Radio Astronomy Observatory collaboration, is a large-scale 13CO line surveyof the inner Galaxy between longitudes 18◦ and 52◦.
3. The International Galactic Plane Survey (www.ras.ucalgary.ca/IGPS) is an H I 21-cm surveyof the disk of the Milky Way. This survey provides data cubes of the H I spectral line emissionwith resolution of 1′ and one km/s over the entire area of the GLIMPSE survey.
4. The Coordinated Radio and Infrared Survey for High-Mass Star Formation (CORNISH)(www.ast.leeds.ac.uk/Cornish/index.html) Very Large Array (VLA) 6 cm continuum surveyof much of the GLIMPSE area is well underway. CORNISH has a spatial resolution of ∼1′′
and a sensitivity of ∼1 mJy, very similar to that of IRAC.
3 Pipeline Processing
3.1 Image Processing, Photometry, and Bandmerging
The GLIMPSE Pipeline Description document (GPD)3 will describe in detail the GLIMPSE(GLIMPSEI, GLIMPSEII, GLIMPSE-3D) pipeline processing, including photometry and band-merging to produce source lists. We note here some steps that are relevant to the final dataproducts. Image processing steps for photometry include masking hot, dead, and missing datapixels (using SSC supplied flags). Pixels associated with saturated stars are masked using an al-gorithm generated by GLIMPSE; this algorithm finds most of the saturated stars. Pixels withina PSF-shaped region (with a 24-pixel radius) of a saturated source are flagged. Several imageartifacts (described in Hora et al (2004) and the IRAC Data Handbook) are corrected for in theGLIMPSE pipeline. We correct for column pulldown4 in bands 1 & 2, using an algorithm writtenby Lexi Moustakas (GOODS team) and modified by GLIMPSE to handle variable backgrounds.We correct for muxbleed5 in bands 1 & 2 using a modified version of the IRAC Bright Source
3will be found at http://www.astro.wisc.edu/glimpse/docs.html4Column pulldown is a reduction in intensity of the columns in which bright sources are found in Bands 1 and 2.
See Spitzer Observer’s Manual (SOM) at http://ssc.spitzer.caltech.edu/documents/som/.5The multiplexer bleed effect is a series of bright pixels along the horizontal direction on both sides of a bright
source in Bands 1 and 2
7

Artifact Corrector6. We correct for banding7 in band 3 by using an algorithm fitting each incidenceof banding individually and band 4 using an exponential function.
We use a modified version of DAOPHOT (Stetson 1987) as our point source extractor, perform-ing Point Spread Function (PSF) fitting on individual IRAC frames. We repeat the photometrycalculations on the residual (point-source removed) images (referred to as “tweaking” in Table 4),which has been shown to improve the flux estimates in complex background regions substantially.Cosmic rays are removed from the source list based on an algorithm that operates on the residualimages. More details about the photometry steps can be found athttp://www.astro.wisc.edu/glimpse/glimpse photometry v1.0.pdf. The array-location-dependentphotometric corrections8 were applied to the v2.0 source lists.
Prior to the bandmerge stage, we cull all IRAC sources with signal-to-noise less than 3. As aresult, no IRAC sources in the Catalog or Archive will have signal-to-noise less than 3 in any band.We use the SSC-supplied bandmerger9 (modified by the GLIMPSE team) in two stages, first tocombine all detections of the same source in the same band (in-band merge), and then to cross-correlate detections in different bands (cross-band merge). Signal-to-noise and flux information isused as well as position during the in-band merge, but only position is used for the cross-bandmerge (to avoid any systematic effects dependent on source color). Fluxes of sources within 2′′ inthe IRAC frame are combined together or “lumped” into one flux during the in-band merge tolessen flux splitting. Cross-band lumping is done with a 2′′ radius. Position migration can occurin the bandmerging process which results in a small number of sources that have sources within 2′′
of it. Sources from the 2MASS All-Sky Point Source Catalog are merged with the IRAC fluxes inthe cross-band merge stage only if it has a Ks detection.
Image processing for the mosaic image products include the column pulldown, muxbleed and band-ing corrections mentioned above. Hot, dead, and missing pixels are masked. The SSC mosaicerMOPEX10 is run to obtain the outlier mask (rmask; generally due to cosmic rays). Both thedual outlier bit and the temporal bit of the rmask are masked during the mosaicing. Stray lightfrom bright sources outside the field of view scatters onto the detector and can appear in the im-ages. To remove them, we use the SSC IRAC Stray Light Masker11 modified to use the IRACmagnitudes from the GLIMPSEI source lists to predict the positions of the stray light. It cre-ates a mask (smask) for each input IRAC frame. About 90% of the stray light areas are foundby the SSC Stray Light Masker. Most of the remaining stray light areas are removed by visualinspection. Artifacts that have only single-frame coverage (outside the nominal latitude range of±1◦) are left in the mosaic. If there are areas of overlapping image artifacts that cause a gapin coverage, we do not mask that area. In bands 3 and 4 stray light areas can repeat (partic-ularly along rows) and remain in the images because masking them would cause gaps in cover-age. See SSC’s IRAC image features web site12 and the IRAC Data Handbook for more infor-mation about the detector artifacts. See also the GLIMPSE IRAC Instrument Artifact Gallery(http://www.astro.wisc.edu/glimpse/glimpse artifact gallery v1.0.pdf) which gives examples of ar-tifacts in the GLIMPSEI images that are corrected for and examples of artifacts that remain in the
6http://spider.ipac.caltech.edu/staff/carey/irac artifacts7Banding refers to streaks that appear in the rows and columns radiating away from bright sources in Bands 3
and 4. See the SOM.8http://ssc.spitzer.caltech.edu/irac/locationcolor/9http://ssc.spitzer.caltech.edu/postbcd/bandmerge.html
10http://ssc.spitzer.caltech.edu/postbcd/11http://ssc.spitzer.caltech.edu/irac/straylight/12http://ssc.spitzer.caltech.edu/irac/features.html
8
GLIMPSEI images. We use the Montage13 package v2.2 to mosaic and project to Galactic coordi-nates. We use Montage’s background correction algorithm14, with the “level” option, to producethe background matched v3.0 mosaics.
3.2 Source Selection for Catalog and Archive
Now we describe the selection criteria for the Catalog and Archive once photometry and bandmerg-ing have been completed.
CatalogTo satisfy the requirement that the Catalog be ≥99.5% reliable, it was determined from simulateddata and study of the Observation Strategy Validation (OSV) data that a source must be detectedat least twice in one band and at least once in an adjacent band for the general GLIMPSEIobserving strategy of two visits on the sky, described in detail in the GLIMPSE Quality Assurance(GQA) document (http://www.astro.wisc.edu/glimpse/GQA-master.pdf). We call this the “2+1”criterion. The 2MASS Ks magnitude, when present, is used for the “2+1” criterion for IRAC band1. To allow for the more general case of M detections out of N possible observations, we requirethat M/N ≥ 0.6 in one band and M/N ≥ 0.4 in an adjacent band.
In the two bands that satisfy the 2+1 criterion, only sources with flux greater than 0.6 mJy (<14.2mag), 0.4 mJy (<14.1 mag), 2 mJy (<11.9 mag), and 10 mJy (<9.5 mag) in bands 1 through 4,respectively, are allowed in the Catalog. Similarly, the bright limit flux is 439 mJy (7 mag), 450mJy (6.5 mag), 2930 mJy (4 mag) and 1590 mJy (4 mag) for bands 1 through 4, respectively, toremove sources at nonlinear response levels. (See §5.1 for the zeropoints used for converting fromflux to magnitude.) The signal-to-noise in the band with the two detections satisfying the 2+1criterion is required to be greater than 5. Sources with hot or dead pixels within 3 pixels of sourcecenter, those in wings of saturated stars, and those within 3 pixels of the frame edge are culledfrom the Catalog.
Once a source satisfies the 2+1 criterion, the requirements for the other 2 bands of the same sourceare less stringent. Flux values above the bright limit flux are nulled, but values below the low-limitflux are allowed. Signal-to-noise <5 (down to a lower limit of 3) is allowed. Bands with hot ordead pixels and in wings of saturated stars are nulled, but those within 3 pixels of the frame edgeare allowed.
Finally, sources are removed from the Catalog if there are Archive sources within 2′′ of the source,because we found that the neighboring source could influence the flux extraction for that source.
ArchiveRequirements for source selection in the Archive are less stringent than for the Catalog. Thereforethe Archive is less reliable than the Catalog but more complete. We require M/N ≥ 0.6 in oneband or M/N ≥ 0.4 in any two bands. For a typical source observed two times, this translates toa detection twice in one band or once in two bands. The 2MASS Ks magnitude is allowed in the“1+1” criterion. We require that the signal-to-noise be greater than 5 in the band or bands used
13http://montage.ipac.caltech.edu/;Montage is funded by the National Aeronautics and Space Administration’sEarth Science Technology Office, Computation Technologies Project, under Cooperative Agreement Number NCC5-626 between NASA and the California Institute of Technology. Montage is maintained by the NASA/IPAC InfraredScience Archive.
14http://montage.ipac.caltech.edu/docs/algorithms.html#background
9
for source selection. The lower limit of the signal-to-noise for all bands is 3. Sources are removedfrom the Archive if there are neighboring Archive sources within 0.5′′ of the source. There are nofurther culls, leaving it to the user to cull or null based on values of the fluxes and flags (describedin §5.1).
4 Source List Validation
We summarize here analysis used to validate the Catalog and Archive point source lists. TheGLIMPSE Quality Assurance document describes the GLIMPSEI v1.0 data validation in moredetail. Much of it also applies to the GLIMPSEI v2.0 data.
4.1 False sources/Asteroids
Verification of our source selection criteria (§3.2) was done with a Reliability study of the GLIMPSEIOSV data. See http://www.astro.wisc.edu/glimpse/cr manuscript.pdf (Reliability and Complete-ness for the GLIMPSE Survey), http://www.astro.wisc.edu/glimpse/val.20040130.pdf (ObservationStrategy Validation Report), and http://www.astro.wisc.edu/glimpse/addendum4.pdf (Addendumto the Validation Report). One cause of false sources in the source lists is imperfect muxbleedcorrection leaving faint point-like sources every four pixels along a row from a bright source inbands 1 and 2. We estimate about 90% of the muxbleed has been corrected by the Bright SourceArtifact Corrector but the muxbleed remaining in the images can cause false sources. Most of themuxbleed sources have signal-to-noise less than 5 and do not make it into the source lists. Veryfew false sources due to muxbleed are found in high background areas (e.g. in the inner Galaxy).We estimate that < 0.04% of the Catalog sources may be due to muxbleed. We estimate that <0.2% of the Archive sources may be due to muxbleed because of our less stringent selection crite-ria. The false detections due to muxbleed will be in only bands 1 and 2. An additional cause offalse detections in the Archive occurs in regions surrounding saturated stars where the GLIMPSEsource extractor may find false sources in the wings of the PSF. These sources are culled from theCatalog but only flagged in the Archive. Our source selection criteria remove the vast majority ofother potential false detections, such as cosmic rays and stray light. In addition, our photometryiteration on residual images reduces false source detections in variable backgrounds caused by bothreal sky variations as well as instrumental artifacts such as banding, stray light, muxbleed, andcolumn pulldown.
Asteroid detection in the GLIMPSEI source lists will generally be limited to the Archive. Dueto the observation strategy and source list criteria, nearly all asteroids should be culled from theCatalog. This is a result of the 2+1 criteria which requires detections in adjacent IRAC bands.Since the IRAC detector observes simultaneously bands 1 and 3 in one location on the sky andbands 2 and 4 at an offset location on the sky, asteroids will generally be limited to having onlytwo bands of data which are not adjacent. In the case that an asteroid is observed in a frame forbands 1 and 3, it will not be imaged in bands 2 and 4 (since those bands are positionally offsetfrom bands 1 and 3) until the AOR has progressed long enough to have positioned the IRAC band2 and 4 detectors at the same area of sky. This is usually a sufficiently long period of time that theasteroid has moved far enough from its earlier position that the asteroid’s band 2 and 4 detectionsare at a unique position compared to its bands 1 and 3 position. Thus, Catalog criteria of 2+1fails. However, the less stringent 1+1 Archive criteria can still be met and asteroids are usually
10
2 unique entries in the Archive: one entry having band 1 and 3 data and the second entry (at aslightly different position) with band 2 and 4 data.
4.2 Astrometric Accuracy
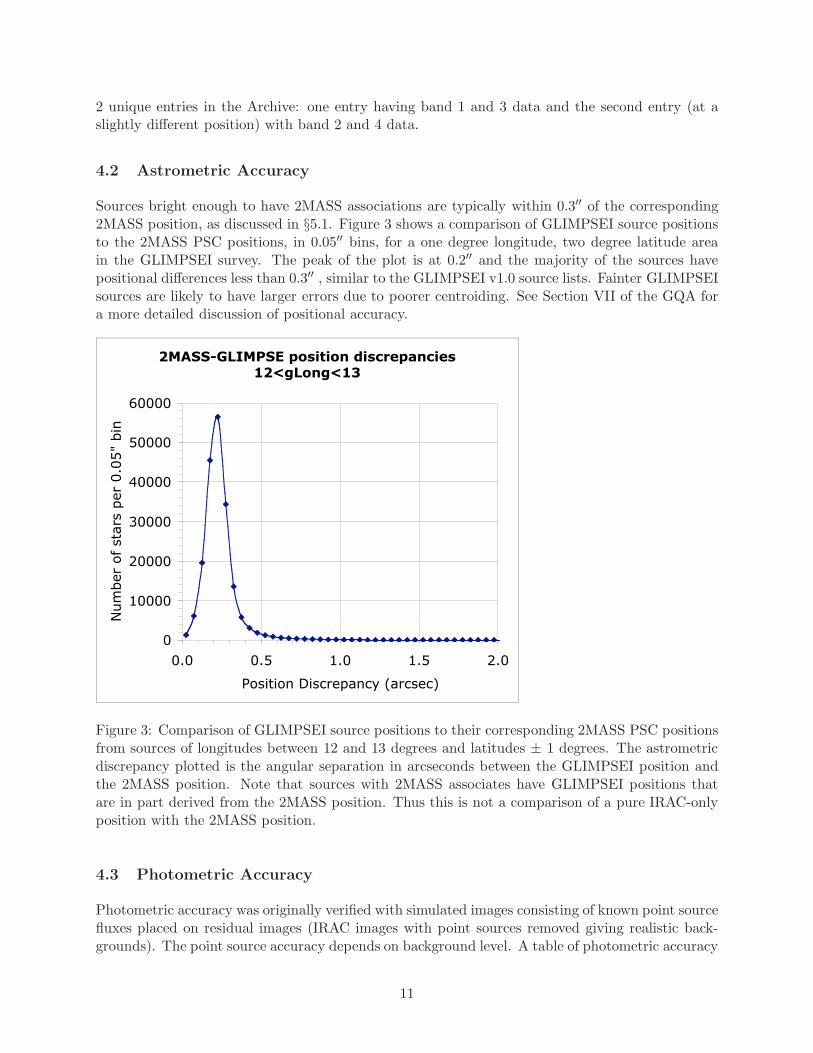
Sources bright enough to have 2MASS associations are typically within 0.3′′ of the corresponding2MASS position, as discussed in §5.1. Figure 3 shows a comparison of GLIMPSEI source positionsto the 2MASS PSC positions, in 0.05′′ bins, for a one degree longitude, two degree latitude areain the GLIMPSEI survey. The peak of the plot is at 0.2′′ and the majority of the sources havepositional differences less than 0.3′′ , similar to the GLIMPSEI v1.0 source lists. Fainter GLIMPSEIsources are likely to have larger errors due to poorer centroiding. See Section VII of the GQA fora more detailed discussion of positional accuracy.
Figure 3: Comparison of GLIMPSEI source positions to their corresponding 2MASS PSC positionsfrom sources of longitudes between 12 and 13 degrees and latitudes ± 1 degrees. The astrometricdiscrepancy plotted is the angular separation in arcseconds between the GLIMPSEI position andthe 2MASS position. Note that sources with 2MASS associates have GLIMPSEI positions thatare in part derived from the 2MASS position. Thus this is not a comparison of a pure IRAC-onlyposition with the 2MASS position.
4.3 Photometric Accuracy
Photometric accuracy was originally verified with simulated images consisting of known point sourcefluxes placed on residual images (IRAC images with point sources removed giving realistic back-grounds). The point source accuracy depends on background level. A table of photometric accuracy
11
as a function of background level is given in the Addendum to the GLIMPSE Validation Report(http://www.astro.wisc.edu/glimpse/addendum4.pdf). For average background levels, the photo-metric accuracy is ≤ 0.2m at magnitudes brighter than ∼ 14,∼ 12,∼ 10.5,∼ 9.0 for bands 1 - 4respectively.
Our goal was to achieve point source photometry accuracy of ≤0.2 mag. Table 1 shows a summaryof the fraction of sources in both the Catalog and Archive that achieve this level. Band 3 showsa higher percentage of sources with photometric accuracy >0.2 mag, probably due to its lowersensitivity. Band 2 shows a higher percentage of sources with photometric accuracy >0.2 magcompared to band 1, most likely due to our selection criteria (§3.2). For the Catalog, band 1 isalmost always the band with the “2” in our “2+1” criteria. The signal-to-noise for the band with2 detections is required to be greater than 5. Therefore a smaller percentage of band 1 sourceswith photometric accuracy >0.2 mag will be in the Catalog. Similarly, the Archive requires twodetections in any band. The two detections are often band 1 detections with the signal-to-noiserequired to be greater than 5.
Table 1. Photometric Accuracy of the GLIMPSEI Sources
Band (µm) [3.6] [4.5] [5.8] [8.0]
CatalogNo. with error >0.2 mag 246861 3546719 2917697 1069064Total number of entries 30985240 30476282 12377561 7309529% with errors >0.2 mag 0.8 11.6 23.6 14.6
ArchiveNo. with error >0.2 mag 1152849 10488841 3429636 1232235Total number of entries 48410563 40847634 13227218 7817077% with errors >0.2 mag 2.4 25.7 25.9 15.8
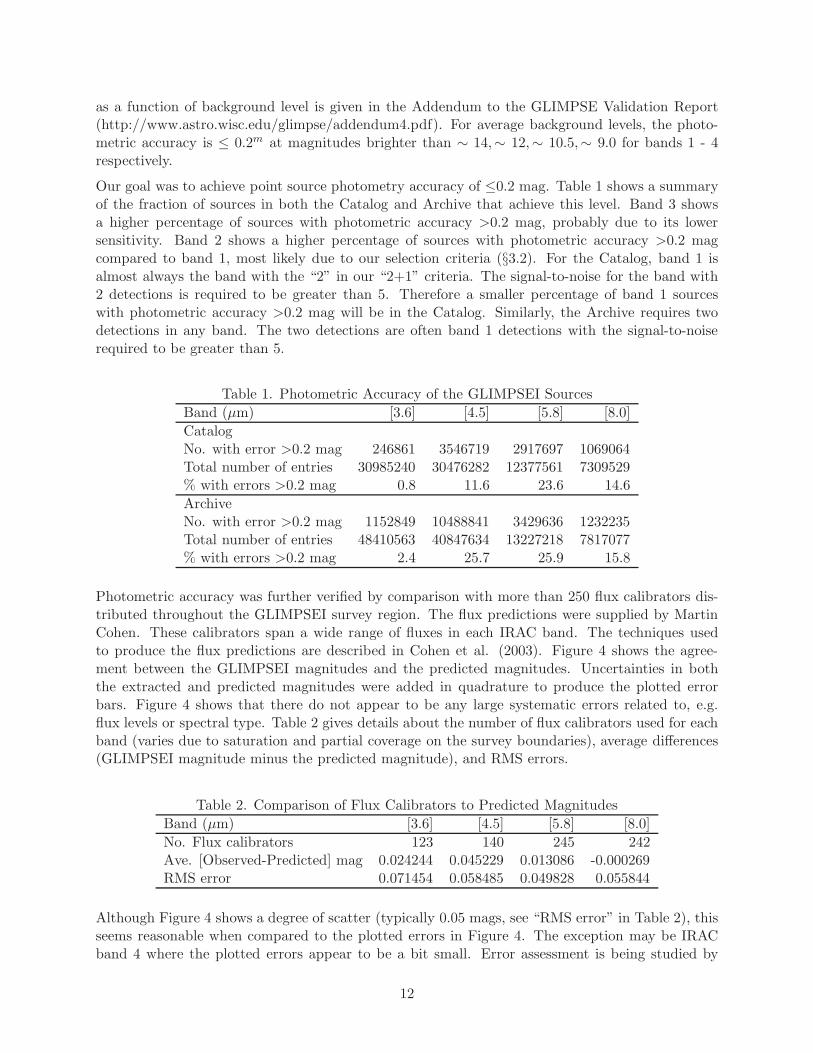
Photometric accuracy was further verified by comparison with more than 250 flux calibrators dis-tributed throughout the GLIMPSEI survey region. The flux predictions were supplied by MartinCohen. These calibrators span a wide range of fluxes in each IRAC band. The techniques usedto produce the flux predictions are described in Cohen et al. (2003). Figure 4 shows the agree-ment between the GLIMPSEI magnitudes and the predicted magnitudes. Uncertainties in boththe extracted and predicted magnitudes were added in quadrature to produce the plotted errorbars. Figure 4 shows that there do not appear to be any large systematic errors related to, e.g.flux levels or spectral type. Table 2 gives details about the number of flux calibrators used for eachband (varies due to saturation and partial coverage on the survey boundaries), average differences(GLIMPSEI magnitude minus the predicted magnitude), and RMS errors.
Table 2. Comparison of Flux Calibrators to Predicted Magnitudes
Band (µm) [3.6] [4.5] [5.8] [8.0]
No. Flux calibrators 123 140 245 242Ave. [Observed-Predicted] mag 0.024244 0.045229 0.013086 -0.000269RMS error 0.071454 0.058485 0.049828 0.055844
Although Figure 4 shows a degree of scatter (typically 0.05 mags, see “RMS error” in Table 2), thisseems reasonable when compared to the plotted errors in Figure 4. The exception may be IRACband 4 where the plotted errors appear to be a bit small. Error assessment is being studied by
12
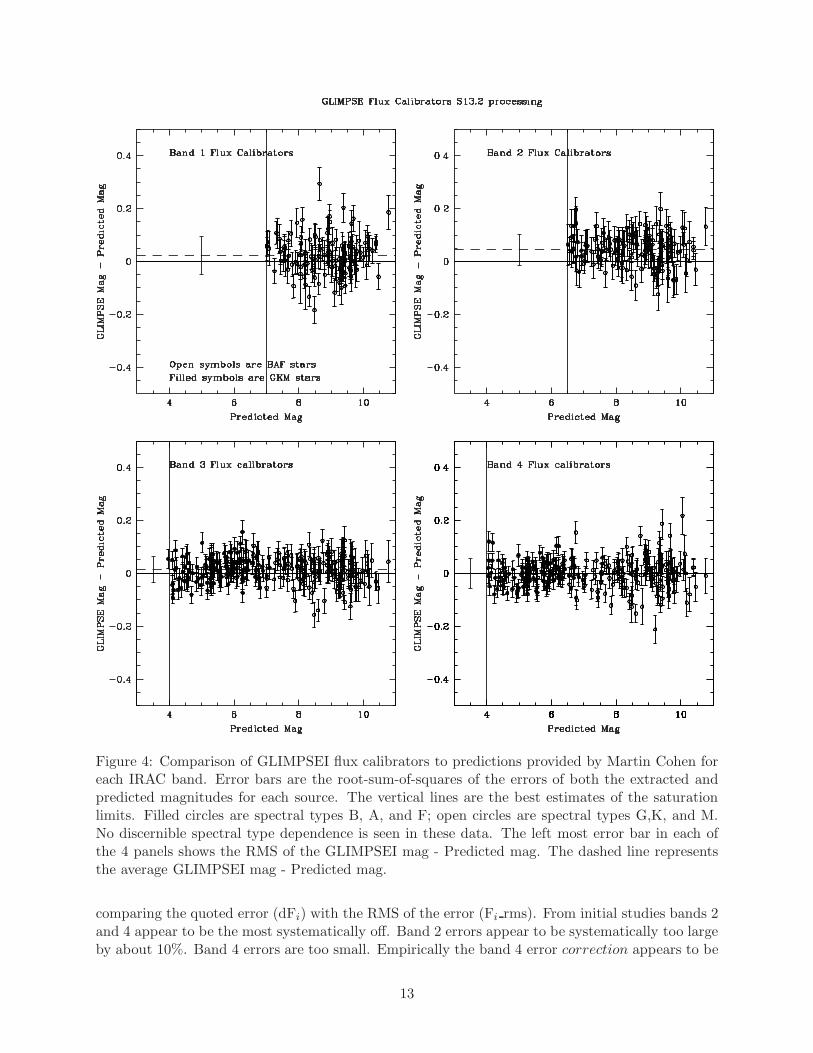
Figure 4: Comparison of GLIMPSEI flux calibrators to predictions provided by Martin Cohen foreach IRAC band. Error bars are the root-sum-of-squares of the errors of both the extracted andpredicted magnitudes for each source. The vertical lines are the best estimates of the saturationlimits. Filled circles are spectral types B, A, and F; open circles are spectral types G,K, and M.No discernible spectral type dependence is seen in these data. The left most error bar in each ofthe 4 panels shows the RMS of the GLIMPSEI mag - Predicted mag. The dashed line representsthe average GLIMPSEI mag - Predicted mag.
comparing the quoted error (dFi) with the RMS of the error (Fi rms). From initial studies bands 2and 4 appear to be the most systematically off. Band 2 errors appear to be systematically too largeby about 10%. Band 4 errors are too small. Empirically the band 4 error correction appears to be
13

related to the background level as well as the quoted error. The average band 4 error correctionis around +20%, (i.e. df b4’=df b4*1.2) but ranges from about 0.8 to 2.0. Likewise there may besmall corrections for bands 1 and 3. No corrections have been applied to the data, but we willmake recommendations for corrections when our study is completed.
4.4 Color-Color and Color-Magnitude Plots
Color-color and color-magnitude plots were made of each Catalog and Archive Table (in approxi-mately 1◦×2◦ regions). An example set of color-color and color-magnitude plots is shown in Figures5 and 6, respectively. The color-color plots generally show a peak near 0 color due to main sequenceand giant stars, and a red tail corresponding to the large variety of stars with circumstellar dust andpossibly galaxies. The color-magnitude plots can be used to show the limiting magnitudes wherethe flux errors become large and the colors begin to show large deviations. This is not apparentin Figure 6 which demonstrates that our fluxes are accurate at the faint end. Postscript files ofthe color-color and color-magnitude plots for each degree of longitude in the GLIMPSEI survey areavailable from the GLIMPSE web site (http://www.astro.wisc.edu/glimpse/v2.0/ColorColor/ andhttp://www.astro.wisc.edu/glimpse/v2.0/ColorMag/).
4.5 Other checks
Spot checks include inspection of residual images to verify proper point source extraction; over-plotting the positions of the sources in the Catalogs and Archives on mosaic images; and plottingSpectral Energy Distributions (SEDs) of several sources. The l=13◦-14◦, l=43◦-44◦ and l=300◦-301◦ Catalogs and Archives were run through our SED grid and fitter (§5.4, Robitaille et al. 2006,2007). using a large grid of stellar atmosphere models. Four data points were required for the fit.About >98% (Archive) and >99% (Catalog) of the sources were well-fit within the χ2 per datapoint< 3 and are therefore likely valid data. The remaining <1% (Catalog) and <2% (Archive) sourceswere examined individually and we found that about 1/2 to 2/3 of the sources have a datapointthat is questionable (due to bad or mismatched IRAC or 2MASS fluxes, or variability betweenIRAC and 2MASS; Robitaille et al. 2007, submitted). The rest are real sources not well fit bystellar atmospheres, e.g. dusty Young Stellar Objects and evolved stars. As another sanity check,the values of the Source Quality Flag were plotted as a function of source position. No obviousproblems were apparent.
5 Data Products Description
5.1 Catalog and Archive Fields and Flags
Each entry in the GLIMPSEI v2.0 Catalog and Archive has the following information:
14
Figure 5: Color-color plots of the region l = 12 − 13◦ and |b| < 1◦ for sources in the Catalog. 10contours are evenly spaced between log(# sources/mag2)=2.0 and the log of maximum number ofsources per square magnitude. The contours are labeled with the log of the number of sources persquare magnitude. Outside of the lowest contour, the positions of individual sources are plotted.
designation SSTGLMC GLLL.llll±BB.bbbb, SSTGLMA GLLL.llll±BB.bbbb2MASS PSC names 2MASS designation, 2MASS counterposition l, b, dl, db, ra, dec, dra, ddecflux magi, dmagi, Fi, dFi, Fi rms (IRAC)
magt, dmagt, Ft, dFt (2MASS)diagnostic skyi, SNi, srcdensi, # detections Mi out of Ni possible (IRAC)
SNt (2MASS)flags Close Source Flag, Source Quality Flag (SQFi), Flux Method Flag (MFi) (IRAC)
Source Quality Flag (SQFt) (2MASS)
where i is the IRAC wavelength number (IRAC bands 1 - 4) (3.6 µm, 4.5 µm, 5.6 µm and 8.0 µm)and t is the 2MASS wavelength band (J, H, Ks). Details of the fields are as follows:
Designation
15
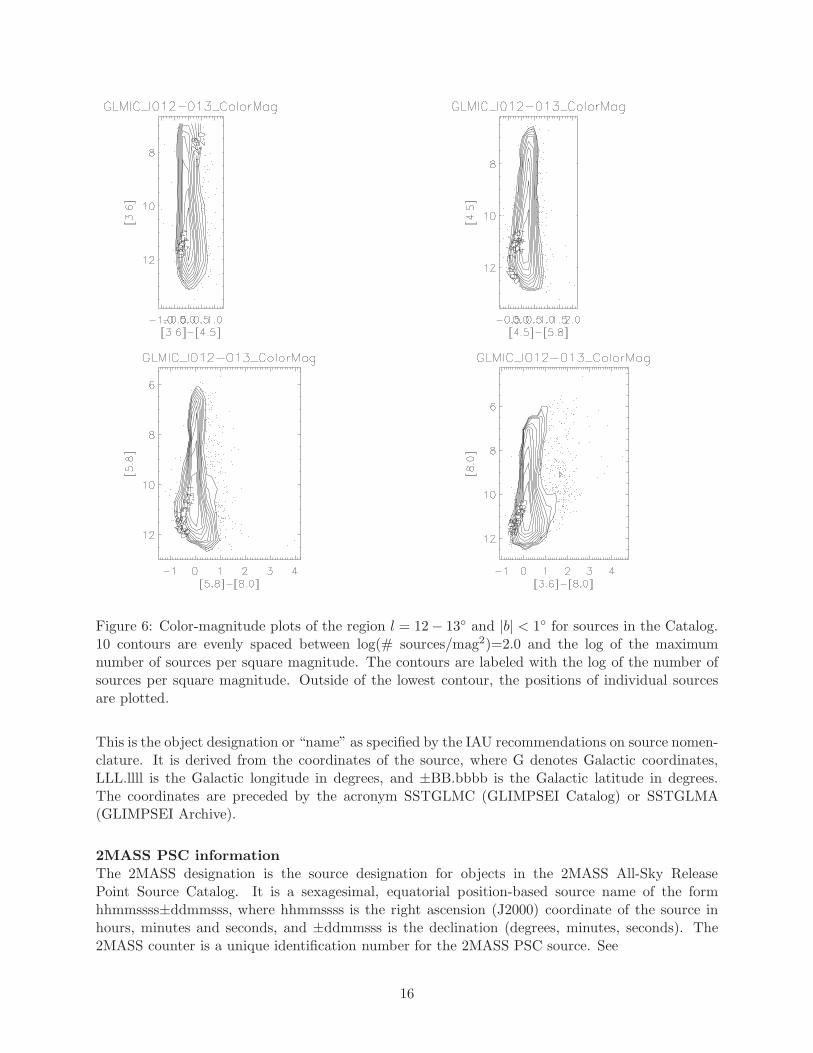
Figure 6: Color-magnitude plots of the region l = 12− 13◦ and |b| < 1◦ for sources in the Catalog.10 contours are evenly spaced between log(# sources/mag2)=2.0 and the log of the maximumnumber of sources per square magnitude. The contours are labeled with the log of the number ofsources per square magnitude. Outside of the lowest contour, the positions of individual sourcesare plotted.
This is the object designation or “name” as specified by the IAU recommendations on source nomen-clature. It is derived from the coordinates of the source, where G denotes Galactic coordinates,LLL.llll is the Galactic longitude in degrees, and ±BB.bbbb is the Galactic latitude in degrees.The coordinates are preceded by the acronym SSTGLMC (GLIMPSEI Catalog) or SSTGLMA(GLIMPSEI Archive).
2MASS PSC informationThe 2MASS designation is the source designation for objects in the 2MASS All-Sky ReleasePoint Source Catalog. It is a sexagesimal, equatorial position-based source name of the formhhmmssss±ddmmsss, where hhmmssss is the right ascension (J2000) coordinate of the source inhours, minutes and seconds, and ±ddmmsss is the declination (degrees, minutes, seconds). The2MASS counter is a unique identification number for the 2MASS PSC source. See
16
http://pegasus.phast.umass.edu/ipac wget/releases/allsky/doc/sec2 2a.html for more informationabout these fields.
PositionThe position is given in both Galactic (l, b) and equatorial (α, δ) J2000 coordinates, along withestimated uncertainties. The pointing accuracy is 1′′ (Werner et al. 2004). The SSC pipeline doespointing refinement15 of the images based on comparison with the 2MASS Point Source Catalog,whose absolute accuracy is typically < 0.2′′ (Cutri et al. 2005). After applying the SSC geometricdistortion corrections and updating to the 2MASS positions, the GLIMPSEI point source accuracyis typically ∼ 0.3′′ absolute accuracy, limited by undersampling of the point-spread function. Theposition uncertainties are calculated by the bandmerger based on the uncertainties of individualdetections, propagated through the calculation of the weighted mean position. Sources with 2MASSassociates have positions in part derived from the 2MASS position.
FluxFor each IRAC band i = 3.6, 4.5, 5.6, and 8.0 µm and, when available 2MASS band t = J, H, andKs, the fluxes are expressed in magnitudes (magi, magt) and in mJy (Fi, Ft). Each IRAC fluxis the error-weighted average of all independent detections of a source. The 2MASS magnitudesand uncertainties are from the 2MASS All-Sky Release Point Source Catalog. They are the j m,j msigcom, h m, h msigcom, and k m, k msigcom columns from the 2MASS PSC. The zeropointsfor converting from flux to magnitude for the S13.2 and later SSC processing versions are fromReach et al (2005) for the IRAC bands and Cohen et al. 2003 for 2MASS and given in Table 3.
Table 3. Zeropoints for Flux to Magnitude Conversion
Band J H Ks [3.6] [4.5] [5.8] [8.0]
Zeropoints (Jy) 1594 1024 666.7 280.9 179.7 115.0 64.13
The IRAC flux/magnitude uncertainties (dFi; dmagi) are computed during the photometry stageand take into account photon noise, readnoise, goodness of flat fielding, and PSF fitting (Stet-son 1987). Magnitude uncertainties are typically <0.2 mag for the Catalog and < 0.3 mag forthe Archive. The uncertainties are smaller in bands 1 and 2 than bands 3 and 4 due to lowerbackgrounds in bands 1 & 2 and the lower sensitivity of the band 3 detector. Table 1 shows thepercentages of sources meeting the 0.2 mag accuracy criterion.
The rms deviation (Fi rms) of the individual detections from the final flux of each source is provided.The F rms is calculated as follows: F rms=
√∑
(Fj− < F >)2/M where j is an individual IRACframe, < F > is the average Flux, and M is the number of detections.
DiagnosticsThe associated flux diagnostics are a local background level (skyi) (i = 3.6, 4.5, 5.6, and 8.0 µm)in MJy/sr, a Signal/Noise (SNi), a local source density (srcdensi) (number of sources per squarearcmin), and number of times (Mi) a source was detected out of a calculated possible number (Ni).The local background, an output of DAOPHOT, is provided because high backgrounds were shownto affect the reliability of IRAS sources, and for IRAC as well (especially bands 3 and 4) (see theGQA document). However, the effects may not be easily characterizable in the quoted error. The
15http://ssc.spitzer.caltech.edu/postbcd/pointingrefine.html
17
Signal/Noise is the flux (Fi) divided by the flux error (dFi). The Signal/Noise for the 2MASSfluxes (SNt) have been taken from the 2MASS PSC (the j snr, h snr and k snr columns). The localsource density is measured as follows: The individual IRAC frame is divided into a 3× 3 grid, eachof the nine cells being 1.71′ x 1.71′ . A source density is calculated for each cell (number of sourcesper arcmin2), and is assigned to each source in that cell. The local source density can be used toassess the confusion in a given region, along with the internal reliability. Mi and Ni can be usedto estimate reliability. Ni is calculated based on the areal coverage of each observed frame; due tooverlaps some areas are observed more than twice per band.
FlagsThere are three types of flags: the Close Source Flag, the Source Quality Flag and the FluxCalculation Method Flag. The Close Source Flag is set if there are Archive sources that arewithin 3′′ of the source. The Source Quality Flag provides a measure of the quality of the pointsource extraction and bandmerging. The Flux Calculation Method Flag describes how the finalCatalog/Archive flux was determined.
• The Close Source Flag is set when a source in the Archive is within 3.0′′ of the source. It wasfound (see Section VIII of the GQA) that the magnitudes of a source with nearby sources closerthan about 2′′ are not reliably extracted and bandmerged. A source that has Archive sources within2.0′′ of the source are culled from the Catalog. A source that has Archive sources within 0.5′′ ofthe source are culled from the Archive. The flag is defined as follows:
0=no Archive source within 3.0′′ of source1=Archive sources between 2.5′′ and 3.0′′ of source2=Archive sources between 2.0′′ and 2.5′′ of source3=Archive sources between 1.5′′ and 2.0′′ of source4=Archive sources between 1.0′′ and 1.5′′ of source5=Archive sources between 0.5′′ and 1.0′′ of source6=Archive sources within 0.5′′ of source
• The Source Quality Flag (SQF) is generated from SSC-provided masks and the GLIMPSEpipeline, during point source extraction on individual IRAC frames and bandmerging. Each sourcequality flag is a binary number allowing combinations of flags (bits) in the same number. Flags areset if an artifact (e.g., a hot or dead pixel) occurs near the core of a source - i.e. within ∼3 pixels.A non-zero SQF will in most cases decrease the reliability of the source. Some of the bits, such asthe DAOPHOT tweaks, will not compromise the source’s reliability, but has likely increased theuncertainty assigned to the source flux. If just one IRAC detection has the condition requiring abit to be set in the SQF, then the bit is set even if the other detections did not have this condition.Sources with hot or dead pixels within 3 pixels of source center (bit 8), those in wings of saturatedstars (bit 20), and those within 3 pixels of the frame edge (bit 30) are culled from the Catalog. Weare continuing to study the effects of various SQF bits on data quality.
Table 4 shows the SQF sequence for the GLIMPSEI v2.0 data release. The stray light flag hasbeen implemented for this data release. We have determined that false sources from such regionsdo not make it into the Catalog due to our 2+1 source selection criterion (§3.2). In addition,our photometry algorithm was modified substantially to find sources in high background regionsthat gives it the ability to find sources in stray light and banded regions as well, increasing thephotometric uncertainties accordingly.
18
The value of the SQF is∑
2(bit−1). For example, a source with bits 1 and 4 set will have SQF =20 + 23 = 9. If the SQF is 0, the source has no detected problems. More information about theseflags and a bit value key can be found in Appendix B.
Table 4. Source Quality Flag (SQF) Bits
SQF bit Description Origin
1 poor pixels in dark current SSC pmask2 flat field questionable SSC dmask3 latent imagea SSC dmask3 persistence (p) 2MASS4 photometric confusion (c) 2MASS7 muxbleed correction applied GLIMPSE8 hot, dead or otherwise unacceptable pixel SSC pmask,dmask,GLIMPSE9 muxbleed correction applied is > 3σ above bkg GLIMPSE9 electronic stripe (s) 2MASS10 DAOPHOT tweak positive GLIMPSE11 DAOPHOT tweak negative GLIMPSE13 confusion in in-band merge GLIMPSE14 confusion in cross-band merge (IRAC) GLIMPSE14 confusion in cross-band merge (2MASS) GLIMPSE15 column pulldown corrected GLIMPSE16 banding corrected GLIMPSE17 stray light GLIMPSE19 data predicted to saturate GLIMPSE20 saturated star wing region GLIMPSE20 diffraction spike (d) 2MASS21 pre-lumping in in-band merge GLIMPSE22 post-lumping in cross-band merge GLIMPSE30 within three pixels of edge of frame GLIMPSE
aDue to the short exposure time and high sky backgrounds in the GLIMPSEI fields, we have not
seen evidence for latent sources in the images, even though they are flagged via an automatic
algorithm in SSC’s processing.
• Flux calculation Method Flag (MFi). The flux calculation method flag indicates by bit whethera given frametime was present, and whether that frametime was used in the final flux. Table 5defines the values for this flag: value= 2(present bit−1) + 2(used bit−1)
Table 5. Flux Calculation Method Flag (MF)
exp present used(sec) bit bit
0.6 1 22 3 412 5 630 7 8100 9 10
19
This flag is more useful for High Dynamic Range (HDR) mode data which has two frametimes, oneof which is not necessarily used (i.e. the 12 second frametime data is not used for the very brightsources). For the 2 second frametime of the GLIMPSEI survey, the method flag always equals 12(22 + 23).
5.2 GLIMPSEI Image Atlas
The IRAC images are mosaicked using the Montage16 package into rectangular tiles that coverthe surveyed region. The units are MJy/sr and the coordinates are Galactic. The mosaic imagesconserve surface brightness in the original images. The angular size of each tile is 1.1◦×0.8◦. Threetiles span the latitude range of the survey (±1.15◦) and 112 span the longitude range (includingthe OSV region), giving a total of 336 mosaic images in each band to cover the survey region. Thepixel size is 0.6′′ , smaller than the native IRAC pixel size of 1.2′′ . World Coordinate System(WCS) keywords are standard (CTYPE, CRPIX, CRVAL, CD matrix keywords) with a Galacticprojection (GLON-CAR, GLAT-CAR; Calabretta and Greisen 2002). See (§6.2) for an exampleof a FITS header. The mosaicked images are 32-bit IEEE floating point single-extension FITSformatted images and require about 170 GB. We also provide 3.1◦×2.4◦ FITS files with a pixelsize of 1.2′′ for an overview look that covers the full latitude range of GLIMPSEI. There are 164 ofthese 3.1◦×2.4◦ mosaics, totalling ∼ 42 GB. For a quick-look of the mosaics, we provide 3-color jpegfiles (bands 1, 2 and 4) for each area covered by the FITS files. These are rebinned to much lowerresolution to make the files small. Note that outside the latitudes of ±1◦ we do not necessarilyhave full coverage in all four IRAC bands. This can be seen in the jpeg files.
5.3 Web Infrared Tool Shed
The Web Infrared Tool Shed (WITS) (dustem.astro.umd.edu) contains two toolboxes: the Dust In-frared Toolbox (DIRT) and the PhotoDissociation Region Toolbox (PDRT). The toolboxes provideextensive databases of circumstellar shell emission models and PDR emission models. Users inputdata and retrieve best fit models. DIRT output includes central source and dust shell parameters.PDRT output consists of gas density, temperature, incident UV field and IR line intensities.
Legacy Tools include, for DIRT, a retrievable database of SEDs convolved with IRAC bands,an IRAC specific input GUI (Graphic User Interface), and an extended model base containingembedded high mass stars and low luminosity protostars with and without illumination by anexternal field. It also includes models with alternate grain models including ice mantles.
Spitzer enhancements to PDRT consist of PDR lines (Si II, Fe II, H 2) useful for Infrared Spec-trograph (IRS) observations and interpretation of IRAC PDR emission.
DIRT is based on the radiation transfer code of Wolfire and Cassinelli (1986) that calculates thepassage of stellar radiation through a spherical dust envelope. The web interface to DIRT is aJAVA applet which accesses a catalog of pre-run spectral energy distributions. There are currentlyabout 400,000 models on-line. Users can display models with various properties including:
16http://montage.ipac.caltech.edu
20
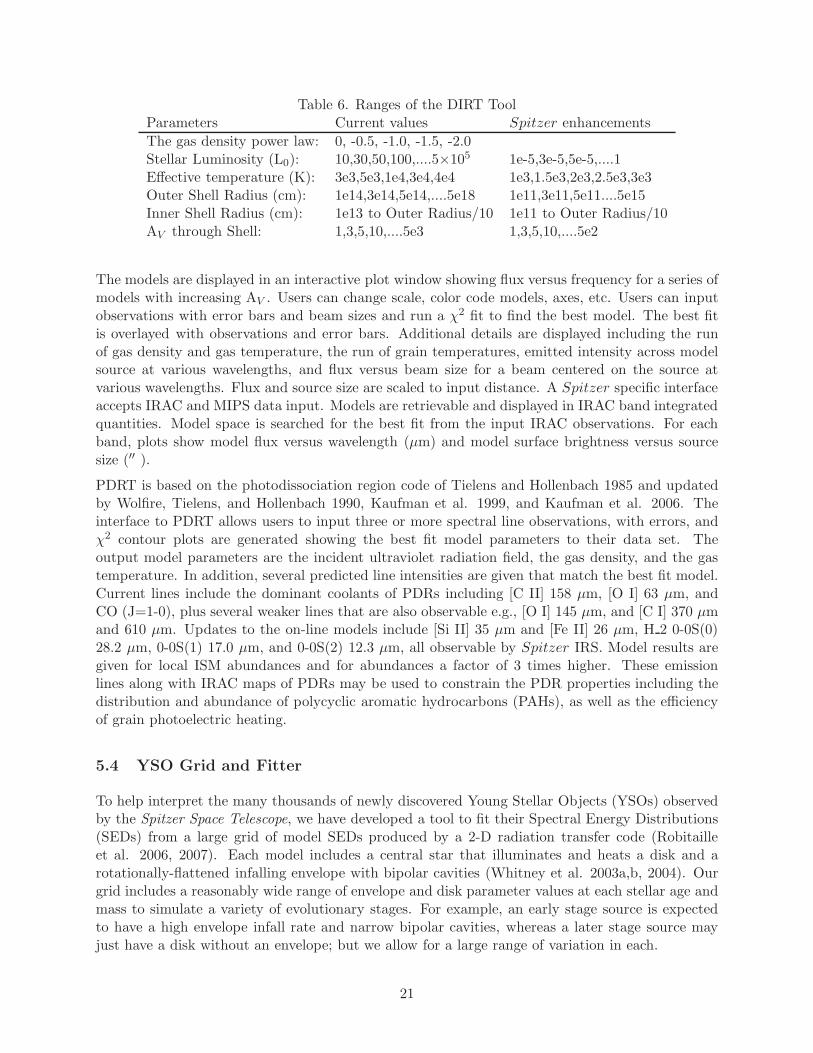
Table 6. Ranges of the DIRT ToolParameters Current values Spitzer enhancements
The gas density power law: 0, -0.5, -1.0, -1.5, -2.0Stellar Luminosity (L0): 10,30,50,100,....5×105 1e-5,3e-5,5e-5,....1Effective temperature (K): 3e3,5e3,1e4,3e4,4e4 1e3,1.5e3,2e3,2.5e3,3e3Outer Shell Radius (cm): 1e14,3e14,5e14,....5e18 1e11,3e11,5e11....5e15Inner Shell Radius (cm): 1e13 to Outer Radius/10 1e11 to Outer Radius/10AV through Shell: 1,3,5,10,....5e3 1,3,5,10,....5e2
The models are displayed in an interactive plot window showing flux versus frequency for a series ofmodels with increasing AV . Users can change scale, color code models, axes, etc. Users can inputobservations with error bars and beam sizes and run a χ2 fit to find the best model. The best fitis overlayed with observations and error bars. Additional details are displayed including the runof gas density and gas temperature, the run of grain temperatures, emitted intensity across modelsource at various wavelengths, and flux versus beam size for a beam centered on the source atvarious wavelengths. Flux and source size are scaled to input distance. A Spitzer specific interfaceaccepts IRAC and MIPS data input. Models are retrievable and displayed in IRAC band integratedquantities. Model space is searched for the best fit from the input IRAC observations. For eachband, plots show model flux versus wavelength (µm) and model surface brightness versus sourcesize (′′ ).
PDRT is based on the photodissociation region code of Tielens and Hollenbach 1985 and updatedby Wolfire, Tielens, and Hollenbach 1990, Kaufman et al. 1999, and Kaufman et al. 2006. Theinterface to PDRT allows users to input three or more spectral line observations, with errors, andχ2 contour plots are generated showing the best fit model parameters to their data set. Theoutput model parameters are the incident ultraviolet radiation field, the gas density, and the gastemperature. In addition, several predicted line intensities are given that match the best fit model.Current lines include the dominant coolants of PDRs including [C II] 158 µm, [O I] 63 µm, andCO (J=1-0), plus several weaker lines that are also observable e.g., [O I] 145 µm, and [C I] 370 µmand 610 µm. Updates to the on-line models include [Si II] 35 µm and [Fe II] 26 µm, H 2 0-0S(0)28.2 µm, 0-0S(1) 17.0 µm, and 0-0S(2) 12.3 µm, all observable by Spitzer IRS. Model results aregiven for local ISM abundances and for abundances a factor of 3 times higher. These emissionlines along with IRAC maps of PDRs may be used to constrain the PDR properties including thedistribution and abundance of polycyclic aromatic hydrocarbons (PAHs), as well as the efficiencyof grain photoelectric heating.
5.4 YSO Grid and Fitter
To help interpret the many thousands of newly discovered Young Stellar Objects (YSOs) observedby the Spitzer Space Telescope, we have developed a tool to fit their Spectral Energy Distributions(SEDs) from a large grid of model SEDs produced by a 2-D radiation transfer code (Robitailleet al. 2006, 2007). Each model includes a central star that illuminates and heats a disk and arotationally-flattened infalling envelope with bipolar cavities (Whitney et al. 2003a,b, 2004). Ourgrid includes a reasonably wide range of envelope and disk parameter values at each stellar age andmass to simulate a variety of evolutionary stages. For example, an early stage source is expectedto have a high envelope infall rate and narrow bipolar cavities, whereas a later stage source mayjust have a disk without an envelope; but we allow for a large range of variation in each.
21
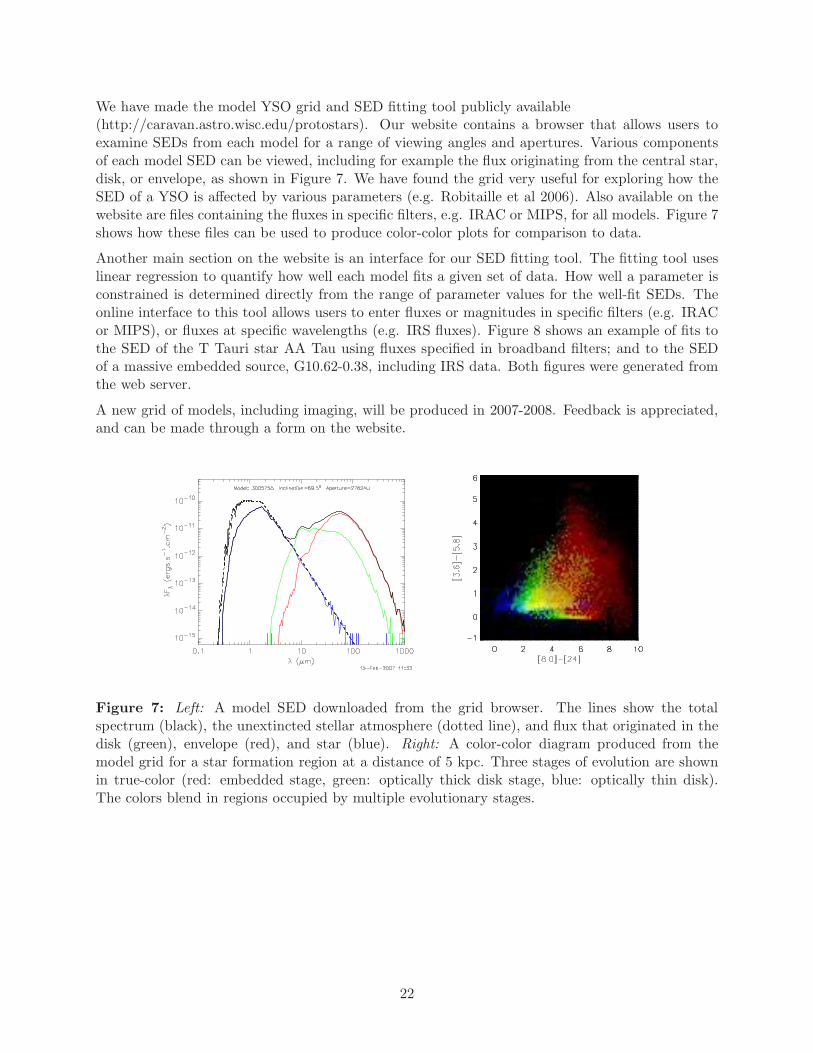
We have made the model YSO grid and SED fitting tool publicly available(http://caravan.astro.wisc.edu/protostars). Our website contains a browser that allows users toexamine SEDs from each model for a range of viewing angles and apertures. Various componentsof each model SED can be viewed, including for example the flux originating from the central star,disk, or envelope, as shown in Figure 7. We have found the grid very useful for exploring how theSED of a YSO is affected by various parameters (e.g. Robitaille et al 2006). Also available on thewebsite are files containing the fluxes in specific filters, e.g. IRAC or MIPS, for all models. Figure 7shows how these files can be used to produce color-color plots for comparison to data.
Another main section on the website is an interface for our SED fitting tool. The fitting tool useslinear regression to quantify how well each model fits a given set of data. How well a parameter isconstrained is determined directly from the range of parameter values for the well-fit SEDs. Theonline interface to this tool allows users to enter fluxes or magnitudes in specific filters (e.g. IRACor MIPS), or fluxes at specific wavelengths (e.g. IRS fluxes). Figure 8 shows an example of fits tothe SED of the T Tauri star AA Tau using fluxes specified in broadband filters; and to the SEDof a massive embedded source, G10.62-0.38, including IRS data. Both figures were generated fromthe web server.
A new grid of models, including imaging, will be produced in 2007-2008. Feedback is appreciated,and can be made through a form on the website.
Figure 7: Left: A model SED downloaded from the grid browser. The lines show the totalspectrum (black), the unextincted stellar atmosphere (dotted line), and flux that originated in thedisk (green), envelope (red), and star (blue). Right: A color-color diagram produced from themodel grid for a star formation region at a distance of 5 kpc. Three stages of evolution are shownin true-color (red: embedded stage, green: optically thick disk stage, blue: optically thin disk).The colors blend in regions occupied by multiple evolutionary stages.
22
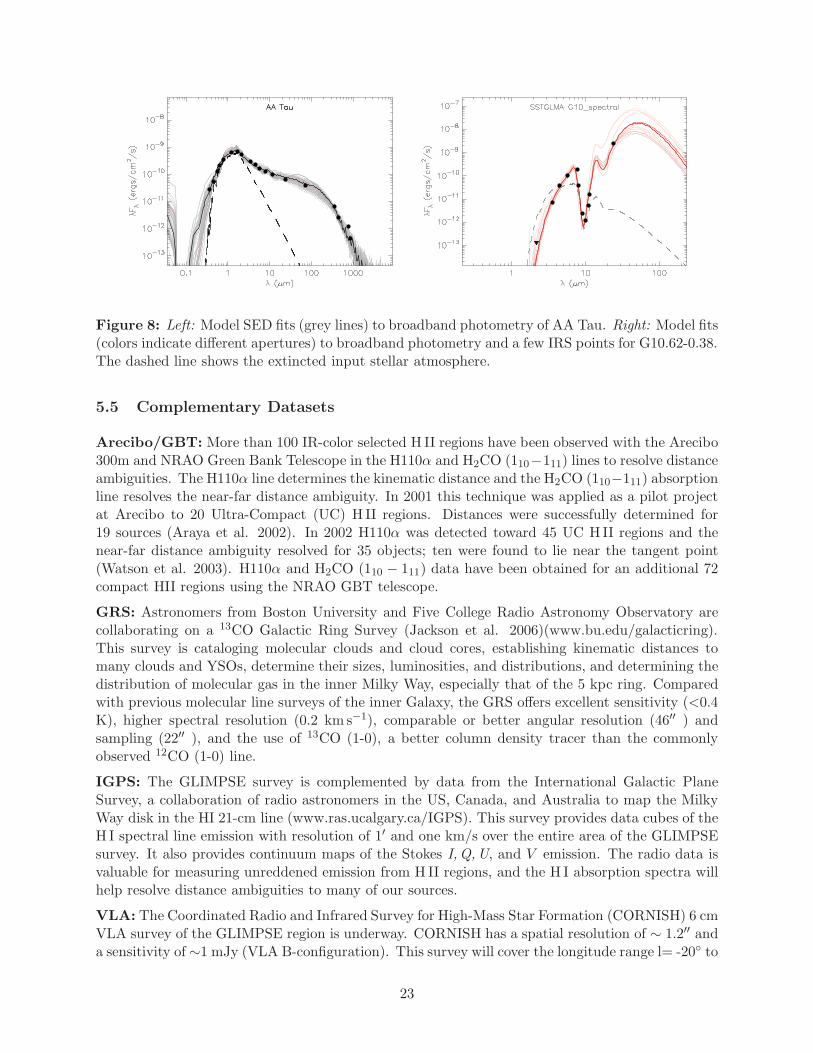
Figure 8: Left: Model SED fits (grey lines) to broadband photometry of AA Tau. Right: Model fits(colors indicate different apertures) to broadband photometry and a few IRS points for G10.62-0.38.The dashed line shows the extincted input stellar atmosphere.
5.5 Complementary Datasets
Arecibo/GBT: More than 100 IR-color selected H II regions have been observed with the Arecibo300m and NRAO Green Bank Telescope in the H110α and H2CO (110−111) lines to resolve distanceambiguities. The H110α line determines the kinematic distance and the H2CO (110−111) absorptionline resolves the near-far distance ambiguity. In 2001 this technique was applied as a pilot projectat Arecibo to 20 Ultra-Compact (UC) H II regions. Distances were successfully determined for19 sources (Araya et al. 2002). In 2002 H110α was detected toward 45 UC H II regions and thenear-far distance ambiguity resolved for 35 objects; ten were found to lie near the tangent point(Watson et al. 2003). H110α and H2CO (110 − 111) data have been obtained for an additional 72compact HII regions using the NRAO GBT telescope.
GRS: Astronomers from Boston University and Five College Radio Astronomy Observatory arecollaborating on a 13CO Galactic Ring Survey (Jackson et al. 2006)(www.bu.edu/galacticring).This survey is cataloging molecular clouds and cloud cores, establishing kinematic distances tomany clouds and YSOs, determine their sizes, luminosities, and distributions, and determining thedistribution of molecular gas in the inner Milky Way, especially that of the 5 kpc ring. Comparedwith previous molecular line surveys of the inner Galaxy, the GRS offers excellent sensitivity (<0.4K), higher spectral resolution (0.2 km s−1), comparable or better angular resolution (46′′ ) andsampling (22′′ ), and the use of 13CO (1-0), a better column density tracer than the commonlyobserved 12CO (1-0) line.
IGPS: The GLIMPSE survey is complemented by data from the International Galactic PlaneSurvey, a collaboration of radio astronomers in the US, Canada, and Australia to map the MilkyWay disk in the HI 21-cm line (www.ras.ucalgary.ca/IGPS). This survey provides data cubes of theH I spectral line emission with resolution of 1′ and one km/s over the entire area of the GLIMPSEsurvey. It also provides continuum maps of the Stokes I,Q,U, and V emission. The radio data isvaluable for measuring unreddened emission from H II regions, and the H I absorption spectra willhelp resolve distance ambiguities to many of our sources.
VLA: The Coordinated Radio and Infrared Survey for High-Mass Star Formation (CORNISH) 6 cmVLA survey of the GLIMPSE region is underway. CORNISH has a spatial resolution of ∼ 1.2′′ anda sensitivity of ∼1 mJy (VLA B-configuration). This survey will cover the longitude range l= -20◦ to
23
66◦, b < |1|◦. It will image SNRs, HIIs, PNs and galaxies. Cross-correlation of GLIMPSE mid-Infrared sources with radio sources is expected to provide deeper insight into the physics of manyclasses of objects in the disk of our Galaxy. See http://www.ast.leeds.ac.uk/Cornish/index.htmlfor more details.
6 Product Formats
6.1 Catalog and Archive
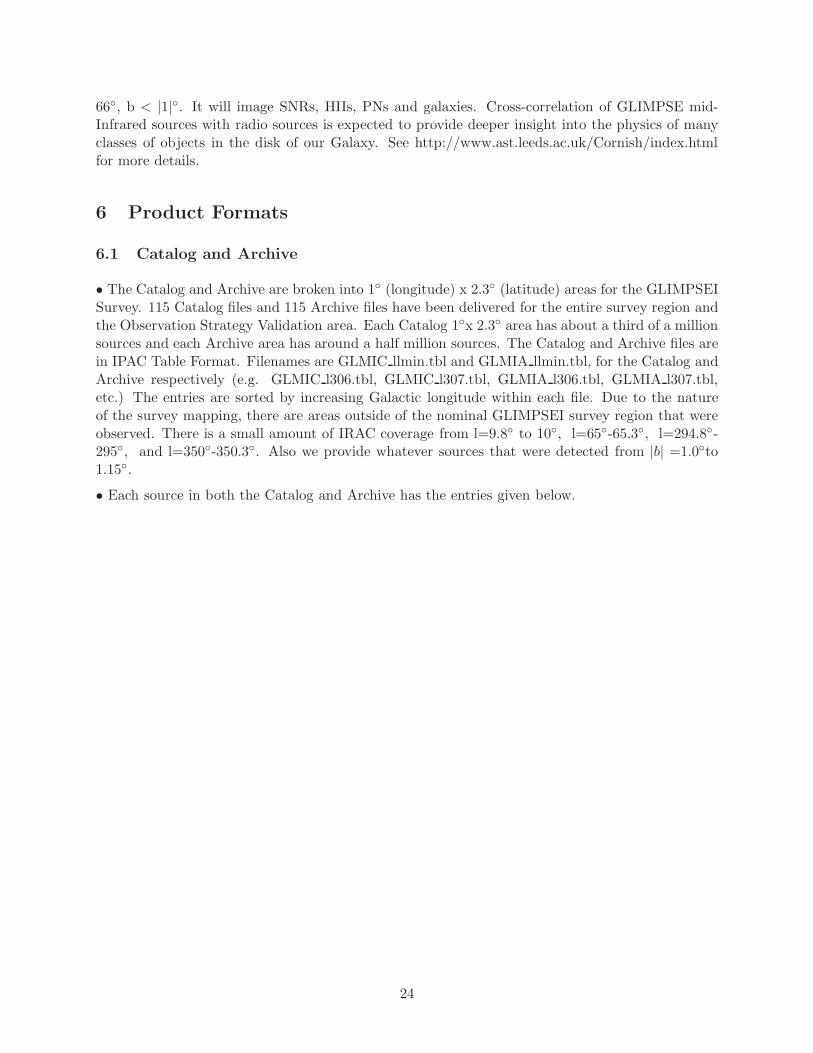
• The Catalog and Archive are broken into 1◦ (longitude) x 2.3◦ (latitude) areas for the GLIMPSEISurvey. 115 Catalog files and 115 Archive files have been delivered for the entire survey region andthe Observation Strategy Validation area. Each Catalog 1◦x 2.3◦ area has about a third of a millionsources and each Archive area has around a half million sources. The Catalog and Archive files arein IPAC Table Format. Filenames are GLMIC llmin.tbl and GLMIA llmin.tbl, for the Catalog andArchive respectively (e.g. GLMIC l306.tbl, GLMIC l307.tbl, GLMIA l306.tbl, GLMIA l307.tbl,etc.) The entries are sorted by increasing Galactic longitude within each file. Due to the natureof the survey mapping, there are areas outside of the nominal GLIMPSEI survey region that wereobserved. There is a small amount of IRAC coverage from l=9.8◦ to 10◦, l=65◦-65.3◦, l=294.8◦-295◦, and l=350◦-350.3◦. Also we provide whatever sources that were detected from |b| =1.0◦to1.15◦.
• Each source in both the Catalog and Archive has the entries given below.
24
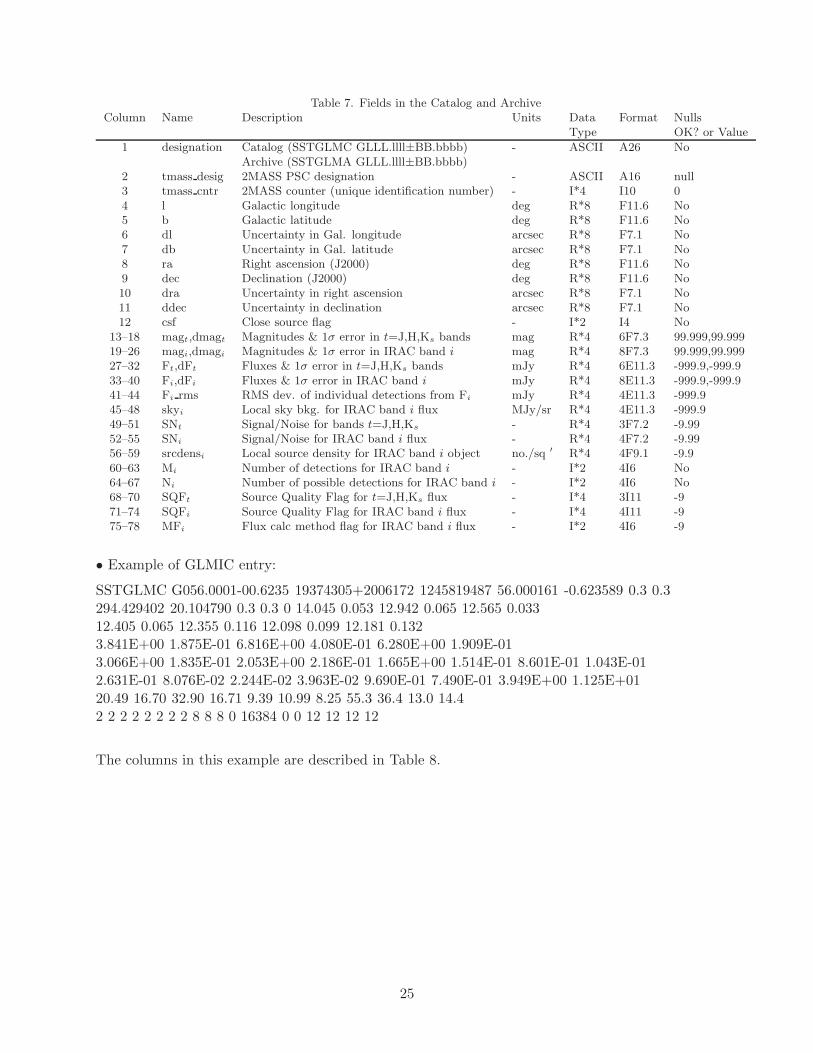
Table 7. Fields in the Catalog and ArchiveColumn Name Description Units Data Format Nulls
Type OK? or Value
1 designation Catalog (SSTGLMC GLLL.llll±BB.bbbb) - ASCII A26 NoArchive (SSTGLMA GLLL.llll±BB.bbbb)
2 tmass desig 2MASS PSC designation - ASCII A16 null3 tmass cntr 2MASS counter (unique identification number) - I*4 I10 04 l Galactic longitude deg R*8 F11.6 No5 b Galactic latitude deg R*8 F11.6 No6 dl Uncertainty in Gal. longitude arcsec R*8 F7.1 No7 db Uncertainty in Gal. latitude arcsec R*8 F7.1 No8 ra Right ascension (J2000) deg R*8 F11.6 No9 dec Declination (J2000) deg R*8 F11.6 No10 dra Uncertainty in right ascension arcsec R*8 F7.1 No11 ddec Uncertainty in declination arcsec R*8 F7.1 No12 csf Close source flag - I*2 I4 No
13–18 magt,dmagt Magnitudes & 1σ error in t=J,H,Ks bands mag R*4 6F7.3 99.999,99.99919–26 magi,dmagi Magnitudes & 1σ error in IRAC band i mag R*4 8F7.3 99.999,99.99927–32 Ft,dFt Fluxes & 1σ error in t=J,H,Ks bands mJy R*4 6E11.3 -999.9,-999.933–40 Fi,dFi Fluxes & 1σ error in IRAC band i mJy R*4 8E11.3 -999.9,-999.941–44 Fi rms RMS dev. of individual detections from Fi mJy R*4 4E11.3 -999.945–48 skyi Local sky bkg. for IRAC band i flux MJy/sr R*4 4E11.3 -999.949–51 SNt Signal/Noise for bands t=J,H,Ks - R*4 3F7.2 -9.9952–55 SNi Signal/Noise for IRAC band i flux - R*4 4F7.2 -9.9956–59 srcdensi Local source density for IRAC band i object no./sq ′ R*4 4F9.1 -9.960–63 Mi Number of detections for IRAC band i - I*2 4I6 No64–67 Ni Number of possible detections for IRAC band i - I*2 4I6 No68–70 SQFt Source Quality Flag for t=J,H,Ks flux - I*4 3I11 -971–74 SQFi Source Quality Flag for IRAC band i flux - I*4 4I11 -975–78 MFi Flux calc method flag for IRAC band i flux - I*2 4I6 -9
• Example of GLMIC entry:
SSTGLMC G056.0001-00.6235 19374305+2006172 1245819487 56.000161 -0.623589 0.3 0.3294.429402 20.104790 0.3 0.3 0 14.045 0.053 12.942 0.065 12.565 0.03312.405 0.065 12.355 0.116 12.098 0.099 12.181 0.1323.841E+00 1.875E-01 6.816E+00 4.080E-01 6.280E+00 1.909E-013.066E+00 1.835E-01 2.053E+00 2.186E-01 1.665E+00 1.514E-01 8.601E-01 1.043E-012.631E-01 8.076E-02 2.244E-02 3.963E-02 9.690E-01 7.490E-01 3.949E+00 1.125E+0120.49 16.70 32.90 16.71 9.39 10.99 8.25 55.3 36.4 13.0 14.42 2 2 2 2 2 2 2 8 8 8 0 16384 0 0 12 12 12 12
The columns in this example are described in Table 8.
25
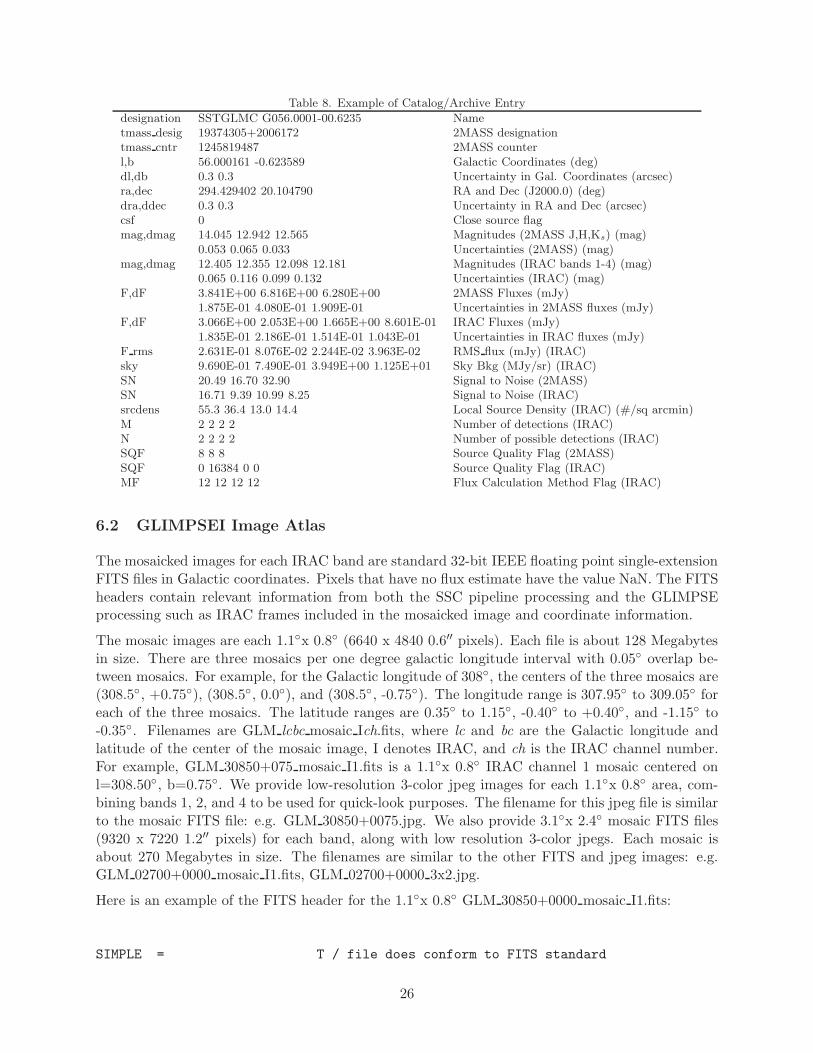
Table 8. Example of Catalog/Archive Entry
designation SSTGLMC G056.0001-00.6235 Nametmass desig 19374305+2006172 2MASS designationtmass cntr 1245819487 2MASS counterl,b 56.000161 -0.623589 Galactic Coordinates (deg)dl,db 0.3 0.3 Uncertainty in Gal. Coordinates (arcsec)ra,dec 294.429402 20.104790 RA and Dec (J2000.0) (deg)dra,ddec 0.3 0.3 Uncertainty in RA and Dec (arcsec)csf 0 Close source flagmag,dmag 14.045 12.942 12.565 Magnitudes (2MASS J,H,Ks) (mag)
0.053 0.065 0.033 Uncertainties (2MASS) (mag)mag,dmag 12.405 12.355 12.098 12.181 Magnitudes (IRAC bands 1-4) (mag)
0.065 0.116 0.099 0.132 Uncertainties (IRAC) (mag)F,dF 3.841E+00 6.816E+00 6.280E+00 2MASS Fluxes (mJy)
1.875E-01 4.080E-01 1.909E-01 Uncertainties in 2MASS fluxes (mJy)F,dF 3.066E+00 2.053E+00 1.665E+00 8.601E-01 IRAC Fluxes (mJy)
1.835E-01 2.186E-01 1.514E-01 1.043E-01 Uncertainties in IRAC fluxes (mJy)F rms 2.631E-01 8.076E-02 2.244E-02 3.963E-02 RMS flux (mJy) (IRAC)sky 9.690E-01 7.490E-01 3.949E+00 1.125E+01 Sky Bkg (MJy/sr) (IRAC)SN 20.49 16.70 32.90 Signal to Noise (2MASS)SN 16.71 9.39 10.99 8.25 Signal to Noise (IRAC)srcdens 55.3 36.4 13.0 14.4 Local Source Density (IRAC) (#/sq arcmin)M 2 2 2 2 Number of detections (IRAC)N 2 2 2 2 Number of possible detections (IRAC)SQF 8 8 8 Source Quality Flag (2MASS)SQF 0 16384 0 0 Source Quality Flag (IRAC)MF 12 12 12 12 Flux Calculation Method Flag (IRAC)
6.2 GLIMPSEI Image Atlas
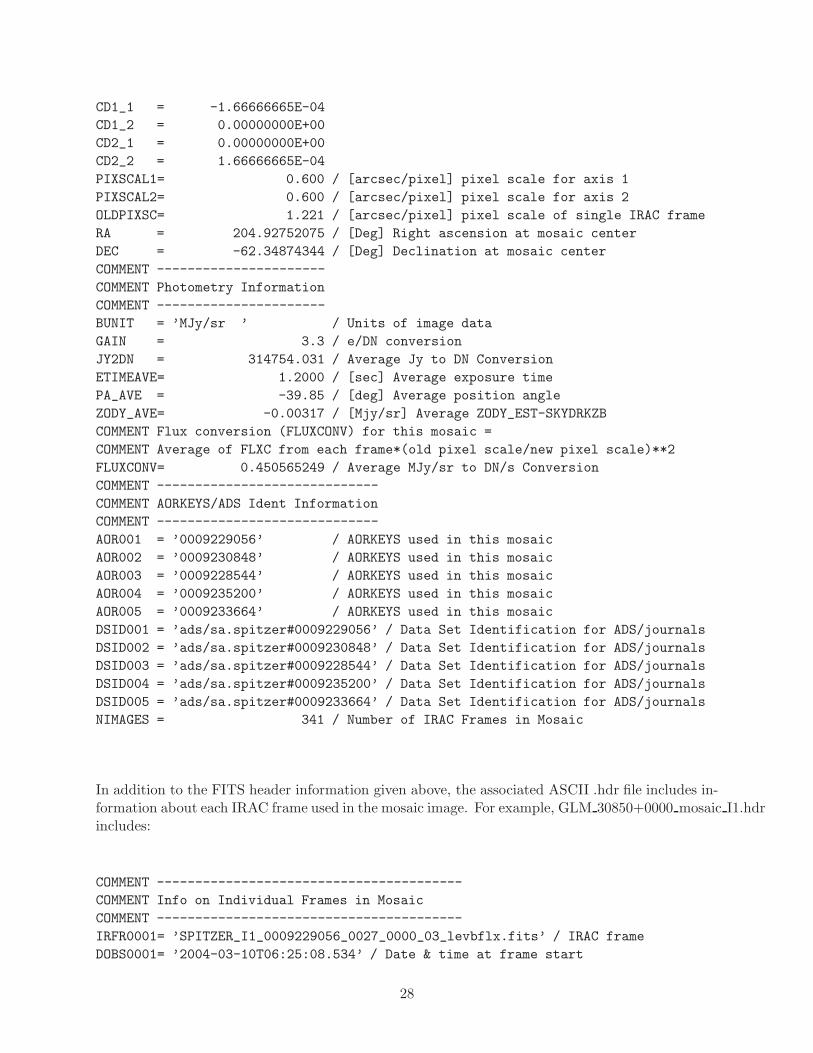
The mosaicked images for each IRAC band are standard 32-bit IEEE floating point single-extensionFITS files in Galactic coordinates. Pixels that have no flux estimate have the value NaN. The FITSheaders contain relevant information from both the SSC pipeline processing and the GLIMPSEprocessing such as IRAC frames included in the mosaicked image and coordinate information.
The mosaic images are each 1.1◦x 0.8◦ (6640 x 4840 0.6′′ pixels). Each file is about 128 Megabytesin size. There are three mosaics per one degree galactic longitude interval with 0.05◦ overlap be-tween mosaics. For example, for the Galactic longitude of 308◦, the centers of the three mosaics are(308.5◦, +0.75◦), (308.5◦, 0.0◦), and (308.5◦, -0.75◦). The longitude range is 307.95◦ to 309.05◦ foreach of the three mosaics. The latitude ranges are 0.35◦ to 1.15◦, -0.40◦ to +0.40◦, and -1.15◦ to-0.35◦. Filenames are GLM lcbc mosaic Ich.fits, where lc and bc are the Galactic longitude andlatitude of the center of the mosaic image, I denotes IRAC, and ch is the IRAC channel number.For example, GLM 30850+075 mosaic I1.fits is a 1.1◦x 0.8◦ IRAC channel 1 mosaic centered onl=308.50◦, b=0.75◦. We provide low-resolution 3-color jpeg images for each 1.1◦x 0.8◦ area, com-bining bands 1, 2, and 4 to be used for quick-look purposes. The filename for this jpeg file is similarto the mosaic FITS file: e.g. GLM 30850+0075.jpg. We also provide 3.1◦x 2.4◦ mosaic FITS files(9320 x 7220 1.2′′ pixels) for each band, along with low resolution 3-color jpegs. Each mosaic isabout 270 Megabytes in size. The filenames are similar to the other FITS and jpeg images: e.g.GLM 02700+0000 mosaic I1.fits, GLM 02700+0000 3x2.jpg.
Here is an example of the FITS header for the 1.1◦x 0.8◦ GLM 30850+0000 mosaic I1.fits:
SIMPLE = T / file does conform to FITS standard
26
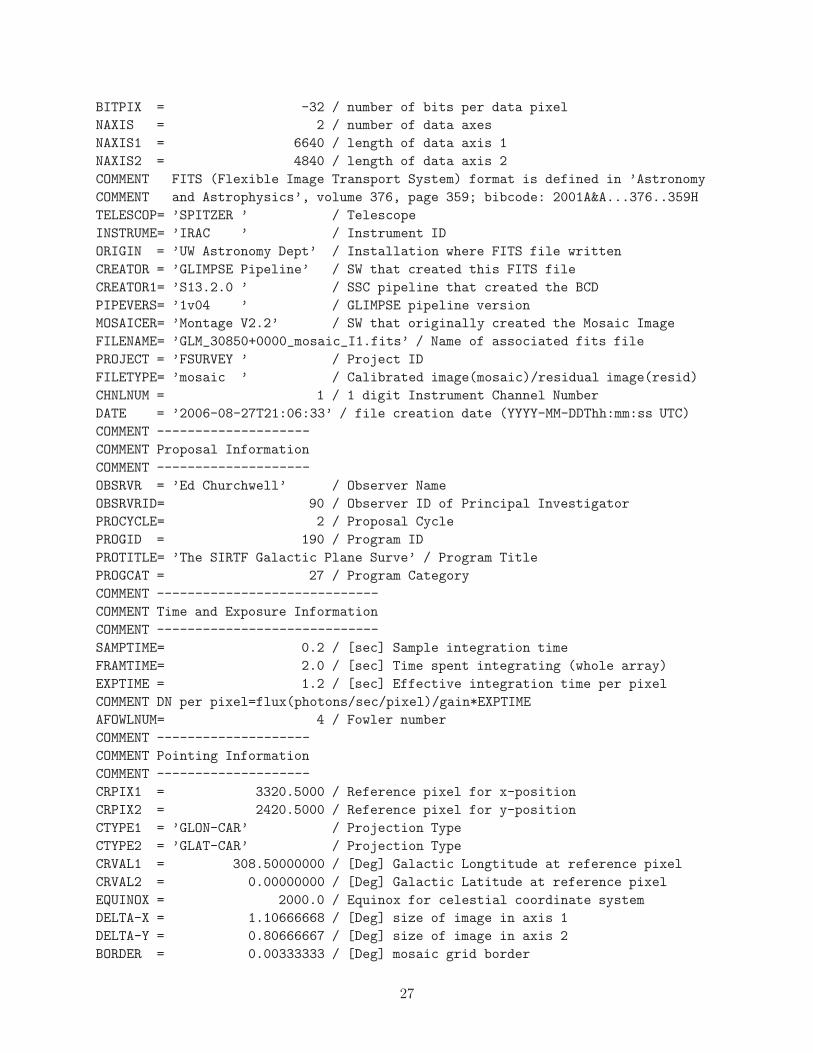
BITPIX = -32 / number of bits per data pixel
NAXIS = 2 / number of data axes
NAXIS1 = 6640 / length of data axis 1
NAXIS2 = 4840 / length of data axis 2
COMMENT FITS (Flexible Image Transport System) format is defined in ’Astronomy
COMMENT and Astrophysics’, volume 376, page 359; bibcode: 2001A&A...376..359H
TELESCOP= ’SPITZER ’ / Telescope
INSTRUME= ’IRAC ’ / Instrument ID
ORIGIN = ’UW Astronomy Dept’ / Installation where FITS file written
CREATOR = ’GLIMPSE Pipeline’ / SW that created this FITS file
CREATOR1= ’S13.2.0 ’ / SSC pipeline that created the BCD
PIPEVERS= ’1v04 ’ / GLIMPSE pipeline version
MOSAICER= ’Montage V2.2’ / SW that originally created the Mosaic Image
FILENAME= ’GLM_30850+0000_mosaic_I1.fits’ / Name of associated fits file
PROJECT = ’FSURVEY ’ / Project ID
FILETYPE= ’mosaic ’ / Calibrated image(mosaic)/residual image(resid)
CHNLNUM = 1 / 1 digit Instrument Channel Number
DATE = ’2006-08-27T21:06:33’ / file creation date (YYYY-MM-DDThh:mm:ss UTC)
COMMENT --------------------
COMMENT Proposal Information
COMMENT --------------------
OBSRVR = ’Ed Churchwell’ / Observer Name
OBSRVRID= 90 / Observer ID of Principal Investigator
PROCYCLE= 2 / Proposal Cycle
PROGID = 190 / Program ID
PROTITLE= ’The SIRTF Galactic Plane Surve’ / Program Title
PROGCAT = 27 / Program Category
COMMENT -----------------------------
COMMENT Time and Exposure Information
COMMENT -----------------------------
SAMPTIME= 0.2 / [sec] Sample integration time
FRAMTIME= 2.0 / [sec] Time spent integrating (whole array)
EXPTIME = 1.2 / [sec] Effective integration time per pixel
COMMENT DN per pixel=flux(photons/sec/pixel)/gain*EXPTIME
AFOWLNUM= 4 / Fowler number
COMMENT --------------------
COMMENT Pointing Information
COMMENT --------------------
CRPIX1 = 3320.5000 / Reference pixel for x-position
CRPIX2 = 2420.5000 / Reference pixel for y-position
CTYPE1 = ’GLON-CAR’ / Projection Type
CTYPE2 = ’GLAT-CAR’ / Projection Type
CRVAL1 = 308.50000000 / [Deg] Galactic Longtitude at reference pixel
CRVAL2 = 0.00000000 / [Deg] Galactic Latitude at reference pixel
EQUINOX = 2000.0 / Equinox for celestial coordinate system
DELTA-X = 1.10666668 / [Deg] size of image in axis 1
DELTA-Y = 0.80666667 / [Deg] size of image in axis 2
BORDER = 0.00333333 / [Deg] mosaic grid border
27
CD1_1 = -1.66666665E-04
CD1_2 = 0.00000000E+00
CD2_1 = 0.00000000E+00
CD2_2 = 1.66666665E-04
PIXSCAL1= 0.600 / [arcsec/pixel] pixel scale for axis 1
PIXSCAL2= 0.600 / [arcsec/pixel] pixel scale for axis 2
OLDPIXSC= 1.221 / [arcsec/pixel] pixel scale of single IRAC frame
RA = 204.92752075 / [Deg] Right ascension at mosaic center
DEC = -62.34874344 / [Deg] Declination at mosaic center
COMMENT ----------------------
COMMENT Photometry Information
COMMENT ----------------------
BUNIT = ’MJy/sr ’ / Units of image data
GAIN = 3.3 / e/DN conversion
JY2DN = 314754.031 / Average Jy to DN Conversion
ETIMEAVE= 1.2000 / [sec] Average exposure time
PA_AVE = -39.85 / [deg] Average position angle
ZODY_AVE= -0.00317 / [Mjy/sr] Average ZODY_EST-SKYDRKZB
COMMENT Flux conversion (FLUXCONV) for this mosaic =
COMMENT Average of FLXC from each frame*(old pixel scale/new pixel scale)**2
FLUXCONV= 0.450565249 / Average MJy/sr to DN/s Conversion
COMMENT -----------------------------
COMMENT AORKEYS/ADS Ident Information
COMMENT -----------------------------
AOR001 = ’0009229056’ / AORKEYS used in this mosaic
AOR002 = ’0009230848’ / AORKEYS used in this mosaic
AOR003 = ’0009228544’ / AORKEYS used in this mosaic
AOR004 = ’0009235200’ / AORKEYS used in this mosaic
AOR005 = ’0009233664’ / AORKEYS used in this mosaic
DSID001 = ’ads/sa.spitzer#0009229056’ / Data Set Identification for ADS/journals
DSID002 = ’ads/sa.spitzer#0009230848’ / Data Set Identification for ADS/journals
DSID003 = ’ads/sa.spitzer#0009228544’ / Data Set Identification for ADS/journals
DSID004 = ’ads/sa.spitzer#0009235200’ / Data Set Identification for ADS/journals
DSID005 = ’ads/sa.spitzer#0009233664’ / Data Set Identification for ADS/journals
NIMAGES = 341 / Number of IRAC Frames in Mosaic
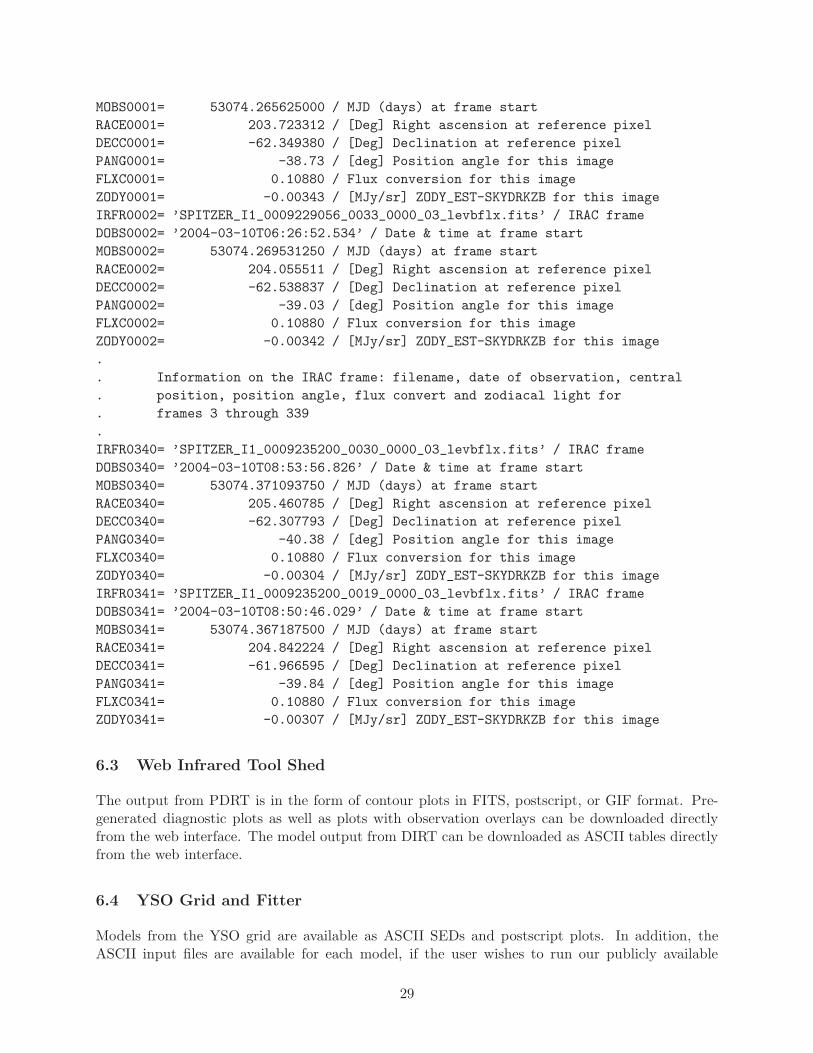
In addition to the FITS header information given above, the associated ASCII .hdr file includes in-formation about each IRAC frame used in the mosaic image. For example, GLM 30850+0000 mosaic I1.hdrincludes:
COMMENT ----------------------------------------
COMMENT Info on Individual Frames in Mosaic
COMMENT ----------------------------------------
IRFR0001= ’SPITZER_I1_0009229056_0027_0000_03_levbflx.fits’ / IRAC frame
DOBS0001= ’2004-03-10T06:25:08.534’ / Date & time at frame start
28
MOBS0001= 53074.265625000 / MJD (days) at frame start
RACE0001= 203.723312 / [Deg] Right ascension at reference pixel
DECC0001= -62.349380 / [Deg] Declination at reference pixel
PANG0001= -38.73 / [deg] Position angle for this image
FLXC0001= 0.10880 / Flux conversion for this image
ZODY0001= -0.00343 / [MJy/sr] ZODY_EST-SKYDRKZB for this image
IRFR0002= ’SPITZER_I1_0009229056_0033_0000_03_levbflx.fits’ / IRAC frame
DOBS0002= ’2004-03-10T06:26:52.534’ / Date & time at frame start
MOBS0002= 53074.269531250 / MJD (days) at frame start
RACE0002= 204.055511 / [Deg] Right ascension at reference pixel
DECC0002= -62.538837 / [Deg] Declination at reference pixel
PANG0002= -39.03 / [deg] Position angle for this image
FLXC0002= 0.10880 / Flux conversion for this image
ZODY0002= -0.00342 / [MJy/sr] ZODY_EST-SKYDRKZB for this image
.
. Information on the IRAC frame: filename, date of observation, central
. position, position angle, flux convert and zodiacal light for
. frames 3 through 339
.
IRFR0340= ’SPITZER_I1_0009235200_0030_0000_03_levbflx.fits’ / IRAC frame
DOBS0340= ’2004-03-10T08:53:56.826’ / Date & time at frame start
MOBS0340= 53074.371093750 / MJD (days) at frame start
RACE0340= 205.460785 / [Deg] Right ascension at reference pixel
DECC0340= -62.307793 / [Deg] Declination at reference pixel
PANG0340= -40.38 / [deg] Position angle for this image
FLXC0340= 0.10880 / Flux conversion for this image
ZODY0340= -0.00304 / [MJy/sr] ZODY_EST-SKYDRKZB for this image
IRFR0341= ’SPITZER_I1_0009235200_0019_0000_03_levbflx.fits’ / IRAC frame
DOBS0341= ’2004-03-10T08:50:46.029’ / Date & time at frame start
MOBS0341= 53074.367187500 / MJD (days) at frame start
RACE0341= 204.842224 / [Deg] Right ascension at reference pixel
DECC0341= -61.966595 / [Deg] Declination at reference pixel
PANG0341= -39.84 / [deg] Position angle for this image
FLXC0341= 0.10880 / Flux conversion for this image
ZODY0341= -0.00307 / [MJy/sr] ZODY_EST-SKYDRKZB for this image
6.3 Web Infrared Tool Shed
The output from PDRT is in the form of contour plots in FITS, postscript, or GIF format. Pre-generated diagnostic plots as well as plots with observation overlays can be downloaded directlyfrom the web interface. The model output from DIRT can be downloaded as ASCII tables directlyfrom the web interface.
6.4 YSO Grid and Fitter
Models from the YSO grid are available as ASCII SEDs and postscript plots. In addition, theASCII input files are available for each model, if the user wishes to run our publicly available
29
radiation transfer code. Fitter fluxes from all the models are available in ASCII format. Resultsfrom the SED fitter are in the form of postscript files.
7 APPENDIX A - Improvements/Fixes in the v2.0 Data Products
A.1 Main improvements in the SSC processing versions S13.2 and later
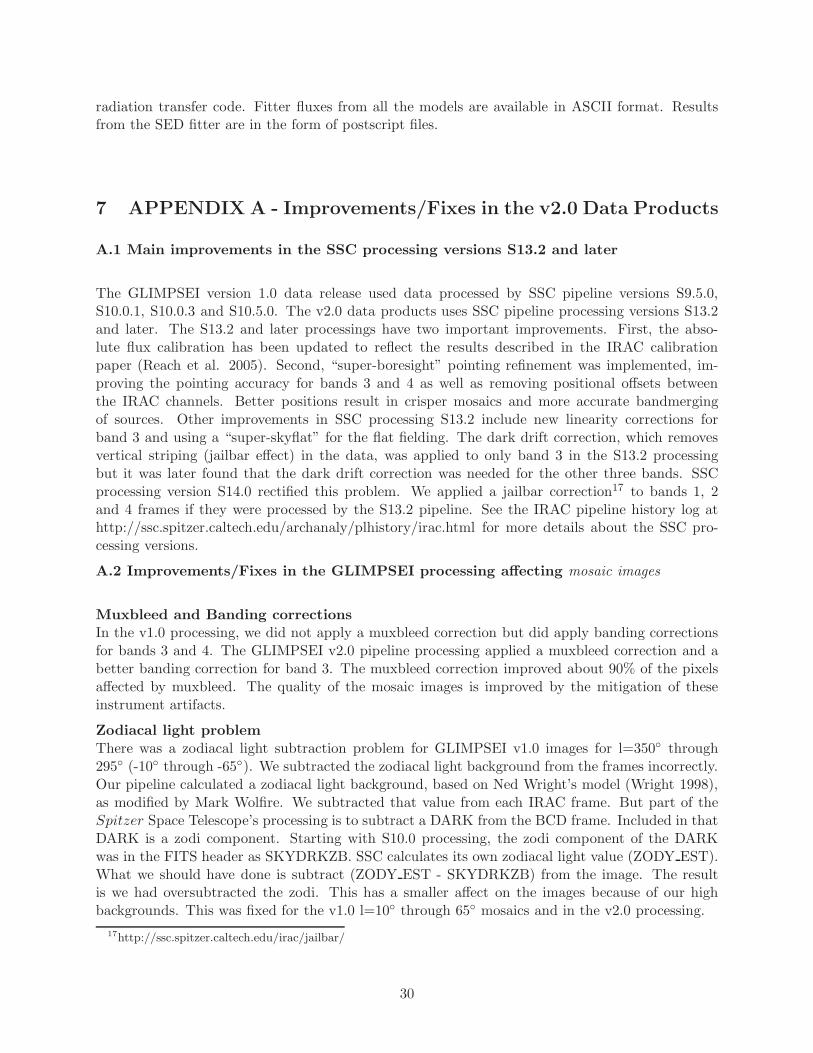
The GLIMPSEI version 1.0 data release used data processed by SSC pipeline versions S9.5.0,S10.0.1, S10.0.3 and S10.5.0. The v2.0 data products uses SSC pipeline processing versions S13.2and later. The S13.2 and later processings have two important improvements. First, the abso-lute flux calibration has been updated to reflect the results described in the IRAC calibrationpaper (Reach et al. 2005). Second, “super-boresight” pointing refinement was implemented, im-proving the pointing accuracy for bands 3 and 4 as well as removing positional offsets betweenthe IRAC channels. Better positions result in crisper mosaics and more accurate bandmergingof sources. Other improvements in SSC processing S13.2 include new linearity corrections forband 3 and using a “super-skyflat” for the flat fielding. The dark drift correction, which removesvertical striping (jailbar effect) in the data, was applied to only band 3 in the S13.2 processingbut it was later found that the dark drift correction was needed for the other three bands. SSCprocessing version S14.0 rectified this problem. We applied a jailbar correction17 to bands 1, 2and 4 frames if they were processed by the S13.2 pipeline. See the IRAC pipeline history log athttp://ssc.spitzer.caltech.edu/archanaly/plhistory/irac.html for more details about the SSC pro-cessing versions.
A.2 Improvements/Fixes in the GLIMPSEI processing affecting mosaic images
Muxbleed and Banding correctionsIn the v1.0 processing, we did not apply a muxbleed correction but did apply banding correctionsfor bands 3 and 4. The GLIMPSEI v2.0 pipeline processing applied a muxbleed correction and abetter banding correction for band 3. The muxbleed correction improved about 90% of the pixelsaffected by muxbleed. The quality of the mosaic images is improved by the mitigation of theseinstrument artifacts.
Zodiacal light problemThere was a zodiacal light subtraction problem for GLIMPSEI v1.0 images for l=350◦ through295◦ (-10◦ through -65◦). We subtracted the zodiacal light background from the frames incorrectly.Our pipeline calculated a zodiacal light background, based on Ned Wright’s model (Wright 1998),as modified by Mark Wolfire. We subtracted that value from each IRAC frame. But part of theSpitzer Space Telescope’s processing is to subtract a DARK from the BCD frame. Included in thatDARK is a zodi component. Starting with S10.0 processing, the zodi component of the DARKwas in the FITS header as SKYDRKZB. SSC calculates its own zodiacal light value (ZODY EST).What we should have done is subtract (ZODY EST - SKYDRKZB) from the image. The resultis we had oversubtracted the zodi. This has a smaller affect on the images because of our highbackgrounds. This was fixed for the v1.0 l=10◦ through 65◦ mosaics and in the v2.0 processing.
17http://ssc.spitzer.caltech.edu/irac/jailbar/
30

Addition of an associated .hdr file; Keywords Changes in the FITS HeaderThe v1.0 mosaic FITS file header included information about each IRAC frame, as well as otherstandard information (pointing, photometry) found in a FITS header. This made the FITS headervery large. We removed the information about the IRAC frames (filename, date of observation,etc.) from the FITS header and created an associated ASCII .hdr file containing that informationas well as all the keywords in the FITS header. The keywords EQUINOX, DELTA-X, DELTA-Y,PA AVE, and ZODY AVE were added to the FITS header. Keywords RACEnnnn, DECCnnnn,PANGnnnn (central position and position angle) were added to the information given for eachIRAC frame, found in the .hdr file. The keyword SEGNAME was removed from the FITS header.See §6.2 for an example of the v2.0 FITS header and the associated .hdr file.
A.3 Improvements/Fixes in the v2.0 processing affecting the source lists
Muxbleed and Banding correctionsApplying a muxbleed correction results in fewer false sources detected. The better banding correc-tion for band 3 provides a more uniform background for the source extraction.
Zodiacal light subtraction problem fixedThe over-subtraction of the zodiacal light in the v1.0 data release, discussed above, doesn’t affectthe photometry but the local sky background value given in the source lists is affected by thisproblem for all entries in the v1.0 source lists.
Source extraction improvementsThe GLIMPSEI v2.0 photometry contains several improvements over the initial GLIMPSEI pho-tometry. SSC BCD images have the estimated zodical light subtracted from it. This fact was nottaken into account in determining the appropriate 3-sigma detection level for the initial GLIMPSEIphotometry. Reprocessed photometry takes this into account and produces source lists that areless prone to false detections. Initial GLIMPSEI photometry was done using point source functions(PSFs) that were empirically derived from a single image containing several well sampled pointsources. The PSFs were determined for several IRAC campaigns containing GLIMPSEI data anddetermined to be stable. For GLIMPSEI v2.0 processing photometry, a single PSF (per band)comprised from a composite of many well sampled point sources was used. Also for bands 3 and4 that suffer electronic bandwidth effects (a decaying brightness every 4th pixel from the brightestpoint sources), the effects of the electronic bandwidth pixels were mitigated to improve the overallPSF for those two bands.
2MASS J, H, and Ks fluxes delivered, when available, with the IRAC dataWe provided only the IRAC magnitudes in our version 1.0 source lists. In the version 2.0 releasewe have bandmerged the IRAC data with the 2MASS All-Sky Point Source Catalog. If a 2MASSsource is found to be associated with the IRAC source, in addition to the IRAC information weprovide 2MASS identification names, fluxes, signal-to-noise and a limited Source Quality Flag. Theuser can refer back to the 2MASS PSC using the 2MASS identification for the complete informationabout the source.
Close Source Flag ImplementedThe Confusion Flag in the v1.0 source lists had not been implemented. In the v2.0 data release thisflag is renamed the Close Source Flag and is set when a source in the Archive is within 3.0′′ of thesource. It was found (see Section VIII of the GQA) that the magnitudes of a source with nearbysources closer than about 2′′ are not reliably extracted and bandmerged. See §5.1 for details aboutthis flag. We cull sources from the Archive and Catalog based on this flag. We have found it one of
31

the most useful improvements to our source lists as it removes problematic objects from our lists.
More Information Included in the Source Quality FlagSources within 3 pixels of a stray light area or a muxbleed corrected region are now flagged in theSource Quality Flag. See Table 4 and Appendix B for more details.
Improved Saturated Star Wing ShapeIn the v1.0 data release we had a circular mask with a width of 24 pixels surrounding each saturatedsource. Sources within 3 pixels of these areas were culled from the Catalog. For the v2.0 release wehave a PSF-shaped region which more accurately reflects the area affected by the diffraction spikesof the saturated source. Thus fewer sources are culled from the Catalog.
Photometric Correction as a Function of Position of the Source in the IRAC frameThe v1.0 source lists did not have this correction applied. SSC recommends that this correctionbe applied to give an improvement of up to 10% peak-to-peak in the flux calibration. The effect islower with the half-step observing strategy of GLIMPSEI.See http://ssc.spitzer.caltech.edu/irac/locationcolor/ for more details about this correction.
In-band and cross-band lumping of sourcesSources in the same IRAC frame within a radius of 2.0′′ are merged into one source before band-merging. Cross-band lumping is also done with a 2.0′′ radius. In the v1.0 source lists there waslimited in-band lumping and no cross-band lumping. In-band and cross-band lumping was imple-mented for the v2.0 source lists. This was done to reduce the instances of flux splitting and multiplesources. Bits were added to the Source Quality Flag to track which data have been lumped. Seethe discussion of bits 21 and 22 in Appendix B for more details.
Source list criteria modificationsWe consider the 2MASS Ks magnitude a detection (a “1”) in our source list criteria. In the “2+1”Catalog criteria, Ks is used with band 1 to determine if it is a source worthy of the Catalog (see§3.2). In the “1+1” Archive criteria, Ks is used with any band to determine if it is a source to beincluded in the Archive. For band 2, the faint flux limit (used for the Catalog) was changed from themore conservative 0.6 mJy in the v1.0 source lists to the original result, 0.4 mJy (see Section V ofthe GLIMPSE Quality Assurance Document http://www.astro.wisc.edu/sirtf/GQA-master.pdf).
Flux Calculation Method Flag ChangedSince we upgraded our pipeline to process HDR mode data which has two exposure times, wechanged the definition of this flag to track which frametimes were used in the final flux. It is notthat useful for GLIMPSEI which has a frametime of 2 secs. This value should always be 12.
Miscellaneous changes/fixesOther changes to the v2.0 processing are: we do not null out M & N (defined in §5.1) when thereis no flux in the band (i.e. the flux has been nulled), since they still contain useful information.Fi rms was in the wrong units in our v1.0 source lists. It is now in the proper units (mJy). Wetruncate the source designation, as per IAU standards, instead of rounding. The longitude positionfor large galactic longitudes had a “stair stepping” problem where the last digit to the right of thedecimal place was incorrect. This has been fixed (it was a 32-bit/64-bit issue).
32
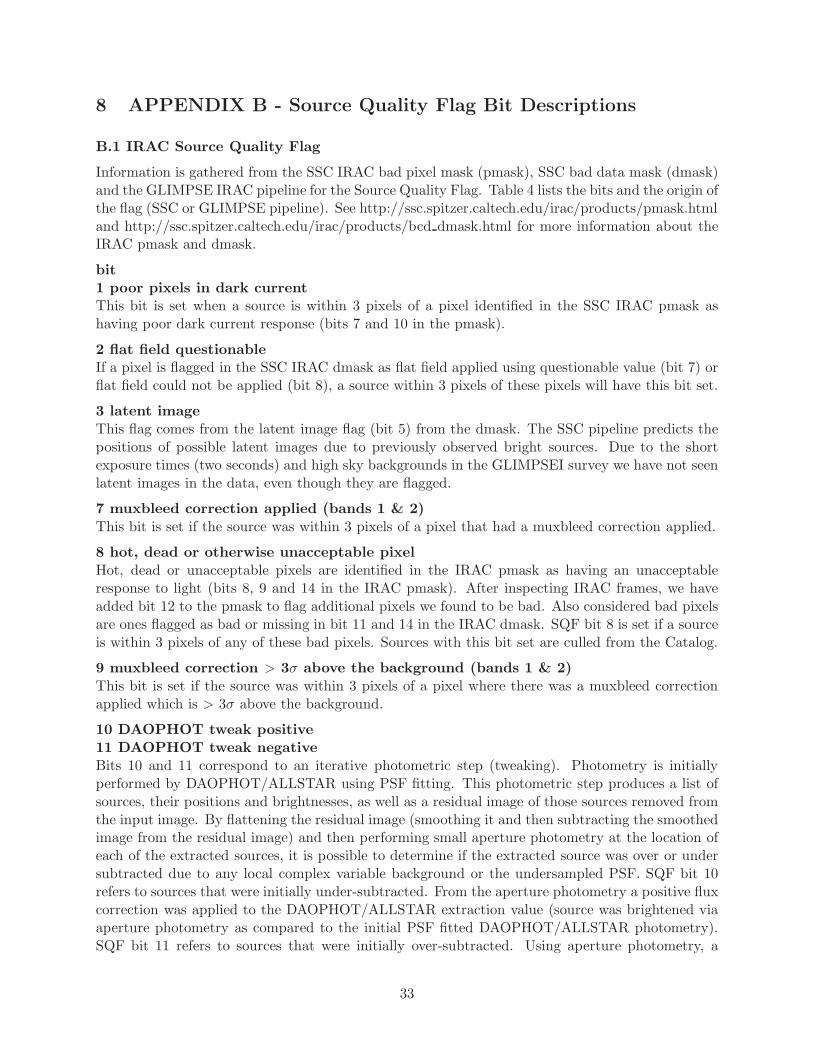
8 APPENDIX B - Source Quality Flag Bit Descriptions
B.1 IRAC Source Quality Flag
Information is gathered from the SSC IRAC bad pixel mask (pmask), SSC bad data mask (dmask)and the GLIMPSE IRAC pipeline for the Source Quality Flag. Table 4 lists the bits and the origin ofthe flag (SSC or GLIMPSE pipeline). See http://ssc.spitzer.caltech.edu/irac/products/pmask.htmland http://ssc.spitzer.caltech.edu/irac/products/bcd dmask.html for more information about theIRAC pmask and dmask.
bit1 poor pixels in dark currentThis bit is set when a source is within 3 pixels of a pixel identified in the SSC IRAC pmask ashaving poor dark current response (bits 7 and 10 in the pmask).
2 flat field questionableIf a pixel is flagged in the SSC IRAC dmask as flat field applied using questionable value (bit 7) orflat field could not be applied (bit 8), a source within 3 pixels of these pixels will have this bit set.
3 latent imageThis flag comes from the latent image flag (bit 5) from the dmask. The SSC pipeline predicts thepositions of possible latent images due to previously observed bright sources. Due to the shortexposure times (two seconds) and high sky backgrounds in the GLIMPSEI survey we have not seenlatent images in the data, even though they are flagged.
7 muxbleed correction applied (bands 1 & 2)This bit is set if the source was within 3 pixels of a pixel that had a muxbleed correction applied.
8 hot, dead or otherwise unacceptable pixelHot, dead or unacceptable pixels are identified in the IRAC pmask as having an unacceptableresponse to light (bits 8, 9 and 14 in the IRAC pmask). After inspecting IRAC frames, we haveadded bit 12 to the pmask to flag additional pixels we found to be bad. Also considered bad pixelsare ones flagged as bad or missing in bit 11 and 14 in the IRAC dmask. SQF bit 8 is set if a sourceis within 3 pixels of any of these bad pixels. Sources with this bit set are culled from the Catalog.
9 muxbleed correction > 3σ above the background (bands 1 & 2)This bit is set if the source was within 3 pixels of a pixel where there was a muxbleed correctionapplied which is > 3σ above the background.
10 DAOPHOT tweak positive11 DAOPHOT tweak negativeBits 10 and 11 correspond to an iterative photometric step (tweaking). Photometry is initiallyperformed by DAOPHOT/ALLSTAR using PSF fitting. This photometric step produces a list ofsources, their positions and brightnesses, as well as a residual image of those sources removed fromthe input image. By flattening the residual image (smoothing it and then subtracting the smoothedimage from the residual image) and then performing small aperture photometry at the location ofeach of the extracted sources, it is possible to determine if the extracted source was over or undersubtracted due to any local complex variable background or the undersampled PSF. SQF bit 10refers to sources that were initially under-subtracted. From the aperture photometry a positive fluxcorrection was applied to the DAOPHOT/ALLSTAR extraction value (source was brightened viaaperture photometry as compared to the initial PSF fitted DAOPHOT/ALLSTAR photometry).SQF bit 11 refers to sources that were initially over-subtracted. Using aperture photometry, a
33
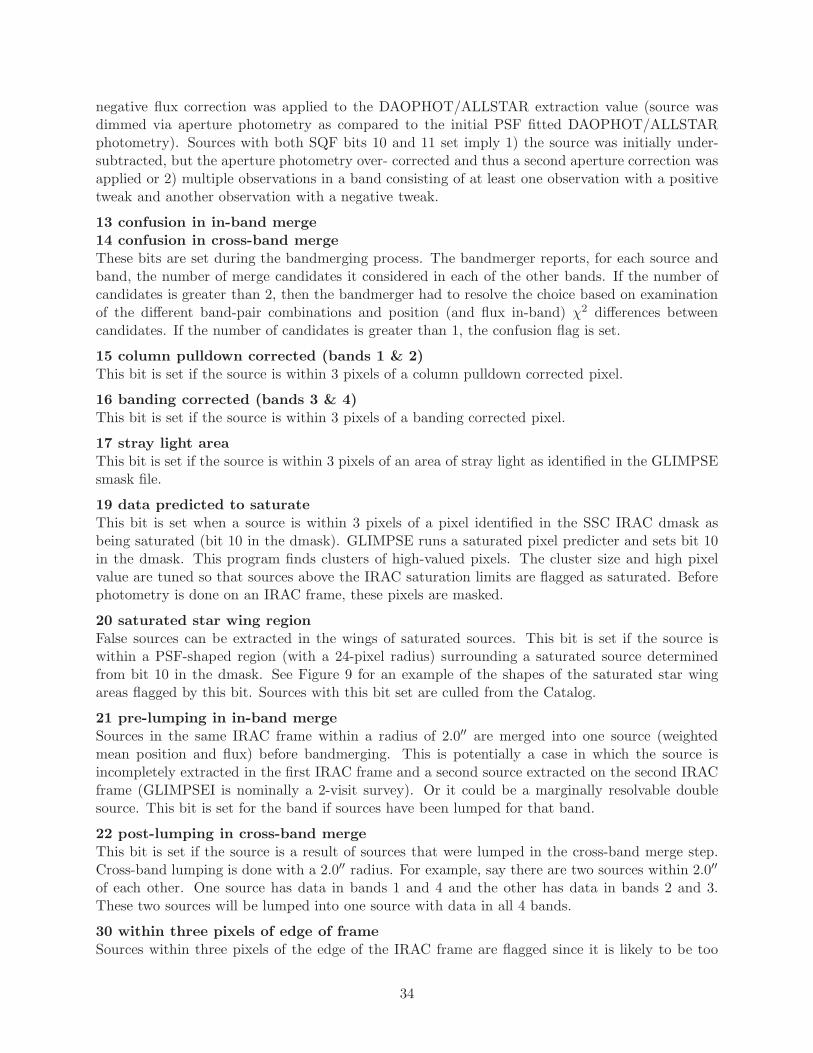
negative flux correction was applied to the DAOPHOT/ALLSTAR extraction value (source wasdimmed via aperture photometry as compared to the initial PSF fitted DAOPHOT/ALLSTARphotometry). Sources with both SQF bits 10 and 11 set imply 1) the source was initially under-subtracted, but the aperture photometry over- corrected and thus a second aperture correction wasapplied or 2) multiple observations in a band consisting of at least one observation with a positivetweak and another observation with a negative tweak.
13 confusion in in-band merge14 confusion in cross-band mergeThese bits are set during the bandmerging process. The bandmerger reports, for each source andband, the number of merge candidates it considered in each of the other bands. If the number ofcandidates is greater than 2, then the bandmerger had to resolve the choice based on examinationof the different band-pair combinations and position (and flux in-band) χ2 differences betweencandidates. If the number of candidates is greater than 1, the confusion flag is set.
15 column pulldown corrected (bands 1 & 2)This bit is set if the source is within 3 pixels of a column pulldown corrected pixel.
16 banding corrected (bands 3 & 4)This bit is set if the source is within 3 pixels of a banding corrected pixel.
17 stray light areaThis bit is set if the source is within 3 pixels of an area of stray light as identified in the GLIMPSEsmask file.
19 data predicted to saturateThis bit is set when a source is within 3 pixels of a pixel identified in the SSC IRAC dmask asbeing saturated (bit 10 in the dmask). GLIMPSE runs a saturated pixel predicter and sets bit 10in the dmask. This program finds clusters of high-valued pixels. The cluster size and high pixelvalue are tuned so that sources above the IRAC saturation limits are flagged as saturated. Beforephotometry is done on an IRAC frame, these pixels are masked.
20 saturated star wing regionFalse sources can be extracted in the wings of saturated sources. This bit is set if the source iswithin a PSF-shaped region (with a 24-pixel radius) surrounding a saturated source determinedfrom bit 10 in the dmask. See Figure 9 for an example of the shapes of the saturated star wingareas flagged by this bit. Sources with this bit set are culled from the Catalog.
21 pre-lumping in in-band mergeSources in the same IRAC frame within a radius of 2.0′′ are merged into one source (weightedmean position and flux) before bandmerging. This is potentially a case in which the source isincompletely extracted in the first IRAC frame and a second source extracted on the second IRACframe (GLIMPSEI is nominally a 2-visit survey). Or it could be a marginally resolvable doublesource. This bit is set for the band if sources have been lumped for that band.
22 post-lumping in cross-band mergeThis bit is set if the source is a result of sources that were lumped in the cross-band merge step.Cross-band lumping is done with a 2.0′′ radius. For example, say there are two sources within 2.0′′
of each other. One source has data in bands 1 and 4 and the other has data in bands 2 and 3.These two sources will be lumped into one source with data in all 4 bands.
30 within three pixels of edge of frameSources within three pixels of the edge of the IRAC frame are flagged since it is likely to be too
34
Figure 9: The band 1 IRAC frame (AOR 12110848, exposure 11) is on the left (corrections wereapplied for muxbleed and column pulldown); the flags for that frame are shown on the right. Straylight masks (SQF bit 17) are seen in the upper right hand corner of the frame. The PSF-shapedareas around the bright sources correspond to SQF bit 20. The vertical lines correspond to wherethe frame was corrected for column pulldown (SQF bit 15). The horizontal dots show which pixelswere corrected for muxbleed (SQF bits 7 and/or 9). Various small dots are hot, dead or bad pixels(SQF bit 8). Bits in the SQF will have been set for sources within 3 pixels of any of these areas.
close to the edge of the frame for accurate photometry to be done. Sources with this bit set areculled from the Catalog.
B.2 2MASS Source Quality Flag
For the 2MASS bands, the following contamination and confusion (cc) flags from the 2MASS All-Sky Point Source Catalog are mapped into bits 3, 4, 9 and 20 of the source quality flag. For moreinformation about the cc flags, seehttp://www.ipac.caltech.edu/2mass/release/allsky/doc/sec2 2a.html#cc flag. Users should con-sult the 2MASS PSC documentation for the complete information about the source, including allof their source quality flags.
bit3 “p” persistenceSource may be contaminated by a latent image left by a nearby bright star.
4 “c” photometric confusionSource photometry is biased by a nearby star that has contaminated the background estimation.
9 “s” electronic stripeSource measurement may be contaminated by a stripe from a nearby bright star.
14 confusion in cross-band mergeThis bit is set during the bandmerging process. The bandmerger reports, for each source and
35
band, the number of merge candidates it considered in each of the other bands. If the number ofcandidates is greater than 2, then the bandmerger had to resolve the choice based on examination ofthe different band-pair combinations and position χ2 differences between candidates. If the numberof candidates is greater than 1, the confusion flag is set.
20 “d” diffraction spike confusionSource may be contaminated by a diffraction spike from a nearby star.
B.3 Key to Bit Values
This section describes how to determine the bit values of a Source Quality Flag.
bt = bit in sqfvalue = 2(bit−1) i.e. bit 3 corresponds to 22=4
bit values: bt 1 => 1; 2 => 2; 3 => 4; 4 => 8; 5 => 16; 6 => 32; 7 => 64; 8 => 128 bt 9=> 256; 10 => 512; 11 => 1024; 12 => 2048; 13 => 4096; 14 => 8192; 15 => 16384; bt 16=> 32768; 17 => 65536; 18 => 131072; 19 => 262144; 20 => 524288; bt 21 => 104857; 22 =>2097152; 30 => 536870912
For example, the Source Quality Flags in the example in Table 8 are 8 for all three 2MASS bands.This translates to bit 4 being set, which is the photometric confusion flag from the 2MASS PSC.IRAC band 2 has a SQF of 16384. This means bit 15 has been set which means the source is withinthree pixels of a column pulldown corrected area.
REFERENCESAraya, E., Hofner, P., Churchwell, E.,and Kurtz, S. 2002, ApJS, 138, 63.Benjamin, R.A., et al. 2003, PASP, 115, 953.Calabretta, M.R. and Greisen, E.W. 2002, A & A, 395, 1077.Cohen, M., Wheaton, W.A., and Megeath, S.T. 2003, AJ, 126, 1090.Cutri, R. et al. 2005, http://pegasus.phast.umass.edu/ipac wget/releases/allsky/doc/sec2 2.html#pscastrprop.Fazio, G.G. et al. 2004, ApJS, 154, 10.Hora, J. et al 2004, Proc SPIE, 5487, 77.Jackson, J.M., Rathborne, J.M., Shah, R.Y., Simon, R., Bania, T.M., Clemens, D.P., Chambers,E.T., Johnsom, A.M., Dormody, M., and Lavoie, R. 2006, ApJS,163, 145.Kaufman, M.J., Wolfire, M.G., Hollenbach, D.J., and Luhman, M.L. 1999, ApJ, 527, 795.Kaufman, M. J.,Wolfire, M. G., & Hollenbach, D. J. 2006, ApJ, 644, 283.Price, S.D., et al. 2001, AJ, 121, 2819.Reach, W. et al. 2005, PASP, 117, 978.Robitaille, T., Whitney, B., Indebetouw, R., Wood, K. & Denzmore, P. 2006, ApJS, 167, 256.Robitaille, T., Whitney, B., Indebetouw, R., & Wood, K. 2007, ApJS, 169, 328Robitaille, T. et al 2007, AJ, submittedSkrutskie, M.F. et al. 2006, AJ, 131, 1163.Stetson, P. 1987, PASP, 99, 191.Tielens, A.G.G.M. and and Hollenbach, D.J. 1985, ApJ, 291, 722.Watson, C., Araya, E., Sewilo, M., Churchwell, E., Hofner, P., and Kurtz, S. 2003, ApJ, 587, 714.Werner, M.W. et al. 2004, ApJS, 154, 1.Whitney, B.A. et al., 2003a, ApJ, 591, 1049.Whitney, B.A. et al., 2003b, ApJ, 598, 1079.
36
Whitney, B.A. et al., 2004, ApJ, 617, 1177.Wolfire, M.G. and Cassinelli, J.P. 1986, ApJ, 310, 207.Wolfire, M.G., Tielens, A.G.G.M., and Hollenbach, D.J. 1990, ApJ, 358, 116.Wright, E.L., 1998, ApJ, 496, 1.
GLOSSARY
2MASS Two Micron All Sky SurveyBCD Basic Calibrated Data, released by the SSCCORNISH Coordinated Radio and Infrared Survey for High-Mass Star FormationDIRT Dust Infrared Toolbox, for data analysisdmask A data quality mask supplied by the SSC for the BCDGBT Green Bank Telescope (100 m)GLIMPSE Galactic Legacy Infrared Midplane Survey ExtraordinaireGLMIC GLIMPSEI Point Source CatalogGLMIA GLIMPSEI Point Source ArchiveGPD GLIMPSE Pipeline DescriptionGQA GLIMPSE Quality AssuranceGRS Galactic Ring Survey (13CO)IPAC Infrared Processing and Analysis CenterIRAC Spitzer Infrared Array CameraIRS Spitzer Infrared SpectrometerIRSA InfraRed Science ArchiveMF Method Flag used to indicate exposure times included in the fluxMIPS Spitzer Multiband Imaging PhotometerMSX Midcourse Space ExperimentNRAO National Radio Astronomy ObservatoryOSV Observation Strategy ValidationPDR Photodissociation RegionPDRT PhotoDissociation Region Toolbox, for data analysispmask A bad pixel mask supplied by the SSC for the BCDPSF Point Spread Functionrmask Outlier (radiation hit) maskSOM Spitzer Observer’s ManualSSC Spitzer Science CenterSED Spectral energy distributionSQF Source Quality FlagSST Spitzer Space Telescopesmask Stray light maskTBD To Be DeterminedVLA Very Large ArrayYSO Young Stellar ObjectWITS Web Infrared Tool Shed, for data analysis
37