Embed Size (px)
Citation preview
Global Adult Tobacco Survey
: Thailand Report, 2011
WHO Library Cataloguing-in-Publication data World Health Organization, Regional Office for South-East Asia. Global adult tobacco survey: Thailand report 2011. 1. Tobacco use disorder - prevention and control. 2. Tobacco use cessation. 3. Tobacco industry - economics - legislation. 4. Smoking - prevention and control.
5. Knowledge, Attitudes, Practice. 6. Thailand ISBN 978-92-9022-421-1 (NLM classification: WM 290)
The publication may be obtained from:
Bureau of Tobacco Control Department of Disease Control (DDC)Ministry of Public Health Nonthaburi, 11000Thailand Tel. +662 580 6962Fax. +662 580 9307
Office of the WHO Representative to Thailand Office of the Permanent Secretary Building 3, 4th FlMinistry of Public Health Nonthaburi, 11000Thailand Tel. +662 590 1524 Fax. +662 591 8199
© World Health Organization 2011
All rights reserved. Requests for publications, or for permission to reproduce or translate WHO publications – whether for sale or for noncommercial distribution – can be obtained from Publishing and Sales, World Health Organization, Regional Office for South-East Asia, Indraprastha Estate, Mahatma Gandhi Marg, New Delhi 110 002, India (fax: +91 11 23370197; e-mail: [email protected]).
The designations employed and the presentation of the material in this publication do not imply the expression of any opinion whatsoever on the part of the World Health Organization concerning the legal status of any country, territory, city or area or of its authorities, or concerning the delimitation of its frontiers or boundaries. Dotted lines on maps represent approximate border lines for which there may not yet be full agreement.
The mention of specific companies or of certain manufacturers’ products does not imply that they are endorsed or recommended by the World Health Organization in preference to others of a similar nature that are not mentioned. Errors and omissions accepted, the names of proprietary products are distinguished by initial capital letters.
All reasonable precautions have been taken by the World Health Organization to verify the information contained in this publication. However, the published material is being distributed without warranty of any kind, either expressed or implied. The responsibility for the interpretation and use of the material lies with the reader. In no event shall the World Health Organization be liable for damages arising from its use.
This publication does not necessarily represent the decisions or policies of the World Health Organization.
Printed in Thailand Nice Earth Design Co., LTD., 2012
Tel: 66-2526-1153 Fax: 66-2696-0851

i
Foreword Monitoring tobacco control through a standard mechanism is the cornerstone for understanding the trends in tobacco use, and tobacco control policy and programme effectiveness. Availability of reliable, accurate data at periodic intervals is also the key to determining the interventions and approaches required to improve programme performance and persuade policy-makers to adopt appropriate policy measures. Article 21 of the WHO Framework Convention on Tobacco Control also recommends periodic monitoring and reporting on tobacco control indicators.
The recognition of the need for a standardized survey to monitor adult tobacco use led WHO and its partners, in particular, Centers for Disease Control and Prevention, Atlanta, USA, and Centers for Disease Control and Prevention Foundation, USA, to launch the Global Adult Tobacco Survey (GATS) in 2007 under the Bloomberg Initiative. The survey is designed to produce nationally representative estimates on tobacco control indicators that are comparable over time and across nations using a standard protocol. Thailand implemented the Global Adult Tobacco Survey and measured the impact of tobacco control and prevention initiatives in 2009.
I am pleased to learn that this is the first report of the repeat Global Adult Tobacco Survey 2011–2012 carried out in the world under the Bloomberg Initiative. The report has been able to capture important data on different aspects of the tobacco control programme in Thailand. The standard and efficient design for data collection and management will help in comparing data between 2009 and 2011, and will provide a good opportunity to understand programme gaps. It will also help in further strengthening tobacco control in Thailand.
I would like to congratulate the implementing agencies and all those involved for having completed the survey successfully, which I am surely has contributed substantially to capacity building of the country to conduct large and standardized surveys.
Most importantly, the findings mentioned in this report will be useful for designing and strengthening effective tobacco control interventions in Thailand.
Dr Samlee Plianbangchang Regional Director
Global Adult Tobacco Survey : Thailand Report, 2011 i

ii
Foreword
Improving Thai People’s health is the main policy of the Ministry of Public Health (MoPH). As is well known, tobacco use is one the major risk factors for noncommunicable diseases (NCDs), which are the current public health problems in Thailand. Tobacco control is considered a very important measure and the most effective tool of the MoPH to reduce the burden of NCDs and other related diseases.
Thailand has signed and ratified the Framework Convention on Tobacco Control of the World Health Organization (WHO FCTC) in 2003 and 2004, respectively. The MoPH has supported implementation of tobacco control according to the FCTC by consolidating a multisectoral national FCTC body, composed of relevant governmental and nongovernmental organizations. Moreover, the MoPH, through the Bureau of Tobacco Control, Department of Disease Control, has developed the National Strategic Plan for Tobacco Control, 2010–2014 for strengthening and developing national capacity in tobacco control. The Global Adult Tobacco Survey (GATS), an important part of the National Strategic Plan for Tobacco Control, is a comprehensive surveillance activity, not only for monitoring the progress and effectiveness of national tobacco control in Thailand but also for implementing FCTC Article 20: Research, surveillance and exchange of information.
I strongly support this tobacco control measure and would like to ensure that the results of this study are used for monitoring, evaluating and further improving the implementation of the National Tobacco Control Plan.
I would like to express my gratitude to the World Health Organization, U.S. Centers for Disease Control and Prevention, Bloomberg Philanthropies, National Statistical Office and Mahidol University for their prompt and magnificent technical support. Specifically, my gratitude to the Bureau of Tobacco Control, Department of Disease Control and all of its related staff who have worked hard to achieve this success and create a record in history by becoming the first country to conduct a repeat GATS survey.
Mr Wittaya Buranasiri,
Minister of Public Health
ii

Global Adult Tobacco Survey : Thailand Report, 2011
iii
Foreword
The prevalence of smoking in Thailand has decreased continuously since 1991, when there were about 12.3 million adults above the age of 15 years who smoked, accounting for about 32.0% of the population. By 2009, the number of adult smokers reduced to about 10.9 million, and comprised 20.7% of the population. This was an 11.3% decrease in smoking prevalence over a period of 18 years. This reduction in Thailand is the result of a very strong commitment to tobacco control over 30 years through collaborative efforts by all sectors, including the government, NGOs and civil society. The National Strategic Plan for Tobacco Control 2010–2014 was developed and approved by the National Committee for Tobacco Consumption Control on 22 April 2010. The mission is to support collaboration among tobacco control networks to conduct surveillance in order to protect Thai citizens from addiction, morbidity, disability and mortality caused by the use of tobacco products.
The Global Adult Tobacco Survey (GATS) aims to systematically monitor adult tobacco use and track key tobacco control indicators in a nationally representative sample, and track implementation of WHO FCTC recommended policies outlined in the MPOWER strategies. Thus, the effort of the GATS Thai team would be very beneficial for the MoPH to monitor and evaluate our tobacco control programme and improve policies to achieve a smoke-free Thailand in the near future.
Dr Porntep Siriwanarungsun Director General
Department of Disease Control
Foreword
On behalf of the Thai National Statistical Office, I would like to express my sincere appreciation to the Department of Disease Control, Faculty of Public Health, Mahidol University for jointly implementing the 2011 Global Adult Tobacco Survey in Thailand. My special thanks go to the Centers for Disease Control and Prevention (CDC), United States and the World Health Organization for their technical support, and to the Bloomberg Philanthropies, Thai Health Promotion Foundation and the Thai Government for their financial support. The final report has been released.
Data on tobacco consumption, including data on the economics, knowledge and attitudes towards tobacco consumption from this survey are very critical as they can be used in planning and policy formulation for the control and surveillance of tobacco consumption in Thailand. Moreover, since the survey strictly followed international standards in terms of questionnaires and sampling design, including data collection and management procedures, its results can be compared against international contexts. I am so proud that with our hard work, the objectives of the MPOWER policy for tobacco control have been completely met.
Mr Viboondhat Sudhantanakit Director General of the National Statistical Office
iii

iv
Foreword Thailand, among 14 other initial low- and middle-income countries where more than half of the world’s smokers live, conducted the Global Adult Tobacco Survey (GATS) in 2009. Thailand has used the GATS results to strengthen the national tobacco surveillance systems. We have integrated the GATS questionnaire into our national tobacco consumption surveys, which are carried out every three years by the National Statistical Office.
The main topics covered in GATS are the prevalence of tobacco use, exposure to second-hand tobacco smoke, cessation, knowledge, attitudes and perceptions, exposure to the media and economics. These results are an
advantage for us in considering our tobacco control strategies such as the MPOWER strategies and interventions in the National Strategic Plan for Tobacco Control, 2010–2014.
I am very thankful to the CDC, WHO and Bloomberg Philanthropies for supporting Thailand in performing the second round of GATS. The results from this survey can be compared with the first GATS and would be of benefit in monitoring our tobacco control policy. I am also thankful to the Thai GATS team for their hard work in completing this excellent survey that reflects our control policy. These results will be necessary for our policy-makers and networks to develop their work effectively.
Professor Dr Prakit Vathesatogkit Executive Secretary of Action on Smoking
and Health Foundation Thailand (ASH Thailand)
Foreword
On behalf of the Faculty of Public Health, Mahidol University, we are very pleased to contribute to tobacco control interventions at the national and international levels. The faculty offers instructions on tobacco control in some undergraduate and MPH curriculum. We also provide technical services research related tobacco control.
We continuously appreciate to support and being the partner of the MoPH, nongovernmental organizations and civil society to develop and implement the effective tobacco control programmes, rendering advocate for public policy, social marketing campaigns and public education.
The faculty supports our staff respectively in participating in GATS, both in the first round in 2009 and the second round in 2011. I sincerely hope that our contribution can be one of the important hand that drives the tobacco control policy to achieve the objectives of the National Tobacco Control Plan and, finally, health for all.
Associate Professor Dr Phitaya Charupoonphol
Dean of Faculty of Public Health, Mahidol University
iv
Global Adult Tobacco Survey : Thailand Report, 2011
v
Preface Over two decades, Thailand has strongly advocated for the implementation of various tobacco control strategies to bring about a change in the social norm of smoking. Tobacco use was deemed to be gradually decreasing from 1991 to 2004 with close observation through surveillance every two years. However, up to present, the situation of tobacco use has not improved. Instead, it remained static and, in fact, showed a rising trend. As is well known, tobacco use is one of the top ten risk factors for disease, hence this increasing trend is a matter of concern.
As part of the Global Tobacco Surveillance System (GTSS), the Global Adult Tobacco Survey (GATS) uses a standard protocol that generally provides comprehensive monitoring of the various aspects of tobacco use as well as tracks key tobacco control indicators in Thailand.
This report provides not only the results of the 2011 GATS but also compares the results of the 2009 GATS and 2011 GATS. The contents are divided into ten chapters. Chapter 1: Introduction – provides an overview of the GTSS, the burden of tobacco use in Thailand and the survey objectives, Chapter 2: Methodology – describes the survey methods and provides information on the study population, sampling design, questionnaire, data collection and statistical analysis. Chapter 3: Sample and Population Characteristics – describes the adult Thai population (15 years of age and above).
The next six chapters address key survey findings by the topic areas covered in the survey questionnaire. These include Chapter 4: Tobacco Use, Chapter 5: Cessation and Chapter 6: Second-hand Smoke. Chapter 7: Economics, examines the costs of manufactured cigarettes and shredded tobacco products, Chapter 8: Media, focuses on smoking tobacco, and Chapter 9: Knowledge, Attitudes and Perceptions, discusses these with respect to tobacco use. Each of these chapters is divided into two parts. The first part covers the survey findings of the 2011 GATS and the second compares the findings of the 2009 GATS and 2011 GATS.
Chapter 10: Conclusion and Recommendations – provides an overview of GATS, lessons learnt from the 2009 GATS, and policy recommendations according to the MPOWER strategy. This strategy has six proven tobacco control measures developed by the World Health Organization (WHO). Each recommended strategy consists of important findings, policy goals, recommendations, and possible problems or obstacles in implementing recommendations.
This publication provides opportunities for both national and international tobacco control partners to utilize the survey findings for improving tobacco control surveillance and strategies. We hope that our efforts will energize Thailand’s tobacco control partners to make relentless efforts to initiate more effective tobacco control programmes to finally end tobacco use.
Core staff of the GATS Thailand Working Group
April 2012
v

vi
Contributors
Contributing authors:
Dr Sarunya Benjakul Department of Disease Control, Ministry of Public Health
Asst Prof. Dr Mondha Kengganpanich Faculty of Public Health, Mahidol University
Asst Prof. Dr Lakkhana Termsirikulchai Faculty of Public Health, Mahidol University
Assoc Prof. Tharadol Kengganpanich Faculty of Public Health, Mahidol University
Mr Nuttapon Theskayan GATS Office, Department of Disease Control
Ms Hataichanok Puckcharern National Statistical Office
Ms Chitrlada Touchchai National Statistical Office
Ms Areerat Lohtongmongkol National Statistical Office
Reviewers:
Dr Dhirendra N. Sinha World Health Organization Regional Office for South-East Asia (WHO SEARO)
Dr Jason Hsia Dr Krishna Mohan Palipudi Dr Samira Asma Dr Linda Andes Ms Glenda Blutcher-Nelson
Global Tobacco Control Office on Smoking and Health, Centers for Disease Control and Prevention (CDC)
vi

Global Adult Tobacco Survey : Thailand Report, 2011
vii
Acknowledgements
Thailand implemented the Global Adult Tobacco Survey (GATS) in 2009 and was chosen as the first country to conduct a repeat GATS in 2011 using standard global protocols. The GATS evaluates current tobacco control measures and policies in order to strengthen tobacco surveillance in Thailand. A comparison between the findings of the 2009 GATS and 2011 GATS indicates the change in tobacco use prevalence and other indicators, which reflect the implementation of Thailand’s tobacco control policies.
Our achievements are due to the great dedication and support of our partners. First of all, GATS Thailand would like to thank Bloomberg Philanthropies for initiating this repeat survey through the Centers for Disease Control and Prevention Foundation. Special mention must be made of Mr William Parra and Mr Brandon Tally. We also thank the WHO Regional Office for South-East Asia (SEARO) and WHO Thailand Office, especially Dr Dhirendra N Sinha and Dr Chai Krittiyapichatkul, who facilitated the development of the survey proposal and grant procedures, provided consultancy and supported this survey.
Our sincere thanks also go to all experts from the Global Tobacco Control Program of the Office of Smoking and Health, CDC who strongly supported our work and helped us to efficiently achieve timely results of the highest quality. The experts include Dr Samira Asma, chief of the Global Tobacco Control Branch, Dr Jason Hsia, CDC focal point for Thailand, and senior biostatistician, Dr Linda Andes and Ms Glenda Blutcher-Nelson for their analytical support of the data. We sincerely acknowledge Raydel Valdes Saigado, Krishna Mohan Palipudi, Jeremy Morton, Deliana Kostova, David Homa and Terry Pechacek for their review of and comments on the initial drafts of the report. We thank Edward Rainey, Sophia Song and Brian Taitt for their support during the preparation of the report. Thanks are also due to Johanna Birckmayer from the Campaign for Tobacco Free Kids (CTFK), and Jennifer Ellis and Kelly Henning from Bloomberg Philanthropies for their guidance on report preparation.
We would like to express our deepest gratitude to the core technical staff team responsible for implementing the survey. This team consisted of researchers and academic officers from the Bureau of Tobacco Control, Department of Disease Control, Ministry of Public Health, National Statistical Office, and the Faculty of Public Health, Mahidol University, who all kindly cooperated in completing this survey. We especially thank the country policy-makers and tobacco control experts from related government and nongovernmental organizations.
We also greatly appreciate the cooperation of the National Statistical Office (NSO), Ministry of Information and Communication Technology, Action on Smoking and Health Foundation (ASH Thailand), Thai Health Promotion Foundation, and Tobacco Control Research and Knowledge Management Center (TRC).
Finally, the most heartfelt acknowledgement goes to the Provincial Technical Officers and Field Interviewers from our Provincial Statistical Offices, and all respondents who participated in producing this successful and effective survey.
Core staff of the GATS Thailand Working Group April 2012
vii
viii
Contents
Foreword ........................................................................................................................................................ i Preface........................................................................................................................................................... v Contributors ................................................................................................................................................ vi Acknowledgements .................................................................................................................................... vii Contents ..................................................................................................................................................... viii Tables ............................................................................................................................................................ x Figures ........................................................................................................................................................ xvi Executive Summary ......................................................................................................................... xix 1. Introduction ............................................................................................................................... 1-1
1.1 Thailand country profile 1-1 1.2 Burden of tobacco use in Thailand 1-2 1.3 Tobacco production in Thailand 1-4 1.4 Current tobacco control policies in Thailand 1-4 1.5 Survey objectives 1-9
2. Methodology .............................................................................................................................. 2-1 2.1 Study population 2-1 2.2 Eligibility criteria 2-1 2.3 Sampling criteria 2-1 2.4 Questionnaire 2-2 2.5 Application program for data recording 2-3 2.6 Recruitment and training procedures 2-3 2.7 Data collection 2-4 2.8 Statistical analysis 2-5 2.9 Data interpretation 2-5
3. Sample and population characteristics ........................................................................................ 3-1 3.1 Household- and person-level response rate 3-1 3.2 Sample and population characteristics 3-1
4. Tobacco use ................................................................................................................................ 4-1 4.1 Tobacco use in 2011 4-2 4.2 Comparison of tobacco use in 2009 and 2011 4-28
5. Cessation .................................................................................................................................... 5-1 5.1 Cessation in 2011 5-1 5.2 Comparison of cessation findings in 2009 and 2011 5-11
6. Second-hand smoke .................................................................................................................... 6-1 6.1 Exposure to situations with second-hand smoke in 2011 6-1 6.2 Comparison of exposure to situations with second-hand smoke in 2009 and 2011 6-7
7. Economics .................................................................................................................................. 7-1 7.1 Economics of tobacco use in 2011 7-1 7.2 Comparison of the economics of tobacco use in 2009 and 2011 7-9
viii
Global Adult Tobacco Survey : Thailand Report, 2011
ix
8. Media ......................................................................................................................................... 8-1 8.1 Media awareness-related tobacco use in 2011 8-1 8.2 Comparison of media awareness-related tobacco use in 2009 and 2011 8-13
9. Knowledge, attitudes and perceptions ........................................................................................ 9-1 9.1 Knowledge, attitudes and perceptions related to tobacco use in 2011 9-1
9.2 Comparison of knowledge, attitudes and perceptions related to tobacco use in 2009 and 2011 9-21
10. Conclusion and recommendations ........................................................................................... 10-1 References ..................................................................................................................................... R-1 Appendix A: Questionnaire ............................................................................................................. A-1 Appendix B: Sample design ............................................................................................................. B-1 Appendix C: Estimation of sampling errors ...................................................................................... C-1 Appendix D: Tables number in thousands ....................................................................................... D-1 Appendix E: Glossary and abbreviations ......................................................................................... E-1 Appendix F: MPOWER summary indicators – GATS Thailand, 2011 ................................................... F-1 Appendix G: Technical and survey staffs .......................................................................................... G-1
ix
x
Tables 3. Sample and population characteristics Table 3.1: Number and percentage of households and persons interviewed and response
rate by residence (unweighted) – GATS Thailand, 2011 .................................................... 3-2Table 3.2: Unweighted sample counts and weighted population estimates by demographic
characteristics – GATS Thailand, 2011 ................................................................................ 3-3 Table 3.3: Unweighted sample counts and weighted population estimates by demographic
characteristics – GATS Thailand, 2009 and 2011. .............................................................. 3-4 4. Tobacco use Table 4.1: Number (in thousands) and percentage of adults aged 15 years and above by
detailed smoking status and gender – GATS Thailand, 2011 ............................................ 4-2 Table 4.2: Number (in thousands) and percentage of adults aged 15 years and above by
detailed status of smokeless tobacco use and gender – GATS Thailand, 2011 ................. 4-3 Table 4.3: Percentage of adults aged 15 years and above who were current smokers of various
smoked tobacco products, by selected demographic characteristics – GATS Thailand, 2011 .................................................................................................. 4-5
Table 4.4: Percentage distribution of adults aged 15 years and above who were daily smokers, occasional smokers and non-smokers, by selected demographic characteristics – GATS Thailand, 2011 ........................................................................................................... 4-7
Table 4.5: Percentage distribution of manufactured cigarettes smoked per day among daily smokers of manufactured cigarettes aged 15 years and above, by selected demographic characteristics – GATS Thailand, 2011 ...................................................... 4-10
Table 4.6: Percentage distribution of hand-rolled cigarettes smoked per day among daily hand-rolled cigarette smokers aged 15 years and above, by selected demographic characteristics – GATS Thailand, 2011 .............................................................................. 4-12
Table 4.7: Percentage distribution of age at initiation among ever daily smokers aged 20–34 years, by selected demographic characteristics – GATS Thailand, 2011 ............... 4-13
Table 4.8: Number (in thousands) and percentage of adults and ever daily smokers aged 15 years and above who were former daily smokers, by selected demographic characteristics – GATS Thailand, 2011 .............................................................................. 4-14
Table 4.9: Percentage distribution of time since quitting among former daily smokers aged 15 years and above, by selected demographic characteristics – GATS Thailand, 2011 ... 4-16
Table 4.10: Percentage distribution of time to first smoke among daily smokers aged 15 years and above, by selected demographic characteristics – GATS Thailand, 2011 ................. 4-17
Table 4.11: Percentage of adults aged 15 years or above who were current users of various smokeless tobacco products, by selected demographic characteristics – GATS Thailand, 2011 ......................................................................................................... 4-18
Table 4.12: Percentage distribution of smokeless tobacco users aged 15 years and above who were daily, occasional or non-users, by selected demographic characteristics – GATS Thailand, 2011 ......................................................................................................... 4-21
x
Global Adult Tobacco Survey : Thailand Report, 2011
xi
Table 4.13: Percentage distribution of age at initiation among ever daily smokeless tobacco users aged 60–79 years, by selected demographic characteristics – GATS Thailand, 2011 ......................................................................................................... 4-23
Table 4.14: Number (in thousands) and percentage of adults and ever daily smokeless tobacco users aged 15 years and above who were former daily smokeless tobacco users,
by selected demographic characteristics – GATS Thailand, 2011 .................................... 4-23Table 4.15: Percentage distribution of time since quitting among former daily smokeless tobacco
users aged 15 years or above, by selected demographic characteristics – GATS Thailand, 2011 ......................................................................................................... 4-24
Table 4.16: Percentage distribution of time to first use among daily smokeless tobacco users aged 15 years and above, by selected demographic characteristics – GATS Thailand, 2011 ......................................................................................................... 4-25
Table 4.17: Percentage of adults who were current tobacco users, and the percentage distribution of tobacco use patterns among current tobacco users aged 15 years and above, by selected demographic characteristics – GATS Thailand, 2011 .................................... 4-26
Table 4.18: Percentage of adults aged 15 years and above, by detailed smoking status and gender – GATS Thailand, 2009 and 2011 .......................................................................... 4-29
Table 4.19: Percentage of adults aged 15 years and above, by detailed smokeless tobacco use status and gender – GATS Thailand, 2009 and 2011 ........................................................ 4-30
Table 4.20: Percentage of adults aged 15 years and above who were current smokers of various smoked tobacco products, by selected demographic characteristics – GATS Thailand, 2009 and 2011 ......................................................................................... 4-31
Table 4.21: Percentage distribution of age at initiation among ever daily smokers aged 20–34 years old, by selected demographic characteristics – GATS Thailand, 2009 and 2011 ......................................................................................... 4-33
Table 4.22: Percentage of former daily smokers among all adults (current non-smokers) and former daily smokers among ever daily smokers, by selected demographic characteristics – GATS Thailand, 2009 and 2011 .............................................................. 4-34
5. Cessation
Table 5.1: Percentage distribution of current smokers aged 15 years and above, by interest in quitting smoking and selected demographic characteristics – GATS Thailand, 2011 ........ 5-2
Table 5.1a: Percentage distribution of current smokeless tobacco users aged 15 years and above, by interest in quitting the use of smokeless tobacco products and selected demographic characteristics – GATS Thailand, 2011 ......................................................... 5-3
Table 5.2: Percentage of smokers aged 15 years and above who made a quit attempt and received health-care provider advice in the past 12 months, by selected demographic characteristics – GATS Thailand, 2011 ................................................................................ 5-5
Table 5.2a: Percentage of smokeless tobacco users aged 15 years and above who made a quit attempt and received health-care provider advice in the past 12 months, by selected demographic characteristics – GATS Thailand, 2011 ...................................... 5-6
Table 5.3: Percentage of smokers aged 15 years or above who made a quit attempt in the past 12 months and used any cessation method, by selected demographic characteristics – GATS Thailand, 2011 ............................................................................... 5-8
xi
xii
Table 5.3a: Percentage of smokeless tobacco users aged 15 years and above who made a quit attempt in the past 12 months and used any cessation method, by selected demographic characteristics – GATS Thailand, 2011 ......................................................... 5-9
Table 5.4: Percentage distribution and average duration of smoking abstinence during the last quit attempt in the past 12 months among current smokers aged 15 years and above, by selected demographic characteristic – GATS Thailand, 2011 ................... 5-10
Table 5.5: Percentage of smokers aged 15 years and above who made a quit attempt in the past 12 months, by selected demographic characteristics – GATS Thailand, 2009 and 2011 ......................................................................................... 5-12
Table 5.5a: Percentage of smokeless tobacco users aged 15 years and above who made a quit attempt in the past 12 months, by selected demographic characteristics – GATS Thailand, 2009 and 2011 ......................................................................................... 5-13
Table 5.6: Percentage of smokers aged 15 years and above who received health-care provider advice in the past 12 months, by selected demographic characteristics – GATS Thailand, 2009 and 2011 ......................................................................................... 5-14
Table 5.6a: Percentage of smokeless tobacco users aged 15 years and above who received health-care provider advice in the past 12 months, by selected demographic characteristics – GATS Thailand, 2009 and 2011 ............................................................. 5-15
6. Second-hand smoke Table 6.1: Number (in thousands) and percentage of adults aged 15 years and above who were
exposed to tobacco smoke at home at least monthly, by smoking status and selected demographic characteristics – GATS Thailand, 2011 ......................................................... 6-2
Table 6.2: Number (in thousands) and percentage of adults aged 15 years and above who worked indoors and were exposed to tobacco smoke at work, by smoking status and selected demographic characteristics – GATS Thailand, 2011 ........................................... 6-3
Table 6.3: Percentage of adults aged 15 years and above who were exposed to tobacco smoke in public places in the past 30 days among those who visited those places, by selected demographic characteristics – GATS Thailand, 2011 ......................................................... 6-5
Table 6.4: Percentage of non-smokers aged 15 years and above who were exposed to tobacco smoke in public places in the past 30 days among those who visited those places, by selected demographic characteristics – GATS Thailand, 2011 ...................................... 6-6
Table 6.5: Percentage of adults aged 15 years and above who worked indoors and were exposed to tobacco smoke at work, by smoking status and selected demographic characteristics – GATS Thailand, 2009 and 2011 ................................................................ 6-8
Table 6.6: Percentage of adults aged 15 years and above who were exposed to tobacco smoke at home at least monthly, by smoking status and selected demographic characteristics – GATS Thailand, 2009 and 2011 ................................................................ 6-9
Table 6.7: Percentage of adults aged 15 years and above who were exposed to tobacco smoke in public places in the past 30 days, by selected demographic characteristics – GATS Thailand, 2009 and 2011 ......................................................................................... 6-11
xii
Global Adult Tobacco Survey : Thailand Report, 2011
xiii
7. Economics Table 7.1: Percentage distribution of the type of manufactured cigarettes at last purchase of
cigarettes – GATS Thailand, 2011 ....................................................................................... 7-2Table 7.1a: Percentage distribution of the type of last purchase of shredded tobacco products
among shredded tobacco users aged 15 years and above, by selected demographic characteristics – GATS Thailand, 2011 ................................................................................ 7-3
Table 7.2: Percentage of current smokers of manufactured cigarettes aged 15 years and above, by the brand of manufactured cigarette last purchased and selected demographic characteristics – GATS Thailand, 2011 ................................................................................ 7-5
Table 7.3: Percentage distribution of the source of last purchase of cigarettes among smokers of manufactured cigarettes aged 15 years and above, by selected demographic characteristics – GATS Thailand, 2011 ................................................................................ 7-6
Table 7.4: Mean and median expenditures per month among manufactured cigarette smokers aged 15 years and above and shredded tobacco users aged 15 years and above, by selected demographic characteristics – GATS Thailand, 2011 ........................................... 7-7
Table 7.5: Percentage distribution of current smokers of manufactured cigarettes aged 15 years and above whose last purchased cigarette packet had and did not have an PHW, by selected demographic characteristics – GATS Thailand, 2011 ........................................... 7-8
Table 7.6: Percentage distribution of the type of cigarettes last purchased by manufactured cigarette smokers aged 15 years and above, by selected demographic characteristics – GATS Thailand, 2009 and 2011 .............................................................. 7-10
Table 7.7: Percentage of current manufactured cigarette smokers aged 15 years and above whose last purchased cigarette package did not have a health warning, by selected demographic characteristics – GATS Thailand, 2009 and 2011 ....................................... 7-11
8. Media Table 8.1: Percentage of adults aged 15 years and above who noticed anti-cigarette smoking
information during the past 30 days in various places, by smoking status and selected demographic characteristics – GATS Thailand, 2011 ........................................... 8-2
Table 8.2: Number (in thousands) and percentage of current smokers aged 15 years and above who noticed health warnings on cigarette packets and considered quitting because of the warning label during the past 30 days, by selected demographic characteristics – GATS Thailand, 2011 ..................................................................................................................... 8-6
Table 8.2a: Number (in thousands) and percentage of current hand-rolled cigarette smokers and smokeless tobacco users aged 15 years and above who noticed health warnings on shredded tobacco packs and considered quitting because of the warnings label during the past 30 days, by selected demographic characteristics – GATS Thailand, 2011 .......... 8-7
Table 8.3: Percentage of adults aged 15 years and above who noticed cigarette marketing during the past 30 days in various places, by selected demographic characteristics – GATS Thailand, 2011 ......................................................................................................... 8-10
Table 8.4: Percentage of current smokers aged 15 years and above who noticed cigarette marketing during the past 30 days in various places, by selected demographic characteristics – GATS Thailand, 2011 .............................................................................. 8-11
xiii
xiv
Table 8.5: Percentage of non-smokers aged 15 years and above who noticed cigarette marketing during the past 30 days in various places, by selected demographic characteristics – GATS Thailand, 2011 .............................................................................. 8-12
Table 8.6: Percentage of adults aged 15 years and above who noticed anti-cigarette smoking information during the past 30 days in various places, by selected demographic characteristics – GATS Thailand, 2009 and 2011 .............................................................. 8-14
Table 8.7: Percentage of current smokers aged 15 years and above who noticed health warnings on cigarette packages, and considered quitting because of the warning label on cigarette packages during the past 30 days, by selected demographic characteristics – GATS Thailand, 2009 and 2011 .............................................................. 8-15
Table 8.7a: Percentage of current hand-rolled cigarette smokers and smokeless tobacco users aged 15 years and above who noticed health warnings on raw tobacco packs and considered quitting because of the health warnings during the past 30 days, by selected demographic characteristics – GATS Thailand, 2009 and 2011 .................... 8-17
Table 8.8: Percentage of adults aged 15 years and above who noticed cigarette marketing advertisements during the past 30 days in various places, by selected demographic
characteristics – GATS Thailand, 2009 and 2011 .............................................................. 8-18
9. Knowledge, attitudes and perceptions
Table 9.1: Percentage of adults aged 15 years and above who believed that smoking causes serious illness and specific diseases, by selected demographic characteristics – GATS Thailand, 2011 ........................................................................................................... 9-3
Table 9.1a: Percentage of current smokers aged 15 years and above who believed that smoking causes serious illness and specific diseases, by selected demographic characteristics – GATS Thailand, 2011 ................................................................................ 9-5
Table 9.1b: Percentage of non-smokers aged 15 years and above who believed that smoking causes serious illness and specific diseases, by selected demographic characteristics – GATS Thailand, 2011 ........................................................................................................... 9-7
Table 9.2: Percentage of adults aged 15 years and above who believed that breathing other people's smoke causes serious illness and specific diseases in non-smokers, by selected demographic characteristics – GATS Thailand, 2011 .................................... 9-10
Table 9.2a: Percentage of current smokers aged 15 years and above who believed that breathing other people's smoke causes serious illness and specific diseases in non-smokers, by selected demographic characteristics – GATS Thailand, 2011 ..................... 9-11
Table 9.2b: Percentage of non-smokers aged 15 years and above who believed that breathing other people's smoke causes serious illness and specific diseases in non-smokers, by selected demographic characteristics – GATS Thailand, 2011 ......................................... 9-12
Table 9.3: Percentage distribution of pictorial health warnings (PHWs) that make current smokers of manufactured cigarettes or cigars aged 15 years and above want to quit the most, by selected demographic characteristics – GATS Thailand, 2011 .................... 9-15
Table 9.4: Percentage distribution of pictorial health warnings (PHWs) that make non-smokers aged 15 years and above not want to smoke the most, by selected demographic characteristics – GATS Thailand, 2011 .............................................................................. 9-16
xiv
Global Adult Tobacco Survey : Thailand Report, 2011 xv
xv
Table 9.5: Percentage distribution of the belief that smoking hand-rolled cigarettes is less harmful than smoking manufactured cigarettes among adults aged 15 years and above, by smoking status and selected demographic characteristics – GATS Thailand, 2011 ......................................................................................................... 9-17
Table 9.6: Percentage of adults aged 15 years and above who believed that cigarettes are addictive, by smoking status and selected demographic characteristics – GATS Thailand, 2011 ......................................................................................................... 9-18
Table 9.7: Percentage of adults aged 15 years and above who believed that smokeless tobacco use causes serious illness, by smoking status and selected demographic characteristics – GATS Thailand, 2011 .............................................................................. 9-19
Table 9.8: Percentage of adults aged 15 years and above who believed that cigarette packages with different colours are harmful to health in different ways, by smoking status and selected demographic characteristics – GATS Thailand, 2011 ....................... 9-20
Table 9.9: Percentage who believed that smoking hand-rolled cigarettes is less harmful than smoking manufactured cigarettes among adults aged 15 years and above, by selected demographic characteristics – GATS Thailand, 2009 and 2011 .................... 9-21
Table 9.10: Percentage distribution of the belief that smoking manufactured/hand-rolled cigarettes is equally harmful among adults aged 15 years and above, by selected demographic characteristics – GATS Thailand, 2009 and 2011 ....................................... 9-22
xvi
xvi
Figures 4. Tobacco use Figure 4.1: Percentages of adults aged 15 years and above, by smoking status and gender –
GATS Thailand, 2011 ........................................................................................................... 4-2 Figure 4.2: Percentage of adults aged15years and above,by smokeless tobacco use and gender –
GATS Thailand, 2011 .......................................................................................................... 4-3 Figure 4.3a: Percentage of adults aged 15 years and above who currently smoked manufactured
cigarettes and hand-rolled cigarettes by age group – GATS Thailand, 2011 ...................... 4-6 Figure 4.3b: Percentage of adults aged 15 years and above who currently smoked manufactured
cigarettes and hand-rolled cigarettes, by residence – GATS Thailand, 2011...................... 4-6 Figure 4.3c: Percentage of adults 15 years and above who currently smoked manufactured
cigarettes and hand-rolled cigarettes, by region – GATS Thailand, 2011 ........................... 4-6 Figure 4.4a: Percentage of daily smokers and occasional smokers aged 15 years and above,
by gender – GATS Thailand, 2011. ...................................................................................... 4-8 Figure 4.4b: Percentage of daily smokers aged 15 years and above, by region – GATS Thailand, 2011. 4-8 Figure 4.5: Percentage distribution of manufactured cigarettes smoked per day among daily
smokers of manufactured cigarettes aged 15 years and above – GATS Thailand, 2011 .... 4-9 Figure 4.6: Percentage distribution of hand-rolled cigarettes smoked per day among daily
smokers of hand-rolled cigarettes aged 15 years and above – GATS Thailand, 2011 ...... 4-11 Figure 4.7: Percentage distribution of age at smoking initiation (years) among ever daily smokers
aged 20–34 years – GATS Thailand, 2011 ......................................................................... 4-13 Figure 4.8: Percentage distribution of time since quitting among former daily smokers aged
15 years and above – GATS Thailand, 2011 ...................................................................... 4-15 Figure 4.9: Percentage distribution of time to first smoke among daily smokers aged 15 years and
above – GATS Thailand, 2011............................................................................................ 4-17 Figure 4.10a: Percentage of adults aged 15 years or above who were current users of various
smokeless tobacco products by gender – GATS Thailand, 2011 ....................................... 4-19 Figure 4.10b: Percentage of adults aged 15 years or above who were current users of any
smokeless tobacco product by age group – GATS Thailand, 2011 ................................... 4-19 Figure 4.10c: Percentage of adults aged 15 years and above who were current users of various
smokeless tobacco products, by residence – GATS Thailand, 2011 ................................. 4-19 Figure 4.10d: Percentage of adults aged 15 years and above who were current users of any
smokeless tobacco product, by education level – GATS Thailand, 2011 .......................... 4-20 Figure 4.10e: Percentage of adults aged 15 years and above who were current users of any
smokeless tobacco product, by region – GATS Thailand, 2011 ........................................ 4-20 Figure 4.10f: Percentage of adults aged 15 years and above who were current users any
smokeless tobacco product, by socioeconomic status – GATS Thailand, 2011 ................ 4-20 Figure 4.11: Percentage distribution of smokeless tobacco users aged 15 years and above who
were daily users and occasional users, by residence – GATS Thailand, 2011................... 4-22 Figure 4.12: Percentage distribution of age at initiation among ever daily smokeless tobacco users
aged 60–79 years, by age group – GATS Thailand, 2011 .................................................. 4-22 Figure 4.13: Percentage distribution of time to first use among daily smokeless tobacco users
aged 15 years and above – GATS Thailand, 2011 ............................................................. 4-24
Global Adult Tobacco Survey : Thailand Report, 2011 xvii
xvii
Figure 4.14a: Percentage distribution of men aged 15 years and above who were current tobacco users, by type of current tobacco use – GATS Thailand, 2011 ......................................... 4-27
Figure 4.14b: Percentage distribution of women aged 15 years and above who were current tobacco users, by type of current tobacco use – GATS Thailand, 2011 ............................ 4-27
Figure 4.14c: Percentage of adults aged 15 years and above who were current tobacco users, by region – GATS Thailand, 2011 ...................................................................................... 4-27
Figure 4.15: Cumulative percentage of adults aged 15 years and above, by smoking status – GATS Thailand, 2009 and 2011 ......................................................................................... 4-28
Figure 4.16: Cumulative percentage of adults aged 15 years and above, by smokeless tobacco use status – GATS Thailand, 2009 and 2011 ............................................................................ 4-29
5. Cessation Figure 5.1: Percentage distribution of current smokers aged 15 years and above, by interest in
quitting smoking – GATS Thailand, 2011 ............................................................................ 5-2 Figure 5.1a: Percentage distribution of current smokeless tobacco users aged 15 years and above,
by interest in quitting the use of smokeless tobacco products – GATS Thailand, 2011 ..... 5-3 Figure 5.2a: Percentage of smokers aged 15 years and above who made a quit attempt and
received health-care provider assistance in the past 12 months – GATS Thailand, 2011 .. 5-4 Figure 5.2b: Percentage of smokers aged 15 years and above who made a quit attempt in
the past 12 months, by region – GATS Thailand, 2011 ....................................................... 5-4 Figure 5.3: Percentage distribution by average duration of smoking abstinence during the last
quit attempt in the past 12 months among current smokers aged 15 years and above – GATS Thailand, 2011............................................................................................ 5-10
6. Second-hand smoke Figure 6.1: Percentage of adults aged 15 years and above who were exposed to tobacco smoke in
public places, at work, and at home at least monthly in the past 30 days – GATS Thailand, 2009 and 2011. ........................................................................................ 6-10
7. Economics Figure 7.1a: Percentage distribution of the type of manufactured cigarettes at last purchase of
cigarettes, by age group – GATS Thailand, 2011................................................................. 7-2 Figure 7.1b: Percentage distribution of the type of last purchase of shredded tobacco products
among shredded tobacco users aged 15 years and above – GATS Thailand, 2011 ............ 7-3
xviii
8. Media Figure 8.1: Percentage of adults aged 15 years and above who noticed anti-cigarette smoking
information in the past 30 days – GATS Thailand, 2011 ....................................................... 8-5 Figure 8.2: Percentage of current smokers and current smokeless tobacco users aged 15 years and
above who reported noticing health warnings on manufactured cigarette packages or shredded tobacco packs and thinking about quitting because of the warning labels during the past 30 days – GATS Thailand, 2011.................................................................... 8-8
Figure 8.3: Percentage of adults aged 15 years and above who noticed cigarette marketing in the past 30 days – GATS Thailand, 2011. .................................................................................... 8-9
9. Knowledge, attitudes and perceptions Figure 9.1: Percentage of adults aged 15 years and above who believed that smoking causes
serious illness and specific diseases – GATS Thailand, 2011 ................................................ 9-2 Figure 9.2: Percentage of adults aged 15 years and above who believed that breathing other
people’s smoke causes serious illness and specific diseases in non-smokers – GATS Thailand, 2011 ............................................................................................................. 9-9
Figure 9.3: Percentage of adults aged 15 years and above who believed that smoking causes serious illness and that breathing other people’s smoke causes serious illness, by smoking status – GATS Thailand, 2011 ............................................................................... 9-13
xviii
Global Adult Tobacco Survey : Thailand Report, 2011 xix
xix
Executive Summary Overview of the survey characteristics
Thailand implemented the Global Adult Tobacco Survey (GATS) in 2009 and 2011, using a standard global protocol. Findings from GATS assist countries in the formulation, tracking and implementation of effective tobacco control interventions. The findings allow for strong exchange of information following the World Health Organization Framework Convention on Tobacco Control (WHO FCTC) Article 20 – research and surveillance and exchange of information, and Article 21 – reporting and exchange of information. Thailand ratified the WHO FCTC on 8 November 2004. The GATS findings
also inform the implementation of the WHO MPOWER, a package of six evidence-based demand
reduction measures contained in the WHO. These include: monitor tobacco use and prevention policies, protect people from tobacco smoke, offer help to quit tobacco use, warn about the dangers of tobacco, enforce bans on tobacco advertising, promotion and sponsorship, and raise taxes on tobacco.
GATS is a nationally representative household survey of all non-institutionalized adults (defined in this survey as people aged 15 years and above). The survey used a three-stage stratified cluster sampling and was designed to produce key indicators for the whole country stratified by gender, urban and rural residence, and for each of the five regions of the country – Bangkok metropolis, Central, Northern, Northeastern and Southern – stratified by gender. Data were collected from one selected person in each participating household using an adapted questionnaire administered using an electronic data collection device.
Primary sampling units (PSUs) in the repeat 2011 GATS were from the same enumeration areas as in the 2009 GATS. In the 2011 GATS, new households were selected from previously sampled PSUs. The 2011 GATS provides information on tobacco use, cessation, second-hand smoke (SHS), economics of manufactured cigarettes and shredded tobacco products, media, knowledge, attitudes and perceptions, and pictorial health warnings. In the 2011 GATS, 21 488 households were screened and 20 606 adults aged 15 years and above were interviewed; the overall response rate was 96.3%. Field implementation took three months, from 1 October to 30 December 2011. The average time for each interview was 21.9 minutes per respondent.
Implementing organizations conducting the 2011 GATS were the Bureau of Tobacco Control (BTC), Department of Disease Control, Ministry of Public Health, National Statistical Office (NSO), and Faculty of Public Health, Mahidol University (PH-MU). Technical assistance was provided by WHO and the United States Centers for Disease Control and Prevention (CDC).
This report provides key findings from the 2011 GATS and also provides a comparative summary between the two survey rounds (2009 and 2011 GATS).
xx
xx
Key findings
Tobacco use
Overall, 24.0% of adults (13.0 million) currently smoked tobacco in 2011. More men smoked than women (46.6% vs 2.6%). Current smoking was reported more often in rural than in urban areas (25.9% vs 20.3%). The commonly smoked tobacco products were manufactured cigarettes (15.2%, 8.2 million) and hand-rolled cigarettes (14.4%, 7.8 million). The prevalence of manufactured cigarette smoking was high among persons aged 15–24 years (20.1%), those in urban areas (17.0 %), and people in the high socioeconomic status (SES, 19.6%). In contrast, the prevalence of current hand-rolled cigarette smoking was high in rural areas (18.9%), among poor people (17.8% of those with low SES*
Among those who smoked in the past 12 months (i.e. current smokers and those who quit within the past 12 months), 36.7% made a quit attempt in the past 12 months. The percentage of those who made a quit attempt declined with increasing age, and with decreasing education and SES levels. The percentage of smokers who made a quit attempt did not show a statistically significant difference between men and women (36.5% and 39.4%, respectively), but the percentage of smokers living in urban areas who made a quit attempt was higher than that of smokers living in rural areas (41.3%
(fourth quintile of personal monthly income)) and less educated people (22.5% of those with a primary level of education).
Overall, 3.2% (1.7 million people) currently used smokeless tobacco products. Current smokeless tobacco use was more prevalent among women (5.2% for women vs 1.1% for men), those who were aged 60 years and above (13.6%) and those who lived in rural areas (4.2%). The majority of smokeless tobacco users (1.8%) used betel quid with tobacco, followed by oral snuff (1.3%).
Current tobacco use in any form among Thai adults aged 15 years and above was 26.9% (14.6 million), being 47.2% among men and 7.6% among women. Among current tobacco users, 97.7% of men smoked tobacco products only, while almost two out of three women used smokeless tobacco only (65.8%).
Among daily smokers, 57.7% had their first smoke of the day within 30 minutes of waking up.
Comparison: The prevalence of current tobacco smoking did not show a statistically significant change
between 2009 and 2011 among men (45.6% vs 46.6%, respectively), women (3.1% vs 2.6%, respectively), and overall (23.7% vs 24.0%, respectively).
The prevalence of current manufactured cigarette smoking did not show a statistically significant change between 2009 and 2011 among men (29.6% vs 30.1%, respectively), women (1.1% vs 1.1%, respectively), and overall (15.0% vs 15.2%, respectively). The prevalence of current hand-rolled cigarette smoking also remained at the same level between 2009 and 2011 among men (27.0% vs 28.1%, respectively), women (1.8% vs 1.4%, respectively), and overall (14.1% vs 14.4%, respectively).
Overall, the distribution of the age at initiation of smoking by age groups remained the same from 2009 to 2011. There were no statistically significant changes in the quit ratio between 2009 and 2011 (28.8% vs 27.2%, respectively).
Cessation
* Socioeconomic status (SES) is defined by personal monthly income quintiles.
Global Adult Tobacco Survey : Thailand Report, 2011 xxi
xxi
and 34.7%, respectively). Among those who smoked in the past 12 months and who visited any health-care facility, 65.3% were asked about their smoking behaviour by the health-care provider (HCP) and 55.8% were advised to quit by the HCP. Among smokers who tried to quit in the past 12 months, a high percentage (90.7%) tried to quit without any assistance at least once in the past 12 months. The percentage of those who tried to quit without any assistance during the past 12 months showed no difference by gender, residence and region.
Among those who used smokeless tobacco in the past 12 months (i.e. current smokeless tobacco users and those who quit within the past 12 months), 16.4% made a quit attempt in the past 12 months. Among those who used smokeless tobacco in the past 12 months and who visited any health-care facility, 25.1% were asked about their use of smokeless tobacco products and 16.3% were advised to quit smokeless tobacco use by the HCP.
Comparison: A statistically significant decline was reported between 2009 and 2011 in the percentage
of smokers who made a quit attempt during the past 12 months (49.8% vs 36.7%, respectively). The decline was found across all age groups, and by all demographic variables including residence, education level and SES.
Among those who smoked in the past 12 months and who visited any health-care facility, the percentage who were asked about their smoking status by the HCP increased from 2009 to 2011 (60.2% in 2009 and 65.3% in 2011). The same trend was found in urban areas (59.2% and 68.4%, respectively). However, there was no statistically significant change in advice to quit by HCPs between 2009 and 2011 (51.9% vs 55.8%).
Second-hand smoke
Regarding exposure to second-hand smoke (SHS) in the 30 days preceding the survey, it was found that among workers who usually worked indoors or both indoors and outdoors, 30.5% (4.2 million) were exposed to SHS at their workplaces. Men workers were more likely to be exposed to SHS than women workers (37.1% vs 22.8%). The prevalence of exposure to SHS among workers in rural areas was statistically higher than among those in urban areas (35.2% vs 25.4%).
In the last 30 days preceding the survey, the three most common public places where there was exposure to SHS were markets (68.8%), bars or night clubs (68.4%), and restaurants (46.9%).
About 36.0% (19.5 million people) were exposed to SHS at home at least monthly during the 30 days preceding the survey. A higher prevalence of exposure to SHS at home at least monthly was found among those living in rural areas, those who had secondary school education or less, and those who were in the low and middle level of SES.
Comparison: The prevalence of exposure to SHS at home at least monthly showed a statistically
significant increase from 2009 to 2011 (from 33.2% in 2009 to 36.0% in 2011). The prevalence of exposure to SHS at indoor workplaces did not show a statistically significant change between 2009 and 2011 (27.2% vs 30.5%, respectively). Public places where the prevalence of exposure to SHS showed a statistically significant increase from 2009 to 2011 were health-care facilities (4.8% vs 7.3%, respectively) and public transportation (21.6% vs 25.6%, respectively). The prevalence of exposure to SHS in markets did not show a statistically significant change (69.3% vs 68.8%, respectively) during this period.
xxii
xxii
Economics
Among current smokers of manufactured cigarettes, 47.3% purchased their last cigarettes as individual sticks. Of the top five cigarette brands, two were inexpensive brands (approximately 30–45 Thai Baht [THB]/pack) of the Thailand Tobacco Monopoly (TTM), accounting for 35.3% of purchased brands.
The median amount spent on 20 manufactured cigarettes was THB 58.0, while the median monthly cigarette expenditure was THB 585.5, accounting for 9.7% of monthly personal income. Expenditure on shredded tobacco products (THB 37.5 per month) was considerably lower than that on manufactured cigarettes. Most cigarette smokers (88.3%) bought cigarettes from grocery stores. Among current smokers of manufactured cigarette, 4.8% reported that the last cigarette pack they purchased did not exhibit pictorial health warnings (PHWs). This percentage was highest in the Southern region (18.5%), suggesting an increased occurrence of tax avoidance in that region.
Comparison: The median price paid per 20 manufactured cigarettes increased from THB 45.0 in 2009
to THB 58.0 in 2011. The affordability decreased slightly since the relative income price (price paid per 2000 cigarettes as a fraction of annual per capita gross domestic product [GDP]) slightly increased from 3.4% to 3.6%. The percentage of youth aged 15–17 years who bought manufactured cigarettes as individual sticks remained high (84.3% in 2009 vs 88.3% in 2011).
TTM responded to the 2009 increase in cigarette excise taxes by introducing a new inexpensive cigarette brand (approximately THB 30 per pack) after 2009. Consequently, the percentage of smokers who purchased inexpensive TTM cigarette brands increased from 20.0% in 2009 to 35.3% in 2011 among the top five most popular brands. Furthermore, it was found that the percentage of cigarette packs purchased without PHWs statistically significantly increased from 2.6% in 2009 to 4.8% in 2011. This suggests that tax avoidance may have intensified after the 2009 tax increase.
Media
Anti-smoking information was noticed by 81.2% of people in the past 30 days, mostly on television (68.1%), whereas 25.7% of people noticed any tobacco advertisement, promotion and sponsorship (TAPS). For TAPS, differences were observed by gender (28.5% of men and 23.1% of women), residence (29.4% of urban areas and 23.7% of rural areas), and age group (34.2% of those aged 15–24 years and 23.7% of those aged 25 years and above). Advertisements were noticed mainly in stores where cigarettes are sold (18.2%), Among current smokers, 94.6% noticed pictorial health warnings (PHWs) on cigarette packages, and 62.6% of those who noticed PHWs thought about quitting smoking because of the PHWs. Among shredded tobacco users, 75.2% noticed black and white PHWs on shredded tobacco packages and 49.5% of those who noticed the HWs thought about quitting smoking because of the PHWs.
Comparison: Current smokers who noticed anti-smoking information in any location decreased
statistically significantly from 86.9% in 2009 to 81.2% in 2011. In contrast, those who were exposed to any TAP increased statistically significantly from 17.8% to 25.7%. There was also a statistically significant increase in those who noticed advertisements in stores where cigarettes are sold (from 6.7% in 2009 to 18.2% in 2011).
Global Adult Tobacco Survey : Thailand Report, 2011 xxiii
xxiii
The percentage of current smokers who noticed health warnings on cigarette packets did not show a change (93.0% in 2009 and 94.6% in 2011). However, those who thought about quitting smoking because of the PHWs decreased statistically significantly from 67.0% in 2009 to 62.6% in 2011.
Knowledge, attitudes and perceptions
Of all adults, 97.0% believed that smoking causes serious illness. For each specific disease, the percentage of adults who believed that smoking causes lung cancer was the highest (97.8%) and bladder cancer was the lowest (48.1%). In addition, 94.2% of adults believed that exposure to SHS causes serious illness; the percentage of those who believed that SHS causes lung cancer was the highest (91.2%) and premature birth was the lowest (58.6%). About one third (34.3%) believed that smoking hand-rolled cigarettes was less harmful than smoking manufactured cigarettes.
Comparison: The percentage of adults who believed that smoking causes serious illness remained
high (98.6% in 2009 and 97.0% in 2011). Similarly, the percentage of people who believed that exposure to SHS causes serious illness also remained high (94.9% and 94.2%, respectively). Those who thought that smoking hand-rolled cigarettes was less harmful than smoking manufactured cigarettes decreased statistically significantly from 2009 to 2011 (38.1% to 34.3%, respectively).
Policy implications
The findings of the 2011 GATS and comparison of the findings of the two surveys (2009 and 2011) have provided critical information on key indicators of tobacco control by selected demographic characteristics. This creates an opportunity for policy-makers and the public health community to modify interventions, and scale up and accelerate implementation of tobacco control programmes and policies at the national, regional and local levels. The following are a set of recommendations based on the WHO MPOWER strategies:
M: Monitor tobacco use and preventive and protective policies. The policy goal is to decrease the
prevalence of tobacco use by the following means: a. Seek and intensify cooperation and commitment of all offices and organizations working for
children and youth in the community to limit their accessibility to tobacco. b. Systematically develop the process of monitoring violations of the tobacco control
legislation and acts, and interference by the tobacco industry at the national and local levels through active participation of civil society.
c. Launch campaigns to create awareness consistently and continuously through social and community networking.
d. Continue systematic monitoring of tobacco use and key tobacco control measures through national surveys and also integrate standard questions on tobacco into ongoing surveys.
xxiv
xxiv
P: Protect people from tobacco smoke. The policy goal is to decrease exposure to SHS in workplaces
and public places, which shall be smoke free by law: a. Strengthen the existing policy and its compliance through amendments in the Non-
Smoker’s Health Protection Act, 1992. This can be done by including standard compliance measures such as a clear demarcation of the roles and responsibilities of law enforcers and penalty adjustments for effective law enforcement, imposing fines at progressive rates, including other legal punishment, and waiving licenses for opening a restaurant, business, entertainment complex, etc.
b. Strengthen the education, training and communication programme to raise public awareness of exposure to tobacco smoke and compliance with smoke-free laws, especially among rural populations, disadvantaged groups, owners/managers of public places and workplaces.
O: Offer help to quit tobacco use. The policy goal is to increase the number of quitters through the
following: a. Improve the systematic tobacco use cessation service:
- Regularly build the capacity of HCPs at different levels of health-care facilities to provide cessation services.
- Integrate effective cessation approaches with routine work in primary health-care services, particularly 100% use of at least 2As (ask and advise).
- Increase the outreach capacity of the national “Quitline 1600” to serve the maximum number of people who desire to quit.
- Set up an effective referral system for smoking cessation. b. Increase media campaigns to make people realize the value of a smoke-free life,
especially for younger smokers.
W: Warn about the dangers of tobacco. The policy goal is to increase the effectiveness of pictorial
health warnings (PHWs) by doing the following: a. Revise the Tobacco Control Product Act, 1992 to conform to the following requirements
for PHWs: - Extend colour PHWs to other tobacco products and all forms of tobacco products,
especially shredded tobacco used for hand-rolled cigarettes and smokeless tobacco. - Update and refresh the PHWs every two years with the aim of sustaining the impact
of the health warning message. - Use clear, simple, direct warnings and well-defined pictures. These need to be
recognizable and easily identifiable. - Use simple language in the text to influence readability, help understanding and
lessen confusion. - Increase the size of the PHWs to promote visibility and noticeability, and consider
adopting plain packaging instead of the PHWs to restrict or prohibit the use of logos, colours and brand images on packaging.
b. Integrate pack imagery for use in other media (e.g. TV and social media). It would reinforce the warnings and heighten the impact in general.
Global Adult Tobacco Survey : Thailand Report, 2011 xxv
xxv
E: Enforce bans on tobacco advertising, promotion and sponsorship (TAPS). The policy goal is to
decrease exposure to TAPS by the following means: a. Amend the Tobacco Control Product Act, 1992 according to the international guideline of
the WHO FCTC 13 and ensure comprehensive tobacco control legislation. b. Develop systematic monitoring on interference by the tobacco industry to determine
the magnitude of interference. c. Ensure effective and vigorous law enforcement to eliminate advertising by the tobacco
industry.
R: Raise taxes on tobacco. The policy goal is to decrease the accessibility of tobacco products,
especially among minors, by the following methods: a. Advocate to authorized organizations and the Ministry of Finance to effectively
implement taxes on all kinds of tobacco products. b. Formulate effective strategies to prohibit the sale of cigarettes in loose form nationwide.
For example, increase the level of public concern about selling cigarettes in loose form to minors and strictly enforce the law on any store that sells cigarettes in loose form. Strengthen and generate awareness among the community to monitor stores where cigarettes are sold to ensure that minors cannot access tobacco products.
c. Strengthen public policy and advocacy among political leaders and decision-makers to obtain strong commitment to supporting tobacco control policies such as tax measures for increasing the price of tobacco products and eliminating the sale of illicit cigarettes.
d. Increase the tax on all kinds of tobacco products, especially shredded tobacco products.

1. Introduction
Global Adult Tobacco Survey : Thailand Report, 2011 1-1
1-1
1. Introduction One of the essential components of a comprehensive tobacco control programme is an efficient and systematic surveillance mechanism to monitor the tobacco epidemic. The Global Adult Tobacco Survey (GATS) is a component of the ongoing Global Tobacco Surveillance System (GTSS) whose other components are the Global Youth Tobacco Survey (GYTS) and the Global Health Professional Students’ Survey (GHPSS). GATS is a standard global survey of households, which produces data on tobacco use by adults.†
1.1 Thailand country profile Thailand is situated in South-East Asia, covering an area of 514 000 sq. km. The official language is Thai. Most of the Thai people are Buddhists (94.5%). The currency is Baht (THB).1 The exchange rate is US$ 1 equals THB 30.85 (29 March 2012).2 Thailand is a democratic country, with a constitutional monarchy since 1932. His Majesty the King’s governance covers three independent functions –legislative, administrative and judicial.
According to the World Economic Outlook (WEO), in September 20113 the per capita gross domestic product (GDP) of Thailand was equivalent to US$ 5281.5. Over the past five years, the GDP per capita growth was unstable, and varied from 4.7% in 2007, 2.0% in 2008, –2.6% in 2009, 7.2% in 2010 and 2.9% in 2011. The inflation rate stood at 2.3%, 5.5%, –0.9%, 3.3% and 4% during the same period.4
During 2005–2010, women had a life expectancy at birth of 77.5 years as against 70.6 years for men.5 The literacy rate among Thai adults aged 15 years and above increased from 94.1% in 2007 to 97.0% in 2010.6
These data can be compared across countries and provide evidence for evaluating tobacco control policies, especially the MPOWER strategies developed by the World Health Organization (WHO), which focus on monitoring and reducing tobacco use.
GATS is a nationally representative household survey that was launched in February 2007. It enables countries to collect data among the adult population aged 15 years and above on tobacco use and key tobacco control measures. GATS uses a standard protocol developed through a participatory approach, which enhances the country’s capacity to monitor tobacco use.
Thailand, along with 14 other countries, conducted a GATS survey in 2009. A repeat survey was conducted in 2011 for tracking the situation of tobacco use and observing trends. Comparison of the findings of the 2009 and 2011 GATS will assist the country in identifying weak areas of programme implementation. The findings can also be used for improving planning as well as for tracking implementation of effective tobacco control interventions. Conducting the survey and disseminating the findings are essential components of the WHO Framework Convention on Tobacco Control (FCTC) Article 20: Research and surveillance and exchange of information, and Article 21: Reporting and exchanging information.
This chapter covers the Thailand country profile, the burden of tobacco use, tobacco production and revised tobacco control policies following the MPOWER strategies during the past two years.
† In this document, the term “adult” includes people 15 years of age and above.
1-2
The Ministry of Public Health (MoPH) is responsible for laying down public health policy and providing health-care services for the population. The main objectives are to keep Thai people healthy, both physically and mentally; to help them maintain a good quality of life; and to develop appropriate social relationships and serve as valuable resources for the country. The MoPH allocates almost 60% of its assets for regional administration. In 2009, at the regional level (apart from Bangkok metropolis), there were six medical school hospitals, 25 regional hospitals and 47 specialized hospitals. For the provinces, there were 69 general hospitals covering all provincial areas, 734 community hospitals covering 83.6% of all districts and 9 768 sub-district health promotion hospitals covering 100% of all sub-districts.7
1.2 Burden of tobacco use in Thailand Thailand has established a tool for monitoring tobacco use since the past 30 years, using national survey data provided by the National Statistics Office (NSO). Data on smoking among the adult population aged 15 years and above are also available through the Health and Welfare Survey (HWS) and the Cigarette Smoking and Alcohol Drinking Behavior Survey, which are conducted every two years and three years, respectively. These provide data on the various aspects of the burden of tobacco use, such as tobacco users’ status, patterns of tobacco use and economic impact of tobacco use.8,9
The latest survey on Cigarette Smoking and Alcohol Drinking Behavior was conducted during February–April 2011. The survey adopted a two-stage stratified cluster sampling and integrated the standard tobacco questions for surveys (TQS) of the 2009 GATS.10
1.2.1 Adult tobacco users
From 1991 to 2011, the percentage of current tobacco smokers decreased from 32.0% to 21.4%, a 33.1% decrease. Men have a 20 times’ higher prevalence than women (41.7% vs 2.1%, respectively, in 2012). From 2006 to the present, the prevalence of current tobacco smoking has gradually increased by 37% among young respondents, from 6.7% in 2006 to 9.2% in 2011 for adults aged 15–18 years, and by 12.2%, from 19.7% in 2006 to 22.1% in 2011 among adults aged 19–24 years.
Undergraduates had the lowest prevalence of current tobacco smoking compared with persons with lesser levels of education in both the surveys. Persons with a junior education (grades 7–9) had the highest prevalence of current tobacco smoking, and this further increased from 20.9% to 22.9% (9.6% increase) from 2009 to 2011, as seen in the two surveys. Although the prevalence of current tobacco smoking in rural areas was higher than that in urban areas in both the surveys, the percentage change in urban areas was twice as high as in rural areas between 2009 and 2011. The increase was 7.8% in urban areas (16.0% in 2009 to 17.3% in 2011) and 3.1% in rural areas (22.8% in 2009 to 23.5% in 2011).
Since 2004, people in the Southern region have had the highest prevalence of current tobacco smoking as compared to other regions, including Bangkok metropolis. From 2009 to 2011, the percentage change among those living in Bangkok metropolis was the highest, with a 28.0% increase (12.0% in 2009 to 15.4% in 2011). Among women, the highest prevalence of current tobacco smoking over the past 20 years has been found in the Northern region (12.5% in 1991 and 4.7% in 2011); this is two to four fold higher than the prevalence among women in other regions.
1-2 Introduction
Global Adult Tobacco Survey : Thailand Report, 2011
1-3
1.2.2 Tobacco consumption patterns and trends
In the past two decades (1991–2011), the average number of overall tobacco products smoked per day by current smokers (including manufactured cigarettes, hand-rolled cigarettes, cigars, pipes and other smoking products) decreased from an equivalent of 12 cigarette sticks per day in 1991 to 10 cigarette sticks per day in 2011. The number of overall tobacco products smoked by men decreased from 12 to 10 cigarette sticks per day. Conversely, the number of overall tobacco products smoked by women increased from 7 to 9 cigarette sticks per day during the same period.
As classified by smoked tobacco products, the majority of current tobacco smokers who smoked manufactured cigarettes lived in urban areas (including Bangkok metropolis), were in the age group of 15–18 years, and had a university level of education. Conversely, the majority of those who smoked hand-rolled cigarettes lived in the rural areas, in the Northern and Northeastern regions, were elderly (aged 60 years and above) and had no or primary levels of education.
1.2.3 Economic impact of tobacco use
Considering the average expenditure on smoked tobacco products in the latest survey conducted by NSO in 2011, the average expenditure on all kinds of smoked tobacco products among current adult smokers aged 15 years and above is THB 357.3 per month. By type of smoked tobacco product, the average expenditure for smokers of manufactured cigarettes is THB 613.2 per month, which is five times higher than that for those who smoke hand-rolled cigarettes (THB 95.1 per month). The average expenditure of those who smoke other smoked tobacco products, such as pipe, cigar and water pipe is THB 385.1 per month.
When examining the prevalence of current tobacco smoking by socioeconomic status (SES), it was observed that the greatest economic impact of smoking was faced by those in the lowest SES. As per the first GATS survey in 2009, those in the lowest SES spent 21.5% of their monthly income on smoking while those in the highest SES level spent only 4.1%.11
In 2006, the out-of-pocket expenditures for treatment of tobacco-related illnesses were THB 368.5 million for lung cancer, THB 7 714.9 million for chronic obstructive pulmonary disease (COPD), and THB 1 773.7 million for coronary heart disease (CHD). Total smoking attributable out of pocket costs for medical care amounted to THB 9 857 million, or 0.48% of the GDP.12
1.2.4 Health impact of tobacco use
The burden of mortality attributable to tobacco use for Thailand was reported in the Global report on mortality attributable to tobacco in 2012. The report indicated that the three leading causes of death due to tobacco use were cancers of the trachea, bronchus and lung (32 per 100 000 adults aged 30 years and above), COPD (44 per 100 000 adults aged 30 years and above) and respiratory disease (51 per 100 000 adults aged 30 years and above). The percentages of deaths attributable to tobacco use for these diseases were 80%, 70% and 52%, respectively.13 An assessment of the burden of disease in terms of disability-adjusted life years (DALYs) lost due to tobacco use by the Burden of Diseases Project, Thailand in 2004 revealed that tobacco use among men and women ranked third and seventh in burden, accounting for an estimated 9% and 2% of the total burden (9.7 million DALYs) for men and women, respectively.14
1-3
1-4
1.3 Tobacco production in Thailand
Domestic manufactured cigarettes are produced by Thailand Tobacco Monopoly (TTM), established in 1939. The government allowed the import of foreign cigarettes for the first time in 1991. Foreign cigarette companies have been prohibited from setting up factories, so all international cigarette brands sold in the Kingdom are imported. Although the market share of domestic manufactured cigarettes was higher than that of imported cigarettes, the proportion of imported cigarettes has gradually increased from 0.6% in 1991 to 23.5% in 2010.15,16 Factors affecting TTM were not only the slowing economy that decreased purchasing power but also the increase in cigarette prices because of increase in cigarette excise tax, anti-smoking campaigns and the promulgation of a law. To maintain its market share of not less than 75% and overall cigarette sale, TTM approved the launch SHOOT and SMS in 2009. These are cheap brands that can be bought by low-income customers who are impacted by the economic slowdown and increase in the price of TTM’s original brand, and are in competition with the cheap brand of imported cigarettes. Therefore, in 2010, the overall cigarette sales of TTM decreased only 0.09% as compared with the previous year, 2009.15
1.4 Current tobacco control policies in Thailand Thailand has a long history of anti-smoking movements. Since 1986, Thailand has developed and implemented a tobacco control programme. Two comprehensive national tobacco control acts were enacted in 1992.16 In subsequent years, several ministerial notifications were issued to improve the implementation of tobacco control policies. Existing laws in Thailand cover most of the provisions of the WHO Framework Convention on Tobacco Control (WHO FCTC), which Thailand signed and ratified on 20 June 2003 and 08 November 2004, respectively.17
1.4.1 Status of national legislation
Two tobacco control acts, the Tobacco Products Control Act, 1992 and the Non-Smokers’ Health Protection Act, 1992 are authorized under the MoPH. The major contents of these two tobacco control acts are given below.
The Tobacco Products Control Act, 1992 has the following important elements:
• Banning all types of tobacco advertisements, direct and indirect, including the display of trademarks
• Prohibiting all forms of sales promotion
• Prohibiting cigarette vending machines
• Banning cigarette sales to minors below 18 years of age
• Requiring the disclosure of cigarette product ingredients to the MoPH
• Requiring ten legible pictorial health warnings (PHWs) and warning labels, with ten different messages, to be placed on the front of cigarette packets.
The Non-smokers’ Health Protection Act, 1992 was drafted with the principal purpose of protecting non-smokers’ health by prohibiting smoking in public places, and includes a decree of punishment for violators. A Ministerial Notification No. 19 under this Act was enacted on 28 June 2010, which repealed Notification No. 17 enacted on 24 August 2006 and Notification No. 18 enacted in November 2007.
1-4 Introduction
1-5
After the 2009 GATS was completed, several ministerial notifications under the Tobacco Products Control Act, 1992 and the Non-Smokers’ Health Protection Act, 1992 have been revised according to the MPOWER strategies as follows:
MPOWER Activities undertaken
M: Monitor National periodic surveys on smoking are being conducted by the NSO every three years. The standard tobacco questions for surveys (TQS)10 were integrated in the Cigarette Smoking and Alcohol Drinking Behavior Survey in 2011.
P: Protect Notification No. 19 of the MoPH was revised and enacted on 28 June 2010, designating names, types and boundaries of public places where non-smokers’ health is under protection; and designating zones or areas of such places to be smoking or non-smoking areas pursuant to the Non-Smoker's Health Protection Act, 1992.18 Most partial smoke-free areas were upgraded to totally smoke-free areas. For example, smoking is not allowed in private rooms of government buildings, health-care facilities, indoor workplaces, etc.
According to the new notifications, indoor workplaces and public places have been divided into two groups:
- Totally smoke-free areas; these are divided into five sub-groups as follows: a) Health service and health promotion facilities b) Educational institutes c) Public places – both indoor and outdoor areas, used by the general
public or serving as workplaces d) Public vehicles and stations e) Religious places or places for performing religious rites of all
religions and sects.
- Totally smoke-free indoor workplaces; a smoking area may be specifically provided apart from the built-up or structured areas. These include:
a) Higher educational institutes b) Petrol or gas service stations c) Workplaces of state agencies, state enterprises or any other
governmental agencies.
Meanwhile, international airports may have designated smoking areas based on Notification No. 9 of 1997 of the MoPH – Condition and Appearance of Smoking Areas, in accordance with the Non-Smokers’ Health Protection Act, 1992.
O: Offer help
A notification of the MoPH – Criteria, Procedures and Conditions for Displaying Labels and Statements on Labels of Cigarettes, 2009 –was enacted on 29 March 2010.19 This new regulation on PHWs on cigarette packs requires the addition of a national quit-line number (1600) for communication by smokers who desire to quit. It encourages health professionals at different levels to integrate cessation guideline 2A (ask and advice) at the very least into routine work and support setting up cessation clinics at all levels of health-care offices.
Global Adult Tobacco Survey : Thailand Report, 2011 1-5
1-6
MPOWER Activities undertaken
W: Warn The revised notification of the MoPH – Criteria, Procedures and Conditions for Displaying Labels and Statements on Labels of Cigarettes, 2009 – enacted on 29 March 201019 makes the following changes regarding warnings:
o The number of PHWs on cigarette packs has been changed from nine to 10 pictures. These include two new PHWs “Smoking causes foot gangrene” and “Cigarette smoke causes 10 types of cancer”.
o The area to be covered by PHWs has been increased from 50% to 55% on both sides of cigarette packs and cartons.
The finding of the GATS 2009 that the three PHWs have the strongest impact on the desire to quit among smokers and influence continued abstinence among non-smokers remains the same for GATS 2011.
Draft notifications of the MoPH on Criteria, Procedures and Conditions for Displaying Labels and Statements on Labels of Shredded Tobacco Packs, which will come into force soon, stipulate the following:
o PHWs on shredded tobacco packs will be changed from two black and white pictures to four colour pictures.
o A national quit-line number (1600) and web site for quitting (www.thailandquitline.or.th) will be printed along with the PHWs.
Notification No. 15 of the MoPH issued on 21 December 201120 pertains to providing labels on packages, boxes, containers or covers of cigarettes, cigars, shredded tobacco or blended shredded tobacco, including imported products. This says that producers shall not include words or statements to persuade the consumer.
The prohibited words not only cover words or statements indicating less dangerous or less toxic, but also include any words or statements indicating scent or flavour and quality of tobacco products, as follows:
o Words or statements indicating that the product is less dangerous or less toxic such as “mild”, “medium”, “light”, “ultra light” or “low tar”
o Words or statements indicating scent or flavour such as “cool”, “ice”, “frost”, “crisp”, “fresh”, “mint”, “mellow”, “rich”, “strong” or “extra strong”
o Words or statements indicating the quality of tobacco products such as “smooth”, “natural”, “special”, “genuine”, “luminous”, “extra”, “premium”, “finest” or “best quality”.
Notification No. 16 of the MoPH21 regarding Criteria, Procedures and Conditions for Displaying Statements about toxic or carcinogenic substances on cigarette labels pursuant to the Tobacco Products Control Act, 1992 was enacted on 26 January 2012.
The new notification replaced notification No. 10 and directs printing 10 assorted statements about toxic and carcinogenic substances on both sides of the cigarette pack, box, carton or paper wrap. Moreover, the printed area has been increased from less than 50% to 60% of the area of each side.
1-6 Introduction
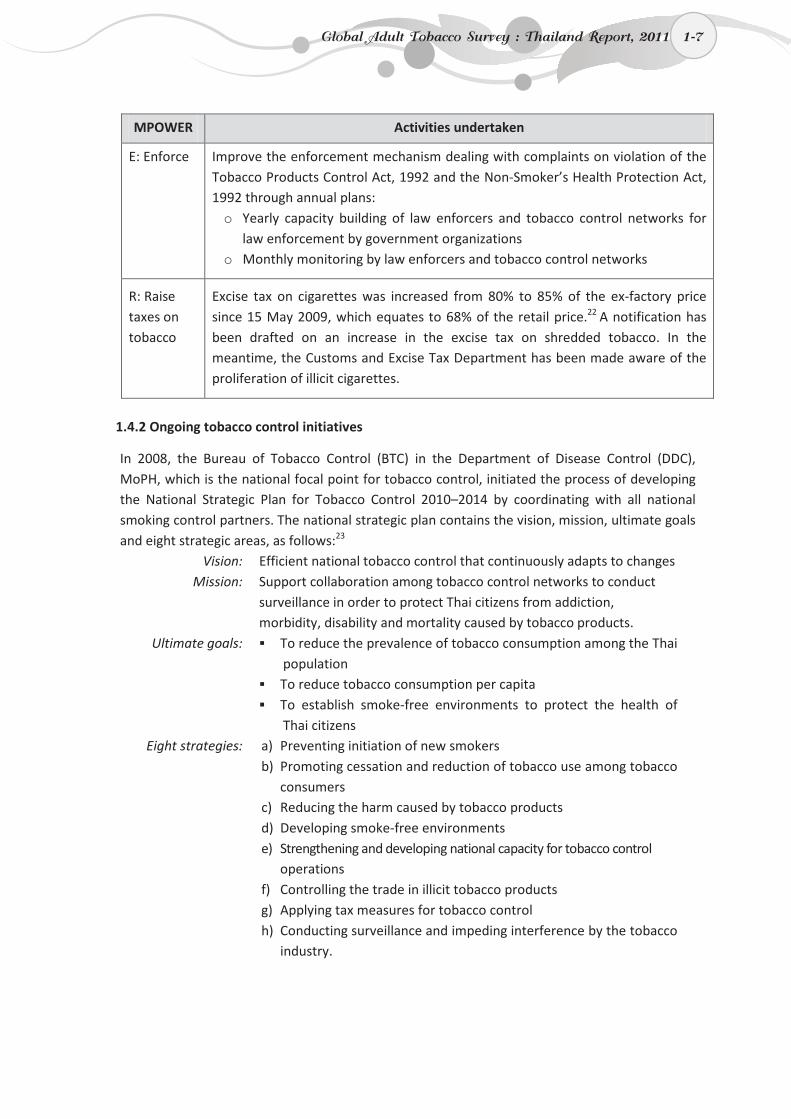
1-7
MPOWER Activities undertaken
E: Enforce Improve the enforcement mechanism dealing with complaints on violation of the Tobacco Products Control Act, 1992 and the Non-Smoker’s Health Protection Act, 1992 through annual plans:
o Yearly capacity building of law enforcers and tobacco control networks for law enforcement by government organizations
o Monthly monitoring by law enforcers and tobacco control networks
R: Raise taxes on tobacco
Excise tax on cigarettes was increased from 80% to 85% of the ex-factory price since 15 May 2009, which equates to 68% of the retail price.22 A notification has been drafted on an increase in the excise tax on shredded tobacco. In the meantime, the Customs and Excise Tax Department has been made aware of the proliferation of illicit cigarettes.
1.4.2 Ongoing tobacco control initiatives
In 2008, the Bureau of Tobacco Control (BTC) in the Department of Disease Control (DDC), MoPH, which is the national focal point for tobacco control, initiated the process of developing the National Strategic Plan for Tobacco Control 2010–2014 by coordinating with all national smoking control partners. The national strategic plan contains the vision, mission, ultimate goals and eight strategic areas, as follows:23
Vision: Efficient national tobacco control that continuously adapts to changes Mission: Support collaboration among tobacco control networks to conduct
surveillance in order to protect Thai citizens from addiction, morbidity, disability and mortality caused by tobacco products.
Ultimate goals: To reduce the prevalence of tobacco consumption among the Thai population
To reduce tobacco consumption per capita To establish smoke-free environments to protect the health of
Thai citizens Eight strategies: a) Preventing initiation of new smokers
b) Promoting cessation and reduction of tobacco use among tobacco consumers
c) Reducing the harm caused by tobacco products d) Developing smoke-free environments
e) Strengthening and developing national capacity for tobacco control operations
f) Controlling the trade in illicit tobacco products g) Applying tax measures for tobacco control h) Conducting surveillance and impeding interference by the tobacco
industry.
Global Adult Tobacco Survey : Thailand Report, 2011 1-7
1-8
These strategies have been designed for effective implementation of tobacco control, in accordance with the WHO FCTC guidelines and MPOWER strategies by tobacco control partners including the MoPH and other ministries/departments such as the Excise Department and Customs Department, Ministry of Finance, Ministry of Education, National Police Office, nongovernmental organizations (NGOs) and civil societies.
Since 2009, apart from the BTC, various government organizations and several NGOs have been mobilized to actively participate in tobacco control programmes. These have been fully supported by the Thai Health Promotion Foundation (THPF). For example, the Thai Health Professional Alliance Against Tobacco (THPAAT) focuses on capacity building of health personnel to encourage quitting and urges incorporation of cessation services in primary health care under the national health security system. The Teachers Alliance Against Tobacco (TAAT) focuses on preventing initiation of smoking among youth in schools. The Thailand National Quit line focuses on phone counselling. Civil society networks and the “Stop Drinking” networks have actively participated in monitoring non-compliance with the tobacco control acts in their local areas. Meanwhile, other organizations such as the Action on Smoking or Health (ASH) Foundation established in 1986 and the Tobacco Control Research and Knowledge Management Centre (TRC) established in 2004 are continuously making active efforts to reduce the use of tobacco.16
Presently, the Excise Department and Customs Department, Ministry of Finance and partners are working together to devise effective approaches to the tobacco tax structure and administration, not only for excise tax on cigarettes but also on all kinds of tobacco products. As revealed in a study on the role of tobacco control policies in reducing smoking through a simulation model in Thailand in 2006,24 a 29% decline in the smoking rate was predicted by the model for men, from 59.4% in 1991 to 41.7% in 2006, which was because of the effect of a tobacco tax of 61%. It has been realized that imposing tax is the strongest measure to reduce the number of smokers in Thailand, particularly among the youth.25,26
Over the past year, the working group on legal development, BTC, MoPH has rigorously updated the tobacco control acts in accordance with the FCTC, in the country’s context. For example, amendments to Article 6-8 of the Tobacco Products Control Act, 1992 were made in accordance with Article 13 of the WHO FCTC, which calls for a comprehensive ban on tobacco advertising, promotion and sponsorship (TAPS). Regarding Article 11 of the WHO FCTC, Thailand conducted a feasibility study pertaining to conflicts of law and public opinion on applying plain packaging to improve the effectiveness of PHWs, desire and intention to quit smoking among current smokers, and continued abstinence among non-smokers. The roles and responsibilities of law enforcers are being revised to make law enforcement more effective.
1-8 Introduction
1-9
1.5 Survey objectives The general and specific objectives of the GATS in Thailand are as follows:
o General objective
Obtain sufficiently reliable estimates of the prevalence of tobacco use and related indicators in Thailand at the national level, and by gender, residence and regions of Thailand.
o Specific objectives
1. Determine the prevalence of tobacco use among Thai adults aged 15 years and above by selected demographic characteristics in the 2011 GATS.
2. Study the profile of tobacco use in Thailand, including cessation, exposure to second-hand smoke (SHS), economic aspects, media exposure, knowledge, attitudes and perceptions, and impact of PHWs in the 2011 GATS.
3. Compare the data from the 2009 GATS and 2011 GATS and evaluate any change in the prevalence of tobacco use and indicators for tobacco control.
Global Adult Tobacco Survey : Thailand Report, 2011 1-9

2. Methodology
2-1
2. Methodology The GATS carried out in 2011 in Thailand was a repeat cross-sectional household survey aimed at obtaining the national- and regional-level estimates as a whole, and comparing the results with those of the GATS 2009. The design aimed to produce estimates stratified by gender and place of residence at the national level, and by gender at the regional level. This chapter focuses on the survey methodology, including study population, eligibility criteria, sampling design, questionnaire, and application program for data recording, recruitment and training procedures, data collection and statistical analysis.
2.1 Study population
The target population for the 2011 GATS included all non-institutionalized adult Thai residents (aged 15 years and above), living in their usual place of residence. Adults who were institutionalized, such as those who lived in military barracks, prisons or hospitals, were not included.
2.2 Eligibility criteria
Eligible respondents were all non-institutionalized adults aged 15 years and above who were residing in the country and who agreed to participate in the survey. For respondents aged between 15 and 17 years, the interviewer was required to obtain a parent’s or guardian’s consent before interviewing the respondent.
Respondents were excluded if (a) their usual place of residence was in a military base or group quarters, and (b) they were institutionalized, such as those residing in hospitals, prisons or nursing homes. Moreover, a respondent was excluded if the interviewer found out later that he/she was less than 15 years of age and/or was incapacitated. Eligible respondents could withdraw from the study at any time. They also had a right to refuse to answer any question without providing any reason for the refusal.
2.3 Sampling criteria
The sampling design used in the 2011 GATS was the same as that used in the 2009 GATS, a three-stage stratified cluster sampling design. The details are described in Appendix B. In general, the target population was first partitioned by region, namely, Bangkok metropolis area and the Central, Northern, Northeastern and Southern regions. Each of the four regions was further stratified into urban and rural areas to create nine strata in all. At the first stage, the primary sampling units (PSUs), which were the same enumeration areas (EAs) used as PSUs in the 2009 GATS, were used in the 2011 GATS. The sampling frame for selection of PSUs was derived from the 2000 Population and Housing Census (PHC) conducted by the National Statistical Office (NSO) of Thailand. However, this information frame is updated every year by the staff of the Provincial Statistical Offices (PSOs). In 2010, the NSO had conducted a fresh PHC, which resulted in modification of the earlier sampling frame based on the 2000 PHC. This updated information was used for the 2011 GATS. In the updated procedure, if an EA had more than 300 households, it was divided into more than one EA with 150 households each; and if an EA had less than 70 households, it was combined with the adjacent one.
At the second stage, 18, 16 and 28 households were selected, using systematic random sampling from the selected EAs in Bangkok, urban areas excluding Bangkok, and rural areas, respectively.
Global Adult Tobacco Survey : Thailand Report, 2011 2-1
2-2
Mapping and listing were performed to update the existing sampling frame of households. At the last stage, one individual was randomly chosen from each selected household by simple random sampling.
2.4 Questionnaire The questionnaire for the 2011 GATS was based on the GATS Core Questionnaire with Optional Questions, version 2.0, November 201027 developed by the GATS Thailand working group and experts. The questionnaire was translated into the Thai language, back-translated and pretested. It was approved by the GATS Questionnaire Review Committee (QRC) of the US Centers for Disease Control and Prevention (CDC) on 30 September 2011. The adapted GATS questionnaire had two major parts, the household questionnaire and the individual questionnaire.
2.4.1 Household questionnaire
This part included information from the selected household on the household members at their primary place of residence where the household member had spent at least three months in the past 12 months. This also quantified the number of adult household members (15 years of age and older) eligible for the interview. The respondents for the household questionnaire had to be 18 years of age or above living in the household. The interviewer had to consider which respondent would be able to provide accurate information about the household members. The questionnaire included questions on the number of household members and the required information on age, gender and the current status of tobacco use. Elementary randomized sampling was also provided in the pocket personal computers (PCs, HP hx2490c) to select individual respondents for interviewing.
2.4.2 Individual questionnaire
This part included information on the eligible respondents. It consisted of 10 sections, as follows:
Section A Background characteristics: Gender, age, working status, education level, personal income, marital status and household items possessed
Section B Tobacco smoking: Patterns of smoked tobacco use, former tobacco consumption, number of cigarettes smoked per day, age at initiation of smoking, time since quitting smoking, time to first use of tobacco on awakening
Section C Smokeless tobacco use: Patterns of smokeless tobacco use, former smokeless tobacco use, number of times used per day, age at initiation of smokeless tobacco use, time since quitting, consumption of different types of smokeless tobacco products (snuff by mouth or nose, chewing tobacco, betel quid with tobacco, etc.)
Section D Cessation: Quit smoking attempts in the past 12 months, queries on quitting smoking and advice on quitting by health-care providers, use of cessation aids by smokers, level of interest in quitting smoking
Section E Second-hand smoke: Exposure to SHS in the past 30 days at work, at home and in various public places such as health-care facilities, restaurants, public transportation, etc.; the belief that serious illness can occur due to exposure to SHS
2-2 Methodology
2-3
Section F Economics: The number of manufactured cigarettes bought, price paid, brand bought, and place where the last purchase was made
Section G Media: Awareness of anti-cigarette smoking information, cigarette advertising, cigarette company sponsorship and cigarette promotions in the past 30 days
Section H Knowledge, attitudes and perceptions: Beliefs about the dangers of tobacco smoking and specific diseases caused by smoking
Section I Pictorial Health warnings: The impact of pictorial health warnings (PHWs) on the desire to quit among current smokers as well as their influence on intention to continue abstinence from smoking among non-smokers
Section J Economics: The quantity of shredded tobacco products bought and price paid during the last purchase.
2.5 Application program for data recording The Thailand NSO developed an application program for data collection for the 2011 GATS using Microsoft Visual Studio NET 2003 software, for use on desktop PCs. The completed program was then pretested among 126 respondents in July 2011 to validate it. The program worked well during the field implementation period of the 2011 GATS. During the field implementation, each provincial supervisor gathered data from field interviewers, synchronized the data from a secure digital (SD) card to a desktop PC, and then transferred the output data in the form of a text file and an XML file to the information and communications technology (ICT) centre of the NSO. The output data were then aggregated. The correctness and completeness of data as well as data back-up and response rate were checked every week. The completed data were subjected to validation checks across variables within and across the household and individual questionnaires.
2.6 Recruitment and training procedures
2.6.1 Recruitment
NSO was the implementing agency. Field staff were grouped into three levels – field interviewers (FIs), provincial technical officers (PTOs, to function as provincial supervisors) and central field supervisors (FSs). A total of 111 FIs, 79 PTOs and 10 FSs were recruited for the 2011 GATS. FIs and PTOs were from the permanent staff of the PSO with an average working experience in the PSO of 8.4 years and 10.1 years, respectively. Each province had between one and three FIs and one PTO assigned to it. In addition, each FS was assigned 7 to 12 PTOs per province, except Bangkok metropolis, where 16 FIs, 3 PTOs and 1 FS were assigned.
The key criterion for inclusion of each group of persons was prior experience in the 2009 GATS. The other criteria were experience in collecting any household survey data; familiarity with the use of the iPAQ; and prior experience of surveys on tobacco use at the national level. As a result, 66.7% of FIs, 64.5% of PTOs and 60.0% of FSs who were recruited for the repeat survey had participated in the earlier survey.
2.6.2 Training procedure
In order to ensure the quality of data, the training objectives were capacity building of FIs and PTOs to improve their knowledge of the GATS adapted questionnaire, procedures for mapping and listing, criteria for selecting households and eligible respondents, knowledge of interview
Global Adult Tobacco Survey : Thailand Report, 2011 2-3
2-4
codes as well as skills for conducting interviews, and using the interview device HP iPAQ hx2490c.
A similar training programme as that for the 2009 GATS was made out, duly modified in light of the lessons learn from the training for the 2009 GATS and pre-testing for the 2011 GATS. A two-day refresher programme was organized for field staff with experience of the 2009 GATS. For new field staff, a three-day training programme was planned for both PTOs and FIs. To standardize the training and make it consistent, all survey staff members were trained by the same trainers’ team as that of the 2009 GATS.
The additions in the three-day programme as compared to the two-day programme were provision of question-by-question (QxQ) instructions in detail, instructions on the use of the pocket PCs and demonstrations on applying the software program questionnaire for data collection.
Training methods used were: (a) lectures, (b) demonstration of various kinds of tobacco products related to the GATS questionnaire, (c) role-play under mock conditions and in real situations to gain skills in interviewing and using the interview device, i.e. pocket PC (HP iPAQ hx2490c), (d) close monitoring and prompt feedback by FSs and core teams, (e) relaxation activities, games and exercises within the dynamic group, and (f) pre- and post-test evaluation processes.
2.7 Data collection
The fieldwork was spread over three months, from 1 October to 30 December 2011. Several strategies were applied to monitor field implementation for ensuring the quality of data, including regularly following up the progress of data collection through the monitoring software program developed by the NSO, regular telephone and e-mail follow up, field visits and short verification interviews. A total of 1 253 sampled respondents in 77 provinces were selected for verification.
The kappa (κ) coefficient indicated that the data from both sources (FIs and PTOs) had almost perfect
consistency. The value of κ was 0.98 for gender, 0.97 for age group, 0.95 for tobacco smoking status and 0.96 for smokeless tobacco use status. These steps greatly improved data quality and reduced non-sampling errors.
All data files were saved on an SD card for the HP iPAQ hx2490c. Household and individual data were saved as text (.txt) files and eXtensible Markup Language (.XML) files, respectively. The data from the SD card were synchronized weekly on the PSOs’ desktops and transmitted to the NSO ICT Centre in Bangkok by the PTOs. The IT expert at the NSO ICT Centre then aggregated and checked output data (.txt files and .XML files) received from the 77 provinces. Data processing was done every week using commands on Microsoft Windows XP (Version 5.1.2.2600). After field work was completed in mid-March 2012, the data of the entire Kingdom were completely checked for accuracy. The weighting and analysis processes were also completed.
The most common interview language used was the central Thai language (52.8%), followed by the northeastern dialect (29.1%), the southern dialect (8.5%), the northern dialect (6.8%), the Pattani Malay dialect (2.1%) and other languages (0.7%). The majority of Thai people are able to read and understand Thai. When other dialects were used, interviewers still read in Thai with different accents.
2-4 Methodology
2-5
The Institutional Review Board (IRB) is formally designated to protect the rights of research subjects. The protocols of the repeat GATS survey were approved by the Ethics Committee of the Faculty of Public Health, Mahidol University vide certificate of approval (COA) No. MUPH 2011-205, on 13 September 2011. During the data collection, the GATS protocol did not allow FIs to interview persons aged less than 17 years without formal permission from either their parents or guardians and the respondents themselves. For all respondents aged 18 years and above, FIs could not conduct the interview without verbal permission from the respondent. FIs were required to respect the confidentiality of the data collected and sign the consent form, which included the GATS statement on confidentiality.
2.8 Statistical analysis Complex survey data analysis was performed to obtain population estimates and their 95% confidence intervals (CIs). The sample weights were developed by NSO. For each respondent, a sample weight was computed using a weighting process (see details in Appendix B) that included the following three main steps: (1) creation of the base weight or design weight, calculated from all steps of random selection in the sample design, (2) an adjustment for non-response by sample households and sample individuals eligible for the survey, and (3) a post-stratification calibration adjustment of sample totals to projection of the population aged 15 years and above by region, area, gender and age group. The final weights attached to each respondent were computed as the product of the base weights, the non-response adjustment and post-stratification calibration adjustment. The final weights were used in all analyses to produce estimates of population parameters and their CIs. All weighting computations were carried out using the SAS 9.1 program, and all computational estimates and their CIs were calculated using the SPSS 17 complex samples module.
2.9 Data interpretation A 95 percent confidence interval (95% CI) was used to indicate the precision of the estimate. The CIs are closely related to statistical significance testing. When comparing two parameter estimates, a non-overlap of the 95% CI means that the results are statistically significantly different and if they have overlapping CIs, it means that they are not significantly different. Two-sample t-test was also used to indicate the statistical significance of the estimates for comparison between the 2009 and 2011 data. The significance level for the estimates were denoted as ** if P<0.05.
Global Adult Tobacco Survey : Thailand Report, 2011 2-5
3. Sample and population characteristics
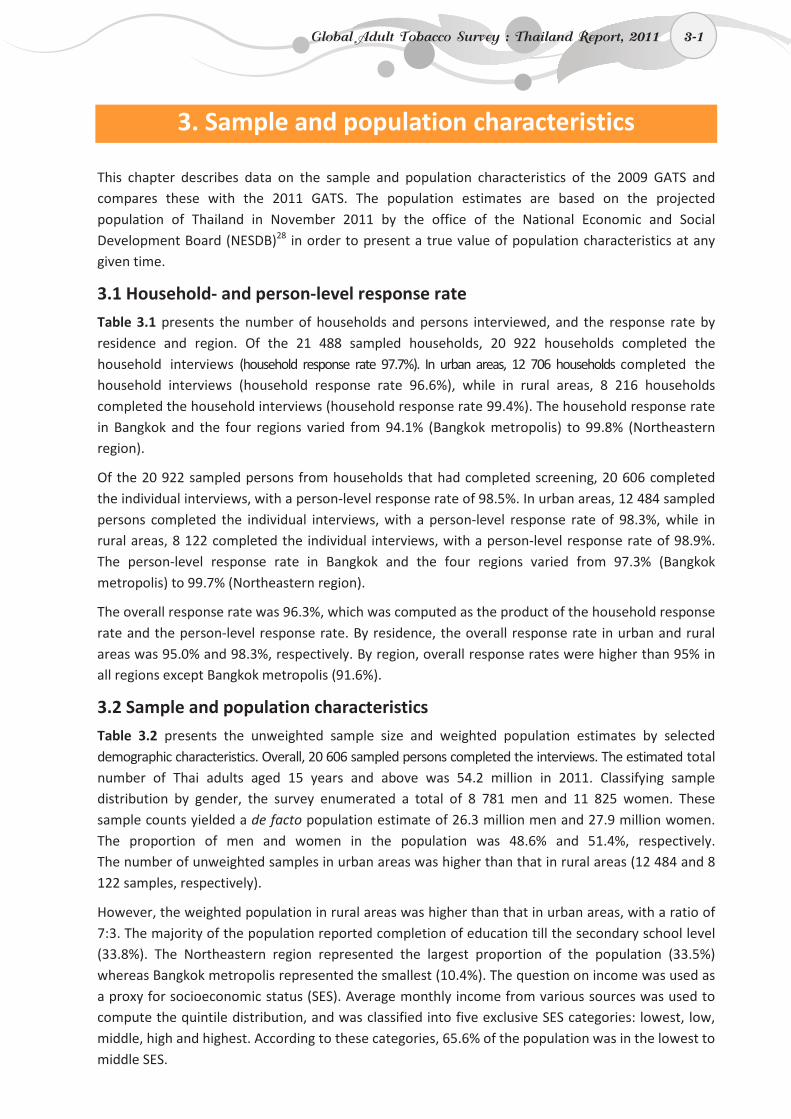
3-1
3. Sample and population characteristics This chapter describes data on the sample and population characteristics of the 2009 GATS and compares these with the 2011 GATS. The population estimates are based on the projected population of Thailand in November 2011 by the office of the National Economic and Social Development Board (NESDB)28 in order to present a true value of population characteristics at any given time.
3.1 Household- and person-level response rate Table 3.1 presents the number of households and persons interviewed, and the response rate by residence and region. Of the 21 488 sampled households, 20 922 households completed the household interviews (household response rate 97.7%). In urban areas, 12 706 households completed the household interviews (household response rate 96.6%), while in rural areas, 8 216 households completed the household interviews (household response rate 99.4%). The household response rate in Bangkok and the four regions varied from 94.1% (Bangkok metropolis) to 99.8% (Northeastern region).
Of the 20 922 sampled persons from households that had completed screening, 20 606 completed the individual interviews, with a person-level response rate of 98.5%. In urban areas, 12 484 sampled persons completed the individual interviews, with a person-level response rate of 98.3%, while in rural areas, 8 122 completed the individual interviews, with a person-level response rate of 98.9%. The person-level response rate in Bangkok and the four regions varied from 97.3% (Bangkok metropolis) to 99.7% (Northeastern region).
The overall response rate was 96.3%, which was computed as the product of the household response rate and the person-level response rate. By residence, the overall response rate in urban and rural areas was 95.0% and 98.3%, respectively. By region, overall response rates were higher than 95% in all regions except Bangkok metropolis (91.6%).
3.2 Sample and population characteristics Table 3.2 presents the unweighted sample size and weighted population estimates by selected demographic characteristics. Overall, 20 606 sampled persons completed the interviews. The estimated total number of Thai adults aged 15 years and above was 54.2 million in 2011. Classifying sample distribution by gender, the survey enumerated a total of 8 781 men and 11 825 women. These sample counts yielded a de facto population estimate of 26.3 million men and 27.9 million women. The proportion of men and women in the population was 48.6% and 51.4%, respectively. The number of unweighted samples in urban areas was higher than that in rural areas (12 484 and 8 122 samples, respectively).
However, the weighted population in rural areas was higher than that in urban areas, with a ratio of 7:3. The majority of the population reported completion of education till the secondary school level (33.8%). The Northeastern region represented the largest proportion of the population (33.5%) whereas Bangkok metropolis represented the smallest (10.4%). The question on income was used as a proxy for socioeconomic status (SES). Average monthly income from various sources was used to compute the quintile distribution, and was classified into five exclusive SES categories: lowest, low, middle, high and highest. According to these categories, 65.6% of the population was in the lowest to middle SES.
Global Adult Tobacco Survey : Thailand Report, 2011 3-1
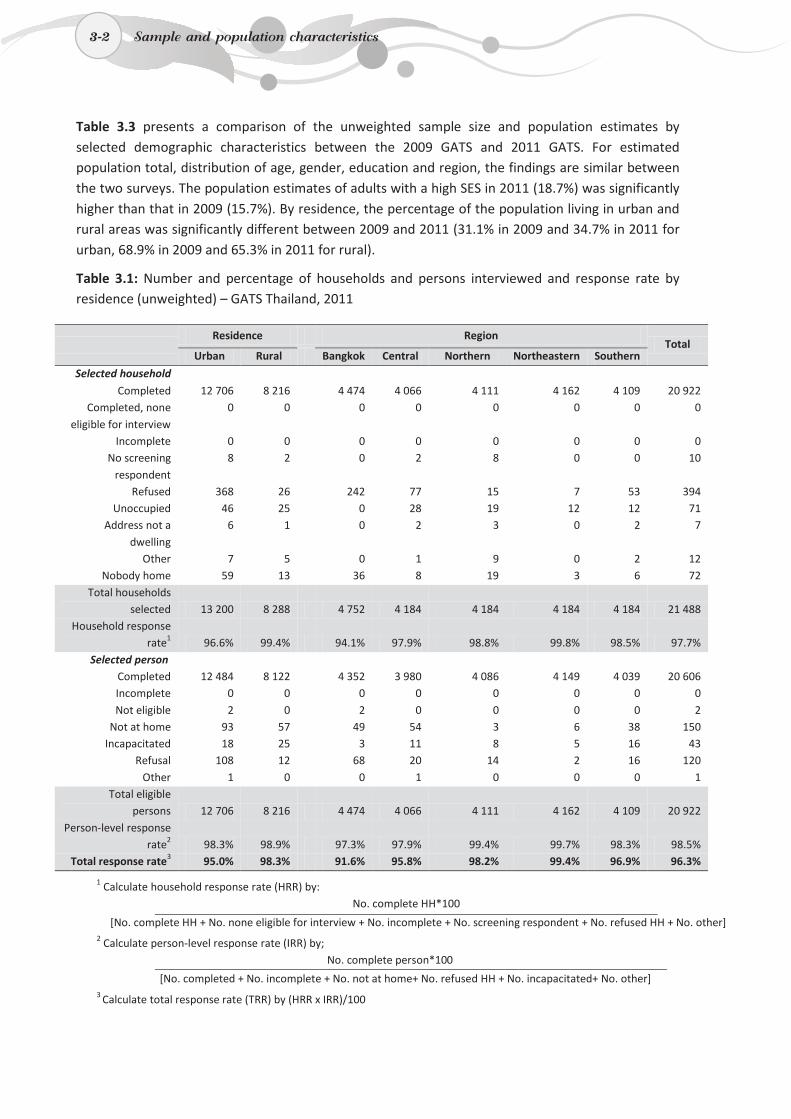
3-2
Table 3.3 presents a comparison of the unweighted sample size and population estimates by selected demographic characteristics between the 2009 GATS and 2011 GATS. For estimated population total, distribution of age, gender, education and region, the findings are similar between the two surveys. The population estimates of adults with a high SES in 2011 (18.7%) was significantly higher than that in 2009 (15.7%). By residence, the percentage of the population living in urban and rural areas was significantly different between 2009 and 2011 (31.1% in 2009 and 34.7% in 2011 for urban, 68.9% in 2009 and 65.3% in 2011 for rural).
Table 3.1: Number and percentage of households and persons interviewed and response rate by residence (unweighted) – GATS Thailand, 2011
Residence Region
Total Urban Rural Bangkok Central Northern Northeastern Southern
Selected household
Completed 12 706 8 216 4 474 4 066 4 111 4 162 4 109 20 922 Completed, none
eligible for interview 0 0 0 0 0 0 0 0
Incomplete 0 0 0 0 0 0 0 0 No screening
respondent 8 2 0 2 8 0 0 10
Refused 368 26 242 77 15 7 53 394 Unoccupied 46 25 0 28 19 12 12 71
Address not a dwelling
6 1 0 2 3 0 2 7
Other 7 5 0 1 9 0 2 12 Nobody home 59 13 36 8 19 3 6 72
Total households selected 13 200 8 288 4 752 4 184 4 184 4 184 4 184 21 488
Household response rate1 96.6% 99.4% 94.1% 97.9% 98.8% 99.8% 98.5% 97.7%
Selected person Completed 12 484 8 122 4 352 3 980 4 086 4 149 4 039 20 606 Incomplete 0 0 0 0 0 0 0 0 Not eligible 2 0 2 0 0 0 0 2
Not at home 93 57 49 54 3 6 38 150 Incapacitated 18 25 3 11 8 5 16 43
Refusal 108 12 68 20 14 2 16 120 Other 1 0 0 1 0 0 0 1
Total eligible persons 12 706 8 216 4 474 4 066 4 111 4 162 4 109 20 922
Person-level response rate2 98.3% 98.9% 97.3% 97.9% 99.4% 99.7% 98.3% 98.5%
Total response rate3 95.0% 98.3% 91.6% 95.8% 98.2% 99.4% 96.9% 96.3%
1 Calculate household response rate (HRR) by: No. complete HH*100
[No. complete HH + No. none eligible for interview + No. incomplete + No. screening respondent + No. refused HH + No. other] 2 Calculate person-level response rate (IRR) by; No. complete person*100
[No. completed + No. incomplete + No. not at home+ No. refused HH + No. incapacitated+ No. other] 3 Calculate total response rate (TRR) by (HRR x IRR)/100
3-2 Sample and population characteristics
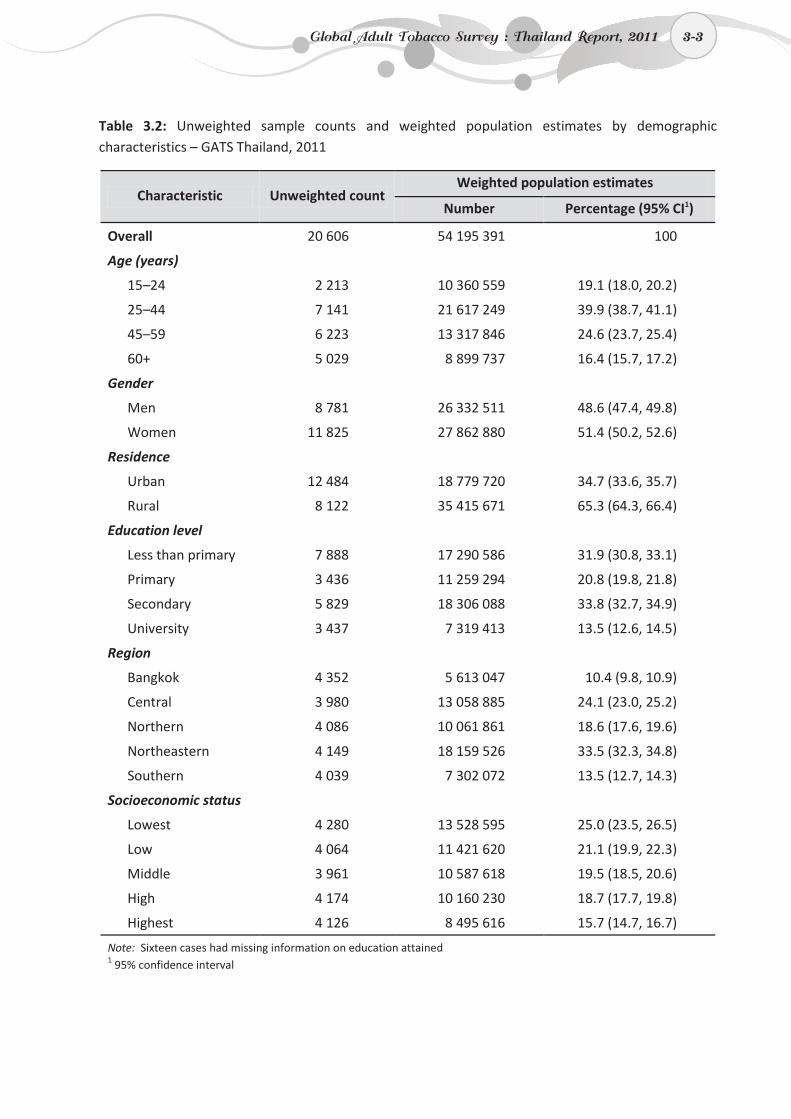
3-3
Table 3.2: Unweighted sample counts and weighted population estimates by demographic characteristics – GATS Thailand, 2011
Characteristic Unweighted count Weighted population estimates
Number Percentage (95% CI1)
Overall 20 606 54 195 391 100
Age (years)
15–24 2 213 10 360 559 19.1 (18.0, 20.2)
25–44 7 141 21 617 249 39.9 (38.7, 41.1)
45–59 6 223 13 317 846 24.6 (23.7, 25.4)
60+ 5 029 8 899 737 16.4 (15.7, 17.2)
Gender
Men 8 781 26 332 511 48.6 (47.4, 49.8)
Women 11 825 27 862 880 51.4 (50.2, 52.6)
Residence
Urban 12 484 18 779 720 34.7 (33.6, 35.7)
Rural 8 122 35 415 671 65.3 (64.3, 66.4)
Education level
Less than primary 7 888 17 290 586 31.9 (30.8, 33.1)
Primary 3 436 11 259 294 20.8 (19.8, 21.8)
Secondary 5 829 18 306 088 33.8 (32.7, 34.9)
University 3 437 7 319 413 13.5 (12.6, 14.5)
Region
Bangkok 4 352 5 613 047 10.4 (9.8, 10.9)
Central 3 980 13 058 885 24.1 (23.0, 25.2)
Northern 4 086 10 061 861 18.6 (17.6, 19.6)
Northeastern 4 149 18 159 526 33.5 (32.3, 34.8)
Southern 4 039 7 302 072 13.5 (12.7, 14.3)
Socioeconomic status
Lowest 4 280 13 528 595 25.0 (23.5, 26.5)
Low 4 064 11 421 620 21.1 (19.9, 22.3)
Middle 3 961 10 587 618 19.5 (18.5, 20.6)
High 4 174 10 160 230 18.7 (17.7, 19.8)
Highest 4 126 8 495 616 15.7 (14.7, 16.7)
Note: Sixteen cases had missing information on education attained 1 95% confidence interval
Global Adult Tobacco Survey : Thailand Report, 2011 3-3
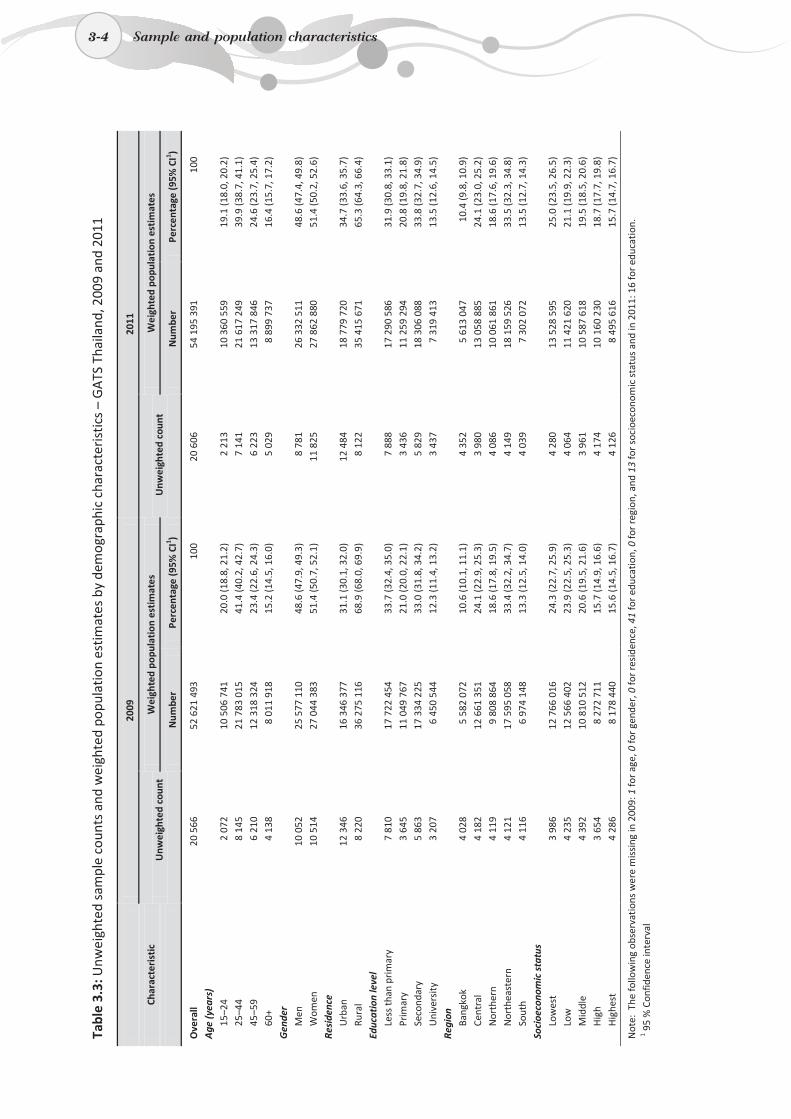
3-4
Tabl
e 3.
3: U
nwei
ghte
d sa
mpl
e co
unts
and
wei
ghte
d po
pula
tion
estim
ates
by
dem
ogra
phic
cha
ract
eris
tics
– G
ATS
Tha
iland
, 200
9 an
d 20
11
20
09
2011
Char
acte
rist
ic
Unw
eigh
ted
coun
t W
eigh
ted
popu
lati
on e
stim
ates
U
nwei
ghte
d co
unt
Wei
ghte
d po
pula
tion
est
imat
es
N
umbe
r Pe
rcen
tage
(95%
CI1 )
Num
ber
Perc
enta
ge (9
5% C
I1 )
Ove
rall
20 5
66
52 6
21 4
93
100
20 6
06
54 1
95 3
91
100
Age
(yea
rs)
15–2
4 2
072
10 5
06 7
41
20.0
(18.
8, 2
1.2)
2
213
10 3
60 5
59
19.1
(18.
0, 2
0.2)
25
–44
8 14
5 21
783
015
41
.4 (4
0.2,
42.
7)
7 14
1 21
617
249
39
.9 (3
8.7,
41.
1)
45–5
9 6
210
12 3
18 3
24
23.4
(22.
6, 2
4.3)
6
223
13 3
17 8
46
24.6
(23.
7, 2
5.4)
60
+ 4
138
8 01
1 91
8 15
.2 (1
4.5,
16.
0)
5 02
9 8
899
737
16.4
(15.
7, 1
7.2)
G
ende
r
M
en
10 0
52
25 5
77 1
10
48.6
(47.
9, 4
9.3)
8
781
26 3
32 5
11
48.6
(47.
4, 4
9.8)
W
omen
10
514
27
044
383
51
.4 (5
0.7,
52.
1)
11 8
25
27 8
62 8
80
51.4
(50.
2, 5
2.6)
Re
side
nce
Urb
an
12 3
46
16 3
46 3
77
31.1
(30.
1, 3
2.0)
12
484
18
779
720
34
.7 (3
3.6,
35.
7)
Rura
l 8
220
36 2
75 1
16
68.9
(68.
0, 6
9.9)
8
122
35 4
15 6
71
65.3
(64.
3, 6
6.4)
Ed
ucat
ion
leve
l
Le
ss th
an p
rimar
y 7
810
17 7
22 4
54
33.7
(32.
4, 3
5.0)
7
888
17 2
90 5
86
31.9
(30.
8, 3
3.1)
Pr
imar
y 3
645
11 0
49 7
67
21.0
(20.
0, 2
2.1)
3
436
11 2
59 2
94
20.8
(19.
8, 2
1.8)
Se
cond
ary
5 86
3 17
334
225
33
.0 (3
1.8,
34.
2)
5 82
9 18
306
088
33
.8 (3
2.7,
34.
9)
Uni
vers
ity
3 20
7 6
450
544
12.3
(11.
4, 1
3.2)
3
437
7 31
9 41
3 13
.5 (1
2.6,
14.
5)
Regi
on
Bang
kok
4 02
8 5
582
072
10.6
(10.
1, 1
1.1)
4
352
5 61
3 04
7 10
.4 (9
.8, 1
0.9)
Ce
ntra
l 4
182
12 6
61 3
51
24.1
(22.
9, 2
5.3)
3
980
13 0
58 8
85
24.1
(23.
0, 2
5.2)
N
orth
ern
4 11
9 9
808
864
18.6
(17.
8, 1
9.5)
4
086
10 0
61 8
61
18.6
(17.
6, 1
9.6)
N
orth
east
ern
4 12
1 17
595
058
33
.4 (3
2.2,
34.
7)
4 14
9 18
159
526
33
.5 (3
2.3,
34.
8)
Sout
h 4
116
6 97
4 14
8 13
.3 (1
2.5,
14.
0)
4 03
9 7
302
072
13.5
(12.
7, 1
4.3)
So
cioe
cono
mic
sta
tus
Low
est
3 98
6 12
766
016
24
.3 (2
2.7,
25.
9)
4 28
0 13
528
595
25
.0 (2
3.5,
26.
5)
Low
4
235
12 5
66 4
02
23.9
(22.
5, 2
5.3)
4
064
11 4
21 6
20
21.1
(19.
9, 2
2.3)
M
iddl
e 4
392
10 8
10 5
12
20.6
(19.
5, 2
1.6)
3
961
10 5
87 6
18
19.5
(18.
5, 2
0.6)
H
igh
3 65
4 8
272
711
15.7
(14.
9, 1
6.6)
4
174
10 1
60 2
30
18.7
(17.
7, 1
9.8)
H
ighe
st
4 28
6 8
178
440
15.6
(14.
5, 1
6.7)
4
126
8 49
5 61
6 15
.7 (1
4.7,
16.
7)
Not
e: T
he fo
llow
ing
obse
rvat
ions
wer
e m
issi
ng in
200
9: 1
for a
ge, 0
for g
ende
r, 0
for r
esid
ence
, 41
for
educ
atio
n, 0
for r
egio
n, a
nd 1
3 fo
r soc
ioec
onom
ic s
tatu
s an
d in
201
1: 1
6 fo
r edu
cati
on.
1 95
% C
onfid
ence
inte
rval
3-4 Sample and population characteristics
4. Tobacco use
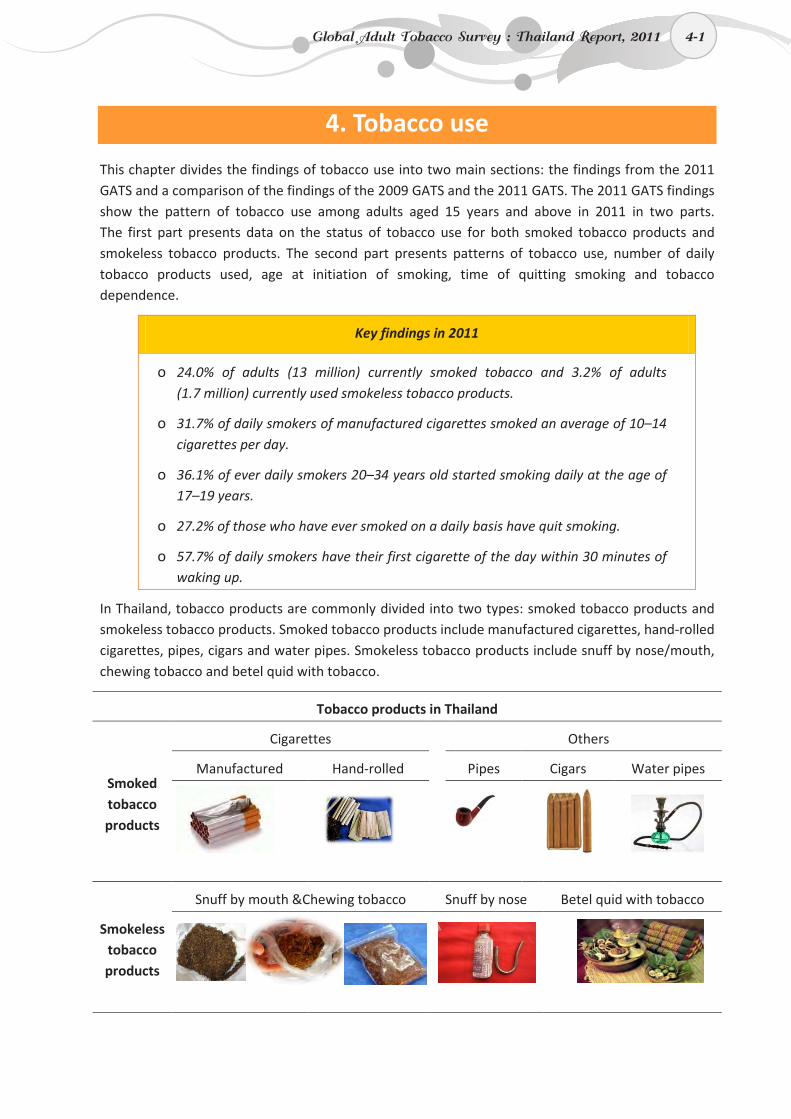
4-1
4. Tobacco use
This chapter divides the findings of tobacco use into two main sections: the findings from the 2011 GATS and a comparison of the findings of the 2009 GATS and the 2011 GATS. The 2011 GATS findings show the pattern of tobacco use among adults aged 15 years and above in 2011 in two parts. The first part presents data on the status of tobacco use for both smoked tobacco products and smokeless tobacco products. The second part presents patterns of tobacco use, number of daily tobacco products used, age at initiation of smoking, time of quitting smoking and tobacco dependence.
Key findings in 2011
o 24.0% of adults (13 million) currently smoked tobacco and 3.2% of adults (1.7 million) currently used smokeless tobacco products.
o 31.7% of daily smokers of manufactured cigarettes smoked an average of 10–14 cigarettes per day.
o 36.1% of ever daily smokers 20–34 years old started smoking daily at the age of 17–19 years.
o 27.2% of those who have ever smoked on a daily basis have quit smoking.
o 57.7% of daily smokers have their first cigarette of the day within 30 minutes of waking up.
In Thailand, tobacco products are commonly divided into two types: smoked tobacco products and smokeless tobacco products. Smoked tobacco products include manufactured cigarettes, hand-rolled cigarettes, pipes, cigars and water pipes. Smokeless tobacco products include snuff by nose/mouth, chewing tobacco and betel quid with tobacco.
Tobacco products in Thailand
Smoked tobacco products
Cigarettes Others
Manufactured Hand-rolled Pipes Cigars Water pipes
Smokeless tobacco products
Snuff by mouth &Chewing tobacco Snuff by nose Betel quid with tobacco
Global Adult Tobacco Survey : Thailand Report, 2011 4-1
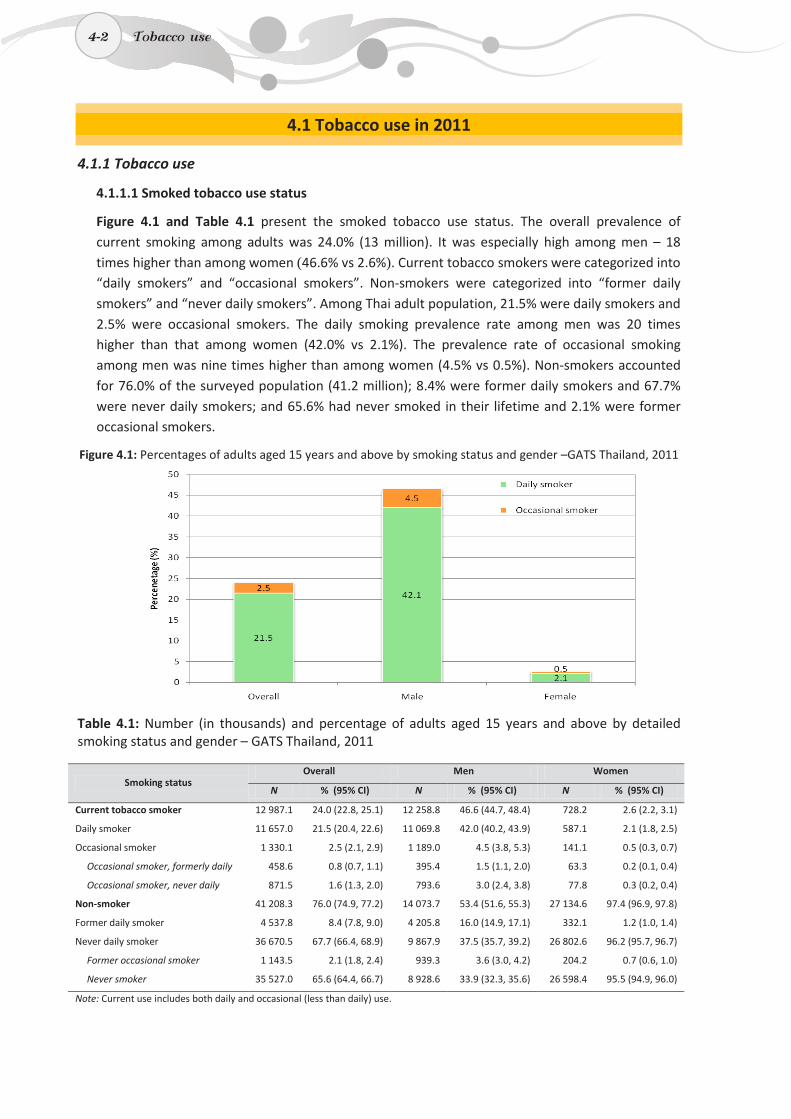
4-2
4.1 Tobacco use in 2011
4.1.1 Tobacco use
4.1.1.1 Smoked tobacco use status
Figure 4.1 and Table 4.1 present the smoked tobacco use status. The overall prevalence of current smoking among adults was 24.0% (13 million). It was especially high among men – 18 times higher than among women (46.6% vs 2.6%). Current tobacco smokers were categorized into “daily smokers” and “occasional smokers”. Non-smokers were categorized into “former daily smokers” and “never daily smokers”. Among Thai adult population, 21.5% were daily smokers and 2.5% were occasional smokers. The daily smoking prevalence rate among men was 20 times higher than that among women (42.0% vs 2.1%). The prevalence rate of occasional smoking among men was nine times higher than among women (4.5% vs 0.5%). Non-smokers accounted for 76.0% of the surveyed population (41.2 million); 8.4% were former daily smokers and 67.7% were never daily smokers; and 65.6% had never smoked in their lifetime and 2.1% were former occasional smokers.
Figure 4.1: Percentages of adults aged 15 years and above by smoking status and gender –GATS Thailand, 2011
Table 4.1: Number (in thousands) and percentage of adults aged 15 years and above by detailed smoking status and gender – GATS Thailand, 2011
Smoking status Overall Men Women
N % (95% CI) N % (95% CI) N % (95% CI)
Current tobacco smoker 12 987.1 24.0 (22.8, 25.1) 12 258.8 46.6 (44.7, 48.4) 728.2 2.6 (2.2, 3.1)
Daily smoker 11 657.0 21.5 (20.4, 22.6) 11 069.8 42.0 (40.2, 43.9) 587.1 2.1 (1.8, 2.5)
Occasional smoker 1 330.1 2.5 (2.1, 2.9) 1 189.0 4.5 (3.8, 5.3) 141.1 0.5 (0.3, 0.7)
Occasional smoker, formerly daily 458.6 0.8 (0.7, 1.1) 395.4 1.5 (1.1, 2.0) 63.3 0.2 (0.1, 0.4)
Occasional smoker, never daily 871.5 1.6 (1.3, 2.0) 793.6 3.0 (2.4, 3.8) 77.8 0.3 (0.2, 0.4)
Non-smoker 41 208.3 76.0 (74.9, 77.2) 14 073.7 53.4 (51.6, 55.3) 27 134.6 97.4 (96.9, 97.8)
Former daily smoker 4 537.8 8.4 (7.8, 9.0) 4 205.8 16.0 (14.9, 17.1) 332.1 1.2 (1.0, 1.4)
Never daily smoker 36 670.5 67.7 (66.4, 68.9) 9 867.9 37.5 (35.7, 39.2) 26 802.6 96.2 (95.7, 96.7)
Former occasional smoker 1 143.5 2.1 (1.8, 2.4) 939.3 3.6 (3.0, 4.2) 204.2 0.7 (0.6, 1.0)
Never smoker 35 527.0 65.6 (64.4, 66.7) 8 928.6 33.9 (32.3, 35.6) 26 598.4 95.5 (94.9, 96.0)
Note: Current use includes both daily and occasional (less than daily) use.
4-2 Tobacco use
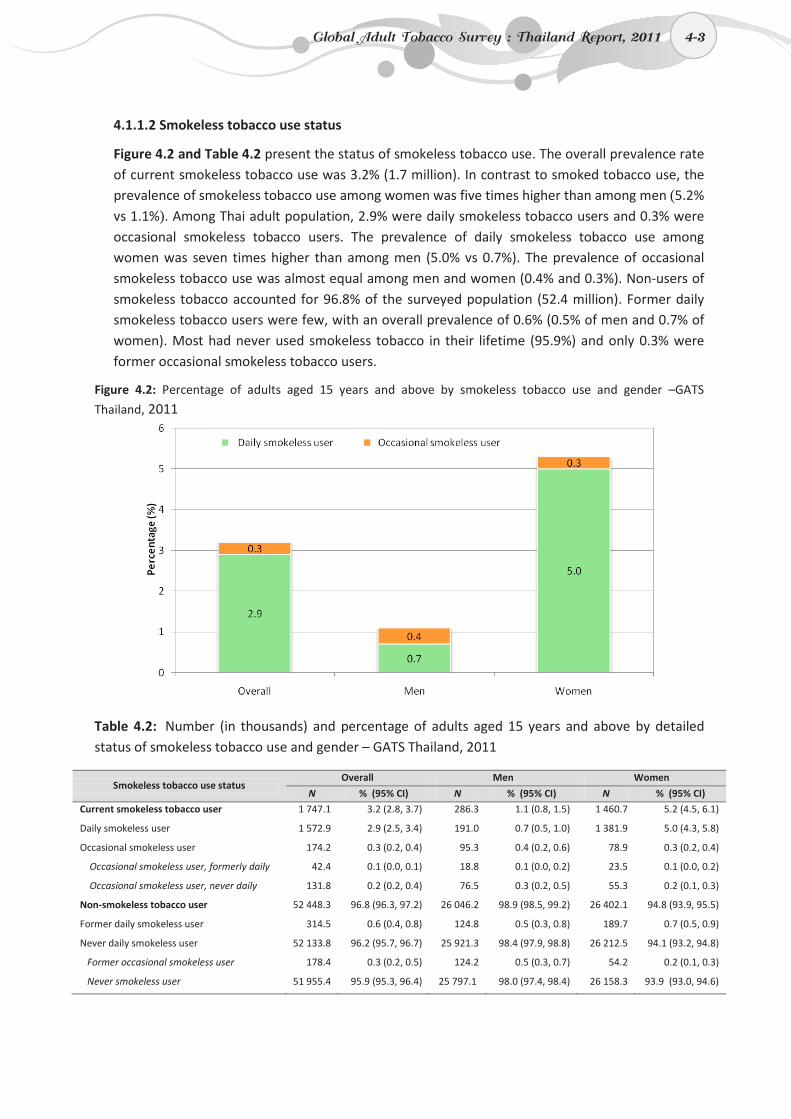
4-3
4.1.1.2 Smokeless tobacco use status
Figure 4.2 and Table 4.2 present the status of smokeless tobacco use. The overall prevalence rate of current smokeless tobacco use was 3.2% (1.7 million). In contrast to smoked tobacco use, the prevalence of smokeless tobacco use among women was five times higher than among men (5.2% vs 1.1%). Among Thai adult population, 2.9% were daily smokeless tobacco users and 0.3% were occasional smokeless tobacco users. The prevalence of daily smokeless tobacco use among women was seven times higher than among men (5.0% vs 0.7%). The prevalence of occasional smokeless tobacco use was almost equal among men and women (0.4% and 0.3%). Non-users of smokeless tobacco accounted for 96.8% of the surveyed population (52.4 million). Former daily smokeless tobacco users were few, with an overall prevalence of 0.6% (0.5% of men and 0.7% of women). Most had never used smokeless tobacco in their lifetime (95.9%) and only 0.3% were former occasional smokeless tobacco users.
Figure 4.2: Percentage of adults aged 15 years and above by smokeless tobacco use and gender –GATS
Thailand, 2011
Table 4.2: Number (in thousands) and percentage of adults aged 15 years and above by detailed status of smokeless tobacco use and gender – GATS Thailand, 2011
Smokeless tobacco use status Overall Men Women
N % (95% CI) N % (95% CI) N % (95% CI)
Current smokeless tobacco user 1 747.1 3.2 (2.8, 3.7) 286.3 1.1 (0.8, 1.5) 1 460.7 5.2 (4.5, 6.1)
Daily smokeless user 1 572.9 2.9 (2.5, 3.4) 191.0 0.7 (0.5, 1.0) 1 381.9 5.0 (4.3, 5.8)
Occasional smokeless user 174.2 0.3 (0.2, 0.4) 95.3 0.4 (0.2, 0.6) 78.9 0.3 (0.2, 0.4)
Occasional smokeless user, formerly daily 42.4 0.1 (0.0, 0.1) 18.8 0.1 (0.0, 0.2) 23.5 0.1 (0.0, 0.2)
Occasional smokeless user, never daily 131.8 0.2 (0.2, 0.4) 76.5 0.3 (0.2, 0.5) 55.3 0.2 (0.1, 0.3)
Non-smokeless tobacco user 52 448.3 96.8 (96.3, 97.2) 26 046.2 98.9 (98.5, 99.2) 26 402.1 94.8 (93.9, 95.5)
Former daily smokeless user 314.5 0.6 (0.4, 0.8) 124.8 0.5 (0.3, 0.8) 189.7 0.7 (0.5, 0.9)
Never daily smokeless user 52 133.8 96.2 (95.7, 96.7) 25 921.3 98.4 (97.9, 98.8) 26 212.5 94.1 (93.2, 94.8)
Former occasional smokeless user 178.4 0.3 (0.2, 0.5) 124.2 0.5 (0.3, 0.7) 54.2 0.2 (0.1, 0.3)
Never smokeless user 51 955.4 95.9 (95.3, 96.4) 25 797.1 98.0 (97.4, 98.4) 26 158.3 93.9 (93.0, 94.6)
Global Adult Tobacco Survey : Thailand Report, 2011 4-3
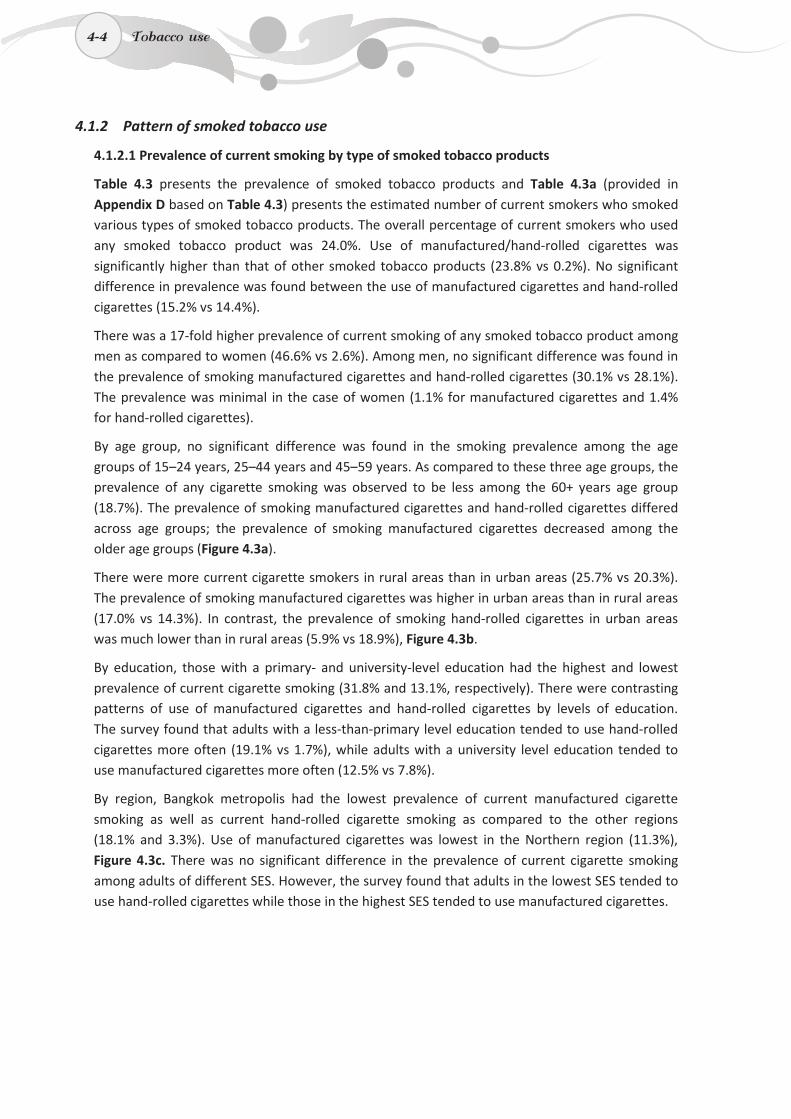
4-4
4.1.2 Pattern of smoked tobacco use
4.1.2.1 Prevalence of current smoking by type of smoked tobacco products
Table 4.3 presents the prevalence of smoked tobacco products and Table 4.3a (provided in Appendix D based on Table 4.3) presents the estimated number of current smokers who smoked various types of smoked tobacco products. The overall percentage of current smokers who used any smoked tobacco product was 24.0%. Use of manufactured/hand-rolled cigarettes was significantly higher than that of other smoked tobacco products (23.8% vs 0.2%). No significant difference in prevalence was found between the use of manufactured cigarettes and hand-rolled cigarettes (15.2% vs 14.4%).
There was a 17-fold higher prevalence of current smoking of any smoked tobacco product among men as compared to women (46.6% vs 2.6%). Among men, no significant difference was found in the prevalence of smoking manufactured cigarettes and hand-rolled cigarettes (30.1% vs 28.1%). The prevalence was minimal in the case of women (1.1% for manufactured cigarettes and 1.4% for hand-rolled cigarettes).
By age group, no significant difference was found in the smoking prevalence among the age groups of 15–24 years, 25–44 years and 45–59 years. As compared to these three age groups, the prevalence of any cigarette smoking was observed to be less among the 60+ years age group (18.7%). The prevalence of smoking manufactured cigarettes and hand-rolled cigarettes differed across age groups; the prevalence of smoking manufactured cigarettes decreased among the older age groups (Figure 4.3a).
There were more current cigarette smokers in rural areas than in urban areas (25.7% vs 20.3%). The prevalence of smoking manufactured cigarettes was higher in urban areas than in rural areas (17.0% vs 14.3%). In contrast, the prevalence of smoking hand-rolled cigarettes in urban areas was much lower than in rural areas (5.9% vs 18.9%), Figure 4.3b.
By education, those with a primary- and university-level education had the highest and lowest prevalence of current cigarette smoking (31.8% and 13.1%, respectively). There were contrasting patterns of use of manufactured cigarettes and hand-rolled cigarettes by levels of education. The survey found that adults with a less-than-primary level education tended to use hand-rolled cigarettes more often (19.1% vs 1.7%), while adults with a university level education tended to use manufactured cigarettes more often (12.5% vs 7.8%).
By region, Bangkok metropolis had the lowest prevalence of current manufactured cigarette smoking as well as current hand-rolled cigarette smoking as compared to the other regions (18.1% and 3.3%). Use of manufactured cigarettes was lowest in the Northern region (11.3%), Figure 4.3c. There was no significant difference in the prevalence of current cigarette smoking among adults of different SES. However, the survey found that adults in the lowest SES tended to use hand-rolled cigarettes while those in the highest SES tended to use manufactured cigarettes.
4-4 Tobacco use
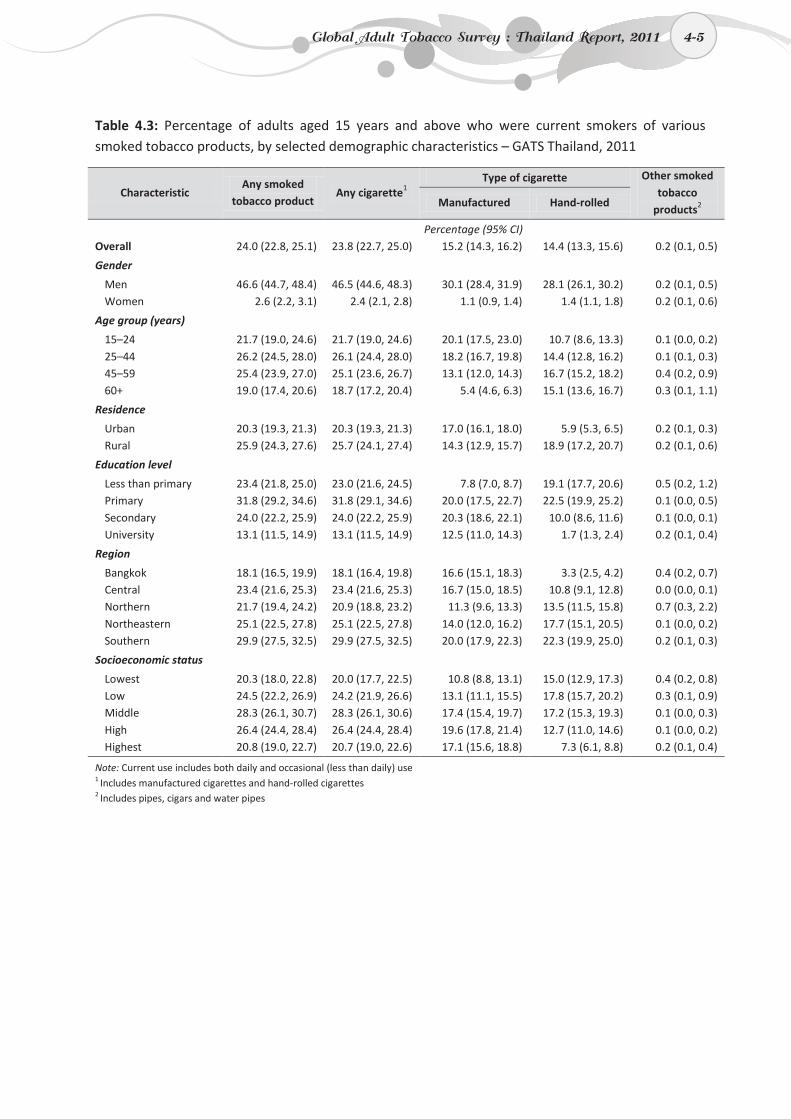
4-5
Table 4.3: Percentage of adults aged 15 years and above who were current smokers of various smoked tobacco products, by selected demographic characteristics – GATS Thailand, 2011
Characteristic Any smoked
tobacco product Any cigarette1
Type of cigarette Other smoked tobacco
products2 Manufactured Hand-rolled
Percentage (95% CI) Overall 24.0 (22.8, 25.1) 23.8 (22.7, 25.0) 15.2 (14.3, 16.2) 14.4 (13.3, 15.6) 0.2 (0.1, 0.5)
Gender
Men 46.6 (44.7, 48.4) 46.5 (44.6, 48.3) 30.1 (28.4, 31.9) 28.1 (26.1, 30.2) 0.2 (0.1, 0.5) Women 2.6 (2.2, 3.1) 2.4 (2.1, 2.8) 1.1 (0.9, 1.4) 1.4 (1.1, 1.8) 0.2 (0.1, 0.6)
Age group (years)
15–24 21.7 (19.0, 24.6) 21.7 (19.0, 24.6) 20.1 (17.5, 23.0) 10.7 (8.6, 13.3) 0.1 (0.0, 0.2) 25–44 26.2 (24.5, 28.0) 26.1 (24.4, 28.0) 18.2 (16.7, 19.8) 14.4 (12.8, 16.2) 0.1 (0.1, 0.3) 45–59 25.4 (23.9, 27.0) 25.1 (23.6, 26.7) 13.1 (12.0, 14.3) 16.7 (15.2, 18.2) 0.4 (0.2, 0.9) 60+ 19.0 (17.4, 20.6) 18.7 (17.2, 20.4) 5.4 (4.6, 6.3) 15.1 (13.6, 16.7) 0.3 (0.1, 1.1)
Residence
Urban 20.3 (19.3, 21.3) 20.3 (19.3, 21.3) 17.0 (16.1, 18.0) 5.9 (5.3, 6.5) 0.2 (0.1, 0.3) Rural 25.9 (24.3, 27.6) 25.7 (24.1, 27.4) 14.3 (12.9, 15.7) 18.9 (17.2, 20.7) 0.2 (0.1, 0.6)
Education level
Less than primary 23.4 (21.8, 25.0) 23.0 (21.6, 24.5) 7.8 (7.0, 8.7) 19.1 (17.7, 20.6) 0.5 (0.2, 1.2) Primary 31.8 (29.2, 34.6) 31.8 (29.1, 34.6) 20.0 (17.5, 22.7) 22.5 (19.9, 25.2) 0.1 (0.0, 0.5) Secondary 24.0 (22.2, 25.9) 24.0 (22.2, 25.9) 20.3 (18.6, 22.1) 10.0 (8.6, 11.6) 0.1 (0.0, 0.1) University 13.1 (11.5, 14.9) 13.1 (11.5, 14.9) 12.5 (11.0, 14.3) 1.7 (1.3, 2.4) 0.2 (0.1, 0.4)
Region
Bangkok 18.1 (16.5, 19.9) 18.1 (16.4, 19.8) 16.6 (15.1, 18.3) 3.3 (2.5, 4.2) 0.4 (0.2, 0.7) Central 23.4 (21.6, 25.3) 23.4 (21.6, 25.3) 16.7 (15.0, 18.5) 10.8 (9.1, 12.8) 0.0 (0.0, 0.1) Northern 21.7 (19.4, 24.2) 20.9 (18.8, 23.2) 11.3 (9.6, 13.3) 13.5 (11.5, 15.8) 0.7 (0.3, 2.2) Northeastern 25.1 (22.5, 27.8) 25.1 (22.5, 27.8) 14.0 (12.0, 16.2) 17.7 (15.1, 20.5) 0.1 (0.0, 0.2) Southern 29.9 (27.5, 32.5) 29.9 (27.5, 32.5) 20.0 (17.9, 22.3) 22.3 (19.9, 25.0) 0.2 (0.1, 0.3)
Socioeconomic status
Lowest 20.3 (18.0, 22.8) 20.0 (17.7, 22.5) 10.8 (8.8, 13.1) 15.0 (12.9, 17.3) 0.4 (0.2, 0.8) Low 24.5 (22.2, 26.9) 24.2 (21.9, 26.6) 13.1 (11.1, 15.5) 17.8 (15.7, 20.2) 0.3 (0.1, 0.9) Middle 28.3 (26.1, 30.7) 28.3 (26.1, 30.6) 17.4 (15.4, 19.7) 17.2 (15.3, 19.3) 0.1 (0.0, 0.3) High 26.4 (24.4, 28.4) 26.4 (24.4, 28.4) 19.6 (17.8, 21.4) 12.7 (11.0, 14.6) 0.1 (0.0, 0.2) Highest 20.8 (19.0, 22.7) 20.7 (19.0, 22.6) 17.1 (15.6, 18.8) 7.3 (6.1, 8.8) 0.2 (0.1, 0.4)
Note: Current use includes both daily and occasional (less than daily) use 1 Includes manufactured cigarettes and hand-rolled cigarettes 2 Includes pipes, cigars and water pipes
Global Adult Tobacco Survey : Thailand Report, 2011 4-5
4-6
Figure 4.3a: Percentage of adults aged 15 years and above who currently smoked manufactured cigarettes and hand-rolled cigarettes by age group – GATS Thailand, 2011
Figure 4.3b: Percentage of adults aged 15 years and above who currently smoked manufactured cigarettes and hand-rolled cigarettes, by residence – GATS Thailand, 2011
Figure 4.3c: Percentage of adults 15 years and above who currently smoked manufactured cigarettes and hand-rolled cigarettes, by region – GATS Thailand, 2011
4-6 Tobacco use
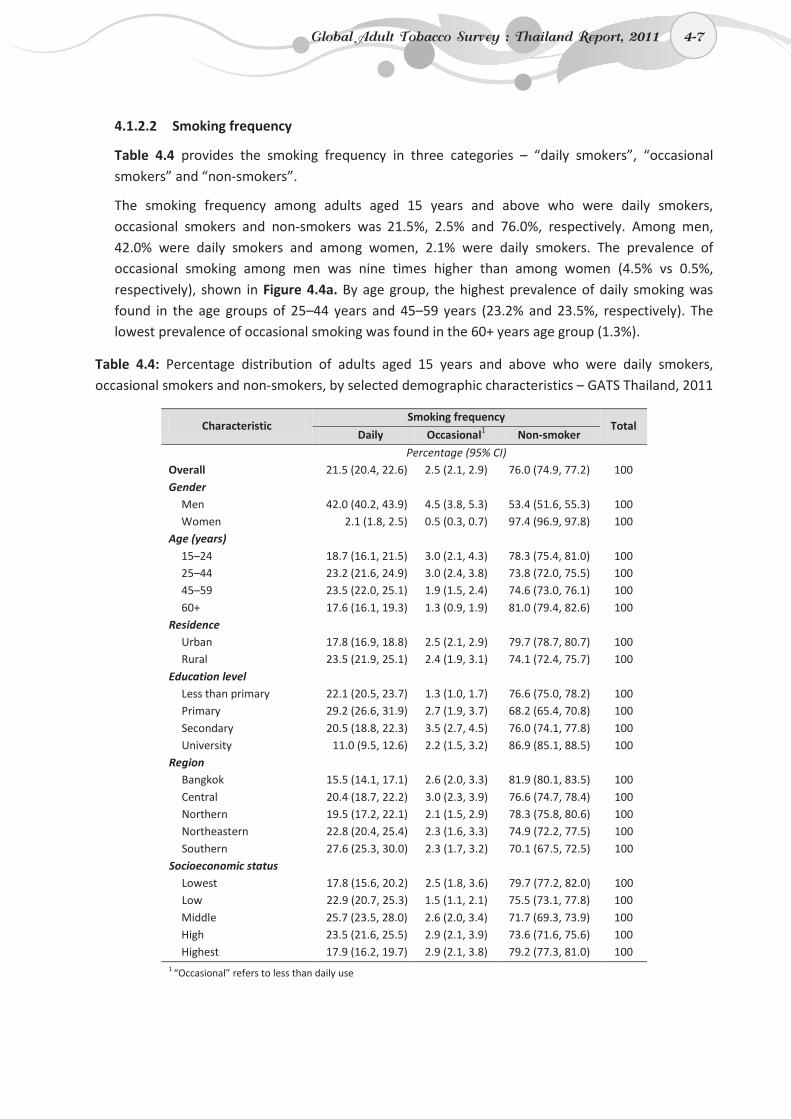
4-7
4.1.2.2 Smoking frequency
Table 4.4 provides the smoking frequency in three categories – “daily smokers”, “occasional smokers” and “non-smokers”.
The smoking frequency among adults aged 15 years and above who were daily smokers, occasional smokers and non-smokers was 21.5%, 2.5% and 76.0%, respectively. Among men, 42.0% were daily smokers and among women, 2.1% were daily smokers. The prevalence of occasional smoking among men was nine times higher than among women (4.5% vs 0.5%, respectively), shown in Figure 4.4a. By age group, the highest prevalence of daily smoking was found in the age groups of 25–44 years and 45–59 years (23.2% and 23.5%, respectively). The lowest prevalence of occasional smoking was found in the 60+ years age group (1.3%).
Table 4.4: Percentage distribution of adults aged 15 years and above who were daily smokers, occasional smokers and non-smokers, by selected demographic characteristics – GATS Thailand, 2011
Characteristic Smoking frequency
Total Daily Occasional1 Non-smoker
Percentage (95% CI) Overall 21.5 (20.4, 22.6) 2.5 (2.1, 2.9) 76.0 (74.9, 77.2) 100 Gender
Men 42.0 (40.2, 43.9) 4.5 (3.8, 5.3) 53.4 (51.6, 55.3) 100 Women 2.1 (1.8, 2.5) 0.5 (0.3, 0.7) 97.4 (96.9, 97.8) 100
Age (years) 15–24 18.7 (16.1, 21.5) 3.0 (2.1, 4.3) 78.3 (75.4, 81.0) 100 25–44 23.2 (21.6, 24.9) 3.0 (2.4, 3.8) 73.8 (72.0, 75.5) 100 45–59 23.5 (22.0, 25.1) 1.9 (1.5, 2.4) 74.6 (73.0, 76.1) 100 60+ 17.6 (16.1, 19.3) 1.3 (0.9, 1.9) 81.0 (79.4, 82.6) 100
Residence Urban 17.8 (16.9, 18.8) 2.5 (2.1, 2.9) 79.7 (78.7, 80.7) 100 Rural 23.5 (21.9, 25.1) 2.4 (1.9, 3.1) 74.1 (72.4, 75.7) 100
Education level Less than primary 22.1 (20.5, 23.7) 1.3 (1.0, 1.7) 76.6 (75.0, 78.2) 100 Primary 29.2 (26.6, 31.9) 2.7 (1.9, 3.7) 68.2 (65.4, 70.8) 100 Secondary 20.5 (18.8, 22.3) 3.5 (2.7, 4.5) 76.0 (74.1, 77.8) 100 University 11.0 (9.5, 12.6) 2.2 (1.5, 3.2) 86.9 (85.1, 88.5) 100
Region Bangkok 15.5 (14.1, 17.1) 2.6 (2.0, 3.3) 81.9 (80.1, 83.5) 100 Central 20.4 (18.7, 22.2) 3.0 (2.3, 3.9) 76.6 (74.7, 78.4) 100 Northern 19.5 (17.2, 22.1) 2.1 (1.5, 2.9) 78.3 (75.8, 80.6) 100 Northeastern 22.8 (20.4, 25.4) 2.3 (1.6, 3.3) 74.9 (72.2, 77.5) 100 Southern 27.6 (25.3, 30.0) 2.3 (1.7, 3.2) 70.1 (67.5, 72.5) 100
Socioeconomic status Lowest 17.8 (15.6, 20.2) 2.5 (1.8, 3.6) 79.7 (77.2, 82.0) 100 Low 22.9 (20.7, 25.3) 1.5 (1.1, 2.1) 75.5 (73.1, 77.8) 100 Middle 25.7 (23.5, 28.0) 2.6 (2.0, 3.4) 71.7 (69.3, 73.9) 100 High 23.5 (21.6, 25.5) 2.9 (2.1, 3.9) 73.6 (71.6, 75.6) 100 Highest 17.9 (16.2, 19.7) 2.9 (2.1, 3.8) 79.2 (77.3, 81.0) 100
1 “Occasional” refers to less than daily use
Global Adult Tobacco Survey : Thailand Report, 2011 4-7
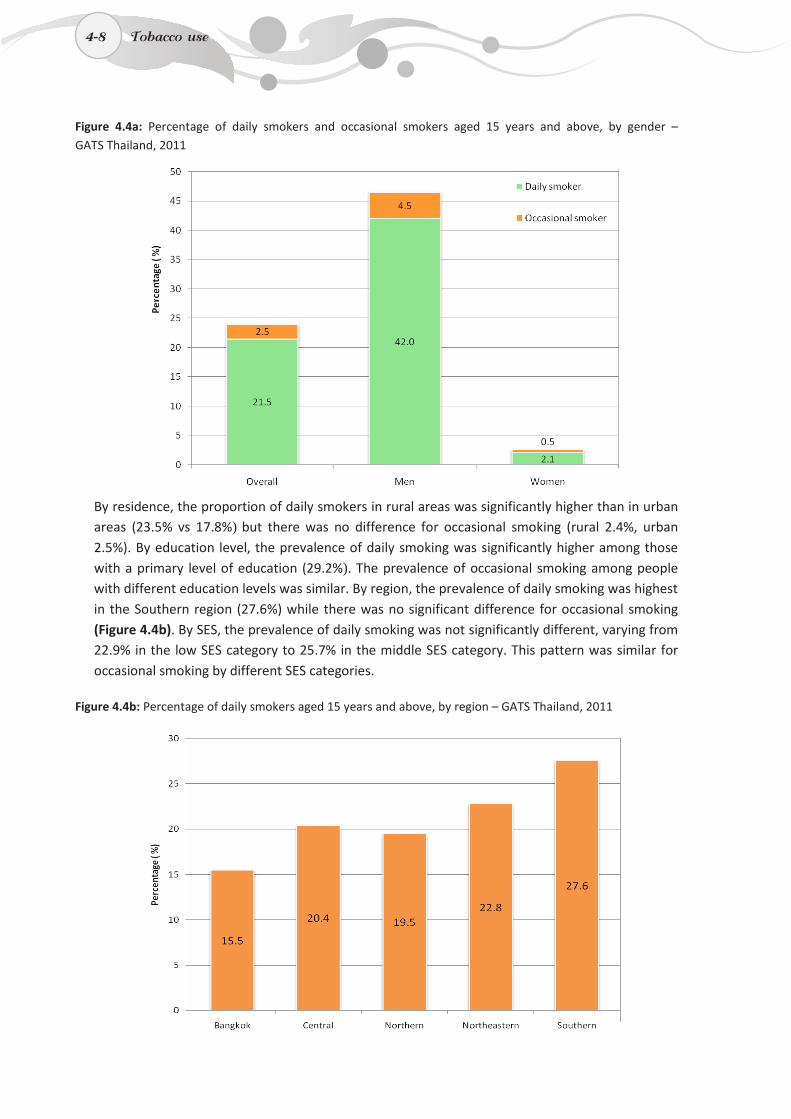
4-8
Figure 4.4a: Percentage of daily smokers and occasional smokers aged 15 years and above, by gender – GATS Thailand, 2011
By residence, the proportion of daily smokers in rural areas was significantly higher than in urban areas (23.5% vs 17.8%) but there was no difference for occasional smoking (rural 2.4%, urban 2.5%). By education level, the prevalence of daily smoking was significantly higher among those with a primary level of education (29.2%). The prevalence of occasional smoking among people with different education levels was similar. By region, the prevalence of daily smoking was highest in the Southern region (27.6%) while there was no significant difference for occasional smoking (Figure 4.4b). By SES, the prevalence of daily smoking was not significantly different, varying from 22.9% in the low SES category to 25.7% in the middle SES category. This pattern was similar for occasional smoking by different SES categories.
Figure 4.4b: Percentage of daily smokers aged 15 years and above, by region – GATS Thailand, 2011
4-8 Tobacco use
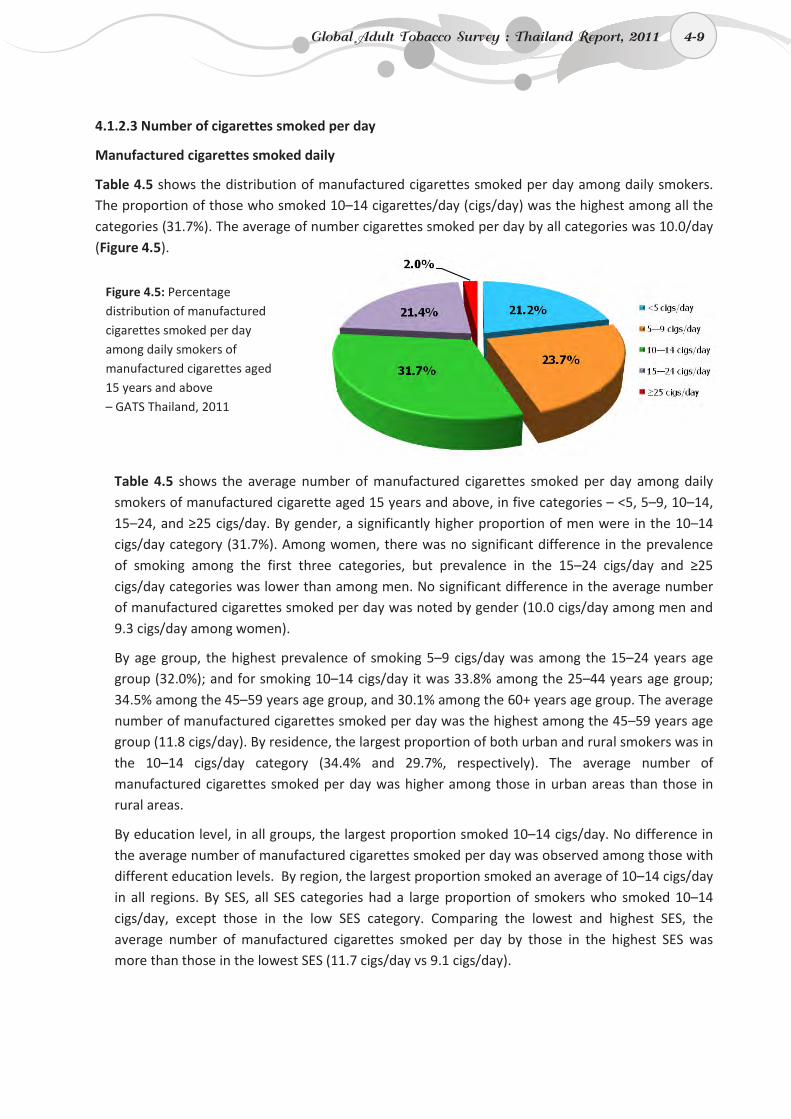
4-9
4.1.2.3 Number of cigarettes smoked per day
Manufactured cigarettes smoked daily
Table 4.5 shows the distribution of manufactured cigarettes smoked per day among daily smokers. The proportion of those who smoked 10–14 cigarettes/day (cigs/day) was the highest among all the categories (31.7%). The average of number cigarettes smoked per day by all categories was 10.0/day (Figure 4.5).
Table 4.5 shows the average number of manufactured cigarettes smoked per day among daily smokers of manufactured cigarette aged 15 years and above, in five categories – <5, 5–9, 10–14, 15–24, and ≥25 cigs/day. By gender, a significantly higher proportion of men were in the 10–14 cigs/day category (31.7%). Among women, there was no significant difference in the prevalence of smoking among the first three categories, but prevalence in the 15–24 cigs/day and ≥25 cigs/day categories was lower than among men. No significant difference in the average number of manufactured cigarettes smoked per day was noted by gender (10.0 cigs/day among men and 9.3 cigs/day among women).
By age group, the highest prevalence of smoking 5–9 cigs/day was among the 15–24 years age group (32.0%); and for smoking 10–14 cigs/day it was 33.8% among the 25–44 years age group; 34.5% among the 45–59 years age group, and 30.1% among the 60+ years age group. The average number of manufactured cigarettes smoked per day was the highest among the 45–59 years age group (11.8 cigs/day). By residence, the largest proportion of both urban and rural smokers was in the 10–14 cigs/day category (34.4% and 29.7%, respectively). The average number of manufactured cigarettes smoked per day was higher among those in urban areas than those in rural areas.
By education level, in all groups, the largest proportion smoked 10–14 cigs/day. No difference in the average number of manufactured cigarettes smoked per day was observed among those with different education levels. By region, the largest proportion smoked an average of 10–14 cigs/day in all regions. By SES, all SES categories had a large proportion of smokers who smoked 10–14 cigs/day, except those in the low SES category. Comparing the lowest and highest SES, the average number of manufactured cigarettes smoked per day by those in the highest SES was more than those in the lowest SES (11.7 cigs/day vs 9.1 cigs/day).
Figure 4.5: Percentage distribution of manufactured cigarettes smoked per day among daily smokers of manufactured cigarettes aged 15 years and above – GATS Thailand, 2011
Global Adult Tobacco Survey : Thailand Report, 2011 4-9
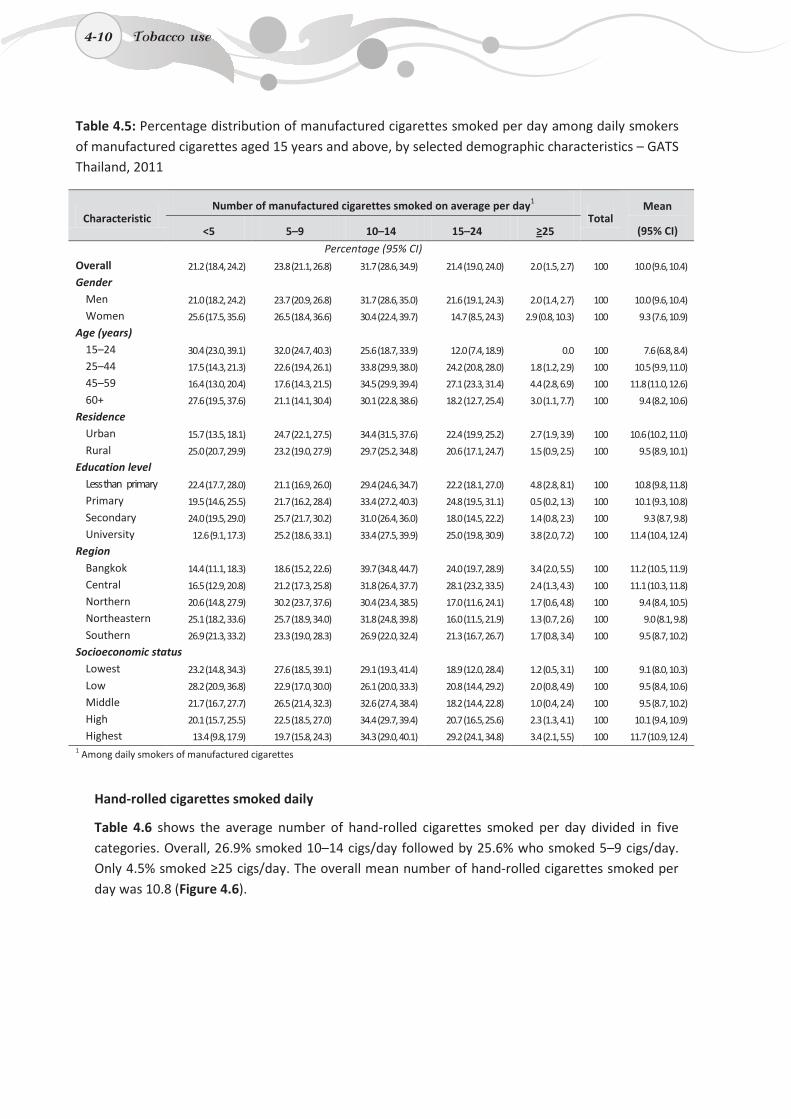
4-10
Table 4.5: Percentage distribution of manufactured cigarettes smoked per day among daily smokers of manufactured cigarettes aged 15 years and above, by selected demographic characteristics – GATS Thailand, 2011
Characteristic Number of manufactured cigarettes smoked on average per day1
Total Mean
(95% CI) <5 5–9 10–14 15–24 ≥25
Percentage (95% CI) Overall 21.2 (18.4, 24.2) 23.8 (21.1, 26.8) 31.7 (28.6, 34.9) 21.4 (19.0, 24.0) 2.0 (1.5, 2.7) 100 10.0 (9.6, 10.4)
Gender
Men 21.0 (18.2, 24.2) 23.7 (20.9, 26.8) 31.7 (28.6, 35.0) 21.6 (19.1, 24.3) 2.0 (1.4, 2.7) 100 10.0 (9.6, 10.4)
Women 25.6 (17.5, 35.6) 26.5 (18.4, 36.6) 30.4 (22.4, 39.7) 14.7 (8.5, 24.3) 2.9 (0.8, 10.3) 100 9.3 (7.6, 10.9)
Age (years)
15–24 30.4 (23.0, 39.1) 32.0 (24.7, 40.3) 25.6 (18.7, 33.9) 12.0 (7.4, 18.9) 0.0 100 7.6 (6.8, 8.4)
25–44 17.5 (14.3, 21.3) 22.6 (19.4, 26.1) 33.8 (29.9, 38.0) 24.2 (20.8, 28.0) 1.8 (1.2, 2.9) 100 10.5 (9.9, 11.0)
45–59 16.4 (13.0, 20.4) 17.6 (14.3, 21.5) 34.5 (29.9, 39.4) 27.1 (23.3, 31.4) 4.4 (2.8, 6.9) 100 11.8 (11.0, 12.6)
60+ 27.6 (19.5, 37.6) 21.1 (14.1, 30.4) 30.1 (22.8, 38.6) 18.2 (12.7, 25.4) 3.0 (1.1, 7.7) 100 9.4 (8.2, 10.6)
Residence
Urban 15.7 (13.5, 18.1) 24.7 (22.1, 27.5) 34.4 (31.5, 37.6) 22.4 (19.9, 25.2) 2.7 (1.9, 3.9) 100 10.6 (10.2, 11.0)
Rural 25.0 (20.7, 29.9) 23.2 (19.0, 27.9) 29.7 (25.2, 34.8) 20.6 (17.1, 24.7) 1.5 (0.9, 2.5) 100 9.5 (8.9, 10.1)
Education level Less than primary 22.4 (17.7, 28.0) 21.1 (16.9, 26.0) 29.4 (24.6, 34.7) 22.2 (18.1, 27.0) 4.8 (2.8, 8.1) 100 10.8 (9.8, 11.8)
Primary 19.5 (14.6, 25.5) 21.7 (16.2, 28.4) 33.4 (27.2, 40.3) 24.8 (19.5, 31.1) 0.5 (0.2, 1.3) 100 10.1 (9.3, 10.8)
Secondary 24.0 (19.5, 29.0) 25.7 (21.7, 30.2) 31.0 (26.4, 36.0) 18.0 (14.5, 22.2) 1.4 (0.8, 2.3) 100 9.3 (8.7, 9.8)
University 12.6 (9.1, 17.3) 25.2 (18.6, 33.1) 33.4 (27.5, 39.9) 25.0 (19.8, 30.9) 3.8 (2.0, 7.2) 100 11.4 (10.4, 12.4)
Region
Bangkok 14.4 (11.1, 18.3) 18.6 (15.2, 22.6) 39.7 (34.8, 44.7) 24.0 (19.7, 28.9) 3.4 (2.0, 5.5) 100 11.2 (10.5, 11.9)
Central 16.5 (12.9, 20.8) 21.2 (17.3, 25.8) 31.8 (26.4, 37.7) 28.1 (23.2, 33.5) 2.4 (1.3, 4.3) 100 11.1 (10.3, 11.8)
Northern 20.6 (14.8, 27.9) 30.2 (23.7, 37.6) 30.4 (23.4, 38.5) 17.0 (11.6, 24.1) 1.7 (0.6, 4.8) 100 9.4 (8.4, 10.5)
Northeastern 25.1 (18.2, 33.6) 25.7 (18.9, 34.0) 31.8 (24.8, 39.8) 16.0 (11.5, 21.9) 1.3 (0.7, 2.6) 100 9.0 (8.1, 9.8)
Southern 26.9 (21.3, 33.2) 23.3 (19.0, 28.3) 26.9 (22.0, 32.4) 21.3 (16.7, 26.7) 1.7 (0.8, 3.4) 100 9.5 (8.7, 10.2)
Socioeconomic status
Lowest 23.2 (14.8, 34.3) 27.6 (18.5, 39.1) 29.1 (19.3, 41.4) 18.9 (12.0, 28.4) 1.2 (0.5, 3.1) 100 9.1 (8.0, 10.3)
Low 28.2 (20.9, 36.8) 22.9 (17.0, 30.0) 26.1 (20.0, 33.3) 20.8 (14.4, 29.2) 2.0 (0.8, 4.9) 100 9.5 (8.4, 10.6)
Middle 21.7 (16.7, 27.7) 26.5 (21.4, 32.3) 32.6 (27.4, 38.4) 18.2 (14.4, 22.8) 1.0 (0.4, 2.4) 100 9.5 (8.7, 10.2)
High 20.1 (15.7, 25.5) 22.5 (18.5, 27.0) 34.4 (29.7, 39.4) 20.7 (16.5, 25.6) 2.3 (1.3, 4.1) 100 10.1 (9.4, 10.9)
Highest 13.4 (9.8, 17.9) 19.7 (15.8, 24.3) 34.3 (29.0, 40.1) 29.2 (24.1, 34.8) 3.4 (2.1, 5.5) 100 11.7 (10.9, 12.4) 1 Among daily smokers of manufactured cigarettes
Hand-rolled cigarettes smoked daily
Table 4.6 shows the average number of hand-rolled cigarettes smoked per day divided in five categories. Overall, 26.9% smoked 10–14 cigs/day followed by 25.6% who smoked 5–9 cigs/day. Only 4.5% smoked ≥25 cigs/day. The overall mean number of hand-rolled cigarettes smoked per day was 10.8 (Figure 4.6).
4-10 Tobacco use
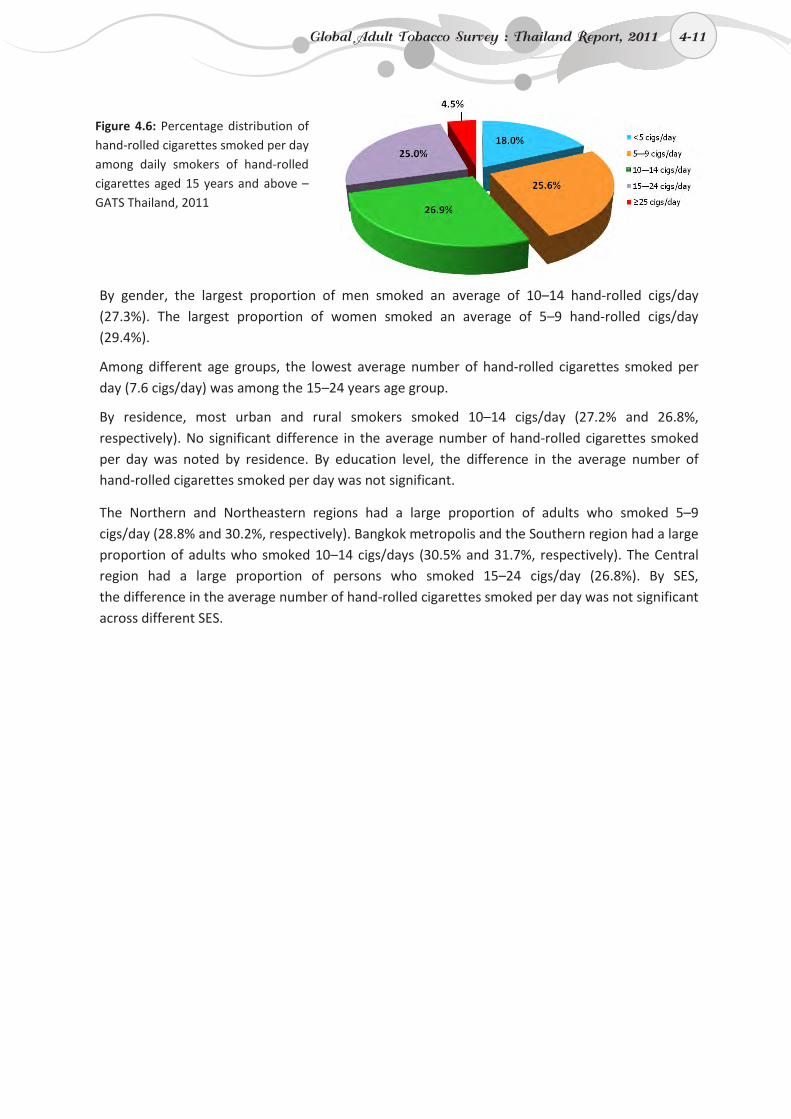
4-11
By gender, the largest proportion of men smoked an average of 10–14 hand-rolled cigs/day (27.3%). The largest proportion of women smoked an average of 5–9 hand-rolled cigs/day (29.4%).
Among different age groups, the lowest average number of hand-rolled cigarettes smoked per day (7.6 cigs/day) was among the 15–24 years age group.
By residence, most urban and rural smokers smoked 10–14 cigs/day (27.2% and 26.8%, respectively). No significant difference in the average number of hand-rolled cigarettes smoked per day was noted by residence. By education level, the difference in the average number of hand-rolled cigarettes smoked per day was not significant.
The Northern and Northeastern regions had a large proportion of adults who smoked 5–9 cigs/day (28.8% and 30.2%, respectively). Bangkok metropolis and the Southern region had a large proportion of adults who smoked 10–14 cigs/days (30.5% and 31.7%, respectively). The Central region had a large proportion of persons who smoked 15–24 cigs/day (26.8%). By SES, the difference in the average number of hand-rolled cigarettes smoked per day was not significant across different SES.
Figure 4.6: Percentage distribution of hand-rolled cigarettes smoked per day among daily smokers of hand-rolled cigarettes aged 15 years and above – GATS Thailand, 2011
Global Adult Tobacco Survey : Thailand Report, 2011 4-11
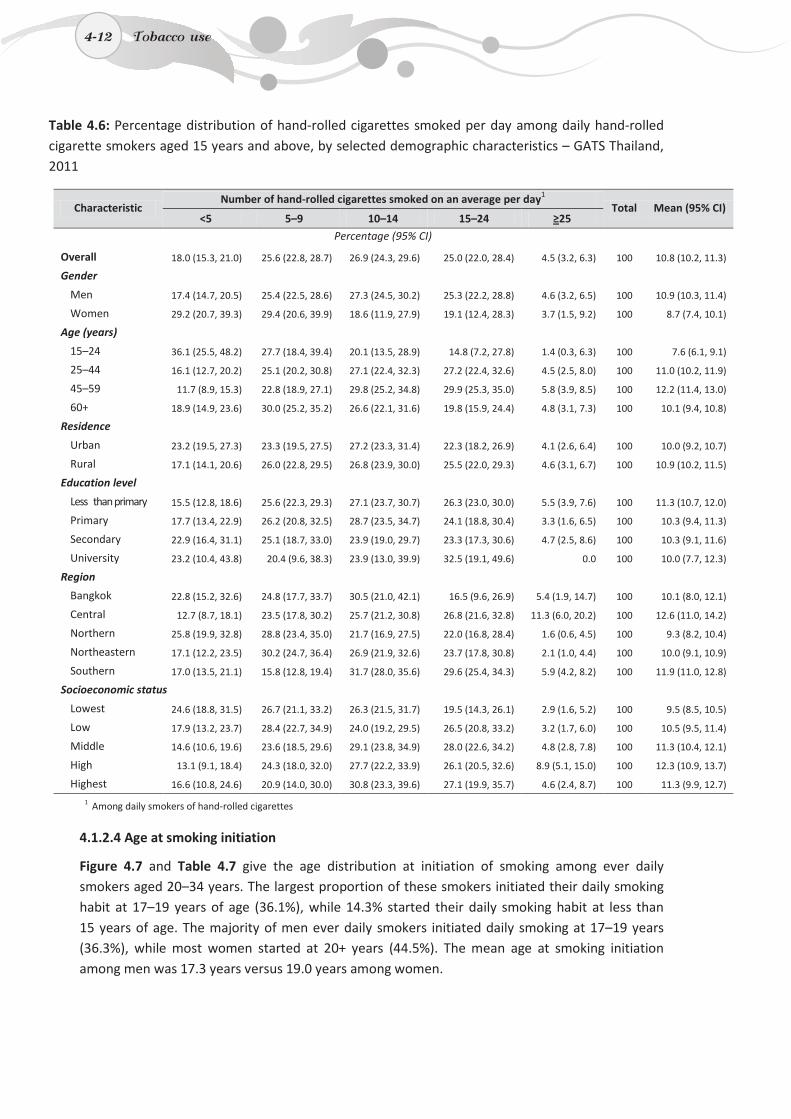
4-12
Table 4.6: Percentage distribution of hand-rolled cigarettes smoked per day among daily hand-rolled cigarette smokers aged 15 years and above, by selected demographic characteristics – GATS Thailand, 2011
Characteristic Number of hand-rolled cigarettes smoked on an average per day1
Total Mean (95% CI) <5 5–9 10–14 15–24 ≥25
Percentage (95% CI)
Overall 18.0 (15.3, 21.0) 25.6 (22.8, 28.7) 26.9 (24.3, 29.6) 25.0 (22.0, 28.4) 4.5 (3.2, 6.3) 100 10.8 (10.2, 11.3)
Gender
Men 17.4 (14.7, 20.5) 25.4 (22.5, 28.6) 27.3 (24.5, 30.2) 25.3 (22.2, 28.8) 4.6 (3.2, 6.5) 100 10.9 (10.3, 11.4)
Women 29.2 (20.7, 39.3) 29.4 (20.6, 39.9) 18.6 (11.9, 27.9) 19.1 (12.4, 28.3) 3.7 (1.5, 9.2) 100 8.7 (7.4, 10.1)
Age (years)
15–24 36.1 (25.5, 48.2) 27.7 (18.4, 39.4) 20.1 (13.5, 28.9) 14.8 (7.2, 27.8) 1.4 (0.3, 6.3) 100 7.6 (6.1, 9.1)
25–44 16.1 (12.7, 20.2) 25.1 (20.2, 30.8) 27.1 (22.4, 32.3) 27.2 (22.4, 32.6) 4.5 (2.5, 8.0) 100 11.0 (10.2, 11.9)
45–59 11.7 (8.9, 15.3) 22.8 (18.9, 27.1) 29.8 (25.2, 34.8) 29.9 (25.3, 35.0) 5.8 (3.9, 8.5) 100 12.2 (11.4, 13.0)
60+ 18.9 (14.9, 23.6) 30.0 (25.2, 35.2) 26.6 (22.1, 31.6) 19.8 (15.9, 24.4) 4.8 (3.1, 7.3) 100 10.1 (9.4, 10.8)
Residence
Urban 23.2 (19.5, 27.3) 23.3 (19.5, 27.5) 27.2 (23.3, 31.4) 22.3 (18.2, 26.9) 4.1 (2.6, 6.4) 100 10.0 (9.2, 10.7)
Rural 17.1 (14.1, 20.6) 26.0 (22.8, 29.5) 26.8 (23.9, 30.0) 25.5 (22.0, 29.3) 4.6 (3.1, 6.7) 100 10.9 (10.2, 11.5)
Education level
Less than primary 15.5 (12.8, 18.6) 25.6 (22.3, 29.3) 27.1 (23.7, 30.7) 26.3 (23.0, 30.0) 5.5 (3.9, 7.6) 100 11.3 (10.7, 12.0)
Primary 17.7 (13.4, 22.9) 26.2 (20.8, 32.5) 28.7 (23.5, 34.7) 24.1 (18.8, 30.4) 3.3 (1.6, 6.5) 100 10.3 (9.4, 11.3)
Secondary 22.9 (16.4, 31.1) 25.1 (18.7, 33.0) 23.9 (19.0, 29.7) 23.3 (17.3, 30.6) 4.7 (2.5, 8.6) 100 10.3 (9.1, 11.6)
University 23.2 (10.4, 43.8) 20.4 (9.6, 38.3) 23.9 (13.0, 39.9) 32.5 (19.1, 49.6) 0.0 100 10.0 (7.7, 12.3)
Region
Bangkok 22.8 (15.2, 32.6) 24.8 (17.7, 33.7) 30.5 (21.0, 42.1) 16.5 (9.6, 26.9) 5.4 (1.9, 14.7) 100 10.1 (8.0, 12.1)
Central 12.7 (8.7, 18.1) 23.5 (17.8, 30.2) 25.7 (21.2, 30.8) 26.8 (21.6, 32.8) 11.3 (6.0, 20.2) 100 12.6 (11.0, 14.2)
Northern 25.8 (19.9, 32.8) 28.8 (23.4, 35.0) 21.7 (16.9, 27.5) 22.0 (16.8, 28.4) 1.6 (0.6, 4.5) 100 9.3 (8.2, 10.4)
Northeastern 17.1 (12.2, 23.5) 30.2 (24.7, 36.4) 26.9 (21.9, 32.6) 23.7 (17.8, 30.8) 2.1 (1.0, 4.4) 100 10.0 (9.1, 10.9)
Southern 17.0 (13.5, 21.1) 15.8 (12.8, 19.4) 31.7 (28.0, 35.6) 29.6 (25.4, 34.3) 5.9 (4.2, 8.2) 100 11.9 (11.0, 12.8)
Socioeconomic status
Lowest 24.6 (18.8, 31.5) 26.7 (21.1, 33.2) 26.3 (21.5, 31.7) 19.5 (14.3, 26.1) 2.9 (1.6, 5.2) 100 9.5 (8.5, 10.5)
Low 17.9 (13.2, 23.7) 28.4 (22.7, 34.9) 24.0 (19.2, 29.5) 26.5 (20.8, 33.2) 3.2 (1.7, 6.0) 100 10.5 (9.5, 11.4)
Middle 14.6 (10.6, 19.6) 23.6 (18.5, 29.6) 29.1 (23.8, 34.9) 28.0 (22.6, 34.2) 4.8 (2.8, 7.8) 100 11.3 (10.4, 12.1)
High 13.1 (9.1, 18.4) 24.3 (18.0, 32.0) 27.7 (22.2, 33.9) 26.1 (20.5, 32.6) 8.9 (5.1, 15.0) 100 12.3 (10.9, 13.7)
Highest 16.6 (10.8, 24.6) 20.9 (14.0, 30.0) 30.8 (23.3, 39.6) 27.1 (19.9, 35.7) 4.6 (2.4, 8.7) 100 11.3 (9.9, 12.7)
1 Among daily smokers of hand-rolled cigarettes
4.1.2.4 Age at smoking initiation
Figure 4.7 and Table 4.7 give the age distribution at initiation of smoking among ever daily smokers aged 20–34 years. The largest proportion of these smokers initiated their daily smoking habit at 17–19 years of age (36.1%), while 14.3% started their daily smoking habit at less than 15 years of age. The majority of men ever daily smokers initiated daily smoking at 17–19 years (36.3%), while most women started at 20+ years (44.5%). The mean age at smoking initiation among men was 17.3 years versus 19.0 years among women.
4-12 Tobacco use
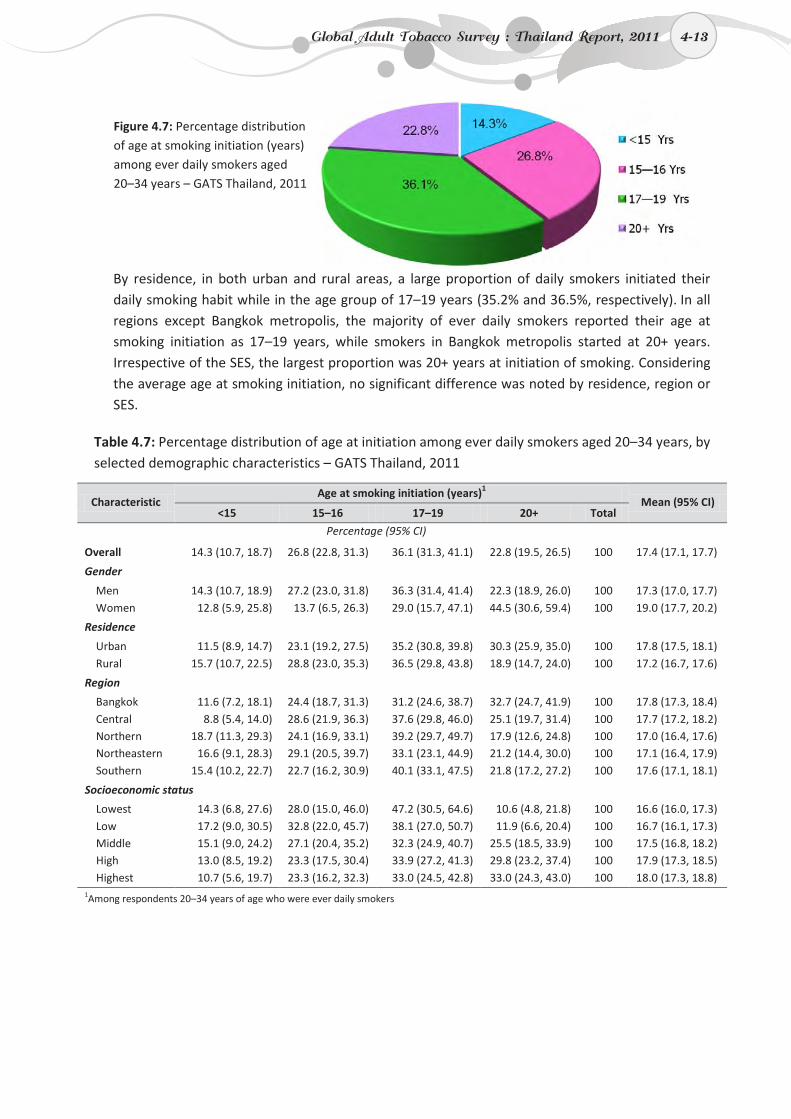
4-13
By residence, in both urban and rural areas, a large proportion of daily smokers initiated their daily smoking habit while in the age group of 17–19 years (35.2% and 36.5%, respectively). In all regions except Bangkok metropolis, the majority of ever daily smokers reported their age at smoking initiation as 17–19 years, while smokers in Bangkok metropolis started at 20+ years. Irrespective of the SES, the largest proportion was 20+ years at initiation of smoking. Considering the average age at smoking initiation, no significant difference was noted by residence, region or SES.
Table 4.7: Percentage distribution of age at initiation among ever daily smokers aged 20–34 years, by selected demographic characteristics – GATS Thailand, 2011
Characteristic Age at smoking initiation (years)1
Mean (95% CI) <15 15–16 17–19 20+ Total
Percentage (95% CI)
Overall 14.3 (10.7, 18.7) 26.8 (22.8, 31.3) 36.1 (31.3, 41.1) 22.8 (19.5, 26.5) 100 17.4 (17.1, 17.7)
Gender
Men 14.3 (10.7, 18.9) 27.2 (23.0, 31.8) 36.3 (31.4, 41.4) 22.3 (18.9, 26.0) 100 17.3 (17.0, 17.7) Women 12.8 (5.9, 25.8) 13.7 (6.5, 26.3) 29.0 (15.7, 47.1) 44.5 (30.6, 59.4) 100 19.0 (17.7, 20.2)
Residence
Urban 11.5 (8.9, 14.7) 23.1 (19.2, 27.5) 35.2 (30.8, 39.8) 30.3 (25.9, 35.0) 100 17.8 (17.5, 18.1) Rural 15.7 (10.7, 22.5) 28.8 (23.0, 35.3) 36.5 (29.8, 43.8) 18.9 (14.7, 24.0) 100 17.2 (16.7, 17.6)
Region
Bangkok 11.6 (7.2, 18.1) 24.4 (18.7, 31.3) 31.2 (24.6, 38.7) 32.7 (24.7, 41.9) 100 17.8 (17.3, 18.4) Central 8.8 (5.4, 14.0) 28.6 (21.9, 36.3) 37.6 (29.8, 46.0) 25.1 (19.7, 31.4) 100 17.7 (17.2, 18.2) Northern 18.7 (11.3, 29.3) 24.1 (16.9, 33.1) 39.2 (29.7, 49.7) 17.9 (12.6, 24.8) 100 17.0 (16.4, 17.6) Northeastern 16.6 (9.1, 28.3) 29.1 (20.5, 39.7) 33.1 (23.1, 44.9) 21.2 (14.4, 30.0) 100 17.1 (16.4, 17.9) Southern 15.4 (10.2, 22.7) 22.7 (16.2, 30.9) 40.1 (33.1, 47.5) 21.8 (17.2, 27.2) 100 17.6 (17.1, 18.1)
Socioeconomic status
Lowest 14.3 (6.8, 27.6) 28.0 (15.0, 46.0) 47.2 (30.5, 64.6) 10.6 (4.8, 21.8) 100 16.6 (16.0, 17.3) Low 17.2 (9.0, 30.5) 32.8 (22.0, 45.7) 38.1 (27.0, 50.7) 11.9 (6.6, 20.4) 100 16.7 (16.1, 17.3) Middle 15.1 (9.0, 24.2) 27.1 (20.4, 35.2) 32.3 (24.9, 40.7) 25.5 (18.5, 33.9) 100 17.5 (16.8, 18.2) High 13.0 (8.5, 19.2) 23.3 (17.5, 30.4) 33.9 (27.2, 41.3) 29.8 (23.2, 37.4) 100 17.9 (17.3, 18.5) Highest 10.7 (5.6, 19.7) 23.3 (16.2, 32.3) 33.0 (24.5, 42.8) 33.0 (24.3, 43.0) 100 18.0 (17.3, 18.8)
1Among respondents 20–34 years of age who were ever daily smokers
Figure 4.7: Percentage distribution of age at smoking initiation (years) among ever daily smokers aged 20–34 years – GATS Thailand, 2011
Global Adult Tobacco Survey : Thailand Report, 2011 4-13
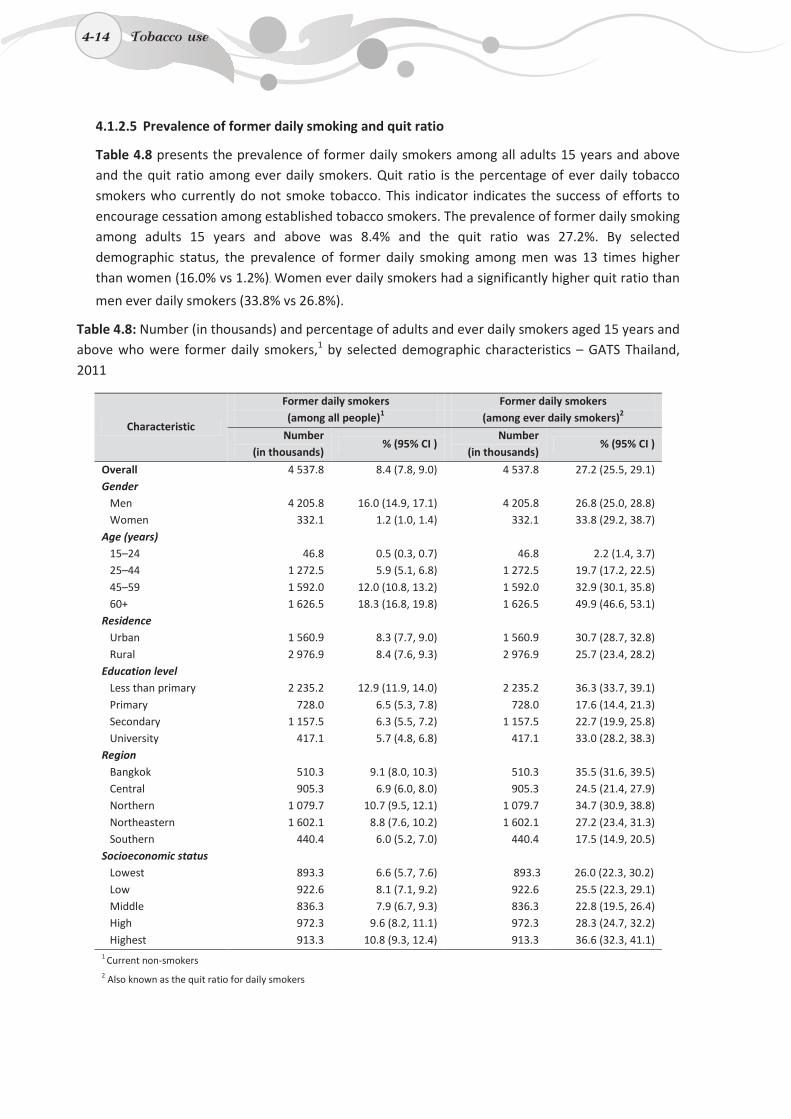
4-14
4.1.2.5 Prevalence of former daily smoking and quit ratio
Table 4.8 presents the prevalence of former daily smokers among all adults 15 years and above and the quit ratio among ever daily smokers. Quit ratio is the percentage of ever daily tobacco smokers who currently do not smoke tobacco. This indicator indicates the success of efforts to encourage cessation among established tobacco smokers. The prevalence of former daily smoking among adults 15 years and above was 8.4% and the quit ratio was 27.2%. By selected demographic status, the prevalence of former daily smoking among men was 13 times higher than women (16.0% vs 1.2%). Women ever daily smokers had a significantly higher quit ratio than
men ever daily smokers (33.8% vs 26.8%).
Table 4.8: Number (in thousands) and percentage of adults and ever daily smokers aged 15 years and above who were former daily smokers,1 by selected demographic characteristics – GATS Thailand, 2011
Characteristic
Former daily smokers Former daily smokers (among all people)1 (among ever daily smokers)2
Number (in thousands)
% (95% CI ) Number
(in thousands) % (95% CI )
Overall 4 537.8 8.4 (7.8, 9.0) 4 537.8 27.2 (25.5, 29.1) Gender
Men 4 205.8 16.0 (14.9, 17.1) 4 205.8 26.8 (25.0, 28.8) Women 332.1 1.2 (1.0, 1.4) 332.1 33.8 (29.2, 38.7)
Age (years) 15–24 46.8 0.5 (0.3, 0.7) 46.8 2.2 (1.4, 3.7) 25–44 1 272.5 5.9 (5.1, 6.8) 1 272.5 19.7 (17.2, 22.5) 45–59 1 592.0 12.0 (10.8, 13.2) 1 592.0 32.9 (30.1, 35.8) 60+ 1 626.5 18.3 (16.8, 19.8) 1 626.5 49.9 (46.6, 53.1)
Residence Urban 1 560.9 8.3 (7.7, 9.0) 1 560.9 30.7 (28.7, 32.8) Rural 2 976.9 8.4 (7.6, 9.3) 2 976.9 25.7 (23.4, 28.2)
Education level Less than primary 2 235.2 12.9 (11.9, 14.0) 2 235.2 36.3 (33.7, 39.1) Primary 728.0 6.5 (5.3, 7.8) 728.0 17.6 (14.4, 21.3) Secondary 1 157.5 6.3 (5.5, 7.2) 1 157.5 22.7 (19.9, 25.8) University 417.1 5.7 (4.8, 6.8) 417.1 33.0 (28.2, 38.3)
Region Bangkok 510.3 9.1 (8.0, 10.3) 510.3 35.5 (31.6, 39.5) Central 905.3 6.9 (6.0, 8.0) 905.3 24.5 (21.4, 27.9) Northern 1 079.7 10.7 (9.5, 12.1) 1 079.7 34.7 (30.9, 38.8) Northeastern 1 602.1 8.8 (7.6, 10.2) 1 602.1 27.2 (23.4, 31.3) Southern 440.4 6.0 (5.2, 7.0) 440.4 17.5 (14.9, 20.5)
Socioeconomic status Lowest 893.3 6.6 (5.7, 7.6) 893.3 26.0 (22.3, 30.2) Low 922.6 8.1 (7.1, 9.2) 922.6 25.5 (22.3, 29.1) Middle 836.3 7.9 (6.7, 9.3) 836.3 22.8 (19.5, 26.4) High 972.3 9.6 (8.2, 11.1) 972.3 28.3 (24.7, 32.2) Highest 913.3 10.8 (9.3, 12.4) 913.3 36.6 (32.3, 41.1)
1 Current non-smokers 2 Also known as the quit ratio for daily smokers
4-14 Tobacco use
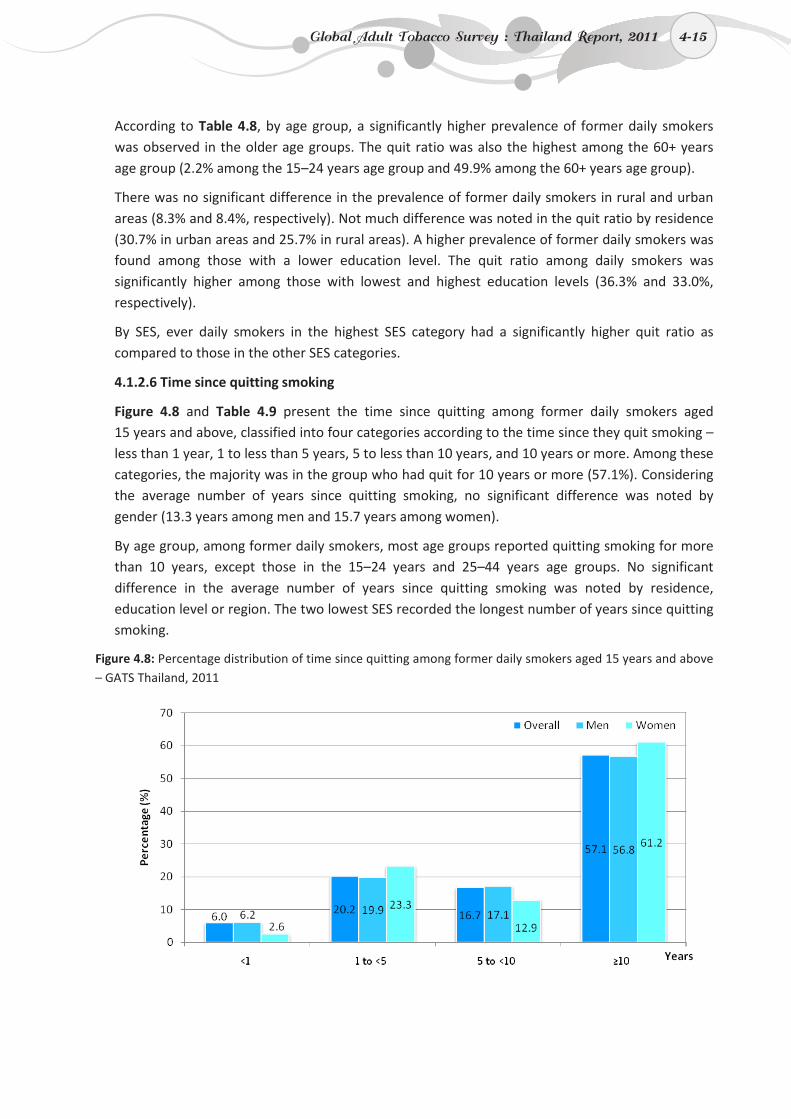
4-15
According to Table 4.8, by age group, a significantly higher prevalence of former daily smokers was observed in the older age groups. The quit ratio was also the highest among the 60+ years age group (2.2% among the 15–24 years age group and 49.9% among the 60+ years age group).
There was no significant difference in the prevalence of former daily smokers in rural and urban areas (8.3% and 8.4%, respectively). Not much difference was noted in the quit ratio by residence (30.7% in urban areas and 25.7% in rural areas). A higher prevalence of former daily smokers was found among those with a lower education level. The quit ratio among daily smokers was significantly higher among those with lowest and highest education levels (36.3% and 33.0%, respectively).
By SES, ever daily smokers in the highest SES category had a significantly higher quit ratio as compared to those in the other SES categories.
4.1.2.6 Time since quitting smoking
Figure 4.8 and Table 4.9 present the time since quitting among former daily smokers aged 15 years and above, classified into four categories according to the time since they quit smoking – less than 1 year, 1 to less than 5 years, 5 to less than 10 years, and 10 years or more. Among these categories, the majority was in the group who had quit for 10 years or more (57.1%). Considering the average number of years since quitting smoking, no significant difference was noted by gender (13.3 years among men and 15.7 years among women).
By age group, among former daily smokers, most age groups reported quitting smoking for more than 10 years, except those in the 15–24 years and 25–44 years age groups. No significant difference in the average number of years since quitting smoking was noted by residence, education level or region. The two lowest SES recorded the longest number of years since quitting smoking.
Figure 4.8: Percentage distribution of time since quitting among former daily smokers aged 15 years and above – GATS Thailand, 2011
Global Adult Tobacco Survey : Thailand Report, 2011 4-15
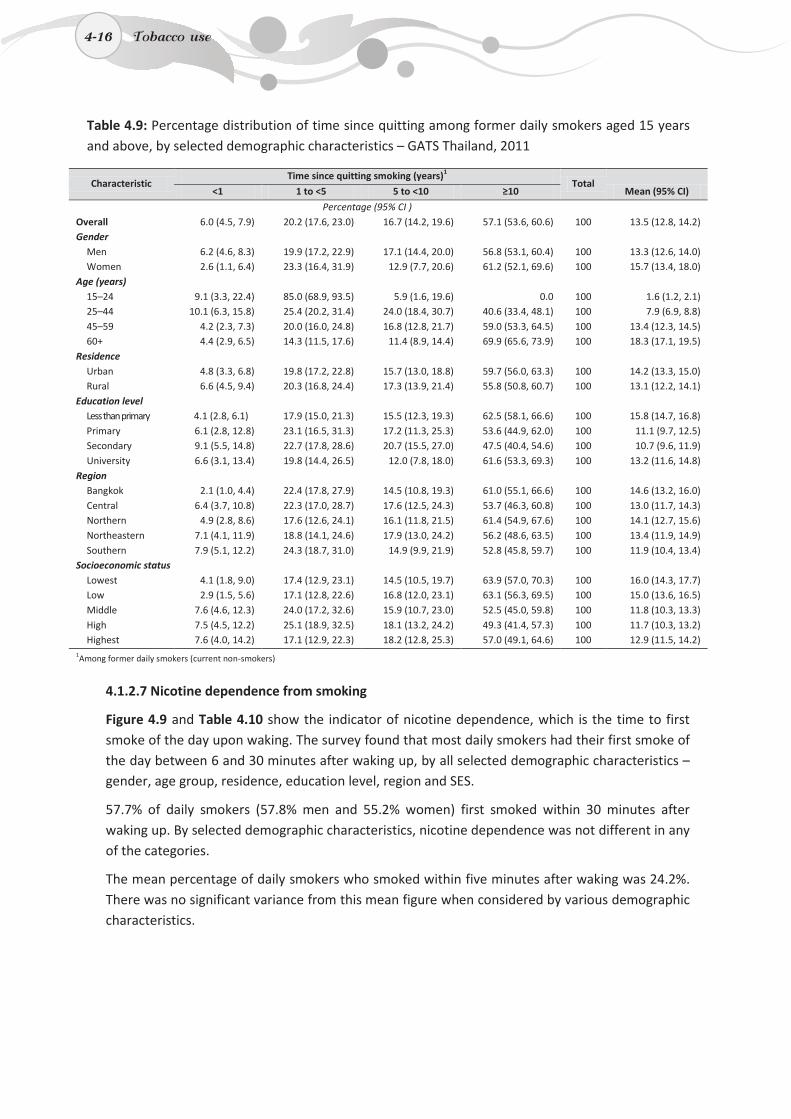
4-16
Table 4.9: Percentage distribution of time since quitting among former daily smokers aged 15 years and above, by selected demographic characteristics – GATS Thailand, 2011
Characteristic Time since quitting smoking (years)1
Total Mean (95% CI) <1 1 to <5 5 to <10 ≥10
Percentage (95% CI ) Overall 6.0 (4.5, 7.9) 20.2 (17.6, 23.0) 16.7 (14.2, 19.6) 57.1 (53.6, 60.6) 100 13.5 (12.8, 14.2) Gender
Men 6.2 (4.6, 8.3) 19.9 (17.2, 22.9) 17.1 (14.4, 20.0) 56.8 (53.1, 60.4) 100 13.3 (12.6, 14.0) Women 2.6 (1.1, 6.4) 23.3 (16.4, 31.9) 12.9 (7.7, 20.6) 61.2 (52.1, 69.6) 100 15.7 (13.4, 18.0)
Age (years) 15–24 9.1 (3.3, 22.4) 85.0 (68.9, 93.5) 5.9 (1.6, 19.6) 0.0 100 1.6 (1.2, 2.1) 25–44 10.1 (6.3, 15.8) 25.4 (20.2, 31.4) 24.0 (18.4, 30.7) 40.6 (33.4, 48.1) 100 7.9 (6.9, 8.8) 45–59 4.2 (2.3, 7.3) 20.0 (16.0, 24.8) 16.8 (12.8, 21.7) 59.0 (53.3, 64.5) 100 13.4 (12.3, 14.5) 60+ 4.4 (2.9, 6.5) 14.3 (11.5, 17.6) 11.4 (8.9, 14.4) 69.9 (65.6, 73.9) 100 18.3 (17.1, 19.5)
Residence Urban 4.8 (3.3, 6.8) 19.8 (17.2, 22.8) 15.7 (13.0, 18.8) 59.7 (56.0, 63.3) 100 14.2 (13.3, 15.0) Rural 6.6 (4.5, 9.4) 20.3 (16.8, 24.4) 17.3 (13.9, 21.4) 55.8 (50.8, 60.7) 100 13.1 (12.2, 14.1)
Education level Less than primary 4.1 (2.8, 6.1) 17.9 (15.0, 21.3) 15.5 (12.3, 19.3) 62.5 (58.1, 66.6) 100 15.8 (14.7, 16.8) Primary 6.1 (2.8, 12.8) 23.1 (16.5, 31.3) 17.2 (11.3, 25.3) 53.6 (44.9, 62.0) 100 11.1 (9.7, 12.5) Secondary 9.1 (5.5, 14.8) 22.7 (17.8, 28.6) 20.7 (15.5, 27.0) 47.5 (40.4, 54.6) 100 10.7 (9.6, 11.9) University 6.6 (3.1, 13.4) 19.8 (14.4, 26.5) 12.0 (7.8, 18.0) 61.6 (53.3, 69.3) 100 13.2 (11.6, 14.8)
Region Bangkok 2.1 (1.0, 4.4) 22.4 (17.8, 27.9) 14.5 (10.8, 19.3) 61.0 (55.1, 66.6) 100 14.6 (13.2, 16.0) Central 6.4 (3.7, 10.8) 22.3 (17.0, 28.7) 17.6 (12.5, 24.3) 53.7 (46.3, 60.8) 100 13.0 (11.7, 14.3) Northern 4.9 (2.8, 8.6) 17.6 (12.6, 24.1) 16.1 (11.8, 21.5) 61.4 (54.9, 67.6) 100 14.1 (12.7, 15.6) Northeastern 7.1 (4.1, 11.9) 18.8 (14.1, 24.6) 17.9 (13.0, 24.2) 56.2 (48.6, 63.5) 100 13.4 (11.9, 14.9) Southern 7.9 (5.1, 12.2) 24.3 (18.7, 31.0) 14.9 (9.9, 21.9) 52.8 (45.8, 59.7) 100 11.9 (10.4, 13.4)
Socioeconomic status Lowest 4.1 (1.8, 9.0) 17.4 (12.9, 23.1) 14.5 (10.5, 19.7) 63.9 (57.0, 70.3) 100 16.0 (14.3, 17.7) Low 2.9 (1.5, 5.6) 17.1 (12.8, 22.6) 16.8 (12.0, 23.1) 63.1 (56.3, 69.5) 100 15.0 (13.6, 16.5) Middle 7.6 (4.6, 12.3) 24.0 (17.2, 32.6) 15.9 (10.7, 23.0) 52.5 (45.0, 59.8) 100 11.8 (10.3, 13.3) High 7.5 (4.5, 12.2) 25.1 (18.9, 32.5) 18.1 (13.2, 24.2) 49.3 (41.4, 57.3) 100 11.7 (10.3, 13.2) Highest 7.6 (4.0, 14.2) 17.1 (12.9, 22.3) 18.2 (12.8, 25.3) 57.0 (49.1, 64.6) 100 12.9 (11.5, 14.2)
1Among former daily smokers (current non-smokers)
4.1.2.7 Nicotine dependence from smoking
Figure 4.9 and Table 4.10 show the indicator of nicotine dependence, which is the time to first smoke of the day upon waking. The survey found that most daily smokers had their first smoke of the day between 6 and 30 minutes after waking up, by all selected demographic characteristics –gender, age group, residence, education level, region and SES.
57.7% of daily smokers (57.8% men and 55.2% women) first smoked within 30 minutes after waking up. By selected demographic characteristics, nicotine dependence was not different in any of the categories.
The mean percentage of daily smokers who smoked within five minutes after waking was 24.2%. There was no significant variance from this mean figure when considered by various demographic characteristics.
4-16 Tobacco use
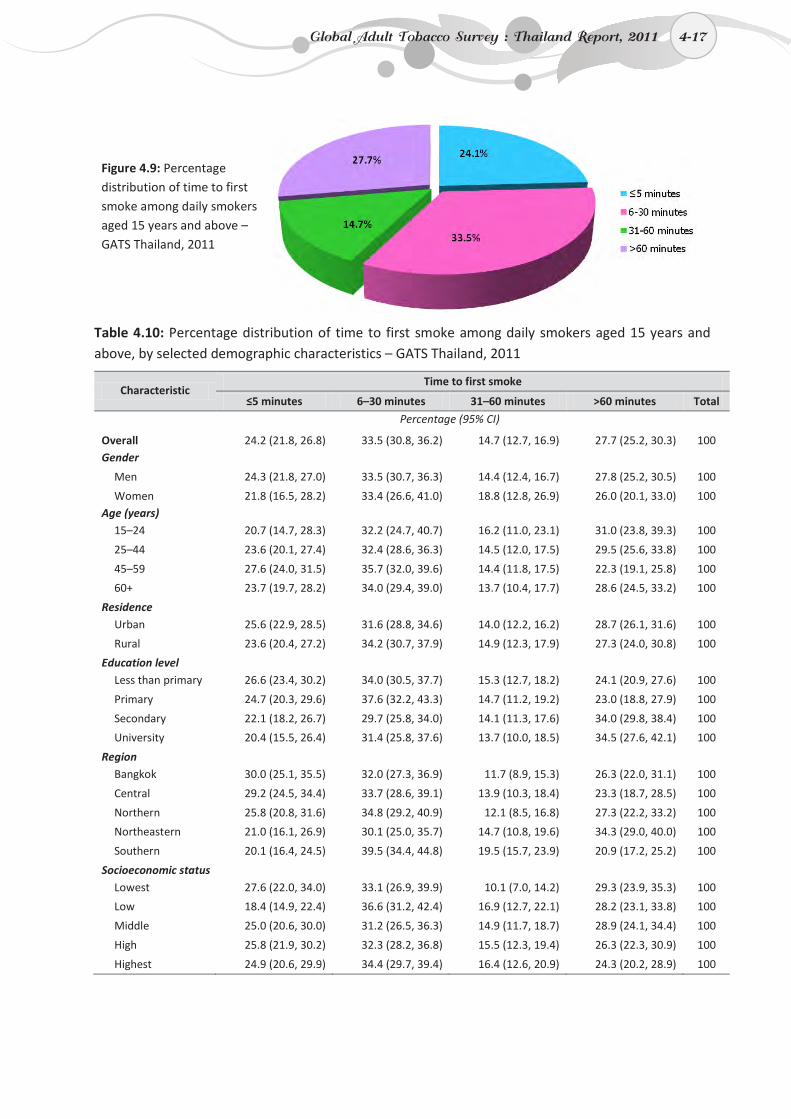
4-17
Table 4.10: Percentage distribution of time to first smoke among daily smokers aged 15 years and above, by selected demographic characteristics – GATS Thailand, 2011
Characteristic Time to first smoke
≤5 minutes 6–30 minutes 31–60 minutes >60 minutes Total
Percentage (95% CI)
Overall 24.2 (21.8, 26.8) 33.5 (30.8, 36.2) 14.7 (12.7, 16.9) 27.7 (25.2, 30.3) 100 Gender
Men 24.3 (21.8, 27.0) 33.5 (30.7, 36.3) 14.4 (12.4, 16.7) 27.8 (25.2, 30.5) 100
Women 21.8 (16.5, 28.2) 33.4 (26.6, 41.0) 18.8 (12.8, 26.9) 26.0 (20.1, 33.0) 100 Age (years)
15–24 20.7 (14.7, 28.3) 32.2 (24.7, 40.7) 16.2 (11.0, 23.1) 31.0 (23.8, 39.3) 100
25–44 23.6 (20.1, 27.4) 32.4 (28.6, 36.3) 14.5 (12.0, 17.5) 29.5 (25.6, 33.8) 100
45–59 27.6 (24.0, 31.5) 35.7 (32.0, 39.6) 14.4 (11.8, 17.5) 22.3 (19.1, 25.8) 100
60+ 23.7 (19.7, 28.2) 34.0 (29.4, 39.0) 13.7 (10.4, 17.7) 28.6 (24.5, 33.2) 100
Residence Urban 25.6 (22.9, 28.5) 31.6 (28.8, 34.6) 14.0 (12.2, 16.2) 28.7 (26.1, 31.6) 100
Rural 23.6 (20.4, 27.2) 34.2 (30.7, 37.9) 14.9 (12.3, 17.9) 27.3 (24.0, 30.8) 100
Education level Less than primary 26.6 (23.4, 30.2) 34.0 (30.5, 37.7) 15.3 (12.7, 18.2) 24.1 (20.9, 27.6) 100
Primary 24.7 (20.3, 29.6) 37.6 (32.2, 43.3) 14.7 (11.2, 19.2) 23.0 (18.8, 27.9) 100
Secondary 22.1 (18.2, 26.7) 29.7 (25.8, 34.0) 14.1 (11.3, 17.6) 34.0 (29.8, 38.4) 100
University 20.4 (15.5, 26.4) 31.4 (25.8, 37.6) 13.7 (10.0, 18.5) 34.5 (27.6, 42.1) 100
Region Bangkok 30.0 (25.1, 35.5) 32.0 (27.3, 36.9) 11.7 (8.9, 15.3) 26.3 (22.0, 31.1) 100
Central 29.2 (24.5, 34.4) 33.7 (28.6, 39.1) 13.9 (10.3, 18.4) 23.3 (18.7, 28.5) 100
Northern 25.8 (20.8, 31.6) 34.8 (29.2, 40.9) 12.1 (8.5, 16.8) 27.3 (22.2, 33.2) 100
Northeastern 21.0 (16.1, 26.9) 30.1 (25.0, 35.7) 14.7 (10.8, 19.6) 34.3 (29.0, 40.0) 100
Southern 20.1 (16.4, 24.5) 39.5 (34.4, 44.8) 19.5 (15.7, 23.9) 20.9 (17.2, 25.2) 100
Socioeconomic status Lowest 27.6 (22.0, 34.0) 33.1 (26.9, 39.9) 10.1 (7.0, 14.2) 29.3 (23.9, 35.3) 100
Low 18.4 (14.9, 22.4) 36.6 (31.2, 42.4) 16.9 (12.7, 22.1) 28.2 (23.1, 33.8) 100
Middle 25.0 (20.6, 30.0) 31.2 (26.5, 36.3) 14.9 (11.7, 18.7) 28.9 (24.1, 34.4) 100
High 25.8 (21.9, 30.2) 32.3 (28.2, 36.8) 15.5 (12.3, 19.4) 26.3 (22.3, 30.9) 100
Highest 24.9 (20.6, 29.9) 34.4 (29.7, 39.4) 16.4 (12.6, 20.9) 24.3 (20.2, 28.9) 100
Figure 4.9: Percentage distribution of time to first smoke among daily smokers aged 15 years and above – GATS Thailand, 2011
Global Adult Tobacco Survey : Thailand Report, 2011 4-17
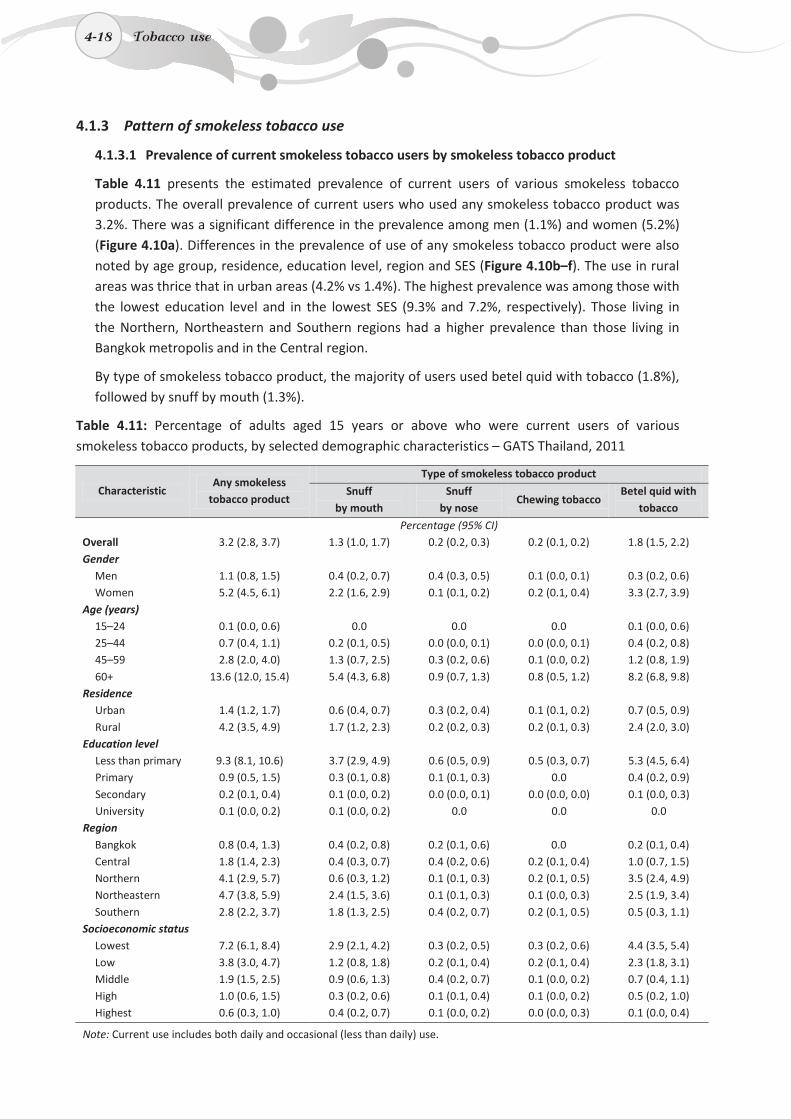
4-18
4.1.3 Pattern of smokeless tobacco use
4.1.3.1 Prevalence of current smokeless tobacco users by smokeless tobacco product
Table 4.11 presents the estimated prevalence of current users of various smokeless tobacco products. The overall prevalence of current users who used any smokeless tobacco product was 3.2%. There was a significant difference in the prevalence among men (1.1%) and women (5.2%) (Figure 4.10a). Differences in the prevalence of use of any smokeless tobacco product were also noted by age group, residence, education level, region and SES (Figure 4.10b–f). The use in rural areas was thrice that in urban areas (4.2% vs 1.4%). The highest prevalence was among those with the lowest education level and in the lowest SES (9.3% and 7.2%, respectively). Those living in the Northern, Northeastern and Southern regions had a higher prevalence than those living in Bangkok metropolis and in the Central region.
By type of smokeless tobacco product, the majority of users used betel quid with tobacco (1.8%), followed by snuff by mouth (1.3%).
Table 4.11: Percentage of adults aged 15 years or above who were current users of various smokeless tobacco products, by selected demographic characteristics – GATS Thailand, 2011
Characteristic Any smokeless
tobacco product
Type of smokeless tobacco product
Snuff by mouth
Snuff by nose
Chewing tobacco Betel quid with
tobacco
Percentage (95% CI) Overall 3.2 (2.8, 3.7) 1.3 (1.0, 1.7) 0.2 (0.2, 0.3) 0.2 (0.1, 0.2) 1.8 (1.5, 2.2) Gender
Men 1.1 (0.8, 1.5) 0.4 (0.2, 0.7) 0.4 (0.3, 0.5) 0.1 (0.0, 0.1) 0.3 (0.2, 0.6) Women 5.2 (4.5, 6.1) 2.2 (1.6, 2.9) 0.1 (0.1, 0.2) 0.2 (0.1, 0.4) 3.3 (2.7, 3.9)
Age (years) 15–24 0.1 (0.0, 0.6) 0.0 0.0 0.0 0.1 (0.0, 0.6) 25–44 0.7 (0.4, 1.1) 0.2 (0.1, 0.5) 0.0 (0.0, 0.1) 0.0 (0.0, 0.1) 0.4 (0.2, 0.8) 45–59 2.8 (2.0, 4.0) 1.3 (0.7, 2.5) 0.3 (0.2, 0.6) 0.1 (0.0, 0.2) 1.2 (0.8, 1.9) 60+ 13.6 (12.0, 15.4) 5.4 (4.3, 6.8) 0.9 (0.7, 1.3) 0.8 (0.5, 1.2) 8.2 (6.8, 9.8)
Residence Urban 1.4 (1.2, 1.7) 0.6 (0.4, 0.7) 0.3 (0.2, 0.4) 0.1 (0.1, 0.2) 0.7 (0.5, 0.9) Rural 4.2 (3.5, 4.9) 1.7 (1.2, 2.3) 0.2 (0.2, 0.3) 0.2 (0.1, 0.3) 2.4 (2.0, 3.0)
Education level Less than primary 9.3 (8.1, 10.6) 3.7 (2.9, 4.9) 0.6 (0.5, 0.9) 0.5 (0.3, 0.7) 5.3 (4.5, 6.4) Primary 0.9 (0.5, 1.5) 0.3 (0.1, 0.8) 0.1 (0.1, 0.3) 0.0 0.4 (0.2, 0.9) Secondary 0.2 (0.1, 0.4) 0.1 (0.0, 0.2) 0.0 (0.0, 0.1) 0.0 (0.0, 0.0) 0.1 (0.0, 0.3) University 0.1 (0.0, 0.2) 0.1 (0.0, 0.2) 0.0 0.0 0.0
Region Bangkok 0.8 (0.4, 1.3) 0.4 (0.2, 0.8) 0.2 (0.1, 0.6) 0.0 0.2 (0.1, 0.4) Central 1.8 (1.4, 2.3) 0.4 (0.3, 0.7) 0.4 (0.2, 0.6) 0.2 (0.1, 0.4) 1.0 (0.7, 1.5) Northern 4.1 (2.9, 5.7) 0.6 (0.3, 1.2) 0.1 (0.1, 0.3) 0.2 (0.1, 0.5) 3.5 (2.4, 4.9) Northeastern 4.7 (3.8, 5.9) 2.4 (1.5, 3.6) 0.1 (0.1, 0.3) 0.1 (0.0, 0.3) 2.5 (1.9, 3.4) Southern 2.8 (2.2, 3.7) 1.8 (1.3, 2.5) 0.4 (0.2, 0.7) 0.2 (0.1, 0.5) 0.5 (0.3, 1.1)
Socioeconomic status Lowest 7.2 (6.1, 8.4) 2.9 (2.1, 4.2) 0.3 (0.2, 0.5) 0.3 (0.2, 0.6) 4.4 (3.5, 5.4) Low 3.8 (3.0, 4.7) 1.2 (0.8, 1.8) 0.2 (0.1, 0.4) 0.2 (0.1, 0.4) 2.3 (1.8, 3.1) Middle 1.9 (1.5, 2.5) 0.9 (0.6, 1.3) 0.4 (0.2, 0.7) 0.1 (0.0, 0.2) 0.7 (0.4, 1.1) High 1.0 (0.6, 1.5) 0.3 (0.2, 0.6) 0.1 (0.1, 0.4) 0.1 (0.0, 0.2) 0.5 (0.2, 1.0) Highest 0.6 (0.3, 1.0) 0.4 (0.2, 0.7) 0.1 (0.0, 0.2) 0.0 (0.0, 0.3) 0.1 (0.0, 0.4)
Note: Current use includes both daily and occasional (less than daily) use.
4-18 Tobacco use
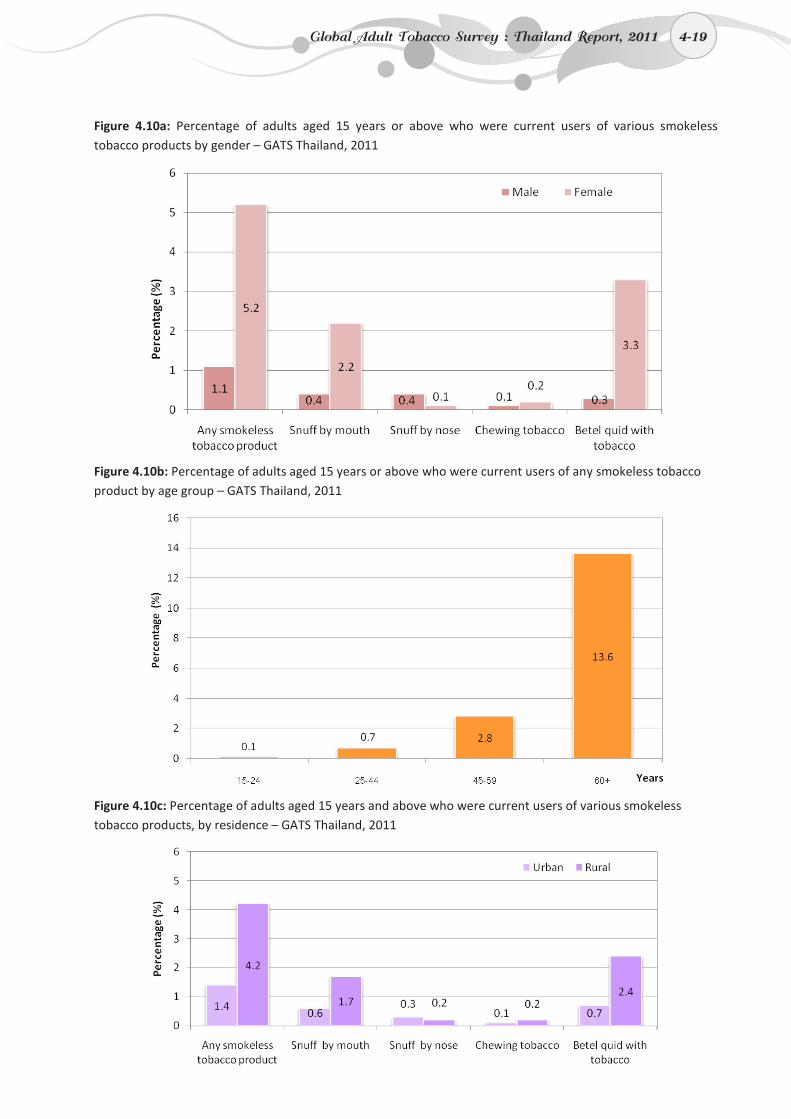
4-19
Figure 4.10a: Percentage of adults aged 15 years or above who were current users of various smokeless tobacco products by gender – GATS Thailand, 2011
Figure 4.10b: Percentage of adults aged 15 years or above who were current users of any smokeless tobacco product by age group – GATS Thailand, 2011
Figure 4.10c: Percentage of adults aged 15 years and above who were current users of various smokeless tobacco products, by residence – GATS Thailand, 2011
Global Adult Tobacco Survey : Thailand Report, 2011 4-19
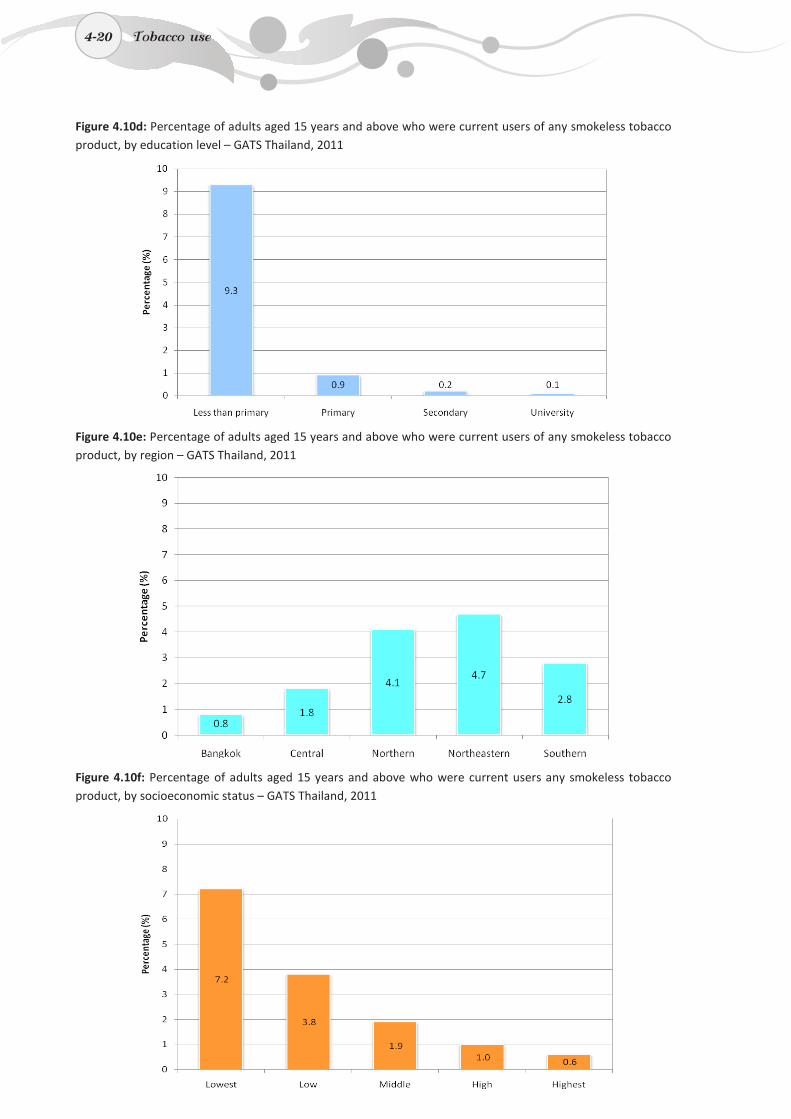
4-20
Figure 4.10d: Percentage of adults aged 15 years and above who were current users of any smokeless tobacco product, by education level – GATS Thailand, 2011
Figure 4.10e: Percentage of adults aged 15 years and above who were current users of any smokeless tobacco product, by region – GATS Thailand, 2011
Figure 4.10f: Percentage of adults aged 15 years and above who were current users any smokeless tobacco product, by socioeconomic status – GATS Thailand, 2011
4-20 Tobacco use
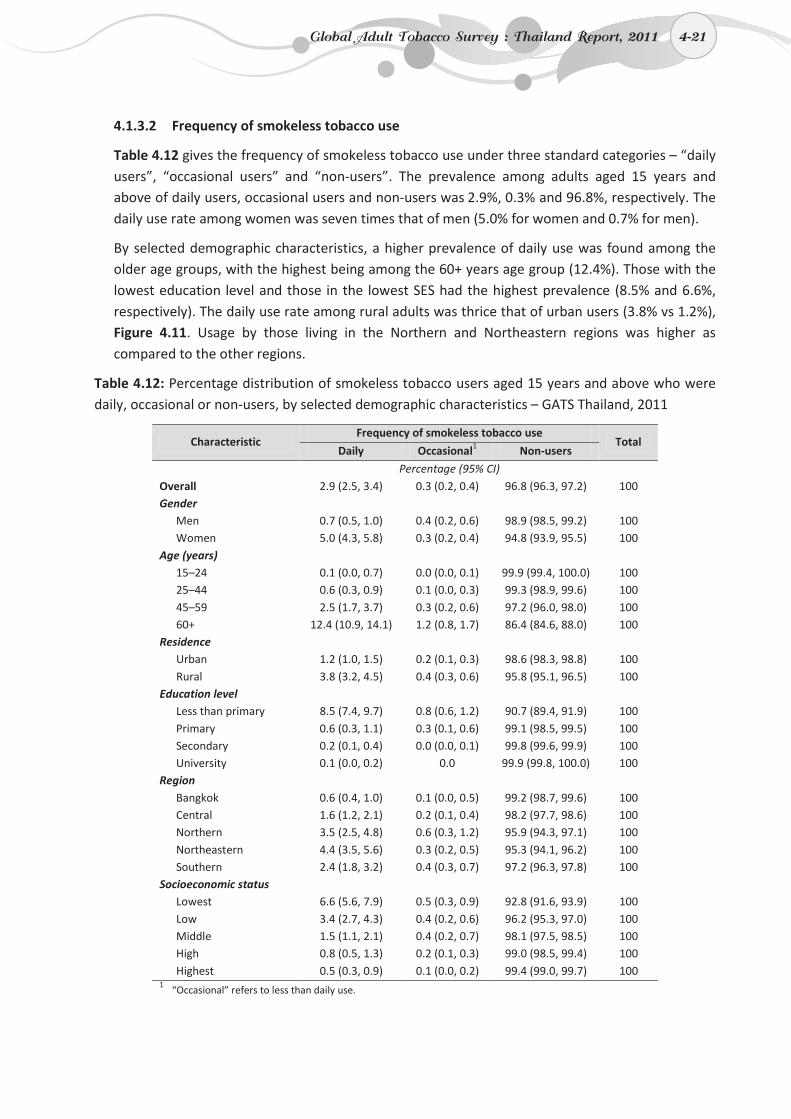
4-21
4.1.3.2 Frequency of smokeless tobacco use
Table 4.12 gives the frequency of smokeless tobacco use under three standard categories – “daily users”, “occasional users” and “non-users”. The prevalence among adults aged 15 years and above of daily users, occasional users and non-users was 2.9%, 0.3% and 96.8%, respectively. The daily use rate among women was seven times that of men (5.0% for women and 0.7% for men).
By selected demographic characteristics, a higher prevalence of daily use was found among the older age groups, with the highest being among the 60+ years age group (12.4%). Those with the lowest education level and those in the lowest SES had the highest prevalence (8.5% and 6.6%, respectively). The daily use rate among rural adults was thrice that of urban users (3.8% vs 1.2%), Figure 4.11. Usage by those living in the Northern and Northeastern regions was higher as compared to the other regions.
Table 4.12: Percentage distribution of smokeless tobacco users aged 15 years and above who were daily, occasional or non-users, by selected demographic characteristics – GATS Thailand, 2011
Characteristic Frequency of smokeless tobacco use
Total Daily Occasional1 Non-users
Percentage (95% CI) Overall 2.9 (2.5, 3.4) 0.3 (0.2, 0.4) 96.8 (96.3, 97.2) 100 Gender
Men 0.7 (0.5, 1.0) 0.4 (0.2, 0.6) 98.9 (98.5, 99.2) 100 Women 5.0 (4.3, 5.8) 0.3 (0.2, 0.4) 94.8 (93.9, 95.5) 100
Age (years) 15–24 0.1 (0.0, 0.7) 0.0 (0.0, 0.1) 99.9 (99.4, 100.0) 100 25–44 0.6 (0.3, 0.9) 0.1 (0.0, 0.3) 99.3 (98.9, 99.6) 100 45–59 2.5 (1.7, 3.7) 0.3 (0.2, 0.6) 97.2 (96.0, 98.0) 100 60+ 12.4 (10.9, 14.1) 1.2 (0.8, 1.7) 86.4 (84.6, 88.0) 100
Residence Urban 1.2 (1.0, 1.5) 0.2 (0.1, 0.3) 98.6 (98.3, 98.8) 100 Rural 3.8 (3.2, 4.5) 0.4 (0.3, 0.6) 95.8 (95.1, 96.5) 100
Education level Less than primary 8.5 (7.4, 9.7) 0.8 (0.6, 1.2) 90.7 (89.4, 91.9) 100 Primary 0.6 (0.3, 1.1) 0.3 (0.1, 0.6) 99.1 (98.5, 99.5) 100 Secondary 0.2 (0.1, 0.4) 0.0 (0.0, 0.1) 99.8 (99.6, 99.9) 100 University 0.1 (0.0, 0.2) 0.0 99.9 (99.8, 100.0) 100
Region Bangkok 0.6 (0.4, 1.0) 0.1 (0.0, 0.5) 99.2 (98.7, 99.6) 100 Central 1.6 (1.2, 2.1) 0.2 (0.1, 0.4) 98.2 (97.7, 98.6) 100 Northern 3.5 (2.5, 4.8) 0.6 (0.3, 1.2) 95.9 (94.3, 97.1) 100 Northeastern 4.4 (3.5, 5.6) 0.3 (0.2, 0.5) 95.3 (94.1, 96.2) 100 Southern 2.4 (1.8, 3.2) 0.4 (0.3, 0.7) 97.2 (96.3, 97.8) 100
Socioeconomic status Lowest 6.6 (5.6, 7.9) 0.5 (0.3, 0.9) 92.8 (91.6, 93.9) 100 Low 3.4 (2.7, 4.3) 0.4 (0.2, 0.6) 96.2 (95.3, 97.0) 100 Middle 1.5 (1.1, 2.1) 0.4 (0.2, 0.7) 98.1 (97.5, 98.5) 100 High 0.8 (0.5, 1.3) 0.2 (0.1, 0.3) 99.0 (98.5, 99.4) 100 Highest 0.5 (0.3, 0.9) 0.1 (0.0, 0.2) 99.4 (99.0, 99.7) 100
1 “Occasional” refers to less than daily use.
Global Adult Tobacco Survey : Thailand Report, 2011 4-21
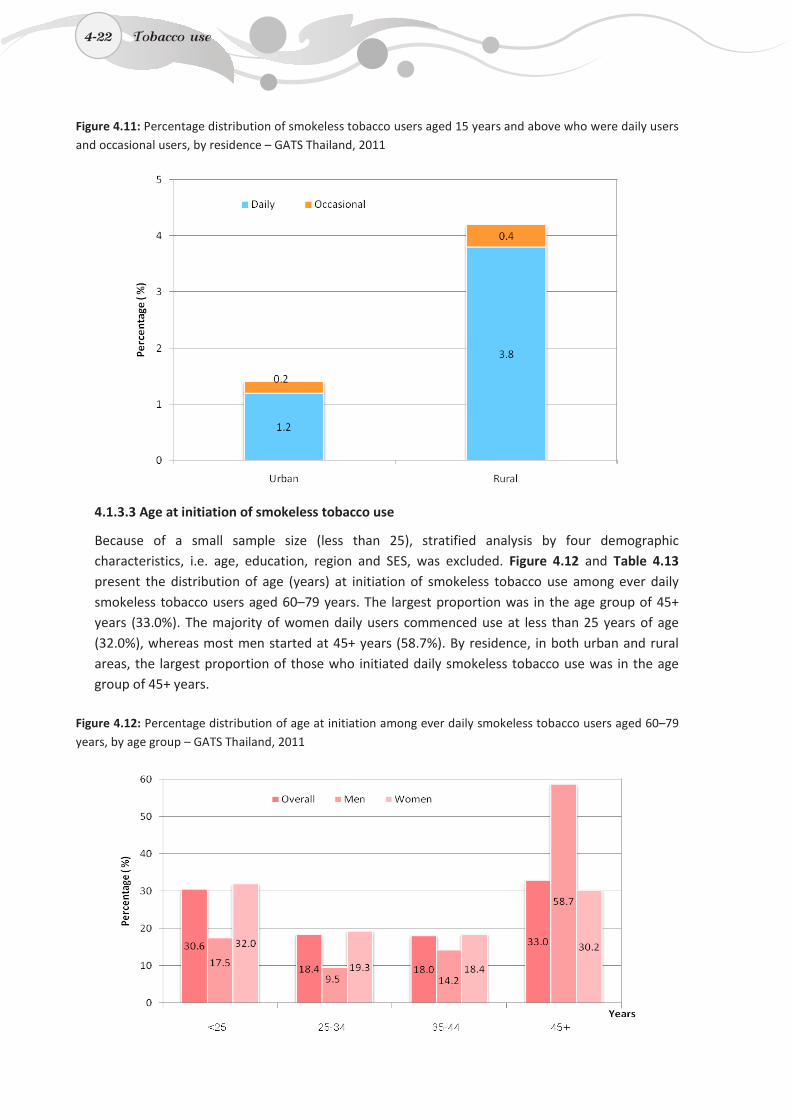
4-22
Figure 4.11: Percentage distribution of smokeless tobacco users aged 15 years and above who were daily users and occasional users, by residence – GATS Thailand, 2011
4.1.3.3 Age at initiation of smokeless tobacco use
Because of a small sample size (less than 25), stratified analysis by four demographic characteristics, i.e. age, education, region and SES, was excluded. Figure 4.12 and Table 4.13 present the distribution of age (years) at initiation of smokeless tobacco use among ever daily smokeless tobacco users aged 60–79 years. The largest proportion was in the age group of 45+ years (33.0%). The majority of women daily users commenced use at less than 25 years of age (32.0%), whereas most men started at 45+ years (58.7%). By residence, in both urban and rural areas, the largest proportion of those who initiated daily smokeless tobacco use was in the age group of 45+ years.
Figure 4.12: Percentage distribution of age at initiation among ever daily smokeless tobacco users aged 60–79 years, by age group – GATS Thailand, 2011
4-22 Tobacco use
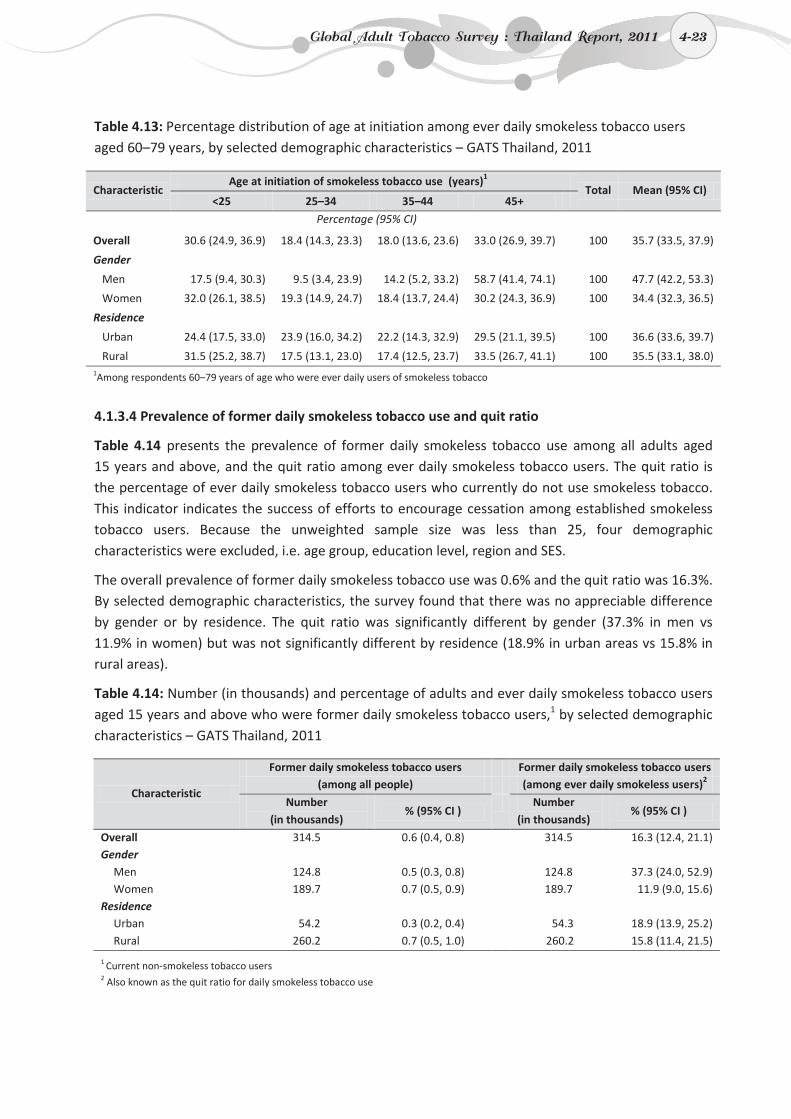
4-23
Table 4.13: Percentage distribution of age at initiation among ever daily smokeless tobacco users aged 60–79 years, by selected demographic characteristics – GATS Thailand, 2011
Characteristic Age at initiation of smokeless tobacco use (years)1
Total Mean (95% CI) <25 25–34 35–44 45+
Percentage (95% CI)
Overall 30.6 (24.9, 36.9) 18.4 (14.3, 23.3) 18.0 (13.6, 23.6) 33.0 (26.9, 39.7) 100 35.7 (33.5, 37.9)
Gender
Men 17.5 (9.4, 30.3) 9.5 (3.4, 23.9) 14.2 (5.2, 33.2) 58.7 (41.4, 74.1) 100 47.7 (42.2, 53.3)
Women 32.0 (26.1, 38.5) 19.3 (14.9, 24.7) 18.4 (13.7, 24.4) 30.2 (24.3, 36.9) 100 34.4 (32.3, 36.5)
Residence
Urban 24.4 (17.5, 33.0) 23.9 (16.0, 34.2) 22.2 (14.3, 32.9) 29.5 (21.1, 39.5) 100 36.6 (33.6, 39.7)
Rural 31.5 (25.2, 38.7) 17.5 (13.1, 23.0) 17.4 (12.5, 23.7) 33.5 (26.7, 41.1) 100 35.5 (33.1, 38.0) 1Among respondents 60–79 years of age who were ever daily users of smokeless tobacco
4.1.3.4 Prevalence of former daily smokeless tobacco use and quit ratio
Table 4.14 presents the prevalence of former daily smokeless tobacco use among all adults aged 15 years and above, and the quit ratio among ever daily smokeless tobacco users. The quit ratio is the percentage of ever daily smokeless tobacco users who currently do not use smokeless tobacco. This indicator indicates the success of efforts to encourage cessation among established smokeless tobacco users. Because the unweighted sample size was less than 25, four demographic characteristics were excluded, i.e. age group, education level, region and SES.
The overall prevalence of former daily smokeless tobacco use was 0.6% and the quit ratio was 16.3%. By selected demographic characteristics, the survey found that there was no appreciable difference by gender or by residence. The quit ratio was significantly different by gender (37.3% in men vs 11.9% in women) but was not significantly different by residence (18.9% in urban areas vs 15.8% in rural areas).
Table 4.14: Number (in thousands) and percentage of adults and ever daily smokeless tobacco users aged 15 years and above who were former daily smokeless tobacco users,1 by selected demographic characteristics – GATS Thailand, 2011
Characteristic
Former daily smokeless tobacco users Former daily smokeless tobacco users (among all people) (among ever daily smokeless users)2
Number (in thousands)
% (95% CI ) Number
(in thousands) % (95% CI )
Overall 314.5 0.6 (0.4, 0.8) 314.5 16.3 (12.4, 21.1) Gender
Men 124.8 0.5 (0.3, 0.8) 124.8 37.3 (24.0, 52.9) Women 189.7 0.7 (0.5, 0.9) 189.7 11.9 (9.0, 15.6)
Residence Urban 54.2 0.3 (0.2, 0.4) 54.3 18.9 (13.9, 25.2) Rural 260.2 0.7 (0.5, 1.0) 260.2 15.8 (11.4, 21.5)
1 Current non-smokeless tobacco users 2 Also known as the quit ratio for daily smokeless tobacco use
Global Adult Tobacco Survey : Thailand Report, 2011 4-23
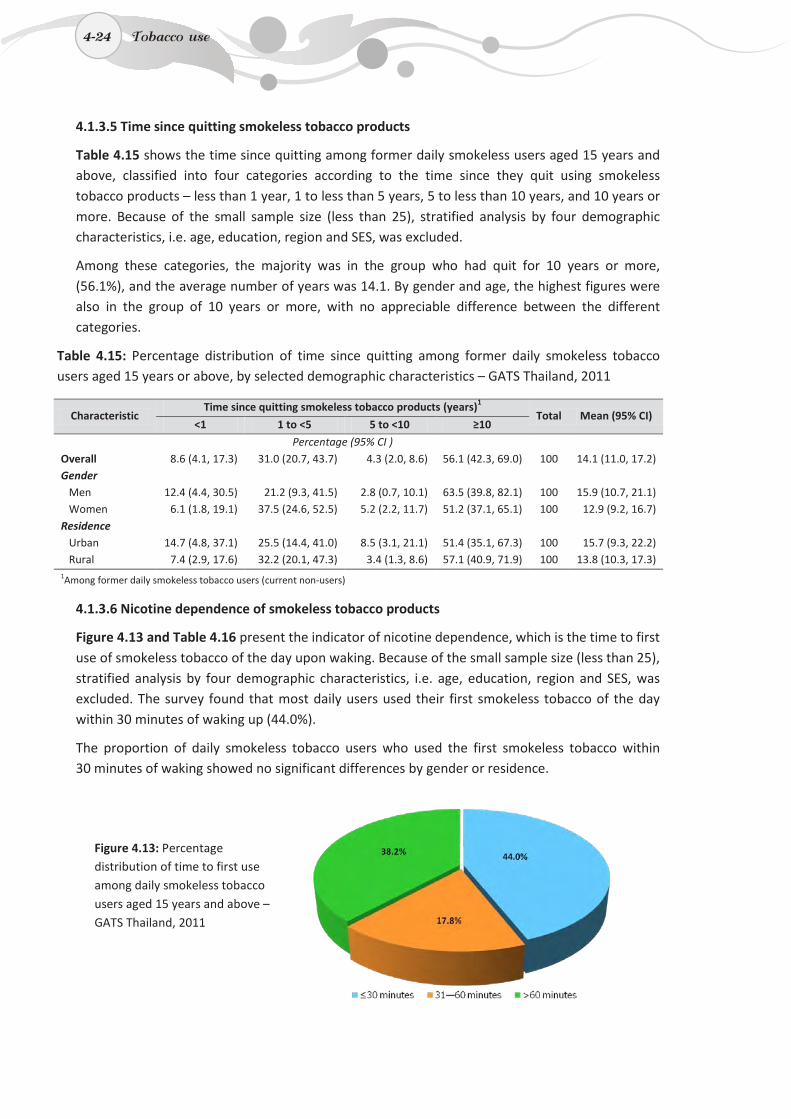
4-24
4.1.3.5 Time since quitting smokeless tobacco products
Table 4.15 shows the time since quitting among former daily smokeless users aged 15 years and above, classified into four categories according to the time since they quit using smokeless tobacco products – less than 1 year, 1 to less than 5 years, 5 to less than 10 years, and 10 years or more. Because of the small sample size (less than 25), stratified analysis by four demographic characteristics, i.e. age, education, region and SES, was excluded.
Among these categories, the majority was in the group who had quit for 10 years or more, (56.1%), and the average number of years was 14.1. By gender and age, the highest figures were also in the group of 10 years or more, with no appreciable difference between the different categories.
Table 4.15: Percentage distribution of time since quitting among former daily smokeless tobacco users aged 15 years or above, by selected demographic characteristics – GATS Thailand, 2011
Characteristic Time since quitting smokeless tobacco products (years)1
Total Mean (95% CI) <1 1 to <5 5 to <10 ≥10
Percentage (95% CI ) Overall 8.6 (4.1, 17.3) 31.0 (20.7, 43.7) 4.3 (2.0, 8.6) 56.1 (42.3, 69.0) 100 14.1 (11.0, 17.2) Gender
Men 12.4 (4.4, 30.5) 21.2 (9.3, 41.5) 2.8 (0.7, 10.1) 63.5 (39.8, 82.1) 100 15.9 (10.7, 21.1) Women 6.1 (1.8, 19.1) 37.5 (24.6, 52.5) 5.2 (2.2, 11.7) 51.2 (37.1, 65.1) 100 12.9 (9.2, 16.7)
Residence Urban 14.7 (4.8, 37.1) 25.5 (14.4, 41.0) 8.5 (3.1, 21.1) 51.4 (35.1, 67.3) 100 15.7 (9.3, 22.2) Rural 7.4 (2.9, 17.6) 32.2 (20.1, 47.3) 3.4 (1.3, 8.6) 57.1 (40.9, 71.9) 100 13.8 (10.3, 17.3)
1Among former daily smokeless tobacco users (current non-users)
4.1.3.6 Nicotine dependence of smokeless tobacco products
Figure 4.13 and Table 4.16 present the indicator of nicotine dependence, which is the time to first use of smokeless tobacco of the day upon waking. Because of the small sample size (less than 25), stratified analysis by four demographic characteristics, i.e. age, education, region and SES, was excluded. The survey found that most daily users used their first smokeless tobacco of the day within 30 minutes of waking up (44.0%).
The proportion of daily smokeless tobacco users who used the first smokeless tobacco within 30 minutes of waking showed no significant differences by gender or residence.
Figure 4.13: Percentage distribution of time to first use among daily smokeless tobacco users aged 15 years and above – GATS Thailand, 2011
4-24 Tobacco use
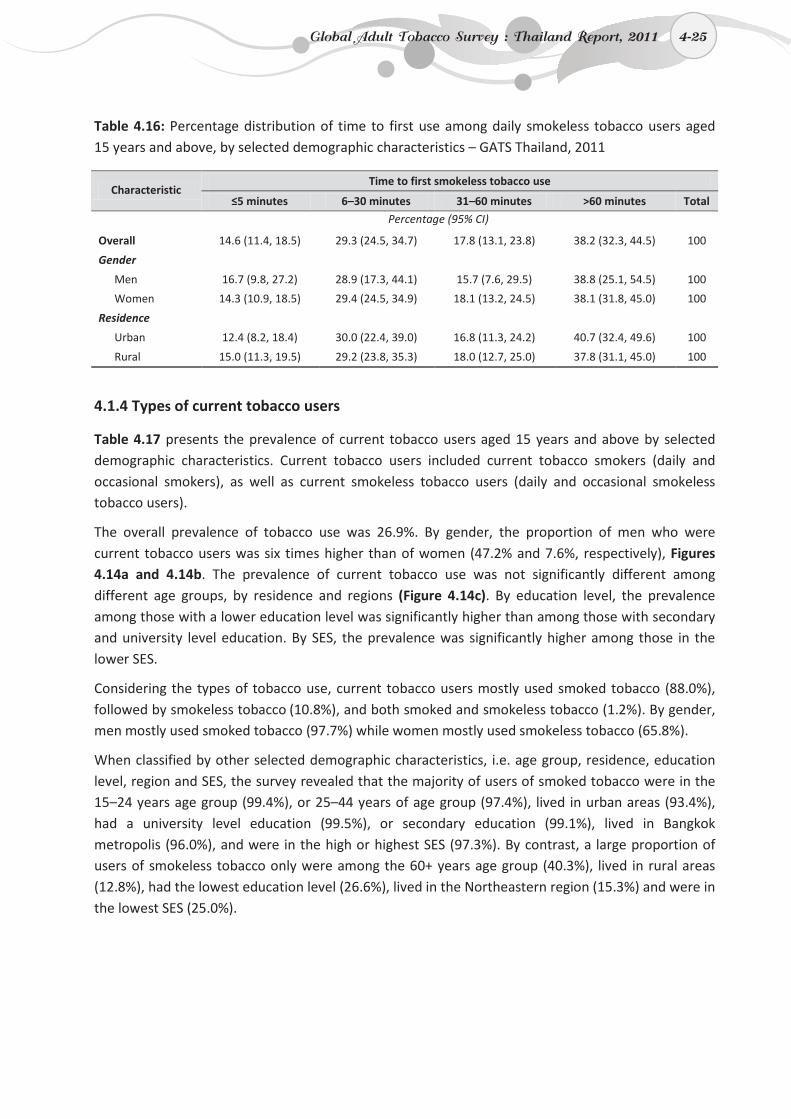
4-25
Table 4.16: Percentage distribution of time to first use among daily smokeless tobacco users aged 15 years and above, by selected demographic characteristics – GATS Thailand, 2011
Characteristic Time to first smokeless tobacco use
≤5 minutes 6–30 minutes 31–60 minutes >60 minutes Total
Percentage (95% CI)
Overall 14.6 (11.4, 18.5) 29.3 (24.5, 34.7) 17.8 (13.1, 23.8) 38.2 (32.3, 44.5) 100
Gender
Men 16.7 (9.8, 27.2) 28.9 (17.3, 44.1) 15.7 (7.6, 29.5) 38.8 (25.1, 54.5) 100
Women 14.3 (10.9, 18.5) 29.4 (24.5, 34.9) 18.1 (13.2, 24.5) 38.1 (31.8, 45.0) 100
Residence
Urban 12.4 (8.2, 18.4) 30.0 (22.4, 39.0) 16.8 (11.3, 24.2) 40.7 (32.4, 49.6) 100
Rural 15.0 (11.3, 19.5) 29.2 (23.8, 35.3) 18.0 (12.7, 25.0) 37.8 (31.1, 45.0) 100
4.1.4 Types of current tobacco users
Table 4.17 presents the prevalence of current tobacco users aged 15 years and above by selected demographic characteristics. Current tobacco users included current tobacco smokers (daily and occasional smokers), as well as current smokeless tobacco users (daily and occasional smokeless tobacco users).
The overall prevalence of tobacco use was 26.9%. By gender, the proportion of men who were current tobacco users was six times higher than of women (47.2% and 7.6%, respectively), Figures 4.14a and 4.14b. The prevalence of current tobacco use was not significantly different among different age groups, by residence and regions (Figure 4.14c). By education level, the prevalence among those with a lower education level was significantly higher than among those with secondary and university level education. By SES, the prevalence was significantly higher among those in the lower SES.
Considering the types of tobacco use, current tobacco users mostly used smoked tobacco (88.0%), followed by smokeless tobacco (10.8%), and both smoked and smokeless tobacco (1.2%). By gender, men mostly used smoked tobacco (97.7%) while women mostly used smokeless tobacco (65.8%).
When classified by other selected demographic characteristics, i.e. age group, residence, education level, region and SES, the survey revealed that the majority of users of smoked tobacco were in the 15–24 years age group (99.4%), or 25–44 years of age group (97.4%), lived in urban areas (93.4%), had a university level education (99.5%), or secondary education (99.1%), lived in Bangkok metropolis (96.0%), and were in the high or highest SES (97.3%). By contrast, a large proportion of users of smokeless tobacco only were among the 60+ years age group (40.3%), lived in rural areas (12.8%), had the lowest education level (26.6%), lived in the Northeastern region (15.3%) and were in the lowest SES (25.0%).
Global Adult Tobacco Survey : Thailand Report, 2011 4-25
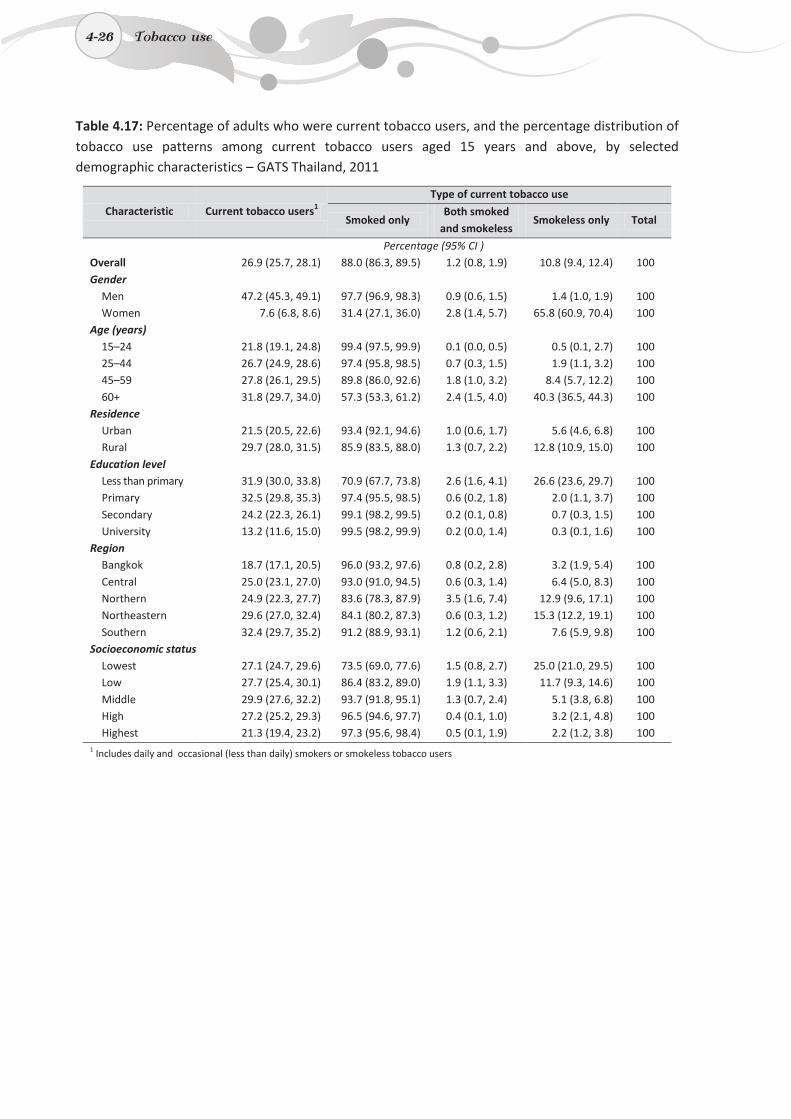
4-26
Table 4.17: Percentage of adults who were current tobacco users, and the percentage distribution of tobacco use patterns among current tobacco users aged 15 years and above, by selected demographic characteristics – GATS Thailand, 2011
Characteristic Current tobacco users1 Type of current tobacco use
Smoked only Both smoked
and smokeless Smokeless only Total
Percentage (95% CI ) Overall 26.9 (25.7, 28.1) 88.0 (86.3, 89.5) 1.2 (0.8, 1.9) 10.8 (9.4, 12.4) 100 Gender
Men 47.2 (45.3, 49.1) 97.7 (96.9, 98.3) 0.9 (0.6, 1.5) 1.4 (1.0, 1.9) 100 Women 7.6 (6.8, 8.6) 31.4 (27.1, 36.0) 2.8 (1.4, 5.7) 65.8 (60.9, 70.4) 100
Age (years) 15–24 21.8 (19.1, 24.8) 99.4 (97.5, 99.9) 0.1 (0.0, 0.5) 0.5 (0.1, 2.7) 100 25–44 26.7 (24.9, 28.6) 97.4 (95.8, 98.5) 0.7 (0.3, 1.5) 1.9 (1.1, 3.2) 100 45–59 27.8 (26.1, 29.5) 89.8 (86.0, 92.6) 1.8 (1.0, 3.2) 8.4 (5.7, 12.2) 100 60+ 31.8 (29.7, 34.0) 57.3 (53.3, 61.2) 2.4 (1.5, 4.0) 40.3 (36.5, 44.3) 100
Residence Urban 21.5 (20.5, 22.6) 93.4 (92.1, 94.6) 1.0 (0.6, 1.7) 5.6 (4.6, 6.8) 100 Rural 29.7 (28.0, 31.5) 85.9 (83.5, 88.0) 1.3 (0.7, 2.2) 12.8 (10.9, 15.0) 100
Education level Less than primary 31.9 (30.0, 33.8) 70.9 (67.7, 73.8) 2.6 (1.6, 4.1) 26.6 (23.6, 29.7) 100 Primary 32.5 (29.8, 35.3) 97.4 (95.5, 98.5) 0.6 (0.2, 1.8) 2.0 (1.1, 3.7) 100 Secondary 24.2 (22.3, 26.1) 99.1 (98.2, 99.5) 0.2 (0.1, 0.8) 0.7 (0.3, 1.5) 100 University 13.2 (11.6, 15.0) 99.5 (98.2, 99.9) 0.2 (0.0, 1.4) 0.3 (0.1, 1.6) 100
Region Bangkok 18.7 (17.1, 20.5) 96.0 (93.2, 97.6) 0.8 (0.2, 2.8) 3.2 (1.9, 5.4) 100 Central 25.0 (23.1, 27.0) 93.0 (91.0, 94.5) 0.6 (0.3, 1.4) 6.4 (5.0, 8.3) 100 Northern 24.9 (22.3, 27.7) 83.6 (78.3, 87.9) 3.5 (1.6, 7.4) 12.9 (9.6, 17.1) 100 Northeastern 29.6 (27.0, 32.4) 84.1 (80.2, 87.3) 0.6 (0.3, 1.2) 15.3 (12.2, 19.1) 100 Southern 32.4 (29.7, 35.2) 91.2 (88.9, 93.1) 1.2 (0.6, 2.1) 7.6 (5.9, 9.8) 100
Socioeconomic status Lowest 27.1 (24.7, 29.6) 73.5 (69.0, 77.6) 1.5 (0.8, 2.7) 25.0 (21.0, 29.5) 100 Low 27.7 (25.4, 30.1) 86.4 (83.2, 89.0) 1.9 (1.1, 3.3) 11.7 (9.3, 14.6) 100 Middle 29.9 (27.6, 32.2) 93.7 (91.8, 95.1) 1.3 (0.7, 2.4) 5.1 (3.8, 6.8) 100 High 27.2 (25.2, 29.3) 96.5 (94.6, 97.7) 0.4 (0.1, 1.0) 3.2 (2.1, 4.8) 100 Highest 21.3 (19.4, 23.2) 97.3 (95.6, 98.4) 0.5 (0.1, 1.9) 2.2 (1.2, 3.8) 100
1 Includes daily and occasional (less than daily) smokers or smokeless tobacco users
4-26 Tobacco use
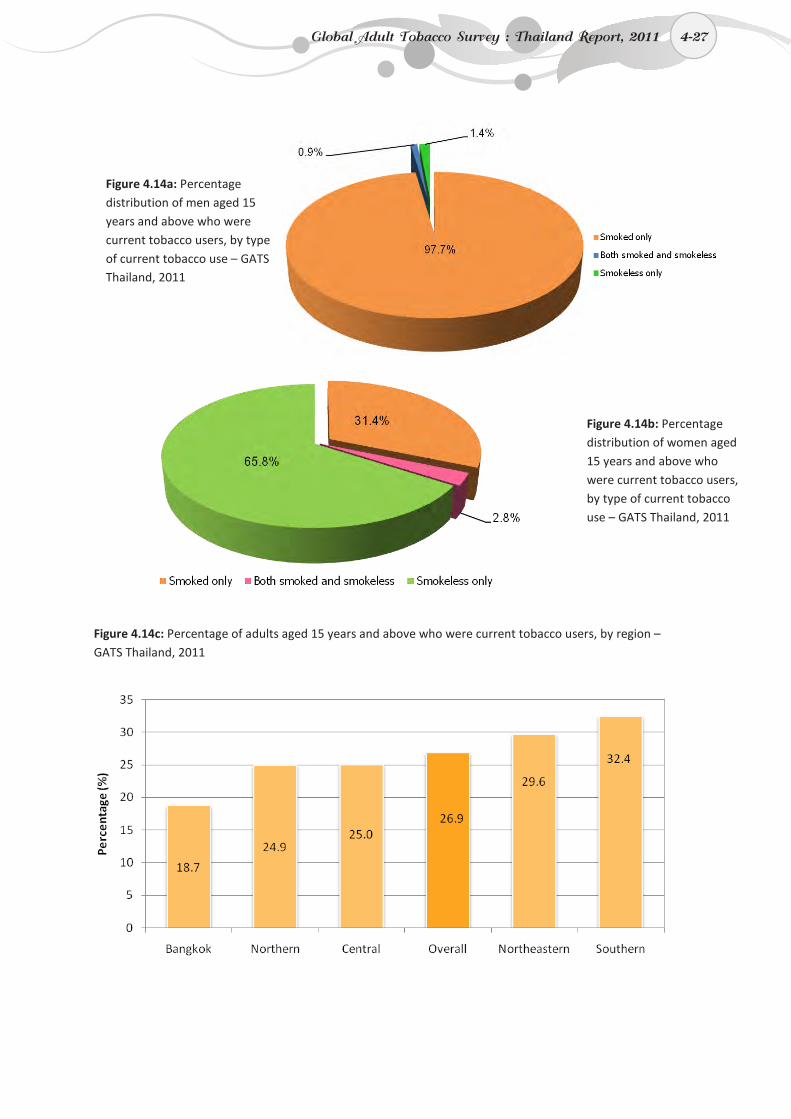
4-27
Figure 4.14c: Percentage of adults aged 15 years and above who were current tobacco users, by region – GATS Thailand, 2011
Figure 4.14a: Percentage distribution of men aged 15 years and above who were current tobacco users, by type of current tobacco use – GATS Thailand, 2011
Figure 4.14b: Percentage distribution of women aged 15 years and above who were current tobacco users, by type of current tobacco use – GATS Thailand, 2011
Global Adult Tobacco Survey : Thailand Report, 2011 4-27
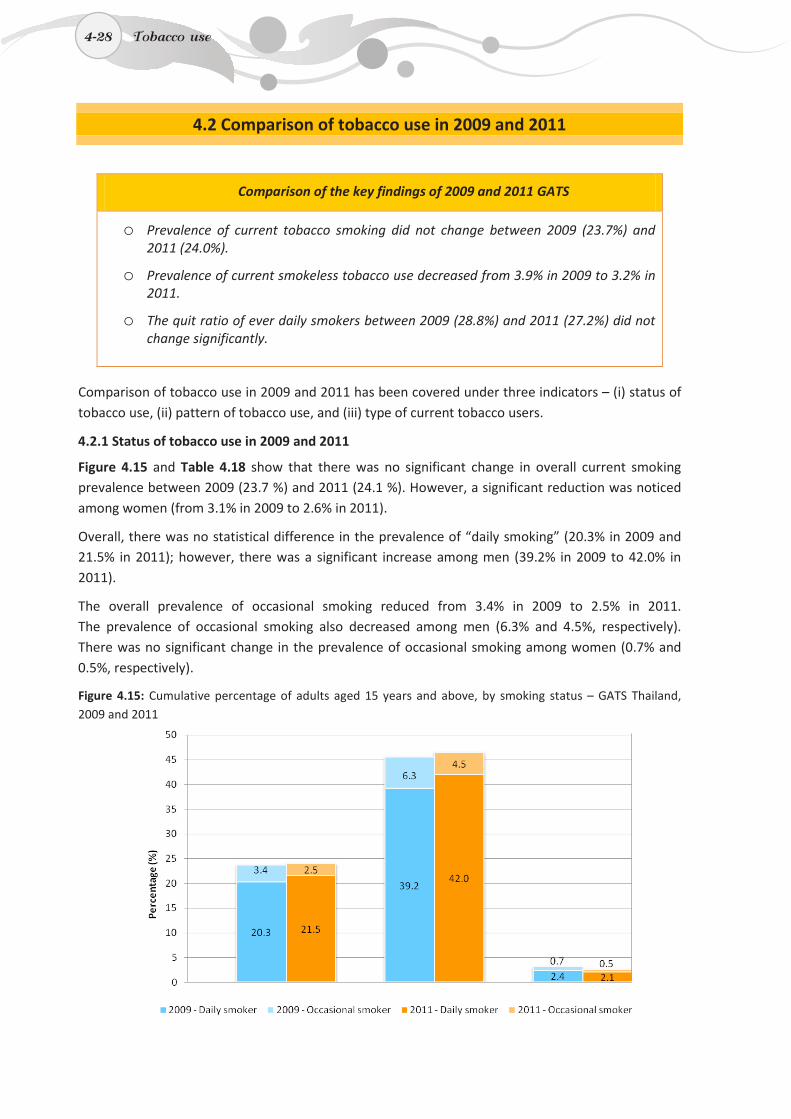
4-28
4.2 Comparison of tobacco use in 2009 and 2011
Comparison of the key findings of 2009 and 2011 GATS
o Prevalence of current tobacco smoking did not change between 2009 (23.7%) and 2011 (24.0%).
o Prevalence of current smokeless tobacco use decreased from 3.9% in 2009 to 3.2% in 2011.
o The quit ratio of ever daily smokers between 2009 (28.8%) and 2011 (27.2%) did not change significantly.
Comparison of tobacco use in 2009 and 2011 has been covered under three indicators – (i) status of tobacco use, (ii) pattern of tobacco use, and (iii) type of current tobacco users.
4.2.1 Status of tobacco use in 2009 and 2011
Figure 4.15 and Table 4.18 show that there was no significant change in overall current smoking prevalence between 2009 (23.7 %) and 2011 (24.1 %). However, a significant reduction was noticed among women (from 3.1% in 2009 to 2.6% in 2011).
Overall, there was no statistical difference in the prevalence of “daily smoking” (20.3% in 2009 and 21.5% in 2011); however, there was a significant increase among men (39.2% in 2009 to 42.0% in 2011).
The overall prevalence of occasional smoking reduced from 3.4% in 2009 to 2.5% in 2011. The prevalence of occasional smoking also decreased among men (6.3% and 4.5%, respectively). There was no significant change in the prevalence of occasional smoking among women (0.7% and 0.5%, respectively).
Figure 4.15: Cumulative percentage of adults aged 15 years and above, by smoking status – GATS Thailand, 2009 and 2011
4-28 Tobacco use
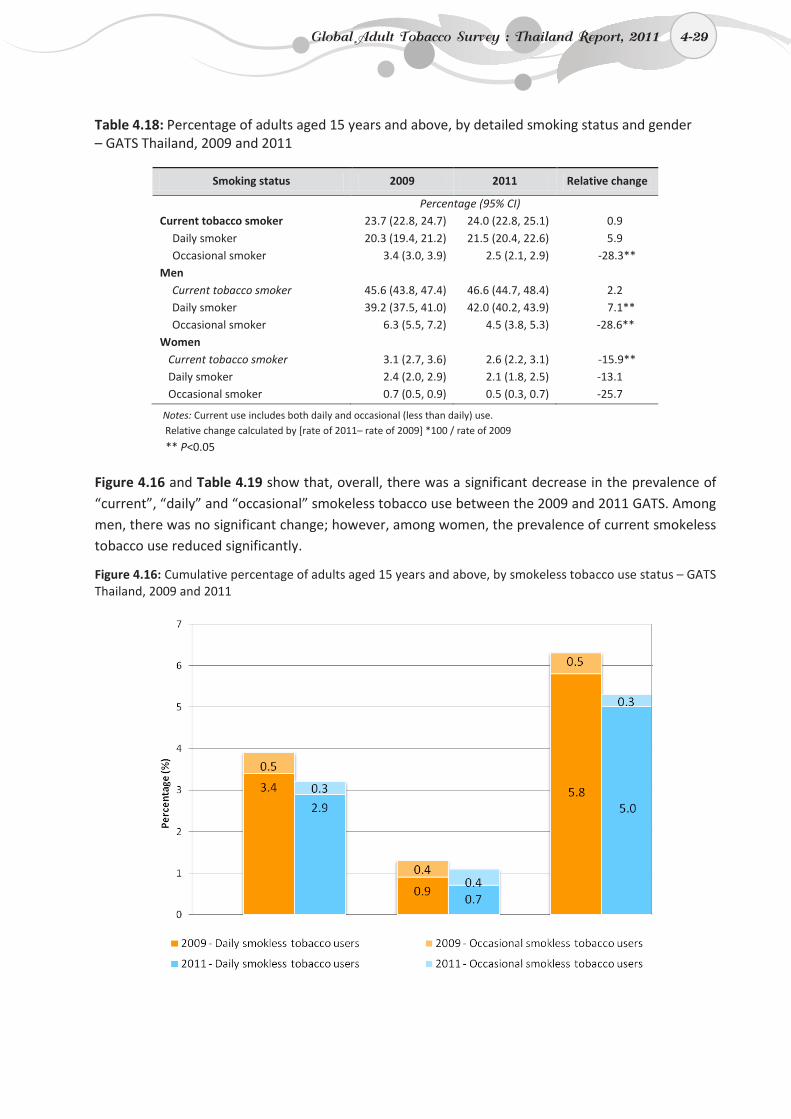
4-29
Table 4.18: Percentage of adults aged 15 years and above, by detailed smoking status and gender – GATS Thailand, 2009 and 2011
Smoking status 2009 2011 Relative change
Percentage (95% CI) Current tobacco smoker 23.7 (22.8, 24.7) 24.0 (22.8, 25.1) 0.9
Daily smoker 20.3 (19.4, 21.2) 21.5 (20.4, 22.6) 5.9 Occasional smoker 3.4 (3.0, 3.9) 2.5 (2.1, 2.9) -28.3**
Men Current tobacco smoker 45.6 (43.8, 47.4) 46.6 (44.7, 48.4) 2.2 Daily smoker 39.2 (37.5, 41.0) 42.0 (40.2, 43.9) 7.1** Occasional smoker 6.3 (5.5, 7.2) 4.5 (3.8, 5.3) -28.6**
Women Current tobacco smoker 3.1 (2.7, 3.6) 2.6 (2.2, 3.1) -15.9** Daily smoker 2.4 (2.0, 2.9) 2.1 (1.8, 2.5) -13.1 Occasional smoker 0.7 (0.5, 0.9) 0.5 (0.3, 0.7) -25.7
Notes: Current use includes both daily and occasional (less than daily) use. Relative change calculated by [rate of 2011– rate of 2009] *100 / rate of 2009
** P<0.05
Figure 4.16 and Table 4.19 show that, overall, there was a significant decrease in the prevalence of “current”, “daily” and “occasional” smokeless tobacco use between the 2009 and 2011 GATS. Among men, there was no significant change; however, among women, the prevalence of current smokeless tobacco use reduced significantly.
Figure 4.16: Cumulative percentage of adults aged 15 years and above, by smokeless tobacco use status – GATS Thailand, 2009 and 2011
Global Adult Tobacco Survey : Thailand Report, 2011 4-29
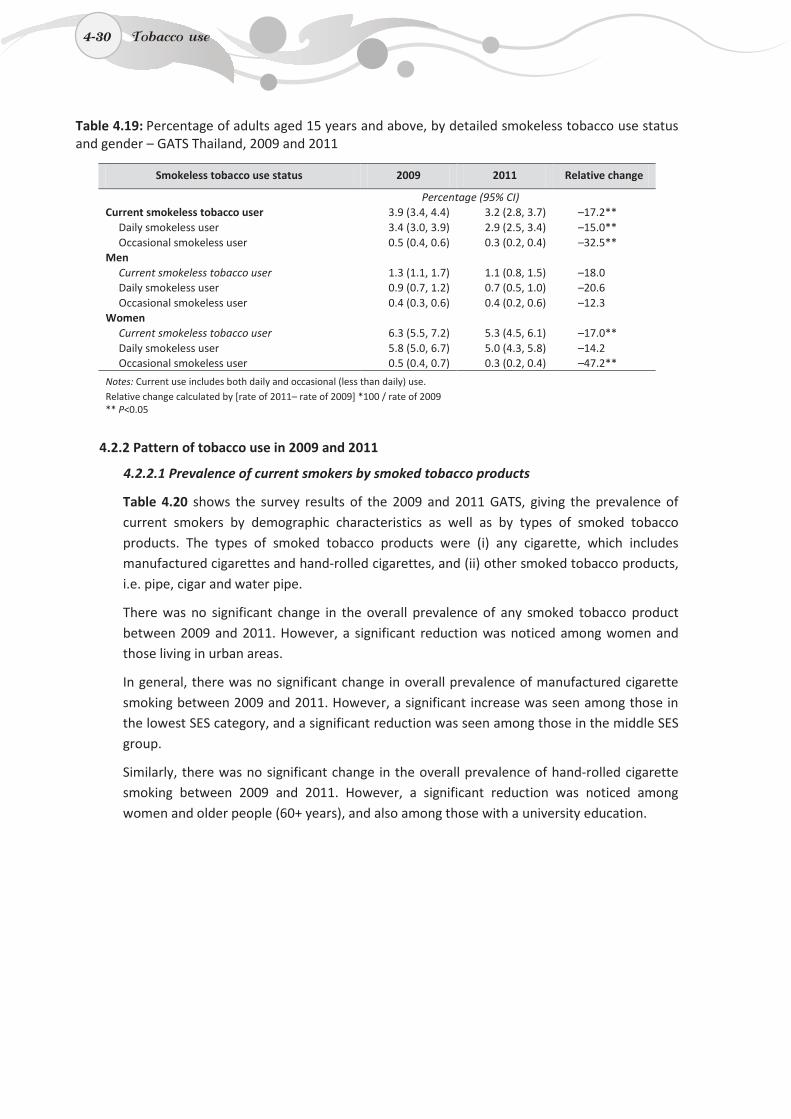
4-30
Table 4.19: Percentage of adults aged 15 years and above, by detailed smokeless tobacco use status and gender – GATS Thailand, 2009 and 2011
Smokeless tobacco use status 2009 2011 Relative change
Percentage (95% CI) Current smokeless tobacco user 3.9 (3.4, 4.4) 3.2 (2.8, 3.7) –17.2**
Daily smokeless user 3.4 (3.0, 3.9) 2.9 (2.5, 3.4) –15.0** Occasional smokeless user 0.5 (0.4, 0.6) 0.3 (0.2, 0.4) –32.5**
Men Current smokeless tobacco user 1.3 (1.1, 1.7) 1.1 (0.8, 1.5) –18.0 Daily smokeless user 0.9 (0.7, 1.2) 0.7 (0.5, 1.0) –20.6 Occasional smokeless user 0.4 (0.3, 0.6) 0.4 (0.2, 0.6) –12.3
Women Current smokeless tobacco user 6.3 (5.5, 7.2) 5.3 (4.5, 6.1) –17.0** Daily smokeless user 5.8 (5.0, 6.7) 5.0 (4.3, 5.8) –14.2 Occasional smokeless user 0.5 (0.4, 0.7) 0.3 (0.2, 0.4) –47.2**
Notes: Current use includes both daily and occasional (less than daily) use. Relative change calculated by [rate of 2011– rate of 2009] *100 / rate of 2009 ** P<0.05
4.2.2 Pattern of tobacco use in 2009 and 2011
4.2.2.1 Prevalence of current smokers by smoked tobacco products
Table 4.20 shows the survey results of the 2009 and 2011 GATS, giving the prevalence of current smokers by demographic characteristics as well as by types of smoked tobacco products. The types of smoked tobacco products were (i) any cigarette, which includes manufactured cigarettes and hand-rolled cigarettes, and (ii) other smoked tobacco products, i.e. pipe, cigar and water pipe.
There was no significant change in the overall prevalence of any smoked tobacco product between 2009 and 2011. However, a significant reduction was noticed among women and those living in urban areas.
In general, there was no significant change in overall prevalence of manufactured cigarette smoking between 2009 and 2011. However, a significant increase was seen among those in the lowest SES category, and a significant reduction was seen among those in the middle SES group.
Similarly, there was no significant change in the overall prevalence of hand-rolled cigarette smoking between 2009 and 2011. However, a significant reduction was noticed among women and older people (60+ years), and also among those with a university education.
4-30 Tobacco use
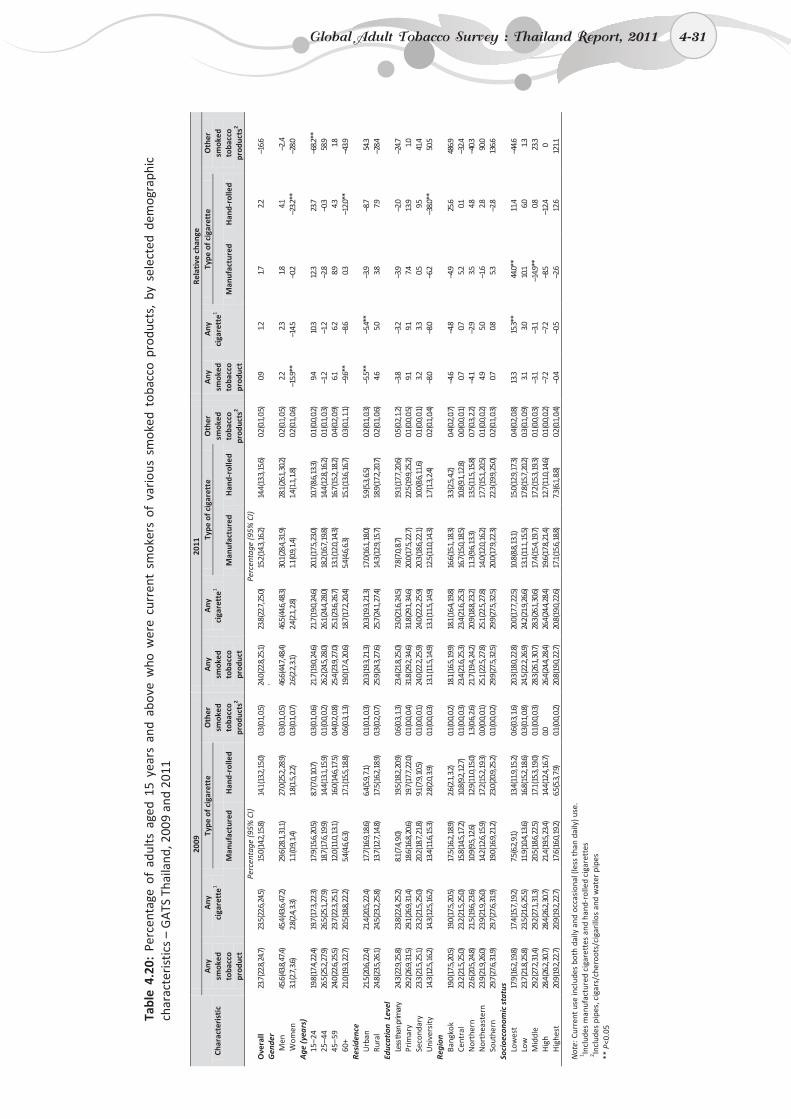
4-
31
Tabl
e 4.
20:
Perc
enta
ge o
f ad
ults
age
d 15
yea
rs a
nd a
bove
who
wer
e cu
rren
t sm
oker
s of
var
ious
sm
oked
tob
acco
pro
duct
s, b
y se
lect
ed d
emog
raph
ic
char
acte
rist
ics
– G
ATS
Tha
iland
, 200
9 an
d 20
11
Char
acte
rist
ic
2009
20
11
Rela
tive
cha
nge
Any
sm
oked
to
bacc
o pr
oduc
t
Any
ci
gare
tte1
Type
of c
igar
ette
O
ther
sm
oked
to
bacc
o pr
oduc
ts2
Any
sm
oked
to
bacc
o pr
oduc
t
Any
ci
gare
tte1
Type
of c
igar
ette
O
ther
sm
oked
to
bacc
o pr
oduc
ts2
Any
sm
oked
to
bacc
o pr
oduc
t
Any
ci
gare
tte1
Type
of c
igar
ette
O
ther
sm
oked
to
bacc
o pr
oduc
ts2
Man
ufac
ture
d H
and-
rolle
d M
anuf
actu
red
Han
d-ro
lled
Man
ufac
ture
d H
and-
rolle
d
Pe
rcen
tage
(95%
CI)
Perc
enta
ge (9
5% C
I)
Ove
rall
23.7
(22.8
, 24.7
) 23
.5 (2
2.6, 2
4.5)
15.0
(14.2
, 15.8
) 14
.1 (1
3.2, 1
5.0)
0.3 (0
.1, 0.
5)
24.0
(22.8
, 25.1
) 23
.8 (2
2.7, 2
5.0)
15.2
(14.3
, 16.2
) 14
.4 (1
3.3, 1
5.6)
0.2 (0
.1, 0.
5)
0.9
1.2
1.7
2.2
–16.6
G
ende
r
Men
45
.6 (4
3.8, 4
7.4)
45.4
(43.6
, 47.2
) 29
.6 (2
8.1, 3
1.1)
27.0
(25.2
, 28.9
) 0.3
(0.1,
0.5)
46
.6 (4
4.7, 4
8.4)
46.5
(44.6
, 48.3
) 30
.1 (2
8.4, 3
1.9)
28.1
(26.1
, 30.2
) 0.2
(0.1,
0.5)
2.2
2.3
1.8
4.1
–2
..4
Wom
en
3.1 (2
.7, 3.
6)
2.8 (2
.4, 3.
3)
1.1 (0
.9, 1.
4)
1.8 (1
.5, 2.
2)
0.3 (0
.1, 0.
7)
2.6 (2
.2, 3.
1)
2.4 (2
.1, 2.
8)
1.1 (0
.9, 1.
4)
1.4 (1
.1, 1.
8)
0.2 (0
.1, 0.
6)
–15.9
**
–14.5
–0
.2 –2
3.2**
–2
8.0
Age
(yea
rs)
15
–24
19.8
(17.4
, 22.4
) 19
.7 (1
7.3, 2
2.3)
17.9
(15.6
, 20.5
) 8.7
(7.0,
10.7)
0.3
(0.1,
0.6)
21
.7 (1
9.0, 2
4.6)
21.7
(19.0
, 24.6
) 20
.1 (1
7.5, 2
3.0)
10.7
(8.6,
13.3)
0.1
(0.0,
0.2)
9.4
10
.3 12
.3 23
.7 –6
8.2**
25
–44
26.5
(25.2
, 27.9
) 26
.5 (2
5.1, 2
7.9)
18.7
(17.6
, 19.9
) 14
.4 (1
3.1, 1
5.9)
0.1 (0
.0, 0.
2)
26.2
(24.5
, 28.0
) 26
.1 (2
4.4, 2
8.0)
18.2
(16.7
, 19.8
) 14
.4 (1
2.8, 1
6.2)
0.1 (0
.1, 0.
3)
–1.2
–1.2
–2.8
–0.3
58.9
45–5
9 24
.0 (2
2.6, 2
5.5)
23.7
(22.3
, 25.1
) 12
.0 (1
1.0, 1
3.1)
16.0
(14.6
, 17.5
) 0.4
(0.2,
0.8)
25
.4 (2
3.9, 2
7.0)
25.1
(23.6
, 26.7
) 13
.1 (1
2.0, 1
4.3)
16.7
(15.2
, 18.2
) 0.4
(0.2,
0.9)
6.1
6.2
8.9
4.3
1.8
60
+ 21
.0 (1
9.3, 2
2.7)
20.5
(18.8
, 22.2
) 5.4
(4.6,
6.3)
17
.1 (1
5.5, 1
8.8)
0.6 (0
.3, 1.
3)
19.0
(17.4
, 20.6
) 18
.7 (1
7.2, 2
0.4)
5.4 (4
.6, 6.
3)
15.1
(13.6
, 16.7
) 0.3
(0.1,
1.1)
–9
.6**
–8.6
0.3
–12.0
**
–43.9
Re
side
nce
U
rban
21
.5 (2
0.6, 2
2.4)
21.4
(20.5
, 22.4
) 17
.7 (1
6.9, 1
8.6)
6.4 (5
.9, 7.
1)
0.1 (0
.1, 0.
3)
20.3
(19.3
, 21.3
) 20
.3 (1
9.3, 2
1.3)
17.0
(16.1
, 18.0
) 5.9
(5.3,
6.5)
0.2
(0.1,
0.3)
–5
.5**
–5.4*
* –3
.9 –8
.7 54
.3 Ru
ral
24.8
(23.5
, 26.1
) 24
.5 (2
3.2, 2
5.8)
13.7
(12.7
, 14.8
) 17
.5 (1
6.2, 1
8.9)
0.3 (0
.2, 0.
7)
25.9
(24.3
, 27.6
) 25
.7 (2
4.1, 2
7.4)
14.3
(12.9
, 15.7
) 18
.9 (1
7.2, 2
0.7)
0.2 (0
.1, 0.
6)
4.6
5.0
3.8
7.9
–28.4
Ed
ucat
ion
Lev
el
L ess
than
prim
ary
24.3
(22.9
, 25.8
) 23
.8 (2
2.4, 2
5.2)
8.1 (7
.4, 9.
0)
19.5
(18.2
, 20.9
) 0.6
(0.3,
1.3)
23
.4 (2
1.8, 2
5.0)
23.0
(21.6
, 24.5
) 7.8
(7.0,
8.7)
19
.1 (1
7.7, 2
0.6)
0.5 (0
.2, 1.
2)
–3.8
–3.2
–3.9
–2.0
–24.7
Pr
imar
y 29
.2 (2
6.9, 3
1.5)
29.1
(26.9
, 31.4
) 18
.6 (1
6.8, 2
0.6)
19.7
(17.7
, 22.0
) 0.1
(0.0,
0.4)
31
.8 (2
9.2, 3
4.6)
31.8
(29.1
, 34.6
) 20
.0 (1
7.5, 2
2.7)
22.5
(19.9
, 25.2
) 0.1
(0.0,
0.5)
9.1
9.1
7.4
13
.9 1.0
Se
cond
ary
23.3
(21.5
, 25.1
) 23
.2 (2
1.5, 2
5.0)
20.2
(18.7
, 21.8
) 9.1
(7.9,
10.5)
0.1
(0.0,
0.1)
24
.0 (2
2.2, 2
5.9)
24.0
(22.2
, 25.9
) 20
.3 (1
8.6, 2
2.1)
10.0
(8.6,
11.6)
0.1
(0.0,
0.1)
3.2
3.3
0.5
9.5
41
.4 U
nive
rsity
14
.3 (1
2.5, 1
6.2)
14.3
(12.5
, 16.2
) 13
.4 (1
1.6, 1
5.3)
2.8 (2
.0, 3.
9)
0.1 (0
.0, 0.
3)
13.1
(11.5
, 14.9
) 13
.1 (1
1.5, 1
4.9)
12.5
(11.0
, 14.3
) 1.7
(1.3,
2.4)
0.2
(0.1,
0.4)
–8
.0 –8
.0 –6
.2 –3
8.0**
50
.5 Re
gion
Bang
kok
19.0
(17.5
, 20.5
) 19
.0 (1
7.5, 2
0.5)
17.5
(16.2
, 18.9
) 2.6
(2.1,
3.2)
0.1
(0.0,
0.2)
18
.1 (1
6.5, 1
9.9)
18.1
(16.4
, 19.8
) 16
.6 (1
5.1, 1
8.3)
3.3 (2
.5, 4.
2)
0.4 (0
.2, 0.
7)
–4.6
–4.8
–4.9
25.6
486.9
Ce
ntra
l 23
.2 (2
1.5, 2
5.0)
23.2
(21.5
, 25.0
) 15
.8 (1
4.5, 1
7.2)
10.8
(9.2,
12.7)
0.1
(0.0,
0.3)
23
.4 (2
1.6, 2
5.3)
23.4
(21.6
, 25.3
) 16
.7 (1
5.0, 1
8.5)
10.8
(9.1,
12.8)
0.0
(0.0,
0.1)
0.7
0.7
5.2
0.1
–3
2.4
Nor
ther
n 22
.6 (2
0.5, 2
4.8)
21.5
(19.6
, 23.6
) 10
.9 (9
.5, 12
.6)
12.9
(11.0
, 15.0
) 1.3
(0.6,
2.6)
21
.7 (1
9.4, 2
4.2)
20.9
(18.8
, 23.2
) 11
.3 (9
.6, 13
.3)
13.5
(11.5
, 15.8
) 0.7
(0.3,
2.2)
–4
.1 –2
.9 3.5
4.8
–4
0.3
Nor
thea
ster
n 23
.9 (2
1.9, 2
6.0)
23.9
(21.9
, 26.0
) 14
.2 (1
2.6, 1
5.9)
17.2
(15.2
, 19.3
) 0.0
(0.0,
0.1)
25
.1 (2
2.5, 2
7.8)
25.1
(22.5
, 27.8
) 14
.0 (1
2.0, 1
6.2)
17.7
(15.1
, 20.5
) 0.1
(0.0,
0.2)
4.9
5.0
–1
.6 2.8
90
.0 So
uthe
rn
29.7
(27.6
, 31.9
) 29
.7 (2
7.6, 3
1.9)
19.0
(16.9
, 21.2
) 23
.0 (2
0.9, 2
5.2)
0.1 (0
.0, 0.
2)
29.9
(27.5
, 32.5
) 29
.9 (2
7.5, 3
2.5)
20.0
(17.9
, 22.3
) 22
.3 (1
9.9, 2
5.0)
0.2 (0
.1, 0.
3)
0.7
0.8
5.3
–2.8
136.6
So
cioe
cono
mic
sta
tus
Low
est
17.9
(16.2
, 19.8
) 17
.4 (1
5.7, 1
9.2)
7.5 (6
.2, 9.
1)
13.4
(11.9
, 15.2
) 0.6
(0.3,
1.6)
20
.3 (1
8.0, 2
2.8)
20.0
(17.7
, 22.5
) 10
.8 (8
.8, 13
.1)
15.0
(12.9
, 17.3
) 0.4
(0.2,
0.8)
13
.3 15
.3**
44.0*
* 11
.4 –4
4.6
Low
23
.7 (2
1.8, 2
5.8)
23.5
(21.6
, 25.5
) 11
.9 (1
0.4, 1
3.6)
16.8
(15.2
, 18.6
) 0.3
(0.1,
0.8)
24
.5 (2
2.2, 2
6.9)
24.2
(21.9
, 26.6
) 13
.1 (1
1.1, 1
5.5)
1 7.8
(15.7
, 20.2
) 0.3
(0.1,
0.9)
3.1
3.0
10
.1 6.0
1.3
M
iddl
e 29
.2 (2
7.2, 3
1.4)
29.2
(27.1
, 31.3
) 20
.5 (1
8.6, 2
2.5)
17.1
(15.3
, 19.0
) 0.1
(0.0,
0.3)
28
.3 (2
6.1, 3
0.7)
28.3
(26.1
, 30.6
) 17
.4 (1
5.4, 1
9.7)
17.2
(15.3
, 19.3
) 0.1
(0.0,
0.3)
–3
.1 –3
.1 –1
4.9**
0.8
23
.3 H
igh
28.4
(26.2
, 30.7
) 28
.4 (2
6.2, 3
0.7)
21.4
(19.5
, 23.4
) 14
.4 (1
2.4, 1
6.7)
0.0
26.4
(24.4
, 28.4
) 26
.4 (2
4.4, 2
8.4)
19.6
(17.8
, 21.4
) 12
.7 (1
1.0, 1
4.6)
0.1 (0
.0, 0.
2)
–7.2
–7.2
–8.5
–12.4
0
Hig
hest
20
.9 (1
9.2, 2
2.7)
20.9
(19.2
, 22.7
) 17
.6 (1
6.0, 1
9.2)
6.5 (5
.3, 7.
9)
0.1 (0
.0, 0.
2)
20.8
(19.0
, 22.7
) 20
.8 (1
9.0, 2
2.6)
17.1
(15.6
, 18.8
) 7.3
(6.1,
8.8)
0.2
(0.1,
0.4)
–0
.4 –0
.5 –2
.6 12
.6 12
1.1
Not
e: C
urre
nt u
se in
clud
es b
oth
daily
and
occ
asio
nal (
less
than
dai
ly) u
se.
1In
clud
es m
anuf
actu
red
ciga
rett
es a
nd h
and-
rolle
d ci
gare
ttes
2
Incl
udes
pip
es, c
igar
s/ch
eroo
ts/c
igar
illos
and
wat
er p
ipes
**
P<0
.05
Global Adult Tobacco Survey : Thailand Report, 2011 4-31
4-32
4.2.2.3 Age at smoking initiation
Table 4.21 presents the age at smoking initiation of ever daily smokers aged 20–34 years in four groups – <15 years, 15–16 years, 17–19 years and 20+ years. Considering the four demographic characteristics, i.e. gender, residence, region and SES, there were some differences in the age at smoking initiation between 2009 and 2011, but these were not statistically significant.
It was observed that the age at initiation among the overall population during 2009 and 2011 was stable, with no significant statistical change in all age categories by any demographic characteristics with following exceptions:
1. In the age group of 17–19 years, there was a significant reduction among women, those in Bangkok region and those in the middle SES.
2. In the age group of 20+ years, there was a significant increase in urban areas and those in the lowest SES.
4.2.2.4 Prevalence of former daily smokers and quit ratio
Table 4.22 shows the percentage of former daily smokers among all adults (quit rate) and the percentage of former daily smokers among ever daily smokers (quit ratio). “Quit rate” is determined by the number of former daily smokers (current non-smokers) divided by all adults and “quit ratio” is determined by the number of former daily smokers (current non-smokers) divided by the number of ever daily smokers.
Between 2009 and 2011, there was no change in the overall prevalence of former daily smokers among all adults, and also by gender or residence. However, the percentage of former daily smokers decreased in the age groups of 15–24 and 24–44 years, those with university education, those living in Central region and those in the lowest SES.
Overall, by gender, the percentage of former daily smokers among every daily smokers did not change between 2009 and 2011. However, the percentage decreased in the age group of 15–24 years, in rural areas, those with primary education and those in the lowest SES.
4-32 Tobacco use
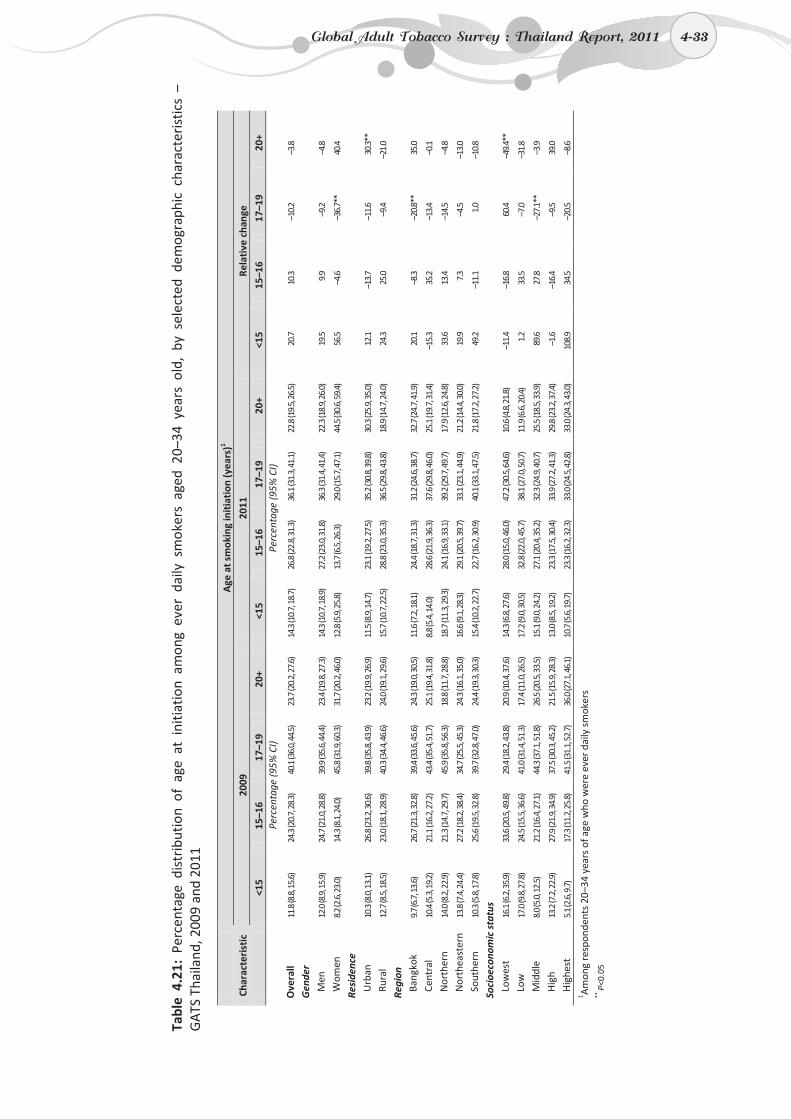
4-
33
Tabl
e 4.
21:
Perc
enta
ge d
istr
ibut
ion
of a
ge a
t in
itiat
ion
amon
g ev
er d
aily
sm
oker
s ag
ed 2
0–34
yea
rs o
ld,
by s
elec
ted
dem
ogra
phic
cha
ract
eris
tics
–
GA
TS T
haila
nd, 2
009
and
2011
A
ge a
t sm
okin
g in
itia
tion
(yea
rs)1
Char
acte
rist
ic
2009
20
11
Rela
tive
cha
nge
<1
5 15
–16
17–1
9 20
+ <1
5 15
–16
17–1
9 20
+ <1
5 15
–16
17–1
9 20
+
Pe
rcen
tage
(95%
CI)
Perc
enta
ge (9
5% C
I)
Ove
rall
11.8
(8.8
, 15.
6)
24.3
(20.
7, 28
.3)
40.1
(36.
0, 44
.5)
23.7
(20.
2, 27
.6)
14.3
(10.
7, 18
.7)
26.8
(22.
8, 31
.3)
36.1
(31.
3, 41
.1)
22.8
(19.
5, 26
.5)
20.7
10
.3
–10.
2 –3
.8
Gen
der
Men
12
.0 (8
.9, 1
5.9)
24
.7 (2
1.0,
28.8
) 39
.9 (3
5.6,
44.4
) 23
.4 (1
9.8,
27.3
) 14
.3 (1
0.7,
18.9
) 27
.2 (2
3.0,
31.8
) 36
.3 (3
1.4,
41.4
) 22
.3 (1
8.9,
26.0
) 19
.5
9.9
–9.2
–4
.8
Wom
en
8.2 (
2.6,
23.0
) 14
.3 (8
.1, 2
4.0)
45
.8 (3
1.9,
60.3
) 31
.7 (2
0.2,
46.0
) 12
.8 (5
.9, 2
5.8)
13
.7 (6
.5, 2
6.3)
29
.0 (1
5.7,
47.1
) 44
.5 (3
0.6,
59.4
) 56
.5
–4.6
–3
6.7*
* 40
.4
Resi
denc
e
Urb
an
10.3
(8.0
, 13.
1)
26.8
(23.
2, 30
.6)
39.8
(35.
8, 43
.9)
23.2
(19.
9, 26
.9)
11.5
(8.9
, 14.
7)
23.1
(19.
2, 27
.5)
35.2
(30.
8, 39
.8)
30.3
(25.
9, 35
.0)
12.1
–1
3.7
–11.
6 30
.3**
Rura
l 12
.7 (8
.5, 1
8.5)
23
.0 (1
8.1,
28.9
) 40
.3 (3
4.4,
46.6
) 24
.0 (1
9.1,
29.6
) 15
.7 (1
0.7,
22.5
) 28
.8 (2
3.0,
35.3
) 36
.5 (2
9.8,
43.8
) 18
.9 (1
4.7,
24.0
) 24
.3
25.0
–9
.4
–21.
0
Regi
on
Bang
kok
9.7 (
6.7,
13.6
) 26
.7 (2
1.3,
32.8
) 39
.4 (3
3.6,
45.6
) 24
.3 (1
9.0,
30.5
) 11
.6 (7
.2, 1
8.1)
24
.4 (1
8.7,
31.3
) 31
.2 (2
4.6,
38.7
) 32
.7 (2
4.7,
41.9
) 20
.1
–8.3
–2
0.8*
* 35
.0
Cent
ral
10.4
(5.3
, 19.
2)
21.1
(16.
2, 27
.2)
43.4
(35.
4, 51
.7)
25.1
(19.
4, 31
.8)
8.8 (
5.4,
14.0
) 28
.6 (2
1.9,
36.3
) 37
.6 (2
9.8,
46.0
) 25
.1 (1
9.7,
31.4
) –1
5.3
35.2
–1
3.4
–0.1
Nor
ther
n 14
.0 (8
.2, 2
2.9)
21
.3 (1
4.7,
29.7
) 45
.9 (3
5.8,
56.3
) 18
.8 (1
1.7,
28.8
) 18
.7 (1
1.3,
29.3
) 24
.1 (1
6.9,
33.1
) 39
.2 (2
9.7,
49.7
) 17
.9 (1
2.6,
24.8
) 33
.6
13.4
–1
4.5
–4.8
Nor
thea
ster
n 13
.8 (7
.4, 2
4.4)
27
.2 (1
8.2,
38.4
) 34
.7 (2
5.5,
45.3
) 24
.3 (1
6.1,
35.0
) 16
.6 (9
.1, 2
8.3)
29
.1 (2
0.5,
39.7
) 33
.1 (2
3.1,
44.9
) 21
.2 (1
4.4,
30.0
) 19
.9
7.3
–4.5
–1
3.0
Sout
hern
10
.3 (5
.8, 1
7.8)
25
.6 (1
9.5,
32.8
) 39
.7 (3
2.8,
47.0
) 24
.4 (1
9.3,
30.3
) 15
.4 (1
0.2,
22.7
) 22
.7 (1
6.2,
30.9
) 40
.1 (3
3.1,
47.5
) 21
.8 (1
7.2,
27.2
) 49
.2
–11.
1 1.
0 –1
0.8
Soci
oeco
nom
ic s
tatu
s
Low
est
16.1
(6.2
, 35.
9)
33.6
(20.
5, 49
.8)
29.4
(18.
2, 43
.8)
20.9
(10.
4, 37
.6)
14.3
(6.8
, 27.
6)
28.0
(15.
0, 46
.0)
47.2
(30.
5, 64
.6)
10.6
(4.8
, 21.
8)
–11.
4 –1
6.8
60.4
–4
9.4*
*
Low
17
.0 (9
.8, 2
7.8)
24
.5 (1
5.5,
36.6
) 41
.0 (3
1.4,
51.3
) 17
.4 (1
1.0,
26.5
) 17
.2 (9
.0, 3
0.5)
32
.8 (2
2.0,
45.7
) 38
.1 (2
7.0,
50.7
) 11
.9 (6
.6, 2
0.4)
1.
2 33
.5
–7.0
–3
1.8
Mid
dle
8.0 (
5.0,
12.5
) 21
.2 (1
6.4,
27.1
) 44
.3 (3
7.1,
51.8
) 26
.5 (2
0.5,
33.5
) 15
.1 (9
.0, 2
4.2)
27
.1 (2
0.4,
35.2
) 32
.3 (2
4.9,
40.7
) 25
.5 (1
8.5,
33.9
) 89
.6
27.8
–2
7.1*
* –3
.9
Hig
h 13
.2 (7
.2, 2
2.9)
27
.9 (2
1.9,
34.9
) 37
.5 (3
0.3,
45.2
) 21
.5 (1
5.9,
28.3
) 13
.0 (8
.5, 1
9.2)
23
.3 (1
7.5,
30.4
) 33
.9 (2
7.2,
41.3
) 29
.8 (2
3.2,
37.4
) –1
.6
–16.
4 –9
.5
39.0
Hig
hest
5.
1 (2.
6, 9.
7)
17.3
(11.
2, 25
.8)
41.5
(31.
1, 52
.7)
36.0
(27.
1, 46
.1)
10.7
(5.6
, 19.
7)
23.3
(16.
2, 32
.3)
33.0
(24.
5, 42
.8)
33.0
(24.
3, 43
.0)
108.
9 34
.5
–20.
5 –8
.6
1 Am
ong
resp
onde
nts
20–3
4 ye
ars
of a
ge w
ho w
ere
ever
dai
ly s
mok
ers
** P<
0.05
Global Adult Tobacco Survey : Thailand Report, 2011 4-33
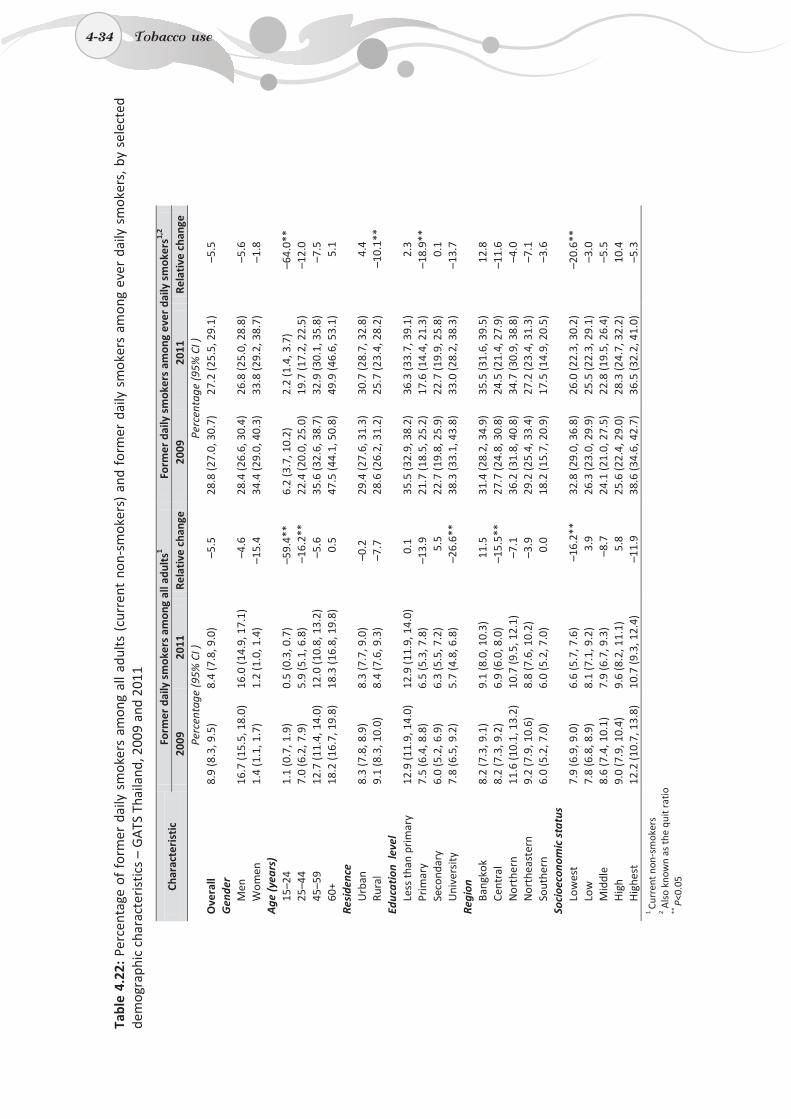
4-34
Ta
ble
4.22
: Pe
rcen
tage
of
form
er d
aily
sm
oker
s am
ong
all a
dults
(cu
rren
t no
n-sm
oker
s) a
nd f
orm
er d
aily
sm
oker
s am
ong
ever
dai
ly s
mok
ers,
by
sele
cted
de
mog
raph
ic c
hara
cter
istic
s –
GA
TS T
haila
nd, 2
009
and
2011
Char
acte
rist
ic
Form
er d
aily
sm
oker
s am
ong
all a
dult
s1
Form
er d
aily
sm
oker
s am
ong
ever
dai
ly s
mok
ers1,
2 20
09
2011
Re
lati
ve c
hang
e
2009
20
11
Rela
tive
cha
nge
Perc
enta
ge (9
5% C
I )
P
erce
ntag
e (9
5% C
I )
Ove
rall
8.9
(8.3
, 9.5
) 8.
4 (7
.8, 9
.0)
–5.
5 28
.8 (2
7.0,
30.
7)
27.2
(25.
5, 2
9.1)
–5
.5
Gen
der
Men
16
.7 (1
5.5,
18.
0)
16.0
(14.
9, 1
7.1)
–
4.6
28.4
(26.
6, 3
0.4)
26
.8 (2
5.0,
28.
8)
–5.6
W
omen
1.
4 (1
.1, 1
.7)
1.2
(1.0
, 1.4
) –1
5.4
34.4
(29.
0, 4
0.3)
33
.8 (2
9.2,
38.
7)
–1.8
A
ge (y
ears
)
15
–24
1.1
(0.7
, 1.9
) 0.
5 (0
.3, 0
.7)
–
59.4
**
6.2
(3.7
, 10.
2)
2.2
(1.4
, 3.7
)
–64
.0**
25
–44
7.0
(6.2
, 7.9
) 5.
9 (5
.1, 6
.8)
–
16.2
**
22.4
(20.
0, 2
5.0)
19
.7 (1
7.2,
22.
5)
–12.
0 45
–59
12.7
(11.
4, 1
4.0)
12
.0 (1
0.8,
13.
2)
–5.
6 35
.6 (3
2.6,
38.
7)
32.9
(30.
1, 3
5.8)
–
7.5
60+
18.2
(16.
7, 1
9.8)
18
.3 (1
6.8,
19.
8)
0
.5
47.5
(44.
1, 5
0.8)
49
.9 (4
6.6,
53.
1)
5.1
Resi
denc
e
U
rban
8.
3 (7
.8, 8
.9)
8.3
(7.7
, 9.0
) –0
.2
29.4
(27.
6, 3
1.3)
30
.7 (2
8.7,
32.
8)
4.4
Rura
l 9.
1 (8
.3, 1
0.0)
8.
4 (7
.6, 9
.3)
–7.7
28
.6 (2
6.2,
31.
2)
25.7
(23.
4, 2
8.2)
–10.
1**
Educ
atio
n le
vel
Le
ss th
an p
rim
ary
12.9
(11.
9, 1
4.0)
12
.9 (1
1.9,
14.
0)
0.
1 35
.5 (3
2.9,
38.
2)
36.3
(33.
7, 3
9.1)
2.
3 Pr
imar
y 7.
5 (6
.4, 8
.8)
6.5
(5.3
, 7.8
) –1
3.9
21.7
(18.
5, 2
5.2)
17
.6 (1
4.4,
21.
3)
–
18.9
**
Seco
ndar
y 6.
0 (5
.2, 6
.9)
6.3
(5.5
, 7.2
)
5.5
22
.7 (1
9.8,
25.
9)
22.7
(19.
9, 2
5.8)
0.
1 U
nive
rsity
7.
8 (6
.5, 9
.2)
5.7
(4.8
, 6.8
)
–26
.6**
38
.3 (3
3.1,
43.
8)
33.0
(28.
2, 3
8.3)
–1
3.7
Regi
on
Bang
kok
8.2
(7.3
, 9.1
) 9.
1 (8
.0, 1
0.3)
1
1.5
31.4
(28.
2, 3
4.9)
35
.5 (3
1.6,
39.
5)
12.8
Ce
ntra
l 8.
2 (7
.3, 9
.2)
6.9
(6.0
, 8.0
)
–15
.5**
27
.7 (2
4.8,
30.
8)
24.5
(21.
4, 2
7.9)
–1
1.6
Nor
ther
n 11
.6 (1
0.1,
13.
2)
10.7
(9.5
, 12.
1)
–7.
1 36
.2 (3
1.8,
40.
8)
34.7
(30.
9, 3
8.8)
–4
.0
Nor
thea
ster
n 9.
2 (7
.9, 1
0.6)
8.
8 (7
.6, 1
0.2)
–
3.9
29.2
(25.
4, 3
3.4)
27
.2 (2
3.4,
31.
3)
–7.1
So
uthe
rn
6.0
(5.2
, 7.0
) 6.
0 (5
.2, 7
.0)
0
.0
18.2
(15.
7, 2
0.9)
17
.5 (1
4.9,
20.
5)
–3.6
So
cioe
cono
mic
sta
tus
Lo
wes
t 7.
9 (6
.9, 9
.0)
6.6
(5.7
, 7.6
)
–1
6.2*
* 32
.8 (2
9.0,
36.
8)
26.0
(22.
3, 3
0.2)
–20
.6**
Lo
w
7.8
(6.8
, 8.9
) 8.
1 (7
.1, 9
.2)
3
.9
26.3
(23.
0, 2
9.9)
25
.5 (2
2.3,
29.
1)
–3.0
M
iddl
e 8.
6 (7
.4, 1
0.1)
7.
9 (6
.7, 9
.3)
–8
.7
24.1
(21.
0, 2
7.5)
22
.8 (1
9.5,
26.
4)
–5.5
H
igh
9.0
(7.9
, 10.
4)
9.6
(8.2
, 11.
1)
5
.8
25.6
(22.
4, 2
9.0)
28
.3 (2
4.7,
32.
2)
10.4
H
ighe
st
12.2
(10.
7, 1
3.8)
10
.7 (9
.3, 1
2.4)
–
11.9
38
.6 (3
4.6,
42.
7)
36.5
(32.
2, 4
1.0)
–5
.3
1 Cu
rren
t non
-sm
oker
s
2 A
lso
know
n as
the
quit
ratio
**
P<0.
05
4-34 Tobacco use

5. Cessation
5-1
5. Cessation
This chapter provides the findings of cessation in two main sections. The first section describes the findings in the 2011 GATS, and the second section compares the key findings of the 2009 GATS with the 2011 GATS.
Key findings in 2011
o Smoked tobacco products
• 54.0% of current smokers planned to or were thinking about quitting.
• 36.7% of current smokers and recent quitters (<12 months) made a quit attempt in the past 12 months.
• 65.3% of smokers were asked if they smoked tobacco by health-care providers (HCPs) in the past 12 months.
• 55.8% of smokers received advice to quit smoking by HCPs in the past 12 months.
• “Quitting on your own” was the most common cessation method reported (90.7%) by smokers in the past 12 months.
o Smokeless tobacco products
• 22.2% of current smokeless tobacco users planned to or were thinking about quitting.
• 16.4% of current smokeless tobacco users and recent quitters (<12 months) made a quit attempt in the past 12 months.
• 25.1% of smokeless tobacco users were asked if they used smokeless tobacco by HCPs in the past 12 months.
• 16.3% of smokeless tobacco users received advice to quit such use by HCPs in the past 12 months.
• “Quitting on your own” was the most common cessation method reported (79.5%) by smokeless tobacco users in the past 12 months.
The findings of the 2011 GATS present various aspects of tobacco use cessation among Thai adults who were current or former users of both smoked and smokeless tobacco products. These cover interest in quitting tobacco use, quit attempts of smokers and smokeless tobacco users, receiving cessation advice from health-care providers (HCPs), cessation methods used and duration of abstinence from tobacco use during the last quit attempt.
5.1 Cessation in 2011
5.1.1 Interest in quitting tobacco use
Interest in quitting smoking among current smokers is defined as planning to quit or thinking about quitting smoking within the next month, 12 months, or some day. Figure 5.1 and Table 5.1 present five categories of “interest in quitting smoking”, which include “planning to quit within the next month”, “thinking about quitting within the next 12 months”, “will quit some day, but not in the next 12 months”, “not interested in quitting” and “don’t know”.
Global Adult Tobacco Survey : Thailand Report, 2011 5-1
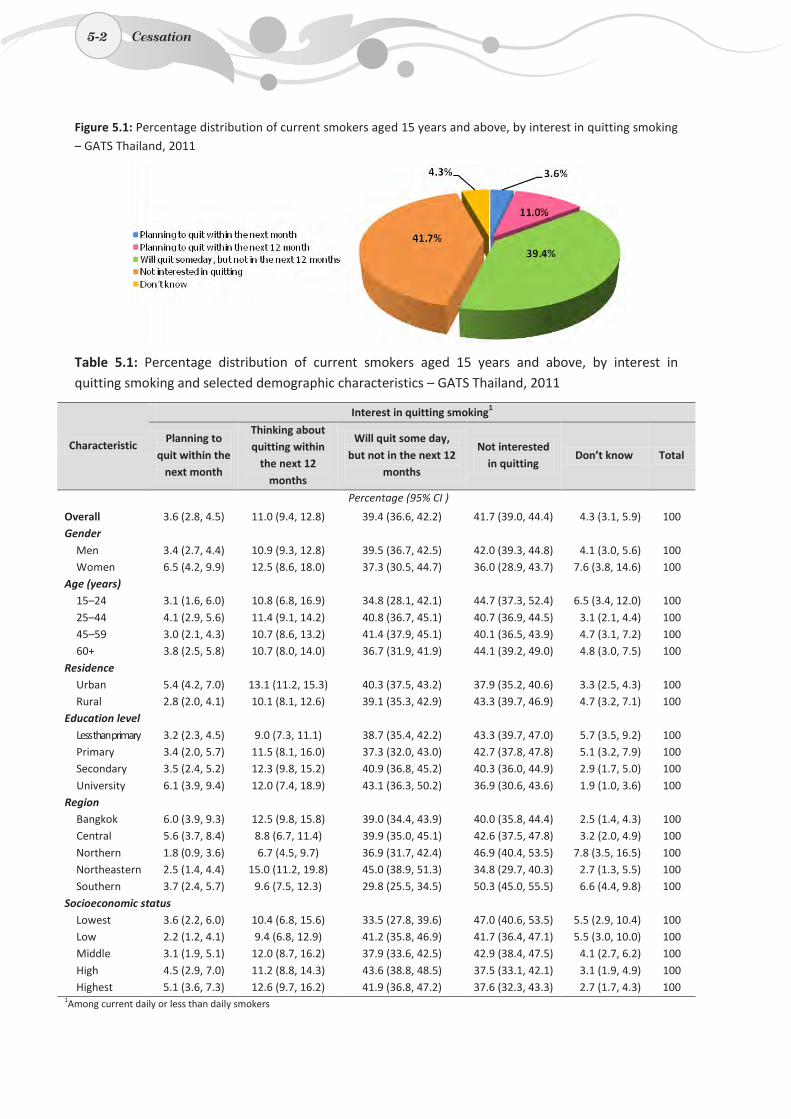
5-2
Figure 5.1: Percentage distribution of current smokers aged 15 years and above, by interest in quitting smoking – GATS Thailand, 2011
Table 5.1: Percentage distribution of current smokers aged 15 years and above, by interest in quitting smoking and selected demographic characteristics – GATS Thailand, 2011
Characteristic
Interest in quitting smoking1
Planning to quit within the
next month
Thinking about quitting within
the next 12 months
Will quit some day, but not in the next 12
months
Not interested in quitting
Don’t know Total
Percentage (95% CI )
Overall 3.6 (2.8, 4.5) 11.0 (9.4, 12.8) 39.4 (36.6, 42.2) 41.7 (39.0, 44.4) 4.3 (3.1, 5.9) 100 Gender
Men 3.4 (2.7, 4.4) 10.9 (9.3, 12.8) 39.5 (36.7, 42.5) 42.0 (39.3, 44.8) 4.1 (3.0, 5.6) 100 Women 6.5 (4.2, 9.9) 12.5 (8.6, 18.0) 37.3 (30.5, 44.7) 36.0 (28.9, 43.7) 7.6 (3.8, 14.6) 100
Age (years) 15–24 3.1 (1.6, 6.0) 10.8 (6.8, 16.9) 34.8 (28.1, 42.1) 44.7 (37.3, 52.4) 6.5 (3.4, 12.0) 100 25–44 4.1 (2.9, 5.6) 11.4 (9.1, 14.2) 40.8 (36.7, 45.1) 40.7 (36.9, 44.5) 3.1 (2.1, 4.4) 100 45–59 3.0 (2.1, 4.3) 10.7 (8.6, 13.2) 41.4 (37.9, 45.1) 40.1 (36.5, 43.9) 4.7 (3.1, 7.2) 100 60+ 3.8 (2.5, 5.8) 10.7 (8.0, 14.0) 36.7 (31.9, 41.9) 44.1 (39.2, 49.0) 4.8 (3.0, 7.5) 100
Residence Urban 5.4 (4.2, 7.0) 13.1 (11.2, 15.3) 40.3 (37.5, 43.2) 37.9 (35.2, 40.6) 3.3 (2.5, 4.3) 100 Rural 2.8 (2.0, 4.1) 10.1 (8.1, 12.6) 39.1 (35.3, 42.9) 43.3 (39.7, 46.9) 4.7 (3.2, 7.1) 100
Education level Less than primary 3.2 (2.3, 4.5) 9.0 (7.3, 11.1) 38.7 (35.4, 42.2) 43.3 (39.7, 47.0) 5.7 (3.5, 9.2) 100 Primary 3.4 (2.0, 5.7) 11.5 (8.1, 16.0) 37.3 (32.0, 43.0) 42.7 (37.8, 47.8) 5.1 (3.2, 7.9) 100 Secondary 3.5 (2.4, 5.2) 12.3 (9.8, 15.2) 40.9 (36.8, 45.2) 40.3 (36.0, 44.9) 2.9 (1.7, 5.0) 100 University 6.1 (3.9, 9.4) 12.0 (7.4, 18.9) 43.1 (36.3, 50.2) 36.9 (30.6, 43.6) 1.9 (1.0, 3.6) 100
Region Bangkok 6.0 (3.9, 9.3) 12.5 (9.8, 15.8) 39.0 (34.4, 43.9) 40.0 (35.8, 44.4) 2.5 (1.4, 4.3) 100 Central 5.6 (3.7, 8.4) 8.8 (6.7, 11.4) 39.9 (35.0, 45.1) 42.6 (37.5, 47.8) 3.2 (2.0, 4.9) 100 Northern 1.8 (0.9, 3.6) 6.7 (4.5, 9.7) 36.9 (31.7, 42.4) 46.9 (40.4, 53.5) 7.8 (3.5, 16.5) 100 Northeastern 2.5 (1.4, 4.4) 15.0 (11.2, 19.8) 45.0 (38.9, 51.3) 34.8 (29.7, 40.3) 2.7 (1.3, 5.5) 100 Southern 3.7 (2.4, 5.7) 9.6 (7.5, 12.3) 29.8 (25.5, 34.5) 50.3 (45.0, 55.5) 6.6 (4.4, 9.8) 100
Socioeconomic status Lowest 3.6 (2.2, 6.0) 10.4 (6.8, 15.6) 33.5 (27.8, 39.6) 47.0 (40.6, 53.5) 5.5 (2.9, 10.4) 100 Low 2.2 (1.2, 4.1) 9.4 (6.8, 12.9) 41.2 (35.8, 46.9) 41.7 (36.4, 47.1) 5.5 (3.0, 10.0) 100 Middle 3.1 (1.9, 5.1) 12.0 (8.7, 16.2) 37.9 (33.6, 42.5) 42.9 (38.4, 47.5) 4.1 (2.7, 6.2) 100 High 4.5 (2.9, 7.0) 11.2 (8.8, 14.3) 43.6 (38.8, 48.5) 37.5 (33.1, 42.1) 3.1 (1.9, 4.9) 100 Highest 5.1 (3.6, 7.3) 12.6 (9.7, 16.2) 41.9 (36.8, 47.2) 37.6 (32.3, 43.3) 2.7 (1.7, 4.3) 100
1Among current daily or less than daily smokers
5-2 Cessation
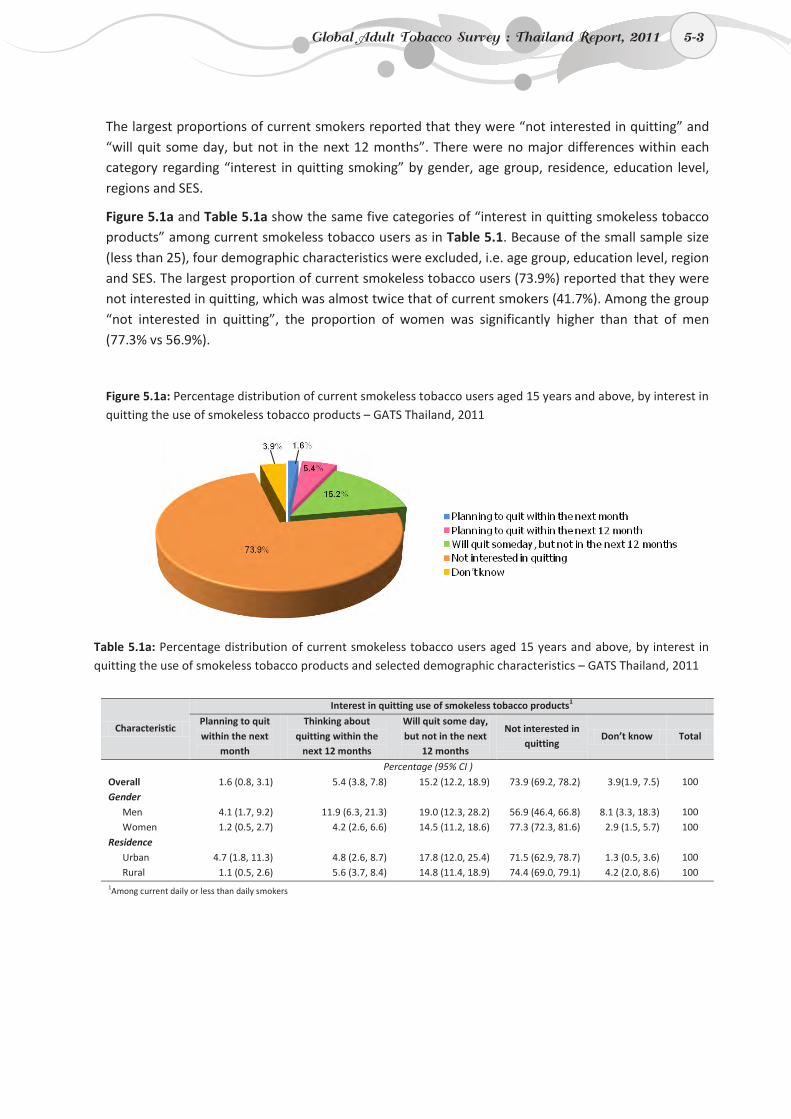
5-3
The largest proportions of current smokers reported that they were “not interested in quitting” and “will quit some day, but not in the next 12 months”. There were no major differences within each category regarding “interest in quitting smoking” by gender, age group, residence, education level, regions and SES.
Figure 5.1a and Table 5.1a show the same five categories of “interest in quitting smokeless tobacco products” among current smokeless tobacco users as in Table 5.1. Because of the small sample size (less than 25), four demographic characteristics were excluded, i.e. age group, education level, region and SES. The largest proportion of current smokeless tobacco users (73.9%) reported that they were not interested in quitting, which was almost twice that of current smokers (41.7%). Among the group “not interested in quitting”, the proportion of women was significantly higher than that of men (77.3% vs 56.9%).
Figure 5.1a: Percentage distribution of current smokeless tobacco users aged 15 years and above, by interest in quitting the use of smokeless tobacco products – GATS Thailand, 2011
Table 5.1a: Percentage distribution of current smokeless tobacco users aged 15 years and above, by interest in quitting the use of smokeless tobacco products and selected demographic characteristics – GATS Thailand, 2011
Characteristic
Interest in quitting use of smokeless tobacco products1
Planning to quit within the next
month
Thinking about quitting within the
next 12 months
Will quit some day, but not in the next
12 months
Not interested in quitting
Don’t know Total
Percentage (95% CI )
Overall 1.6 (0.8, 3.1) 5.4 (3.8, 7.8) 15.2 (12.2, 18.9) 73.9 (69.2, 78.2) 3.9(1.9, 7.5) 100 Gender
Men 4.1 (1.7, 9.2) 11.9 (6.3, 21.3) 19.0 (12.3, 28.2) 56.9 (46.4, 66.8) 8.1 (3.3, 18.3) 100 Women 1.2 (0.5, 2.7) 4.2 (2.6, 6.6) 14.5 (11.2, 18.6) 77.3 (72.3, 81.6) 2.9 (1.5, 5.7) 100
Residence
Urban 4.7 (1.8, 11.3) 4.8 (2.6, 8.7) 17.8 (12.0, 25.4) 71.5 (62.9, 78.7) 1.3 (0.5, 3.6) 100 Rural 1.1 (0.5, 2.6) 5.6 (3.7, 8.4) 14.8 (11.4, 18.9) 74.4 (69.0, 79.1) 4.2 (2.0, 8.6) 100
1Among current daily or less than daily smokers
Global Adult Tobacco Survey : Thailand Report, 2011 5-3
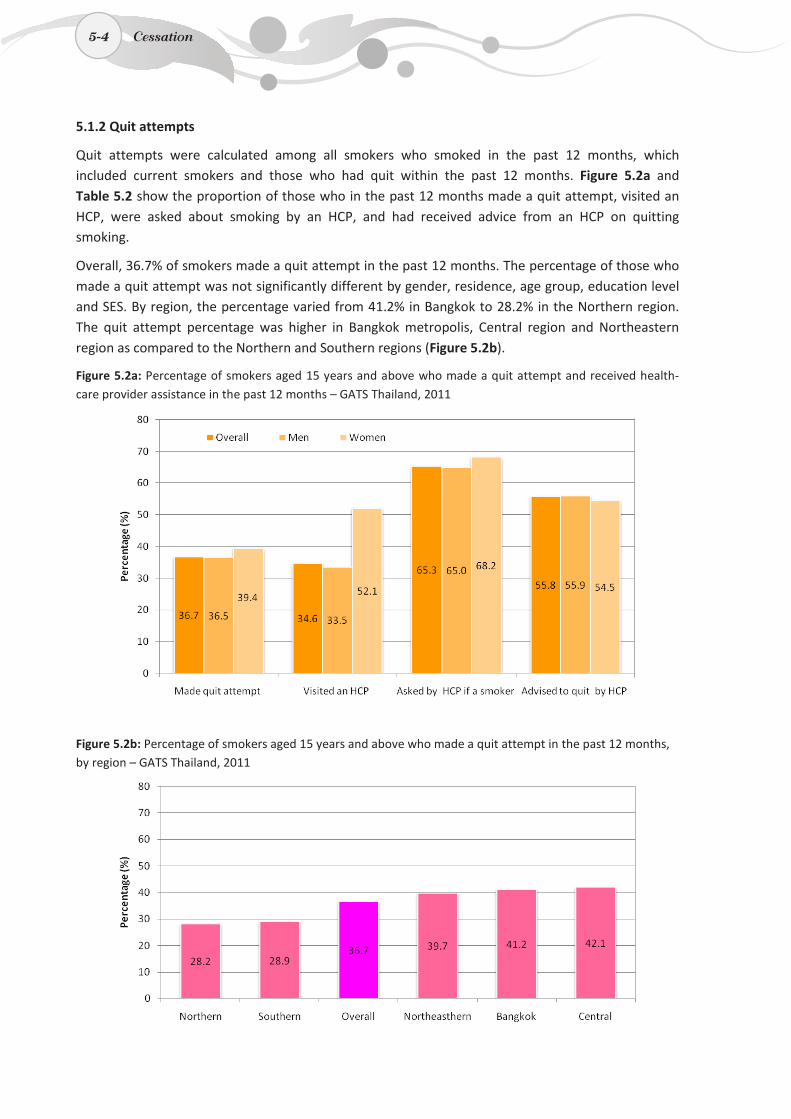
5-4
5.1.2 Quit attempts
Quit attempts were calculated among all smokers who smoked in the past 12 months, which included current smokers and those who had quit within the past 12 months. Figure 5.2a and Table 5.2 show the proportion of those who in the past 12 months made a quit attempt, visited an HCP, were asked about smoking by an HCP, and had received advice from an HCP on quitting smoking.
Overall, 36.7% of smokers made a quit attempt in the past 12 months. The percentage of those who made a quit attempt was not significantly different by gender, residence, age group, education level and SES. By region, the percentage varied from 41.2% in Bangkok to 28.2% in the Northern region. The quit attempt percentage was higher in Bangkok metropolis, Central region and Northeastern region as compared to the Northern and Southern regions (Figure 5.2b).
Figure 5.2a: Percentage of smokers aged 15 years and above who made a quit attempt and received health-care provider assistance in the past 12 months – GATS Thailand, 2011
Figure 5.2b: Percentage of smokers aged 15 years and above who made a quit attempt in the past 12 months, by region – GATS Thailand, 2011
5-4 Cessation
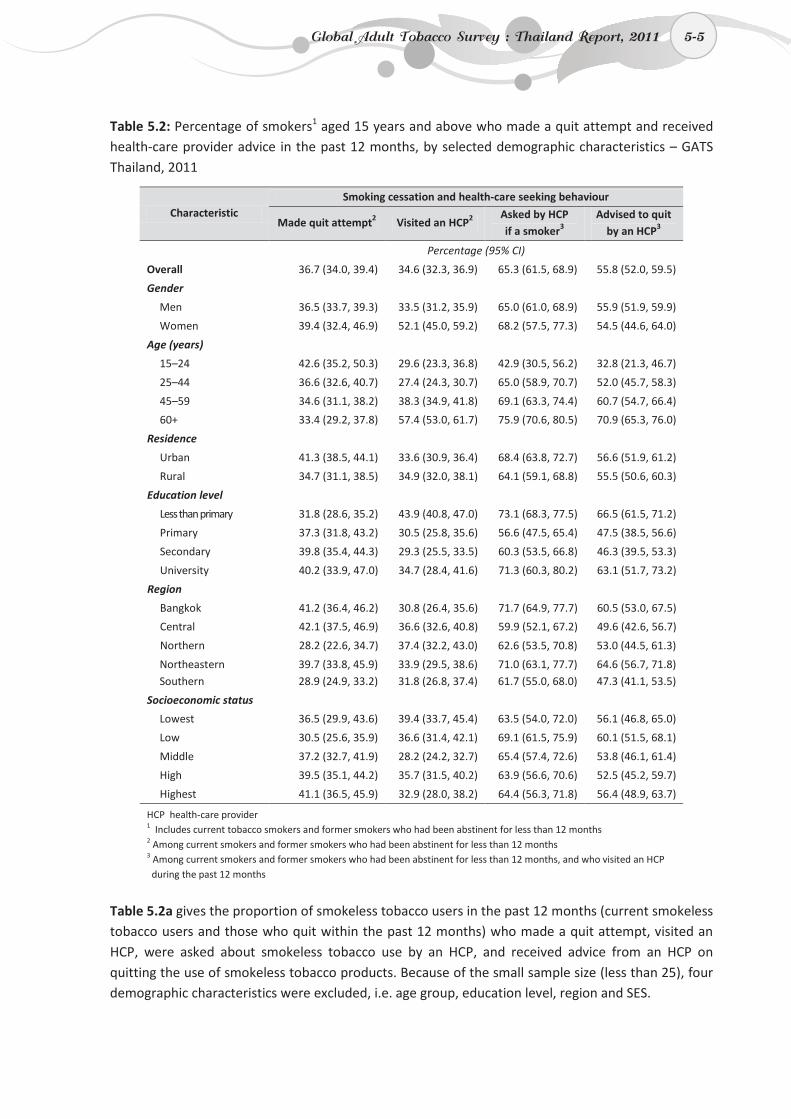
5-5
Table 5.2: Percentage of smokers1 aged 15 years and above who made a quit attempt and received health-care provider advice in the past 12 months, by selected demographic characteristics – GATS Thailand, 2011
Characteristic Smoking cessation and health-care seeking behaviour
Made quit attempt2 Visited an HCP2 Asked by HCP if a smoker3
Advised to quit by an HCP3
Percentage (95% CI)
Overall 36.7 (34.0, 39.4) 34.6 (32.3, 36.9) 65.3 (61.5, 68.9) 55.8 (52.0, 59.5)
Gender
Men 36.5 (33.7, 39.3) 33.5 (31.2, 35.9) 65.0 (61.0, 68.9) 55.9 (51.9, 59.9)
Women 39.4 (32.4, 46.9) 52.1 (45.0, 59.2) 68.2 (57.5, 77.3) 54.5 (44.6, 64.0)
Age (years)
15–24 42.6 (35.2, 50.3) 29.6 (23.3, 36.8) 42.9 (30.5, 56.2) 32.8 (21.3, 46.7)
25–44 36.6 (32.6, 40.7) 27.4 (24.3, 30.7) 65.0 (58.9, 70.7) 52.0 (45.7, 58.3)
45–59 34.6 (31.1, 38.2) 38.3 (34.9, 41.8) 69.1 (63.3, 74.4) 60.7 (54.7, 66.4)
60+ 33.4 (29.2, 37.8) 57.4 (53.0, 61.7) 75.9 (70.6, 80.5) 70.9 (65.3, 76.0)
Residence
Urban 41.3 (38.5, 44.1) 33.6 (30.9, 36.4) 68.4 (63.8, 72.7) 56.6 (51.9, 61.2)
Rural 34.7 (31.1, 38.5) 34.9 (32.0, 38.1) 64.1 (59.1, 68.8) 55.5 (50.6, 60.3)
Education level
Less than primary 31.8 (28.6, 35.2) 43.9 (40.8, 47.0) 73.1 (68.3, 77.5) 66.5 (61.5, 71.2)
Primary 37.3 (31.8, 43.2) 30.5 (25.8, 35.6) 56.6 (47.5, 65.4) 47.5 (38.5, 56.6)
Secondary 39.8 (35.4, 44.3) 29.3 (25.5, 33.5) 60.3 (53.5, 66.8) 46.3 (39.5, 53.3)
University 40.2 (33.9, 47.0) 34.7 (28.4, 41.6) 71.3 (60.3, 80.2) 63.1 (51.7, 73.2)
Region
Bangkok 41.2 (36.4, 46.2) 30.8 (26.4, 35.6) 71.7 (64.9, 77.7) 60.5 (53.0, 67.5)
Central 42.1 (37.5, 46.9) 36.6 (32.6, 40.8) 59.9 (52.1, 67.2) 49.6 (42.6, 56.7)
Northern 28.2 (22.6, 34.7) 37.4 (32.2, 43.0) 62.6 (53.5, 70.8) 53.0 (44.5, 61.3)
Northeastern 39.7 (33.8, 45.9) 33.9 (29.5, 38.6) 71.0 (63.1, 77.7) 64.6 (56.7, 71.8) Southern 28.9 (24.9, 33.2) 31.8 (26.8, 37.4) 61.7 (55.0, 68.0) 47.3 (41.1, 53.5)
Socioeconomic status
Lowest 36.5 (29.9, 43.6) 39.4 (33.7, 45.4) 63.5 (54.0, 72.0) 56.1 (46.8, 65.0)
Low 30.5 (25.6, 35.9) 36.6 (31.4, 42.1) 69.1 (61.5, 75.9) 60.1 (51.5, 68.1)
Middle 37.2 (32.7, 41.9) 28.2 (24.2, 32.7) 65.4 (57.4, 72.6) 53.8 (46.1, 61.4)
High 39.5 (35.1, 44.2) 35.7 (31.5, 40.2) 63.9 (56.6, 70.6) 52.5 (45.2, 59.7)
Highest 41.1 (36.5, 45.9) 32.9 (28.0, 38.2) 64.4 (56.3, 71.8) 56.4 (48.9, 63.7)
HCP health-care provider 1 Includes current tobacco smokers and former smokers who had been abstinent for less than 12 months
2 Among current smokers and former smokers who had been abstinent for less than 12 months 3 Among current smokers and former smokers who had been abstinent for less than 12 months, and who visited an HCP during the past 12 months
Table 5.2a gives the proportion of smokeless tobacco users in the past 12 months (current smokeless tobacco users and those who quit within the past 12 months) who made a quit attempt, visited an HCP, were asked about smokeless tobacco use by an HCP, and received advice from an HCP on quitting the use of smokeless tobacco products. Because of the small sample size (less than 25), four demographic characteristics were excluded, i.e. age group, education level, region and SES.
Global Adult Tobacco Survey : Thailand Report, 2011 5-5
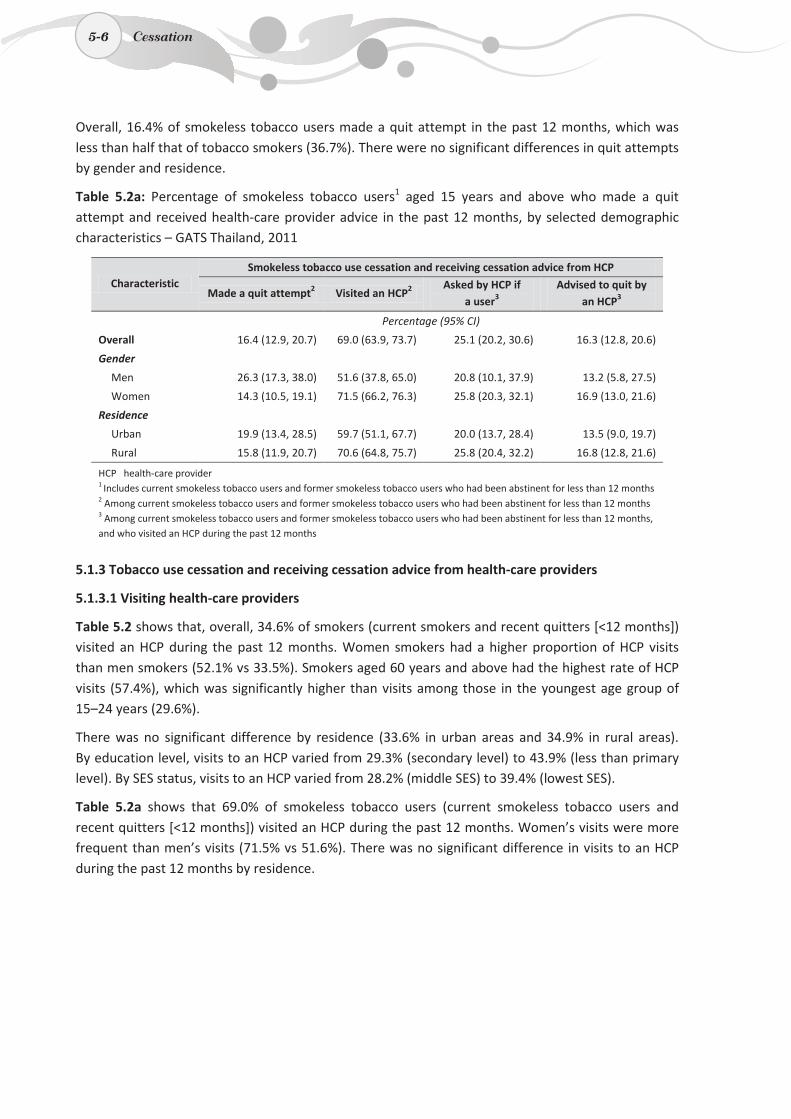
5-6
Overall, 16.4% of smokeless tobacco users made a quit attempt in the past 12 months, which was less than half that of tobacco smokers (36.7%). There were no significant differences in quit attempts by gender and residence.
Table 5.2a: Percentage of smokeless tobacco users1 aged 15 years and above who made a quit attempt and received health-care provider advice in the past 12 months, by selected demographic characteristics – GATS Thailand, 2011
Characteristic Smokeless tobacco use cessation and receiving cessation advice from HCP
Made a quit attempt2 Visited an HCP2 Asked by HCP if
a user3 Advised to quit by
an HCP3
Percentage (95% CI)
Overall 16.4 (12.9, 20.7) 69.0 (63.9, 73.7) 25.1 (20.2, 30.6) 16.3 (12.8, 20.6)
Gender
Men 26.3 (17.3, 38.0) 51.6 (37.8, 65.0) 20.8 (10.1, 37.9) 13.2 (5.8, 27.5)
Women 14.3 (10.5, 19.1) 71.5 (66.2, 76.3) 25.8 (20.3, 32.1) 16.9 (13.0, 21.6)
Residence
Urban 19.9 (13.4, 28.5) 59.7 (51.1, 67.7) 20.0 (13.7, 28.4) 13.5 (9.0, 19.7)
Rural 15.8 (11.9, 20.7) 70.6 (64.8, 75.7) 25.8 (20.4, 32.2) 16.8 (12.8, 21.6)
HCP health-care provider 1 Includes current smokeless tobacco users and former smokeless tobacco users who had been abstinent for less than 12 months 2 Among current smokeless tobacco users and former smokeless tobacco users who had been abstinent for less than 12 months 3 Among current smokeless tobacco users and former smokeless tobacco users who had been abstinent for less than 12 months, and who visited an HCP during the past 12 months
5.1.3 Tobacco use cessation and receiving cessation advice from health-care providers
5.1.3.1 Visiting health-care providers
Table 5.2 shows that, overall, 34.6% of smokers (current smokers and recent quitters [<12 months]) visited an HCP during the past 12 months. Women smokers had a higher proportion of HCP visits than men smokers (52.1% vs 33.5%). Smokers aged 60 years and above had the highest rate of HCP visits (57.4%), which was significantly higher than visits among those in the youngest age group of 15–24 years (29.6%).
There was no significant difference by residence (33.6% in urban areas and 34.9% in rural areas). By education level, visits to an HCP varied from 29.3% (secondary level) to 43.9% (less than primary level). By SES status, visits to an HCP varied from 28.2% (middle SES) to 39.4% (lowest SES).
Table 5.2a shows that 69.0% of smokeless tobacco users (current smokeless tobacco users and recent quitters [<12 months]) visited an HCP during the past 12 months. Women’s visits were more frequent than men’s visits (71.5% vs 51.6%). There was no significant difference in visits to an HCP during the past 12 months by residence.
5-6 Cessation
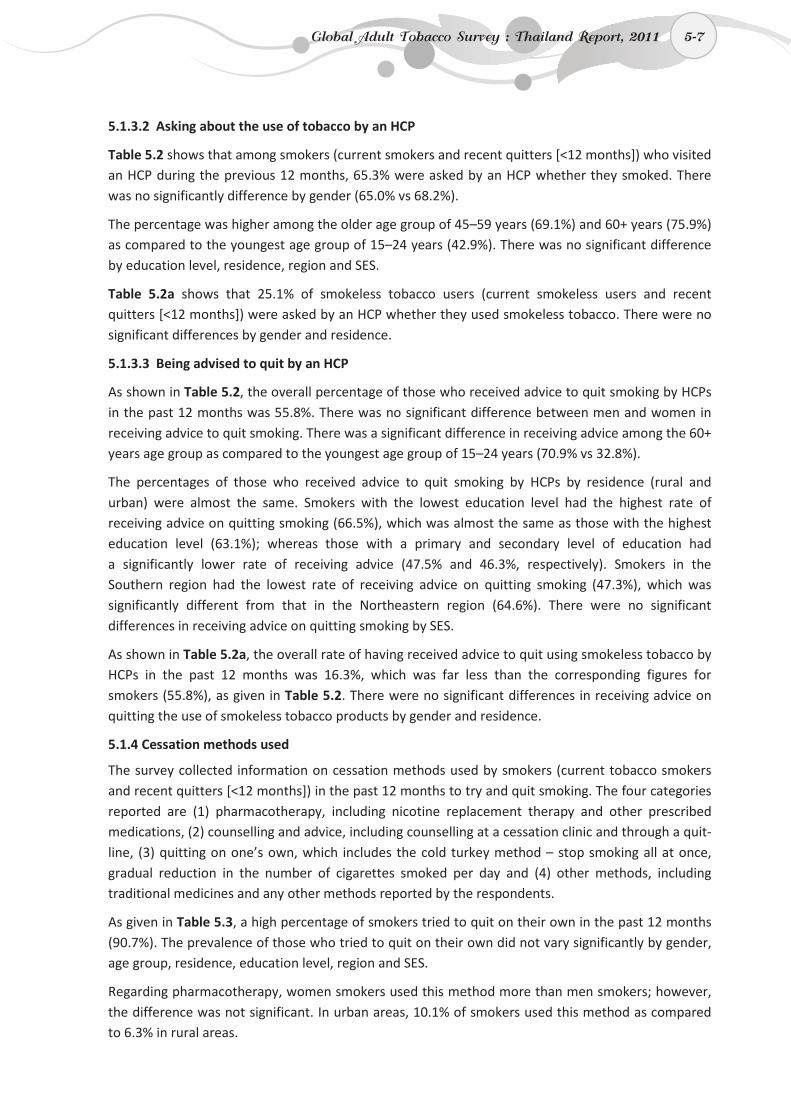
5-7
5.1.3.2 Asking about the use of tobacco by an HCP
Table 5.2 shows that among smokers (current smokers and recent quitters [<12 months]) who visited an HCP during the previous 12 months, 65.3% were asked by an HCP whether they smoked. There was no significantly difference by gender (65.0% vs 68.2%).
The percentage was higher among the older age group of 45–59 years (69.1%) and 60+ years (75.9%) as compared to the youngest age group of 15–24 years (42.9%). There was no significant difference by education level, residence, region and SES.
Table 5.2a shows that 25.1% of smokeless tobacco users (current smokeless users and recent quitters [<12 months]) were asked by an HCP whether they used smokeless tobacco. There were no significant differences by gender and residence.
5.1.3.3 Being advised to quit by an HCP
As shown in Table 5.2, the overall percentage of those who received advice to quit smoking by HCPs in the past 12 months was 55.8%. There was no significant difference between men and women in receiving advice to quit smoking. There was a significant difference in receiving advice among the 60+ years age group as compared to the youngest age group of 15–24 years (70.9% vs 32.8%).
The percentages of those who received advice to quit smoking by HCPs by residence (rural and urban) were almost the same. Smokers with the lowest education level had the highest rate of receiving advice on quitting smoking (66.5%), which was almost the same as those with the highest education level (63.1%); whereas those with a primary and secondary level of education had a significantly lower rate of receiving advice (47.5% and 46.3%, respectively). Smokers in the Southern region had the lowest rate of receiving advice on quitting smoking (47.3%), which was significantly different from that in the Northeastern region (64.6%). There were no significant differences in receiving advice on quitting smoking by SES.
As shown in Table 5.2a, the overall rate of having received advice to quit using smokeless tobacco by HCPs in the past 12 months was 16.3%, which was far less than the corresponding figures for smokers (55.8%), as given in Table 5.2. There were no significant differences in receiving advice on quitting the use of smokeless tobacco products by gender and residence.
5.1.4 Cessation methods used
The survey collected information on cessation methods used by smokers (current tobacco smokers and recent quitters [<12 months]) in the past 12 months to try and quit smoking. The four categories reported are (1) pharmacotherapy, including nicotine replacement therapy and other prescribed medications, (2) counselling and advice, including counselling at a cessation clinic and through a quit-line, (3) quitting on one’s own, which includes the cold turkey method – stop smoking all at once, gradual reduction in the number of cigarettes smoked per day and (4) other methods, including traditional medicines and any other methods reported by the respondents.
As given in Table 5.3, a high percentage of smokers tried to quit on their own in the past 12 months (90.7%). The prevalence of those who tried to quit on their own did not vary significantly by gender, age group, residence, education level, region and SES.
Regarding pharmacotherapy, women smokers used this method more than men smokers; however, the difference was not significant. In urban areas, 10.1% of smokers used this method as compared to 6.3% in rural areas.
Global Adult Tobacco Survey : Thailand Report, 2011 5-7
5-8
Table 5.3: Percentage of smokers1 aged 15 years or above who made a quit attempt in the past 12 months and used any cessation method, by selected demographic characteristics – GATS Thailand, 2011
Characteristic Use of cessation method2
Pharmacotherapy3 Counselling/advice4 Quit on your own Other5
Percentage (95% CI) Overall 7.6 (5.7, 10.1) 4.8 (3.6, 6.3) 90.7 (88.0, 92.9) 2.3 (1.5, 3.5) Gender
Men 7.5 (5.5, 10.2) 4.6 (3.4, 6.2) 91.1 (88.2, 93.3) 2.1 (1.3, 3.4) Women 9.3 (5.0, 17.0) 7.1 (3.8, 13.1) 84.7 (75.3, 91.0) 4.7 (2.1, 9.9)
Age (years) 15–24 9.3 (4.6, 17.9) 5.8 (2.6, 12.1) 92.8 (83.2, 97.1) 3.1 (1.2, 8.3) 25–44 5.9 (4.2, 8.2) 3.0 (1.9, 4.5) 91.8 (88.4, 94.2) 1.7 (0.9, 3.6) 45–59 10.0 (6.5, 15.3) 5.6 (3.4, 9.1) 89.3 (85.1, 92.4) 1.4 (0.7, 3.0) 60+ 6.0 (3.3, 10.7) 8.0 (4.8, 13.0) 86.5 (80.3, 91.0) 4.5 (2.0, 9.8)
Residence Urban 10.1 (7.7, 13.1) 6.5 (4.7, 9.0) 88.7 (85.7, 91.2) 2.8 (1.6, 4.9) Rural 6.3 (3.9, 10.1) 3.9 (2.5, 6.0) 91.7 (87.6, 94.5) 2.0 (1.1, 3.6)
Education level Less than primary 6.3 (4.0, 9.6) 5.4 (3.7, 8.0) 88.5 (83.8, 91.9) 3.2 (1.8, 5.6) Primary 6.7 (3.7, 11.7) 1.2 (0.6, 2.4) 94.3 (89.6, 97.0) 0.7 (0.2, 2.6) Secondary 9.2 (6.2, 13.5) 6.6 (4.2, 10.2) 92.0 (88.6, 94.4) 2.9 (1.4, 5.9) University 7.6 (4.1, 13.6) 6.4 (3.2, 12.4) 80.3 (66.4, 89.4) 2.0 (0.6, 6.4)
Region Bangkok 6.9 (4.1, 11.3) 6.3 (3.6, 10.8) 90.9 (86.2, 94.1) 1.6 (0.6, 4.2) Central 5.7 (3.8, 8.5) 5.9 (3.7, 9.3) 88.9 (84.2, 92.3) 3.6 (1.8, 7.1) Northern 4.9 (2.7, 8.8) 5.0 (2.8, 8.8) 89.7 (83.0, 94.0) 1.0 (0.2, 4.3) Northeastern 9.6 (5.6, 16.0) 3.3 (1.6, 6.7) 91.5 (84.5, 95.6) 1.7 (0.7, 4.1) Southern 8.8 (4.8, 15.4) 5.5 (3.2, 9.4) 93.0 (89.3, 95.5) 2.8 (1.4, 5.4)
Socioeconomic status Lowest 6.4 (3.0, 13.2) 5.8 (2.8, 11.4) 95.7 (93.5, 97.2) 1.5 (0.3, 6.5) Low 5.0 (2.8, 8.9) 5.4 (3.2, 9.0) 90.2 (81.9, 95.0) 4.3 (2.2, 8.4) Middle 8.8 (5.7, 13.3) 2.6 (1.4, 4.6) 91.2 (86.8, 94.3) 2.3 (1.0, 5.2) High 7.1 (4.1, 12.1) 5.1 (3.1, 8.2) 88.6 (82.3, 92.9) 1.9 (0.7, 5.0) Highest 11.1 (6.8, 17.7) 5.6 (2.7, 11.0) 86.8 (81.1, 91.0) 1.4 (0.5, 3.9)
1 Includes current smokers and former smokers who had been abstinent for less than 12 months 2 Among current smokers who made a quit attempt in the past 12 months and former smokers who had been abstinent for less
than 12 months 3 Pharmacotherapy includes nicotine replacement therapy and prescription medications 4 Includes counselling at a cessation clinic and a telephone quit-line/helpline 5 “Other” includes traditional medicines and any other reported methods.
Table 5.3a presents data on cessation methods used by smokeless tobacco users (current users and recent quitters [<12 months]) in the past 12 months. Because of the unweighted sample size of less than 25, four demographic characteristics were excluded, i.e. age group, education level, region and SES.
As in the case of smokers, a high percentage of smokeless tobacco users tried to quit on their own in the past 12 months (79.5%), with other methods falling far behind.
5-8 Cessation
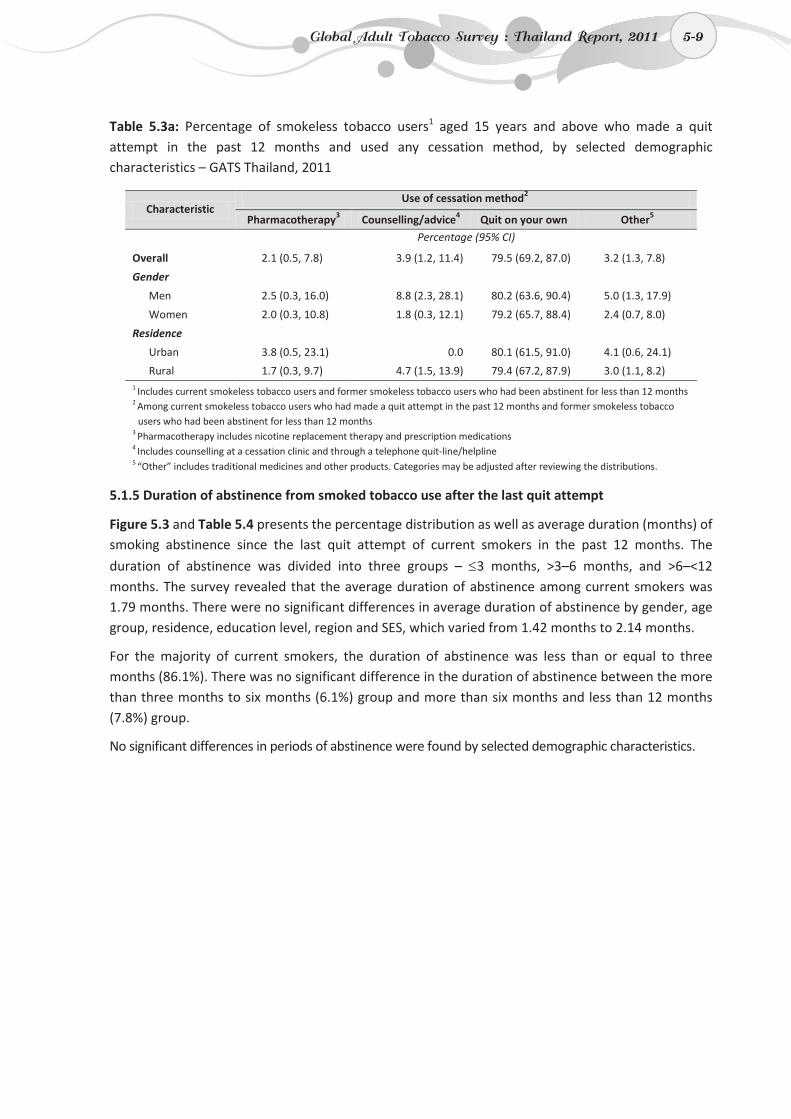
5-9
Table 5.3a: Percentage of smokeless tobacco users1 aged 15 years and above who made a quit attempt in the past 12 months and used any cessation method, by selected demographic characteristics – GATS Thailand, 2011
Characteristic Use of cessation method2
Pharmacotherapy3 Counselling/advice4 Quit on your own Other5
Percentage (95% CI)
Overall 2.1 (0.5, 7.8) 3.9 (1.2, 11.4) 79.5 (69.2, 87.0) 3.2 (1.3, 7.8)
Gender
Men 2.5 (0.3, 16.0) 8.8 (2.3, 28.1) 80.2 (63.6, 90.4) 5.0 (1.3, 17.9)
Women 2.0 (0.3, 10.8) 1.8 (0.3, 12.1) 79.2 (65.7, 88.4) 2.4 (0.7, 8.0)
Residence
Urban 3.8 (0.5, 23.1) 0.0 80.1 (61.5, 91.0) 4.1 (0.6, 24.1)
Rural 1.7 (0.3, 9.7) 4.7 (1.5, 13.9) 79.4 (67.2, 87.9) 3.0 (1.1, 8.2) 1 Includes current smokeless tobacco users and former smokeless tobacco users who had been abstinent for less than 12 months 2 Among current smokeless tobacco users who had made a quit attempt in the past 12 months and former smokeless tobacco
users who had been abstinent for less than 12 months 3 Pharmacotherapy includes nicotine replacement therapy and prescription medications 4 Includes counselling at a cessation clinic and through a telephone quit-line/helpline 5 “Other” includes traditional medicines and other products. Categories may be adjusted after reviewing the distributions.
5.1.5 Duration of abstinence from smoked tobacco use after the last quit attempt
Figure 5.3 and Table 5.4 presents the percentage distribution as well as average duration (months) of smoking abstinence since the last quit attempt of current smokers in the past 12 months. The
duration of abstinence was divided into three groups – ≤3 months, >3–6 months, and >6–<12 months. The survey revealed that the average duration of abstinence among current smokers was 1.79 months. There were no significant differences in average duration of abstinence by gender, age group, residence, education level, region and SES, which varied from 1.42 months to 2.14 months.
For the majority of current smokers, the duration of abstinence was less than or equal to three months (86.1%). There was no significant difference in the duration of abstinence between the more than three months to six months (6.1%) group and more than six months and less than 12 months (7.8%) group.
No significant differences in periods of abstinence were found by selected demographic characteristics.
Global Adult Tobacco Survey : Thailand Report, 2011 5-9
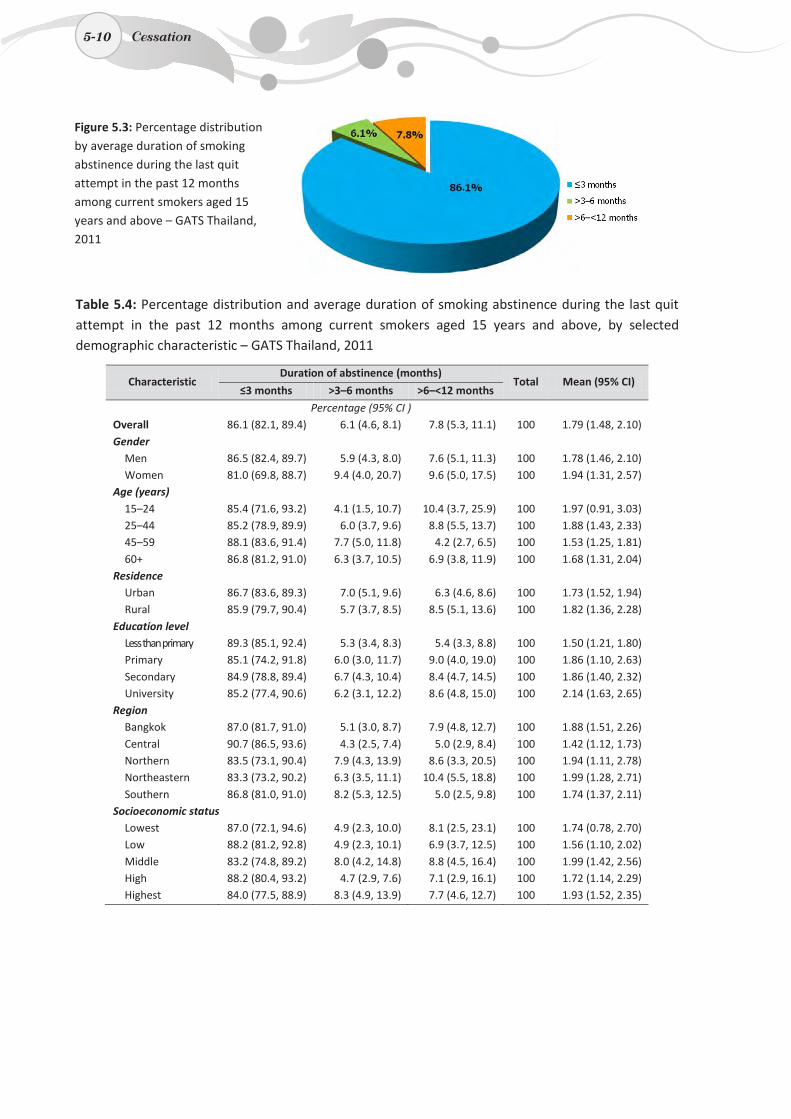
5-10
Table 5.4: Percentage distribution and average duration of smoking abstinence during the last quit attempt in the past 12 months among current smokers aged 15 years and above, by selected demographic characteristic – GATS Thailand, 2011
Characteristic Duration of abstinence (months)
Total Mean (95% CI) ≤3 months >3–6 months >6–<12 months
Percentage (95% CI ) Overall 86.1 (82.1, 89.4) 6.1 (4.6, 8.1) 7.8 (5.3, 11.1) 100 1.79 (1.48, 2.10) Gender
Men 86.5 (82.4, 89.7) 5.9 (4.3, 8.0) 7.6 (5.1, 11.3) 100 1.78 (1.46, 2.10) Women 81.0 (69.8, 88.7) 9.4 (4.0, 20.7) 9.6 (5.0, 17.5) 100 1.94 (1.31, 2.57)
Age (years) 15–24 85.4 (71.6, 93.2) 4.1 (1.5, 10.7) 10.4 (3.7, 25.9) 100 1.97 (0.91, 3.03) 25–44 85.2 (78.9, 89.9) 6.0 (3.7, 9.6) 8.8 (5.5, 13.7) 100 1.88 (1.43, 2.33) 45–59 88.1 (83.6, 91.4) 7.7 (5.0, 11.8) 4.2 (2.7, 6.5) 100 1.53 (1.25, 1.81) 60+ 86.8 (81.2, 91.0) 6.3 (3.7, 10.5) 6.9 (3.8, 11.9) 100 1.68 (1.31, 2.04)
Residence Urban 86.7 (83.6, 89.3) 7.0 (5.1, 9.6) 6.3 (4.6, 8.6) 100 1.73 (1.52, 1.94) Rural 85.9 (79.7, 90.4) 5.7 (3.7, 8.5) 8.5 (5.1, 13.6) 100 1.82 (1.36, 2.28)
Education level Less than primary 89.3 (85.1, 92.4) 5.3 (3.4, 8.3) 5.4 (3.3, 8.8) 100 1.50 (1.21, 1.80) Primary 85.1 (74.2, 91.8) 6.0 (3.0, 11.7) 9.0 (4.0, 19.0) 100 1.86 (1.10, 2.63) Secondary 84.9 (78.8, 89.4) 6.7 (4.3, 10.4) 8.4 (4.7, 14.5) 100 1.86 (1.40, 2.32) University 85.2 (77.4, 90.6) 6.2 (3.1, 12.2) 8.6 (4.8, 15.0) 100 2.14 (1.63, 2.65)
Region Bangkok 87.0 (81.7, 91.0) 5.1 (3.0, 8.7) 7.9 (4.8, 12.7) 100 1.88 (1.51, 2.26) Central 90.7 (86.5, 93.6) 4.3 (2.5, 7.4) 5.0 (2.9, 8.4) 100 1.42 (1.12, 1.73) Northern 83.5 (73.1, 90.4) 7.9 (4.3, 13.9) 8.6 (3.3, 20.5) 100 1.94 (1.11, 2.78) Northeastern 83.3 (73.2, 90.2) 6.3 (3.5, 11.1) 10.4 (5.5, 18.8) 100 1.99 (1.28, 2.71) Southern 86.8 (81.0, 91.0) 8.2 (5.3, 12.5) 5.0 (2.5, 9.8) 100 1.74 (1.37, 2.11)
Socioeconomic status Lowest 87.0 (72.1, 94.6) 4.9 (2.3, 10.0) 8.1 (2.5, 23.1) 100 1.74 (0.78, 2.70) Low 88.2 (81.2, 92.8) 4.9 (2.3, 10.1) 6.9 (3.7, 12.5) 100 1.56 (1.10, 2.02) Middle 83.2 (74.8, 89.2) 8.0 (4.2, 14.8) 8.8 (4.5, 16.4) 100 1.99 (1.42, 2.56) High 88.2 (80.4, 93.2) 4.7 (2.9, 7.6) 7.1 (2.9, 16.1) 100 1.72 (1.14, 2.29) Highest 84.0 (77.5, 88.9) 8.3 (4.9, 13.9) 7.7 (4.6, 12.7) 100 1.93 (1.52, 2.35)
Figure 5.3: Percentage distribution by average duration of smoking abstinence during the last quit attempt in the past 12 months among current smokers aged 15 years and above – GATS Thailand, 2011
5-10 Cessation
5-11
5.2 Comparison of cessation findings in 2009 and 2011
Comparison of key findings between 2009 and 2011
o Smoked tobacco products
• The percentage of quit attempts significantly declined: 49.8% in 2009 vs 36.7% in 2011.
• A significant increase was found in the percentage of smokers who were asked if they smoked tobacco products by health-care providers (HCPs) in the past 12 months: 60.2% in 2009 vs 65.3% in 2011.
• No significant difference was found in the percentage of smokers who received advice to quit smoking by HCPs in the past 12 months: 51.9% in 2009 vs 55.8% in 2011.
o Smokeless tobacco products
• A significant reduction was found in the percentage of quit attempts: 21.5% in 2009 vs 16.4% in 2011.
• No significant difference was found in the percentage of smokeless tobacco users who were asked if they used smokeless tobacco products by HCPs in the past 12 months: 24.8% in 2009 vs 25.1% in 2011.
• No significant difference was found in the percentage of smokeless tobacco users who received advice to quit using smokeless tobacco by HCPs in the past 12 months: 18.7% in 2009 vs 16.3% in 2011.
Comparison of the tobacco cessation situation in 2009 and 2011 covers two indicators – quit attempts (for both smoked and smokeless tobacco products), and smoking cessation and health-care seeking behaviour.
5.2.1 Quit attempts among smokers in 2009 and 2011
Table 5.5 presents the quit attempt prevalence in 2009 and 2011 among those who smoked in the past 12 months preceding the survey (includes current smokers and former smokers who were abstinent for less than 12 months). The surveys revealed that quit attempts in the past 12 months decreased significantly from 49.8% in 2009 to 36.7% in 2011. A significant decrease in quit attempts was noted by all demographic characteristics, with the exception of people living in the Bangkok region.
Global Adult Tobacco Survey : Thailand Report, 2011 5-11
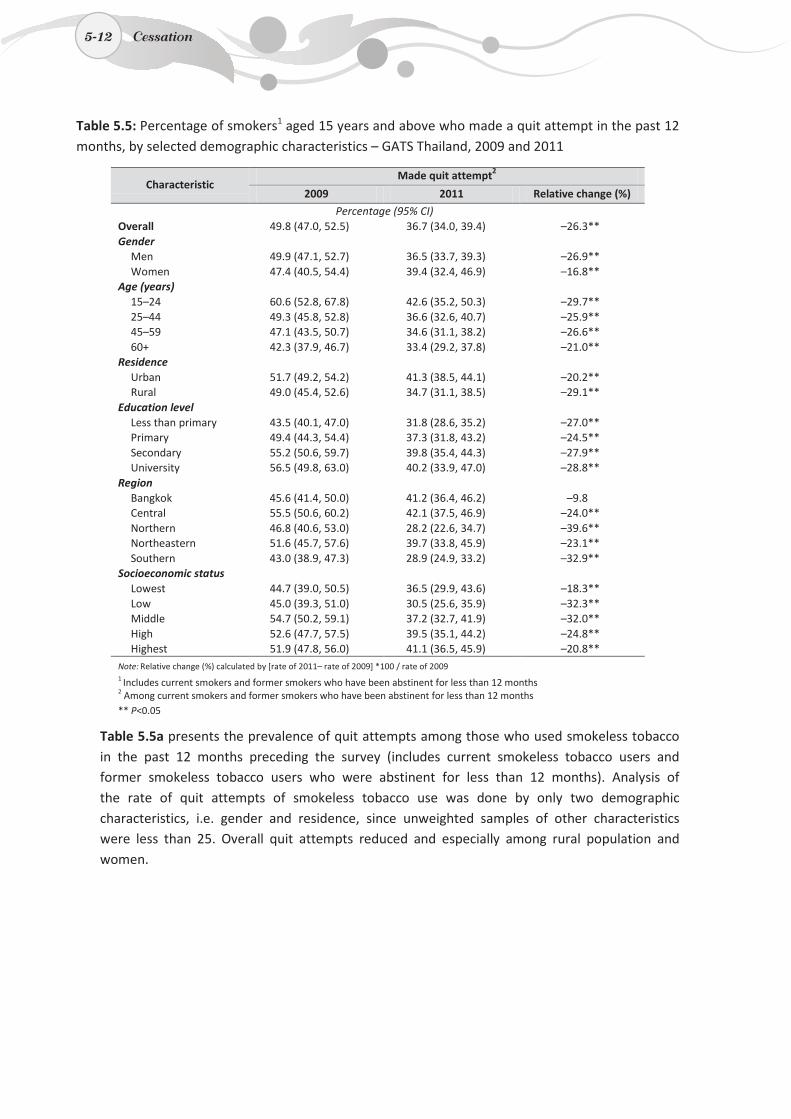
5-12
Table 5.5: Percentage of smokers1 aged 15 years and above who made a quit attempt in the past 12 months, by selected demographic characteristics – GATS Thailand, 2009 and 2011
Characteristic Made quit attempt2
2009 2011 Relative change (%)
Percentage (95% CI) Overall 49.8 (47.0, 52.5) 36.7 (34.0, 39.4) –26.3** Gender
Men 49.9 (47.1, 52.7) 36.5 (33.7, 39.3) –26.9** Women 47.4 (40.5, 54.4) 39.4 (32.4, 46.9) –16.8**
Age (years) 15–24 60.6 (52.8, 67.8) 42.6 (35.2, 50.3) –29.7** 25–44 49.3 (45.8, 52.8) 36.6 (32.6, 40.7) –25.9** 45–59 47.1 (43.5, 50.7) 34.6 (31.1, 38.2) –26.6** 60+ 42.3 (37.9, 46.7) 33.4 (29.2, 37.8) –21.0**
Residence Urban 51.7 (49.2, 54.2) 41.3 (38.5, 44.1) –20.2** Rural 49.0 (45.4, 52.6) 34.7 (31.1, 38.5) –29.1**
Education level Less than primary 43.5 (40.1, 47.0) 31.8 (28.6, 35.2) –27.0** Primary 49.4 (44.3, 54.4) 37.3 (31.8, 43.2) –24.5** Secondary 55.2 (50.6, 59.7) 39.8 (35.4, 44.3) –27.9** University 56.5 (49.8, 63.0) 40.2 (33.9, 47.0) –28.8**
Region Bangkok 45.6 (41.4, 50.0) 41.2 (36.4, 46.2) –9.8 Central 55.5 (50.6, 60.2) 42.1 (37.5, 46.9) –24.0** Northern 46.8 (40.6, 53.0) 28.2 (22.6, 34.7) –39.6** Northeastern 51.6 (45.7, 57.6) 39.7 (33.8, 45.9) –23.1** Southern 43.0 (38.9, 47.3) 28.9 (24.9, 33.2) –32.9**
Socioeconomic status Lowest 44.7 (39.0, 50.5) 36.5 (29.9, 43.6) –18.3** Low 45.0 (39.3, 51.0) 30.5 (25.6, 35.9) –32.3** Middle 54.7 (50.2, 59.1) 37.2 (32.7, 41.9) –32.0** High 52.6 (47.7, 57.5) 39.5 (35.1, 44.2) –24.8** Highest 51.9 (47.8, 56.0) 41.1 (36.5, 45.9) –20.8**
Note: Relative change (%) calculated by [rate of 2011– rate of 2009] *100 / rate of 2009
1 Includes current smokers and former smokers who have been abstinent for less than 12 months 2 Among current smokers and former smokers who have been abstinent for less than 12 months ** P<0.05
Table 5.5a presents the prevalence of quit attempts among those who used smokeless tobacco in the past 12 months preceding the survey (includes current smokeless tobacco users and former smokeless tobacco users who were abstinent for less than 12 months). Analysis of the rate of quit attempts of smokeless tobacco use was done by only two demographic characteristics, i.e. gender and residence, since unweighted samples of other characteristics were less than 25. Overall quit attempts reduced and especially among rural population and women.
5-12 Cessation
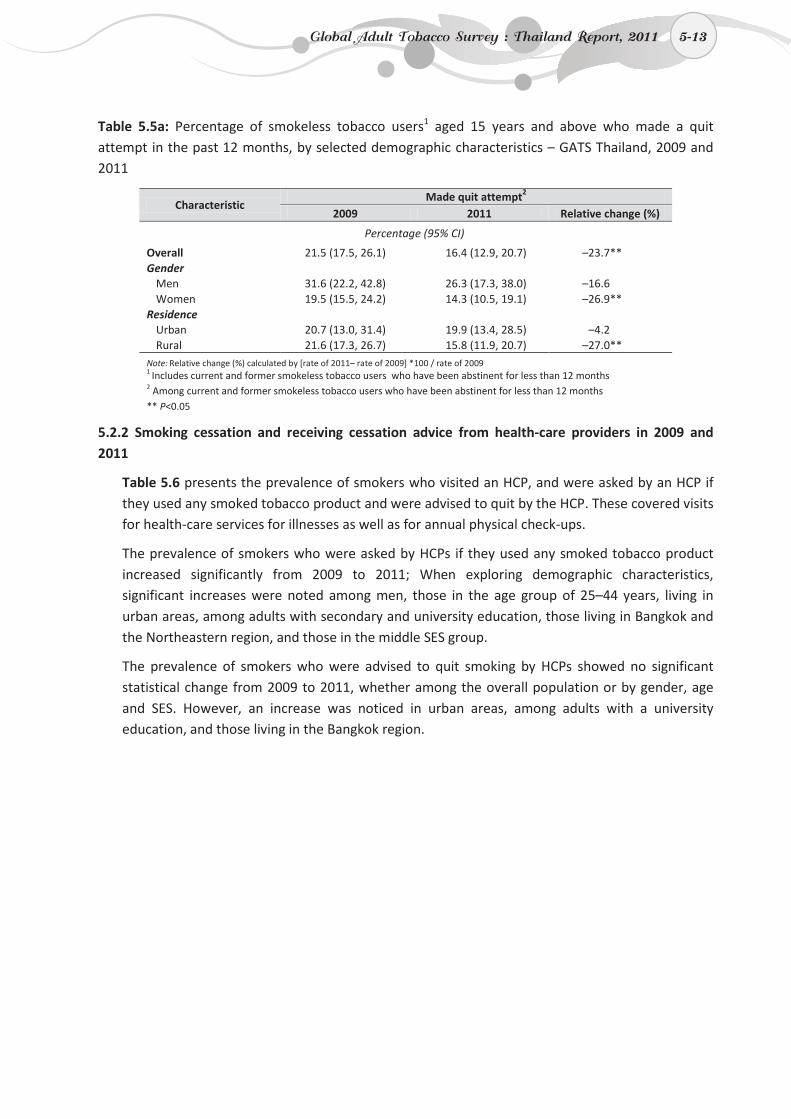
5-13
Table 5.5a: Percentage of smokeless tobacco users1 aged 15 years and above who made a quit attempt in the past 12 months, by selected demographic characteristics – GATS Thailand, 2009 and 2011
Characteristic Made quit attempt2
2009 2011 Relative change (%)
Percentage (95% CI)
Overall 21.5 (17.5, 26.1) 16.4 (12.9, 20.7) –23.7** Gender
Men 31.6 (22.2, 42.8) 26.3 (17.3, 38.0) –16.6 Women 19.5 (15.5, 24.2) 14.3 (10.5, 19.1) –26.9**
Residence Urban 20.7 (13.0, 31.4) 19.9 (13.4, 28.5) –4.2 Rural 21.6 (17.3, 26.7) 15.8 (11.9, 20.7) –27.0**
Note: Relative change (%) calculated by [rate of 2011– rate of 2009] *100 / rate of 2009 1 Includes current and former smokeless tobacco users who have been abstinent for less than 12 months 2 Among current and former smokeless tobacco users who have been abstinent for less than 12 months ** P<0.05
5.2.2 Smoking cessation and receiving cessation advice from health-care providers in 2009 and 2011
Table 5.6 presents the prevalence of smokers who visited an HCP, and were asked by an HCP if they used any smoked tobacco product and were advised to quit by the HCP. These covered visits for health-care services for illnesses as well as for annual physical check-ups.
The prevalence of smokers who were asked by HCPs if they used any smoked tobacco product increased significantly from 2009 to 2011; When exploring demographic characteristics,significant increases were noted among men, those in the age group of 25–44 years, living in urban areas, among adults with secondary and university education, those living in Bangkok and the Northeastern region, and those in the middle SES group.
The prevalence of smokers who were advised to quit smoking by HCPs showed no significant statistical change from 2009 to 2011, whether among the overall population or by gender, age and SES. However, an increase was noticed in urban areas, among adults with a university education, and those living in the Bangkok region.
Global Adult Tobacco Survey : Thailand Report, 2011 5-13
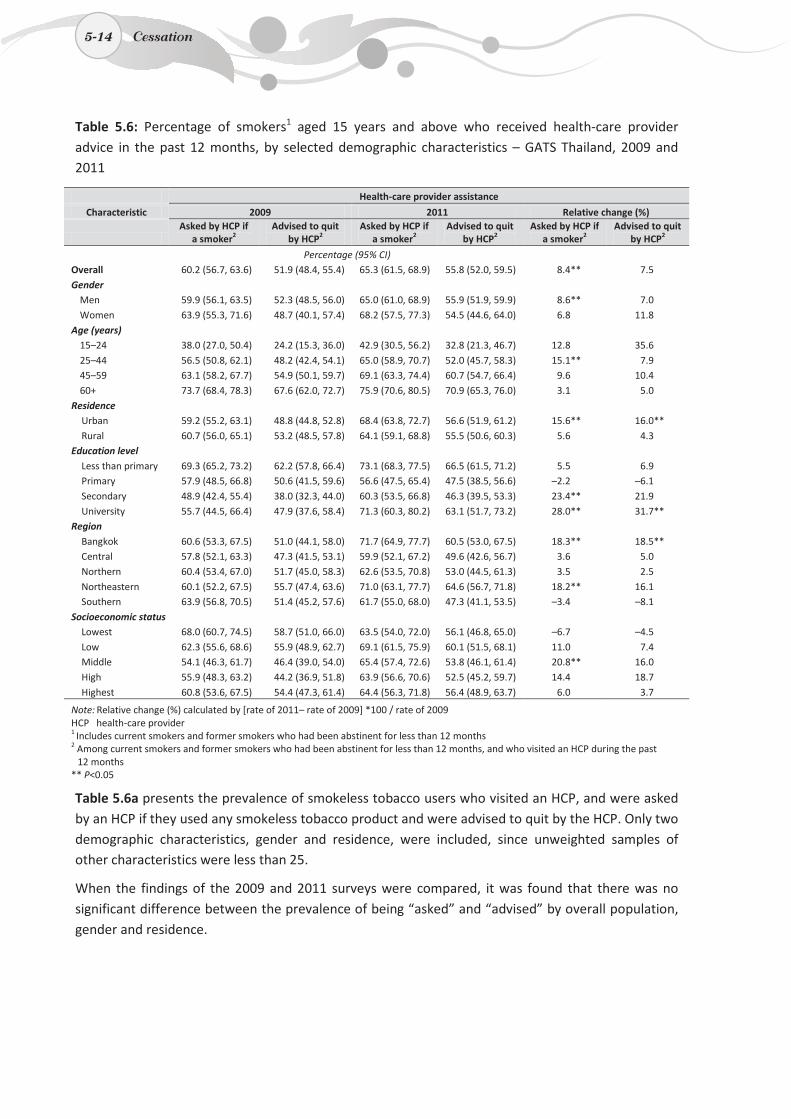
5-14
Table 5.6: Percentage of smokers1 aged 15 years and above who received health-care provider advice in the past 12 months, by selected demographic characteristics – GATS Thailand, 2009 and 2011
Health-care provider assistance
Characteristic 2009 2011 Relative change (%)
Asked by HCP if
a smoker2 Advised to quit
by HCP2 Asked by HCP if
a smoker2 Advised to quit
by HCP2 Asked by HCP if
a smoker2 Advised to quit
by HCP2
Percentage (95% CI) Overall 60.2 (56.7, 63.6) 51.9 (48.4, 55.4) 65.3 (61.5, 68.9) 55.8 (52.0, 59.5) 8.4** 7.5 Gender
Men 59.9 (56.1, 63.5) 52.3 (48.5, 56.0) 65.0 (61.0, 68.9) 55.9 (51.9, 59.9) 8.6** 7.0 Women 63.9 (55.3, 71.6) 48.7 (40.1, 57.4) 68.2 (57.5, 77.3) 54.5 (44.6, 64.0) 6.8 11.8
Age (years) 15–24 38.0 (27.0, 50.4) 24.2 (15.3, 36.0) 42.9 (30.5, 56.2) 32.8 (21.3, 46.7) 12.8 35.6 25–44 56.5 (50.8, 62.1) 48.2 (42.4, 54.1) 65.0 (58.9, 70.7) 52.0 (45.7, 58.3) 15.1** 7.9 45–59 63.1 (58.2, 67.7) 54.9 (50.1, 59.7) 69.1 (63.3, 74.4) 60.7 (54.7, 66.4) 9.6 10.4 60+ 73.7 (68.4, 78.3) 67.6 (62.0, 72.7) 75.9 (70.6, 80.5) 70.9 (65.3, 76.0) 3.1 5.0
Residence Urban 59.2 (55.2, 63.1) 48.8 (44.8, 52.8) 68.4 (63.8, 72.7) 56.6 (51.9, 61.2) 15.6** 16.0** Rural 60.7 (56.0, 65.1) 53.2 (48.5, 57.8) 64.1 (59.1, 68.8) 55.5 (50.6, 60.3) 5.6 4.3
Education level Less than primary 69.3 (65.2, 73.2) 62.2 (57.8, 66.4) 73.1 (68.3, 77.5) 66.5 (61.5, 71.2) 5.5 6.9 Primary 57.9 (48.5, 66.8) 50.6 (41.5, 59.6) 56.6 (47.5, 65.4) 47.5 (38.5, 56.6) –2.2 –6.1 Secondary 48.9 (42.4, 55.4) 38.0 (32.3, 44.0) 60.3 (53.5, 66.8) 46.3 (39.5, 53.3) 23.4** 21.9 University 55.7 (44.5, 66.4) 47.9 (37.6, 58.4) 71.3 (60.3, 80.2) 63.1 (51.7, 73.2) 28.0** 31.7**
Region Bangkok 60.6 (53.3, 67.5) 51.0 (44.1, 58.0) 71.7 (64.9, 77.7) 60.5 (53.0, 67.5) 18.3** 18.5** Central 57.8 (52.1, 63.3) 47.3 (41.5, 53.1) 59.9 (52.1, 67.2) 49.6 (42.6, 56.7) 3.6 5.0 Northern 60.4 (53.4, 67.0) 51.7 (45.0, 58.3) 62.6 (53.5, 70.8) 53.0 (44.5, 61.3) 3.5 2.5 Northeastern 60.1 (52.2, 67.5) 55.7 (47.4, 63.6) 71.0 (63.1, 77.7) 64.6 (56.7, 71.8) 18.2** 16.1 Southern 63.9 (56.8, 70.5) 51.4 (45.2, 57.6) 61.7 (55.0, 68.0) 47.3 (41.1, 53.5) –3.4 –8.1
Socioeconomic status Lowest 68.0 (60.7, 74.5) 58.7 (51.0, 66.0) 63.5 (54.0, 72.0) 56.1 (46.8, 65.0) –6.7 –4.5 Low 62.3 (55.6, 68.6) 55.9 (48.9, 62.7) 69.1 (61.5, 75.9) 60.1 (51.5, 68.1) 11.0 7.4 Middle 54.1 (46.3, 61.7) 46.4 (39.0, 54.0) 65.4 (57.4, 72.6) 53.8 (46.1, 61.4) 20.8** 16.0 High 55.9 (48.3, 63.2) 44.2 (36.9, 51.8) 63.9 (56.6, 70.6) 52.5 (45.2, 59.7) 14.4 18.7 Highest 60.8 (53.6, 67.5) 54.4 (47.3, 61.4) 64.4 (56.3, 71.8) 56.4 (48.9, 63.7) 6.0 3.7
Note: Relative change (%) calculated by [rate of 2011– rate of 2009] *100 / rate of 2009
HCP health-care provider 1 Includes current smokers and former smokers who had been abstinent for less than 12 months 2 Among current smokers and former smokers who had been abstinent for less than 12 months, and who visited an HCP during the past 12 months
** P<0.05
Table 5.6a presents the prevalence of smokeless tobacco users who visited an HCP, and were asked by an HCP if they used any smokeless tobacco product and were advised to quit by the HCP. Only two demographic characteristics, gender and residence, were included, since unweighted samples of other characteristics were less than 25.
When the findings of the 2009 and 2011 surveys were compared, it was found that there was no significant difference between the prevalence of being “asked” and “advised” by overall population, gender and residence.
5-14 Cessation
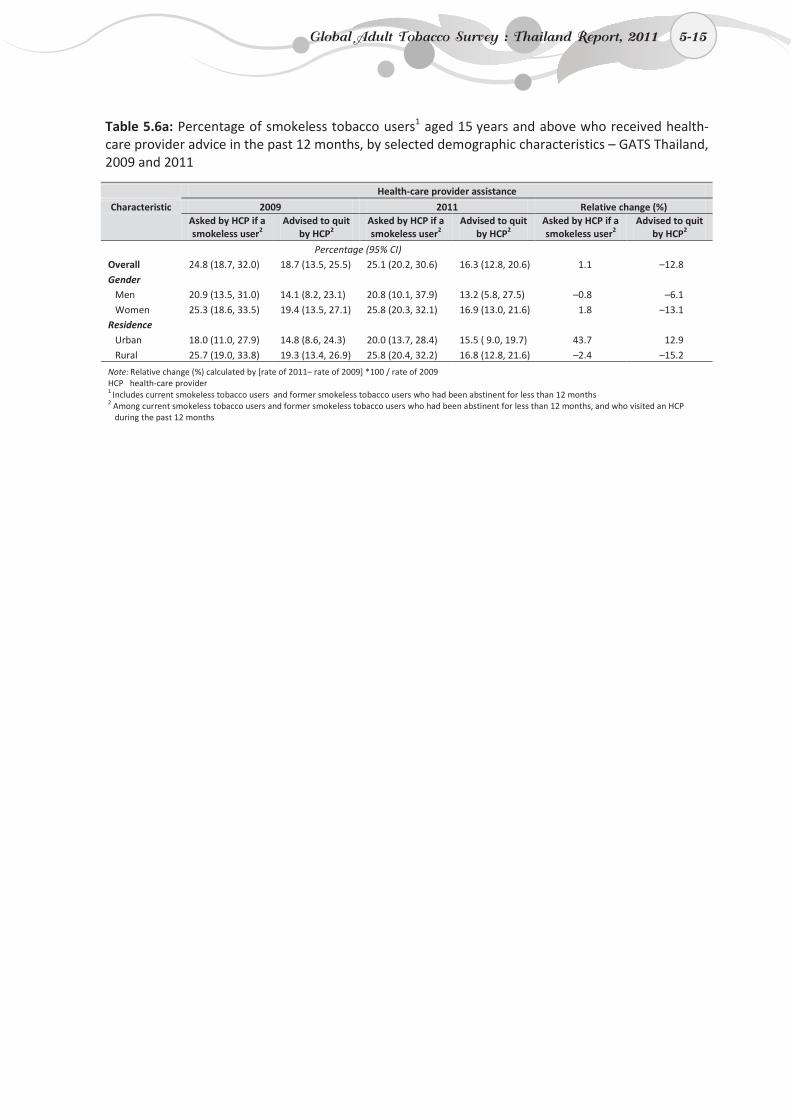
5-15
Table 5.6a: Percentage of smokeless tobacco users1 aged 15 years and above who received health-care provider advice in the past 12 months, by selected demographic characteristics – GATS Thailand, 2009 and 2011
Health-care provider assistance
Characteristic 2009 2011 Relative change (%)
Asked by HCP if a smokeless user2
Advised to quit by HCP2
Asked by HCP if a smokeless user2
Advised to quit by HCP2
Asked by HCP if a smokeless user2
Advised to quit by HCP2
Percentage (95% CI) Overall 24.8 (18.7, 32.0) 18.7 (13.5, 25.5) 25.1 (20.2, 30.6) 16.3 (12.8, 20.6) 1.1 –12.8 Gender
Men 20.9 (13.5, 31.0) 14.1 (8.2, 23.1) 20.8 (10.1, 37.9) 13.2 (5.8, 27.5) –0.8 –6.1 Women 25.3 (18.6, 33.5) 19.4 (13.5, 27.1) 25.8 (20.3, 32.1) 16.9 (13.0, 21.6) 1.8 –13.1
Residence Urban 18.0 (11.0, 27.9) 14.8 (8.6, 24.3) 20.0 (13.7, 28.4) 15.5 ( 9.0, 19.7) 43.7 12.9 Rural 25.7 (19.0, 33.8) 19.3 (13.4, 26.9) 25.8 (20.4, 32.2) 16.8 (12.8, 21.6) –2.4 –15.2
Note: Relative change (%) calculated by [rate of 2011– rate of 2009] *100 / rate of 2009
HCP health-care provider 1 Includes current smokeless tobacco users and former smokeless tobacco users who had been abstinent for less than 12 months 2 Among current smokeless tobacco users and former smokeless tobacco users who had been abstinent for less than 12 months, and who visited an HCP
during the past 12 months
Global Adult Tobacco Survey : Thailand Report, 2011 5-15
6. Second-hand smoke
6-1
6. Second-hand smoke
This chapter describes the data on exposure to second-hand smoke (SHS) at home and in various public places that should be smoke free by law. These include indoor workplaces, government buildings, health-care facilities, restaurants, markets and public transport. The findings are provided in two main sections. The first section describes the findings in the 2011 GATS and the second section compares the key findings between the 2009 GATS and the 2011 GATS.
6.1 Exposure to situations with second-hand smoke in 2011
Key findings in 2011
In the 30 days preceding the survey:
o 36.0% of the population (19.5 million) was exposed to SHS in their homes.
o Among those who worked indoors, 30.5% of workers (4.2 million) were exposed to second-hand smoke (SHS) at their indoor workplaces.
o The three most common public places where adults were exposed to SHS were markets (68.8%), bars or night clubs (68.4%), and restaurants (46.9%).
6.1.1 SHS exposure in indoor places at home
Table 6.1 shows that, overall, 36.0% (19.5 million) of the population was estimated to be exposed to SHS at home, at least monthly. There was no significant difference in the prevalence of exposure to SHS by gender and age group. People in rural areas had a significantly higher prevalence of exposure to SHS than those in urban areas (41.4% vs 25.9%). The prevalence of exposure to SHS at home among those with the lowest education level was significantly higher than among those with the highest education level (39.8% vs 17.5%).
By region, those in the Southern region had the highest exposure rate, which was about three times that in Bangkok metropolis (54.1% vs 19.0%). By SES, those in the lowest SES had a significantly higher prevalence of exposure to SHS at home than those in the highest SES (39.4% vs 22.9%).
Among non-smokers, 28.1% (11.6 million) were estimated to be exposed to SHS at home, at least monthly. Non-smokers who were women had a significantly higher rate of exposure to SHS at home than men (31.2% vs 22.1%), as did adults in the youngest age group of 15–24 years compared with those in oldest age group of 60+ years. A higher prevalence of exposure to SHS at home was also found among non-smokers in rural areas as compared to those in urban areas.
Non-smokers with the highest education level (university education) were significantly less exposed to SHS at home than those with the lowest (less than primary) education level (14.1% vs 30.8%). By region, non-smokers living in Bangkok metropolis were significantly less exposed to SHS than those living in the Southern region. By SES, non-smokers in the lowest SES had a significantly higher exposure to SHS at home than those in the highest SES.
Global Adult Tobacco Survey : Thailand Report, 2011 6-1
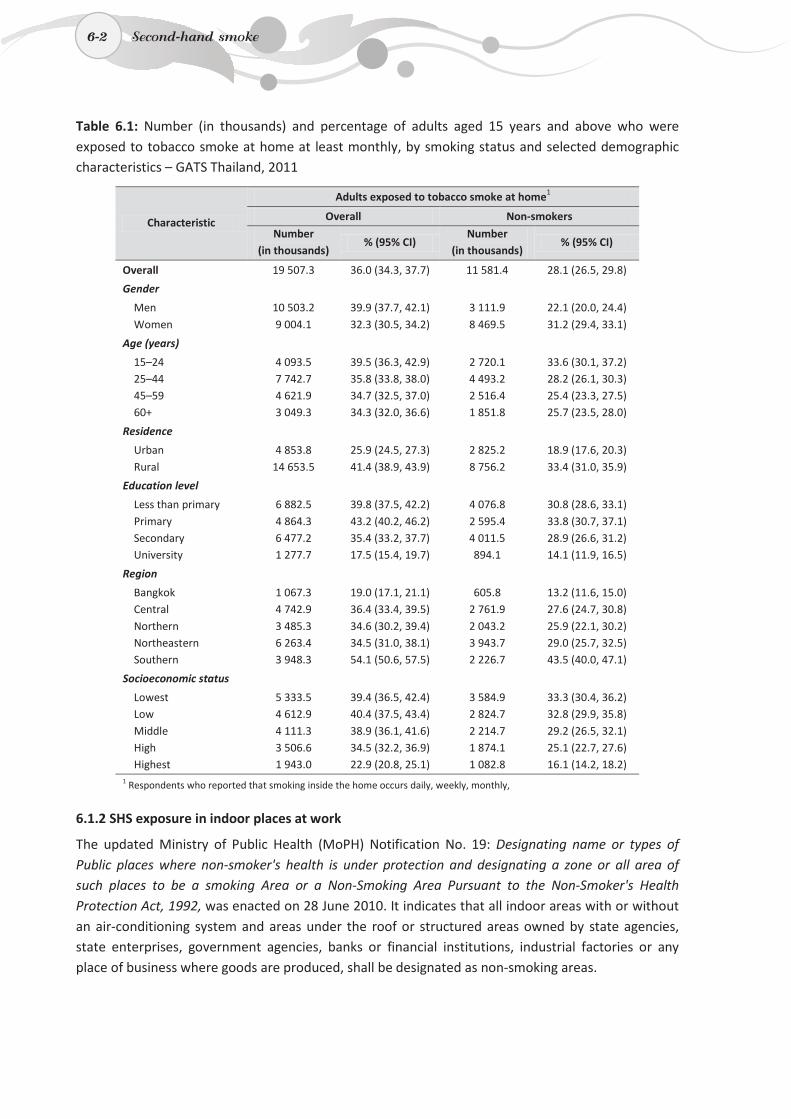
6-2
Table 6.1: Number (in thousands) and percentage of adults aged 15 years and above who were exposed to tobacco smoke at home at least monthly, by smoking status and selected demographic characteristics – GATS Thailand, 2011
Characteristic
Adults exposed to tobacco smoke at home1
Overall Non-smokers
Number (in thousands)
% (95% CI) Number
(in thousands) % (95% CI)
Overall 19 507.3 36.0 (34.3, 37.7) 11 581.4 28.1 (26.5, 29.8)
Gender
Men 10 503.2 39.9 (37.7, 42.1) 3 111.9 22.1 (20.0, 24.4) Women 9 004.1 32.3 (30.5, 34.2) 8 469.5 31.2 (29.4, 33.1)
Age (years)
15–24 4 093.5 39.5 (36.3, 42.9) 2 720.1 33.6 (30.1, 37.2) 25–44 7 742.7 35.8 (33.8, 38.0) 4 493.2 28.2 (26.1, 30.3) 45–59 4 621.9 34.7 (32.5, 37.0) 2 516.4 25.4 (23.3, 27.5) 60+ 3 049.3 34.3 (32.0, 36.6) 1 851.8 25.7 (23.5, 28.0)
Residence
Urban 4 853.8 25.9 (24.5, 27.3) 2 825.2 18.9 (17.6, 20.3) Rural 14 653.5 41.4 (38.9, 43.9) 8 756.2 33.4 (31.0, 35.9)
Education level
Less than primary 6 882.5 39.8 (37.5, 42.2) 4 076.8 30.8 (28.6, 33.1) Primary 4 864.3 43.2 (40.2, 46.2) 2 595.4 33.8 (30.7, 37.1) Secondary 6 477.2 35.4 (33.2, 37.7) 4 011.5 28.9 (26.6, 31.2) University 1 277.7 17.5 (15.4, 19.7) 894.1 14.1 (11.9, 16.5)
Region
Bangkok 1 067.3 19.0 (17.1, 21.1) 605.8 13.2 (11.6, 15.0) Central 4 742.9 36.4 (33.4, 39.5) 2 761.9 27.6 (24.7, 30.8) Northern 3 485.3 34.6 (30.2, 39.4) 2 043.2 25.9 (22.1, 30.2) Northeastern 6 263.4 34.5 (31.0, 38.1) 3 943.7 29.0 (25.7, 32.5) Southern 3 948.3 54.1 (50.6, 57.5) 2 226.7 43.5 (40.0, 47.1)
Socioeconomic status
Lowest 5 333.5 39.4 (36.5, 42.4) 3 584.9 33.3 (30.4, 36.2) Low 4 612.9 40.4 (37.5, 43.4) 2 824.7 32.8 (29.9, 35.8) Middle 4 111.3 38.9 (36.1, 41.6) 2 214.7 29.2 (26.5, 32.1) High 3 506.6 34.5 (32.2, 36.9) 1 874.1 25.1 (22.7, 27.6) Highest 1 943.0 22.9 (20.8, 25.1) 1 082.8 16.1 (14.2, 18.2)
1 Respondents who reported that smoking inside the home occurs daily, weekly, monthly,
6.1.2 SHS exposure in indoor places at work
The updated Ministry of Public Health (MoPH) Notification No. 19: Designating name or types of Public places where non-smoker's health is under protection and designating a zone or all area of such places to be a smoking Area or a Non-Smoking Area Pursuant to the Non-Smoker's Health Protection Act, 1992, was enacted on 28 June 2010. It indicates that all indoor areas with or without an air-conditioning system and areas under the roof or structured areas owned by state agencies, state enterprises, government agencies, banks or financial institutions, industrial factories or any place of business where goods are produced, shall be designated as non-smoking areas.
6-2 Second-hand smoke
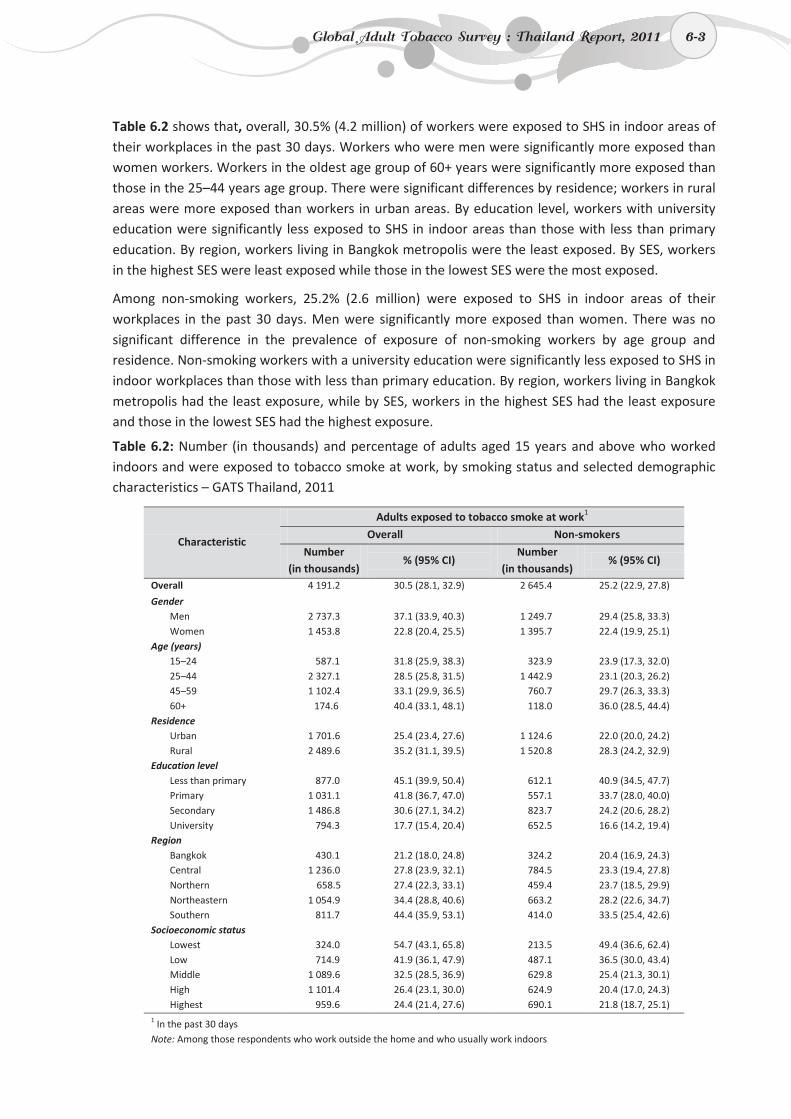
6-3
Table 6.2 shows that, overall, 30.5% (4.2 million) of workers were exposed to SHS in indoor areas of their workplaces in the past 30 days. Workers who were men were significantly more exposed than women workers. Workers in the oldest age group of 60+ years were significantly more exposed than those in the 25–44 years age group. There were significant differences by residence; workers in rural areas were more exposed than workers in urban areas. By education level, workers with university education were significantly less exposed to SHS in indoor areas than those with less than primary education. By region, workers living in Bangkok metropolis were the least exposed. By SES, workers in the highest SES were least exposed while those in the lowest SES were the most exposed.
Among non-smoking workers, 25.2% (2.6 million) were exposed to SHS in indoor areas of their workplaces in the past 30 days. Men were significantly more exposed than women. There was no significant difference in the prevalence of exposure of non-smoking workers by age group and residence. Non-smoking workers with a university education were significantly less exposed to SHS in indoor workplaces than those with less than primary education. By region, workers living in Bangkok metropolis had the least exposure, while by SES, workers in the highest SES had the least exposure and those in the lowest SES had the highest exposure.
Table 6.2: Number (in thousands) and percentage of adults aged 15 years and above who worked indoors and were exposed to tobacco smoke at work, by smoking status and selected demographic characteristics – GATS Thailand, 2011
Characteristic
Adults exposed to tobacco smoke at work1
Overall Non-smokers
Number (in thousands)
% (95% CI) Number
(in thousands) % (95% CI)
Overall 4 191.2 30.5 (28.1, 32.9) 2 645.4 25.2 (22.9, 27.8)
Gender Men 2 737.3 37.1 (33.9, 40.3) 1 249.7 29.4 (25.8, 33.3) Women 1 453.8 22.8 (20.4, 25.5) 1 395.7 22.4 (19.9, 25.1)
Age (years) 15–24 587.1 31.8 (25.9, 38.3) 323.9 23.9 (17.3, 32.0) 25–44 2 327.1 28.5 (25.8, 31.5) 1 442.9 23.1 (20.3, 26.2) 45–59 1 102.4 33.1 (29.9, 36.5) 760.7 29.7 (26.3, 33.3) 60+ 174.6 40.4 (33.1, 48.1) 118.0 36.0 (28.5, 44.4)
Residence Urban 1 701.6 25.4 (23.4, 27.6) 1 124.6 22.0 (20.0, 24.2) Rural 2 489.6 35.2 (31.1, 39.5) 1 520.8 28.3 (24.2, 32.9)
Education level Less than primary 877.0 45.1 (39.9, 50.4) 612.1 40.9 (34.5, 47.7) Primary 1 031.1 41.8 (36.7, 47.0) 557.1 33.7 (28.0, 40.0) Secondary 1 486.8 30.6 (27.1, 34.2) 823.7 24.2 (20.6, 28.2) University 794.3 17.7 (15.4, 20.4) 652.5 16.6 (14.2, 19.4)
Region Bangkok 430.1 21.2 (18.0, 24.8) 324.2 20.4 (16.9, 24.3) Central 1 236.0 27.8 (23.9, 32.1) 784.5 23.3 (19.4, 27.8) Northern 658.5 27.4 (22.3, 33.1) 459.4 23.7 (18.5, 29.9) Northeastern 1 054.9 34.4 (28.8, 40.6) 663.2 28.2 (22.6, 34.7) Southern 811.7 44.4 (35.9, 53.1) 414.0 33.5 (25.4, 42.6)
Socioeconomic status Lowest 324.0 54.7 (43.1, 65.8) 213.5 49.4 (36.6, 62.4) Low 714.9 41.9 (36.1, 47.9) 487.1 36.5 (30.0, 43.4) Middle 1 089.6 32.5 (28.5, 36.9) 629.8 25.4 (21.3, 30.1) High 1 101.4 26.4 (23.1, 30.0) 624.9 20.4 (17.0, 24.3) Highest 959.6 24.4 (21.4, 27.6) 690.1 21.8 (18.7, 25.1)
1 In the past 30 days Note: Among those respondents who work outside the home and who usually work indoors
Global Adult Tobacco Survey : Thailand Report, 2011 6-3

6-4
6.1.3 Exposure to SHS in public places
The updated MoPH Notification No. 19: Designating name or types of Public places where non-smoker's health is under protection and designating a zone or all area of such places to be a smoking Area or a Non-Smoking Area Pursuant to the Non-Smoker's Health Protection Act 1992, was enacted on 28 June 2010. The notification also indicates that the following places shall be designated as non-smoking areas in their entirety: (1) health-care facilities, (2) educational establishments, except higher education institutes (or universities), which shall be smoke free only up to the built-up or structured areas, (3) public places where people gather together such as markets, entertainment places, or places that sell food, beverages or food and beverages, with or without an air-conditioning system, (4) public vehicles and bus stations which are in service, either with or without passengers, and (5) religious places or places for performing religious rites of various religions and sects.
Table 6.3 shows the prevalence of exposure to SHS at various public places among adults who visited those places in the past 30 days and Table 6.3a (in Appendix D, based on Table 6.3) presents the estimated number of adults who were exposed to SHS while visiting various public places in the past 30 days.
Table 6.3 shows that the three public places with the highest exposure to SHS among adults aged 15 years and above were markets (68.8%), bars or night clubs (68.4%), and restaurants or any place that sold food, beverages, or food and beverages, both with and without an air-conditioning system (46.9%).
There was no significant difference in exposure to SHS at government buildings, health-care facilities, public transportation, universities, and bars or night clubs. Men were more significantly exposed to SHS than women at restaurants, schools and markets. By residence, exposure to SHS in rural areas was significantly higher than that in urban areas in restaurants and schools, while exposure to SHS in public transport in urban areas was significantly higher than in rural areas. By age group, the youngest age group of 15–24 years had significantly higher exposure to SHS at various places (government buildings, restaurants, public transportation, schools, universities, markets) as compared to the other age groups.
There was no significant difference in exposure to SHS at all sites by education level, especially between those with the lowest and the highest education level, except at university sites, where those with university-level education level were significantly more exposed to SHS than those with less than primary education. Those living in the Southern region had the highest exposure to SHS in all public places as compared to people in other regions. By SES, people in the lowest SES were significantly more exposed to SHS at schools than those in the highest SES.
6-4 Second-hand smoke
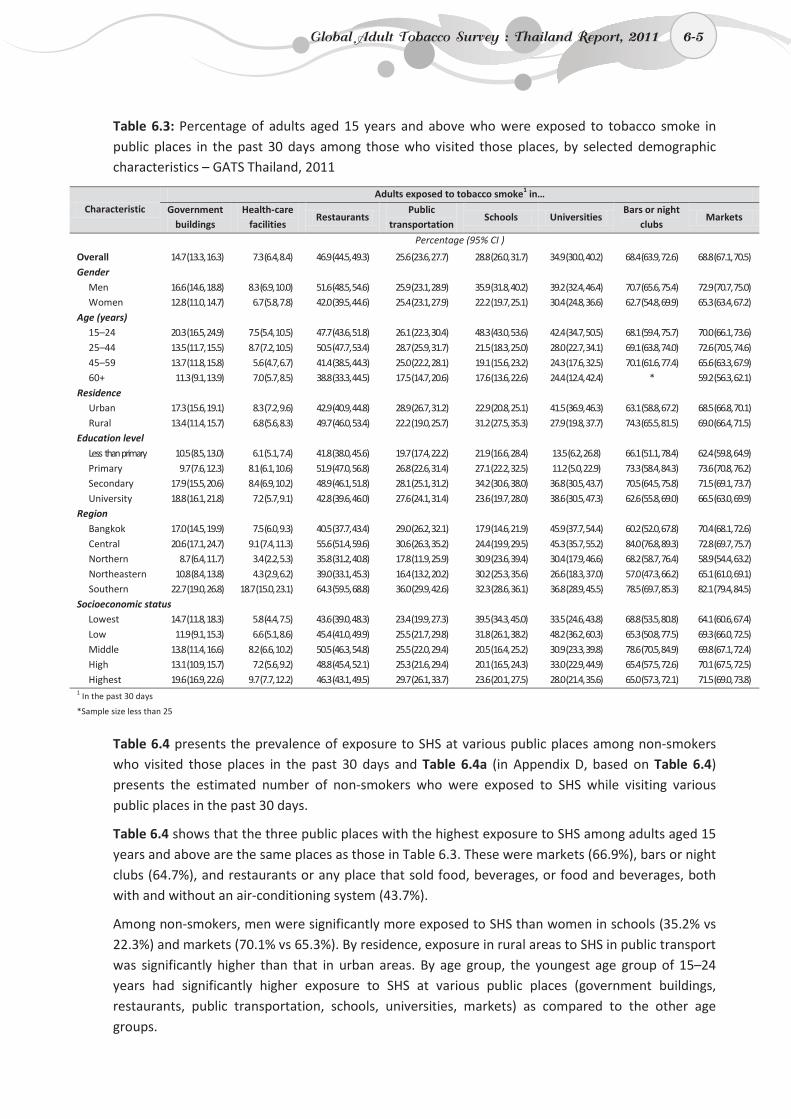
6-5
Table 6.3: Percentage of adults aged 15 years and above who were exposed to tobacco smoke in public places in the past 30 days among those who visited those places, by selected demographic characteristics – GATS Thailand, 2011
Characteristic Adults exposed to tobacco smoke1 in…
Government buildings
Health-care facilities
Restaurants Public
transportation Schools Universities
Bars or night clubs
Markets
Percentage (95% CI )
Overall 14.7 (13.3, 16.3) 7.3 (6.4, 8.4) 46.9 (44.5, 49.3) 25.6 (23.6, 27.7) 28.8 (26.0, 31.7) 34.9 (30.0, 40.2) 68.4 (63.9, 72.6) 68.8 (67.1, 70.5) Gender
Men 16.6 (14.6, 18.8) 8.3 (6.9, 10.0) 51.6 (48.5, 54.6) 25.9 (23.1, 28.9) 35.9 (31.8, 40.2) 39.2 (32.4, 46.4) 70.7 (65.6, 75.4) 72.9 (70.7, 75.0) Women 12.8 (11.0, 14.7) 6.7 (5.8, 7.8) 42.0 (39.5, 44.6) 25.4 (23.1, 27.9) 22.2 (19.7, 25.1) 30.4 (24.8, 36.6) 62.7 (54.8, 69.9) 65.3 (63.4, 67.2)
Age (years) 15–24 20.3 (16.5, 24.9) 7.5 (5.4, 10.5) 47.7 (43.6, 51.8) 26.1 (22.3, 30.4) 48.3 (43.0, 53.6) 42.4 (34.7, 50.5) 68.1 (59.4, 75.7) 70.0 (66.1, 73.6) 25–44 13.5 (11.7, 15.5) 8.7 (7.2, 10.5) 50.5 (47.7, 53.4) 28.7 (25.9, 31.7) 21.5 (18.3, 25.0) 28.0 (22.7, 34.1) 69.1 (63.8, 74.0) 72.6 (70.5, 74.6) 45–59 13.7 (11.8, 15.8) 5.6 (4.7, 6.7) 41.4 (38.5, 44.3) 25.0 (22.2, 28.1) 19.1 (15.6, 23.2) 24.3 (17.6, 32.5) 70.1 (61.6, 77.4) 65.6 (63.3, 67.9) 60+ 11.3 (9.1, 13.9) 7.0 (5.7, 8.5) 38.8 (33.3, 44.5) 17.5 (14.7, 20.6) 17.6 (13.6, 22.6) 24.4 (12.4, 42.4) * 59.2 (56.3, 62.1)
Residence Urban 17.3 (15.6, 19.1) 8.3 (7.2, 9.6) 42.9 (40.9, 44.8) 28.9 (26.7, 31.2) 22.9 (20.8, 25.1) 41.5 (36.9, 46.3) 63.1 (58.8, 67.2) 68.5 (66.8, 70.1) Rural 13.4 (11.4, 15.7) 6.8 (5.6, 8.3) 49.7 (46.0, 53.4) 22.2 (19.0, 25.7) 31.2 (27.5, 35.3) 27.9 (19.8, 37.7) 74.3 (65.5, 81.5) 69.0 (66.4, 71.5)
Education level Less than primary 10.5 (8.5, 13.0) 6.1 (5.1, 7.4) 41.8 (38.0, 45.6) 19.7 (17.4, 22.2) 21.9 (16.6, 28.4) 13.5 (6.2, 26.8) 66.1 (51.1, 78.4) 62.4 (59.8, 64.9) Primary 9.7 (7.6, 12.3) 8.1 (6.1, 10.6) 51.9 (47.0, 56.8) 26.8 (22.6, 31.4) 27.1 (22.2, 32.5) 11.2 (5.0, 22.9) 73.3 (58.4, 84.3) 73.6 (70.8, 76.2) Secondary 17.9 (15.5, 20.6) 8.4 (6.9, 10.2) 48.9 (46.1, 51.8) 28.1 (25.1, 31.2) 34.2 (30.6, 38.0) 36.8 (30.5, 43.7) 70.5 (64.5, 75.8) 71.5 (69.1, 73.7) University 18.8 (16.1, 21.8) 7.2 (5.7, 9.1) 42.8 (39.6, 46.0) 27.6 (24.1, 31.4) 23.6 (19.7, 28.0) 38.6 (30.5, 47.3) 62.6 (55.8, 69.0) 66.5 (63.0, 69.9)
Region Bangkok 17.0 (14.5, 19.9) 7.5 (6.0, 9.3) 40.5 (37.7, 43.4) 29.0 (26.2, 32.1) 17.9 (14.6, 21.9) 45.9 (37.7, 54.4) 60.2 (52.0, 67.8) 70.4 (68.1, 72.6) Central 20.6 (17.1, 24.7) 9.1 (7.4, 11.3) 55.6 (51.4, 59.6) 30.6 (26.3, 35.2) 24.4 (19.9, 29.5) 45.3 (35.7, 55.2) 84.0 (76.8, 89.3) 72.8 (69.7, 75.7) Northern 8.7 (6.4, 11.7) 3.4 (2.2, 5.3) 35.8 (31.2, 40.8) 17.8 (11.9, 25.9) 30.9 (23.6, 39.4) 30.4 (17.9, 46.6) 68.2 (58.7, 76.4) 58.9 (54.4, 63.2) Northeastern 10.8 (8.4, 13.8) 4.3 (2.9, 6.2) 39.0 (33.1, 45.3) 16.4 (13.2, 20.2) 30.2 (25.3, 35.6) 26.6 (18.3, 37.0) 57.0 (47.3, 66.2) 65.1 (61.0, 69.1) Southern 22.7 (19.0, 26.8) 18.7 (15.0, 23.1) 64.3 (59.5, 68.8) 36.0 (29.9, 42.6) 32.3 (28.6, 36.1) 36.8 (28.9, 45.5) 78.5 (69.7, 85.3) 82.1 (79.4, 84.5)
Socioeconomic status
Lowest 14.7 (11.8, 18.3) 5.8 (4.4, 7.5) 43.6 (39.0, 48.3) 23.4 (19.9, 27.3) 39.5 (34.3, 45.0) 33.5 (24.6, 43.8) 68.8 (53.5, 80.8) 64.1 (60.6, 67.4) Low 11.9 (9.1, 15.3) 6.6 (5.1, 8.6) 45.4 (41.0, 49.9) 25.5 (21.7, 29.8) 31.8 (26.1, 38.2) 48.2 (36.2, 60.3) 65.3 (50.8, 77.5) 69.3 (66.0, 72.5) Middle 13.8 (11.4, 16.6) 8.2 (6.6, 10.2) 50.5 (46.3, 54.8) 25.5 (22.0, 29.4) 20.5 (16.4, 25.2) 30.9 (23.3, 39.8) 78.6 (70.5, 84.9) 69.8 (67.1, 72.4) High 13.1 (10.9, 15.7) 7.2 (5.6, 9.2) 48.8 (45.4, 52.1) 25.3 (21.6, 29.4) 20.1 (16.5, 24.3) 33.0 (22.9, 44.9) 65.4 (57.5, 72.6) 70.1 (67.5, 72.5) Highest 19.6 (16.9, 22.6) 9.7 (7.7, 12.2) 46.3 (43.1, 49.5) 29.7 (26.1, 33.7) 23.6 (20.1, 27.5) 28.0 (21.4, 35.6) 65.0 (57.3, 72.1) 71.5 (69.0, 73.8)
1 In the past 30 days
*Sample size less than 25
Table 6.4 presents the prevalence of exposure to SHS at various public places among non-smokers who visited those places in the past 30 days and Table 6.4a (in Appendix D, based on Table 6.4) presents the estimated number of non-smokers who were exposed to SHS while visiting various public places in the past 30 days.
Table 6.4 shows that the three public places with the highest exposure to SHS among adults aged 15 years and above are the same places as those in Table 6.3. These were markets (66.9%), bars or night clubs (64.7%), and restaurants or any place that sold food, beverages, or food and beverages, both with and without an air-conditioning system (43.7%).
Among non-smokers, men were significantly more exposed to SHS than women in schools (35.2% vs 22.3%) and markets (70.1% vs 65.3%). By residence, exposure in rural areas to SHS in public transport was significantly higher than that in urban areas. By age group, the youngest age group of 15–24 years had significantly higher exposure to SHS at various public places (government buildings, restaurants, public transportation, schools, universities, markets) as compared to the other age groups.
Global Adult Tobacco Survey : Thailand Report, 2011 6-5
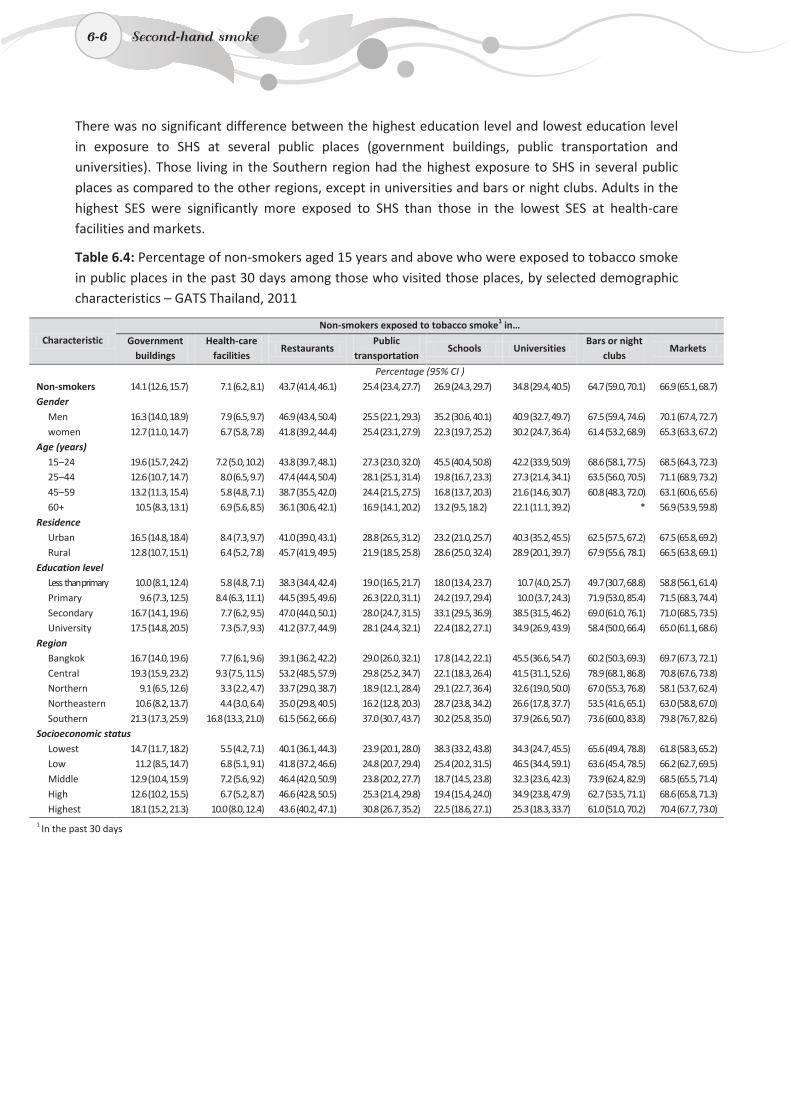
6-6
There was no significant difference between the highest education level and lowest education level in exposure to SHS at several public places (government buildings, public transportation and universities). Those living in the Southern region had the highest exposure to SHS in several public places as compared to the other regions, except in universities and bars or night clubs. Adults in the highest SES were significantly more exposed to SHS than those in the lowest SES at health-care facilities and markets.
Table 6.4: Percentage of non-smokers aged 15 years and above who were exposed to tobacco smoke in public places in the past 30 days among those who visited those places, by selected demographic characteristics – GATS Thailand, 2011
Characteristic Non-smokers exposed to tobacco smoke1 in…
Government buildings
Health-care facilities
Restaurants Public
transportation Schools Universities
Bars or night clubs
Markets
Percentage (95% CI ) Non-smokers 14.1 (12.6, 15.7) 7.1 (6.2, 8.1) 43.7 (41.4, 46.1) 25.4 (23.4, 27.7) 26.9 (24.3, 29.7) 34.8 (29.4, 40.5) 64.7 (59.0, 70.1) 66.9 (65.1, 68.7) Gender
Men 16.3 (14.0, 18.9) 7.9 (6.5, 9.7) 46.9 (43.4, 50.4) 25.5 (22.1, 29.3) 35.2 (30.6, 40.1) 40.9 (32.7, 49.7) 67.5 (59.4, 74.6) 70.1 (67.4, 72.7) women 12.7 (11.0, 14.7) 6.7 (5.8, 7.8) 41.8 (39.2, 44.4) 25.4 (23.1, 27.9) 22.3 (19.7, 25.2) 30.2 (24.7, 36.4) 61.4 (53.2, 68.9) 65.3 (63.3, 67.2)
Age (years) 15–24 19.6 (15.7, 24.2) 7.2 (5.0, 10.2) 43.8 (39.7, 48.1) 27.3 (23.0, 32.0) 45.5 (40.4, 50.8) 42.2 (33.9, 50.9) 68.6 (58.1, 77.5) 68.5 (64.3, 72.3) 25–44 12.6 (10.7, 14.7) 8.0 (6.5, 9.7) 47.4 (44.4, 50.4) 28.1 (25.1, 31.4) 19.8 (16.7, 23.3) 27.3 (21.4, 34.1) 63.5 (56.0, 70.5) 71.1 (68.9, 73.2) 45–59 13.2 (11.3, 15.4) 5.8 (4.8, 7.1) 38.7 (35.5, 42.0) 24.4 (21.5, 27.5) 16.8 (13.7, 20.3) 21.6 (14.6, 30.7) 60.8 (48.3, 72.0) 63.1 (60.6, 65.6) 60+ 10.5 (8.3, 13.1) 6.9 (5.6, 8.5) 36.1 (30.6, 42.1) 16.9 (14.1, 20.2) 13.2 (9.5, 18.2) 22.1 (11.1, 39.2) * 56.9 (53.9, 59.8)
Residence Urban 16.5 (14.8, 18.4) 8.4 (7.3, 9.7) 41.0 (39.0, 43.1) 28.8 (26.5, 31.2) 23.2 (21.0, 25.7) 40.3 (35.2, 45.5) 62.5 (57.5, 67.2) 67.5 (65.8, 69.2) Rural 12.8 (10.7, 15.1) 6.4 (5.2, 7.8) 45.7 (41.9, 49.5) 21.9 (18.5, 25.8) 28.6 (25.0, 32.4) 28.9 (20.1, 39.7) 67.9 (55.6, 78.1) 66.5 (63.8, 69.1)
Education level Less than primary 10.0 (8.1, 12.4) 5.8 (4.8, 7.1) 38.3 (34.4, 42.4) 19.0 (16.5, 21.7) 18.0 (13.4, 23.7) 10.7 (4.0, 25.7) 49.7 (30.7, 68.8) 58.8 (56.1, 61.4) Primary 9.6 (7.3, 12.5) 8.4 (6.3, 11.1) 44.5 (39.5, 49.6) 26.3 (22.0, 31.1) 24.2 (19.7, 29.4) 10.0 (3.7, 24.3) 71.9 (53.0, 85.4) 71.5 (68.3, 74.4) Secondary 16.7 (14.1, 19.6) 7.7 (6.2, 9.5) 47.0 (44.0, 50.1) 28.0 (24.7, 31.5) 33.1 (29.5, 36.9) 38.5 (31.5, 46.2) 69.0 (61.0, 76.1) 71.0 (68.5, 73.5) University 17.5 (14.8, 20.5) 7.3 (5.7, 9.3) 41.2 (37.7, 44.9) 28.1 (24.4, 32.1) 22.4 (18.2, 27.1) 34.9 (26.9, 43.9) 58.4 (50.0, 66.4) 65.0 (61.1, 68.6)
Region Bangkok 16.7 (14.0, 19.6) 7.7 (6.1, 9.6) 39.1 (36.2, 42.2) 29.0 (26.0, 32.1) 17.8 (14.2, 22.1) 45.5 (36.6, 54.7) 60.2 (50.3, 69.3) 69.7 (67.3, 72.1) Central 19.3 (15.9, 23.2) 9.3 (7.5, 11.5) 53.2 (48.5, 57.9) 29.8 (25.2, 34.7) 22.1 (18.3, 26.4) 41.5 (31.1, 52.6) 78.9 (68.1, 86.8) 70.8 (67.6, 73.8) Northern 9.1 (6.5, 12.6) 3.3 (2.2, 4.7) 33.7 (29.0, 38.7) 18.9 (12.1, 28.4) 29.1 (22.7, 36.4) 32.6 (19.0, 50.0) 67.0 (55.3, 76.8) 58.1 (53.7, 62.4) Northeastern 10.6 (8.2, 13.7) 4.4 (3.0, 6.4) 35.0 (29.8, 40.5) 16.2 (12.8, 20.3) 28.7 (23.8, 34.2) 26.6 (17.8, 37.7) 53.5 (41.6, 65.1) 63.0 (58.8, 67.0) Southern 21.3 (17.3, 25.9) 16.8 (13.3, 21.0) 61.5 (56.2, 66.6) 37.0 (30.7, 43.7) 30.2 (25.8, 35.0) 37.9 (26.6, 50.7) 73.6 (60.0, 83.8) 79.8 (76.7, 82.6)
Socioeconomic status Lowest 14.7 (11.7, 18.2) 5.5 (4.2, 7.1) 40.1 (36.1, 44.3) 23.9 (20.1, 28.0) 38.3 (33.2, 43.8) 34.3 (24.7, 45.5) 65.6 (49.4, 78.8) 61.8 (58.3, 65.2) Low 11.2 (8.5, 14.7) 6.8 (5.1, 9.1) 41.8 (37.2, 46.6) 24.8 (20.7, 29.4) 25.4 (20.2, 31.5) 46.5 (34.4, 59.1) 63.6 (45.4, 78.5) 66.2 (62.7, 69.5) Middle 12.9 (10.4, 15.9) 7.2 (5.6, 9.2) 46.4 (42.0, 50.9) 23.8 (20.2, 27.7) 18.7 (14.5, 23.8) 32.3 (23.6, 42.3) 73.9 (62.4, 82.9) 68.5 (65.5, 71.4) High 12.6 (10.2, 15.5) 6.7 (5.2, 8.7) 46.6 (42.8, 50.5) 25.3 (21.4, 29.8) 19.4 (15.4, 24.0) 34.9 (23.8, 47.9) 62.7 (53.5, 71.1) 68.6 (65.8, 71.3) Highest 18.1 (15.2, 21.3) 10.0 (8.0, 12.4) 43.6 (40.2, 47.1) 30.8 (26.7, 35.2) 22.5 (18.6, 27.1) 25.3 (18.3, 33.7) 61.0 (51.0, 70.2) 70.4 (67.7, 73.0)
1 In the past 30 days
6-6 Second-hand smoke
6-7
6.2 Comparison of exposure to situations with second-hand smoke in 2009 and 2011
Comparison of the key findings between 2009 and 2011
o There was a significant increase in the overall prevalence of exposure to second-hand smoke (SHS) among workers at their indoor workplaces between 2009 (27.2%) and 2011 (30.5%).
o There was a significant increase in the overall prevalence of exposure to SHS among people in their homes (from 33.2% in 2009 to 36.0% in 2011).
o There was a significant increase in the prevalence of exposure to SHS among people at health-care facilities (from 4.8% in 2009 to 7.3% in 2011), and in public transportation (from 21.6% in 2009 to 25.6% in 2011).
Comparisons of exposure to SHS in 2009 and 2011 cover three places – at work, at home and in public places.
6.2.1 Exposure to SHS in indoor areas at work in 2009 and 2011
Table 6.5 presents the prevalence of exposure to SHS in indoor areas at workplaces, among overall workers and non-smokers during the past 30 days, by demographic characteristics.
The results showed an increasing rate of exposure to SHS at indoor workplaces in 2011 as compared to 2009 among all workers. The overall percentage of adults exposed to tobacco smoke at the workplace increased from 27.2% in 2009 to 30.5% in 2011. An increase was noticed among women, those in the age group of 25–44 years, those with less than primary education, and those in the lowest SES.
Between 2009 and 2011, among non-smokers, the percentage of adults exposed to tobacco smoke at the workplace increased among women, those in the in age group of 45–59 years, those with less than primary education and those in the lowest SES (from 29.6% in 2009 to 49.4% in 2011).
Global Adult Tobacco Survey : Thailand Report, 2011 6-7
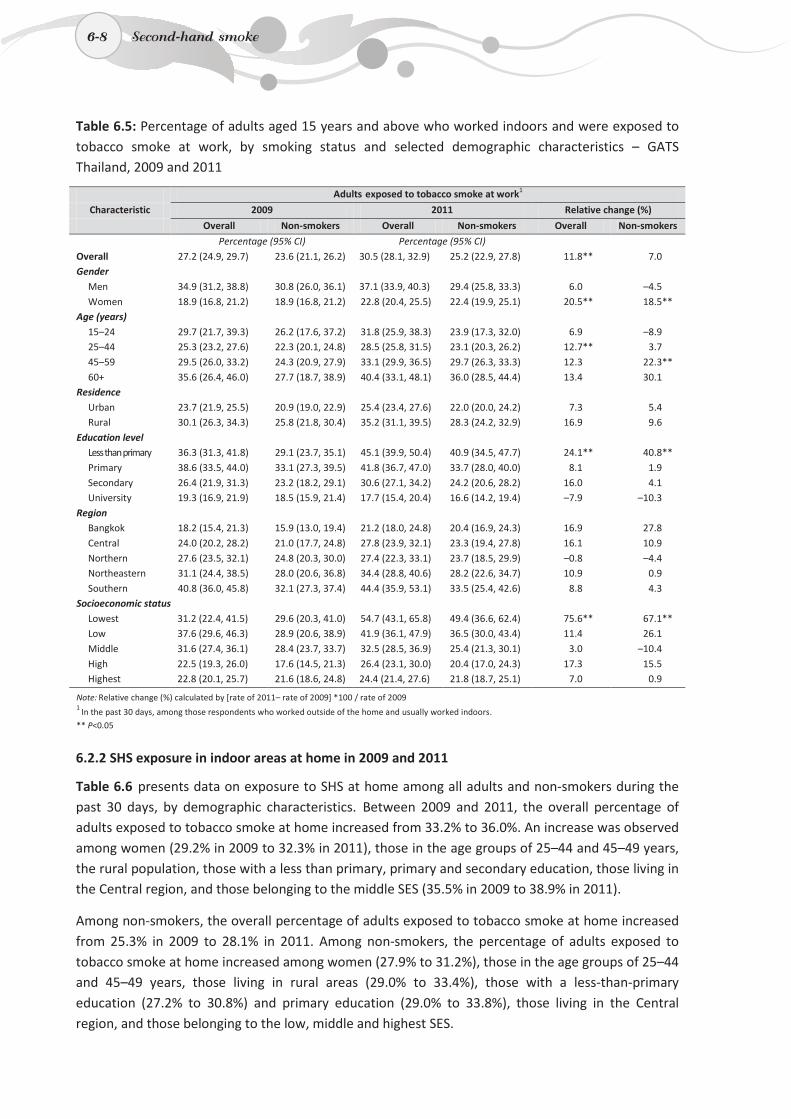
6-8
Table 6.5: Percentage of adults aged 15 years and above who worked indoors and were exposed to tobacco smoke at work, by smoking status and selected demographic characteristics – GATS Thailand, 2009 and 2011
Adults exposed to tobacco smoke at work1
Characteristic 2009 2011 Relative change (%)
Overall Non-smokers Overall Non-smokers Overall Non-smokers
Percentage (95% CI) Percentage (95% CI) Overall 27.2 (24.9, 29.7) 23.6 (21.1, 26.2) 30.5 (28.1, 32.9) 25.2 (22.9, 27.8) 11.8** 7.0 Gender
Men 34.9 (31.2, 38.8) 30.8 (26.0, 36.1) 37.1 (33.9, 40.3) 29.4 (25.8, 33.3) 6.0 –4.5 Women 18.9 (16.8, 21.2) 18.9 (16.8, 21.2) 22.8 (20.4, 25.5) 22.4 (19.9, 25.1) 20.5** 18.5**
Age (years) 15–24 29.7 (21.7, 39.3) 26.2 (17.6, 37.2) 31.8 (25.9, 38.3) 23.9 (17.3, 32.0) 6.9 –8.9 25–44 25.3 (23.2, 27.6) 22.3 (20.1, 24.8) 28.5 (25.8, 31.5) 23.1 (20.3, 26.2) 12.7** 3.7 45–59 29.5 (26.0, 33.2) 24.3 (20.9, 27.9) 33.1 (29.9, 36.5) 29.7 (26.3, 33.3) 12.3 22.3** 60+ 35.6 (26.4, 46.0) 27.7 (18.7, 38.9) 40.4 (33.1, 48.1) 36.0 (28.5, 44.4) 13.4 30.1
Residence Urban 23.7 (21.9, 25.5) 20.9 (19.0, 22.9) 25.4 (23.4, 27.6) 22.0 (20.0, 24.2) 7.3 5.4 Rural 30.1 (26.3, 34.3) 25.8 (21.8, 30.4) 35.2 (31.1, 39.5) 28.3 (24.2, 32.9) 16.9 9.6
Education level Less than primary 36.3 (31.3, 41.8) 29.1 (23.7, 35.1) 45.1 (39.9, 50.4) 40.9 (34.5, 47.7) 24.1** 40.8** Primary 38.6 (33.5, 44.0) 33.1 (27.3, 39.5) 41.8 (36.7, 47.0) 33.7 (28.0, 40.0) 8.1 1.9 Secondary 26.4 (21.9, 31.3) 23.2 (18.2, 29.1) 30.6 (27.1, 34.2) 24.2 (20.6, 28.2) 16.0 4.1 University 19.3 (16.9, 21.9) 18.5 (15.9, 21.4) 17.7 (15.4, 20.4) 16.6 (14.2, 19.4) –7.9 –10.3
Region Bangkok 18.2 (15.4, 21.3) 15.9 (13.0, 19.4) 21.2 (18.0, 24.8) 20.4 (16.9, 24.3) 16.9 27.8 Central 24.0 (20.2, 28.2) 21.0 (17.7, 24.8) 27.8 (23.9, 32.1) 23.3 (19.4, 27.8) 16.1 10.9 Northern 27.6 (23.5, 32.1) 24.8 (20.3, 30.0) 27.4 (22.3, 33.1) 23.7 (18.5, 29.9) –0.8 –4.4 Northeastern 31.1 (24.4, 38.5) 28.0 (20.6, 36.8) 34.4 (28.8, 40.6) 28.2 (22.6, 34.7) 10.9 0.9 Southern 40.8 (36.0, 45.8) 32.1 (27.3, 37.4) 44.4 (35.9, 53.1) 33.5 (25.4, 42.6) 8.8 4.3
Socioeconomic status Lowest 31.2 (22.4, 41.5) 29.6 (20.3, 41.0) 54.7 (43.1, 65.8) 49.4 (36.6, 62.4) 75.6** 67.1** Low 37.6 (29.6, 46.3) 28.9 (20.6, 38.9) 41.9 (36.1, 47.9) 36.5 (30.0, 43.4) 11.4 26.1 Middle 31.6 (27.4, 36.1) 28.4 (23.7, 33.7) 32.5 (28.5, 36.9) 25.4 (21.3, 30.1) 3.0 –10.4 High 22.5 (19.3, 26.0) 17.6 (14.5, 21.3) 26.4 (23.1, 30.0) 20.4 (17.0, 24.3) 17.3 15.5 Highest 22.8 (20.1, 25.7) 21.6 (18.6, 24.8) 24.4 (21.4, 27.6) 21.8 (18.7, 25.1) 7.0 0.9
Note: Relative change (%) calculated by [rate of 2011– rate of 2009] *100 / rate of 2009
1 In the past 30 days, among those respondents who worked outside of the home and usually worked indoors.
** P<0.05
6.2.2 SHS exposure in indoor areas at home in 2009 and 2011
Table 6.6 presents data on exposure to SHS at home among all adults and non-smokers during the past 30 days, by demographic characteristics. Between 2009 and 2011, the overall percentage of adults exposed to tobacco smoke at home increased from 33.2% to 36.0%. An increase was observed among women (29.2% in 2009 to 32.3% in 2011), those in the age groups of 25–44 and 45–49 years, the rural population, those with a less than primary, primary and secondary education, those living in the Central region, and those belonging to the middle SES (35.5% in 2009 to 38.9% in 2011).
Among non-smokers, the overall percentage of adults exposed to tobacco smoke at home increased from 25.3% in 2009 to 28.1% in 2011. Among non-smokers, the percentage of adults exposed to tobacco smoke at home increased among women (27.9% to 31.2%), those in the age groups of 25–44 and 45–49 years, those living in rural areas (29.0% to 33.4%), those with a less-than-primary education (27.2% to 30.8%) and primary education (29.0% to 33.8%), those living in the Central region, and those belonging to the low, middle and highest SES.
6-8 Second-hand smoke
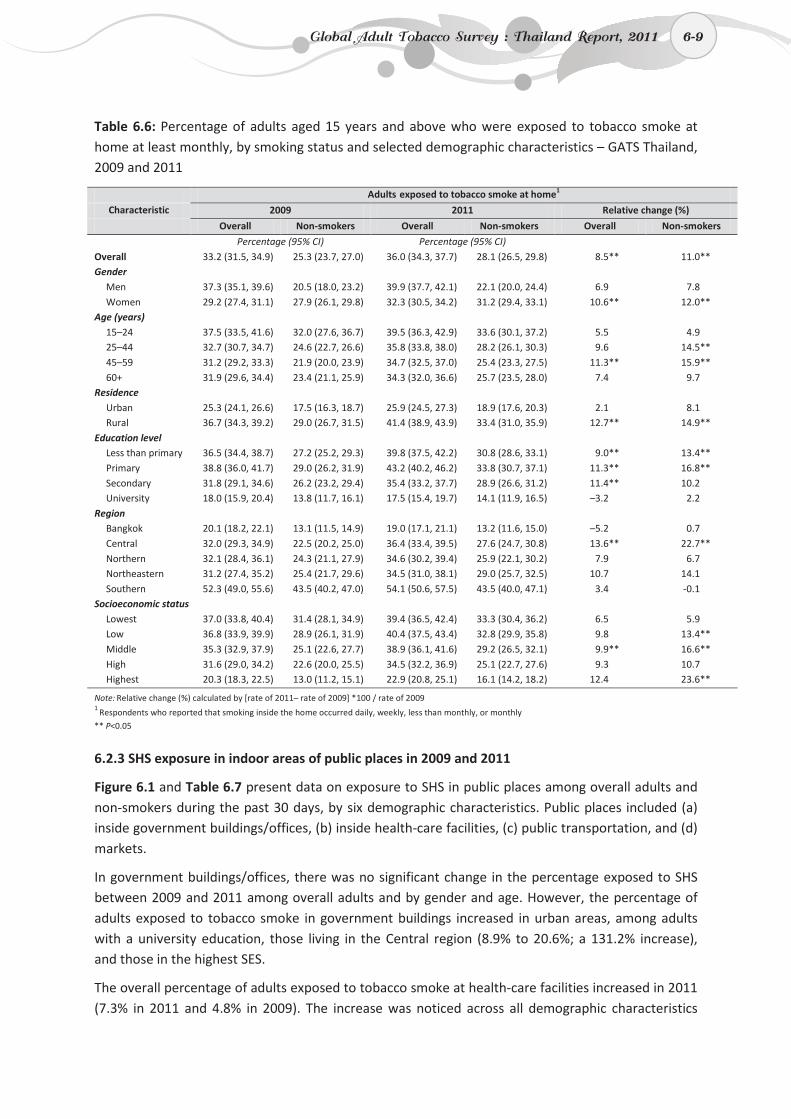
6-9
Table 6.6: Percentage of adults aged 15 years and above who were exposed to tobacco smoke at home at least monthly, by smoking status and selected demographic characteristics – GATS Thailand, 2009 and 2011
Adults exposed to tobacco smoke at home1
Characteristic 2009 2011 Relative change (%)
Overall Non-smokers Overall Non-smokers Overall Non-smokers
Percentage (95% CI) Percentage (95% CI) Overall 33.2 (31.5, 34.9) 25.3 (23.7, 27.0) 36.0 (34.3, 37.7) 28.1 (26.5, 29.8) 8.5** 11.0** Gender
Men 37.3 (35.1, 39.6) 20.5 (18.0, 23.2) 39.9 (37.7, 42.1) 22.1 (20.0, 24.4) 6.9 7.8 Women 29.2 (27.4, 31.1) 27.9 (26.1, 29.8) 32.3 (30.5, 34.2) 31.2 (29.4, 33.1) 10.6** 12.0**
Age (years) 15–24 37.5 (33.5, 41.6) 32.0 (27.6, 36.7) 39.5 (36.3, 42.9) 33.6 (30.1, 37.2) 5.5 4.9 25–44 32.7 (30.7, 34.7) 24.6 (22.7, 26.6) 35.8 (33.8, 38.0) 28.2 (26.1, 30.3) 9.6 14.5** 45–59 31.2 (29.2, 33.3) 21.9 (20.0, 23.9) 34.7 (32.5, 37.0) 25.4 (23.3, 27.5) 11.3** 15.9** 60+ 31.9 (29.6, 34.4) 23.4 (21.1, 25.9) 34.3 (32.0, 36.6) 25.7 (23.5, 28.0) 7.4 9.7
Residence Urban 25.3 (24.1, 26.6) 17.5 (16.3, 18.7) 25.9 (24.5, 27.3) 18.9 (17.6, 20.3) 2.1 8.1 Rural 36.7 (34.3, 39.2) 29.0 (26.7, 31.5) 41.4 (38.9, 43.9) 33.4 (31.0, 35.9) 12.7** 14.9**
Education level Less than primary 36.5 (34.4, 38.7) 27.2 (25.2, 29.3) 39.8 (37.5, 42.2) 30.8 (28.6, 33.1) 9.0** 13.4** Primary 38.8 (36.0, 41.7) 29.0 (26.2, 31.9) 43.2 (40.2, 46.2) 33.8 (30.7, 37.1) 11.3** 16.8** Secondary 31.8 (29.1, 34.6) 26.2 (23.2, 29.4) 35.4 (33.2, 37.7) 28.9 (26.6, 31.2) 11.4** 10.2 University 18.0 (15.9, 20.4) 13.8 (11.7, 16.1) 17.5 (15.4, 19.7) 14.1 (11.9, 16.5) –3.2 2.2
Region Bangkok 20.1 (18.2, 22.1) 13.1 (11.5, 14.9) 19.0 (17.1, 21.1) 13.2 (11.6, 15.0) –5.2 0.7 Central 32.0 (29.3, 34.9) 22.5 (20.2, 25.0) 36.4 (33.4, 39.5) 27.6 (24.7, 30.8) 13.6** 22.7** Northern 32.1 (28.4, 36.1) 24.3 (21.1, 27.9) 34.6 (30.2, 39.4) 25.9 (22.1, 30.2) 7.9 6.7 Northeastern 31.2 (27.4, 35.2) 25.4 (21.7, 29.6) 34.5 (31.0, 38.1) 29.0 (25.7, 32.5) 10.7 14.1 Southern 52.3 (49.0, 55.6) 43.5 (40.2, 47.0) 54.1 (50.6, 57.5) 43.5 (40.0, 47.1) 3.4 -0.1
Socioeconomic status Lowest 37.0 (33.8, 40.4) 31.4 (28.1, 34.9) 39.4 (36.5, 42.4) 33.3 (30.4, 36.2) 6.5 5.9 Low 36.8 (33.9, 39.9) 28.9 (26.1, 31.9) 40.4 (37.5, 43.4) 32.8 (29.9, 35.8) 9.8 13.4** Middle 35.3 (32.9, 37.9) 25.1 (22.6, 27.7) 38.9 (36.1, 41.6) 29.2 (26.5, 32.1) 9.9** 16.6** High 31.6 (29.0, 34.2) 22.6 (20.0, 25.5) 34.5 (32.2, 36.9) 25.1 (22.7, 27.6) 9.3 10.7 Highest 20.3 (18.3, 22.5) 13.0 (11.2, 15.1) 22.9 (20.8, 25.1) 16.1 (14.2, 18.2) 12.4 23.6**
Note: Relative change (%) calculated by [rate of 2011– rate of 2009] *100 / rate of 2009
1 Respondents who reported that smoking inside the home occurred daily, weekly, less than monthly, or monthly
** P<0.05
6.2.3 SHS exposure in indoor areas of public places in 2009 and 2011
Figure 6.1 and Table 6.7 present data on exposure to SHS in public places among overall adults and non-smokers during the past 30 days, by six demographic characteristics. Public places included (a) inside government buildings/offices, (b) inside health-care facilities, (c) public transportation, and (d) markets.
In government buildings/offices, there was no significant change in the percentage exposed to SHS between 2009 and 2011 among overall adults and by gender and age. However, the percentage of adults exposed to tobacco smoke in government buildings increased in urban areas, among adults with a university education, those living in the Central region (8.9% to 20.6%; a 131.2% increase), and those in the highest SES.
The overall percentage of adults exposed to tobacco smoke at health-care facilities increased in 2011 (7.3% in 2011 and 4.8% in 2009). The increase was noticed across all demographic characteristics
Global Adult Tobacco Survey : Thailand Report, 2011 6-9
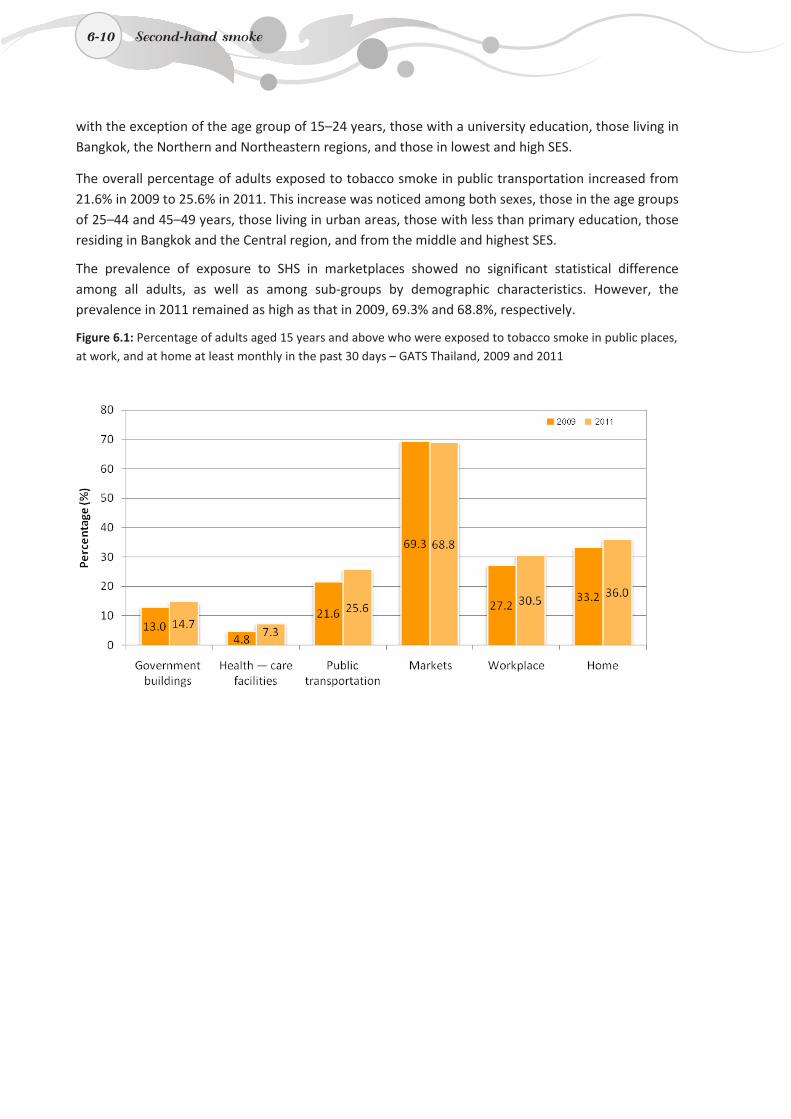
6-10
with the exception of the age group of 15–24 years, those with a university education, those living in Bangkok, the Northern and Northeastern regions, and those in lowest and high SES.
The overall percentage of adults exposed to tobacco smoke in public transportation increased from 21.6% in 2009 to 25.6% in 2011. This increase was noticed among both sexes, those in the age groups of 25–44 and 45–49 years, those living in urban areas, those with less than primary education, those residing in Bangkok and the Central region, and from the middle and highest SES.
The prevalence of exposure to SHS in marketplaces showed no significant statistical difference among all adults, as well as among sub-groups by demographic characteristics. However, the prevalence in 2011 remained as high as that in 2009, 69.3% and 68.8%, respectively.
Figure 6.1: Percentage of adults aged 15 years and above who were exposed to tobacco smoke in public places, at work, and at home at least monthly in the past 30 days – GATS Thailand, 2009 and 2011
6-10 Second-hand smoke
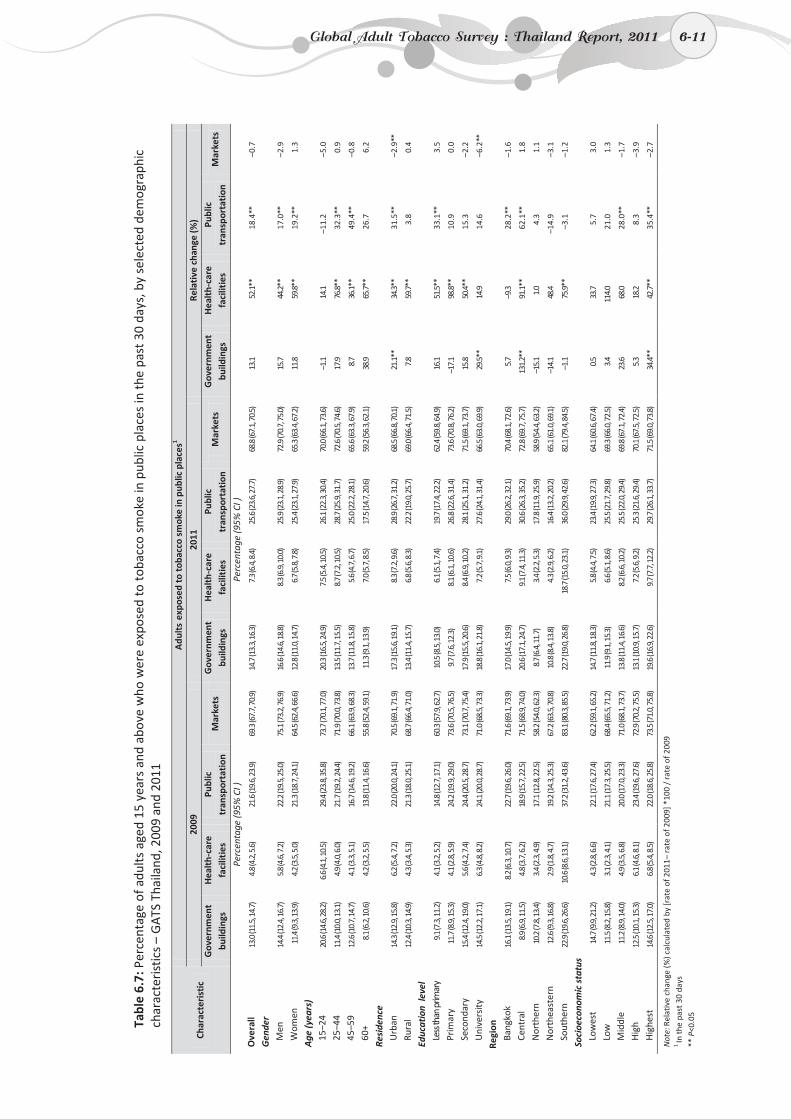
6-11
Ta
ble
6.7:
Per
cent
age
of a
dults
age
d 15
yea
rs a
nd a
bove
who
wer
e ex
pose
d to
tob
acco
sm
oke
in p
ublic
pla
ces
in t
he p
ast
30 d
ays,
by
sele
cted
dem
ogra
phic
ch
arac
teri
stic
s –
GA
TS T
haila
nd, 2
009
and
2011
Char
acte
rist
ic
Adu
lts e
xpos
ed to
toba
cco
smok
e in
pub
lic p
lace
s1
2009
20
11
Rela
tive
cha
nge
(%)
Gov
ernm
ent
build
ings
H
ealt
h-ca
re
faci
litie
s Pu
blic
tr
ansp
orta
tion
M
arke
ts
Gov
ernm
ent
build
ings
H
ealt
h-ca
re
faci
litie
s Pu
blic
tr
ansp
orta
tion
M
arke
ts
Gov
ernm
ent
build
ings
H
ealt
h-ca
re
faci
litie
s Pu
blic
tr
ansp
orta
tion
M
arke
ts
Pe
rcen
tage
(95%
CI )
Pe
rcen
tage
(95%
CI )
Ove
rall
13.0
(11.
5, 14
.7)
4.8 (
4.2,
5.6)
21
.6 (1
9.6,
23.9
) 69
.3 (6
7.7,
70.9
) 14
.7 (1
3.3,
16.3
) 7.
3 (6.
4, 8.
4)
25.6
(23.
6, 27
.7)
68.8
(67.
1, 70
.5)
13.1
52
.1**
18
.4**
–0
.7
Gen
der
Men
14
.4 (1
2.4,
16.7
) 5.
8 (4.
6, 7.
2)
22.2
(19.
5, 25
.0)
75.1
(73.
2, 76
.9)
16.6
(14.
6, 18
.8)
8.3 (
6.9,
10.0
) 25
.9 (2
3.1,
28.9
) 72
.9 (7
0.7,
75.0
) 15
.7
44.2
**
17.0
**
–2.9
Wom
en
11.4
(9.3
, 13.
9)
4.2 (
3.5,
5.0)
21
.3 (1
8.7,
24.1
) 64
.5 (6
2.4,
66.6
) 12
.8 (1
1.0,
14.7
) 6.
7 (5.
8, 7.
8)
25.4
(23.
1, 27
.9)
65.3
(63.
4, 67
.2)
11.8
59
.8**
19
.2**
1.
3
Age
(yea
rs)
15–2
4 20
.6 (1
4.6,
28.2
) 6.
6 (4.
1, 10
.5)
29.4
(23.
8, 35
.8)
73.7
(70.
1, 77
.0)
20.3
(16.
5, 24
.9)
7.5 (
5.4,
10.5
) 26
.1 (2
2.3,
30.4
) 70
.0 (6
6.1,
73.6
) –1
.1
14.1
–1
1.2
–5.0
25–4
4 11
.4 (1
0.0,
13.1
) 4.
9 (4.
0, 6.
0)
21.7
(19.
2, 24
.4)
71.9
(70.
0, 73
.8)
13.5
(11.
7, 15
.5)
8.7 (
7.2,
10.5
) 28
.7 (2
5.9,
31.7
) 72
.6 (7
0.5,
74.6
) 17
.9
76.8
**
32.3
**
0.9
45–5
9 12
.6 (1
0.7,
14.7
) 4.
1 (3.
3, 5.
1)
16.7
(14.
6, 19
.2)
66.1
(63.
9, 68
.3)
13.7
(11.
8, 15
.8)
5.6 (
4.7,
6.7)
25
.0 (2
2.2,
28.1
) 65
.6 (6
3.3,
67.9
) 8.
7 36
.1**
49
.4**
–0
.8
60+
8.1 (
6.2,
10.6
) 4.
2 (3.
2, 5.
5)
13.8
(11.
4, 16
.6)
55.8
(52.
4, 59
.1)
11.3
(9.1
, 13.
9)
7.0 (
5.7,
8.5)
17
.5 (1
4.7,
20.6
) 59
.2 (5
6.3,
62.1
) 38
.9
65.7
**
26.7
6.
2
Resi
denc
e
Urb
an
14.3
(12.
9, 15
.8)
6.2 (
5.4,
7.2)
22
.0 (2
0.0,
24.1
) 70
.5 (6
9.1,
71.9
) 17
.3 (1
5.6,
19.1
) 8.
3 (7.
2, 9.
6)
28.9
(26.
7, 31
.2)
68.5
(66.
8, 70
.1)
21.1
**
34.3
**
31.5
**
–2.9
**
Rura
l 12
.4 (1
0.3,
14.9
) 4.
3 (3.
4, 5.
3)
21.3
(18.
0, 25
.1)
68.7
(66.
4, 71
.0)
13.4
(11.
4, 15
.7)
6.8 (
5.6,
8.3)
22
.2 (1
9.0,
25.7
) 69
.0 (6
6.4,
71.5
) 7.
8 59
.7**
3.
8 0.
4
Educ
atio
n le
vel
Less
than
prim
ary
9.1 (
7.3,
11.2
) 4.
1 (3.
2, 5.
2)
14.8
(12.
7, 17
.1)
60.3
(57.
9, 62
.7)
10.5
(8.5
, 13.
0)
6.1 (
5.1,
7.4)
19
.7 (1
7.4,
22.2
) 62
.4 (5
9.8,
64.9
) 16
.1
51.5
**
33.1
**
3.5
Prim
ary
11.7
(8.9
, 15.
3)
4.1 (
2.8,
5.9)
24
.2 (1
9.9,
29.0
) 73
.6 (7
0.5,
76.5
) 9.
7 (7.
6, 12
.3)
8.1 (
6.1,
10.6
) 26
.8 (2
2.6,
31.4
) 73
.6 (7
0.8,
76.2
) –1
7.1
98.8
**
10.9
0.
0
Seco
ndar
y 15
.4 (1
2.4,
19.0
) 5.
6 (4.
2, 7.
4)
24.4
(20.
5, 28
.7)
73.1
(70.
7, 75
.4)
17.9
(15.
5, 20
.6)
8.4 (
6.9,
10.2
) 28
.1 (2
5.1,
31.2
) 71
.5 (6
9.1,
73.7
) 15
.8
50.4
**
15.3
–2
.2
Uni
vers
ity
14.5
(12.
2, 17
.1)
6.3 (
4.8,
8.2)
24
.1 (2
0.0,
28.7
) 71
.0 (6
8.5,
73.3
) 18
.8 (1
6.1,
21.8
) 7.
2 (5.
7, 9.
1)
27.6
(24.
1, 31
.4)
66.5
(63.
0, 69
.9)
29.5
**
14.9
14
.6
–6.2
**
Regi
on
Bang
kok
16.1
(13.
5, 19
.1)
8.2 (
6.3,
10.7
) 22
.7 (1
9.6,
26.0
) 71
.6 (6
9.1,
73.9
) 17
.0 (1
4.5,
19.9
) 7.
5 (6.
0, 9.
3)
29.0
(26.
2, 32
.1)
70.4
(68.
1, 72
.6)
5.7
–9.3
28
.2**
–1
.6
Cent
ral
8.9 (
6.9,
11.5
) 4.
8 (3.
7, 6.
2)
18.9
(15.
7, 22
.5)
71.5
(68.
9, 74
.0)
20.6
(17.
1, 24
.7)
9.1 (
7.4,
11.3
) 30
.6 (2
6.3,
35.2
) 72
.8 (6
9.7,
75.7
) 13
1.2*
* 91
.1**
62
.1**
1.
8
Nor
ther
n 10
.2 (7
.8, 1
3.4)
3.
4 (2.
3, 4.
9)
17.1
(12.
8, 22
.5)
58.2
(54.
0, 62
.3)
8.7 (
6.4,
11.7
) 3.
4 (2.
2, 5.
3)
17.8
(11.
9, 25
.9)
58.9
(54.
4, 63
.2)
–15.
1 1.
0 4.
3 1.
1
Nor
thea
ster
n 12
.6 (9
.3, 1
6.8)
2.
9 (1.
8, 4.
7)
19.2
(14.
3, 25
.3)
67.2
(63.
5, 70
.8)
10.8
(8.4
, 13.
8)
4.3 (
2.9,
6.2)
16
.4 (1
3.2,
20.2
) 65
.1 (6
1.0,
69.1
) –1
4.1
48.4
–1
4.9
–3.1
Sout
hern
22
.9 (1
9.6,
26.6
) 10
.6 (8
.6, 1
3.1)
37
.2 (3
1.2,
43.6
) 83
.1 (8
0.3,
85.5
) 22
.7 (1
9.0,
26.8
) 18
.7 (1
5.0,
23.1
) 36
.0 (2
9.9,
42.6
) 82
.1 (7
9.4,
84.5
) –1
.1
75.9
**
–3.1
–1
.2
Soci
oeco
nom
ic s
tatu
s
Low
est
14.7
(9.9
, 21.
2)
4.3 (
2.8,
6.6)
22
.1 (1
7.6,
27.4
) 62
.2 (5
9.1,
65.2
) 14
.7 (1
1.8,
18.3
) 5.
8 (4.
4, 7.
5)
23.4
(19.
9, 27
.3)
64.1
(60.
6, 67
.4)
0.5
33.7
5.
7 3.
0
Low
11
.5 (8
.2, 1
5.8)
3.
1 (2.
3, 4.
1)
21.1
(17.
3, 25
.5)
68.4
(65.
5, 71
.2)
11.9
(9.1
, 15.
3)
6.6 (
5.1,
8.6)
25
.5 (2
1.7,
29.8
) 69
.3 (6
6.0,
72.5
) 3.
4 11
4.0
21.0
1.
3
Mid
dle
11.2
(8.9
, 14.
0)
4.9 (
3.5,
6.8)
20
.0 (1
7.0,
23.3
) 71
.0 (6
8.1,
73.7
) 13
.8 (1
1.4,
16.6
) 8.
2 (6.
6, 10
.2)
25.5
(22.
0, 29
.4)
69.8
(67.
1, 72
.4)
23.6
68
.0
28.0
**
–1.7
Hig
h 12
.5 (1
0.1,
15.3
) 6.
1 (4.
6, 8.
1)
23.4
(19.
6, 27
.6)
72.9
(70.
2, 75
.5)
13.1
(10.
9, 15
.7)
7.2 (
5.6,
9.2)
25
.3 (2
1.6,
29.4
) 70
.1 (6
7.5,
72.5
) 5.
3 18
.2
8.3
–3.9
Hig
hest
14
.6 (1
2.5,
17.0
) 6.
8 (5.
4, 8.
5)
22.0
(18.
6, 25
.8)
73.5
(71.
0, 75
.8)
19.6
(16.
9, 22
.6)
9.7 (
7.7,
12.2
) 29
.7 (2
6.1,
33.7
) 71
.5 (6
9.0,
73.8
) 34
.4**
42
.7**
35
.4**
–2
.7
Not
e: Re
lativ
e ch
ange
(%) c
alcu
late
d by
[rat
e of
201
1– ra
te o
f 200
9] *
100
/ ra
te o
f 200
9
1 In
the
past
30
days
**
P<0
.05
Global Adult Tobacco Survey : Thailand Report, 2011 6-11

7. Economics
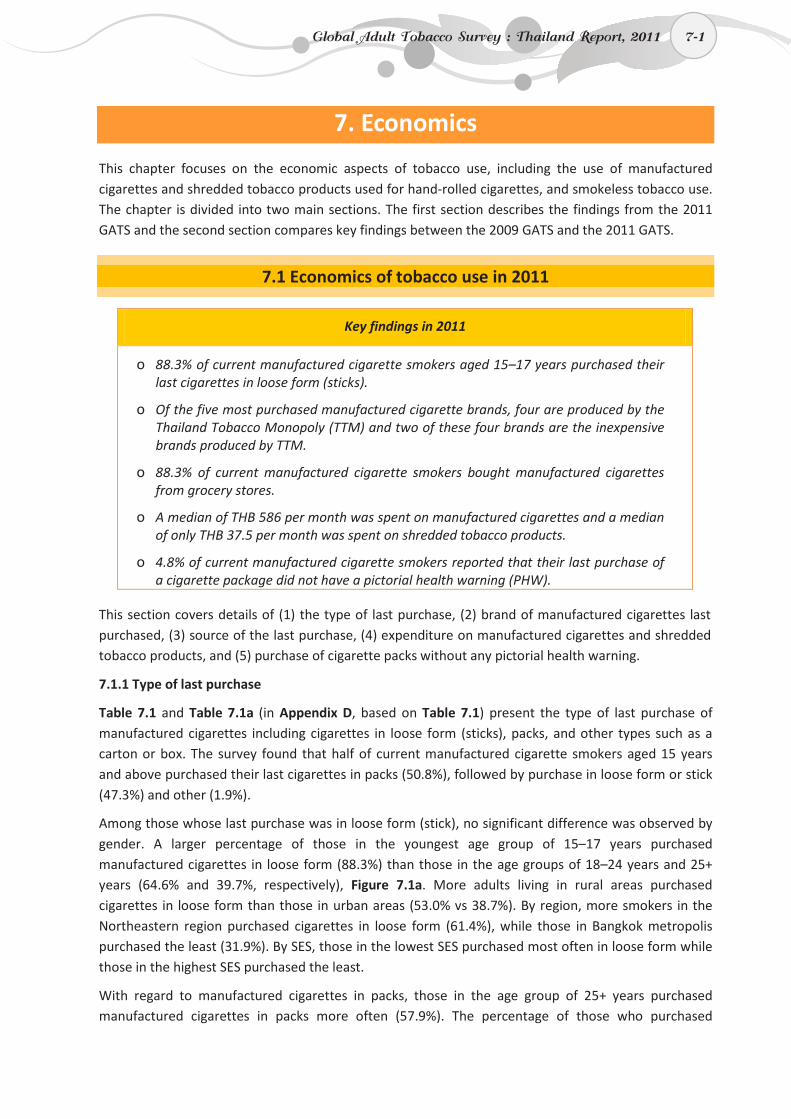
7-1
7. Economics
This chapter focuses on the economic aspects of tobacco use, including the use of manufactured cigarettes and shredded tobacco products used for hand-rolled cigarettes, and smokeless tobacco use. The chapter is divided into two main sections. The first section describes the findings from the 2011 GATS and the second section compares key findings between the 2009 GATS and the 2011 GATS.
7.1 Economics of tobacco use in 2011
Key findings in 2011
o 88.3% of current manufactured cigarette smokers aged 15–17 years purchased their last cigarettes in loose form (sticks).
o Of the five most purchased manufactured cigarette brands, four are produced by the Thailand Tobacco Monopoly (TTM) and two of these four brands are the inexpensive brands produced by TTM.
o 88.3% of current manufactured cigarette smokers bought manufactured cigarettes from grocery stores.
o A median of THB 586 per month was spent on manufactured cigarettes and a median of only THB 37.5 per month was spent on shredded tobacco products.
o 4.8% of current manufactured cigarette smokers reported that their last purchase of a cigarette package did not have a pictorial health warning (PHW).
This section covers details of (1) the type of last purchase, (2) brand of manufactured cigarettes last purchased, (3) source of the last purchase, (4) expenditure on manufactured cigarettes and shredded tobacco products, and (5) purchase of cigarette packs without any pictorial health warning.
7.1.1 Type of last purchase
Table 7.1 and Table 7.1a (in Appendix D, based on Table 7.1) present the type of last purchase of manufactured cigarettes including cigarettes in loose form (sticks), packs, and other types such as a carton or box. The survey found that half of current manufactured cigarette smokers aged 15 years and above purchased their last cigarettes in packs (50.8%), followed by purchase in loose form or stick (47.3%) and other (1.9%).
Among those whose last purchase was in loose form (stick), no significant difference was observed by gender. A larger percentage of those in the youngest age group of 15–17 years purchased manufactured cigarettes in loose form (88.3%) than those in the age groups of 18–24 years and 25+ years (64.6% and 39.7%, respectively), Figure 7.1a. More adults living in rural areas purchased cigarettes in loose form than those in urban areas (53.0% vs 38.7%). By region, more smokers in the Northeastern region purchased cigarettes in loose form (61.4%), while those in Bangkok metropolis purchased the least (31.9%). By SES, those in the lowest SES purchased most often in loose form while those in the highest SES purchased the least.
With regard to manufactured cigarettes in packs, those in the age group of 25+ years purchased manufactured cigarettes in packs more often (57.9%). The percentage of those who purchased
Global Adult Tobacco Survey : Thailand Report, 2011 7-1
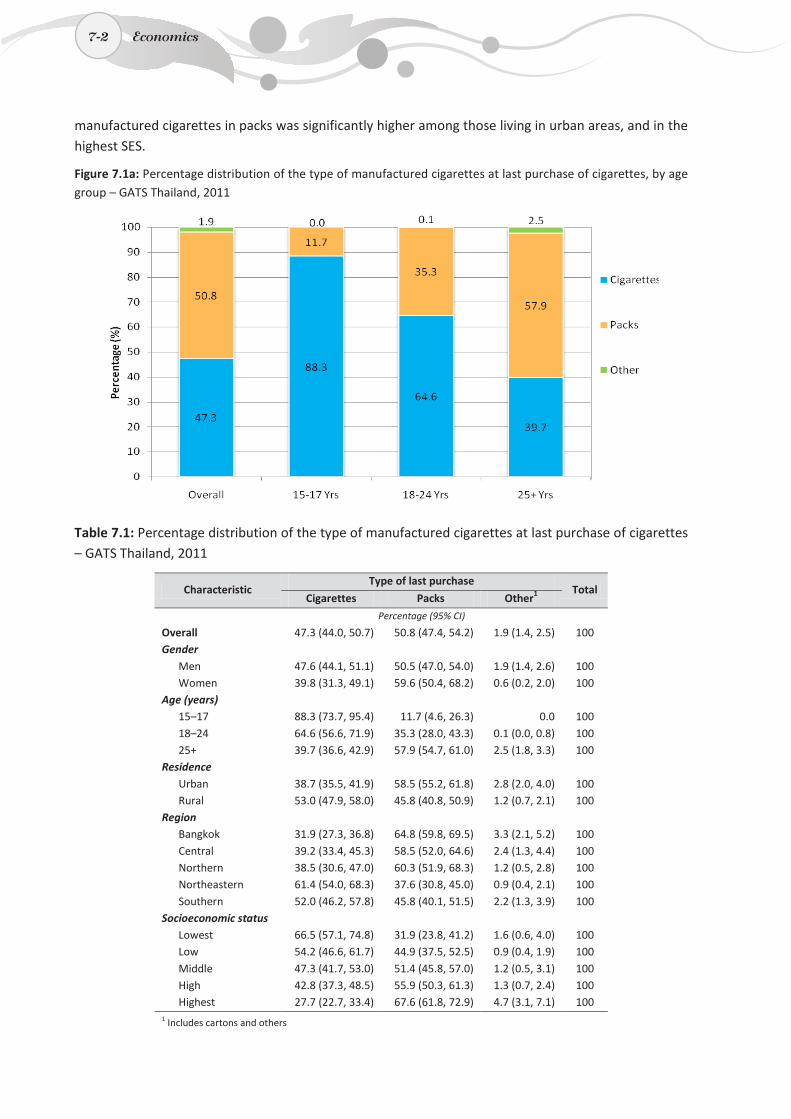
7-2
manufactured cigarettes in packs was significantly higher among those living in urban areas, and in the highest SES.
Figure 7.1a: Percentage distribution of the type of manufactured cigarettes at last purchase of cigarettes, by age group – GATS Thailand, 2011
Table 7.1: Percentage distribution of the type of manufactured cigarettes at last purchase of cigarettes – GATS Thailand, 2011
Characteristic Type of last purchase
Total Cigarettes Packs Other1
Percentage (95% CI) Overall 47.3 (44.0, 50.7) 50.8 (47.4, 54.2) 1.9 (1.4, 2.5) 100 Gender
Men 47.6 (44.1, 51.1) 50.5 (47.0, 54.0) 1.9 (1.4, 2.6) 100 Women 39.8 (31.3, 49.1) 59.6 (50.4, 68.2) 0.6 (0.2, 2.0) 100
Age (years) 15–17 88.3 (73.7, 95.4) 11.7 (4.6, 26.3) 0.0 100 18–24 64.6 (56.6, 71.9) 35.3 (28.0, 43.3) 0.1 (0.0, 0.8) 100 25+ 39.7 (36.6, 42.9) 57.9 (54.7, 61.0) 2.5 (1.8, 3.3) 100
Residence Urban 38.7 (35.5, 41.9) 58.5 (55.2, 61.8) 2.8 (2.0, 4.0) 100 Rural 53.0 (47.9, 58.0) 45.8 (40.8, 50.9) 1.2 (0.7, 2.1) 100
Region Bangkok 31.9 (27.3, 36.8) 64.8 (59.8, 69.5) 3.3 (2.1, 5.2) 100 Central 39.2 (33.4, 45.3) 58.5 (52.0, 64.6) 2.4 (1.3, 4.4) 100 Northern 38.5 (30.6, 47.0) 60.3 (51.9, 68.3) 1.2 (0.5, 2.8) 100 Northeastern 61.4 (54.0, 68.3) 37.6 (30.8, 45.0) 0.9 (0.4, 2.1) 100 Southern 52.0 (46.2, 57.8) 45.8 (40.1, 51.5) 2.2 (1.3, 3.9) 100
Socioeconomic status Lowest 66.5 (57.1, 74.8) 31.9 (23.8, 41.2) 1.6 (0.6, 4.0) 100 Low 54.2 (46.6, 61.7) 44.9 (37.5, 52.5) 0.9 (0.4, 1.9) 100 Middle 47.3 (41.7, 53.0) 51.4 (45.8, 57.0) 1.2 (0.5, 3.1) 100 High 42.8 (37.3, 48.5) 55.9 (50.3, 61.3) 1.3 (0.7, 2.4) 100 Highest 27.7 (22.7, 33.4) 67.6 (61.8, 72.9) 4.7 (3.1, 7.1) 100
1 Includes cartons and others
7-2 Economics
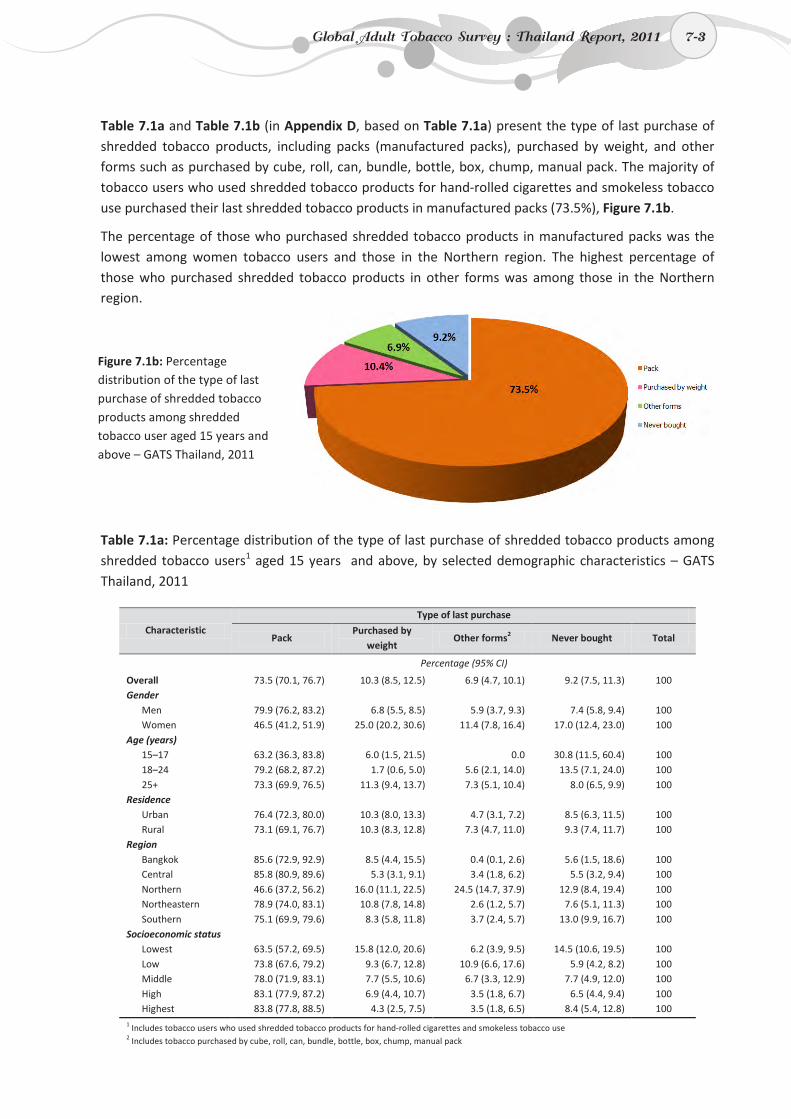
7-3
Table 7.1a and Table 7.1b (in Appendix D, based on Table 7.1a) present the type of last purchase of shredded tobacco products, including packs (manufactured packs), purchased by weight, and other forms such as purchased by cube, roll, can, bundle, bottle, box, chump, manual pack. The majority of tobacco users who used shredded tobacco products for hand-rolled cigarettes and smokeless tobacco use purchased their last shredded tobacco products in manufactured packs (73.5%), Figure 7.1b.
The percentage of those who purchased shredded tobacco products in manufactured packs was the lowest among women tobacco users and those in the Northern region. The highest percentage of those who purchased shredded tobacco products in other forms was among those in the Northern region.
Table 7.1a: Percentage distribution of the type of last purchase of shredded tobacco products among shredded tobacco users1 aged 15 years and above, by selected demographic characteristics – GATS Thailand, 2011
Characteristic
Type of last purchase
Pack Purchased by
weight Other forms2 Never bought Total
Percentage (95% CI)
Overall 73.5 (70.1, 76.7) 10.3 (8.5, 12.5) 6.9 (4.7, 10.1) 9.2 (7.5, 11.3) 100 Gender
Men 79.9 (76.2, 83.2) 6.8 (5.5, 8.5) 5.9 (3.7, 9.3) 7.4 (5.8, 9.4) 100 Women 46.5 (41.2, 51.9) 25.0 (20.2, 30.6) 11.4 (7.8, 16.4) 17.0 (12.4, 23.0) 100
Age (years) 15–17 63.2 (36.3, 83.8) 6.0 (1.5, 21.5) 0.0 30.8 (11.5, 60.4) 100 18–24 79.2 (68.2, 87.2) 1.7 (0.6, 5.0) 5.6 (2.1, 14.0) 13.5 (7.1, 24.0) 100 25+ 73.3 (69.9, 76.5) 11.3 (9.4, 13.7) 7.3 (5.1, 10.4) 8.0 (6.5, 9.9) 100
Residence Urban 76.4 (72.3, 80.0) 10.3 (8.0, 13.3) 4.7 (3.1, 7.2) 8.5 (6.3, 11.5) 100 Rural 73.1 (69.1, 76.7) 10.3 (8.3, 12.8) 7.3 (4.7, 11.0) 9.3 (7.4, 11.7) 100
Region Bangkok 85.6 (72.9, 92.9) 8.5 (4.4, 15.5) 0.4 (0.1, 2.6) 5.6 (1.5, 18.6) 100 Central 85.8 (80.9, 89.6) 5.3 (3.1, 9.1) 3.4 (1.8, 6.2) 5.5 (3.2, 9.4) 100 Northern 46.6 (37.2, 56.2) 16.0 (11.1, 22.5) 24.5 (14.7, 37.9) 12.9 (8.4, 19.4) 100 Northeastern 78.9 (74.0, 83.1) 10.8 (7.8, 14.8) 2.6 (1.2, 5.7) 7.6 (5.1, 11.3) 100 Southern 75.1 (69.9, 79.6) 8.3 (5.8, 11.8) 3.7 (2.4, 5.7) 13.0 (9.9, 16.7) 100
Socioeconomic status Lowest 63.5 (57.2, 69.5) 15.8 (12.0, 20.6) 6.2 (3.9, 9.5) 14.5 (10.6, 19.5) 100 Low 73.8 (67.6, 79.2) 9.3 (6.7, 12.8) 10.9 (6.6, 17.6) 5.9 (4.2, 8.2) 100 Middle 78.0 (71.9, 83.1) 7.7 (5.5, 10.6) 6.7 (3.3, 12.9) 7.7 (4.9, 12.0) 100 High 83.1 (77.9, 87.2) 6.9 (4.4, 10.7) 3.5 (1.8, 6.7) 6.5 (4.4, 9.4) 100 Highest 83.8 (77.8, 88.5) 4.3 (2.5, 7.5) 3.5 (1.8, 6.5) 8.4 (5.4, 12.8) 100
1 Includes tobacco users who used shredded tobacco products for hand-rolled cigarettes and smokeless tobacco use 2 Includes tobacco purchased by cube, roll, can, bundle, bottle, box, chump, manual pack
Figure 7.1b: Percentage distribution of the type of last purchase of shredded tobacco products among shredded tobacco user aged 15 years and above – GATS Thailand, 2011
Global Adult Tobacco Survey : Thailand Report, 2011 7-3
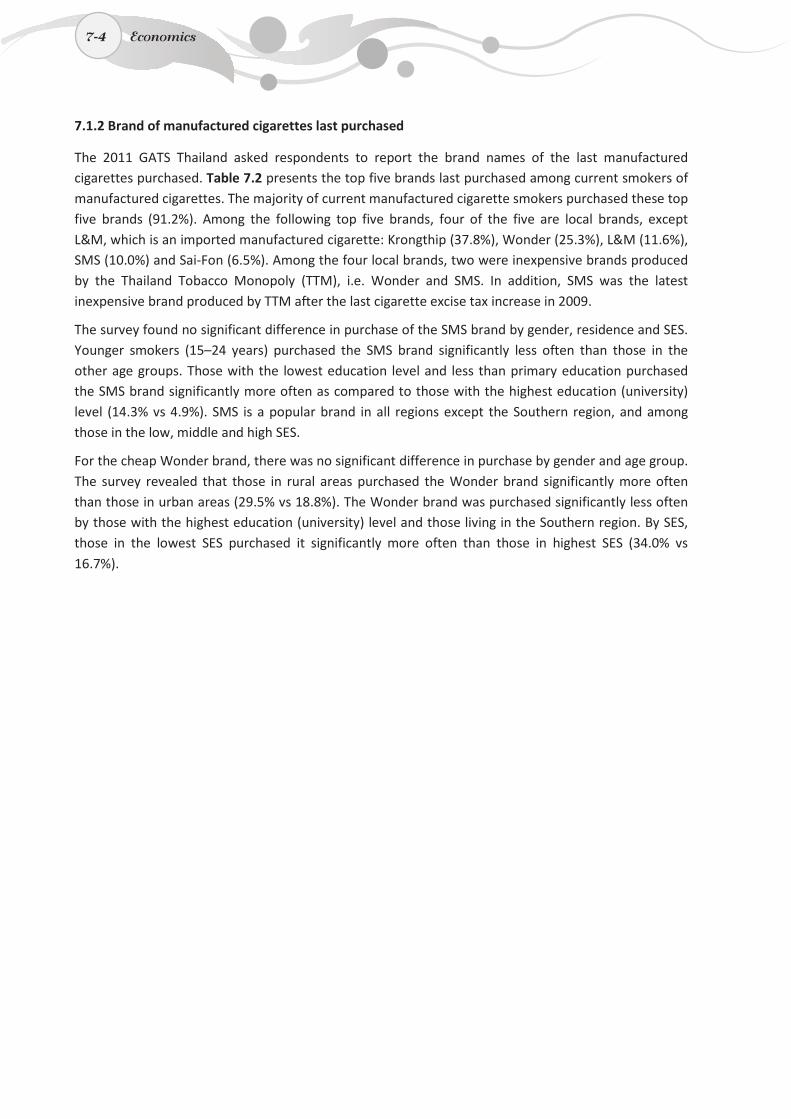
7-4
7.1.2 Brand of manufactured cigarettes last purchased
The 2011 GATS Thailand asked respondents to report the brand names of the last manufactured cigarettes purchased. Table 7.2 presents the top five brands last purchased among current smokers of manufactured cigarettes. The majority of current manufactured cigarette smokers purchased these top five brands (91.2%). Among the following top five brands, four of the five are local brands, except L&M, which is an imported manufactured cigarette: Krongthip (37.8%), Wonder (25.3%), L&M (11.6%), SMS (10.0%) and Sai-Fon (6.5%). Among the four local brands, two were inexpensive brands produced by the Thailand Tobacco Monopoly (TTM), i.e. Wonder and SMS. In addition, SMS was the latest inexpensive brand produced by TTM after the last cigarette excise tax increase in 2009.
The survey found no significant difference in purchase of the SMS brand by gender, residence and SES. Younger smokers (15–24 years) purchased the SMS brand significantly less often than those in the other age groups. Those with the lowest education level and less than primary education purchased the SMS brand significantly more often as compared to those with the highest education (university) level (14.3% vs 4.9%). SMS is a popular brand in all regions except the Southern region, and among those in the low, middle and high SES.
For the cheap Wonder brand, there was no significant difference in purchase by gender and age group. The survey revealed that those in rural areas purchased the Wonder brand significantly more often than those in urban areas (29.5% vs 18.8%). The Wonder brand was purchased significantly less often by those with the highest education (university) level and those living in the Southern region. By SES, those in the lowest SES purchased it significantly more often than those in highest SES (34.0% vs 16.7%).
7-4 Economics
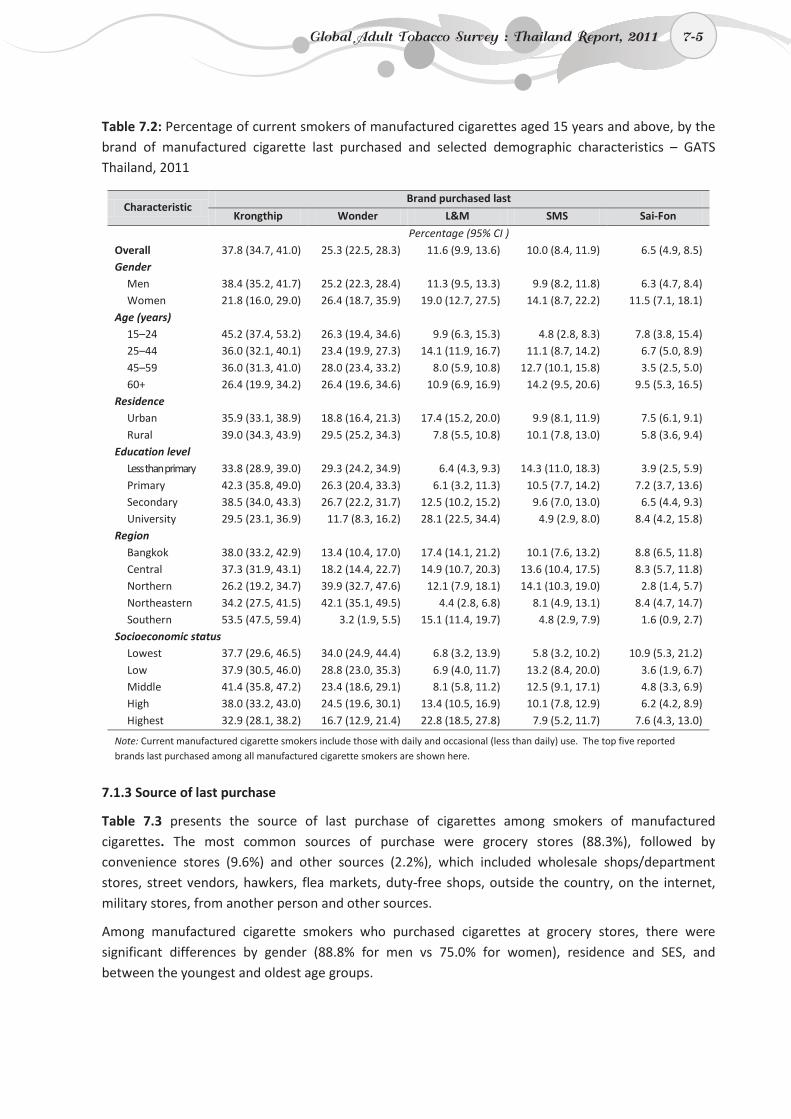
7-5
Table 7.2: Percentage of current smokers of manufactured cigarettes aged 15 years and above, by the brand of manufactured cigarette last purchased and selected demographic characteristics – GATS Thailand, 2011
Characteristic Brand purchased last
Krongthip Wonder L&M SMS Sai-Fon
Percentage (95% CI ) Overall 37.8 (34.7, 41.0) 25.3 (22.5, 28.3) 11.6 (9.9, 13.6) 10.0 (8.4, 11.9) 6.5 (4.9, 8.5) Gender
Men 38.4 (35.2, 41.7) 25.2 (22.3, 28.4) 11.3 (9.5, 13.3) 9.9 (8.2, 11.8) 6.3 (4.7, 8.4) Women 21.8 (16.0, 29.0) 26.4 (18.7, 35.9) 19.0 (12.7, 27.5) 14.1 (8.7, 22.2) 11.5 (7.1, 18.1)
Age (years) 15–24 45.2 (37.4, 53.2) 26.3 (19.4, 34.6) 9.9 (6.3, 15.3) 4.8 (2.8, 8.3) 7.8 (3.8, 15.4) 25–44 36.0 (32.1, 40.1) 23.4 (19.9, 27.3) 14.1 (11.9, 16.7) 11.1 (8.7, 14.2) 6.7 (5.0, 8.9) 45–59 36.0 (31.3, 41.0) 28.0 (23.4, 33.2) 8.0 (5.9, 10.8) 12.7 (10.1, 15.8) 3.5 (2.5, 5.0) 60+ 26.4 (19.9, 34.2) 26.4 (19.6, 34.6) 10.9 (6.9, 16.9) 14.2 (9.5, 20.6) 9.5 (5.3, 16.5)
Residence Urban 35.9 (33.1, 38.9) 18.8 (16.4, 21.3) 17.4 (15.2, 20.0) 9.9 (8.1, 11.9) 7.5 (6.1, 9.1) Rural 39.0 (34.3, 43.9) 29.5 (25.2, 34.3) 7.8 (5.5, 10.8) 10.1 (7.8, 13.0) 5.8 (3.6, 9.4)
Education level Less than primary 33.8 (28.9, 39.0) 29.3 (24.2, 34.9) 6.4 (4.3, 9.3) 14.3 (11.0, 18.3) 3.9 (2.5, 5.9) Primary 42.3 (35.8, 49.0) 26.3 (20.4, 33.3) 6.1 (3.2, 11.3) 10.5 (7.7, 14.2) 7.2 (3.7, 13.6) Secondary 38.5 (34.0, 43.3) 26.7 (22.2, 31.7) 12.5 (10.2, 15.2) 9.6 (7.0, 13.0) 6.5 (4.4, 9.3) University 29.5 (23.1, 36.9) 11.7 (8.3, 16.2) 28.1 (22.5, 34.4) 4.9 (2.9, 8.0) 8.4 (4.2, 15.8)
Region Bangkok 38.0 (33.2, 42.9) 13.4 (10.4, 17.0) 17.4 (14.1, 21.2) 10.1 (7.6, 13.2) 8.8 (6.5, 11.8) Central 37.3 (31.9, 43.1) 18.2 (14.4, 22.7) 14.9 (10.7, 20.3) 13.6 (10.4, 17.5) 8.3 (5.7, 11.8) Northern 26.2 (19.2, 34.7) 39.9 (32.7, 47.6) 12.1 (7.9, 18.1) 14.1 (10.3, 19.0) 2.8 (1.4, 5.7) Northeastern 34.2 (27.5, 41.5) 42.1 (35.1, 49.5) 4.4 (2.8, 6.8) 8.1 (4.9, 13.1) 8.4 (4.7, 14.7) Southern 53.5 (47.5, 59.4) 3.2 (1.9, 5.5) 15.1 (11.4, 19.7) 4.8 (2.9, 7.9) 1.6 (0.9, 2.7)
Socioeconomic status Lowest 37.7 (29.6, 46.5) 34.0 (24.9, 44.4) 6.8 (3.2, 13.9) 5.8 (3.2, 10.2) 10.9 (5.3, 21.2) Low 37.9 (30.5, 46.0) 28.8 (23.0, 35.3) 6.9 (4.0, 11.7) 13.2 (8.4, 20.0) 3.6 (1.9, 6.7) Middle 41.4 (35.8, 47.2) 23.4 (18.6, 29.1) 8.1 (5.8, 11.2) 12.5 (9.1, 17.1) 4.8 (3.3, 6.9) High 38.0 (33.2, 43.0) 24.5 (19.6, 30.1) 13.4 (10.5, 16.9) 10.1 (7.8, 12.9) 6.2 (4.2, 8.9) Highest 32.9 (28.1, 38.2) 16.7 (12.9, 21.4) 22.8 (18.5, 27.8) 7.9 (5.2, 11.7) 7.6 (4.3, 13.0)
Note: Current manufactured cigarette smokers include those with daily and occasional (less than daily) use. The top five reported brands last purchased among all manufactured cigarette smokers are shown here.
7.1.3 Source of last purchase
Table 7.3 presents the source of last purchase of cigarettes among smokers of manufactured cigarettes. The most common sources of purchase were grocery stores (88.3%), followed by convenience stores (9.6%) and other sources (2.2%), which included wholesale shops/department stores, street vendors, hawkers, flea markets, duty-free shops, outside the country, on the internet, military stores, from another person and other sources.
Among manufactured cigarette smokers who purchased cigarettes at grocery stores, there were significant differences by gender (88.8% for men vs 75.0% for women), residence and SES, and between the youngest and oldest age groups.
Global Adult Tobacco Survey : Thailand Report, 2011 7-5
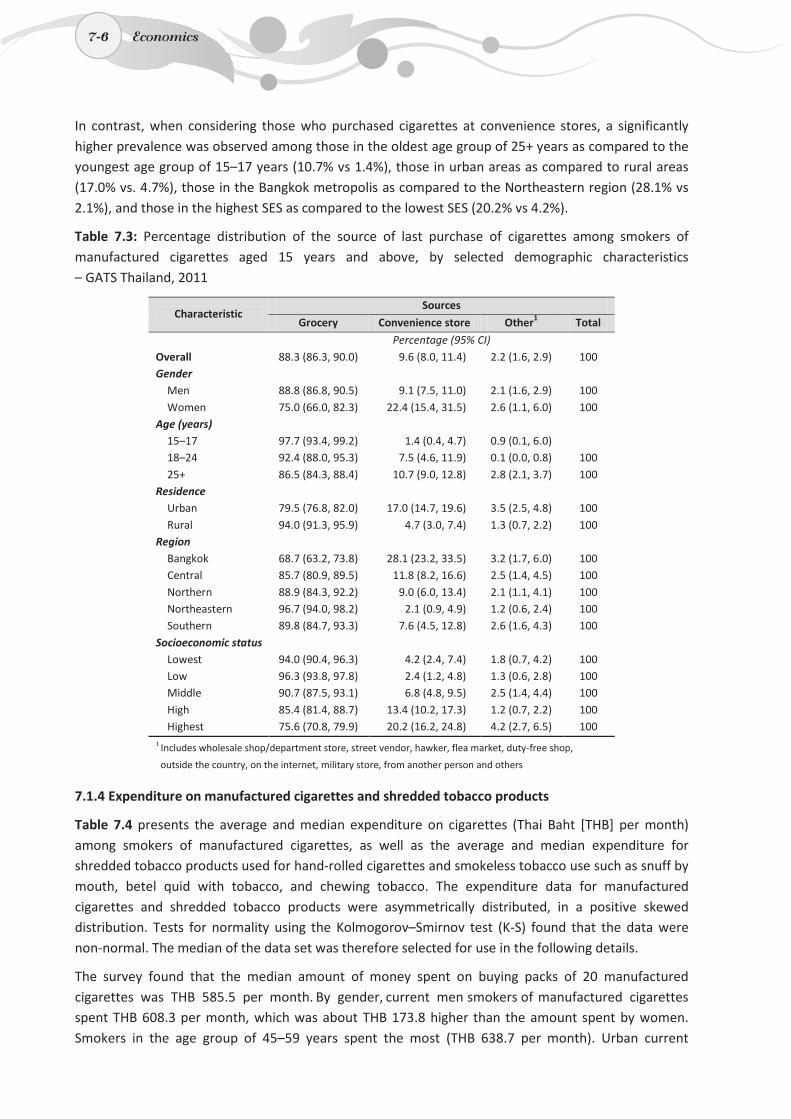
7-6
In contrast, when considering those who purchased cigarettes at convenience stores, a significantly higher prevalence was observed among those in the oldest age group of 25+ years as compared to the youngest age group of 15–17 years (10.7% vs 1.4%), those in urban areas as compared to rural areas (17.0% vs. 4.7%), those in the Bangkok metropolis as compared to the Northeastern region (28.1% vs 2.1%), and those in the highest SES as compared to the lowest SES (20.2% vs 4.2%).
Table 7.3: Percentage distribution of the source of last purchase of cigarettes among smokers of manufactured cigarettes aged 15 years and above, by selected demographic characteristics – GATS Thailand, 2011
Characteristic Sources
Grocery Convenience store Other1 Total
Percentage (95% CI) Overall 88.3 (86.3, 90.0) 9.6 (8.0, 11.4) 2.2 (1.6, 2.9) 100 Gender
Men 88.8 (86.8, 90.5) 9.1 (7.5, 11.0) 2.1 (1.6, 2.9) 100 Women 75.0 (66.0, 82.3) 22.4 (15.4, 31.5) 2.6 (1.1, 6.0) 100
Age (years) 15–17 97.7 (93.4, 99.2) 1.4 (0.4, 4.7) 0.9 (0.1, 6.0) 18–24 92.4 (88.0, 95.3) 7.5 (4.6, 11.9) 0.1 (0.0, 0.8) 100 25+ 86.5 (84.3, 88.4) 10.7 (9.0, 12.8) 2.8 (2.1, 3.7) 100
Residence Urban 79.5 (76.8, 82.0) 17.0 (14.7, 19.6) 3.5 (2.5, 4.8) 100 Rural 94.0 (91.3, 95.9) 4.7 (3.0, 7.4) 1.3 (0.7, 2.2) 100
Region Bangkok 68.7 (63.2, 73.8) 28.1 (23.2, 33.5) 3.2 (1.7, 6.0) 100 Central 85.7 (80.9, 89.5) 11.8 (8.2, 16.6) 2.5 (1.4, 4.5) 100 Northern 88.9 (84.3, 92.2) 9.0 (6.0, 13.4) 2.1 (1.1, 4.1) 100 Northeastern 96.7 (94.0, 98.2) 2.1 (0.9, 4.9) 1.2 (0.6, 2.4) 100 Southern 89.8 (84.7, 93.3) 7.6 (4.5, 12.8) 2.6 (1.6, 4.3) 100
Socioeconomic status Lowest 94.0 (90.4, 96.3) 4.2 (2.4, 7.4) 1.8 (0.7, 4.2) 100 Low 96.3 (93.8, 97.8) 2.4 (1.2, 4.8) 1.3 (0.6, 2.8) 100 Middle 90.7 (87.5, 93.1) 6.8 (4.8, 9.5) 2.5 (1.4, 4.4) 100 High 85.4 (81.4, 88.7) 13.4 (10.2, 17.3) 1.2 (0.7, 2.2) 100 Highest 75.6 (70.8, 79.9) 20.2 (16.2, 24.8) 4.2 (2.7, 6.5) 100
1 Includes wholesale shop/department store, street vendor, hawker, flea market, duty-free shop,
outside the country, on the internet, military store, from another person and others
7.1.4 Expenditure on manufactured cigarettes and shredded tobacco products
Table 7.4 presents the average and median expenditure on cigarettes (Thai Baht [THB] per month) among smokers of manufactured cigarettes, as well as the average and median expenditure for shredded tobacco products used for hand-rolled cigarettes and smokeless tobacco use such as snuff by mouth, betel quid with tobacco, and chewing tobacco. The expenditure data for manufactured cigarettes and shredded tobacco products were asymmetrically distributed, in a positive skewed distribution. Tests for normality using the Kolmogorov–Smirnov test (K-S) found that the data were non-normal. The median of the data set was therefore selected for use in the following details.
The survey found that the median amount of money spent on buying packs of 20 manufactured cigarettes was THB 585.5 per month. By gender, current men smokers of manufactured cigarettes spent THB 608.3 per month, which was about THB 173.8 higher than the amount spent by women. Smokers in the age group of 45–59 years spent the most (THB 638.7 per month). Urban current
7-6 Economics
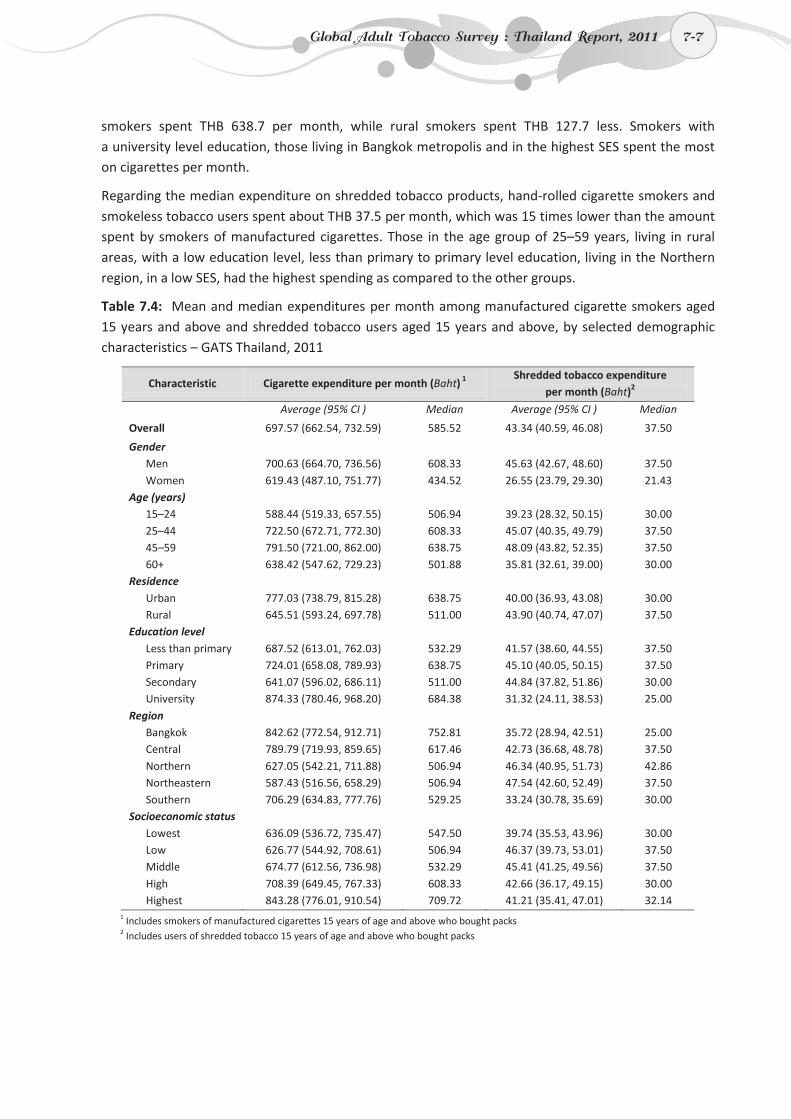
7-7
smokers spent THB 638.7 per month, while rural smokers spent THB 127.7 less. Smokers with a university level education, those living in Bangkok metropolis and in the highest SES spent the most on cigarettes per month.
Regarding the median expenditure on shredded tobacco products, hand-rolled cigarette smokers and smokeless tobacco users spent about THB 37.5 per month, which was 15 times lower than the amount spent by smokers of manufactured cigarettes. Those in the age group of 25–59 years, living in rural areas, with a low education level, less than primary to primary level education, living in the Northern region, in a low SES, had the highest spending as compared to the other groups.
Table 7.4: Mean and median expenditures per month among manufactured cigarette smokers aged 15 years and above and shredded tobacco users aged 15 years and above, by selected demographic characteristics – GATS Thailand, 2011
Characteristic Cigarette expenditure per month (Baht) 1 Shredded tobacco expenditure
per month (Baht)2
Average (95% CI ) Median Average (95% CI ) Median
Overall 697.57 (662.54, 732.59) 585.52 43.34 (40.59, 46.08) 37.50
Gender Men 700.63 (664.70, 736.56) 608.33 45.63 (42.67, 48.60) 37.50 Women 619.43 (487.10, 751.77) 434.52 26.55 (23.79, 29.30) 21.43
Age (years) 15–24 588.44 (519.33, 657.55) 506.94 39.23 (28.32, 50.15) 30.00 25–44 722.50 (672.71, 772.30) 608.33 45.07 (40.35, 49.79) 37.50 45–59 791.50 (721.00, 862.00) 638.75 48.09 (43.82, 52.35) 37.50 60+ 638.42 (547.62, 729.23) 501.88 35.81 (32.61, 39.00) 30.00
Residence Urban 777.03 (738.79, 815.28) 638.75 40.00 (36.93, 43.08) 30.00 Rural 645.51 (593.24, 697.78) 511.00 43.90 (40.74, 47.07) 37.50
Education level Less than primary 687.52 (613.01, 762.03) 532.29 41.57 (38.60, 44.55) 37.50 Primary 724.01 (658.08, 789.93) 638.75 45.10 (40.05, 50.15) 37.50 Secondary 641.07 (596.02, 686.11) 511.00 44.84 (37.82, 51.86) 30.00 University 874.33 (780.46, 968.20) 684.38 31.32 (24.11, 38.53) 25.00
Region Bangkok 842.62 (772.54, 912.71) 752.81 35.72 (28.94, 42.51) 25.00 Central 789.79 (719.93, 859.65) 617.46 42.73 (36.68, 48.78) 37.50 Northern 627.05 (542.21, 711.88) 506.94 46.34 (40.95, 51.73) 42.86 Northeastern 587.43 (516.56, 658.29) 506.94 47.54 (42.60, 52.49) 37.50 Southern 706.29 (634.83, 777.76) 529.25 33.24 (30.78, 35.69) 30.00
Socioeconomic status Lowest 636.09 (536.72, 735.47) 547.50 39.74 (35.53, 43.96) 30.00 Low 626.77 (544.92, 708.61) 506.94 46.37 (39.73, 53.01) 37.50 Middle 674.77 (612.56, 736.98) 532.29 45.41 (41.25, 49.56) 37.50 High 708.39 (649.45, 767.33) 608.33 42.66 (36.17, 49.15) 30.00 Highest 843.28 (776.01, 910.54) 709.72 41.21 (35.41, 47.01) 32.14
1 Includes smokers of manufactured cigarettes 15 years of age and above who bought packs 2 Includes users of shredded tobacco 15 years of age and above who bought packs
Global Adult Tobacco Survey : Thailand Report, 2011 7-7
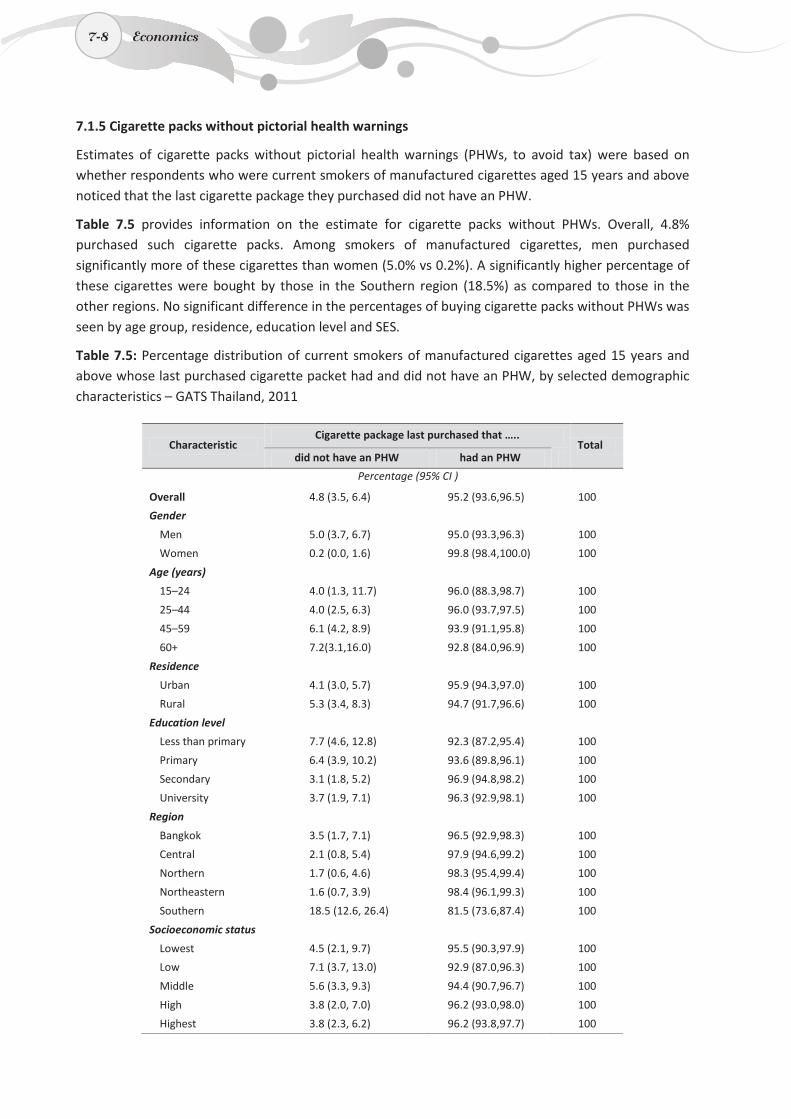
7-8
7.1.5 Cigarette packs without pictorial health warnings
Estimates of cigarette packs without pictorial health warnings (PHWs, to avoid tax) were based on whether respondents who were current smokers of manufactured cigarettes aged 15 years and above noticed that the last cigarette package they purchased did not have an PHW.
Table 7.5 provides information on the estimate for cigarette packs without PHWs. Overall, 4.8% purchased such cigarette packs. Among smokers of manufactured cigarettes, men purchased significantly more of these cigarettes than women (5.0% vs 0.2%). A significantly higher percentage of these cigarettes were bought by those in the Southern region (18.5%) as compared to those in the other regions. No significant difference in the percentages of buying cigarette packs without PHWs was seen by age group, residence, education level and SES.
Table 7.5: Percentage distribution of current smokers of manufactured cigarettes aged 15 years and above whose last purchased cigarette packet had and did not have an PHW, by selected demographic characteristics – GATS Thailand, 2011
Characteristic Cigarette package last purchased that …..
Total did not have an PHW had an PHW
Percentage (95% CI )
Overall 4.8 (3.5, 6.4) 95.2 (93.6,96.5) 100
Gender
Men 5.0 (3.7, 6.7) 95.0 (93.3,96.3) 100
Women 0.2 (0.0, 1.6) 99.8 (98.4,100.0) 100
Age (years)
15–24 4.0 (1.3, 11.7) 96.0 (88.3,98.7) 100
25–44 4.0 (2.5, 6.3) 96.0 (93.7,97.5) 100
45–59 6.1 (4.2, 8.9) 93.9 (91.1,95.8) 100
60+ 7.2(3.1,16.0) 92.8 (84.0,96.9) 100
Residence
Urban 4.1 (3.0, 5.7) 95.9 (94.3,97.0) 100
Rural 5.3 (3.4, 8.3) 94.7 (91.7,96.6) 100
Education level
Less than primary 7.7 (4.6, 12.8) 92.3 (87.2,95.4) 100
Primary 6.4 (3.9, 10.2) 93.6 (89.8,96.1) 100
Secondary 3.1 (1.8, 5.2) 96.9 (94.8,98.2) 100
University 3.7 (1.9, 7.1) 96.3 (92.9,98.1) 100
Region
Bangkok 3.5 (1.7, 7.1) 96.5 (92.9,98.3) 100
Central 2.1 (0.8, 5.4) 97.9 (94.6,99.2) 100
Northern 1.7 (0.6, 4.6) 98.3 (95.4,99.4) 100
Northeastern 1.6 (0.7, 3.9) 98.4 (96.1,99.3) 100
Southern 18.5 (12.6, 26.4) 81.5 (73.6,87.4) 100
Socioeconomic status
Lowest 4.5 (2.1, 9.7) 95.5 (90.3,97.9) 100
Low 7.1 (3.7, 13.0) 92.9 (87.0,96.3) 100
Middle 5.6 (3.3, 9.3) 94.4 (90.7,96.7) 100
High 3.8 (2.0, 7.0) 96.2 (93.0,98.0) 100
Highest 3.8 (2.3, 6.2) 96.2 (93.8,97.7) 100
7-8 Economics
7-9
7.2 Comparison of the economics of tobacco use in 2009 and 2011
Comparison of the key findings between 2009 and 2011
o The percentage of those who purchased their last cigarettes in loose form (sticks) among current smokers aged 15–17 years remained high and did not change significantly (84.3% in 2009 and 88.3% in 2011).
o The median price of cigarettes per 20 sticks increased from THB 45 in 2009 to THB 58 in 2011.
o The percentage of current manufactured cigarette smokers who reported that their last purchase of a cigarette package did not have PHWs was higher in 2011 than in 2009 (4.8% vs 2.6%), but the difference was not significant.
Comparisons of the economics of tobacco use in 2009 and 2011 covered two indicators, i.e. type of last purchase of manufactured cigarettes, and last purchase of cigarette packs without PHWs.
7.2.1 Type of last purchase of manufactured cigarettes in 2009 and 2011
Table 7.6 presents the percentages of the type of last purchase of manufactured cigarettes among smokers of manufactured cigarettes aged 15 years and above, categorized into three types – loose form (sticks), packs and others (large packs or cartons).
Last purchase of manufactured cigarettes in 2009 and 2011 followed the same pattern. These were mostly purchased by pack, followed by loose form (sticks), and others (large packs or cartons). A significant decrease in the patterns of buying in loose form was noted among those in the age group of 25+ years and in the low SES. A significant increase of buying in pack was seen among those in the low SES.
7.2.2 Last purchase of cigarette packs without pictorial health warnings in 2009 and 2011
Table 7.7 presents the percentages of those who last purchased cigarette packs without PHWs. These types of cigarette packs do not carry PHWs to avoid taxation. To identify those who purchased these cigarettes, respondents were asked if the last cigarette pack they bought carried any PHW on it. There was no overall significant difference between difference sub-group by demographic characteristics (gender, age group, residence, education level, region and SES).
Global Adult Tobacco Survey : Thailand Report, 2011 7-9
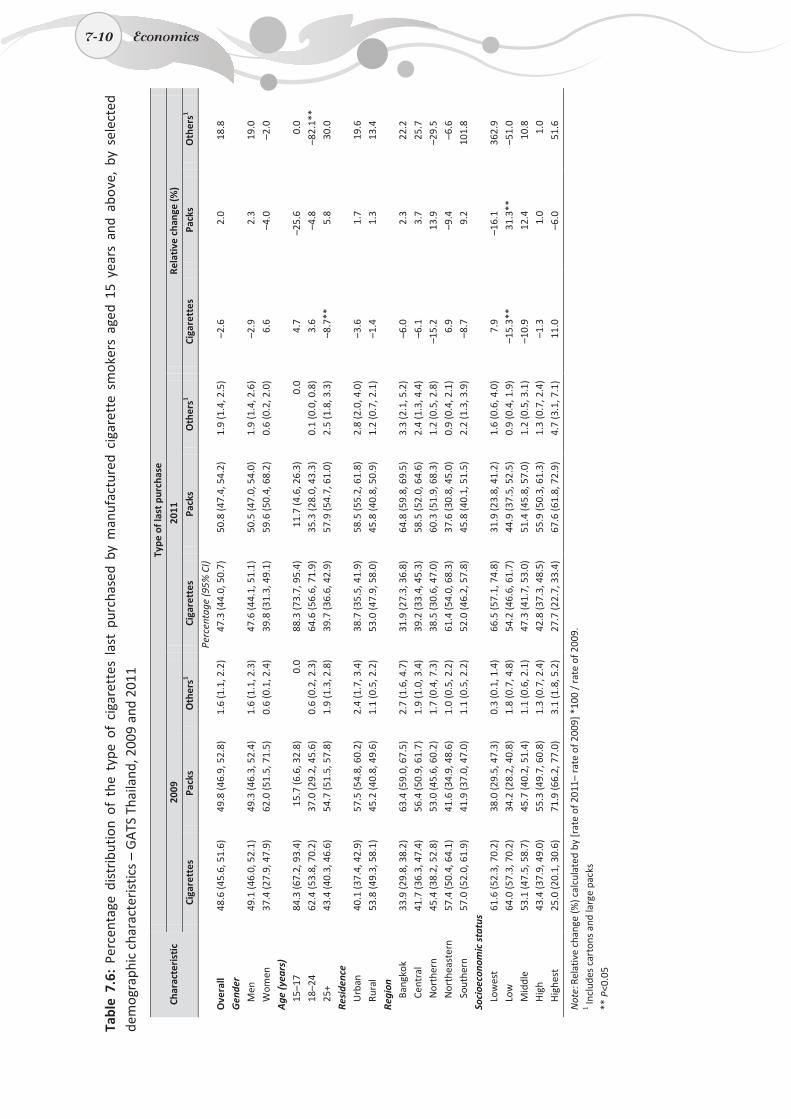
7-10
Ta
ble
7.6:
Per
cent
age
dist
ribu
tion
of t
he t
ype
of c
igar
ette
s la
st p
urch
ased
by
man
ufac
ture
d ci
gare
tte
smok
ers
aged
15
year
s an
d ab
ove,
by
sele
cted
de
mog
raph
ic c
hara
cter
istic
s –
GA
TS T
haila
nd, 2
009
and
2011
Char
acte
rist
ic
Type
of l
ast p
urch
ase
2009
20
11
Rela
tive
cha
nge
(%)
Ciga
rett
es
Pack
s O
ther
s1 Ci
gare
ttes
Pa
cks
Oth
ers1
Ciga
rett
es
Pack
s O
ther
s1
Pe
rcen
tage
(95%
CI)
O
vera
ll 48
.6 (4
5.6,
51.
6)
49.8
(46.
9, 5
2.8)
1.
6 (1
.1, 2
.2)
47.3
(44.
0, 5
0.7)
50
.8 (4
7.4,
54.
2)
1.9
(1.4
, 2.5
) –2
.6
2.0
18.8
G
ende
r
Men
49
.1 (4
6.0,
52.
1)
49.3
(46.
3, 5
2.4)
1.
6 (1
.1, 2
.3)
47.6
(44.
1, 5
1.1)
50
.5 (4
7.0,
54.
0)
1.9
(1.4
, 2.6
) –2
.9
2.3
19.0
W
omen
37
.4 (2
7.9,
47.
9)
62.0
(51.
5, 7
1.5)
0.
6 (0
.1, 2
.4)
39.8
(31.
3, 4
9.1)
59
.6 (5
0.4,
68.
2)
0.6
(0.2
, 2.0
) 6.
6 –4
.0
–2.0
A
ge (y
ears
)
15–1
7 84
.3 (6
7.2,
93.
4)
15.7
(6.6
, 32.
8)
0.0
88.3
(73.
7, 9
5.4)
11
.7 (4
.6, 2
6.3)
0.
0 4.
7 –2
5.6
0.0
18–2
4 62
.4 (5
3.8,
70.
2)
37.0
(29.
2, 4
5.6)
0.
6 (0
.2, 2
.3)
64.6
(56.
6, 7
1.9)
35
.3 (2
8.0,
43.
3)
0.1
(0.0
, 0.8
) 3.
6 –4
.8
–82.
1**
25+
43.4
(40.
3, 4
6.6)
54
.7 (5
1.5,
57.
8)
1.9
(1.3
, 2.8
) 39
.7 (3
6.6,
42.
9)
57.9
(54.
7, 6
1.0)
2.
5 (1
.8, 3
.3)
–8.7
**
5.8
30.0
Re
side
nce
U
rban
40
.1 (3
7.4,
42.
9)
57.5
(54.
8, 6
0.2)
2.
4 (1
.7, 3
.4)
38.7
(35.
5, 4
1.9)
58
.5 (5
5.2,
61.
8)
2.8
(2.0
, 4.0
) –3
.6
1.7
19.6
Ru
ral
53.8
(49.
3, 5
8.1)
45
.2 (4
0.8,
49.
6)
1.1
(0.5
, 2.2
) 53
.0 (4
7.9,
58.
0)
45.8
(40.
8, 5
0.9)
1.
2 (0
.7, 2
.1)
–1.4
1.
3 13
.4
Regi
on
Ba
ngko
k 33
.9 (2
9.8,
38.
2)
63.4
(59.
0, 6
7.5)
2.
7 (1
.6, 4
.7)
31.9
(27.
3, 3
6.8)
64
.8 (5
9.8,
69.
5)
3.3
(2.1
, 5.2
) –6
.0
2.3
22.2
Ce
ntra
l 41
.7 (3
6.3,
47.
4)
56.4
(50.
9, 6
1.7)
1.
9 (1
.0, 3
.4)
39.2
(33.
4, 4
5.3)
58
.5 (5
2.0,
64.
6)
2.4
(1.3
, 4.4
) –6
.1
3.7
25.7
N
orth
ern
45.4
(38.
2, 5
2.8)
53
.0 (4
5.6,
60.
2)
1.7
(0.4
, 7.3
) 38
.5 (3
0.6,
47.
0)
60.3
(51.
9, 6
8.3)
1.
2 (0
.5, 2
.8)
–15.
2 13
.9
–29.
5 N
orth
east
ern
57.4
(50.
4, 6
4.1)
41
.6 (3
4.9,
48.
6)
1.0
(0.5
, 2.2
) 61
.4 (5
4.0,
68.
3)
37.6
(30.
8, 4
5.0)
0.
9 (0
.4, 2
.1)
6.9
–9.4
–6
.6
Sout
hern
57
.0 (5
2.0,
61.
9)
41.9
(37.
0, 4
7.0)
1.
1 (0
.5, 2
.2)
52.0
(46.
2, 5
7.8)
45
.8 (4
0.1,
51.
5)
2.2
(1.3
, 3.9
) –8
.7
9.2
101.
8 So
cioe
cono
mic
sta
tus
Low
est
61.6
(52.
3, 7
0.2)
38
.0 (2
9.5,
47.
3)
0.3
(0.1
, 1.4
) 66
.5 (5
7.1,
74.
8)
31.9
(23.
8, 4
1.2)
1.
6 (0
.6, 4
.0)
7.9
–16.
1 36
2.9
Low
64
.0 (5
7.3,
70.
2)
34.2
(28.
2, 4
0.8)
1.
8 (0
.7, 4
.8)
54.2
(46.
6, 6
1.7)
44
.9 (3
7.5,
52.
5)
0.9
(0.4
, 1.9
) –1
5.3*
* 31
.3**
–5
1.0
Mid
dle
53.1
(47.
5, 5
8.7)
45
.7 (4
0.2,
51.
4)
1.1
(0.6
, 2.1
) 47
.3 (4
1.7,
53.
0)
51.4
(45.
8, 5
7.0)
1.
2 (0
.5, 3
.1)
–10.
9 12
.4
10.8
H
igh
43.4
(37.
9, 4
9.0)
55
.3 (4
9.7,
60.
8)
1.3
(0.7
, 2.4
) 42
.8 (3
7.3,
48.
5)
55.9
(50.
3, 6
1.3)
1.
3 (0
.7, 2
.4)
–1.3
1.
0 1.
0 H
ighe
st
25.0
(20.
1, 3
0.6)
71
.9 (6
6.2,
77.
0)
3.1
(1.8
, 5.2
) 27
.7 (2
2.7,
33.
4)
67.6
(61.
8, 7
2.9)
4.
7 (3
.1, 7
.1)
11.0
–6
.0
51.6
Not
e: Re
lativ
e ch
ange
(%) c
alcu
late
d by
[rat
e of
201
1– ra
te o
f 200
9] *
100
/ ra
te o
f 200
9.
1 Incl
udes
car
tons
and
larg
e pa
cks
** P
<0.0
5
7-10 Economics
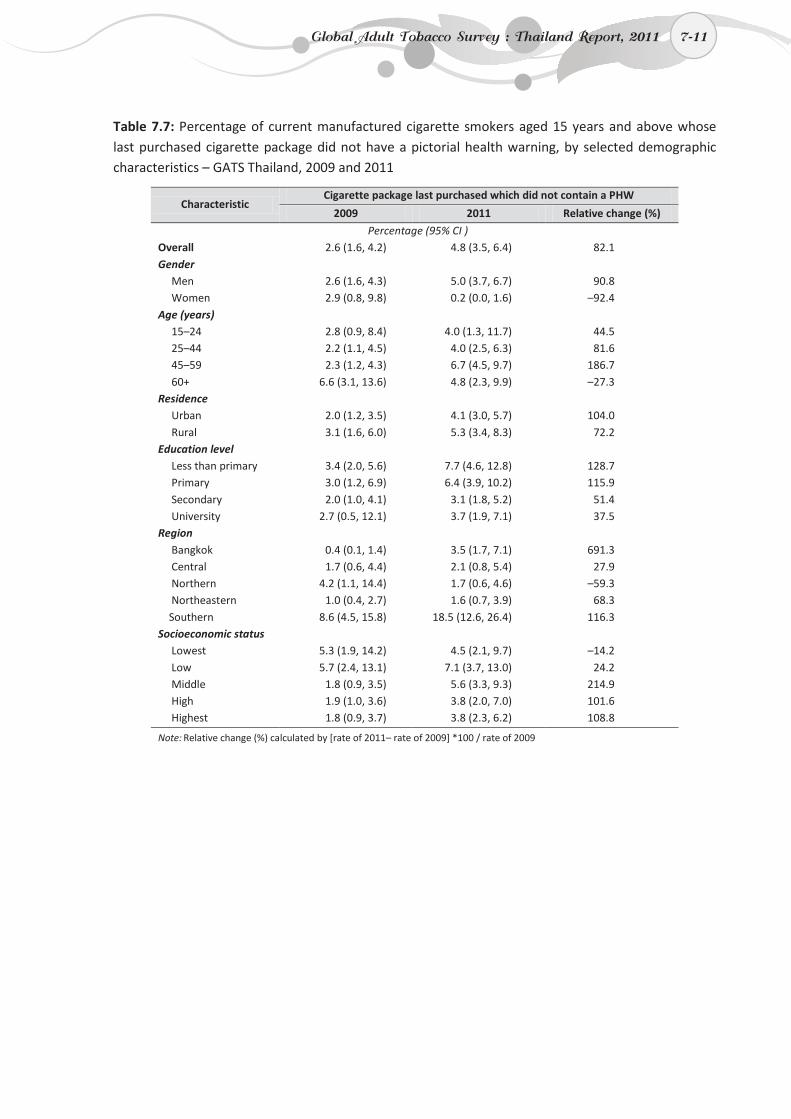
7-11
Table 7.7: Percentage of current manufactured cigarette smokers aged 15 years and above whose last purchased cigarette package did not have a pictorial health warning, by selected demographic characteristics – GATS Thailand, 2009 and 2011
Characteristic Cigarette package last purchased which did not contain a PHW
2009 2011 Relative change (%)
Percentage (95% CI ) Overall 2.6 (1.6, 4.2) 4.8 (3.5, 6.4) 82.1 Gender
Men 2.6 (1.6, 4.3) 5.0 (3.7, 6.7) 90.8 Women 2.9 (0.8, 9.8) 0.2 (0.0, 1.6) –92.4
Age (years) 15–24 2.8 (0.9, 8.4) 4.0 (1.3, 11.7) 44.5 25–44 2.2 (1.1, 4.5) 4.0 (2.5, 6.3) 81.6 45–59 2.3 (1.2, 4.3) 6.7 (4.5, 9.7) 186.7 60+ 6.6 (3.1, 13.6) 4.8 (2.3, 9.9) –27.3
Residence Urban 2.0 (1.2, 3.5) 4.1 (3.0, 5.7) 104.0 Rural 3.1 (1.6, 6.0) 5.3 (3.4, 8.3) 72.2
Education level Less than primary 3.4 (2.0, 5.6) 7.7 (4.6, 12.8) 128.7 Primary 3.0 (1.2, 6.9) 6.4 (3.9, 10.2) 115.9 Secondary 2.0 (1.0, 4.1) 3.1 (1.8, 5.2) 51.4 University 2.7 (0.5, 12.1) 3.7 (1.9, 7.1) 37.5
Region Bangkok 0.4 (0.1, 1.4) 3.5 (1.7, 7.1) 691.3 Central 1.7 (0.6, 4.4) 2.1 (0.8, 5.4) 27.9 Northern 4.2 (1.1, 14.4) 1.7 (0.6, 4.6) –59.3 Northeastern 1.0 (0.4, 2.7) 1.6 (0.7, 3.9) 68.3
Southern 8.6 (4.5, 15.8) 18.5 (12.6, 26.4) 116.3 Socioeconomic status
Lowest 5.3 (1.9, 14.2) 4.5 (2.1, 9.7) –14.2 Low 5.7 (2.4, 13.1) 7.1 (3.7, 13.0) 24.2 Middle 1.8 (0.9, 3.5) 5.6 (3.3, 9.3) 214.9 High 1.9 (1.0, 3.6) 3.8 (2.0, 7.0) 101.6 Highest 1.8 (0.9, 3.7) 3.8 (2.3, 6.2) 108.8
Note: Relative change (%) calculated by [rate of 2011– rate of 2009] *100 / rate of 2009
Global Adult Tobacco Survey : Thailand Report, 2011 7-11

8. Media
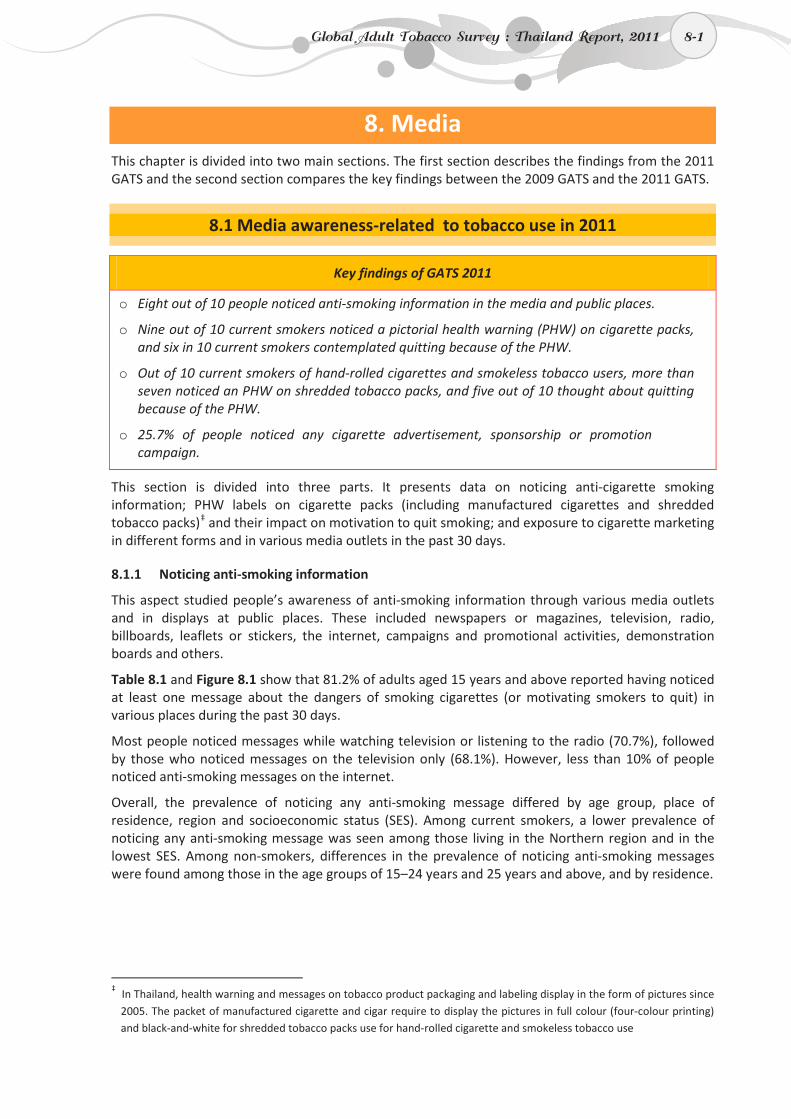
8-1
8. Media This chapter is divided into two main sections. The first section describes the findings from the 2011 GATS and the second section compares the key findings between the 2009 GATS and the 2011 GATS.
8.1 Media awareness-related to tobacco use in 2011
Key findings of GATS 2011
o Eight out of 10 people noticed anti-smoking information in the media and public places.
o Nine out of 10 current smokers noticed a pictorial health warning (PHW) on cigarette packs, and six in 10 current smokers contemplated quitting because of the PHW.
o Out of 10 current smokers of hand-rolled cigarettes and smokeless tobacco users, more than seven noticed an PHW on shredded tobacco packs, and five out of 10 thought about quitting because of the PHW.
o 25.7% of people noticed any cigarette advertisement, sponsorship or promotion campaign.
This section is divided into three parts. It presents data on noticing anti-cigarette smoking information; PHW labels on cigarette packs (including manufactured cigarettes and shredded tobacco packs)‡
8.1.1 Noticing anti-smoking information
and their impact on motivation to quit smoking; and exposure to cigarette marketing in different forms and in various media outlets in the past 30 days.
This aspect studied people’s awareness of anti-smoking information through various media outlets and in displays at public places. These included newspapers or magazines, television, radio, billboards, leaflets or stickers, the internet, campaigns and promotional activities, demonstration boards and others.
Table 8.1 and Figure 8.1 show that 81.2% of adults aged 15 years and above reported having noticed at least one message about the dangers of smoking cigarettes (or motivating smokers to quit) in various places during the past 30 days.
Most people noticed messages while watching television or listening to the radio (70.7%), followed by those who noticed messages on the television only (68.1%). However, less than 10% of people noticed anti-smoking messages on the internet.
Overall, the prevalence of noticing any anti-smoking message differed by age group, place of residence, region and socioeconomic status (SES). Among current smokers, a lower prevalence of noticing any anti-smoking message was seen among those living in the Northern region and in the lowest SES. Among non-smokers, differences in the prevalence of noticing anti-smoking messages were found among those in the age groups of 15–24 years and 25 years and above, and by residence.
‡ In Thailand, health warning and messages on tobacco product packaging and labeling display in the form of pictures since
2005. The packet of manufactured cigarette and cigar require to display the pictures in full colour (four-colour printing) and black-and-white for shredded tobacco packs use for hand-rolled cigarette and smokeless tobacco use
Global Adult Tobacco Survey : Thailand Report, 2011 8-1
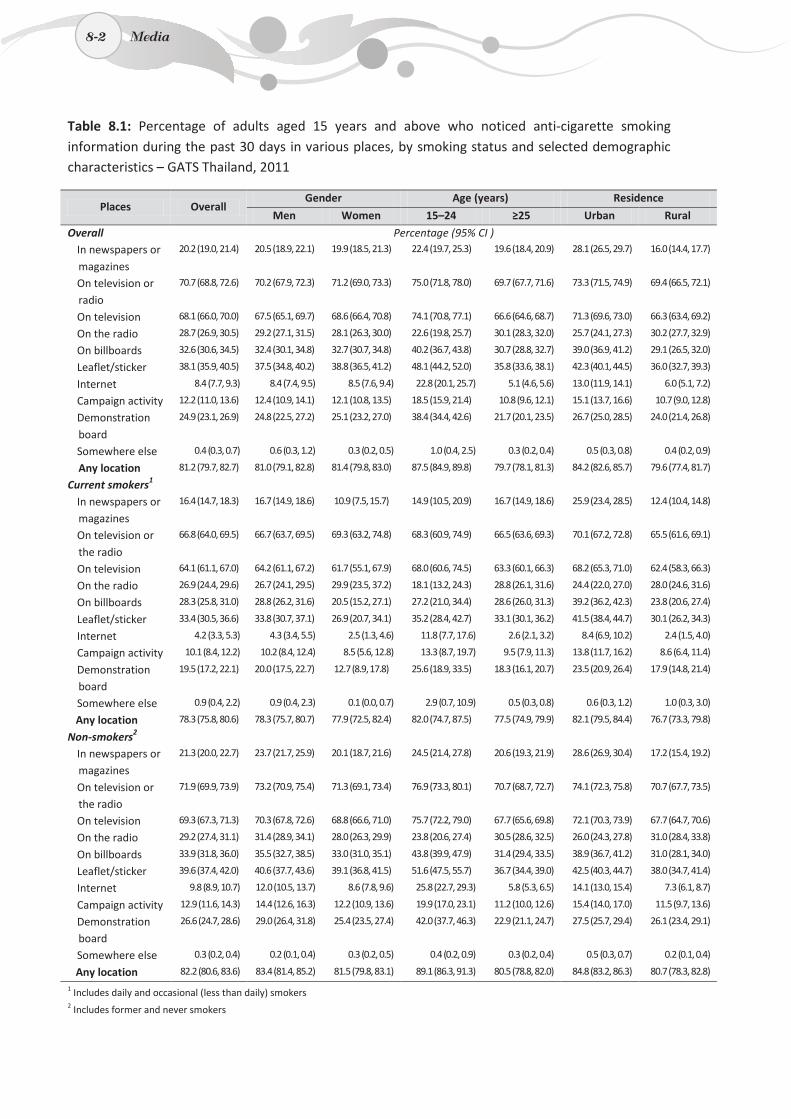
8-2
Table 8.1: Percentage of adults aged 15 years and above who noticed anti-cigarette smoking information during the past 30 days in various places, by smoking status and selected demographic characteristics – GATS Thailand, 2011
Places Overall Gender Age (years) Residence
Men Women 15–24 ≥25 Urban Rural
Overall Percentage (95% CI ) In newspapers or
magazines
20.2 (19.0, 21.4) 20.5 (18.9, 22.1) 19.9 (18.5, 21.3) 22.4 (19.7, 25.3) 19.6 (18.4, 20.9) 28.1 (26.5, 29.7) 16.0 (14.4, 17.7)
On television or radio
70.7 (68.8, 72.6) 70.2 (67.9, 72.3) 71.2 (69.0, 73.3) 75.0 (71.8, 78.0) 69.7 (67.7, 71.6) 73.3 (71.5, 74.9) 69.4 (66.5, 72.1)
On television 68.1 (66.0, 70.0) 67.5 (65.1, 69.7) 68.6 (66.4, 70.8) 74.1 (70.8, 77.1) 66.6 (64.6, 68.7) 71.3 (69.6, 73.0) 66.3 (63.4, 69.2)
On the radio 28.7 (26.9, 30.5) 29.2 (27.1, 31.5) 28.1 (26.3, 30.0) 22.6 (19.8, 25.7) 30.1 (28.3, 32.0) 25.7 (24.1, 27.3) 30.2 (27.7, 32.9)
On billboards 32.6 (30.6, 34.5) 32.4 (30.1, 34.8) 32.7 (30.7, 34.8) 40.2 (36.7, 43.8) 30.7 (28.8, 32.7) 39.0 (36.9, 41.2) 29.1 (26.5, 32.0)
Leaflet/sticker 38.1 (35.9, 40.5) 37.5 (34.8, 40.2) 38.8 (36.5, 41.2) 48.1 (44.2, 52.0) 35.8 (33.6, 38.1) 42.3 (40.1, 44.5) 36.0 (32.7, 39.3)
Internet 8.4 (7.7, 9.3) 8.4 (7.4, 9.5) 8.5 (7.6, 9.4) 22.8 (20.1, 25.7) 5.1 (4.6, 5.6) 13.0 (11.9, 14.1) 6.0 (5.1, 7.2)
Campaign activity 12.2 (11.0, 13.6) 12.4 (10.9, 14.1) 12.1 (10.8, 13.5) 18.5 (15.9, 21.4) 10.8 (9.6, 12.1) 15.1 (13.7, 16.6) 10.7 (9.0, 12.8)
Demonstration board
24.9 (23.1, 26.9) 24.8 (22.5, 27.2) 25.1 (23.2, 27.0) 38.4 (34.4, 42.6) 21.7 (20.1, 23.5) 26.7 (25.0, 28.5) 24.0 (21.4, 26.8)
Somewhere else 0.4 (0.3, 0.7) 0.6 (0.3, 1.2) 0.3 (0.2, 0.5) 1.0 (0.4, 2.5) 0.3 (0.2, 0.4) 0.5 (0.3, 0.8) 0.4 (0.2, 0.9)
Any location 81.2 (79.7, 82.7) 81.0 (79.1, 82.8) 81.4 (79.8, 83.0) 87.5 (84.9, 89.8) 79.7 (78.1, 81.3) 84.2 (82.6, 85.7) 79.6 (77.4, 81.7)
Current smokers1 In newspapers or
magazines
16.4 (14.7, 18.3) 16.7 (14.9, 18.6) 10.9 (7.5, 15.7) 14.9 (10.5, 20.9) 16.7 (14.9, 18.6) 25.9 (23.4, 28.5) 12.4 (10.4, 14.8)
On television or the radio
66.8 (64.0, 69.5) 66.7 (63.7, 69.5) 69.3 (63.2, 74.8) 68.3 (60.9, 74.9) 66.5 (63.6, 69.3) 70.1 (67.2, 72.8) 65.5 (61.6, 69.1)
On television 64.1 (61.1, 67.0) 64.2 (61.1, 67.2) 61.7 (55.1, 67.9) 68.0 (60.6, 74.5) 63.3 (60.1, 66.3) 68.2 (65.3, 71.0) 62.4 (58.3, 66.3)
On the radio 26.9 (24.4, 29.6) 26.7 (24.1, 29.5) 29.9 (23.5, 37.2) 18.1 (13.2, 24.3) 28.8 (26.1, 31.6) 24.4 (22.0, 27.0) 28.0 (24.6, 31.6)
On billboards 28.3 (25.8, 31.0) 28.8 (26.2, 31.6) 20.5 (15.2, 27.1) 27.2 (21.0, 34.4) 28.6 (26.0, 31.3) 39.2 (36.2, 42.3) 23.8 (20.6, 27.4)
Leaflet/sticker 33.4 (30.5, 36.6) 33.8 (30.7, 37.1) 26.9 (20.7, 34.1) 35.2 (28.4, 42.7) 33.1 (30.1, 36.2) 41.5 (38.4, 44.7) 30.1 (26.2, 34.3)
Internet 4.2 (3.3, 5.3) 4.3 (3.4, 5.5) 2.5 (1.3, 4.6) 11.8 (7.7, 17.6) 2.6 (2.1, 3.2) 8.4 (6.9, 10.2) 2.4 (1.5, 4.0)
Campaign activity 10.1 (8.4, 12.2) 10.2 (8.4, 12.4) 8.5 (5.6, 12.8) 13.3 (8.7, 19.7) 9.5 (7.9, 11.3) 13.8 (11.7, 16.2) 8.6 (6.4, 11.4)
Demonstration board
19.5 (17.2, 22.1) 20.0 (17.5, 22.7) 12.7 (8.9, 17.8) 25.6 (18.9, 33.5) 18.3 (16.1, 20.7) 23.5 (20.9, 26.4) 17.9 (14.8, 21.4)
Somewhere else 0.9 (0.4, 2.2) 0.9 (0.4, 2.3) 0.1 (0.0, 0.7) 2.9 (0.7, 10.9) 0.5 (0.3, 0.8) 0.6 (0.3, 1.2) 1.0 (0.3, 3.0)
Any location 78.3 (75.8, 80.6) 78.3 (75.7, 80.7) 77.9 (72.5, 82.4) 82.0 (74.7, 87.5) 77.5 (74.9, 79.9) 82.1 (79.5, 84.4) 76.7 (73.3, 79.8)
Non-smokers2
In newspapers or magazines
21.3 (20.0, 22.7) 23.7 (21.7, 25.9) 20.1 (18.7, 21.6) 24.5 (21.4, 27.8) 20.6 (19.3, 21.9) 28.6 (26.9, 30.4) 17.2 (15.4, 19.2)
On television or the radio
71.9 (69.9, 73.9) 73.2 (70.9, 75.4) 71.3 (69.1, 73.4) 76.9 (73.3, 80.1) 70.7 (68.7, 72.7) 74.1 (72.3, 75.8) 70.7 (67.7, 73.5)
On television 69.3 (67.3, 71.3) 70.3 (67.8, 72.6) 68.8 (66.6, 71.0) 75.7 (72.2, 79.0) 67.7 (65.6, 69.8) 72.1 (70.3, 73.9) 67.7 (64.7, 70.6)
On the radio 29.2 (27.4, 31.1) 31.4 (28.9, 34.1) 28.0 (26.3, 29.9) 23.8 (20.6, 27.4) 30.5 (28.6, 32.5) 26.0 (24.3, 27.8) 31.0 (28.4, 33.8)
On billboards 33.9 (31.8, 36.0) 35.5 (32.7, 38.5) 33.0 (31.0, 35.1) 43.8 (39.9, 47.9) 31.4 (29.4, 33.5) 38.9 (36.7, 41.2) 31.0 (28.1, 34.0)
Leaflet/sticker 39.6 (37.4, 42.0) 40.6 (37.7, 43.6) 39.1 (36.8, 41.5) 51.6 (47.5, 55.7) 36.7 (34.4, 39.0) 42.5 (40.3, 44.7) 38.0 (34.7, 41.4)
Internet 9.8 (8.9, 10.7) 12.0 (10.5, 13.7) 8.6 (7.8, 9.6) 25.8 (22.7, 29.3) 5.8 (5.3, 6.5) 14.1 (13.0, 15.4) 7.3 (6.1, 8.7)
Campaign activity 12.9 (11.6, 14.3) 14.4 (12.6, 16.3) 12.2 (10.9, 13.6) 19.9 (17.0, 23.1) 11.2 (10.0, 12.6) 15.4 (14.0, 17.0) 11.5 (9.7, 13.6)
Demonstration board
26.6 (24.7, 28.6) 29.0 (26.4, 31.8) 25.4 (23.5, 27.4) 42.0 (37.7, 46.3) 22.9 (21.1, 24.7) 27.5 (25.7, 29.4) 26.1 (23.4, 29.1)
Somewhere else 0.3 (0.2, 0.4) 0.2 (0.1, 0.4) 0.3 (0.2, 0.5) 0.4 (0.2, 0.9) 0.3 (0.2, 0.4) 0.5 (0.3, 0.7) 0.2 (0.1, 0.4)
Any location 82.2 (80.6, 83.6) 83.4 (81.4, 85.2) 81.5 (79.8, 83.1) 89.1 (86.3, 91.3) 80.5 (78.8, 82.0) 84.8 (83.2, 86.3) 80.7 (78.3, 82.8)
1 Includes daily and occasional (less than daily) smokers 2 Includes former and never smokers
8-2 Media
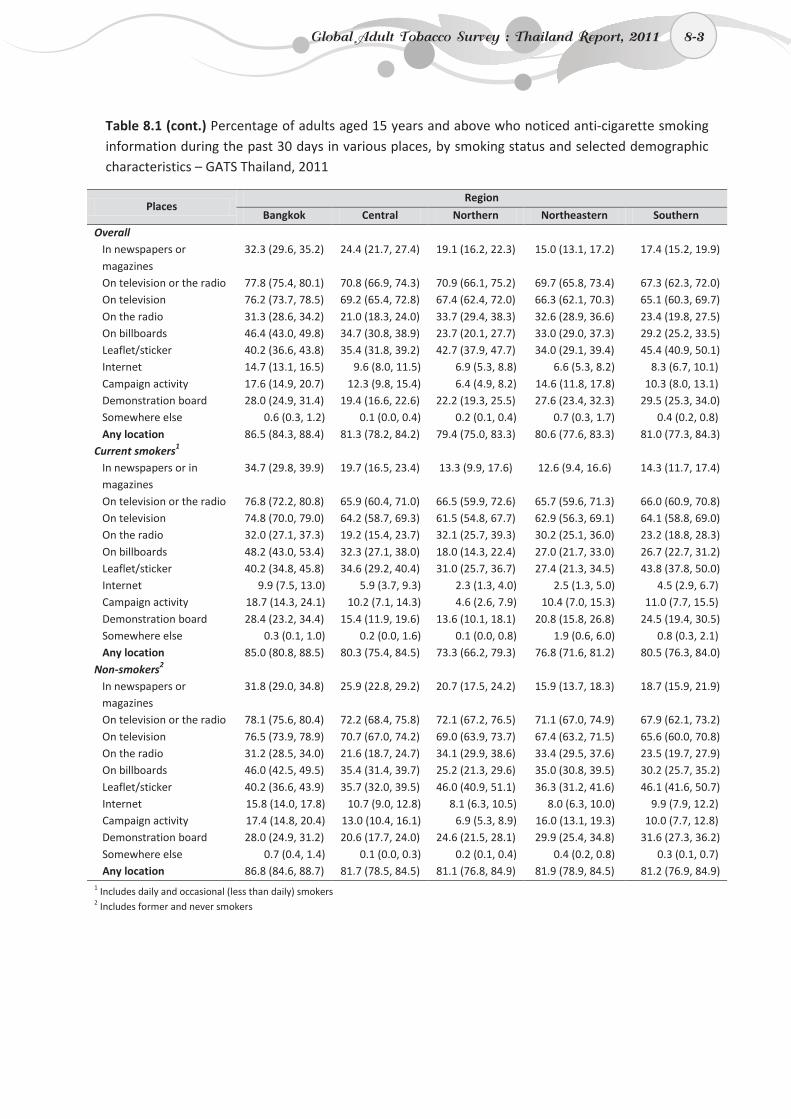
8-3
Table 8.1 (cont.) Percentage of adults aged 15 years and above who noticed anti-cigarette smoking information during the past 30 days in various places, by smoking status and selected demographic characteristics – GATS Thailand, 2011
Places Region
Bangkok Central Northern Northeastern Southern
Overall In newspapers or magazines
32.3 (29.6, 35.2) 24.4 (21.7, 27.4) 19.1 (16.2, 22.3) 15.0 (13.1, 17.2) 17.4 (15.2, 19.9)
On television or the radio 77.8 (75.4, 80.1) 70.8 (66.9, 74.3) 70.9 (66.1, 75.2) 69.7 (65.8, 73.4) 67.3 (62.3, 72.0) On television 76.2 (73.7, 78.5) 69.2 (65.4, 72.8) 67.4 (62.4, 72.0) 66.3 (62.1, 70.3) 65.1 (60.3, 69.7) On the radio 31.3 (28.6, 34.2) 21.0 (18.3, 24.0) 33.7 (29.4, 38.3) 32.6 (28.9, 36.6) 23.4 (19.8, 27.5) On billboards 46.4 (43.0, 49.8) 34.7 (30.8, 38.9) 23.7 (20.1, 27.7) 33.0 (29.0, 37.3) 29.2 (25.2, 33.5) Leaflet/sticker 40.2 (36.6, 43.8) 35.4 (31.8, 39.2) 42.7 (37.9, 47.7) 34.0 (29.1, 39.4) 45.4 (40.9, 50.1) Internet 14.7 (13.1, 16.5) 9.6 (8.0, 11.5) 6.9 (5.3, 8.8) 6.6 (5.3, 8.2) 8.3 (6.7, 10.1) Campaign activity 17.6 (14.9, 20.7) 12.3 (9.8, 15.4) 6.4 (4.9, 8.2) 14.6 (11.8, 17.8) 10.3 (8.0, 13.1) Demonstration board 28.0 (24.9, 31.4) 19.4 (16.6, 22.6) 22.2 (19.3, 25.5) 27.6 (23.4, 32.3) 29.5 (25.3, 34.0) Somewhere else 0.6 (0.3, 1.2) 0.1 (0.0, 0.4) 0.2 (0.1, 0.4) 0.7 (0.3, 1.7) 0.4 (0.2, 0.8) Any location 86.5 (84.3, 88.4) 81.3 (78.2, 84.2) 79.4 (75.0, 83.3) 80.6 (77.6, 83.3) 81.0 (77.3, 84.3)
Current smokers1 In newspapers or in magazines
34.7 (29.8, 39.9) 19.7 (16.5, 23.4) 13.3 (9.9, 17.6) 12.6 (9.4, 16.6) 14.3 (11.7, 17.4)
On television or the radio 76.8 (72.2, 80.8) 65.9 (60.4, 71.0) 66.5 (59.9, 72.6) 65.7 (59.6, 71.3) 66.0 (60.9, 70.8) On television 74.8 (70.0, 79.0) 64.2 (58.7, 69.3) 61.5 (54.8, 67.7) 62.9 (56.3, 69.1) 64.1 (58.8, 69.0) On the radio 32.0 (27.1, 37.3) 19.2 (15.4, 23.7) 32.1 (25.7, 39.3) 30.2 (25.1, 36.0) 23.2 (18.8, 28.3) On billboards 48.2 (43.0, 53.4) 32.3 (27.1, 38.0) 18.0 (14.3, 22.4) 27.0 (21.7, 33.0) 26.7 (22.7, 31.2) Leaflet/sticker 40.2 (34.8, 45.8) 34.6 (29.2, 40.4) 31.0 (25.7, 36.7) 27.4 (21.3, 34.5) 43.8 (37.8, 50.0) Internet 9.9 (7.5, 13.0) 5.9 (3.7, 9.3) 2.3 (1.3, 4.0) 2.5 (1.3, 5.0) 4.5 (2.9, 6.7) Campaign activity 18.7 (14.3, 24.1) 10.2 (7.1, 14.3) 4.6 (2.6, 7.9) 10.4 (7.0, 15.3) 11.0 (7.7, 15.5) Demonstration board 28.4 (23.2, 34.4) 15.4 (11.9, 19.6) 13.6 (10.1, 18.1) 20.8 (15.8, 26.8) 24.5 (19.4, 30.5) Somewhere else 0.3 (0.1, 1.0) 0.2 (0.0, 1.6) 0.1 (0.0, 0.8) 1.9 (0.6, 6.0) 0.8 (0.3, 2.1) Any location 85.0 (80.8, 88.5) 80.3 (75.4, 84.5) 73.3 (66.2, 79.3) 76.8 (71.6, 81.2) 80.5 (76.3, 84.0)
Non-smokers2 In newspapers or magazines
31.8 (29.0, 34.8) 25.9 (22.8, 29.2) 20.7 (17.5, 24.2) 15.9 (13.7, 18.3) 18.7 (15.9, 21.9)
On television or the radio 78.1 (75.6, 80.4) 72.2 (68.4, 75.8) 72.1 (67.2, 76.5) 71.1 (67.0, 74.9) 67.9 (62.1, 73.2) On television 76.5 (73.9, 78.9) 70.7 (67.0, 74.2) 69.0 (63.9, 73.7) 67.4 (63.2, 71.5) 65.6 (60.0, 70.8) On the radio 31.2 (28.5, 34.0) 21.6 (18.7, 24.7) 34.1 (29.9, 38.6) 33.4 (29.5, 37.6) 23.5 (19.7, 27.9) On billboards 46.0 (42.5, 49.5) 35.4 (31.4, 39.7) 25.2 (21.3, 29.6) 35.0 (30.8, 39.5) 30.2 (25.7, 35.2) Leaflet/sticker 40.2 (36.6, 43.9) 35.7 (32.0, 39.5) 46.0 (40.9, 51.1) 36.3 (31.2, 41.6) 46.1 (41.6, 50.7) Internet 15.8 (14.0, 17.8) 10.7 (9.0, 12.8) 8.1 (6.3, 10.5) 8.0 (6.3, 10.0) 9.9 (7.9, 12.2) Campaign activity 17.4 (14.8, 20.4) 13.0 (10.4, 16.1) 6.9 (5.3, 8.9) 16.0 (13.1, 19.3) 10.0 (7.7, 12.8) Demonstration board 28.0 (24.9, 31.2) 20.6 (17.7, 24.0) 24.6 (21.5, 28.1) 29.9 (25.4, 34.8) 31.6 (27.3, 36.2) Somewhere else 0.7 (0.4, 1.4) 0.1 (0.0, 0.3) 0.2 (0.1, 0.4) 0.4 (0.2, 0.8) 0.3 (0.1, 0.7) Any location 86.8 (84.6, 88.7) 81.7 (78.5, 84.5) 81.1 (76.8, 84.9) 81.9 (78.9, 84.5) 81.2 (76.9, 84.9)
1 Includes daily and occasional (less than daily) smokers2 Includes former and never smokers
Global Adult Tobacco Survey : Thailand Report, 2011 8-3
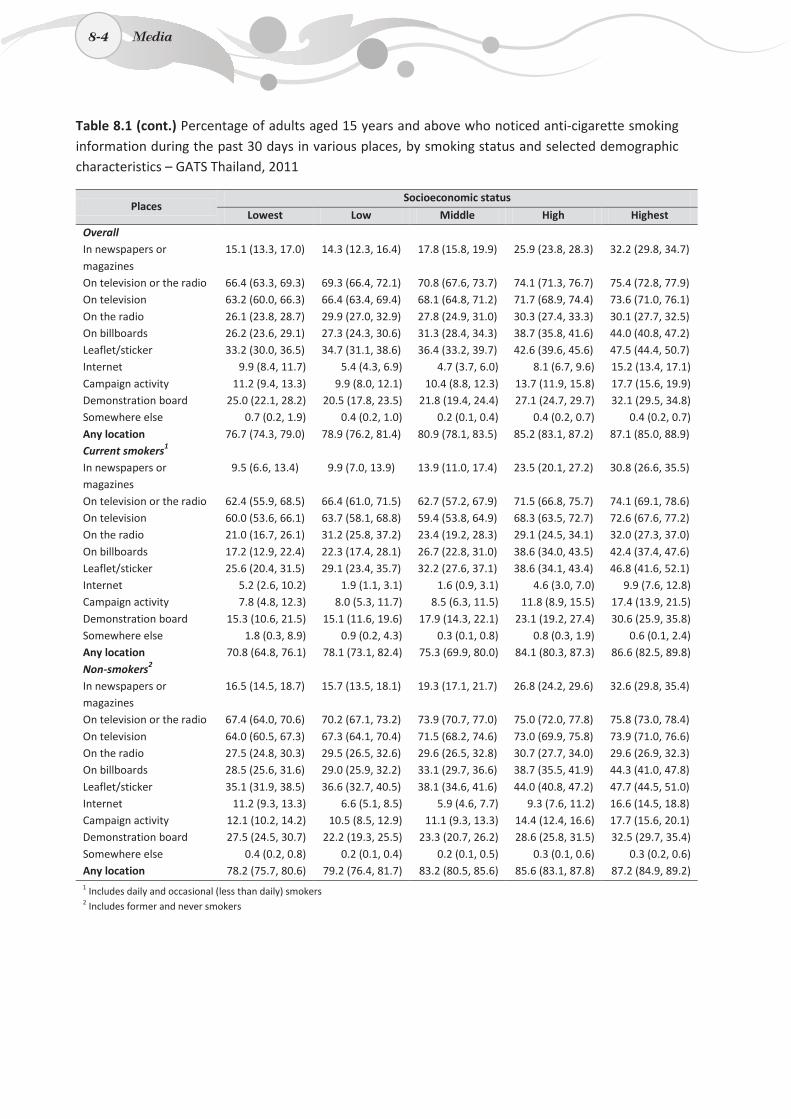
8-4
Table 8.1 (cont.) Percentage of adults aged 15 years and above who noticed anti-cigarette smoking information during the past 30 days in various places, by smoking status and selected demographic characteristics – GATS Thailand, 2011
Places Socioeconomic status
Lowest Low Middle High Highest
Overall In newspapers or magazines
15.1 (13.3, 17.0) 14.3 (12.3, 16.4) 17.8 (15.8, 19.9) 25.9 (23.8, 28.3) 32.2 (29.8, 34.7)
On television or the radio 66.4 (63.3, 69.3) 69.3 (66.4, 72.1) 70.8 (67.6, 73.7) 74.1 (71.3, 76.7) 75.4 (72.8, 77.9) On television 63.2 (60.0, 66.3) 66.4 (63.4, 69.4) 68.1 (64.8, 71.2) 71.7 (68.9, 74.4) 73.6 (71.0, 76.1) On the radio 26.1 (23.8, 28.7) 29.9 (27.0, 32.9) 27.8 (24.9, 31.0) 30.3 (27.4, 33.3) 30.1 (27.7, 32.5) On billboards 26.2 (23.6, 29.1) 27.3 (24.3, 30.6) 31.3 (28.4, 34.3) 38.7 (35.8, 41.6) 44.0 (40.8, 47.2) Leaflet/sticker 33.2 (30.0, 36.5) 34.7 (31.1, 38.6) 36.4 (33.2, 39.7) 42.6 (39.6, 45.6) 47.5 (44.4, 50.7) Internet 9.9 (8.4, 11.7) 5.4 (4.3, 6.9) 4.7 (3.7, 6.0) 8.1 (6.7, 9.6) 15.2 (13.4, 17.1) Campaign activity 11.2 (9.4, 13.3) 9.9 (8.0, 12.1) 10.4 (8.8, 12.3) 13.7 (11.9, 15.8) 17.7 (15.6, 19.9) Demonstration board 25.0 (22.1, 28.2) 20.5 (17.8, 23.5) 21.8 (19.4, 24.4) 27.1 (24.7, 29.7) 32.1 (29.5, 34.8) Somewhere else 0.7 (0.2, 1.9) 0.4 (0.2, 1.0) 0.2 (0.1, 0.4) 0.4 (0.2, 0.7) 0.4 (0.2, 0.7) Any location 76.7 (74.3, 79.0) 78.9 (76.2, 81.4) 80.9 (78.1, 83.5) 85.2 (83.1, 87.2) 87.1 (85.0, 88.9) Current smokers1 In newspapers or magazines
9.5 (6.6, 13.4) 9.9 (7.0, 13.9) 13.9 (11.0, 17.4) 23.5 (20.1, 27.2) 30.8 (26.6, 35.5)
On television or the radio 62.4 (55.9, 68.5) 66.4 (61.0, 71.5) 62.7 (57.2, 67.9) 71.5 (66.8, 75.7) 74.1 (69.1, 78.6) On television 60.0 (53.6, 66.1) 63.7 (58.1, 68.8) 59.4 (53.8, 64.9) 68.3 (63.5, 72.7) 72.6 (67.6, 77.2) On the radio 21.0 (16.7, 26.1) 31.2 (25.8, 37.2) 23.4 (19.2, 28.3) 29.1 (24.5, 34.1) 32.0 (27.3, 37.0) On billboards 17.2 (12.9, 22.4) 22.3 (17.4, 28.1) 26.7 (22.8, 31.0) 38.6 (34.0, 43.5) 42.4 (37.4, 47.6) Leaflet/sticker 25.6 (20.4, 31.5) 29.1 (23.4, 35.7) 32.2 (27.6, 37.1) 38.6 (34.1, 43.4) 46.8 (41.6, 52.1) Internet 5.2 (2.6, 10.2) 1.9 (1.1, 3.1) 1.6 (0.9, 3.1) 4.6 (3.0, 7.0) 9.9 (7.6, 12.8) Campaign activity 7.8 (4.8, 12.3) 8.0 (5.3, 11.7) 8.5 (6.3, 11.5) 11.8 (8.9, 15.5) 17.4 (13.9, 21.5) Demonstration board 15.3 (10.6, 21.5) 15.1 (11.6, 19.6) 17.9 (14.3, 22.1) 23.1 (19.2, 27.4) 30.6 (25.9, 35.8) Somewhere else 1.8 (0.3, 8.9) 0.9 (0.2, 4.3) 0.3 (0.1, 0.8) 0.8 (0.3, 1.9) 0.6 (0.1, 2.4) Any location 70.8 (64.8, 76.1) 78.1 (73.1, 82.4) 75.3 (69.9, 80.0) 84.1 (80.3, 87.3) 86.6 (82.5, 89.8) Non-smokers2 In newspapers or magazines
16.5 (14.5, 18.7) 15.7 (13.5, 18.1) 19.3 (17.1, 21.7) 26.8 (24.2, 29.6) 32.6 (29.8, 35.4)
On television or the radio 67.4 (64.0, 70.6) 70.2 (67.1, 73.2) 73.9 (70.7, 77.0) 75.0 (72.0, 77.8) 75.8 (73.0, 78.4) On television 64.0 (60.5, 67.3) 67.3 (64.1, 70.4) 71.5 (68.2, 74.6) 73.0 (69.9, 75.8) 73.9 (71.0, 76.6) On the radio 27.5 (24.8, 30.3) 29.5 (26.5, 32.6) 29.6 (26.5, 32.8) 30.7 (27.7, 34.0) 29.6 (26.9, 32.3) On billboards 28.5 (25.6, 31.6) 29.0 (25.9, 32.2) 33.1 (29.7, 36.6) 38.7 (35.5, 41.9) 44.3 (41.0, 47.8) Leaflet/sticker 35.1 (31.9, 38.5) 36.6 (32.7, 40.5) 38.1 (34.6, 41.6) 44.0 (40.8, 47.2) 47.7 (44.5, 51.0) Internet 11.2 (9.3, 13.3) 6.6 (5.1, 8.5) 5.9 (4.6, 7.7) 9.3 (7.6, 11.2) 16.6 (14.5, 18.8) Campaign activity 12.1 (10.2, 14.2) 10.5 (8.5, 12.9) 11.1 (9.3, 13.3) 14.4 (12.4, 16.6) 17.7 (15.6, 20.1) Demonstration board 27.5 (24.5, 30.7) 22.2 (19.3, 25.5) 23.3 (20.7, 26.2) 28.6 (25.8, 31.5) 32.5 (29.7, 35.4) Somewhere else 0.4 (0.2, 0.8) 0.2 (0.1, 0.4) 0.2 (0.1, 0.5) 0.3 (0.1, 0.6) 0.3 (0.2, 0.6) Any location 78.2 (75.7, 80.6) 79.2 (76.4, 81.7) 83.2 (80.5, 85.6) 85.6 (83.1, 87.8) 87.2 (84.9, 89.2) 1 Includes daily and occasional (less than daily) smokers2 Includes former and never smokers
8-4 Media
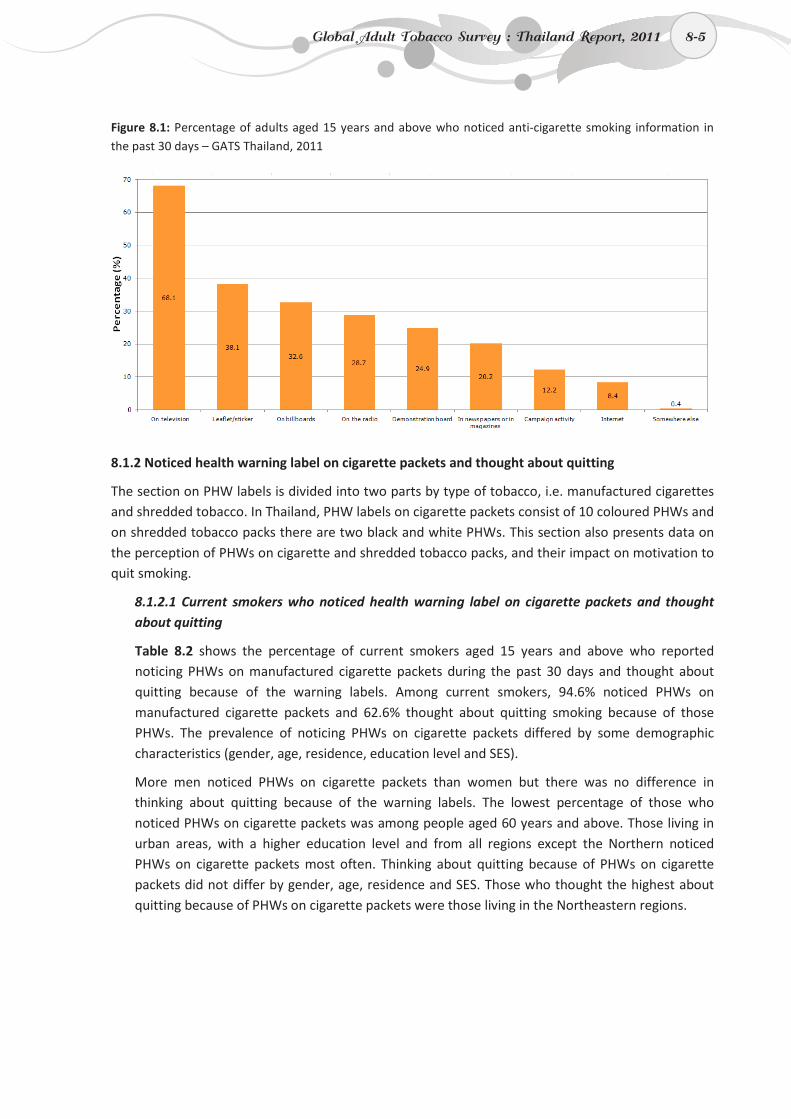
8-5
Figure 8.1: Percentage of adults aged 15 years and above who noticed anti-cigarette smoking information in the past 30 days – GATS Thailand, 2011
8.1.2 Noticed health warning label on cigarette packets and thought about quitting
The section on PHW labels is divided into two parts by type of tobacco, i.e. manufactured cigarettes and shredded tobacco. In Thailand, PHW labels on cigarette packets consist of 10 coloured PHWs and on shredded tobacco packs there are two black and white PHWs. This section also presents data on the perception of PHWs on cigarette and shredded tobacco packs, and their impact on motivation to quit smoking.
8.1.2.1 Current smokers who noticed health warning label on cigarette packets and thought about quitting
Table 8.2 shows the percentage of current smokers aged 15 years and above who reported noticing PHWs on manufactured cigarette packets during the past 30 days and thought about quitting because of the warning labels. Among current smokers, 94.6% noticed PHWs on manufactured cigarette packets and 62.6% thought about quitting smoking because of those PHWs. The prevalence of noticing PHWs on cigarette packets differed by some demographic characteristics (gender, age, residence, education level and SES).
More men noticed PHWs on cigarette packets than women but there was no difference in thinking about quitting because of the warning labels. The lowest percentage of those who noticed PHWs on cigarette packets was among people aged 60 years and above. Those living in urban areas, with a higher education level and from all regions except the Northern noticed PHWs on cigarette packets most often. Thinking about quitting because of PHWs on cigarette packets did not differ by gender, age, residence and SES. Those who thought the highest about quitting because of PHWs on cigarette packets were those living in the Northeastern regions.
Global Adult Tobacco Survey : Thailand Report, 2011 8-5
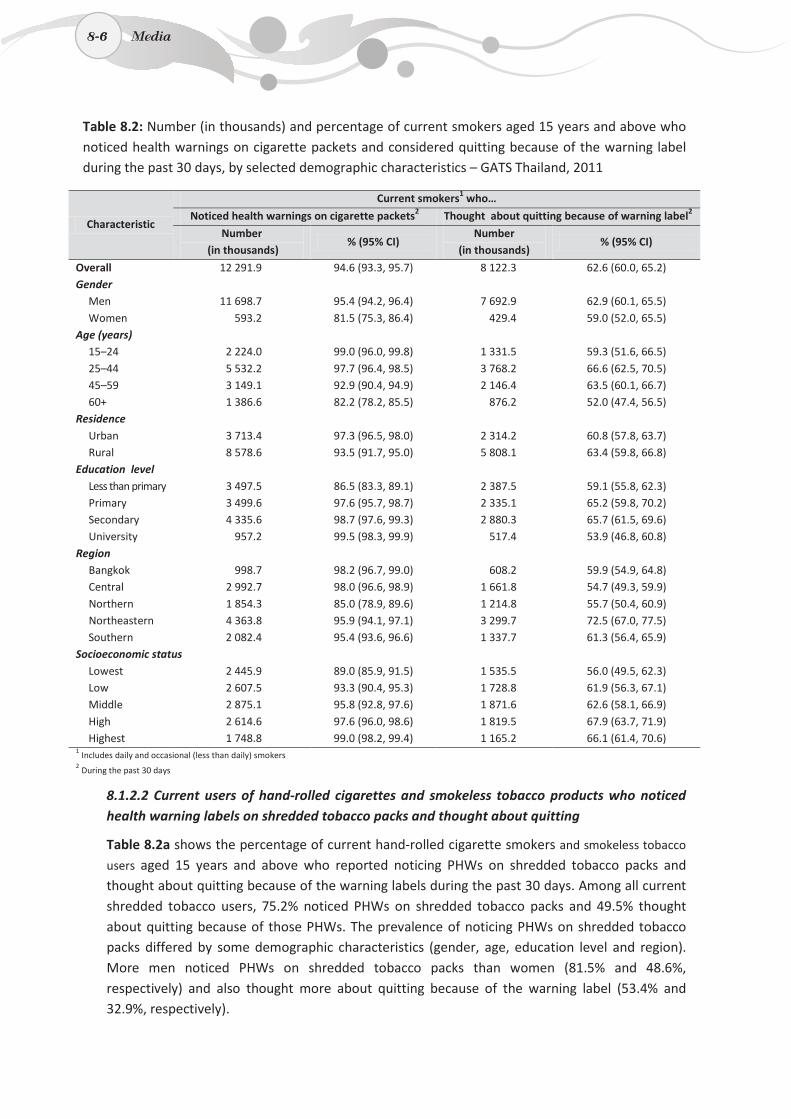
8-6
Table 8.2: Number (in thousands) and percentage of current smokers aged 15 years and above who noticed health warnings on cigarette packets and considered quitting because of the warning label during the past 30 days, by selected demographic characteristics – GATS Thailand, 2011
Characteristic
Current smokers1 who…
Noticed health warnings on cigarette packets2 Thought about quitting because of warning label2
Number (in thousands)
% (95% CI) Number
(in thousands) % (95% CI)
Overall 12 291.9 94.6 (93.3, 95.7) 8 122.3 62.6 (60.0, 65.2) Gender
Men 11 698.7 95.4 (94.2, 96.4) 7 692.9 62.9 (60.1, 65.5) Women 593.2 81.5 (75.3, 86.4) 429.4 59.0 (52.0, 65.5)
Age (years) 15–24 2 224.0 99.0 (96.0, 99.8) 1 331.5 59.3 (51.6, 66.5) 25–44 5 532.2 97.7 (96.4, 98.5) 3 768.2 66.6 (62.5, 70.5) 45–59 3 149.1 92.9 (90.4, 94.9) 2 146.4 63.5 (60.1, 66.7) 60+ 1 386.6 82.2 (78.2, 85.5) 876.2 52.0 (47.4, 56.5)
Residence Urban 3 713.4 97.3 (96.5, 98.0) 2 314.2 60.8 (57.8, 63.7) Rural 8 578.6 93.5 (91.7, 95.0) 5 808.1 63.4 (59.8, 66.8)
Education level Less than primary 3 497.5 86.5 (83.3, 89.1) 2 387.5 59.1 (55.8, 62.3) Primary 3 499.6 97.6 (95.7, 98.7) 2 335.1 65.2 (59.8, 70.2) Secondary 4 335.6 98.7 (97.6, 99.3) 2 880.3 65.7 (61.5, 69.6) University 957.2 99.5 (98.3, 99.9) 517.4 53.9 (46.8, 60.8)
Region Bangkok 998.7 98.2 (96.7, 99.0) 608.2 59.9 (54.9, 64.8) Central 2 992.7 98.0 (96.6, 98.9) 1 661.8 54.7 (49.3, 59.9) Northern 1 854.3 85.0 (78.9, 89.6) 1 214.8 55.7 (50.4, 60.9) Northeastern 4 363.8 95.9 (94.1, 97.1) 3 299.7 72.5 (67.0, 77.5) Southern 2 082.4 95.4 (93.6, 96.6) 1 337.7 61.3 (56.4, 65.9)
Socioeconomic status Lowest 2 445.9 89.0 (85.9, 91.5) 1 535.5 56.0 (49.5, 62.3) Low 2 607.5 93.3 (90.4, 95.3) 1 728.8 61.9 (56.3, 67.1) Middle 2 875.1 95.8 (92.8, 97.6) 1 871.6 62.6 (58.1, 66.9) High 2 614.6 97.6 (96.0, 98.6) 1 819.5 67.9 (63.7, 71.9) Highest 1 748.8 99.0 (98.2, 99.4) 1 165.2 66.1 (61.4, 70.6)
1 Includes daily and occasional (less than daily) smokers 2 During the past 30 days
8.1.2.2 Current users of hand-rolled cigarettes and smokeless tobacco products who noticed health warning labels on shredded tobacco packs and thought about quitting
Table 8.2a shows the percentage of current hand-rolled cigarette smokers and smokeless tobacco
users aged 15 years and above who reported noticing PHWs on shredded tobacco packs and thought about quitting because of the warning labels during the past 30 days. Among all current shredded tobacco users, 75.2% noticed PHWs on shredded tobacco packs and 49.5% thought about quitting because of those PHWs. The prevalence of noticing PHWs on shredded tobacco packs differed by some demographic characteristics (gender, age, education level and region). More men noticed PHWs on shredded tobacco packs than women (81.5% and 48.6%, respectively) and also thought more about quitting because of the warning label (53.4% and 32.9%, respectively).
8-6 Media
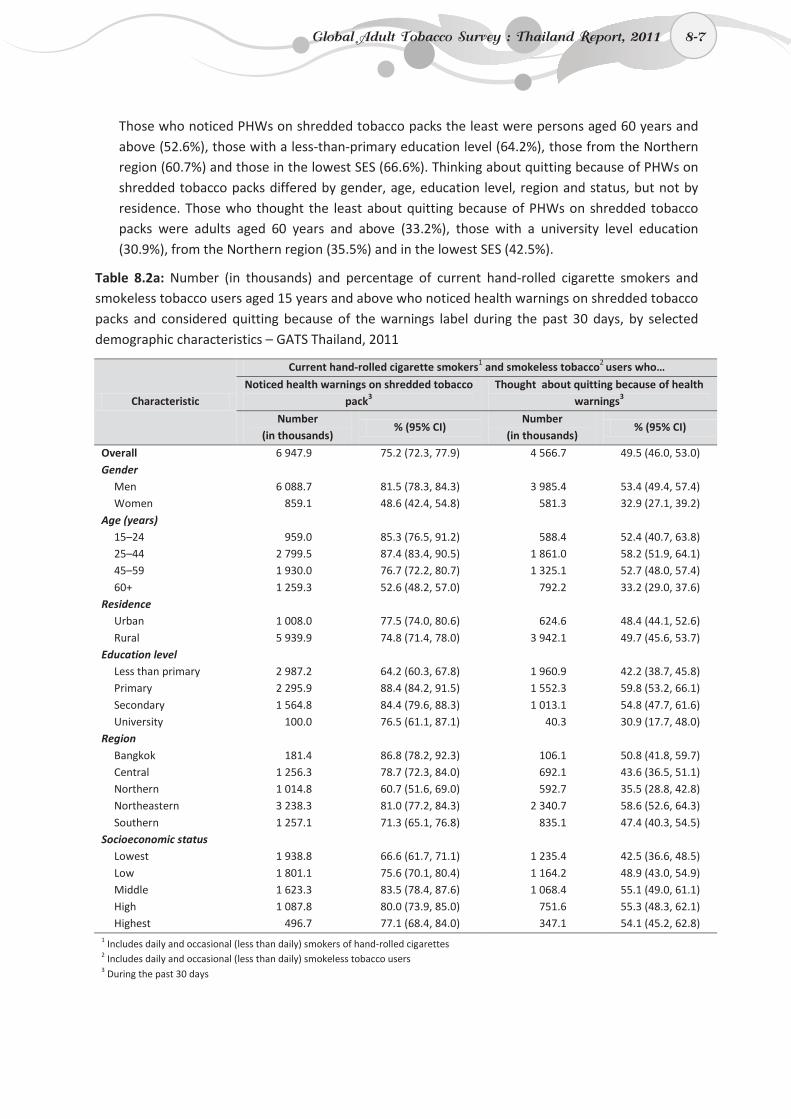
8-7
Those who noticed PHWs on shredded tobacco packs the least were persons aged 60 years and above (52.6%), those with a less-than-primary education level (64.2%), those from the Northern region (60.7%) and those in the lowest SES (66.6%). Thinking about quitting because of PHWs on shredded tobacco packs differed by gender, age, education level, region and status, but not by residence. Those who thought the least about quitting because of PHWs on shredded tobacco packs were adults aged 60 years and above (33.2%), those with a university level education (30.9%), from the Northern region (35.5%) and in the lowest SES (42.5%).
Table 8.2a: Number (in thousands) and percentage of current hand-rolled cigarette smokers and smokeless tobacco users aged 15 years and above who noticed health warnings on shredded tobacco packs and considered quitting because of the warnings label during the past 30 days, by selected demographic characteristics – GATS Thailand, 2011
Characteristic
Current hand-rolled cigarette smokers1 and smokeless tobacco2 users who…
Noticed health warnings on shredded tobacco pack3
Thought about quitting because of health warnings3
Number (in thousands)
% (95% CI) Number
(in thousands) % (95% CI)
Overall 6 947.9 75.2 (72.3, 77.9) 4 566.7 49.5 (46.0, 53.0) Gender
Men 6 088.7 81.5 (78.3, 84.3) 3 985.4 53.4 (49.4, 57.4) Women 859.1 48.6 (42.4, 54.8) 581.3 32.9 (27.1, 39.2)
Age (years) 15–24 959.0 85.3 (76.5, 91.2) 588.4 52.4 (40.7, 63.8) 25–44 2 799.5 87.4 (83.4, 90.5) 1 861.0 58.2 (51.9, 64.1) 45–59 1 930.0 76.7 (72.2, 80.7) 1 325.1 52.7 (48.0, 57.4) 60+ 1 259.3 52.6 (48.2, 57.0) 792.2 33.2 (29.0, 37.6)
Residence Urban 1 008.0 77.5 (74.0, 80.6) 624.6 48.4 (44.1, 52.6) Rural 5 939.9 74.8 (71.4, 78.0) 3 942.1 49.7 (45.6, 53.7)
Education level Less than primary 2 987.2 64.2 (60.3, 67.8) 1 960.9 42.2 (38.7, 45.8) Primary 2 295.9 88.4 (84.2, 91.5) 1 552.3 59.8 (53.2, 66.1) Secondary 1 564.8 84.4 (79.6, 88.3) 1 013.1 54.8 (47.7, 61.6) University 100.0 76.5 (61.1, 87.1) 40.3 30.9 (17.7, 48.0)
Region Bangkok 181.4 86.8 (78.2, 92.3) 106.1 50.8 (41.8, 59.7) Central 1 256.3 78.7 (72.3, 84.0) 692.1 43.6 (36.5, 51.1) Northern 1 014.8 60.7 (51.6, 69.0) 592.7 35.5 (28.8, 42.8) Northeastern 3 238.3 81.0 (77.2, 84.3) 2 340.7 58.6 (52.6, 64.3) Southern 1 257.1 71.3 (65.1, 76.8) 835.1 47.4 (40.3, 54.5)
Socioeconomic status Lowest 1 938.8 66.6 (61.7, 71.1) 1 235.4 42.5 (36.6, 48.5) Low 1 801.1 75.6 (70.1, 80.4) 1 164.2 48.9 (43.0, 54.9) Middle 1 623.3 83.5 (78.4, 87.6) 1 068.4 55.1 (49.0, 61.1) High 1 087.8 80.0 (73.9, 85.0) 751.6 55.3 (48.3, 62.1) Highest 496.7 77.1 (68.4, 84.0) 347.1 54.1 (45.2, 62.8)
1 Includes daily and occasional (less than daily) smokers of hand-rolled cigarettes 2 Includes daily and occasional (less than daily) smokeless tobacco users 3 During the past 30 days
Global Adult Tobacco Survey : Thailand Report, 2011 8-7
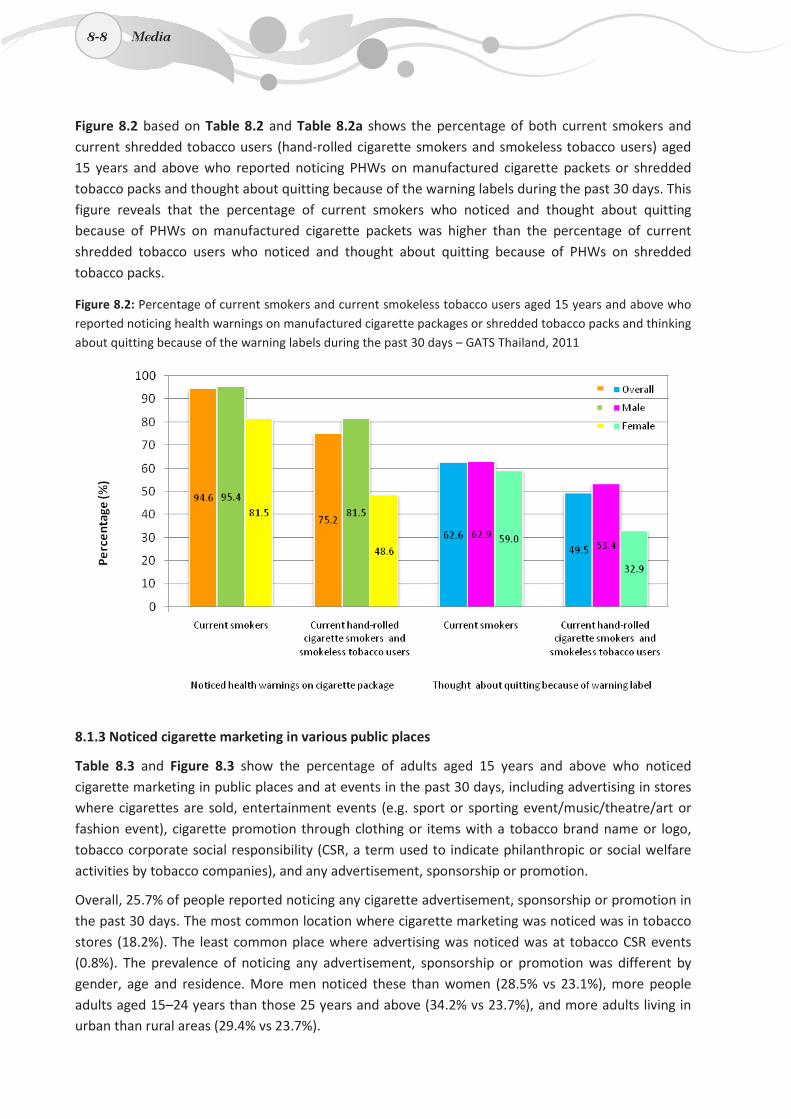
8-8
Figure 8.2 based on Table 8.2 and Table 8.2a shows the percentage of both current smokers and current shredded tobacco users (hand-rolled cigarette smokers and smokeless tobacco users) aged 15 years and above who reported noticing PHWs on manufactured cigarette packets or shredded tobacco packs and thought about quitting because of the warning labels during the past 30 days. This figure reveals that the percentage of current smokers who noticed and thought about quitting because of PHWs on manufactured cigarette packets was higher than the percentage of current shredded tobacco users who noticed and thought about quitting because of PHWs on shredded tobacco packs.
Figure 8.2: Percentage of current smokers and current smokeless tobacco users aged 15 years and above who reported noticing health warnings on manufactured cigarette packages or shredded tobacco packs and thinking about quitting because of the warning labels during the past 30 days – GATS Thailand, 2011
8.1.3 Noticed cigarette marketing in various public places
Table 8.3 and Figure 8.3 show the percentage of adults aged 15 years and above who noticed cigarette marketing in public places and at events in the past 30 days, including advertising in stores where cigarettes are sold, entertainment events (e.g. sport or sporting event/music/theatre/art or fashion event), cigarette promotion through clothing or items with a tobacco brand name or logo, tobacco corporate social responsibility (CSR, a term used to indicate philanthropic or social welfare activities by tobacco companies), and any advertisement, sponsorship or promotion.
Overall, 25.7% of people reported noticing any cigarette advertisement, sponsorship or promotion in the past 30 days. The most common location where cigarette marketing was noticed was in tobacco stores (18.2%). The least common place where advertising was noticed was at tobacco CSR events (0.8%). The prevalence of noticing any advertisement, sponsorship or promotion was different by gender, age and residence. More men noticed these than women (28.5% vs 23.1%), more people adults aged 15–24 years than those 25 years and above (34.2% vs 23.7%), and more adults living in urban than rural areas (29.4% vs 23.7%).
8-8 Media
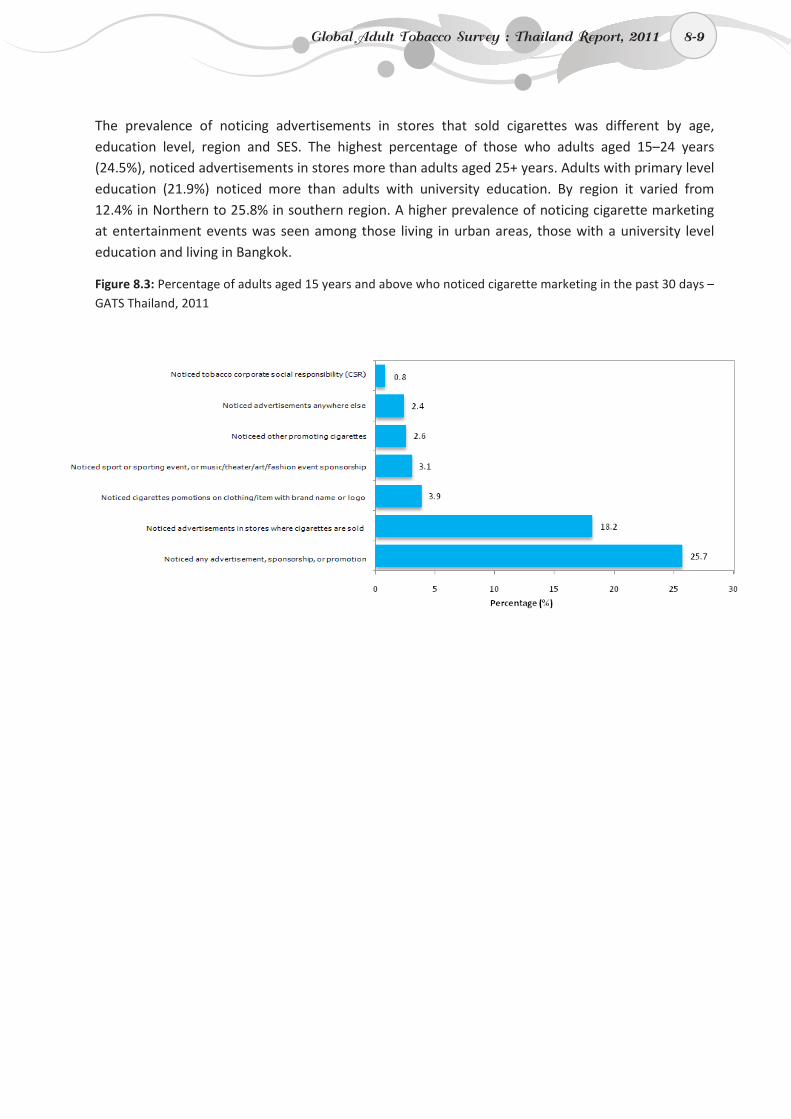
8-9
The prevalence of noticing advertisements in stores that sold cigarettes was different by age, education level, region and SES. The highest percentage of those who adults aged 15–24 years (24.5%), noticed advertisements in stores more than adults aged 25+ years. Adults with primary level education (21.9%) noticed more than adults with university education. By region it varied from 12.4% in Northern to 25.8% in southern region. A higher prevalence of noticing cigarette marketing at entertainment events was seen among those living in urban areas, those with a university level education and living in Bangkok.
Figure 8.3: Percentage of adults aged 15 years and above who noticed cigarette marketing in the past 30 days – GATS Thailand, 2011
Global Adult Tobacco Survey : Thailand Report, 2011 8-9
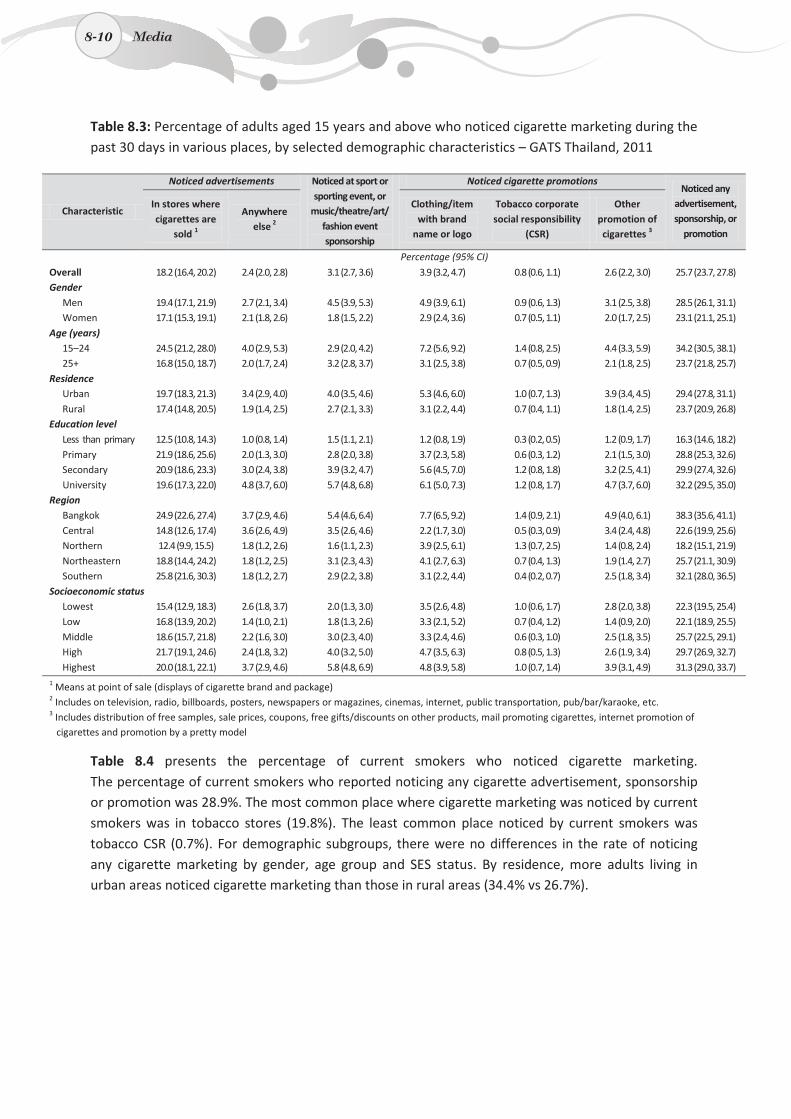
8-10
Table 8.3: Percentage of adults aged 15 years and above who noticed cigarette marketing during the past 30 days in various places, by selected demographic characteristics – GATS Thailand, 2011
Characteristic
Noticed advertisements Noticed at sport or sporting event, or
music/theatre/art/ fashion event sponsorship
Noticed cigarette promotions Noticed any
advertisement, sponsorship, or
promotion
In stores where cigarettes are
sold 1
Anywhere else 2
Clothing/item with brand
name or logo
Tobacco corporate social responsibility
(CSR)
Other promotion of cigarettes 3
Percentage (95% CI)
Overall 18.2 (16.4, 20.2) 2.4 (2.0, 2.8) 3.1 (2.7, 3.6) 3.9 (3.2, 4.7) 0.8 (0.6, 1.1) 2.6 (2.2, 3.0) 25.7 (23.7, 27.8) Gender
Men 19.4 (17.1, 21.9) 2.7 (2.1, 3.4) 4.5 (3.9, 5.3) 4.9 (3.9, 6.1) 0.9 (0.6, 1.3) 3.1 (2.5, 3.8) 28.5 (26.1, 31.1) Women 17.1 (15.3, 19.1) 2.1 (1.8, 2.6) 1.8 (1.5, 2.2) 2.9 (2.4, 3.6) 0.7 (0.5, 1.1) 2.0 (1.7, 2.5) 23.1 (21.1, 25.1)
Age (years) 15–24 24.5 (21.2, 28.0) 4.0 (2.9, 5.3) 2.9 (2.0, 4.2) 7.2 (5.6, 9.2) 1.4 (0.8, 2.5) 4.4 (3.3, 5.9) 34.2 (30.5, 38.1) 25+ 16.8 (15.0, 18.7) 2.0 (1.7, 2.4) 3.2 (2.8, 3.7) 3.1 (2.5, 3.8) 0.7 (0.5, 0.9) 2.1 (1.8, 2.5) 23.7 (21.8, 25.7)
Residence Urban 19.7 (18.3, 21.3) 3.4 (2.9, 4.0) 4.0 (3.5, 4.6) 5.3 (4.6, 6.0) 1.0 (0.7, 1.3) 3.9 (3.4, 4.5) 29.4 (27.8, 31.1) Rural 17.4 (14.8, 20.5) 1.9 (1.4, 2.5) 2.7 (2.1, 3.3) 3.1 (2.2, 4.4) 0.7 (0.4, 1.1) 1.8 (1.4, 2.5) 23.7 (20.9, 26.8)
Education level Less than primary 12.5 (10.8, 14.3) 1.0 (0.8, 1.4) 1.5 (1.1, 2.1) 1.2 (0.8, 1.9) 0.3 (0.2, 0.5) 1.2 (0.9, 1.7) 16.3 (14.6, 18.2) Primary 21.9 (18.6, 25.6) 2.0 (1.3, 3.0) 2.8 (2.0, 3.8) 3.7 (2.3, 5.8) 0.6 (0.3, 1.2) 2.1 (1.5, 3.0) 28.8 (25.3, 32.6) Secondary 20.9 (18.6, 23.3) 3.0 (2.4, 3.8) 3.9 (3.2, 4.7) 5.6 (4.5, 7.0) 1.2 (0.8, 1.8) 3.2 (2.5, 4.1) 29.9 (27.4, 32.6) University 19.6 (17.3, 22.0) 4.8 (3.7, 6.0) 5.7 (4.8, 6.8) 6.1 (5.0, 7.3) 1.2 (0.8, 1.7) 4.7 (3.7, 6.0) 32.2 (29.5, 35.0)
Region Bangkok 24.9 (22.6, 27.4) 3.7 (2.9, 4.6) 5.4 (4.6, 6.4) 7.7 (6.5, 9.2) 1.4 (0.9, 2.1) 4.9 (4.0, 6.1) 38.3 (35.6, 41.1) Central 14.8 (12.6, 17.4) 3.6 (2.6, 4.9) 3.5 (2.6, 4.6) 2.2 (1.7, 3.0) 0.5 (0.3, 0.9) 3.4 (2.4, 4.8) 22.6 (19.9, 25.6) Northern 12.4 (9.9, 15.5) 1.8 (1.2, 2.6) 1.6 (1.1, 2.3) 3.9 (2.5, 6.1) 1.3 (0.7, 2.5) 1.4 (0.8, 2.4) 18.2 (15.1, 21.9) Northeastern 18.8 (14.4, 24.2) 1.8 (1.2, 2.5) 3.1 (2.3, 4.3) 4.1 (2.7, 6.3) 0.7 (0.4, 1.3) 1.9 (1.4, 2.7) 25.7 (21.1, 30.9) Southern 25.8 (21.6, 30.3) 1.8 (1.2, 2.7) 2.9 (2.2, 3.8) 3.1 (2.2, 4.4) 0.4 (0.2, 0.7) 2.5 (1.8, 3.4) 32.1 (28.0, 36.5)
Socioeconomic status Lowest 15.4 (12.9, 18.3) 2.6 (1.8, 3.7) 2.0 (1.3, 3.0) 3.5 (2.6, 4.8) 1.0 (0.6, 1.7) 2.8 (2.0, 3.8) 22.3 (19.5, 25.4) Low 16.8 (13.9, 20.2) 1.4 (1.0, 2.1) 1.8 (1.3, 2.6) 3.3 (2.1, 5.2) 0.7 (0.4, 1.2) 1.4 (0.9, 2.0) 22.1 (18.9, 25.5) Middle 18.6 (15.7, 21.8) 2.2 (1.6, 3.0) 3.0 (2.3, 4.0) 3.3 (2.4, 4.6) 0.6 (0.3, 1.0) 2.5 (1.8, 3.5) 25.7 (22.5, 29.1) High 21.7 (19.1, 24.6) 2.4 (1.8, 3.2) 4.0 (3.2, 5.0) 4.7 (3.5, 6.3) 0.8 (0.5, 1.3) 2.6 (1.9, 3.4) 29.7 (26.9, 32.7) Highest 20.0 (18.1, 22.1) 3.7 (2.9, 4.6) 5.8 (4.8, 6.9) 4.8 (3.9, 5.8) 1.0 (0.7, 1.4) 3.9 (3.1, 4.9) 31.3 (29.0, 33.7)
1 Means at point of sale (displays of cigarette brand and package) 2 Includes on television, radio, billboards, posters, newspapers or magazines, cinemas, internet, public transportation, pub/bar/karaoke, etc. 3 Includes distribution of free samples, sale prices, coupons, free gifts/discounts on other products, mail promoting cigarettes, internet promotion of
cigarettes and promotion by a pretty model
Table 8.4 presents the percentage of current smokers who noticed cigarette marketing. The percentage of current smokers who reported noticing any cigarette advertisement, sponsorship or promotion was 28.9%. The most common place where cigarette marketing was noticed by current smokers was in tobacco stores (19.8%). The least common place noticed by current smokers was tobacco CSR (0.7%). For demographic subgroups, there were no differences in the rate of noticing any cigarette marketing by gender, age group and SES status. By residence, more adults living in urban areas noticed cigarette marketing than those in rural areas (34.4% vs 26.7%).
8-10 Media
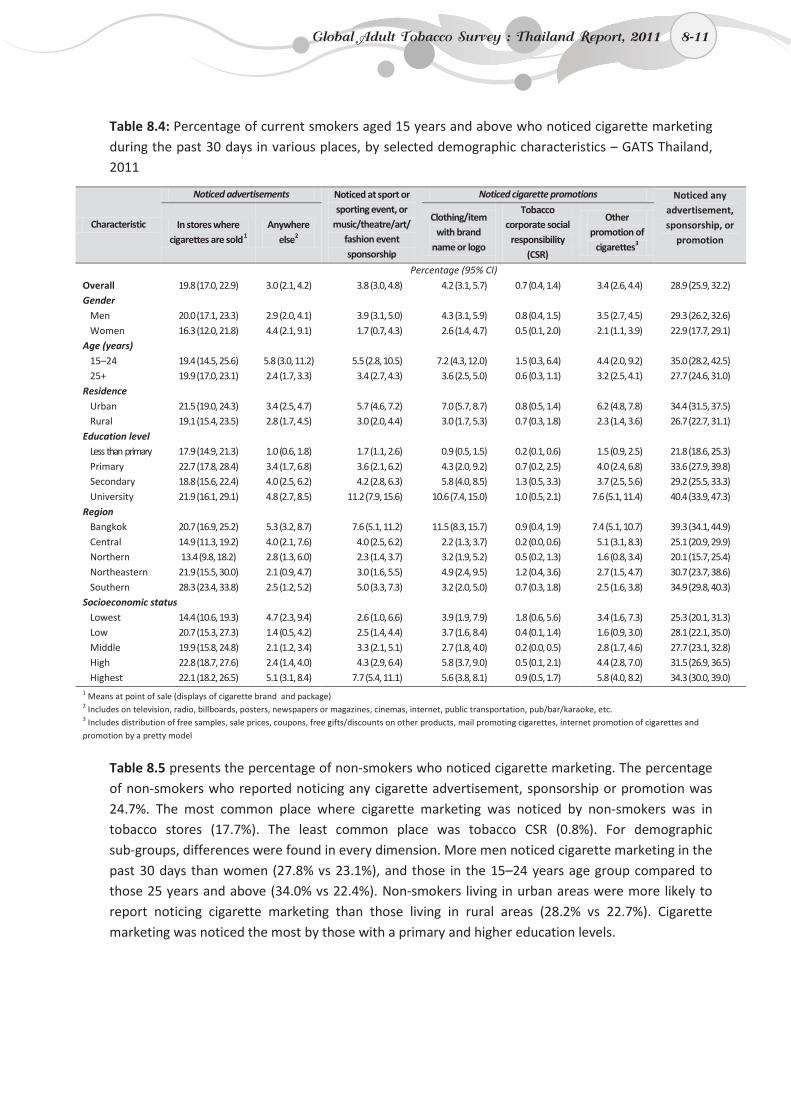
8-11
Table 8.4: Percentage of current smokers aged 15 years and above who noticed cigarette marketing during the past 30 days in various places, by selected demographic characteristics – GATS Thailand, 2011
Characteristic
Noticed advertisements Noticed at sport or sporting event, or
music/theatre/art/ fashion event sponsorship
Noticed cigarette promotions Noticed any advertisement, sponsorship, or
promotion In stores where
cigarettes are sold 1 Anywhere
else2
Clothing/item with brand
name or logo
Tobacco corporate social
responsibility (CSR)
Other promotion of
cigarettes3
Percentage (95% CI)
Overall 19.8 (17.0, 22.9) 3.0 (2.1, 4.2) 3.8 (3.0, 4.8) 4.2 (3.1, 5.7) 0.7 (0.4, 1.4) 3.4 (2.6, 4.4) 28.9 (25.9, 32.2) Gender
Men 20.0 (17.1, 23.3) 2.9 (2.0, 4.1) 3.9 (3.1, 5.0) 4.3 (3.1, 5.9) 0.8 (0.4, 1.5) 3.5 (2.7, 4.5) 29.3 (26.2, 32.6) Women 16.3 (12.0, 21.8) 4.4 (2.1, 9.1) 1.7 (0.7, 4.3) 2.6 (1.4, 4.7) 0.5 (0.1, 2.0) 2.1 (1.1, 3.9) 22.9 (17.7, 29.1)
Age (years) 15–24 19.4 (14.5, 25.6) 5.8 (3.0, 11.2) 5.5 (2.8, 10.5) 7.2 (4.3, 12.0) 1.5 (0.3, 6.4) 4.4 (2.0, 9.2) 35.0 (28.2, 42.5) 25+ 19.9 (17.0, 23.1) 2.4 (1.7, 3.3) 3.4 (2.7, 4.3) 3.6 (2.5, 5.0) 0.6 (0.3, 1.1) 3.2 (2.5, 4.1) 27.7 (24.6, 31.0)
Residence Urban 21.5 (19.0, 24.3) 3.4 (2.5, 4.7) 5.7 (4.6, 7.2) 7.0 (5.7, 8.7) 0.8 (0.5, 1.4) 6.2 (4.8, 7.8) 34.4 (31.5, 37.5) Rural 19.1 (15.4, 23.5) 2.8 (1.7, 4.5) 3.0 (2.0, 4.4) 3.0 (1.7, 5.3) 0.7 (0.3, 1.8) 2.3 (1.4, 3.6) 26.7 (22.7, 31.1)
Education level Less than primary 17.9 (14.9, 21.3) 1.0 (0.6, 1.8) 1.7 (1.1, 2.6) 0.9 (0.5, 1.5) 0.2 (0.1, 0.6) 1.5 (0.9, 2.5) 21.8 (18.6, 25.3) Primary 22.7 (17.8, 28.4) 3.4 (1.7, 6.8) 3.6 (2.1, 6.2) 4.3 (2.0, 9.2) 0.7 (0.2, 2.5) 4.0 (2.4, 6.8) 33.6 (27.9, 39.8) Secondary 18.8 (15.6, 22.4) 4.0 (2.5, 6.2) 4.2 (2.8, 6.3) 5.8 (4.0, 8.5) 1.3 (0.5, 3.3) 3.7 (2.5, 5.6) 29.2 (25.5, 33.3) University 21.9 (16.1, 29.1) 4.8 (2.7, 8.5) 11.2 (7.9, 15.6) 10.6 (7.4, 15.0) 1.0 (0.5, 2.1) 7.6 (5.1, 11.4) 40.4 (33.9, 47.3)
Region Bangkok 20.7 (16.9, 25.2) 5.3 (3.2, 8.7) 7.6 (5.1, 11.2) 11.5 (8.3, 15.7) 0.9 (0.4, 1.9) 7.4 (5.1, 10.7) 39.3 (34.1, 44.9) Central 14.9 (11.3, 19.2) 4.0 (2.1, 7.6) 4.0 (2.5, 6.2) 2.2 (1.3, 3.7) 0.2 (0.0, 0.6) 5.1 (3.1, 8.3) 25.1 (20.9, 29.9) Northern 13.4 (9.8, 18.2) 2.8 (1.3, 6.0) 2.3 (1.4, 3.7) 3.2 (1.9, 5.2) 0.5 (0.2, 1.3) 1.6 (0.8, 3.4) 20.1 (15.7, 25.4) Northeastern 21.9 (15.5, 30.0) 2.1 (0.9, 4.7) 3.0 (1.6, 5.5) 4.9 (2.4, 9.5) 1.2 (0.4, 3.6) 2.7 (1.5, 4.7) 30.7 (23.7, 38.6) Southern 28.3 (23.4, 33.8) 2.5 (1.2, 5.2) 5.0 (3.3, 7.3) 3.2 (2.0, 5.0) 0.7 (0.3, 1.8) 2.5 (1.6, 3.8) 34.9 (29.8, 40.3)
Socioeconomic status Lowest 14.4 (10.6, 19.3) 4.7 (2.3, 9.4) 2.6 (1.0, 6.6) 3.9 (1.9, 7.9) 1.8 (0.6, 5.6) 3.4 (1.6, 7.3) 25.3 (20.1, 31.3) Low 20.7 (15.3, 27.3) 1.4 (0.5, 4.2) 2.5 (1.4, 4.4) 3.7 (1.6, 8.4) 0.4 (0.1, 1.4) 1.6 (0.9, 3.0) 28.1 (22.1, 35.0) Middle 19.9 (15.8, 24.8) 2.1 (1.2, 3.4) 3.3 (2.1, 5.1) 2.7 (1.8, 4.0) 0.2 (0.0, 0.5) 2.8 (1.7, 4.6) 27.7 (23.1, 32.8) High 22.8 (18.7, 27.6) 2.4 (1.4, 4.0) 4.3 (2.9, 6.4) 5.8 (3.7, 9.0) 0.5 (0.1, 2.1) 4.4 (2.8, 7.0) 31.5 (26.9, 36.5) Highest 22.1 (18.2, 26.5) 5.1 (3.1, 8.4) 7.7 (5.4, 11.1) 5.6 (3.8, 8.1) 0.9 (0.5, 1.7) 5.8 (4.0, 8.2) 34.3 (30.0, 39.0)
1 Means at point of sale (displays of cigarette brand and package) 2 Includes on television, radio, billboards, posters, newspapers or magazines, cinemas, internet, public transportation, pub/bar/karaoke, etc. 3 Includes distribution of free samples, sale prices, coupons, free gifts/discounts on other products, mail promoting cigarettes, internet promotion of cigarettes and promotion by a pretty model
Table 8.5 presents the percentage of non-smokers who noticed cigarette marketing. The percentage of non-smokers who reported noticing any cigarette advertisement, sponsorship or promotion was 24.7%. The most common place where cigarette marketing was noticed by non-smokers was in tobacco stores (17.7%). The least common place was tobacco CSR (0.8%). For demographic sub-groups, differences were found in every dimension. More men noticed cigarette marketing in the past 30 days than women (27.8% vs 23.1%), and those in the 15–24 years age group compared to those 25 years and above (34.0% vs 22.4%). Non-smokers living in urban areas were more likely to report noticing cigarette marketing than those living in rural areas (28.2% vs 22.7%). Cigarette marketing was noticed the most by those with a primary and higher education levels.
Global Adult Tobacco Survey : Thailand Report, 2011 8-11
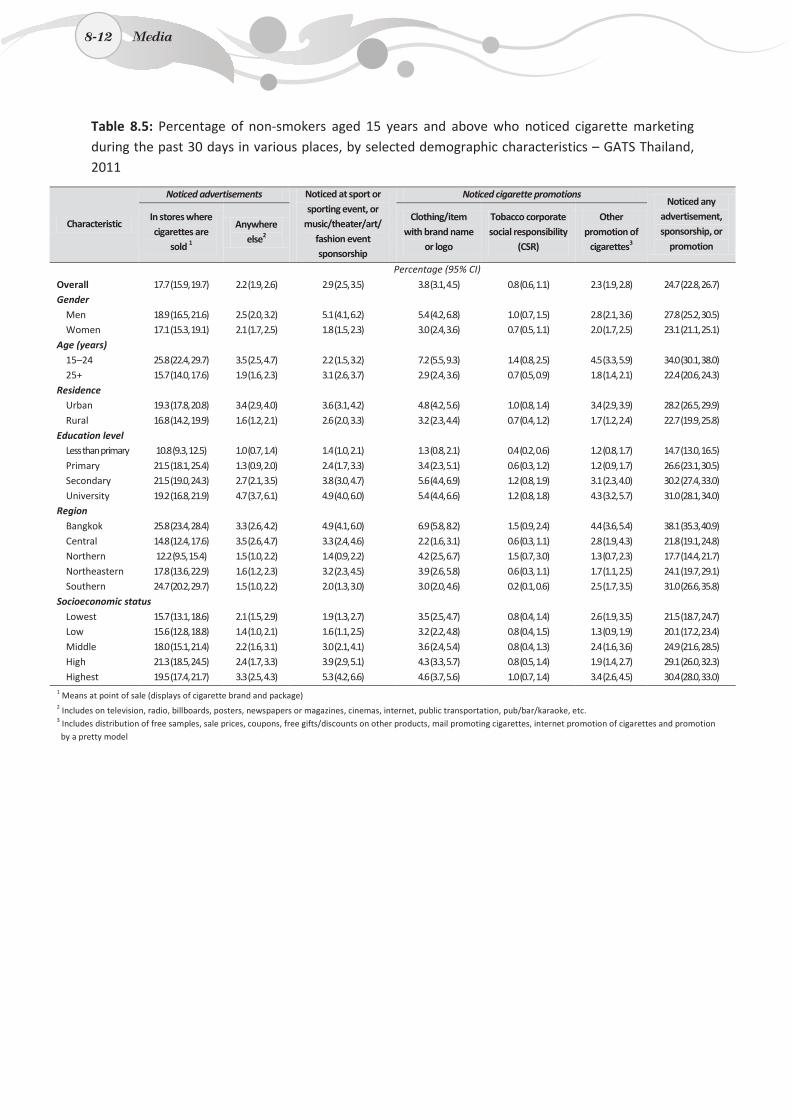
8-12
Table 8.5: Percentage of non-smokers aged 15 years and above who noticed cigarette marketing during the past 30 days in various places, by selected demographic characteristics – GATS Thailand, 2011
Characteristic
Noticed advertisements Noticed at sport or sporting event, or
music/theater/art/ fashion event sponsorship
Noticed cigarette promotions Noticed any
advertisement, sponsorship, or
promotion
In stores where cigarettes are
sold 1
Anywhere else2
Clothing/item with brand name
or logo
Tobacco corporate social responsibility
(CSR)
Other promotion of
cigarettes3
Percentage (95% CI)
Overall 17.7 (15.9, 19.7) 2.2 (1.9, 2.6) 2.9 (2.5, 3.5) 3.8 (3.1, 4.5) 0.8 (0.6, 1.1) 2.3 (1.9, 2.8) 24.7 (22.8, 26.7) Gender
Men 18.9 (16.5, 21.6) 2.5 (2.0, 3.2) 5.1 (4.1, 6.2) 5.4 (4.2, 6.8) 1.0 (0.7, 1.5) 2.8 (2.1, 3.6) 27.8 (25.2, 30.5) Women 17.1 (15.3, 19.1) 2.1 (1.7, 2.5) 1.8 (1.5, 2.3) 3.0 (2.4, 3.6) 0.7 (0.5, 1.1) 2.0 (1.7, 2.5) 23.1 (21.1, 25.1)
Age (years) 15–24 25.8 (22.4, 29.7) 3.5 (2.5, 4.7) 2.2 (1.5, 3.2) 7.2 (5.5, 9.3) 1.4 (0.8, 2.5) 4.5 (3.3, 5.9) 34.0 (30.1, 38.0) 25+ 15.7 (14.0, 17.6) 1.9 (1.6, 2.3) 3.1 (2.6, 3.7) 2.9 (2.4, 3.6) 0.7 (0.5, 0.9) 1.8 (1.4, 2.1) 22.4 (20.6, 24.3)
Residence Urban 19.3 (17.8, 20.8) 3.4 (2.9, 4.0) 3.6 (3.1, 4.2) 4.8 (4.2, 5.6) 1.0 (0.8, 1.4) 3.4 (2.9, 3.9) 28.2 (26.5, 29.9) Rural 16.8 (14.2, 19.9) 1.6 (1.2, 2.1) 2.6 (2.0, 3.3) 3.2 (2.3, 4.4) 0.7 (0.4, 1.2) 1.7 (1.2, 2.4) 22.7 (19.9, 25.8)
Education level Less than primary 10.8 (9.3, 12.5) 1.0 (0.7, 1.4) 1.4 (1.0, 2.1) 1.3 (0.8, 2.1) 0.4 (0.2, 0.6) 1.2 (0.8, 1.7) 14.7 (13.0, 16.5) Primary 21.5 (18.1, 25.4) 1.3 (0.9, 2.0) 2.4 (1.7, 3.3) 3.4 (2.3, 5.1) 0.6 (0.3, 1.2) 1.2 (0.9, 1.7) 26.6 (23.1, 30.5) Secondary 21.5 (19.0, 24.3) 2.7 (2.1, 3.5) 3.8 (3.0, 4.7) 5.6 (4.4, 6.9) 1.2 (0.8, 1.9) 3.1 (2.3, 4.0) 30.2 (27.4, 33.0) University 19.2 (16.8, 21.9) 4.7 (3.7, 6.1) 4.9 (4.0, 6.0) 5.4 (4.4, 6.6) 1.2 (0.8, 1.8) 4.3 (3.2, 5.7) 31.0 (28.1, 34.0)
Region Bangkok 25.8 (23.4, 28.4) 3.3 (2.6, 4.2) 4.9 (4.1, 6.0) 6.9 (5.8, 8.2) 1.5 (0.9, 2.4) 4.4 (3.6, 5.4) 38.1 (35.3, 40.9) Central 14.8 (12.4, 17.6) 3.5 (2.6, 4.7) 3.3 (2.4, 4.6) 2.2 (1.6, 3.1) 0.6 (0.3, 1.1) 2.8 (1.9, 4.3) 21.8 (19.1, 24.8) Northern 12.2 (9.5, 15.4) 1.5 (1.0, 2.2) 1.4 (0.9, 2.2) 4.2 (2.5, 6.7) 1.5 (0.7, 3.0) 1.3 (0.7, 2.3) 17.7 (14.4, 21.7) Northeastern 17.8 (13.6, 22.9) 1.6 (1.2, 2.3) 3.2 (2.3, 4.5) 3.9 (2.6, 5.8) 0.6 (0.3, 1.1) 1.7 (1.1, 2.5) 24.1 (19.7, 29.1) Southern 24.7 (20.2, 29.7) 1.5 (1.0, 2.2) 2.0 (1.3, 3.0) 3.0 (2.0, 4.6) 0.2 (0.1, 0.6) 2.5 (1.7, 3.5) 31.0 (26.6, 35.8)
Socioeconomic status Lowest 15.7 (13.1, 18.6) 2.1 (1.5, 2.9) 1.9 (1.3, 2.7) 3.5 (2.5, 4.7) 0.8 (0.4, 1.4) 2.6 (1.9, 3.5) 21.5 (18.7, 24.7) Low 15.6 (12.8, 18.8) 1.4 (1.0, 2.1) 1.6 (1.1, 2.5) 3.2 (2.2, 4.8) 0.8 (0.4, 1.5) 1.3 (0.9, 1.9) 20.1 (17.2, 23.4) Middle 18.0 (15.1, 21.4) 2.2 (1.6, 3.1) 3.0 (2.1, 4.1) 3.6 (2.4, 5.4) 0.8 (0.4, 1.3) 2.4 (1.6, 3.6) 24.9 (21.6, 28.5) High 21.3 (18.5, 24.5) 2.4 (1.7, 3.3) 3.9 (2.9, 5.1) 4.3 (3.3, 5.7) 0.8 (0.5, 1.4) 1.9 (1.4, 2.7) 29.1 (26.0, 32.3) Highest 19.5 (17.4, 21.7) 3.3 (2.5, 4.3) 5.3 (4.2, 6.6) 4.6 (3.7, 5.6) 1.0 (0.7, 1.4) 3.4 (2.6, 4.5) 30.4 (28.0, 33.0)
1 Means at point of sale (displays of cigarette brand and package)2 Includes on television, radio, billboards, posters, newspapers or magazines, cinemas, internet, public transportation, pub/bar/karaoke, etc. 3 Includes distribution of free samples, sale prices, coupons, free gifts/discounts on other products, mail promoting cigarettes, internet promotion of cigarettes and promotion by a pretty model
8-12 Media
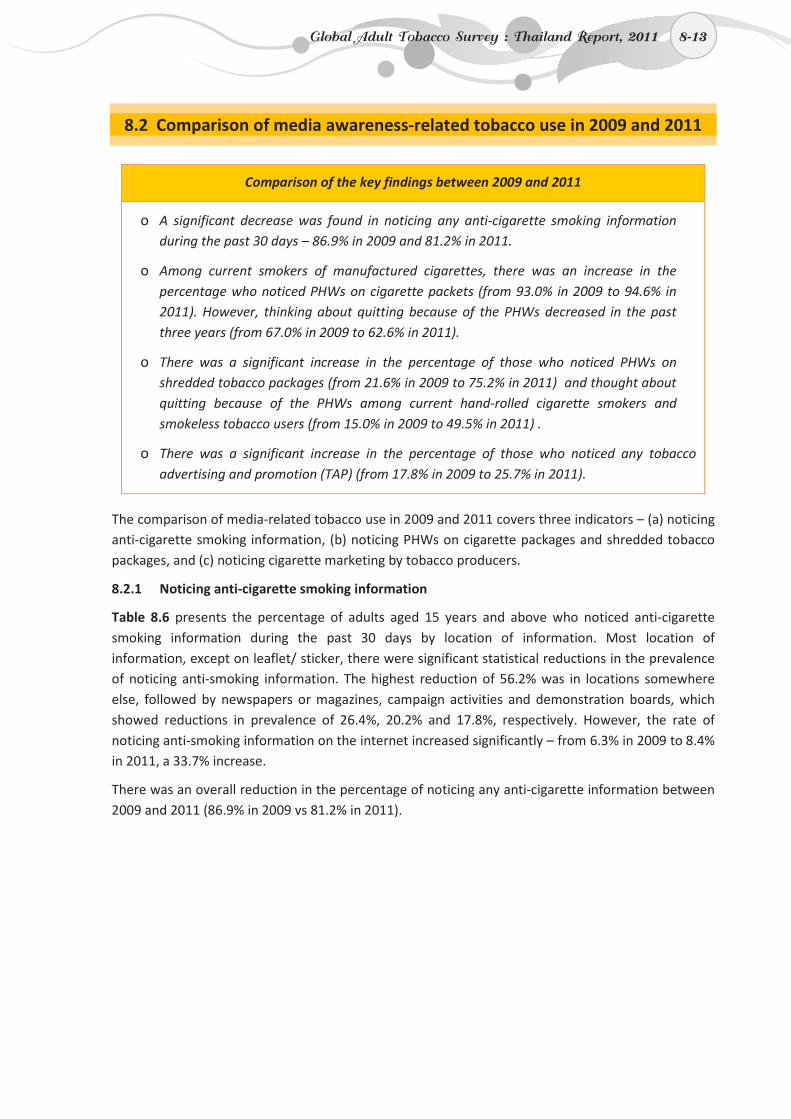
8-13
8.2 Comparison of media awareness-related tobacco use in 2009 and 2011
Comparison of the key findings between 2009 and 2011
o A significant decrease was found in noticing any anti-cigarette smoking information during the past 30 days – 86.9% in 2009 and 81.2% in 2011.
o Among current smokers of manufactured cigarettes, there was an increase in the percentage who noticed PHWs on cigarette packets (from 93.0% in 2009 to 94.6% in 2011). However, thinking about quitting because of the PHWs decreased in the past three years (from 67.0% in 2009 to 62.6% in 2011).
o There was a significant increase in the percentage of those who noticed PHWs on shredded tobacco packages (from 21.6% in 2009 to 75.2% in 2011) and thought about quitting because of the PHWs among current hand-rolled cigarette smokers and smokeless tobacco users (from 15.0% in 2009 to 49.5% in 2011) .
o There was a significant increase in the percentage of those who noticed any tobacco advertising and promotion (TAP) (from 17.8% in 2009 to 25.7% in 2011).
The comparison of media-related tobacco use in 2009 and 2011 covers three indicators – (a) noticing anti-cigarette smoking information, (b) noticing PHWs on cigarette packages and shredded tobacco packages, and (c) noticing cigarette marketing by tobacco producers.
8.2.1 Noticing anti-cigarette smoking information
Table 8.6 presents the percentage of adults aged 15 years and above who noticed anti-cigarette smoking information during the past 30 days by location of information. Most location of information, except on leaflet/ sticker, there were significant statistical reductions in the prevalence of noticing anti-smoking information. The highest reduction of 56.2% was in locations somewhere else, followed by newspapers or magazines, campaign activities and demonstration boards, which showed reductions in prevalence of 26.4%, 20.2% and 17.8%, respectively. However, the rate of noticing anti-smoking information on the internet increased significantly – from 6.3% in 2009 to 8.4% in 2011, a 33.7% increase.
There was an overall reduction in the percentage of noticing any anti-cigarette information between 2009 and 2011 (86.9% in 2009 vs 81.2% in 2011).
Global Adult Tobacco Survey : Thailand Report, 2011 8-13
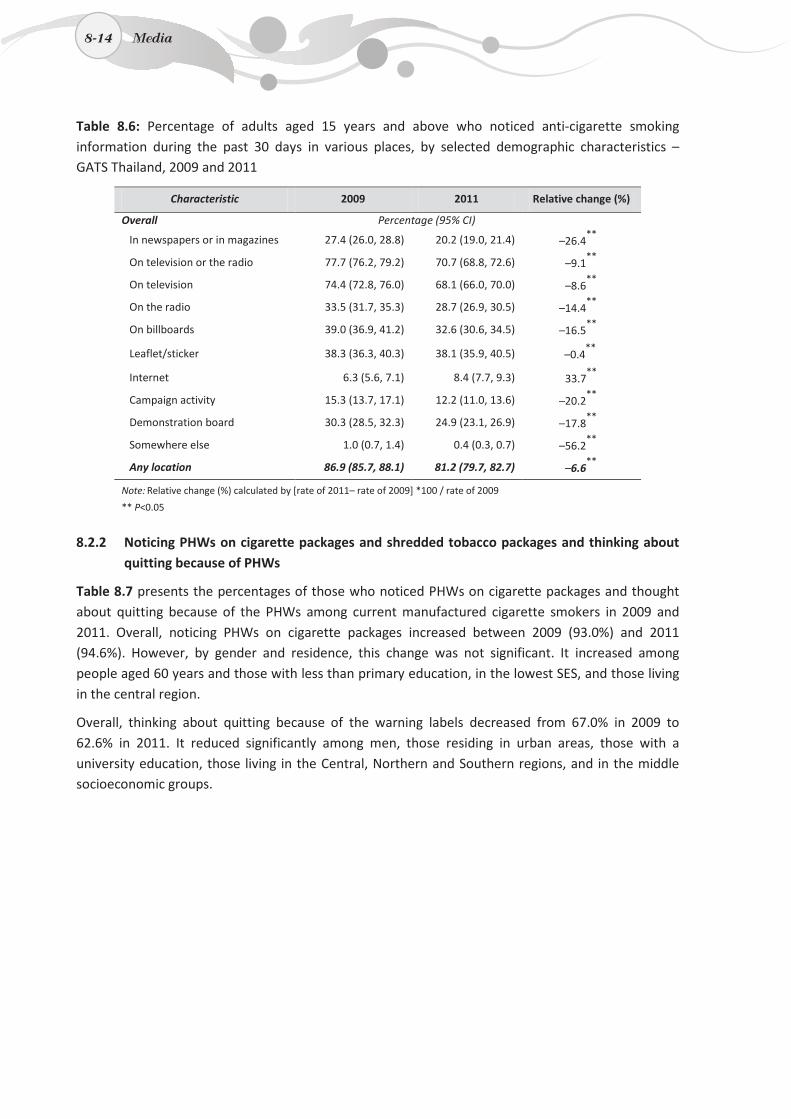
8-14
Table 8.6: Percentage of adults aged 15 years and above who noticed anti-cigarette smoking information during the past 30 days in various places, by selected demographic characteristics – GATS Thailand, 2009 and 2011
Characteristic 2009 2011 Relative change (%)
Overall Percentage (95% CI)
In newspapers or in magazines 27.4 (26.0, 28.8) 20.2 (19.0, 21.4) –26.4**
On television or the radio 77.7 (76.2, 79.2) 70.7 (68.8, 72.6) –9.1**
On television 74.4 (72.8, 76.0) 68.1 (66.0, 70.0) –8.6**
On the radio 33.5 (31.7, 35.3) 28.7 (26.9, 30.5) –14.4**
On billboards 39.0 (36.9, 41.2) 32.6 (30.6, 34.5) –16.5**
Leaflet/sticker 38.3 (36.3, 40.3) 38.1 (35.9, 40.5) –0.4**
Internet 6.3 (5.6, 7.1) 8.4 (7.7, 9.3) 33.7**
Campaign activity 15.3 (13.7, 17.1) 12.2 (11.0, 13.6) –20.2**
Demonstration board 30.3 (28.5, 32.3) 24.9 (23.1, 26.9) –17.8**
Somewhere else 1.0 (0.7, 1.4) 0.4 (0.3, 0.7) –56.2**
Any location 86.9 (85.7, 88.1) 81.2 (79.7, 82.7) –6.6**
Note: Relative change (%) calculated by [rate of 2011– rate of 2009] *100 / rate of 2009
** P<0.05
8.2.2 Noticing PHWs on cigarette packages and shredded tobacco packages and thinking about quitting because of PHWs
Table 8.7 presents the percentages of those who noticed PHWs on cigarette packages and thought about quitting because of the PHWs among current manufactured cigarette smokers in 2009 and 2011. Overall, noticing PHWs on cigarette packages increased between 2009 (93.0%) and 2011 (94.6%). However, by gender and residence, this change was not significant. It increased among people aged 60 years and those with less than primary education, in the lowest SES, and those living in the central region.
Overall, thinking about quitting because of the warning labels decreased from 67.0% in 2009 to 62.6% in 2011. It reduced significantly among men, those residing in urban areas, those with a university education, those living in the Central, Northern and Southern regions, and in the middle socioeconomic groups.
8-14 Media
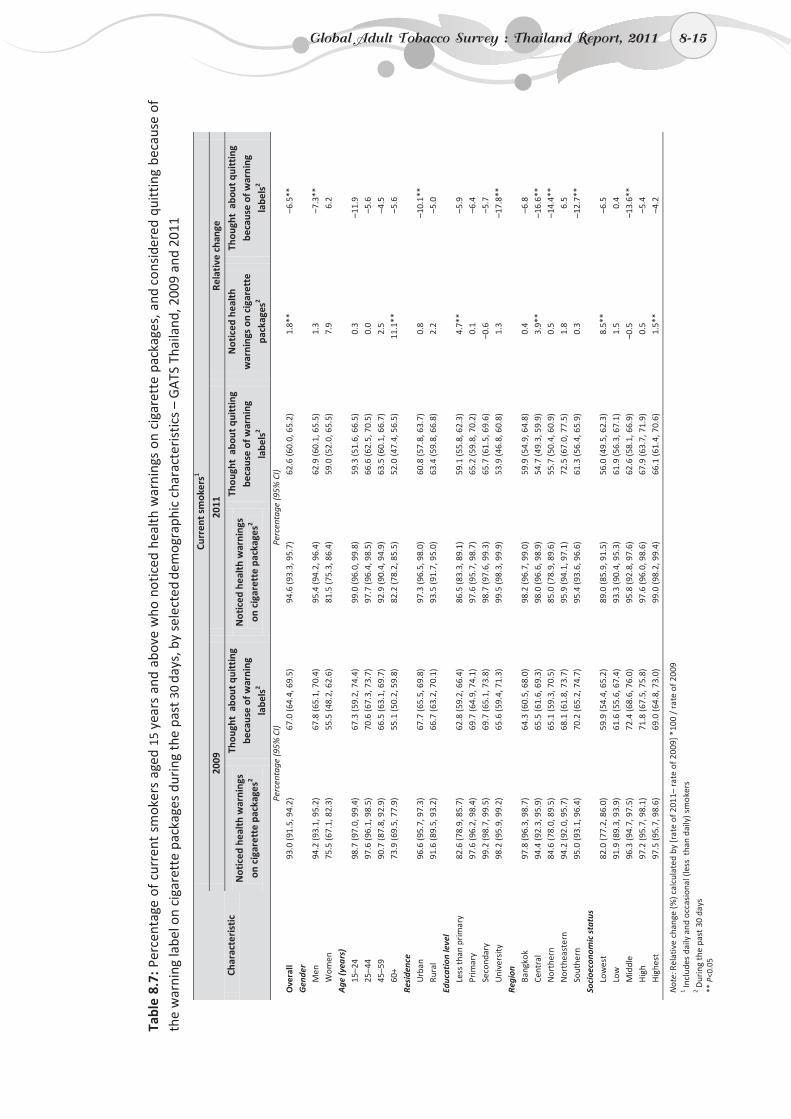
8-15
Ta
ble
8.7:
Per
cent
age
of c
urre
nt s
mok
ers
aged
15
year
s an
d ab
ove
who
not
iced
hea
lth w
arni
ngs
on c
igar
ette
pac
kage
s, a
nd c
onsi
dere
d qu
ittin
g be
caus
e of
th
e w
arni
ng la
bel o
n ci
gare
tte
pack
ages
dur
ing
the
past
30
days
, by
sele
cted
dem
ogra
phic
cha
ract
eris
tics
– G
ATS
Tha
iland
, 200
9 an
d 20
11
Char
acte
rist
ic
Curr
ent s
mok
ers1
2009
20
11
Rela
tive
cha
nge
Not
iced
hea
lth
war
ning
s on
cig
aret
te p
acka
ges2
Thou
ght
abou
t qui
ttin
g be
caus
e of
war
ning
la
bels
2
Not
iced
hea
lth
war
ning
s on
cig
aret
te p
acka
ges2
Thou
ght
abou
t qui
ttin
g be
caus
e of
war
ning
la
bels
2
Not
iced
hea
lth
war
ning
s on
cig
aret
te
pack
ages
2
Thou
ght
abou
t qui
ttin
g be
caus
e of
war
ning
la
bels
2
Perc
enta
ge (9
5% C
I) Pe
rcen
tage
(95%
CI)
O
vera
ll 93
.0 (9
1.5,
94.
2)
67.0
(64.
4, 6
9.5)
94
.6 (9
3.3,
95.
7)
62.6
(60.
0, 6
5.2)
1.
8**
–6.5
**
Gen
der
Men
94
.2 (9
3.1,
95.
2)
67.8
(65.
1, 7
0.4)
95
.4 (9
4.2,
96.
4)
62.9
(60.
1, 6
5.5)
1.
3 –7
.3**
W
omen
75
.5 (6
7.1,
82.
3)
55.5
(48.
2, 6
2.6)
81
.5 (7
5.3,
86.
4)
59.0
(52.
0, 6
5.5)
7.
9 6.
2 A
ge (y
ears
)
15
–24
98.7
(97.
0, 9
9.4)
67
.3 (5
9.2,
74.
4)
99.0
(96.
0, 9
9.8)
59
.3 (5
1.6,
66.
5)
0.3
–11.
9 25
–44
97.6
(96.
1, 9
8.5)
70
.6 (6
7.3,
73.
7)
97.7
(96.
4, 9
8.5)
66
.6 (6
2.5,
70.
5)
0.0
–5.6
45
–59
90.7
(87.
8, 9
2.9)
66
.5 (6
3.1,
69.
7)
92.9
(90.
4, 9
4.9)
63
.5 (6
0.1,
66.
7)
2.5
–4.5
60
+ 73
.9 (6
9.5,
77.
9)
55.1
(50.
2, 5
9.8)
82
.2 (7
8.2,
85.
5)
52.0
(47.
4, 5
6.5)
11
.1**
–5
.6
Resi
denc
e
U
rban
96
.6 (9
5.7,
97.
3)
67.7
(65.
5, 6
9.8)
97
.3 (9
6.5,
98.
0)
60.8
(57.
8, 6
3.7)
0.
8 –1
0.1*
* Ru
ral
91.6
(89.
5, 9
3.2)
66
.7 (6
3.2,
70.
1)
93.5
(91.
7, 9
5.0)
63
.4 (5
9.8,
66.
8)
2.2
–5.0
Ed
ucat
ion
leve
l
Le
ss th
an p
rim
ary
82.6
(78.
9, 8
5.7)
62
.8 (5
9.2,
66.
4)
86.5
(83.
3, 8
9.1)
59
.1 (5
5.8,
62.
3)
4.7*
* –5
.9
Prim
ary
97.6
(96.
2, 9
8.4)
69
.7 (6
4.9,
74.
1)
97.6
(95.
7, 9
8.7)
65
.2 (5
9.8,
70.
2)
0.1
–6.4
Se
cond
ary
99.2
(98.
7, 9
9.5)
69
.7 (6
5.1,
73.
8)
98.7
(97.
6, 9
9.3)
65
.7 (6
1.5,
69.
6)
–0.6
–5
.7
Uni
vers
ity
98.2
(95.
9, 9
9.2)
65
.6 (5
9.4,
71.
3)
99.5
(98.
3, 9
9.9)
53
.9 (4
6.8,
60.
8)
1.3
–17.
8**
Regi
on
Bang
kok
97.8
(96.
3, 9
8.7)
64
.3 (6
0.5,
68.
0)
98.2
(96.
7, 9
9.0)
59
.9 (5
4.9,
64.
8)
0.4
–6.8
Ce
ntra
l 94
.4 (9
2.3,
95.
9)
65.5
(61.
6, 6
9.3)
98
.0 (9
6.6,
98.
9)
54.7
(49.
3, 5
9.9)
3.
9**
–16.
6**
Nor
ther
n 84
.6 (7
8.0,
89.
5)
65.1
(59.
3, 7
0.5)
85
.0 (7
8.9,
89.
6)
55.7
(50.
4, 6
0.9)
0.
5 –1
4.4*
* N
orth
east
ern
94.2
(92.
0, 9
5.7)
68
.1 (6
1.8,
73.
7)
95.9
(94.
1, 9
7.1)
72
.5 (6
7.0,
77.
5)
1.8
6.5
Sout
hern
95
.0 (9
3.1,
96.
4)
70.2
(65.
2, 7
4.7)
95
.4 (9
3.6,
96.
6)
61.3
(56.
4, 6
5.9)
0.
3 –1
2.7*
* So
cioe
cono
mic
sta
tus
Lo
wes
t 82
.0 (7
7.2,
86.
0)
59.9
(54.
4, 6
5.2)
89
.0 (8
5.9,
91.
5)
56.0
(49.
5, 6
2.3)
8.
5**
–6.5
Lo
w
91.9
(89.
3, 9
3.9)
61
.6 (5
5.6,
67.
4)
93.3
(90.
4, 9
5.3)
61
.9 (5
6.3,
67.
1)
1.5
0.4
Mid
dle
96.3
(94.
7, 9
7.5)
72
.4 (6
8.6,
76.
0)
95.8
(92.
8, 9
7.6)
62
.6 (5
8.1,
66.
9)
–0.5
–1
3.6*
* H
igh
97.2
(95.
7, 9
8.1)
71
.8 (6
7.5,
75.
8)
97.6
(96.
0, 9
8.6)
67
.9 (6
3.7,
71.
9)
0.5
–5.4
H
ighe
st
97.5
(95.
7, 9
8.6)
69
.0 (6
4.8,
73.
0)
99.0
(98.
2, 9
9.4)
66
.1 (6
1.4,
70.
6)
1.5*
* –4
.2
Not
e: Re
lativ
e ch
ange
(%) c
alcu
late
d by
[rat
e of
201
1– ra
te o
f 200
9] *
100
/ ra
te o
f 200
9
1 Incl
udes
dai
ly a
nd o
ccas
iona
l (le
ss t
han
daily
) sm
oker
s
2 D
urin
g th
e pa
st 3
0 da
ys
** P
<0.0
5
Global Adult Tobacco Survey : Thailand Report, 2011 8-15
8-16
Table 8.7a compares the percentages in 2009 and 2011 of noticing PHWs on shredded tobacco packs and thinking about quitting because of the PHWs among current hand-rolled cigarette smokers and smokeless tobacco users.
The prevalence of noticing PHWs on shredded tobacco packs among current hand-rolled cigarette smokers and smokeless tobacco users showed a statistically significant increase, both by overall population as well as by individual demographic characteristics. The prevalence of thinking about quitting because of the PHWs also showed a statistically significant increase by the overall population and by individual demographic characteristics.
8.2.3 Noticing cigarette marketing by tobacco producers
Table 8.8 presents the percentages of those who noticed cigarette marketing advertisements during the past 30 days in stores where cigarettes are sold, and noticing any advertisement, sponsorship or promotion.
It was alarming to see that the prevalence of noticing advertisements or promotions of smoking in stores where cigarettes are sold increased two- to six-fold between 2009 and 2011, overall and by all demographic characteristics. The percentage of those who noticed advertisements in stores where cigarettes are sold increased from 6.7% in 2009 to 18.2% in 2011. The increase was significant by all demographic characteristics. All these changes were statistically significant.
The prevalence of noticing any advertisement, sponsorship and promotion also showed statistically significant increases between 2009 and 2011. Noticing any advertisement, sponsorship or promotion increased from 17.8% in 2009 to 25.7% in 2011. Significant increases were noticed by all demographic characteristics with the exception of adults with university education and those living in the Central and Northern regions. These increases, however, were not as striking as those of noticing advertisements in stores.
8-16 Media
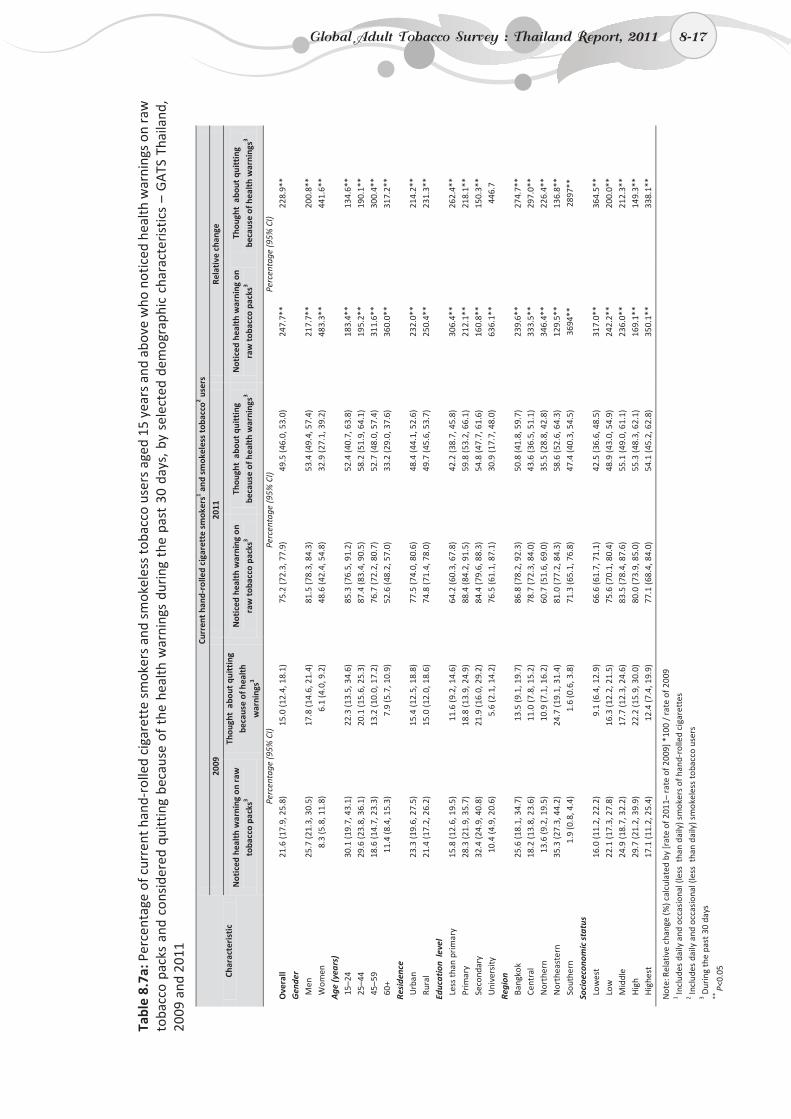
8-17
Ta
ble
8.7a
: Per
cent
age
of c
urre
nt h
and-
rolle
d ci
gare
tte
smok
ers
and
smok
eles
s to
bacc
o us
ers
aged
15
year
s an
d ab
ove
who
not
iced
hea
lth w
arni
ngs
on ra
w
toba
cco
pack
s an
d co
nsid
ered
qui
ttin
g be
caus
e of
the
hea
lth w
arni
ngs
duri
ng t
he p
ast
30 d
ays,
by
sele
cted
dem
ogra
phic
cha
ract
eris
tics
– G
ATS
Tha
iland
, 20
09 a
nd 2
011
Char
acte
rist
ic
Curr
ent h
and-
rolle
d ci
gare
tte
smok
ers1 a
nd s
mok
eles
s to
bacc
o2 use
rs
2009
20
11
Rela
tive
cha
nge
Not
iced
hea
lth
war
ning
on
raw
to
bacc
o pa
cks3
Thou
ght
abou
t qu
itti
ng
beca
use
of h
ealt
h w
arni
ngs3
Not
iced
hea
lth
war
ning
on
raw
toba
cco
pack
s3 Th
ough
t ab
out
quit
ting
be
caus
e of
hea
lth
war
ning
s3 N
otic
ed h
ealt
h w
arni
ng o
n ra
w to
bacc
o pa
cks3
Thou
ght
abou
t qu
itti
ng
beca
use
of h
ealt
h w
arni
ngs3
Pe
rcen
tage
(95%
CI)
Perc
enta
ge (9
5% C
I) Pe
rcen
tage
(95%
CI)
Ove
rall
21.6
(17.
9, 2
5.8)
15
.0 (1
2.4,
18.
1)
75.2
(72.
3, 7
7.9)
49
.5 (4
6.0,
53.
0)
247.
7**
228.
9**
Gen
der
Men
25
.7 (2
1.3,
30.
5)
17.8
(14.
6, 2
1.4)
81
.5 (7
8.3,
84.
3)
53.4
(49.
4, 5
7.4)
21
7.7*
* 20
0.8*
* W
omen
8.
3 (5
.8, 1
1.8)
6.
1 (4
.0, 9
.2)
48.6
(42.
4, 5
4.8)
32
.9 (2
7.1,
39.
2)
483.
3**
441.
6**
Age
(yea
rs)
15–2
4 30
.1 (1
9.7,
43.
1)
22.3
(13.
5, 3
4.6)
85
.3 (7
6.5,
91.
2)
52.4
(40.
7, 6
3.8)
18
3.4*
* 13
4.6*
* 25
–44
29.6
(23.
8, 3
6.1)
20
.1 (1
5.6,
25.
3)
87.4
(83.
4, 9
0.5)
58
.2 (5
1.9,
64.
1)
195.
2**
190.
1**
45–5
9 18
.6 (1
4.7,
23.
3)
13.2
(10.
0, 1
7.2)
76
.7 (7
2.2,
80.
7)
52.7
(48.
0, 5
7.4)
31
1.6*
* 30
0.4*
* 60
+ 11
.4 (8
.4, 1
5.3)
7.
9 (5
.7, 1
0.9)
52
.6 (4
8.2,
57.
0)
33.2
(29.
0, 3
7.6)
36
0.0*
* 31
7.2*
* Re
side
nce
Urb
an
23.3
(19.
6, 2
7.5)
15
.4 (1
2.5,
18.
8)
77.5
(74.
0, 8
0.6)
48
.4 (4
4.1,
52.
6)
232.
0**
214.
2**
Rura
l 21
.4 (1
7.2,
26.
2)
15.0
(12.
0, 1
8.6)
74
.8 (7
1.4,
78.
0)
49.7
(45.
6, 5
3.7)
25
0.4*
* 23
1.3*
* Ed
ucat
ion
leve
l
Le
ss th
an p
rim
ary
15.8
(12.
6, 1
9.5)
11
.6 (9
.2, 1
4.6)
64
.2 (6
0.3,
67.
8)
42.2
(38.
7, 4
5.8)
30
6.4*
* 26
2.4*
* Pr
imar
y 28
.3 (2
1.9,
35.
7)
18.8
(13.
9, 2
4.9)
88
.4 (8
4.2,
91.
5)
59.8
(53.
2, 6
6.1)
21
2.1*
* 21
8.1*
* Se
cond
ary
32.4
(24.
9, 4
0.8)
21
.9 (1
6.0,
29.
2)
84.4
(79.
6, 8
8.3)
54
.8 (4
7.7,
61.
6)
160.
8**
150.
3**
Uni
vers
ity
10.4
(4.9
, 20.
6)
5.6
(2.1
, 14.
2)
76.5
(61.
1, 8
7.1)
30
.9 (1
7.7,
48.
0)
636.
1**
446.
7 Re
gion
Ba
ngko
k 25
.6 (1
8.1,
34.
7)
13.5
(9.1
, 19.
7)
86.8
(78.
2, 9
2.3)
50
.8 (4
1.8,
59.
7)
239.
6**
274.
7**
Cent
ral
18.2
(13.
8, 2
3.6)
11
.0 (7
.8, 1
5.2)
78
.7 (7
2.3,
84.
0)
43.6
(36.
5, 5
1.1)
33
3.5*
* 29
7.0*
* N
orth
ern
13.6
(9.2
, 19.
5)
10.9
(7.1
, 16.
2)
60.7
(51.
6, 6
9.0)
35
.5 (2
8.8,
42.
8)
346.
4**
226.
4**
Nor
thea
ster
n 35
.3 (2
7.3,
44.
2)
24.7
(19.
1, 3
1.4)
81
.0 (7
7.2,
84.
3)
58.6
(52.
6, 6
4.3)
12
9.5*
* 13
6.8*
* So
uthe
rn
1.9
(0.8
, 4.4
) 1.
6 (0
.6, 3
.8)
71.3
(65.
1, 7
6.8)
47
.4 (4
0.3,
54.
5)
3694
**
2897
**
Soci
oeco
nom
ic s
tatu
s
Lo
wes
t 16
.0 (1
1.2,
22.
2)
9.1
(6.4
, 12.
9)
66.6
(61.
7, 7
1.1)
42
.5 (3
6.6,
48.
5)
317.
0**
364.
5**
Low
22
.1 (1
7.3,
27.
8)
16.3
(12.
2, 2
1.5)
75
.6 (7
0.1,
80.
4)
48.9
(43.
0, 5
4.9)
24
2.2*
* 20
0.0*
* M
iddl
e 24
.9 (1
8.7,
32.
2)
17.7
(12.
3, 2
4.6)
83
.5 (7
8.4,
87.
6)
55.1
(49.
0, 6
1.1)
23
6.0*
* 21
2.3*
* H
igh
29.7
(21.
2, 3
9.9)
22
.2 (1
5.9,
30.
0)
80.0
(73.
9, 8
5.0)
55
.3 (4
8.3,
62.
1)
169.
1**
149.
3**
Hig
hest
17
.1 (1
1.2,
25.
4)
12.4
(7.4
, 19.
9)
77.1
(68.
4, 8
4.0)
54
.1 (4
5.2,
62.
8)
350.
1**
338.
1**
Not
e: Re
lativ
e ch
ange
(%) c
alcu
late
d by
[rat
e of
201
1– ra
te o
f 200
9] *
100
/ ra
te o
f 200
9
1 Incl
udes
dai
ly a
nd o
ccas
iona
l (le
ss t
han
daily
) sm
oker
s of
han
d-ro
lled
ciga
rett
es
2 Incl
udes
dai
ly a
nd o
ccas
iona
l (le
ss t
han
daily
) sm
okel
ess
toba
cco
user
s
3 D
urin
g th
e pa
st 3
0 da
ys
** P<
0.05
Global Adult Tobacco Survey : Thailand Report, 2011 8-17
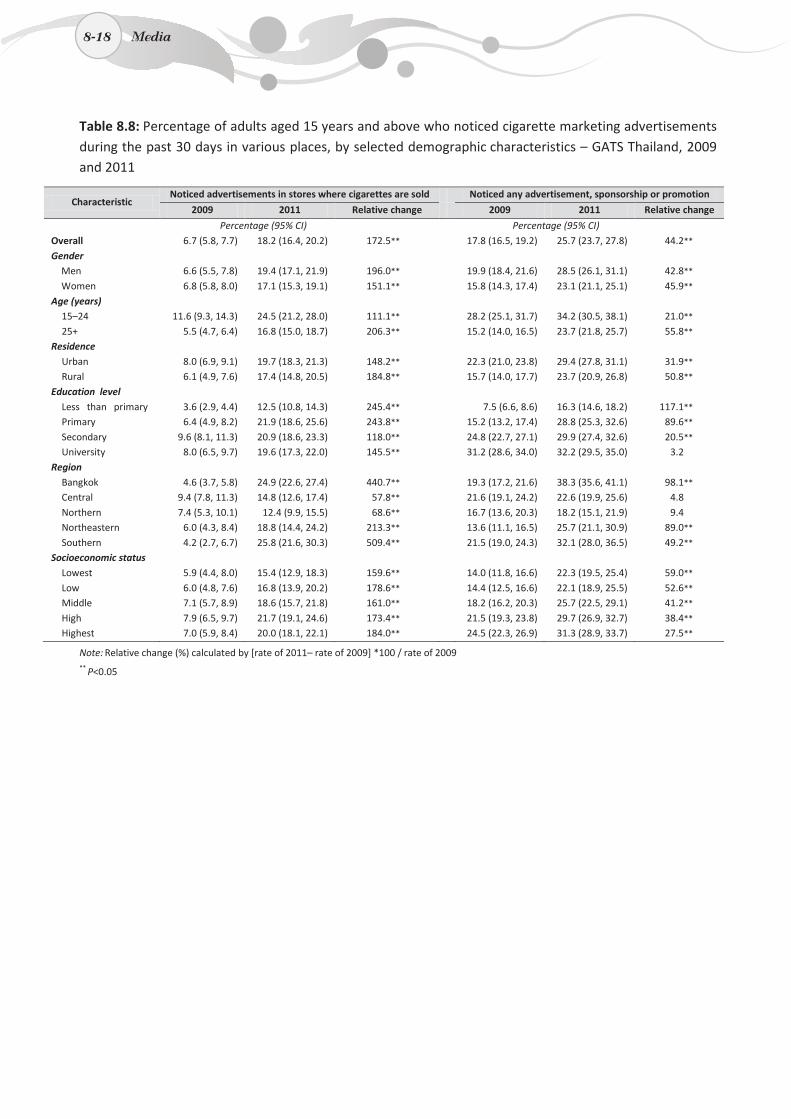
8-18
Table 8.8: Percentage of adults aged 15 years and above who noticed cigarette marketing advertisements during the past 30 days in various places, by selected demographic characteristics – GATS Thailand, 2009 and 2011
Characteristic Noticed advertisements in stores where cigarettes are sold Noticed any advertisement, sponsorship or promotion
2009 2011 Relative change 2009 2011 Relative change
Percentage (95% CI) Percentage (95% CI) Overall 6.7 (5.8, 7.7) 18.2 (16.4, 20.2) 172.5** 17.8 (16.5, 19.2) 25.7 (23.7, 27.8) 44.2** Gender
Men 6.6 (5.5, 7.8) 19.4 (17.1, 21.9) 196.0** 19.9 (18.4, 21.6) 28.5 (26.1, 31.1) 42.8** Women 6.8 (5.8, 8.0) 17.1 (15.3, 19.1) 151.1** 15.8 (14.3, 17.4) 23.1 (21.1, 25.1) 45.9**
Age (years) 15–24 11.6 (9.3, 14.3) 24.5 (21.2, 28.0) 111.1** 28.2 (25.1, 31.7) 34.2 (30.5, 38.1) 21.0** 25+ 5.5 (4.7, 6.4) 16.8 (15.0, 18.7) 206.3** 15.2 (14.0, 16.5) 23.7 (21.8, 25.7) 55.8**
Residence Urban 8.0 (6.9, 9.1) 19.7 (18.3, 21.3) 148.2** 22.3 (21.0, 23.8) 29.4 (27.8, 31.1) 31.9** Rural 6.1 (4.9, 7.6) 17.4 (14.8, 20.5) 184.8** 15.7 (14.0, 17.7) 23.7 (20.9, 26.8) 50.8**
Education level Less than primary 3.6 (2.9, 4.4) 12.5 (10.8, 14.3) 245.4** 7.5 (6.6, 8.6) 16.3 (14.6, 18.2) 117.1** Primary 6.4 (4.9, 8.2) 21.9 (18.6, 25.6) 243.8** 15.2 (13.2, 17.4) 28.8 (25.3, 32.6) 89.6** Secondary 9.6 (8.1, 11.3) 20.9 (18.6, 23.3) 118.0** 24.8 (22.7, 27.1) 29.9 (27.4, 32.6) 20.5** University 8.0 (6.5, 9.7) 19.6 (17.3, 22.0) 145.5** 31.2 (28.6, 34.0) 32.2 (29.5, 35.0) 3.2
Region Bangkok 4.6 (3.7, 5.8) 24.9 (22.6, 27.4) 440.7** 19.3 (17.2, 21.6) 38.3 (35.6, 41.1) 98.1** Central 9.4 (7.8, 11.3) 14.8 (12.6, 17.4) 57.8** 21.6 (19.1, 24.2) 22.6 (19.9, 25.6) 4.8 Northern 7.4 (5.3, 10.1) 12.4 (9.9, 15.5) 68.6** 16.7 (13.6, 20.3) 18.2 (15.1, 21.9) 9.4 Northeastern 6.0 (4.3, 8.4) 18.8 (14.4, 24.2) 213.3** 13.6 (11.1, 16.5) 25.7 (21.1, 30.9) 89.0** Southern 4.2 (2.7, 6.7) 25.8 (21.6, 30.3) 509.4** 21.5 (19.0, 24.3) 32.1 (28.0, 36.5) 49.2**
Socioeconomic status Lowest 5.9 (4.4, 8.0) 15.4 (12.9, 18.3) 159.6** 14.0 (11.8, 16.6) 22.3 (19.5, 25.4) 59.0** Low 6.0 (4.8, 7.6) 16.8 (13.9, 20.2) 178.6** 14.4 (12.5, 16.6) 22.1 (18.9, 25.5) 52.6** Middle 7.1 (5.7, 8.9) 18.6 (15.7, 21.8) 161.0** 18.2 (16.2, 20.3) 25.7 (22.5, 29.1) 41.2** High 7.9 (6.5, 9.7) 21.7 (19.1, 24.6) 173.4** 21.5 (19.3, 23.8) 29.7 (26.9, 32.7) 38.4** Highest 7.0 (5.9, 8.4) 20.0 (18.1, 22.1) 184.0** 24.5 (22.3, 26.9) 31.3 (28.9, 33.7) 27.5**
Note: Relative change (%) calculated by [rate of 2011– rate of 2009] *100 / rate of 2009 ** P<0.05
8-18 Media

9. Knowledge, attitudes and perceptions
9-1
9. Knowledge, attitudes and perceptions
This chapter provides the findings on knowledge, attitudes and perceptions of tobacco use in two main sections. The first section describes the findings from the 2011 GATS and the second section compares the key findings of the 2009 GATS and the 2011 GATS.
9.1 Knowledge, attitudes and perceptions related to tobacco use in 2011
Key findings in 2011
o 97.0% of people believed that smoking causes serious illnesses.
o Only 48.1% of people believed that bladder cancer is caused by smoking.
o 94.2% of people believed that exposure to second-hand smoke (SHS) causes serious illnesses in non-smokers.
o Only 58.6% of people believed that breathing other people’s smoke leads to premature births.
o 34.3% of people thought that smoking hand-rolled cigarettes is less harmful than smoking manufactured cigarettes.
This section presents the knowledge, attitudes and perceptions about smoking. It is divided into seven parts: (1) belief that smoking causes serious illness and specific diseases, (2) belief that second-hand smoke (SHS) causes serious illness and specific diseases, (3) the impact of pictorial health warnings, (4) belief that smoking hand-rolled cigarettes is less harmful than smoking manufactured cigarettes, (5) belief that cigarettes are addictive, (6) belief that smokeless tobacco causes serious illness, and (7) belief that cigarette packages with different colours are harmful to health in different ways.
9.1.1 Belief that cigarette smoking causes serious illness and specific diseases
9.1.1.1 Based on all adults aged 15 years and above
Table 9.1 and Figure 9.1 show that, among all adults, the belief that smoking causes serious illness did not vary significantly by gender, residence, region and SES. By age group, those who were 60 years and above believed this the least as compared to the other age groups. By education level, those with less than primary education also believed this the least as compared to those with other education levels.
Among the 12 specific tobacco-related diseases identified – heart attack, lung cancer, mouth cancer, impotence, emphysema, bladder cancer, stomach cancer, premature birth, bone loss, high blood pressure and laryngeal cancer – the survey revealed that the most common belief regarding tobacco-related disease was that smoking causes lung cancer (97.8%), emphysema (92.8%), laryngeal cancer (92.2%) and mouth cancer (91.8%). By and large all category of people beliefs that smoking causes lung cancer.
Global Adult Tobacco Survey : Thailand Report, 2011 9-1
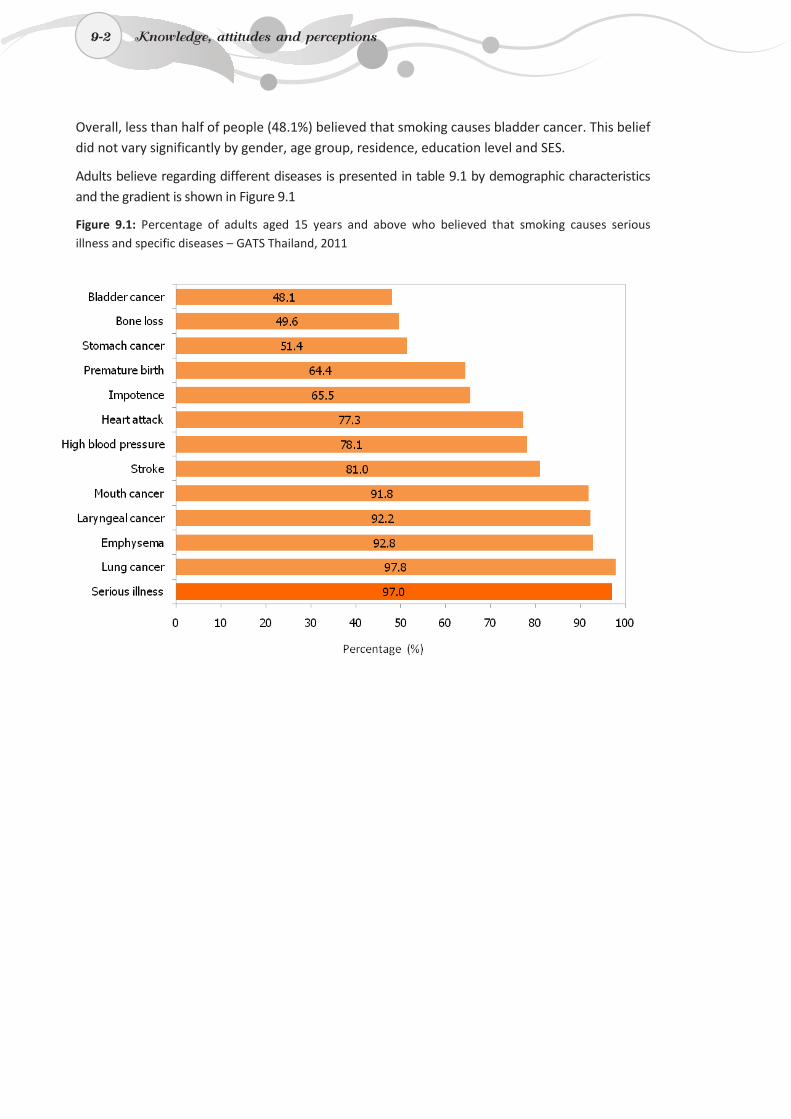
9-2 Knowledge, attitudes and perceptions
9-2
Overall, less than half of people (48.1%) believed that smoking causes bladder cancer. This belief did not vary significantly by gender, age group, residence, education level and SES.
Adults believe regarding different diseases is presented in table 9.1 by demographic characteristics and the gradient is shown in Figure 9.1
Figure 9.1: Percentage of adults aged 15 years and above who believed that smoking causes serious illness and specific diseases – GATS Thailand, 2011
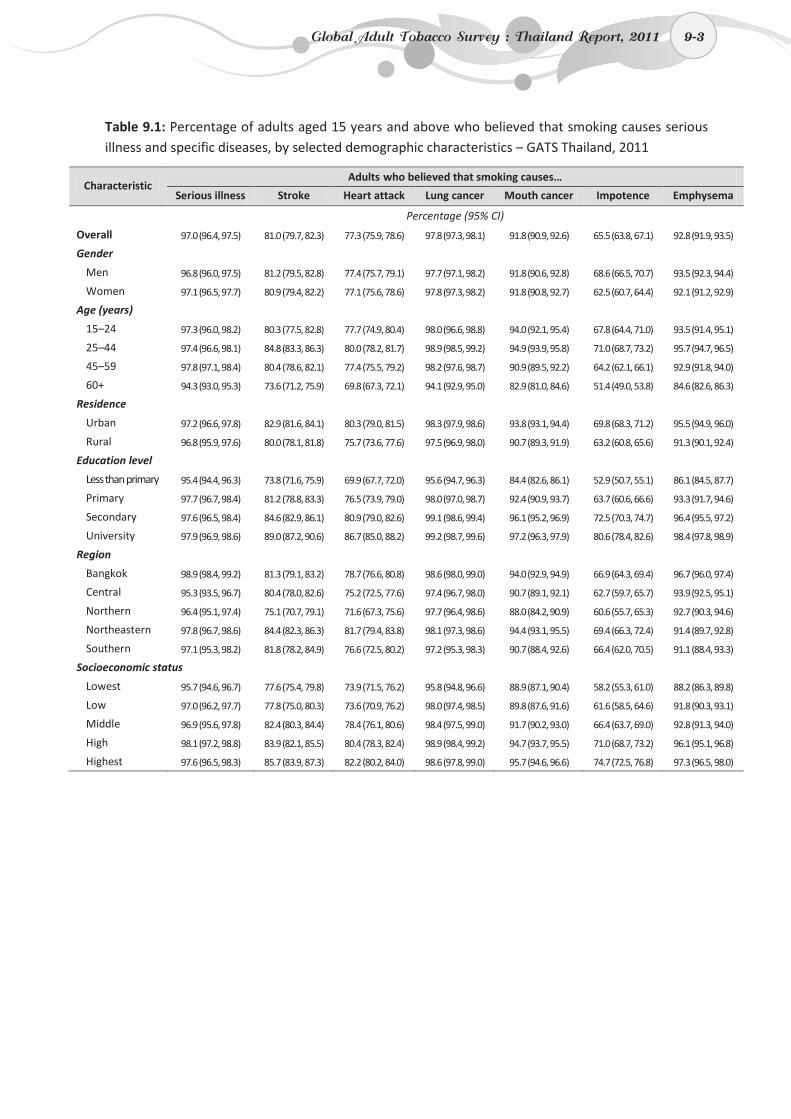
9-3
Table 9.1: Percentage of adults aged 15 years and above who believed that smoking causes serious illness and specific diseases, by selected demographic characteristics – GATS Thailand, 2011
Characteristic Adults who believed that smoking causes…
Serious illness Stroke Heart attack Lung cancer Mouth cancer Impotence Emphysema
Percentage (95% CI)
Overall 97.0 (96.4, 97.5) 81.0 (79.7, 82.3) 77.3 (75.9, 78.6) 97.8 (97.3, 98.1) 91.8 (90.9, 92.6) 65.5 (63.8, 67.1) 92.8 (91.9, 93.5)
Gender
Men 96.8 (96.0, 97.5) 81.2 (79.5, 82.8) 77.4 (75.7, 79.1) 97.7 (97.1, 98.2) 91.8 (90.6, 92.8) 68.6 (66.5, 70.7) 93.5 (92.3, 94.4)
Women 97.1 (96.5, 97.7) 80.9 (79.4, 82.2) 77.1 (75.6, 78.6) 97.8 (97.3, 98.2) 91.8 (90.8, 92.7) 62.5 (60.7, 64.4) 92.1 (91.2, 92.9)
Age (years)
15–24 97.3 (96.0, 98.2) 80.3 (77.5, 82.8) 77.7 (74.9, 80.4) 98.0 (96.6, 98.8) 94.0 (92.1, 95.4) 67.8 (64.4, 71.0) 93.5 (91.4, 95.1)
25–44 97.4 (96.6, 98.1) 84.8 (83.3, 86.3) 80.0 (78.2, 81.7) 98.9 (98.5, 99.2) 94.9 (93.9, 95.8) 71.0 (68.7, 73.2) 95.7 (94.7, 96.5)
45–59 97.8 (97.1, 98.4) 80.4 (78.6, 82.1) 77.4 (75.5, 79.2) 98.2 (97.6, 98.7) 90.9 (89.5, 92.2) 64.2 (62.1, 66.1) 92.9 (91.8, 94.0)
60+ 94.3 (93.0, 95.3) 73.6 (71.2, 75.9) 69.8 (67.3, 72.1) 94.1 (92.9, 95.0) 82.9 (81.0, 84.6) 51.4 (49.0, 53.8) 84.6 (82.6, 86.3)
Residence
Urban 97.2 (96.6, 97.8) 82.9 (81.6, 84.1) 80.3 (79.0, 81.5) 98.3 (97.9, 98.6) 93.8 (93.1, 94.4) 69.8 (68.3, 71.2) 95.5 (94.9, 96.0)
Rural 96.8 (95.9, 97.6) 80.0 (78.1, 81.8) 75.7 (73.6, 77.6) 97.5 (96.9, 98.0) 90.7 (89.3, 91.9) 63.2 (60.8, 65.6) 91.3 (90.1, 92.4)
Education level
Less than primary 95.4 (94.4, 96.3) 73.8 (71.6, 75.9) 69.9 (67.7, 72.0) 95.6 (94.7, 96.3) 84.4 (82.6, 86.1) 52.9 (50.7, 55.1) 86.1 (84.5, 87.7)
Primary 97.7 (96.7, 98.4) 81.2 (78.8, 83.3) 76.5 (73.9, 79.0) 98.0 (97.0, 98.7) 92.4 (90.9, 93.7) 63.7 (60.6, 66.6) 93.3 (91.7, 94.6)
Secondary 97.6 (96.5, 98.4) 84.6 (82.9, 86.1) 80.9 (79.0, 82.6) 99.1 (98.6, 99.4) 96.1 (95.2, 96.9) 72.5 (70.3, 74.7) 96.4 (95.5, 97.2)
University 97.9 (96.9, 98.6) 89.0 (87.2, 90.6) 86.7 (85.0, 88.2) 99.2 (98.7, 99.6) 97.2 (96.3, 97.9) 80.6 (78.4, 82.6) 98.4 (97.8, 98.9)
Region
Bangkok 98.9 (98.4, 99.2) 81.3 (79.1, 83.2) 78.7 (76.6, 80.8) 98.6 (98.0, 99.0) 94.0 (92.9, 94.9) 66.9 (64.3, 69.4) 96.7 (96.0, 97.4)
Central 95.3 (93.5, 96.7) 80.4 (78.0, 82.6) 75.2 (72.5, 77.6) 97.4 (96.7, 98.0) 90.7 (89.1, 92.1) 62.7 (59.7, 65.7) 93.9 (92.5, 95.1)
Northern 96.4 (95.1, 97.4) 75.1 (70.7, 79.1) 71.6 (67.3, 75.6) 97.7 (96.4, 98.6) 88.0 (84.2, 90.9) 60.6 (55.7, 65.3) 92.7 (90.3, 94.6)
Northeastern 97.8 (96.7, 98.6) 84.4 (82.3, 86.3) 81.7 (79.4, 83.8) 98.1 (97.3, 98.6) 94.4 (93.1, 95.5) 69.4 (66.3, 72.4) 91.4 (89.7, 92.8)
Southern 97.1 (95.3, 98.2) 81.8 (78.2, 84.9) 76.6 (72.5, 80.2) 97.2 (95.3, 98.3) 90.7 (88.4, 92.6) 66.4 (62.0, 70.5) 91.1 (88.4, 93.3)
Socioeconomic status
Lowest 95.7 (94.6, 96.7) 77.6 (75.4, 79.8) 73.9 (71.5, 76.2) 95.8 (94.8, 96.6) 88.9 (87.1, 90.4) 58.2 (55.3, 61.0) 88.2 (86.3, 89.8)
Low 97.0 (96.2, 97.7) 77.8 (75.0, 80.3) 73.6 (70.9, 76.2) 98.0 (97.4, 98.5) 89.8 (87.6, 91.6) 61.6 (58.5, 64.6) 91.8 (90.3, 93.1)
Middle 96.9 (95.6, 97.8) 82.4 (80.3, 84.4) 78.4 (76.1, 80.6) 98.4 (97.5, 99.0) 91.7 (90.2, 93.0) 66.4 (63.7, 69.0) 92.8 (91.3, 94.0)
High 98.1 (97.2, 98.8) 83.9 (82.1, 85.5) 80.4 (78.3, 82.4) 98.9 (98.4, 99.2) 94.7 (93.7, 95.5) 71.0 (68.7, 73.2) 96.1 (95.1, 96.8)
Highest 97.6 (96.5, 98.3) 85.7 (83.9, 87.3) 82.2 (80.2, 84.0) 98.6 (97.8, 99.0) 95.7 (94.6, 96.6) 74.7 (72.5, 76.8) 97.3 (96.5, 98.0)
Global Adult Tobacco Survey : Thailand Report, 2011 9-3
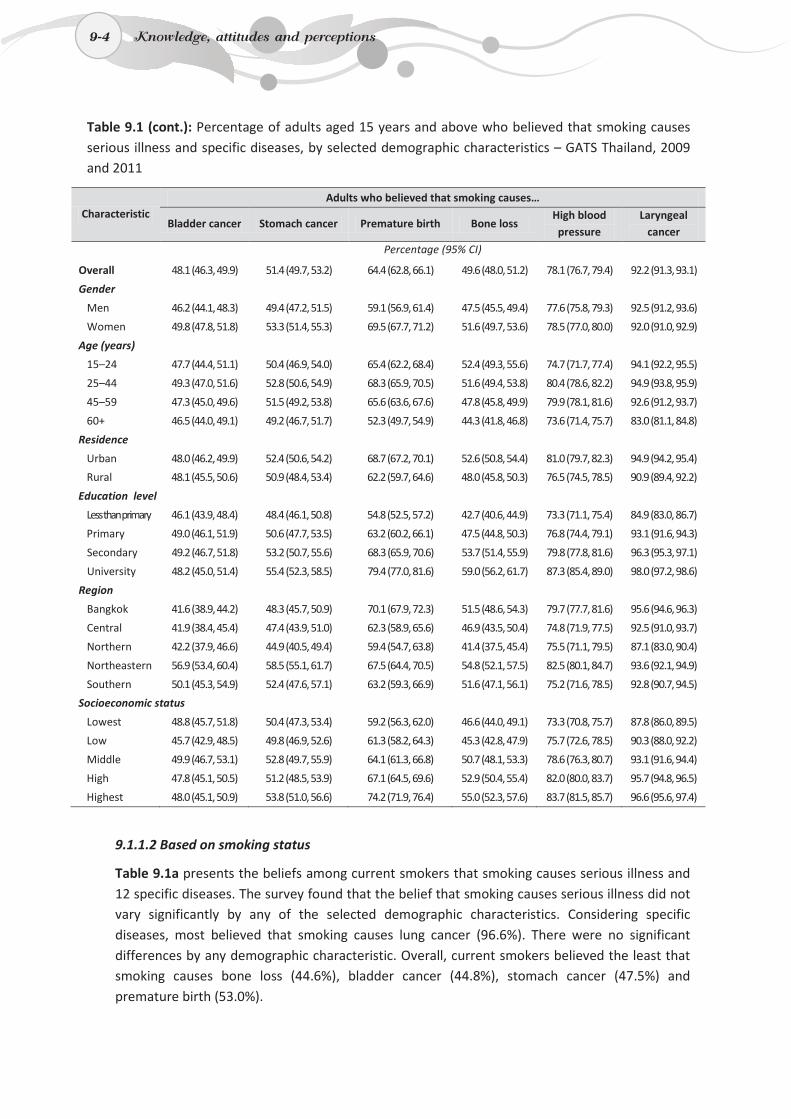
9-4
Table 9.1 (cont.): Percentage of adults aged 15 years and above who believed that smoking causes serious illness and specific diseases, by selected demographic characteristics – GATS Thailand, 2009 and 2011
Characteristic Adults who believed that smoking causes…
Bladder cancer Stomach cancer Premature birth Bone loss High blood
pressure Laryngeal
cancer
Percentage (95% CI)
Overall 48.1 (46.3, 49.9) 51.4 (49.7, 53.2) 64.4 (62.8, 66.1) 49.6 (48.0, 51.2) 78.1 (76.7, 79.4) 92.2 (91.3, 93.1)
Gender
Men 46.2 (44.1, 48.3) 49.4 (47.2, 51.5) 59.1 (56.9, 61.4) 47.5 (45.5, 49.4) 77.6 (75.8, 79.3) 92.5 (91.2, 93.6)
Women 49.8 (47.8, 51.8) 53.3 (51.4, 55.3) 69.5 (67.7, 71.2) 51.6 (49.7, 53.6) 78.5 (77.0, 80.0) 92.0 (91.0, 92.9)
Age (years)
15–24 47.7 (44.4, 51.1) 50.4 (46.9, 54.0) 65.4 (62.2, 68.4) 52.4 (49.3, 55.6) 74.7 (71.7, 77.4) 94.1 (92.2, 95.5)
25–44 49.3 (47.0, 51.6) 52.8 (50.6, 54.9) 68.3 (65.9, 70.5) 51.6 (49.4, 53.8) 80.4 (78.6, 82.2) 94.9 (93.8, 95.9)
45–59 47.3 (45.0, 49.6) 51.5 (49.2, 53.8) 65.6 (63.6, 67.6) 47.8 (45.8, 49.9) 79.9 (78.1, 81.6) 92.6 (91.2, 93.7)
60+ 46.5 (44.0, 49.1) 49.2 (46.7, 51.7) 52.3 (49.7, 54.9) 44.3 (41.8, 46.8) 73.6 (71.4, 75.7) 83.0 (81.1, 84.8)
Residence
Urban 48.0 (46.2, 49.9) 52.4 (50.6, 54.2) 68.7 (67.2, 70.1) 52.6 (50.8, 54.4) 81.0 (79.7, 82.3) 94.9 (94.2, 95.4)
Rural 48.1 (45.5, 50.6) 50.9 (48.4, 53.4) 62.2 (59.7, 64.6) 48.0 (45.8, 50.3) 76.5 (74.5, 78.5) 90.9 (89.4, 92.2)
Education level
Less than primary 46.1 (43.9, 48.4) 48.4 (46.1, 50.8) 54.8 (52.5, 57.2) 42.7 (40.6, 44.9) 73.3 (71.1, 75.4) 84.9 (83.0, 86.7)
Primary 49.0 (46.1, 51.9) 50.6 (47.7, 53.5) 63.2 (60.2, 66.1) 47.5 (44.8, 50.3) 76.8 (74.4, 79.1) 93.1 (91.6, 94.3)
Secondary 49.2 (46.7, 51.8) 53.2 (50.7, 55.6) 68.3 (65.9, 70.6) 53.7 (51.4, 55.9) 79.8 (77.8, 81.6) 96.3 (95.3, 97.1)
University 48.2 (45.0, 51.4) 55.4 (52.3, 58.5) 79.4 (77.0, 81.6) 59.0 (56.2, 61.7) 87.3 (85.4, 89.0) 98.0 (97.2, 98.6)
Region
Bangkok 41.6 (38.9, 44.2) 48.3 (45.7, 50.9) 70.1 (67.9, 72.3) 51.5 (48.6, 54.3) 79.7 (77.7, 81.6) 95.6 (94.6, 96.3)
Central 41.9 (38.4, 45.4) 47.4 (43.9, 51.0) 62.3 (58.9, 65.6) 46.9 (43.5, 50.4) 74.8 (71.9, 77.5) 92.5 (91.0, 93.7)
Northern 42.2 (37.9, 46.6) 44.9 (40.5, 49.4) 59.4 (54.7, 63.8) 41.4 (37.5, 45.4) 75.5 (71.1, 79.5) 87.1 (83.0, 90.4)
Northeastern 56.9 (53.4, 60.4) 58.5 (55.1, 61.7) 67.5 (64.4, 70.5) 54.8 (52.1, 57.5) 82.5 (80.1, 84.7) 93.6 (92.1, 94.9)
Southern 50.1 (45.3, 54.9) 52.4 (47.6, 57.1) 63.2 (59.3, 66.9) 51.6 (47.1, 56.1) 75.2 (71.6, 78.5) 92.8 (90.7, 94.5)
Socioeconomic status
Lowest 48.8 (45.7, 51.8) 50.4 (47.3, 53.4) 59.2 (56.3, 62.0) 46.6 (44.0, 49.1) 73.3 (70.8, 75.7) 87.8 (86.0, 89.5)
Low 45.7 (42.9, 48.5) 49.8 (46.9, 52.6) 61.3 (58.2, 64.3) 45.3 (42.8, 47.9) 75.7 (72.6, 78.5) 90.3 (88.0, 92.2)
Middle 49.9 (46.7, 53.1) 52.8 (49.7, 55.9) 64.1 (61.3, 66.8) 50.7 (48.1, 53.3) 78.6 (76.3, 80.7) 93.1 (91.6, 94.4)
High 47.8 (45.1, 50.5) 51.2 (48.5, 53.9) 67.1 (64.5, 69.6) 52.9 (50.4, 55.4) 82.0 (80.0, 83.7) 95.7 (94.8, 96.5)
Highest 48.0 (45.1, 50.9) 53.8 (51.0, 56.6) 74.2 (71.9, 76.4) 55.0 (52.3, 57.6) 83.7 (81.5, 85.7) 96.6 (95.6, 97.4)
9.1.1.2 Based on smoking status
Table 9.1a presents the beliefs among current smokers that smoking causes serious illness and 12 specific diseases. The survey found that the belief that smoking causes serious illness did not vary significantly by any of the selected demographic characteristics. Considering specific diseases, most believed that smoking causes lung cancer (96.6%). There were no significant differences by any demographic characteristic. Overall, current smokers believed the least that smoking causes bone loss (44.6%), bladder cancer (44.8%), stomach cancer (47.5%) and premature birth (53.0%).
9-4 Knowledge, attitudes and perceptions
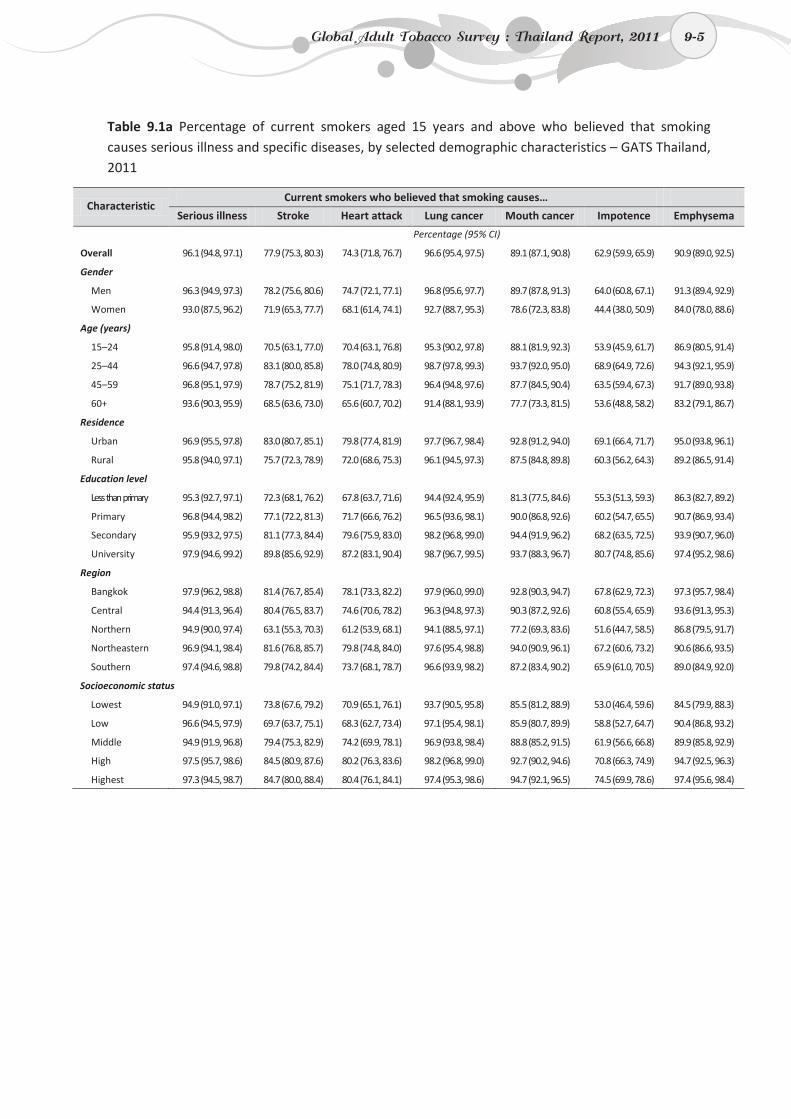
9-5
Table 9.1a Percentage of current smokers aged 15 years and above who believed that smoking causes serious illness and specific diseases, by selected demographic characteristics – GATS Thailand, 2011
Characteristic Current smokers who believed that smoking causes…
Serious illness Stroke Heart attack Lung cancer Mouth cancer Impotence Emphysema
Percentage (95% CI)
Overall 96.1 (94.8, 97.1) 77.9 (75.3, 80.3) 74.3 (71.8, 76.7) 96.6 (95.4, 97.5) 89.1 (87.1, 90.8) 62.9 (59.9, 65.9) 90.9 (89.0, 92.5)
Gender
Men 96.3 (94.9, 97.3) 78.2 (75.6, 80.6) 74.7 (72.1, 77.1) 96.8 (95.6, 97.7) 89.7 (87.8, 91.3) 64.0 (60.8, 67.1) 91.3 (89.4, 92.9)
Women 93.0 (87.5, 96.2) 71.9 (65.3, 77.7) 68.1 (61.4, 74.1) 92.7 (88.7, 95.3) 78.6 (72.3, 83.8) 44.4 (38.0, 50.9) 84.0 (78.0, 88.6)
Age (years)
15–24 95.8 (91.4, 98.0) 70.5 (63.1, 77.0) 70.4 (63.1, 76.8) 95.3 (90.2, 97.8) 88.1 (81.9, 92.3) 53.9 (45.9, 61.7) 86.9 (80.5, 91.4)
25–44 96.6 (94.7, 97.8) 83.1 (80.0, 85.8) 78.0 (74.8, 80.9) 98.7 (97.8, 99.3) 93.7 (92.0, 95.0) 68.9 (64.9, 72.6) 94.3 (92.1, 95.9)
45–59 96.8 (95.1, 97.9) 78.7 (75.2, 81.9) 75.1 (71.7, 78.3) 96.4 (94.8, 97.6) 87.7 (84.5, 90.4) 63.5 (59.4, 67.3) 91.7 (89.0, 93.8)
60+ 93.6 (90.3, 95.9) 68.5 (63.6, 73.0) 65.6 (60.7, 70.2) 91.4 (88.1, 93.9) 77.7 (73.3, 81.5) 53.6 (48.8, 58.2) 83.2 (79.1, 86.7)
Residence
Urban 96.9 (95.5, 97.8) 83.0 (80.7, 85.1) 79.8 (77.4, 81.9) 97.7 (96.7, 98.4) 92.8 (91.2, 94.0) 69.1 (66.4, 71.7) 95.0 (93.8, 96.1)
Rural 95.8 (94.0, 97.1) 75.7 (72.3, 78.9) 72.0 (68.6, 75.3) 96.1 (94.5, 97.3) 87.5 (84.8, 89.8) 60.3 (56.2, 64.3) 89.2 (86.5, 91.4)
Education level
Less than primary 95.3 (92.7, 97.1) 72.3 (68.1, 76.2) 67.8 (63.7, 71.6) 94.4 (92.4, 95.9) 81.3 (77.5, 84.6) 55.3 (51.3, 59.3) 86.3 (82.7, 89.2)
Primary 96.8 (94.4, 98.2) 77.1 (72.2, 81.3) 71.7 (66.6, 76.2) 96.5 (93.6, 98.1) 90.0 (86.8, 92.6) 60.2 (54.7, 65.5) 90.7 (86.9, 93.4)
Secondary 95.9 (93.2, 97.5) 81.1 (77.3, 84.4) 79.6 (75.9, 83.0) 98.2 (96.8, 99.0) 94.4 (91.9, 96.2) 68.2 (63.5, 72.5) 93.9 (90.7, 96.0)
University 97.9 (94.6, 99.2) 89.8 (85.6, 92.9) 87.2 (83.1, 90.4) 98.7 (96.7, 99.5) 93.7 (88.3, 96.7) 80.7 (74.8, 85.6) 97.4 (95.2, 98.6)
Region
Bangkok 97.9 (96.2, 98.8) 81.4 (76.7, 85.4) 78.1 (73.3, 82.2) 97.9 (96.0, 99.0) 92.8 (90.3, 94.7) 67.8 (62.9, 72.3) 97.3 (95.7, 98.4)
Central 94.4 (91.3, 96.4) 80.4 (76.5, 83.7) 74.6 (70.6, 78.2) 96.3 (94.8, 97.3) 90.3 (87.2, 92.6) 60.8 (55.4, 65.9) 93.6 (91.3, 95.3)
Northern 94.9 (90.0, 97.4) 63.1 (55.3, 70.3) 61.2 (53.9, 68.1) 94.1 (88.5, 97.1) 77.2 (69.3, 83.6) 51.6 (44.7, 58.5) 86.8 (79.5, 91.7)
Northeastern 96.9 (94.1, 98.4) 81.6 (76.8, 85.7) 79.8 (74.8, 84.0) 97.6 (95.4, 98.8) 94.0 (90.9, 96.1) 67.2 (60.6, 73.2) 90.6 (86.6, 93.5)
Southern 97.4 (94.6, 98.8) 79.8 (74.2, 84.4) 73.7 (68.1, 78.7) 96.6 (93.9, 98.2) 87.2 (83.4, 90.2) 65.9 (61.0, 70.5) 89.0 (84.9, 92.0)
Socioeconomic status
Lowest 94.9 (91.0, 97.1) 73.8 (67.6, 79.2) 70.9 (65.1, 76.1) 93.7 (90.5, 95.8) 85.5 (81.2, 88.9) 53.0 (46.4, 59.6) 84.5 (79.9, 88.3)
Low 96.6 (94.5, 97.9) 69.7 (63.7, 75.1) 68.3 (62.7, 73.4) 97.1 (95.4, 98.1) 85.9 (80.7, 89.9) 58.8 (52.7, 64.7) 90.4 (86.8, 93.2)
Middle 94.9 (91.9, 96.8) 79.4 (75.3, 82.9) 74.2 (69.9, 78.1) 96.9 (93.8, 98.4) 88.8 (85.2, 91.5) 61.9 (56.6, 66.8) 89.9 (85.8, 92.9)
High 97.5 (95.7, 98.6) 84.5 (80.9, 87.6) 80.2 (76.3, 83.6) 98.2 (96.8, 99.0) 92.7 (90.2, 94.6) 70.8 (66.3, 74.9) 94.7 (92.5, 96.3)
Highest 97.3 (94.5, 98.7) 84.7 (80.0, 88.4) 80.4 (76.1, 84.1) 97.4 (95.3, 98.6) 94.7 (92.1, 96.5) 74.5 (69.9, 78.6) 97.4 (95.6, 98.4)
Global Adult Tobacco Survey : Thailand Report, 2011 9-5
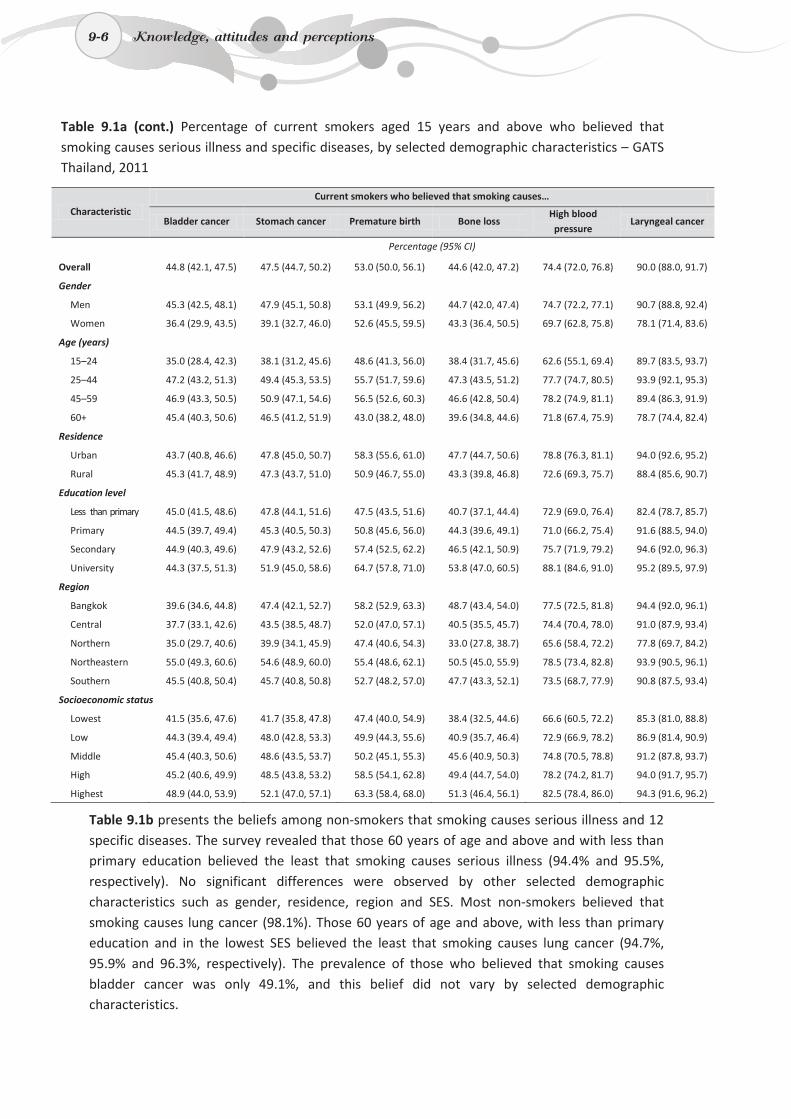
9-6
Table 9.1a (cont.) Percentage of current smokers aged 15 years and above who believed that smoking causes serious illness and specific diseases, by selected demographic characteristics – GATS Thailand, 2011
Characteristic
Current smokers who believed that smoking causes…
Bladder cancer Stomach cancer Premature birth Bone loss High blood
pressure Laryngeal cancer
Percentage (95% CI)
Overall 44.8 (42.1, 47.5) 47.5 (44.7, 50.2) 53.0 (50.0, 56.1) 44.6 (42.0, 47.2) 74.4 (72.0, 76.8) 90.0 (88.0, 91.7)
Gender
Men 45.3 (42.5, 48.1) 47.9 (45.1, 50.8) 53.1 (49.9, 56.2) 44.7 (42.0, 47.4) 74.7 (72.2, 77.1) 90.7 (88.8, 92.4)
Women 36.4 (29.9, 43.5) 39.1 (32.7, 46.0) 52.6 (45.5, 59.5) 43.3 (36.4, 50.5) 69.7 (62.8, 75.8) 78.1 (71.4, 83.6)
Age (years)
15–24 35.0 (28.4, 42.3) 38.1 (31.2, 45.6) 48.6 (41.3, 56.0) 38.4 (31.7, 45.6) 62.6 (55.1, 69.4) 89.7 (83.5, 93.7)
25–44 47.2 (43.2, 51.3) 49.4 (45.3, 53.5) 55.7 (51.7, 59.6) 47.3 (43.5, 51.2) 77.7 (74.7, 80.5) 93.9 (92.1, 95.3)
45–59 46.9 (43.3, 50.5) 50.9 (47.1, 54.6) 56.5 (52.6, 60.3) 46.6 (42.8, 50.4) 78.2 (74.9, 81.1) 89.4 (86.3, 91.9)
60+ 45.4 (40.3, 50.6) 46.5 (41.2, 51.9) 43.0 (38.2, 48.0) 39.6 (34.8, 44.6) 71.8 (67.4, 75.9) 78.7 (74.4, 82.4)
Residence
Urban 43.7 (40.8, 46.6) 47.8 (45.0, 50.7) 58.3 (55.6, 61.0) 47.7 (44.7, 50.6) 78.8 (76.3, 81.1) 94.0 (92.6, 95.2)
Rural 45.3 (41.7, 48.9) 47.3 (43.7, 51.0) 50.9 (46.7, 55.0) 43.3 (39.8, 46.8) 72.6 (69.3, 75.7) 88.4 (85.6, 90.7)
Education level
Less than primary 45.0 (41.5, 48.6) 47.8 (44.1, 51.6) 47.5 (43.5, 51.6) 40.7 (37.1, 44.4) 72.9 (69.0, 76.4) 82.4 (78.7, 85.7)
Primary 44.5 (39.7, 49.4) 45.3 (40.5, 50.3) 50.8 (45.6, 56.0) 44.3 (39.6, 49.1) 71.0 (66.2, 75.4) 91.6 (88.5, 94.0)
Secondary 44.9 (40.3, 49.6) 47.9 (43.2, 52.6) 57.4 (52.5, 62.2) 46.5 (42.1, 50.9) 75.7 (71.9, 79.2) 94.6 (92.0, 96.3)
University 44.3 (37.5, 51.3) 51.9 (45.0, 58.6) 64.7 (57.8, 71.0) 53.8 (47.0, 60.5) 88.1 (84.6, 91.0) 95.2 (89.5, 97.9)
Region
Bangkok 39.6 (34.6, 44.8) 47.4 (42.1, 52.7) 58.2 (52.9, 63.3) 48.7 (43.4, 54.0) 77.5 (72.5, 81.8) 94.4 (92.0, 96.1)
Central 37.7 (33.1, 42.6) 43.5 (38.5, 48.7) 52.0 (47.0, 57.1) 40.5 (35.5, 45.7) 74.4 (70.4, 78.0) 91.0 (87.9, 93.4)
Northern 35.0 (29.7, 40.6) 39.9 (34.1, 45.9) 47.4 (40.6, 54.3) 33.0 (27.8, 38.7) 65.6 (58.4, 72.2) 77.8 (69.7, 84.2)
Northeastern 55.0 (49.3, 60.6) 54.6 (48.9, 60.0) 55.4 (48.6, 62.1) 50.5 (45.0, 55.9) 78.5 (73.4, 82.8) 93.9 (90.5, 96.1)
Southern 45.5 (40.8, 50.4) 45.7 (40.8, 50.8) 52.7 (48.2, 57.0) 47.7 (43.3, 52.1) 73.5 (68.7, 77.9) 90.8 (87.5, 93.4)
Socioeconomic status
Lowest 41.5 (35.6, 47.6) 41.7 (35.8, 47.8) 47.4 (40.0, 54.9) 38.4 (32.5, 44.6) 66.6 (60.5, 72.2) 85.3 (81.0, 88.8)
Low 44.3 (39.4, 49.4) 48.0 (42.8, 53.3) 49.9 (44.3, 55.6) 40.9 (35.7, 46.4) 72.9 (66.9, 78.2) 86.9 (81.4, 90.9)
Middle 45.4 (40.3, 50.6) 48.6 (43.5, 53.7) 50.2 (45.1, 55.3) 45.6 (40.9, 50.3) 74.8 (70.5, 78.8) 91.2 (87.8, 93.7)
High 45.2 (40.6, 49.9) 48.5 (43.8, 53.2) 58.5 (54.1, 62.8) 49.4 (44.7, 54.0) 78.2 (74.2, 81.7) 94.0 (91.7, 95.7)
Highest 48.9 (44.0, 53.9) 52.1 (47.0, 57.1) 63.3 (58.4, 68.0) 51.3 (46.4, 56.1) 82.5 (78.4, 86.0) 94.3 (91.6, 96.2)
Table 9.1b presents the beliefs among non-smokers that smoking causes serious illness and 12 specific diseases. The survey revealed that those 60 years of age and above and with less than primary education believed the least that smoking causes serious illness (94.4% and 95.5%, respectively). No significant differences were observed by other selected demographic characteristics such as gender, residence, region and SES. Most non-smokers believed that smoking causes lung cancer (98.1%). Those 60 years of age and above, with less than primary education and in the lowest SES believed the least that smoking causes lung cancer (94.7%, 95.9% and 96.3%, respectively). The prevalence of those who believed that smoking causes bladder cancer was only 49.1%, and this belief did not vary by selected demographic characteristics.
9-6 Knowledge, attitudes and perceptions
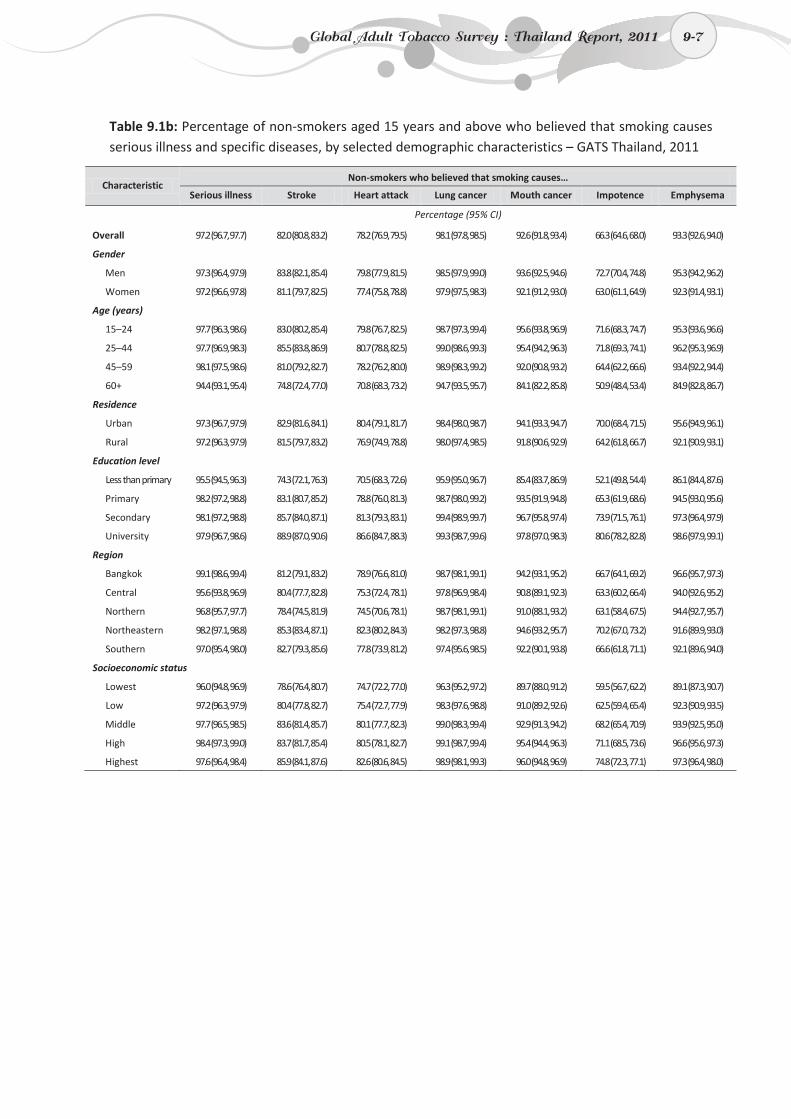
9-7
Table 9.1b: Percentage of non-smokers aged 15 years and above who believed that smoking causes serious illness and specific diseases, by selected demographic characteristics – GATS Thailand, 2011
Characteristic Non-smokers who believed that smoking causes…
Serious illness Stroke Heart attack Lung cancer Mouth cancer Impotence Emphysema
Percentage (95% CI)
Overall 97.2 (96.7, 97.7) 82.0 (80.8, 83.2) 78.2 (76.9, 79.5) 98.1 (97.8, 98.5) 92.6 (91.8, 93.4) 66.3 (64.6, 68.0) 93.3 (92.6, 94.0)
Gender
Men 97.3 (96.4, 97.9) 83.8 (82.1, 85.4) 79.8 (77.9, 81.5) 98.5 (97.9, 99.0) 93.6 (92.5, 94.6) 72.7 (70.4, 74.8) 95.3 (94.2, 96.2)
Women 97.2 (96.6, 97.8) 81.1 (79.7, 82.5) 77.4 (75.8, 78.8) 97.9 (97.5, 98.3) 92.1 (91.2, 93.0) 63.0 (61.1, 64.9) 92.3 (91.4, 93.1)
Age (years)
15–24 97.7 (96.3, 98.6) 83.0 (80.2, 85.4) 79.8 (76.7, 82.5) 98.7 (97.3, 99.4) 95.6 (93.8, 96.9) 71.6 (68.3, 74.7) 95.3 (93.6, 96.6)
25–44 97.7 (96.9, 98.3) 85.5 (83.8, 86.9) 80.7 (78.8, 82.5) 99.0 (98.6, 99.3) 95.4 (94.2, 96.3) 71.8 (69.3, 74.1) 96.2 (95.3, 96.9)
45–59 98.1 (97.5, 98.6) 81.0 (79.2, 82.7) 78.2 (76.2, 80.0) 98.9 (98.3, 99.2) 92.0 (90.8, 93.2) 64.4 (62.2, 66.6) 93.4 (92.2, 94.4)
60+ 94.4 (93.1, 95.4) 74.8 (72.4, 77.0) 70.8 (68.3, 73.2) 94.7 (93.5, 95.7) 84.1 (82.2, 85.8) 50.9 (48.4, 53.4) 84.9 (82.8, 86.7)
Residence
Urban 97.3 (96.7, 97.9) 82.9 (81.6, 84.1) 80.4 (79.1, 81.7) 98.4 (98.0, 98.7) 94.1 (93.3, 94.7) 70.0 (68.4, 71.5) 95.6 (94.9, 96.1)
Rural 97.2 (96.3, 97.9) 81.5 (79.7, 83.2) 76.9 (74.9, 78.8) 98.0 (97.4, 98.5) 91.8 (90.6, 92.9) 64.2 (61.8, 66.7) 92.1 (90.9, 93.1)
Education level
Less than primary 95.5 (94.5, 96.3) 74.3 (72.1, 76.3) 70.5 (68.3, 72.6) 95.9 (95.0, 96.7) 85.4 (83.7, 86.9) 52.1 (49.8, 54.4) 86.1 (84.4, 87.6)
Primary 98.2 (97.2, 98.8) 83.1 (80.7, 85.2) 78.8 (76.0, 81.3) 98.7 (98.0, 99.2) 93.5 (91.9, 94.8) 65.3 (61.9, 68.6) 94.5 (93.0, 95.6)
Secondary 98.1 (97.2, 98.8) 85.7 (84.0, 87.1) 81.3 (79.3, 83.1) 99.4 (98.9, 99.7) 96.7 (95.8, 97.4) 73.9 (71.5, 76.1) 97.3 (96.4, 97.9)
University 97.9 (96.7, 98.6) 88.9 (87.0, 90.6) 86.6 (84.7, 88.3) 99.3 (98.7, 99.6) 97.8 (97.0, 98.3) 80.6 (78.2, 82.8) 98.6 (97.9, 99.1)
Region
Bangkok 99.1 (98.6, 99.4) 81.2 (79.1, 83.2) 78.9 (76.6, 81.0) 98.7 (98.1, 99.1) 94.2 (93.1, 95.2) 66.7 (64.1, 69.2) 96.6 (95.7, 97.3)
Central 95.6 (93.8, 96.9) 80.4 (77.7, 82.8) 75.3 (72.4, 78.1) 97.8 (96.9, 98.4) 90.8 (89.1, 92.3) 63.3 (60.2, 66.4) 94.0 (92.6, 95.2)
Northern 96.8 (95.7, 97.7) 78.4 (74.5, 81.9) 74.5 (70.6, 78.1) 98.7 (98.1, 99.1) 91.0 (88.1, 93.2) 63.1 (58.4, 67.5) 94.4 (92.7, 95.7)
Northeastern 98.2 (97.1, 98.8) 85.3 (83.4, 87.1) 82.3 (80.2, 84.3) 98.2 (97.3, 98.8) 94.6 (93.2, 95.7) 70.2 (67.0, 73.2) 91.6 (89.9, 93.0)
Southern 97.0 (95.4, 98.0) 82.7 (79.3, 85.6) 77.8 (73.9, 81.2) 97.4 (95.6, 98.5) 92.2 (90.1, 93.8) 66.6 (61.8, 71.1) 92.1 (89.6, 94.0)
Socioeconomic status
Lowest 96.0 (94.8, 96.9) 78.6 (76.4, 80.7) 74.7 (72.2, 77.0) 96.3 (95.2, 97.2) 89.7 (88.0, 91.2) 59.5 (56.7, 62.2) 89.1 (87.3, 90.7)
Low 97.2 (96.3, 97.9) 80.4 (77.8, 82.7) 75.4 (72.7, 77.9) 98.3 (97.6, 98.8) 91.0 (89.2, 92.6) 62.5 (59.4, 65.4) 92.3 (90.9, 93.5)
Middle 97.7 (96.5, 98.5) 83.6 (81.4, 85.7) 80.1 (77.7, 82.3) 99.0 (98.3, 99.4) 92.9 (91.3, 94.2) 68.2 (65.4, 70.9) 93.9 (92.5, 95.0)
High 98.4 (97.3, 99.0) 83.7 (81.7, 85.4) 80.5 (78.1, 82.7) 99.1 (98.7, 99.4) 95.4 (94.4, 96.3) 71.1 (68.5, 73.6) 96.6 (95.6, 97.3)
Highest 97.6 (96.4, 98.4) 85.9 (84.1, 87.6) 82.6 (80.6, 84.5) 98.9 (98.1, 99.3) 96.0 (94.8, 96.9) 74.8 (72.3, 77.1) 97.3 (96.4, 98.0)
Global Adult Tobacco Survey : Thailand Report, 2011 9-7
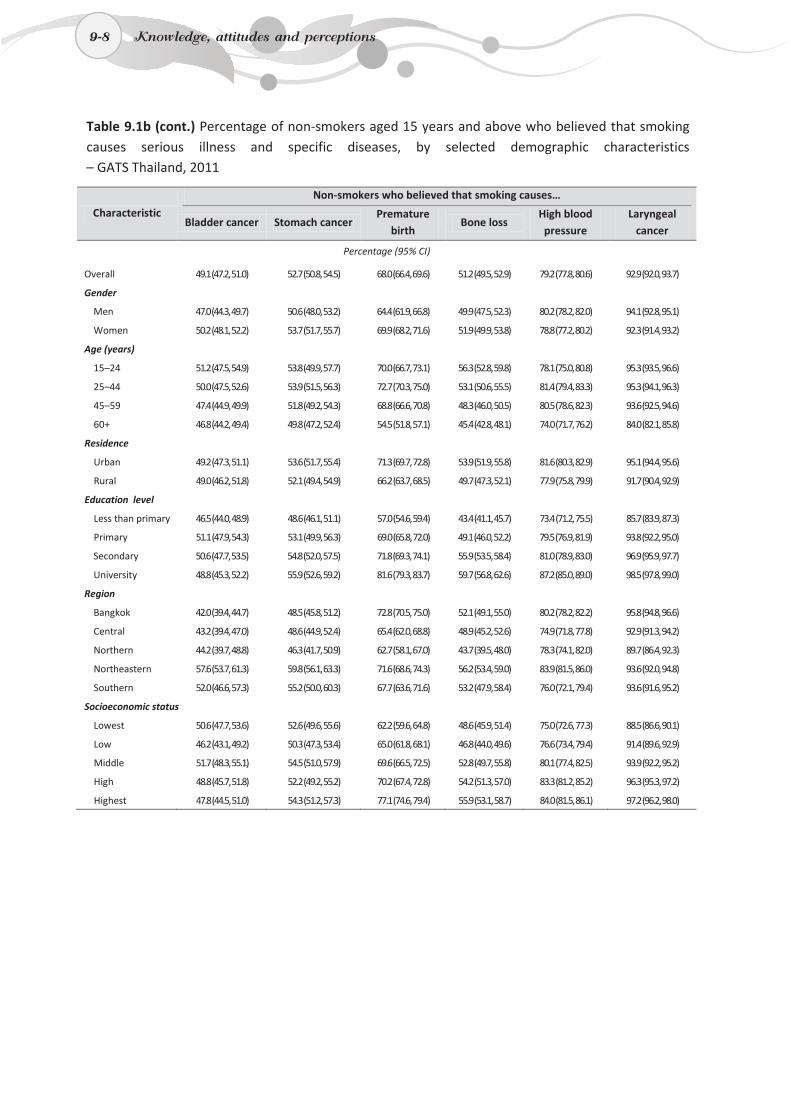
9-8
Table 9.1b (cont.) Percentage of non-smokers aged 15 years and above who believed that smoking causes serious illness and specific diseases, by selected demographic characteristics – GATS Thailand, 2011
Characteristic
Non-smokers who believed that smoking causes…
Bladder cancer Stomach cancer Premature
birth Bone loss
High blood pressure
Laryngeal cancer
Percentage (95% CI)
Overall 49.1 (47.2, 51.0) 52.7 (50.8, 54.5) 68.0 (66.4, 69.6) 51.2 (49.5, 52.9) 79.2 (77.8, 80.6) 92.9 (92.0, 93.7)
Gender
Men 47.0 (44.3, 49.7) 50.6 (48.0, 53.2) 64.4 (61.9, 66.8) 49.9 (47.5, 52.3) 80.2 (78.2, 82.0) 94.1 (92.8, 95.1)
Women 50.2 (48.1, 52.2) 53.7 (51.7, 55.7) 69.9 (68.2, 71.6) 51.9 (49.9, 53.8) 78.8 (77.2, 80.2) 92.3 (91.4, 93.2)
Age (years)
15–24 51.2 (47.5, 54.9) 53.8 (49.9, 57.7) 70.0 (66.7, 73.1) 56.3 (52.8, 59.8) 78.1 (75.0, 80.8) 95.3 (93.5, 96.6)
25–44 50.0 (47.5, 52.6) 53.9 (51.5, 56.3) 72.7 (70.3, 75.0) 53.1 (50.6, 55.5) 81.4 (79.4, 83.3) 95.3 (94.1, 96.3)
45–59 47.4 (44.9, 49.9) 51.8 (49.2, 54.3) 68.8 (66.6, 70.8) 48.3 (46.0, 50.5) 80.5 (78.6, 82.3) 93.6 (92.5, 94.6)
60+ 46.8 (44.2, 49.4) 49.8 (47.2, 52.4) 54.5 (51.8, 57.1) 45.4 (42.8, 48.1) 74.0 (71.7, 76.2) 84.0 (82.1, 85.8)
Residence
Urban 49.2 (47.3, 51.1) 53.6 (51.7, 55.4) 71.3 (69.7, 72.8) 53.9 (51.9, 55.8) 81.6 (80.3, 82.9) 95.1 (94.4, 95.6)
Rural 49.0 (46.2, 51.8) 52.1 (49.4, 54.9) 66.2 (63.7, 68.5) 49.7 (47.3, 52.1) 77.9 (75.8, 79.9) 91.7 (90.4, 92.9)
Education level
Less than primary 46.5 (44.0, 48.9) 48.6 (46.1, 51.1) 57.0 (54.6, 59.4) 43.4 (41.1, 45.7) 73.4 (71.2, 75.5) 85.7 (83.9, 87.3)
Primary 51.1 (47.9, 54.3) 53.1 (49.9, 56.3) 69.0 (65.8, 72.0) 49.1 (46.0, 52.2) 79.5 (76.9, 81.9) 93.8 (92.2, 95.0)
Secondary 50.6 (47.7, 53.5) 54.8 (52.0, 57.5) 71.8 (69.3, 74.1) 55.9 (53.5, 58.4) 81.0 (78.9, 83.0) 96.9 (95.9, 97.7)
University 48.8 (45.3, 52.2) 55.9 (52.6, 59.2) 81.6 (79.3, 83.7) 59.7 (56.8, 62.6) 87.2 (85.0, 89.0) 98.5 (97.8, 99.0)
Region
Bangkok 42.0 (39.4, 44.7) 48.5 (45.8, 51.2) 72.8 (70.5, 75.0) 52.1 (49.1, 55.0) 80.2 (78.2, 82.2) 95.8 (94.8, 96.6)
Central 43.2 (39.4, 47.0) 48.6 (44.9, 52.4) 65.4 (62.0, 68.8) 48.9 (45.2, 52.6) 74.9 (71.8, 77.8) 92.9 (91.3, 94.2)
Northern 44.2 (39.7, 48.8) 46.3 (41.7, 50.9) 62.7 (58.1, 67.0) 43.7 (39.5, 48.0) 78.3 (74.1, 82.0) 89.7 (86.4, 92.3)
Northeastern 57.6 (53.7, 61.3) 59.8 (56.1, 63.3) 71.6 (68.6, 74.3) 56.2 (53.4, 59.0) 83.9 (81.5, 86.0) 93.6 (92.0, 94.8)
Southern 52.0 (46.6, 57.3) 55.2 (50.0, 60.3) 67.7 (63.6, 71.6) 53.2 (47.9, 58.4) 76.0 (72.1, 79.4) 93.6 (91.6, 95.2)
Socioeconomic status
Lowest 50.6 (47.7, 53.6) 52.6 (49.6, 55.6) 62.2 (59.6, 64.8) 48.6 (45.9, 51.4) 75.0 (72.6, 77.3) 88.5 (86.6, 90.1)
Low 46.2 (43.1, 49.2) 50.3 (47.3, 53.4) 65.0 (61.8, 68.1) 46.8 (44.0, 49.6) 76.6 (73.4, 79.4) 91.4 (89.6, 92.9)
Middle 51.7 (48.3, 55.1) 54.5 (51.0, 57.9) 69.6 (66.5, 72.5) 52.8 (49.7, 55.8) 80.1 (77.4, 82.5) 93.9 (92.2, 95.2)
High 48.8 (45.7, 51.8) 52.2 (49.2, 55.2) 70.2 (67.4, 72.8) 54.2 (51.3, 57.0) 83.3 (81.2, 85.2) 96.3 (95.3, 97.2)
Highest 47.8 (44.5, 51.0) 54.3 (51.2, 57.3) 77.1 (74.6, 79.4) 55.9 (53.1, 58.7) 84.0 (81.5, 86.1) 97.2 (96.2, 98.0)
9-8 Knowledge, attitudes and perceptions
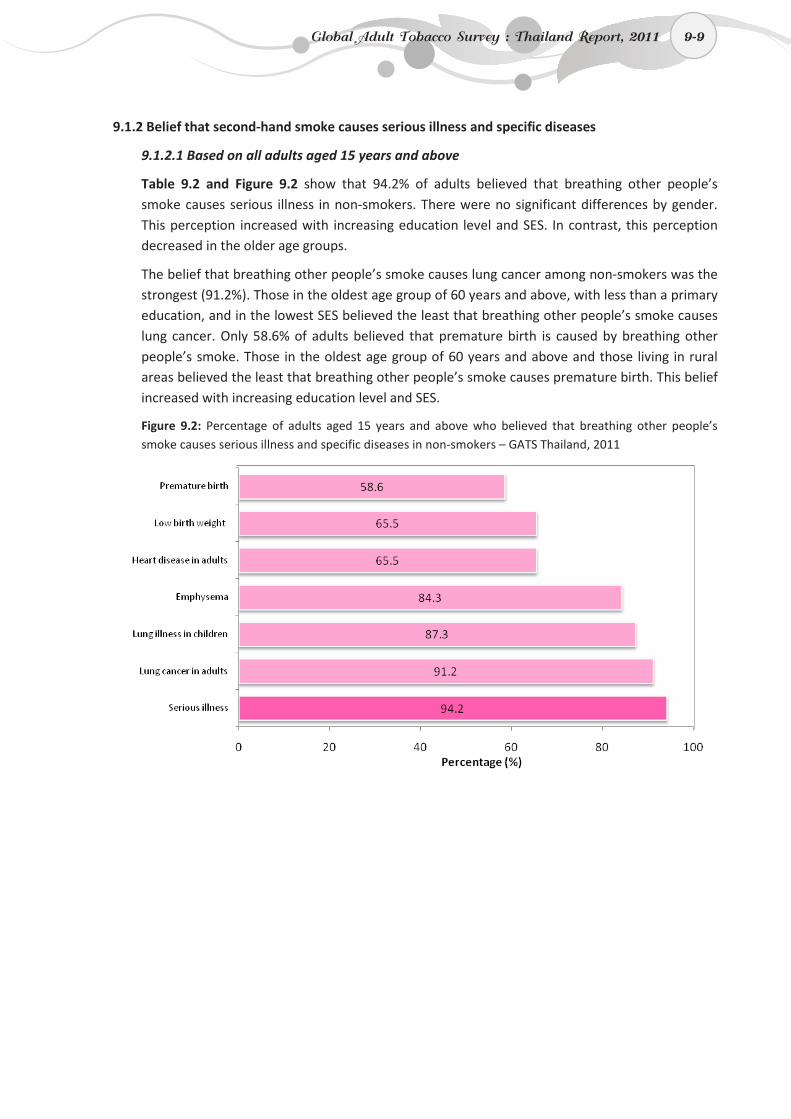
9-9
9.1.2 Belief that second-hand smoke causes serious illness and specific diseases
9.1.2.1 Based on all adults aged 15 years and above
Table 9.2 and Figure 9.2 show that 94.2% of adults believed that breathing other people’s smoke causes serious illness in non-smokers. There were no significant differences by gender. This perception increased with increasing education level and SES. In contrast, this perception decreased in the older age groups.
The belief that breathing other people’s smoke causes lung cancer among non-smokers was the strongest (91.2%). Those in the oldest age group of 60 years and above, with less than a primary education, and in the lowest SES believed the least that breathing other people’s smoke causes lung cancer. Only 58.6% of adults believed that premature birth is caused by breathing other people’s smoke. Those in the oldest age group of 60 years and above and those living in rural areas believed the least that breathing other people’s smoke causes premature birth. This belief increased with increasing education level and SES.
Figure 9.2: Percentage of adults aged 15 years and above who believed that breathing other people’s smoke causes serious illness and specific diseases in non-smokers – GATS Thailand, 2011
Global Adult Tobacco Survey : Thailand Report, 2011 9-9
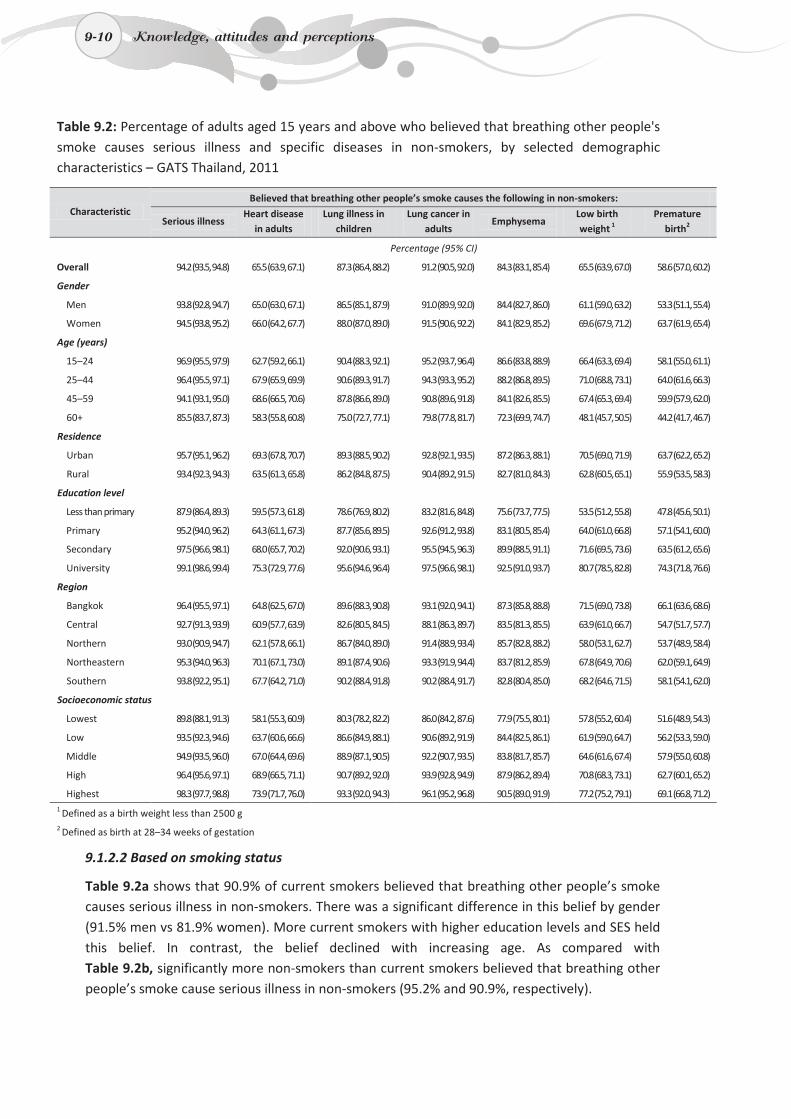
9-10
Table 9.2: Percentage of adults aged 15 years and above who believed that breathing other people's smoke causes serious illness and specific diseases in non-smokers, by selected demographic characteristics – GATS Thailand, 2011
Characteristic Believed that breathing other people’s smoke causes the following in non-smokers:
Serious illness Heart disease
in adults Lung illness in
children Lung cancer in
adults Emphysema
Low birth weight 1
Premature birth2
Percentage (95% CI)
Overall 94.2 (93.5, 94.8) 65.5 (63.9, 67.1) 87.3 (86.4, 88.2) 91.2 (90.5, 92.0) 84.3 (83.1, 85.4) 65.5 (63.9, 67.0) 58.6 (57.0, 60.2)
Gender
Men 93.8 (92.8, 94.7) 65.0 (63.0, 67.1) 86.5 (85.1, 87.9) 91.0 (89.9, 92.0) 84.4 (82.7, 86.0) 61.1 (59.0, 63.2) 53.3 (51.1, 55.4)
Women 94.5 (93.8, 95.2) 66.0 (64.2, 67.7) 88.0 (87.0, 89.0) 91.5 (90.6, 92.2) 84.1 (82.9, 85.2) 69.6 (67.9, 71.2) 63.7 (61.9, 65.4)
Age (years)
15–24 96.9 (95.5, 97.9) 62.7 (59.2, 66.1) 90.4 (88.3, 92.1) 95.2 (93.7, 96.4) 86.6 (83.8, 88.9) 66.4 (63.3, 69.4) 58.1 (55.0, 61.1)
25–44 96.4 (95.5, 97.1) 67.9 (65.9, 69.9) 90.6 (89.3, 91.7) 94.3 (93.3, 95.2) 88.2 (86.8, 89.5) 71.0 (68.8, 73.1) 64.0 (61.6, 66.3)
45–59 94.1 (93.1, 95.0) 68.6 (66.5, 70.6) 87.8 (86.6, 89.0) 90.8 (89.6, 91.8) 84.1 (82.6, 85.5) 67.4 (65.3, 69.4) 59.9 (57.9, 62.0)
60+ 85.5 (83.7, 87.3) 58.3 (55.8, 60.8) 75.0 (72.7, 77.1) 79.8 (77.8, 81.7) 72.3 (69.9, 74.7) 48.1 (45.7, 50.5) 44.2 (41.7, 46.7)
Residence
Urban 95.7 (95.1, 96.2) 69.3 (67.8, 70.7) 89.3 (88.5, 90.2) 92.8 (92.1, 93.5) 87.2 (86.3, 88.1) 70.5 (69.0, 71.9) 63.7 (62.2, 65.2)
Rural 93.4 (92.3, 94.3) 63.5 (61.3, 65.8) 86.2 (84.8, 87.5) 90.4 (89.2, 91.5) 82.7 (81.0, 84.3) 62.8 (60.5, 65.1) 55.9 (53.5, 58.3)
Education level
Less than primary 87.9 (86.4, 89.3) 59.5 (57.3, 61.8) 78.6 (76.9, 80.2) 83.2 (81.6, 84.8) 75.6 (73.7, 77.5) 53.5 (51.2, 55.8) 47.8 (45.6, 50.1)
Primary 95.2 (94.0, 96.2) 64.3 (61.1, 67.3) 87.7 (85.6, 89.5) 92.6 (91.2, 93.8) 83.1 (80.5, 85.4) 64.0 (61.0, 66.8) 57.1 (54.1, 60.0)
Secondary 97.5 (96.6, 98.1) 68.0 (65.7, 70.2) 92.0 (90.6, 93.1) 95.5 (94.5, 96.3) 89.9 (88.5, 91.1) 71.6 (69.5, 73.6) 63.5 (61.2, 65.6)
University 99.1 (98.6, 99.4) 75.3 (72.9, 77.6) 95.6 (94.6, 96.4) 97.5 (96.6, 98.1) 92.5 (91.0, 93.7) 80.7 (78.5, 82.8) 74.3 (71.8, 76.6)
Region
Bangkok 96.4 (95.5, 97.1) 64.8 (62.5, 67.0) 89.6 (88.3, 90.8) 93.1 (92.0, 94.1) 87.3 (85.8, 88.8) 71.5 (69.0, 73.8) 66.1 (63.6, 68.6)
Central 92.7 (91.3, 93.9) 60.9 (57.7, 63.9) 82.6 (80.5, 84.5) 88.1 (86.3, 89.7) 83.5 (81.3, 85.5) 63.9 (61.0, 66.7) 54.7 (51.7, 57.7)
Northern 93.0 (90.9, 94.7) 62.1 (57.8, 66.1) 86.7 (84.0, 89.0) 91.4 (88.9, 93.4) 85.7 (82.8, 88.2) 58.0 (53.1, 62.7) 53.7 (48.9, 58.4)
Northeastern 95.3 (94.0, 96.3) 70.1 (67.1, 73.0) 89.1 (87.4, 90.6) 93.3 (91.9, 94.4) 83.7 (81.2, 85.9) 67.8 (64.9, 70.6) 62.0 (59.1, 64.9)
Southern 93.8 (92.2, 95.1) 67.7 (64.2, 71.0) 90.2 (88.4, 91.8) 90.2 (88.4, 91.7) 82.8 (80.4, 85.0) 68.2 (64.6, 71.5) 58.1 (54.1, 62.0)
Socioeconomic status
Lowest 89.8 (88.1, 91.3) 58.1 (55.3, 60.9) 80.3 (78.2, 82.2) 86.0 (84.2, 87.6) 77.9 (75.5, 80.1) 57.8 (55.2, 60.4) 51.6 (48.9, 54.3)
Low 93.5 (92.3, 94.6) 63.7 (60.6, 66.6) 86.6 (84.9, 88.1) 90.6 (89.2, 91.9) 84.4 (82.5, 86.1) 61.9 (59.0, 64.7) 56.2 (53.3, 59.0)
Middle 94.9 (93.5, 96.0) 67.0 (64.4, 69.6) 88.9 (87.1, 90.5) 92.2 (90.7, 93.5) 83.8 (81.7, 85.7) 64.6 (61.6, 67.4) 57.9 (55.0, 60.8)
High 96.4 (95.6, 97.1) 68.9 (66.5, 71.1) 90.7 (89.2, 92.0) 93.9 (92.8, 94.9) 87.9 (86.2, 89.4) 70.8 (68.3, 73.1) 62.7 (60.1, 65.2)
Highest 98.3 (97.7, 98.8) 73.9 (71.7, 76.0) 93.3 (92.0, 94.3) 96.1 (95.2, 96.8) 90.5 (89.0, 91.9) 77.2 (75.2, 79.1) 69.1 (66.8, 71.2) 1 Defined as a birth weight less than 2500 g 2 Defined as birth at 28–34 weeks of gestation
9.1.2.2 Based on smoking status
Table 9.2a shows that 90.9% of current smokers believed that breathing other people’s smoke causes serious illness in non-smokers. There was a significant difference in this belief by gender (91.5% men vs 81.9% women). More current smokers with higher education levels and SES held this belief. In contrast, the belief declined with increasing age. As compared with Table 9.2b, significantly more non-smokers than current smokers believed that breathing other people’s smoke cause serious illness in non-smokers (95.2% and 90.9%, respectively).
9-10 Knowledge, attitudes and perceptions
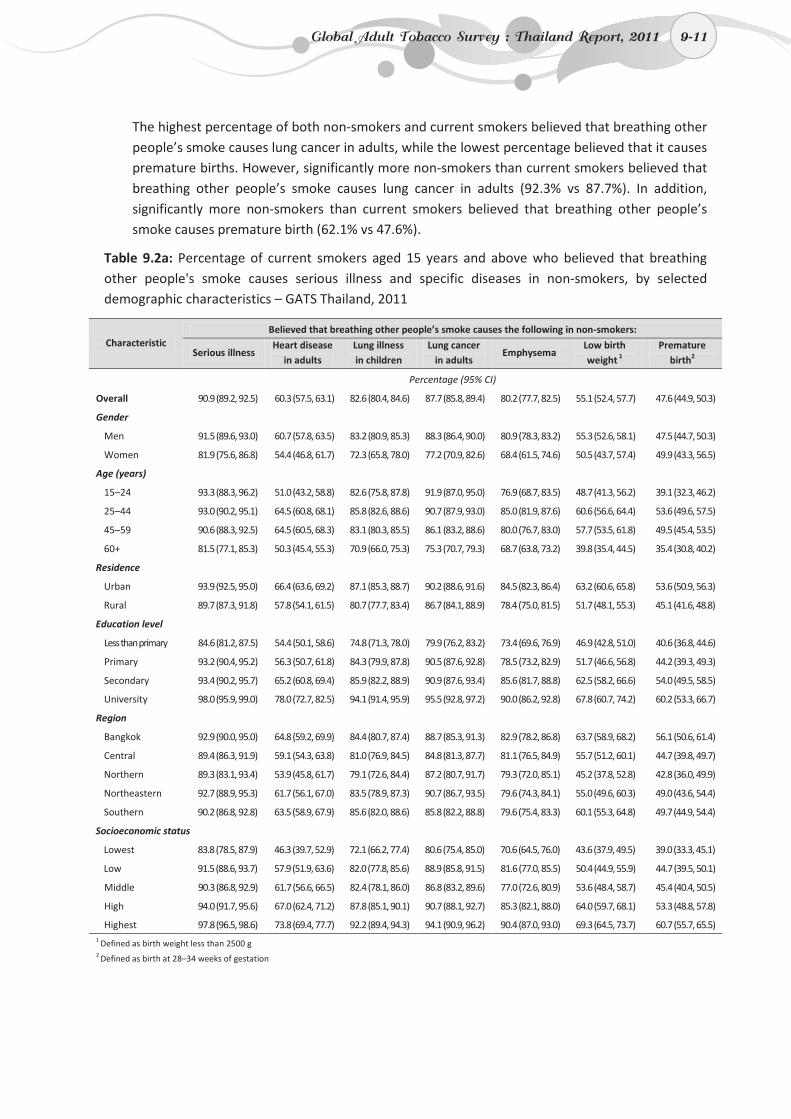
9-11
The highest percentage of both non-smokers and current smokers believed that breathing other people’s smoke causes lung cancer in adults, while the lowest percentage believed that it causes premature births. However, significantly more non-smokers than current smokers believed that breathing other people’s smoke causes lung cancer in adults (92.3% vs 87.7%). In addition, significantly more non-smokers than current smokers believed that breathing other people’s smoke causes premature birth (62.1% vs 47.6%).
Table 9.2a: Percentage of current smokers aged 15 years and above who believed that breathing other people's smoke causes serious illness and specific diseases in non-smokers, by selected demographic characteristics – GATS Thailand, 2011
Characteristic Believed that breathing other people’s smoke causes the following in non-smokers:
Serious illness Heart disease
in adults Lung illness in children
Lung cancer in adults
Emphysema Low birth weight 1
Premature birth2
Percentage (95% CI)
Overall 90.9 (89.2, 92.5) 60.3 (57.5, 63.1) 82.6 (80.4, 84.6) 87.7 (85.8, 89.4) 80.2 (77.7, 82.5) 55.1 (52.4, 57.7) 47.6 (44.9, 50.3)
Gender
Men 91.5 (89.6, 93.0) 60.7 (57.8, 63.5) 83.2 (80.9, 85.3) 88.3 (86.4, 90.0) 80.9 (78.3, 83.2) 55.3 (52.6, 58.1) 47.5 (44.7, 50.3)
Women 81.9 (75.6, 86.8) 54.4 (46.8, 61.7) 72.3 (65.8, 78.0) 77.2 (70.9, 82.6) 68.4 (61.5, 74.6) 50.5 (43.7, 57.4) 49.9 (43.3, 56.5)
Age (years)
15–24 93.3 (88.3, 96.2) 51.0 (43.2, 58.8) 82.6 (75.8, 87.8) 91.9 (87.0, 95.0) 76.9 (68.7, 83.5) 48.7 (41.3, 56.2) 39.1 (32.3, 46.2)
25–44 93.0 (90.2, 95.1) 64.5 (60.8, 68.1) 85.8 (82.6, 88.6) 90.7 (87.9, 93.0) 85.0 (81.9, 87.6) 60.6 (56.6, 64.4) 53.6 (49.6, 57.5)
45–59 90.6 (88.3, 92.5) 64.5 (60.5, 68.3) 83.1 (80.3, 85.5) 86.1 (83.2, 88.6) 80.0 (76.7, 83.0) 57.7 (53.5, 61.8) 49.5 (45.4, 53.5)
60+ 81.5 (77.1, 85.3) 50.3 (45.4, 55.3) 70.9 (66.0, 75.3) 75.3 (70.7, 79.3) 68.7 (63.8, 73.2) 39.8 (35.4, 44.5) 35.4 (30.8, 40.2)
Residence
Urban 93.9 (92.5, 95.0) 66.4 (63.6, 69.2) 87.1 (85.3, 88.7) 90.2 (88.6, 91.6) 84.5 (82.3, 86.4) 63.2 (60.6, 65.8) 53.6 (50.9, 56.3)
Rural 89.7 (87.3, 91.8) 57.8 (54.1, 61.5) 80.7 (77.7, 83.4) 86.7 (84.1, 88.9) 78.4 (75.0, 81.5) 51.7 (48.1, 55.3) 45.1 (41.6, 48.8)
Education level
Less than primary 84.6 (81.2, 87.5) 54.4 (50.1, 58.6) 74.8 (71.3, 78.0) 79.9 (76.2, 83.2) 73.4 (69.6, 76.9) 46.9 (42.8, 51.0) 40.6 (36.8, 44.6)
Primary 93.2 (90.4, 95.2) 56.3 (50.7, 61.8) 84.3 (79.9, 87.8) 90.5 (87.6, 92.8) 78.5 (73.2, 82.9) 51.7 (46.6, 56.8) 44.2 (39.3, 49.3)
Secondary 93.4 (90.2, 95.7) 65.2 (60.8, 69.4) 85.9 (82.2, 88.9) 90.9 (87.6, 93.4) 85.6 (81.7, 88.8) 62.5 (58.2, 66.6) 54.0 (49.5, 58.5)
University 98.0 (95.9, 99.0) 78.0 (72.7, 82.5) 94.1 (91.4, 95.9) 95.5 (92.8, 97.2) 90.0 (86.2, 92.8) 67.8 (60.7, 74.2) 60.2 (53.3, 66.7)
Region
Bangkok 92.9 (90.0, 95.0) 64.8 (59.2, 69.9) 84.4 (80.7, 87.4) 88.7 (85.3, 91.3) 82.9 (78.2, 86.8) 63.7 (58.9, 68.2) 56.1 (50.6, 61.4)
Central 89.4 (86.3, 91.9) 59.1 (54.3, 63.8) 81.0 (76.9, 84.5) 84.8 (81.3, 87.7) 81.1 (76.5, 84.9) 55.7 (51.2, 60.1) 44.7 (39.8, 49.7)
Northern 89.3 (83.1, 93.4) 53.9 (45.8, 61.7) 79.1 (72.6, 84.4) 87.2 (80.7, 91.7) 79.3 (72.0, 85.1) 45.2 (37.8, 52.8) 42.8 (36.0, 49.9)
Northeastern 92.7 (88.9, 95.3) 61.7 (56.1, 67.0) 83.5 (78.9, 87.3) 90.7 (86.7, 93.5) 79.6 (74.3, 84.1) 55.0 (49.6, 60.3) 49.0 (43.6, 54.4)
Southern 90.2 (86.8, 92.8) 63.5 (58.9, 67.9) 85.6 (82.0, 88.6) 85.8 (82.2, 88.8) 79.6 (75.4, 83.3) 60.1 (55.3, 64.8) 49.7 (44.9, 54.4)
Socioeconomic status
Lowest 83.8 (78.5, 87.9) 46.3 (39.7, 52.9) 72.1 (66.2, 77.4) 80.6 (75.4, 85.0) 70.6 (64.5, 76.0) 43.6 (37.9, 49.5) 39.0 (33.3, 45.1)
Low 91.5 (88.6, 93.7) 57.9 (51.9, 63.6) 82.0 (77.8, 85.6) 88.9 (85.8, 91.5) 81.6 (77.0, 85.5) 50.4 (44.9, 55.9) 44.7 (39.5, 50.1)
Middle 90.3 (86.8, 92.9) 61.7 (56.6, 66.5) 82.4 (78.1, 86.0) 86.8 (83.2, 89.6) 77.0 (72.6, 80.9) 53.6 (48.4, 58.7) 45.4 (40.4, 50.5)
High 94.0 (91.7, 95.6) 67.0 (62.4, 71.2) 87.8 (85.1, 90.1) 90.7 (88.1, 92.7) 85.3 (82.1, 88.0) 64.0 (59.7, 68.1) 53.3 (48.8, 57.8)
Highest 97.8 (96.5, 98.6) 73.8 (69.4, 77.7) 92.2 (89.4, 94.3) 94.1 (90.9, 96.2) 90.4 (87.0, 93.0) 69.3 (64.5, 73.7) 60.7 (55.7, 65.5) 1 Defined as birth weight less than 2500 g 2 Defined as birth at 28–34 weeks of gestation
Global Adult Tobacco Survey : Thailand Report, 2011 9-11
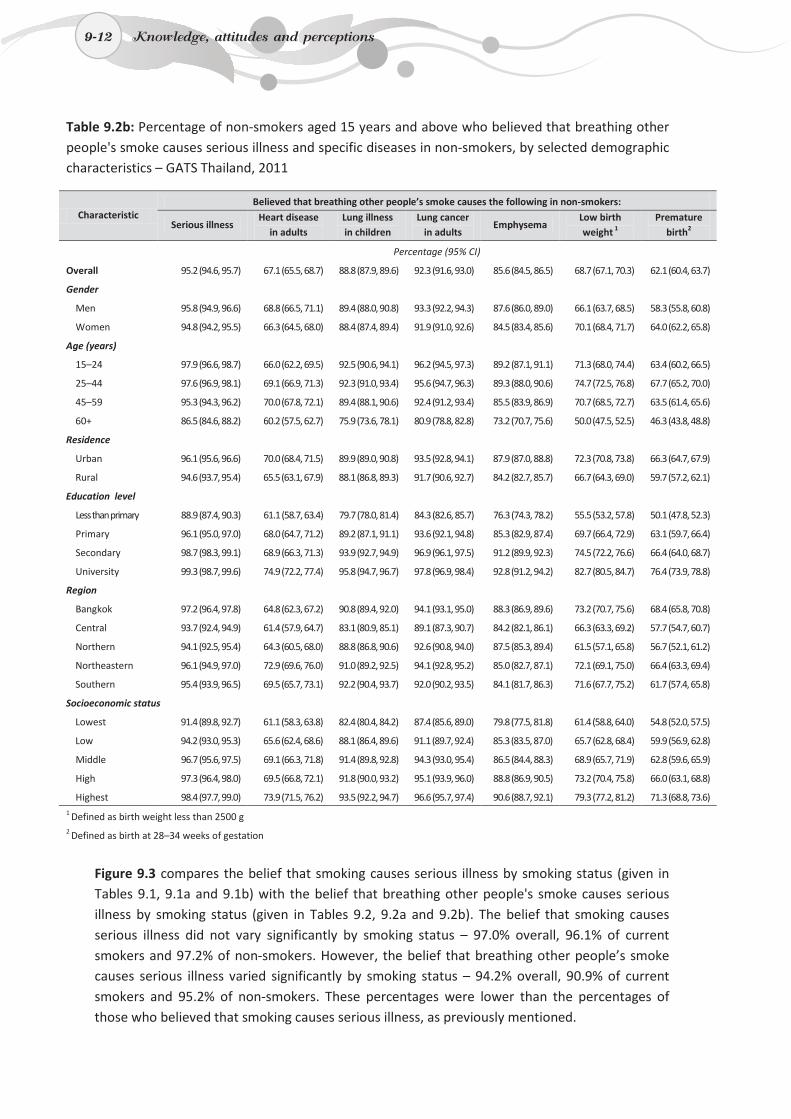
9-12
Table 9.2b: Percentage of non-smokers aged 15 years and above who believed that breathing other people's smoke causes serious illness and specific diseases in non-smokers, by selected demographic characteristics – GATS Thailand, 2011
Characteristic Believed that breathing other people’s smoke causes the following in non-smokers:
Serious illness Heart disease
in adults Lung illness in children
Lung cancer in adults
Emphysema Low birth weight 1
Premature birth2
Percentage (95% CI)
Overall 95.2 (94.6, 95.7) 67.1 (65.5, 68.7) 88.8 (87.9, 89.6) 92.3 (91.6, 93.0) 85.6 (84.5, 86.5) 68.7 (67.1, 70.3) 62.1 (60.4, 63.7)
Gender
Men 95.8 (94.9, 96.6) 68.8 (66.5, 71.1) 89.4 (88.0, 90.8) 93.3 (92.2, 94.3) 87.6 (86.0, 89.0) 66.1 (63.7, 68.5) 58.3 (55.8, 60.8)
Women 94.8 (94.2, 95.5) 66.3 (64.5, 68.0) 88.4 (87.4, 89.4) 91.9 (91.0, 92.6) 84.5 (83.4, 85.6) 70.1 (68.4, 71.7) 64.0 (62.2, 65.8)
Age (years)
15–24 97.9 (96.6, 98.7) 66.0 (62.2, 69.5) 92.5 (90.6, 94.1) 96.2 (94.5, 97.3) 89.2 (87.1, 91.1) 71.3 (68.0, 74.4) 63.4 (60.2, 66.5)
25–44 97.6 (96.9, 98.1) 69.1 (66.9, 71.3) 92.3 (91.0, 93.4) 95.6 (94.7, 96.3) 89.3 (88.0, 90.6) 74.7 (72.5, 76.8) 67.7 (65.2, 70.0)
45–59 95.3 (94.3, 96.2) 70.0 (67.8, 72.1) 89.4 (88.1, 90.6) 92.4 (91.2, 93.4) 85.5 (83.9, 86.9) 70.7 (68.5, 72.7) 63.5 (61.4, 65.6)
60+ 86.5 (84.6, 88.2) 60.2 (57.5, 62.7) 75.9 (73.6, 78.1) 80.9 (78.8, 82.8) 73.2 (70.7, 75.6) 50.0 (47.5, 52.5) 46.3 (43.8, 48.8)
Residence
Urban 96.1 (95.6, 96.6) 70.0 (68.4, 71.5) 89.9 (89.0, 90.8) 93.5 (92.8, 94.1) 87.9 (87.0, 88.8) 72.3 (70.8, 73.8) 66.3 (64.7, 67.9)
Rural 94.6 (93.7, 95.4) 65.5 (63.1, 67.9) 88.1 (86.8, 89.3) 91.7 (90.6, 92.7) 84.2 (82.7, 85.7) 66.7 (64.3, 69.0) 59.7 (57.2, 62.1)
Education level
Less than primary 88.9 (87.4, 90.3) 61.1 (58.7, 63.4) 79.7 (78.0, 81.4) 84.3 (82.6, 85.7) 76.3 (74.3, 78.2) 55.5 (53.2, 57.8) 50.1 (47.8, 52.3)
Primary 96.1 (95.0, 97.0) 68.0 (64.7, 71.2) 89.2 (87.1, 91.1) 93.6 (92.1, 94.8) 85.3 (82.9, 87.4) 69.7 (66.4, 72.9) 63.1 (59.7, 66.4)
Secondary 98.7 (98.3, 99.1) 68.9 (66.3, 71.3) 93.9 (92.7, 94.9) 96.9 (96.1, 97.5) 91.2 (89.9, 92.3) 74.5 (72.2, 76.6) 66.4 (64.0, 68.7)
University 99.3 (98.7, 99.6) 74.9 (72.2, 77.4) 95.8 (94.7, 96.7) 97.8 (96.9, 98.4) 92.8 (91.2, 94.2) 82.7 (80.5, 84.7) 76.4 (73.9, 78.8)
Region
Bangkok 97.2 (96.4, 97.8) 64.8 (62.3, 67.2) 90.8 (89.4, 92.0) 94.1 (93.1, 95.0) 88.3 (86.9, 89.6) 73.2 (70.7, 75.6) 68.4 (65.8, 70.8)
Central 93.7 (92.4, 94.9) 61.4 (57.9, 64.7) 83.1 (80.9, 85.1) 89.1 (87.3, 90.7) 84.2 (82.1, 86.1) 66.3 (63.3, 69.2) 57.7 (54.7, 60.7)
Northern 94.1 (92.5, 95.4) 64.3 (60.5, 68.0) 88.8 (86.8, 90.6) 92.6 (90.8, 94.0) 87.5 (85.3, 89.4) 61.5 (57.1, 65.8) 56.7 (52.1, 61.2)
Northeastern 96.1 (94.9, 97.0) 72.9 (69.6, 76.0) 91.0 (89.2, 92.5) 94.1 (92.8, 95.2) 85.0 (82.7, 87.1) 72.1 (69.1, 75.0) 66.4 (63.3, 69.4)
Southern 95.4 (93.9, 96.5) 69.5 (65.7, 73.1) 92.2 (90.4, 93.7) 92.0 (90.2, 93.5) 84.1 (81.7, 86.3) 71.6 (67.7, 75.2) 61.7 (57.4, 65.8)
Socioeconomic status
Lowest 91.4 (89.8, 92.7) 61.1 (58.3, 63.8) 82.4 (80.4, 84.2) 87.4 (85.6, 89.0) 79.8 (77.5, 81.8) 61.4 (58.8, 64.0) 54.8 (52.0, 57.5)
Low 94.2 (93.0, 95.3) 65.6 (62.4, 68.6) 88.1 (86.4, 89.6) 91.1 (89.7, 92.4) 85.3 (83.5, 87.0) 65.7 (62.8, 68.4) 59.9 (56.9, 62.8)
Middle 96.7 (95.6, 97.5) 69.1 (66.3, 71.8) 91.4 (89.8, 92.8) 94.3 (93.0, 95.4) 86.5 (84.4, 88.3) 68.9 (65.7, 71.9) 62.8 (59.6, 65.9)
High 97.3 (96.4, 98.0) 69.5 (66.8, 72.1) 91.8 (90.0, 93.2) 95.1 (93.9, 96.0) 88.8 (86.9, 90.5) 73.2 (70.4, 75.8) 66.0 (63.1, 68.8)
Highest 98.4 (97.7, 99.0) 73.9 (71.5, 76.2) 93.5 (92.2, 94.7) 96.6 (95.7, 97.4) 90.6 (88.7, 92.1) 79.3 (77.2, 81.2) 71.3 (68.8, 73.6) 1 Defined as birth weight less than 2500 g 2 Defined as birth at 28–34 weeks of gestation
Figure 9.3 compares the belief that smoking causes serious illness by smoking status (given in Tables 9.1, 9.1a and 9.1b) with the belief that breathing other people's smoke causes serious illness by smoking status (given in Tables 9.2, 9.2a and 9.2b). The belief that smoking causes serious illness did not vary significantly by smoking status – 97.0% overall, 96.1% of current smokers and 97.2% of non-smokers. However, the belief that breathing other people’s smoke causes serious illness varied significantly by smoking status – 94.2% overall, 90.9% of current smokers and 95.2% of non-smokers. These percentages were lower than the percentages of those who believed that smoking causes serious illness, as previously mentioned.
9-12 Knowledge, attitudes and perceptions
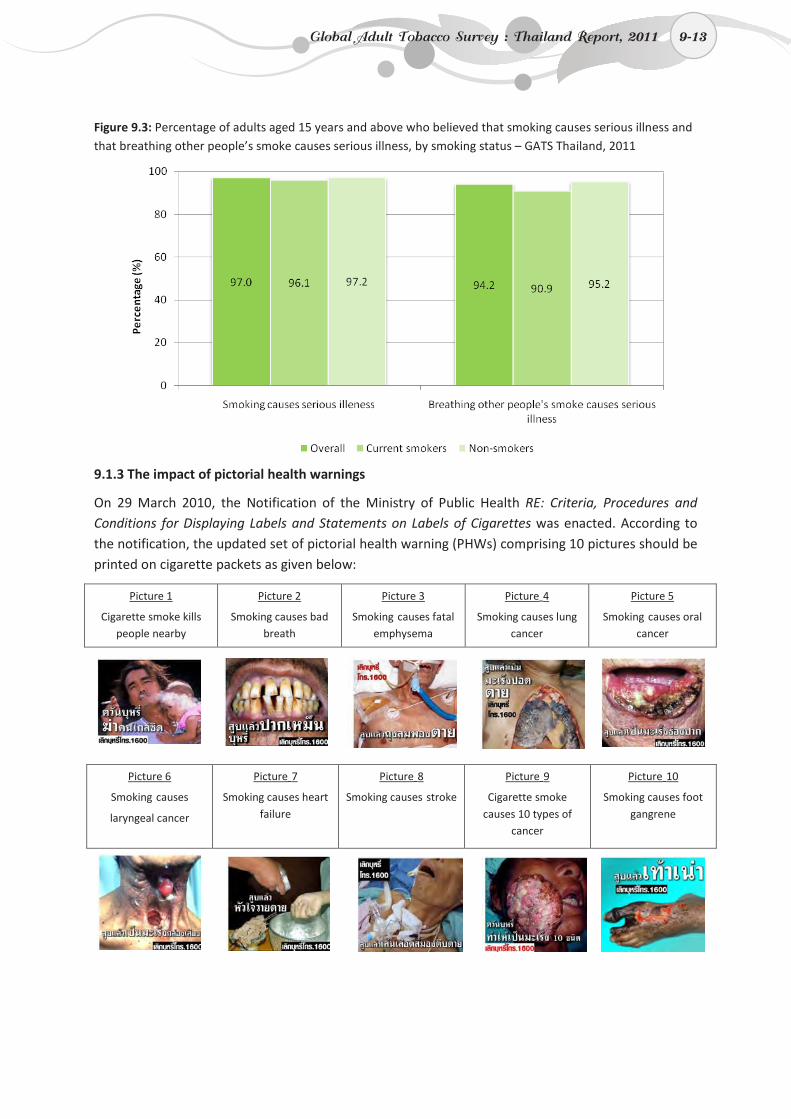
9-13
Figure 9.3: Percentage of adults aged 15 years and above who believed that smoking causes serious illness and that breathing other people’s smoke causes serious illness, by smoking status – GATS Thailand, 2011
9.1.3 The impact of pictorial health warnings
On 29 March 2010, the Notification of the Ministry of Public Health RE: Criteria, Procedures and Conditions for Displaying Labels and Statements on Labels of Cigarettes was enacted. According to the notification, the updated set of pictorial health warning (PHWs) comprising 10 pictures should be printed on cigarette packets as given below:
Picture 1
Cigarette smoke kills people nearby
Picture 2
Smoking causes bad breath
Picture 3
Smoking causes fatal emphysema
Picture 4
Smoking causes lung cancer
Picture 5
Smoking causes oral cancer
Picture 6
Smoking causes
laryngeal cancer
Picture 7
Smoking causes heart failure
Picture 8
Smoking causes stroke
Picture 9
Cigarette smoke causes 10 types of
cancer
Picture 10
Smoking causes foot gangrene
Global Adult Tobacco Survey : Thailand Report, 2011 9-13
9-14
Table 9.3 provides information regarding the impact of PHWs on the desire to quit among current smokers of manufactured cigarettes or cigars among adults aged 15 years and above. According to the 10 PHWs above, the survey found that the three PHWs which had the strongest impact on their desire to quit were: Picture 5 – Smoking causes oral cancer (28.8%), Picture 6 – Smoking causes laryngeal cancer (18.9%), and Picture 4 – Smoking causes lung cancer (18.0%). By demographic characteristics, most current smokers reported that these three PHWs had the strongest influence on their desire to quit.
The three PHWs that had the least impact on the desire to quit were Picture 10 – Smoking causes foot gangrene (1.1%), Picture 2 – Smoking causes bad breath (3.1%), and Picture 3 – Smoking causes fatal emphysema (3.6%). By selected demographic characteristics, all groups of current smokers reported that Picture 10 – Smoking causes foot gangrene had the least impact on the desire to quit.
Table 9.4 shows the impact of PHWs on the intention to continue abstinence from smoking among non-smokers aged 15 years and above. The three PHWs that had the highest influence on continued abstinence among non-smokers were Picture 5 – Smoking causes oral cancer (36.6%), Picture 4 – Smoking causes lung cancer (16.4%), and Picture 6 – Smoking causes laryngeal cancer (15.4%). By demographic characteristics, all groups of non-smokers reported that these three pictures had the greatest influence on their intention to continue abstinence from smoking. It should be noted that current cigarette smokers, cigar smokers and non-smokers all reported that these three PHWs were the most effective in creating a desire to quit among smokers and not wanting to smoke among non-smokers.
Picture 10 – Smoking causes foot gangrene, had the least impact on the desire to quit among all groups of non-smokers (0.5%).
9-14 Knowledge, attitudes and perceptions
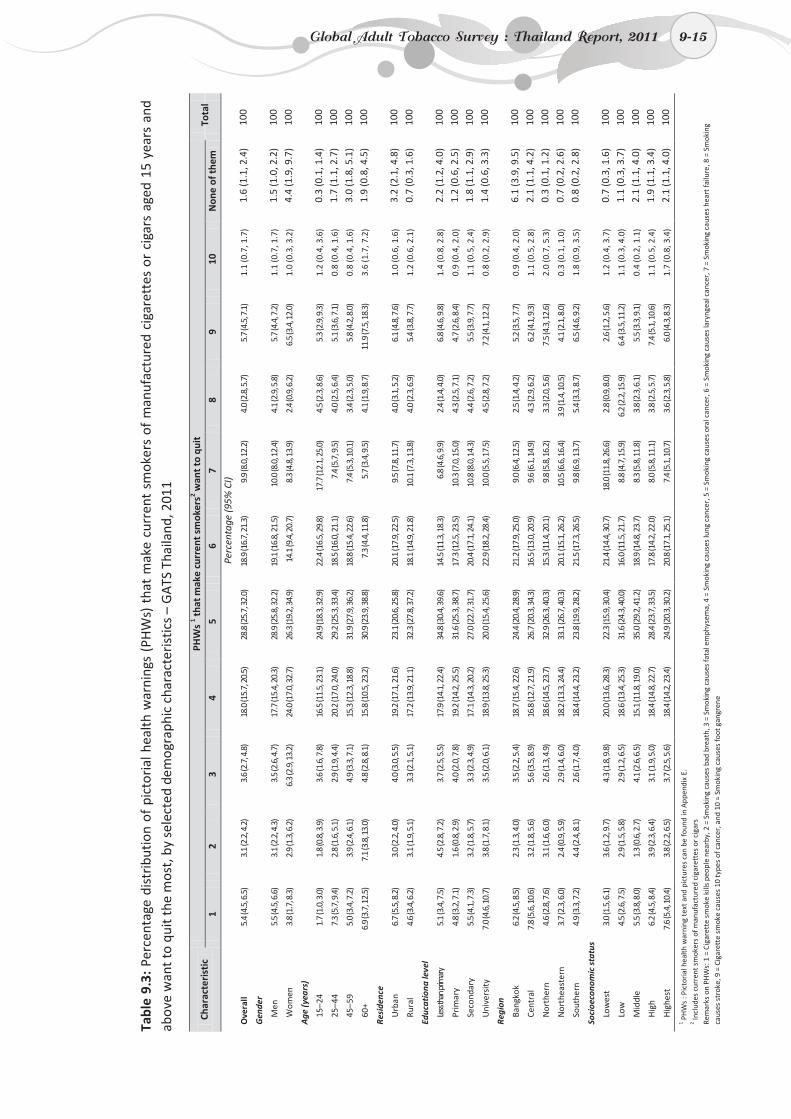
9-15
Ta
ble
9.3:
Per
cent
age
dist
ribut
ion
of p
icto
rial
hea
lth w
arni
ngs
(PH
Ws)
tha
t m
ake
curr
ent
smok
ers
of m
anuf
actu
red
ciga
rett
es o
r ci
gars
age
d 15
yea
rs a
nd
abov
e w
ant t
o qu
it th
e m
ost,
by
sele
cted
dem
ogra
phic
cha
ract
eris
tics
– G
ATS
Tha
iland
, 201
1
Char
acte
rist
ic
PHW
s 1 th
at m
ake
curr
ent s
mok
ers2 w
ant t
o qu
it
1 2
3 4
5 6
7 8
9 10
N
one
of th
em
Pe
rcen
tage
(95%
CI)
Ove
rall
5.4
(4.5
, 6.5
) 3.
1 (2
.2, 4
.2)
3.6
(2.7
, 4.8
) 18
.0 (1
5.7,
20.
5)
28.8
(25.
7, 3
2.0)
18
.9 (1
6.7,
21.
3)
9.9
(8.0
, 12.
2)
4.0
(2.8
, 5.7
) 5.
7 (4
.5, 7
.1)
1.1
(0.7
, 1.7
) 1.
6 (1
.1, 2
.4)
100
Gen
der
Men
5.
5 (4
.5, 6
.6)
3.1
(2.2
, 4.3
) 3.
5 (2
.6, 4
.7)
17.7
(15.
4, 2
0.3)
28
.9 (2
5.8,
32.
2)
19.1
(16.
8, 2
1.5)
10
.0 (8
.0, 1
2.4)
4.
1 (2
.9, 5
.8)
5.7
(4.4
, 7.2
) 1.
1 (0
.7, 1
.7)
1.5
(1.0
, 2.2
) 10
0
Wom
en
3.8
(1.7
, 8.3
) 2.
9 (1
.3, 6
.2)
6.3
(2.9
, 13.
2)
24.0
(17.
0, 3
2.7)
26
.3 (1
9.2,
34.
9)
14.1
(9.4
, 20.
7)
8.3
(4.8
, 13.
9)
2.4
(0.9
, 6.2
) 6.
5 (3
.4, 1
2.0)
1.
0 (0
.3, 3
.2)
4.4
(1.9
, 9.7
) 10
0
Age
(yea
rs)
15–2
4 1.
7 (1
.0, 3
.0)
1.8
(0.8
, 3.9
) 3.
6 (1
.6, 7
.8)
16.5
(11.
5, 2
3.1)
24
.9 (1
8.3,
32.
9)
22.4
(16.
5, 2
9.8)
17
.7 (1
2.1,
25.
0)
4.5
(2.3
, 8.6
) 5.
3 (2
.9, 9
.3)
1.2
(0.4
, 3.6
) 0.
3 (0
.1, 1
.4)
100
25–4
4 7.
3 (5
.7, 9
.4)
2.8
(1.6
, 5.1
) 2.
9 (1
.9, 4
.4)
20.2
(17.
0, 2
4.0)
29
.2 (2
5.3,
33.
4)
18.5
(16.
0, 2
1.1)
7.
4 (5
.7, 9
.5)
4.0
(2.5
, 6.4
) 5.
1 (3
.6, 7
.1)
0.8
(0.4
, 1.6
) 1.
7 (1
.1, 2
.7)
100
45–5
9 5.
0 (3
.4, 7
.2)
3.9
(2.4
, 6.1
) 4.
9 (3
.3, 7
.1)
15.3
(12.
3, 1
8.8)
31
.9 (2
7.9,
36.
2)
18.8
(15.
4, 2
2.6)
7.
4 (5
.3, 1
0.1)
3.
4 (2
.3, 5
.0)
5.8
(4.2
, 8.0
) 0.
8 (0
.4, 1
.6)
3.0
(1.8
, 5.1
) 10
0
60+
6.9
(3.7
, 12.
5)
7.1
(3.8
, 13.
0)
4.8
(2.8
, 8.1
) 15
.8 (1
0.5,
23.
2)
30.9
(23.
9, 3
8.8)
7.
3 (4
.4, 1
1.8)
5.
7 (3
.4, 9
.5)
4.1
(1.9
, 8.7
) 11
.9 (7
.5, 1
8.3)
3.
6 (1
.7, 7
.2)
1.9
(0.8
, 4.5
) 10
0
Resi
denc
e
Urb
an
6.7
(5.5
, 8.2
) 3.
0 (2
.2, 4
.0)
4.0
(3.0
, 5.5
) 19
.2 (1
7.1,
21.
6)
23.1
(20.
6, 2
5.8)
20
.1 (1
7.9,
22.
5)
9.5
(7.8
, 11.
7)
4.0
(3.1
, 5.2
) 6.
1 (4
.8, 7
.6)
1.0
(0.6
, 1.6
) 3.
2 (2
.1, 4
.8)
100
Rura
l 4.
6 (3
.4, 6
.2)
3.1
(1.9
, 5.1
) 3.
3 (2
.1, 5
.1)
17.2
(13.
9, 2
1.1)
32
.3 (2
7.8,
37.
2)
18.1
(14.
9, 2
1.8)
10
.1 (7
.3, 1
3.8)
4.
0 (2
.3, 6
.9)
5.4
(3.8
, 7.7
) 1.
2 (0
.6, 2
.1)
0.7
(0.3
, 1.6
) 10
0
Educ
atio
na le
vel
Less
than
prim
ary
5.1
(3.4
, 7.5
) 4.
5 (2
.8, 7
.2)
3.7
(2.5
, 5.5
) 17
.9 (1
4.1,
22.
4)
34.8
(30.
4, 3
9.6)
14
.5 (1
1.3,
18.
3)
6.8
(4.6
, 9.9
) 2.
4 (1
.4, 4
.0)
6.8
(4.6
, 9.8
) 1.
4 (0
.8, 2
.8)
2.2
(1.2
, 4.0
) 10
0
Prim
ary
4.8
(3.2
, 7.1
) 1.
6 (0
.8, 2
.9)
4.0
(2.0
, 7.8
) 19
.2 (1
4.2,
25.
5)
31.6
(25.
3, 3
8.7)
17
.3 (1
2.5,
23.
5)
10.3
(7.0
, 15.
0)
4.3
(2.5
, 7.1
) 4.
7 (2
.6, 8
.4)
0.9
(0.4
, 2.0
) 1.
2 (0
.6, 2
.5)
100
Seco
ndar
y 5.
5 (4
.1, 7
.3)
3.2
(1.8
, 5.7
) 3.
3 (2
.3, 4
.9)
17.1
(14.
3, 2
0.2)
27
.0 (2
2.7,
31.
7)
20.4
(17.
1, 2
4.1)
10
.8 (8
.0, 1
4.3)
4.
4 (2
.6, 7
.2)
5.5
(3.9
, 7.7
) 1.
1 (0
.5, 2
.4)
1.8
(1.1
, 2.9
) 10
0
Uni
vers
ity
7.0
(4.6
, 10.
7)
3.8
(1.7
, 8.1
) 3.
5 (2
.0, 6
.1)
18.9
(13.
8, 2
5.3)
20
.0 (1
5.4,
25.
6)
22.9
(18.
2, 2
8.4)
10
.0 (5
.5, 1
7.5)
4.
5 (2
.8, 7
.2)
7.2
(4.1
, 12.
2)
0.8
(0.2
, 2.9
) 1.
4 (0
.6, 3
.3)
100
Regi
on
Bang
kok
6.2
(4.5
, 8.5
) 2.
3 (1
.3, 4
.0)
3.5
(2.2
, 5.4
) 18
.7 (1
5.4,
22.
6)
24.4
(20.
4, 2
8.9)
21
.2 (1
7.9,
25.
0)
9.0
(6.4
, 12.
5)
2.5
(1.4
, 4.2
) 5.
2 (3
.5, 7
.7)
0.9
(0.4
, 2.0
) 6.
1 (3
.9, 9
.5)
100
Cent
ral
7.8
(5.6
, 10.
6)
3.2
(1.8
, 5.6
) 5.
6 (3
.5, 8
.9)
16.8
(12.
7, 2
1.9)
26
.7 (2
0.3,
34.
3)
16.5
(13.
0, 2
0.9)
9.
6 (6
.1, 1
4.9)
4.
3 (2
.9, 6
.2)
6.2
(4.1
, 9.3
) 1.
1 (0
.5, 2
.8)
2.1
(1.1
, 4.2
) 10
0
Nor
ther
n 4.
6 (2
.8, 7
.6)
3.1
(1.6
, 6.0
) 2.
6 (1
.3, 4
.9)
18.6
(14.
5, 2
3.7)
32
.9 (2
6.3,
40.
3)
15.3
(11.
4, 2
0.1)
9.
8 (5
.8, 1
6.2)
3.
3 (2
.0, 5
.6)
7.5
(4.3
, 12.
6)
2.0
(0.7
, 5.3
) 0.
3 (0
.1, 1
.2)
100
Nor
thea
ster
n 3.
7 (2
.3, 6
.0)
2.4
(0.9
, 5.9
) 2.
9 (1
.4, 6
.0)
18.2
(13.
3, 2
4.4)
33
.1 (2
6.7,
40.
3)
20.1
(15.
1, 2
6.2)
10
.5 (6
.6, 1
6.4)
3.
9 (1
.4, 1
0.5)
4.
1 (2
.1, 8
.0)
0.3
(0.1
, 1.0
) 0.
7 (0
.2, 2
.6)
100
Sout
hern
4.
9 (3
.3, 7
.2)
4.4
(2.4
, 8.1
) 2.
6 (1
.7, 4
.0)
18.4
(14.
4, 2
3.2)
23
.8 (1
9.9,
28.
2)
21.5
(17.
3, 2
6.5)
9.
8 (6
.9, 1
3.7)
5.
4 (3
.3, 8
.7)
6.5
(4.6
, 9.2
) 1.
8 (0
.9, 3
.5)
0.8
(0.2
, 2.8
) 10
0
Soci
oeco
nom
ic s
tatu
s
Low
est
3.0
(1.5
, 6.1
) 3.
6 (1
.2, 9
.7)
4.3
(1.8
, 9.8
) 20
.0 (1
3.6,
28.
3)
22.3
(15.
9, 3
0.4)
21
.4 (1
4.4,
30.
7)
18.0
(11.
8, 2
6.6)
2.
8 (0
.9, 8
.0)
2.6
(1.2
, 5.6
) 1.
2 (0
.4, 3
.7)
0.7
(0.3
, 1.6
) 10
0
Low
4.
5 (2
.6, 7
.5)
2.9
(1.5
, 5.8
) 2.
9 (1
.2, 6
.5)
18.6
(13.
4, 2
5.3)
31
.6 (2
4.3,
40.
0)
16.0
(11.
5, 2
1.7)
8.
8 (4
.7, 1
5.9)
6.
2 (2
.2, 1
5.9)
6.
4 (3
.5, 1
1.2)
1.
1 (0
.3, 4
.0)
1.1
(0.3
, 3.7
) 10
0
Mid
dle
5.5
(3.8
, 8.0
) 1.
3 (0
.6, 2
.7)
4.1
(2.6
, 6.5
) 15
.1 (1
1.8,
19.
0)
35.0
(29.
2, 4
1.2)
18
.9 (1
4.8,
23.
7)
8.3
(5.8
, 11.
8)
3.8
(2.3
, 6.1
) 5.
5 (3
.3, 9
.1)
0.4
(0.2
, 1.1
) 2.
1 (1
.1, 4
.0)
100
Hig
h 6.
2 (4
.5, 8
.4)
3.9
(2.3
, 6.4
) 3.
1 (1
.9, 5
.0)
18.4
(14.
8, 2
2.7)
28
.4 (2
3.7,
33.
5)
17.8
(14.
2, 2
2.0)
8.
0 (5
.8, 1
1.1)
3.
8 (2
.5, 5
.7)
7.4
(5.1
, 10.
6)
1.1
(0.5
, 2.4
) 1.
9 (1
.1, 3
.4)
100
Hig
hest
7.
6 (5
.4, 1
0.4)
3.
8 (2
.2, 6
.5)
3.7
(2.5
, 5.6
) 18
.4 (1
4.2,
23.
4)
24.9
(20.
3, 3
0.2)
20
.8 (1
7.1,
25.
1)
7.4
(5.1
, 10.
7)
3.6
(2.3
, 5.8
) 6.
0 (4
.3, 8
.3)
1.7
(0.8
, 3.4
) 2.
1 (1
.1, 4
.0)
100
1 PH
Ws
: Pic
tori
al h
ealth
war
ning
text
and
pic
ture
s ca
n be
foun
d in
App
endi
x E.
2 In
clud
es c
urre
nt s
mok
ers
of m
anuf
actu
red
ciga
rett
es o
r cig
ars
Rem
arks
on
PHW
s: 1
= C
igar
ette
sm
oke
kills
peo
ple
near
by, 2
= S
mok
ing
caus
es b
ad b
reat
h, 3
= S
mok
ing
caus
es fa
tal e
mph
ysem
a, 4
= S
mok
ing
caus
es lu
ng c
ance
r, 5
= S
mok
ing
caus
es o
ral c
ance
r, 6
= S
mok
ing
caus
es la
ryng
eal c
ance
r, 7
= S
mok
ing
caus
es h
eart
failu
re, 8
= S
mok
ing
caus
es s
trok
e, 9
= C
igar
ette
sm
oke
caus
es 1
0 ty
pes
of c
ance
r, a
nd 1
0 =
Smok
ing
caus
es fo
ot g
angr
ene
Tota
l
Global Adult Tobacco Survey : Thailand Report, 2011 9-15
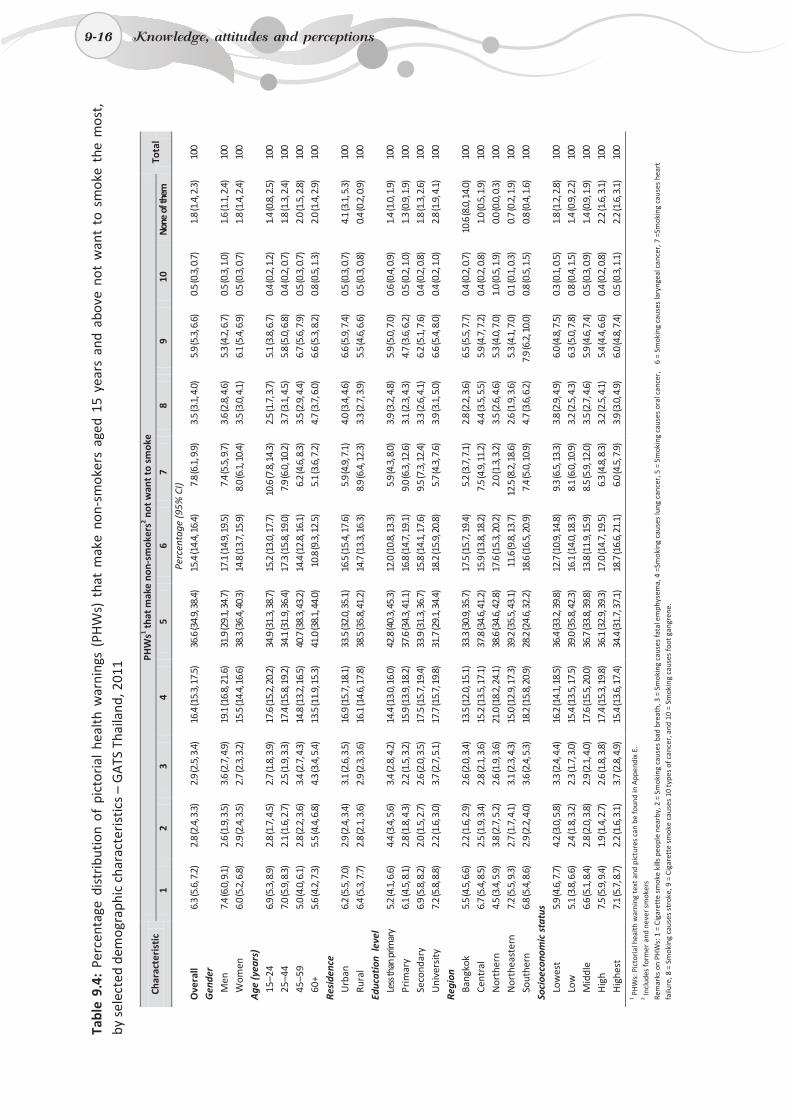
9-16
Tabl
e 9.
4: P
erce
ntag
e di
stri
butio
n of
pic
tori
al h
ealth
war
ning
s (P
HW
s) t
hat
mak
e no
n-sm
oker
s ag
ed 1
5 ye
ars
and
abov
e no
t w
ant
to s
mok
e th
e m
ost,
by
sel
ecte
d de
mog
raph
ic c
hara
cter
istic
s –
GA
TS T
haila
nd, 2
011
Char
acte
rist
ic
PHW
s1 that
mak
e no
n-sm
oker
s2 not
wan
t to
smok
e
1
2 3
4 5
6 7
8 9
10
None
of t
hem
Pe
rcen
tage
(95%
CI)
Ove
rall
6.3
(5.6
, 7.2
) 2.
8 (2
.4, 3
.3)
2.9
(2.5
, 3.4
) 16
.4 (1
5.3,
17.
5)
36.6
(34.
9, 3
8.4)
15
.4 (1
4.4,
16.
4)
7.8
(6.1
, 9.9
) 3.
5 (3
.1, 4
.0)
5.9
(5.3
, 6.6
) 0.
5 (0
.3, 0
.7)
1.8
(1.4
, 2.3
) 10
0 G
ende
r
Men
7.
4 (6
.0, 9
.1)
2.6
(1.9
, 3.5
) 3.
6 (2
.7, 4
.9)
19.1
(16.
8, 2
1.6)
31
.9 (2
9.1,
34.
7)
17.1
(14.
9, 1
9.5)
7.
4 (5
.5, 9
.7)
3.6
(2.8
, 4.6
) 5.
3 (4
.2, 6
.7)
0.5
(0.3
, 1.0
) 1.
6 (1
.1, 2
.4)
100
Wom
en
6.0
(5.2
, 6.8
) 2.
9 (2
.4, 3
.5)
2.7
(2.3
, 3.2
) 15
.5 (1
4.4,
16.
6)
38.3
(36.
4, 4
0.3)
14
.8 (1
3.7,
15.
9)
8.0
(6.1
, 10.
4)
3.5
(3.0
, 4.1
) 6.
1 (5
.4, 6
.9)
0.5
(0.3
, 0.7
) 1.
8 (1
.4, 2
.4)
100
Age
(yea
rs)
15–2
4 6.
9 (5
.3, 8
.9)
2.8
(1.7
, 4.5
) 2.
7 (1
.8, 3
.9)
17.6
(15.
2, 2
0.2)
34
.9 (3
1.3,
38.
7)
15.2
(13.
0, 1
7.7)
10
.6 (7
.8, 1
4.3)
2.
5 (1
.7, 3
.7)
5.1
(3.8
, 6.7
) 0.
4 (0
.2, 1
.2)
1.4
(0.8
, 2.5
) 10
0 25
–44
7.0
(5.9
, 8.3
) 2.
1 (1
.6, 2
.7)
2.5
(1.9
, 3.3
) 17
.4 (1
5.8,
19.
2)
34.1
(31.
9, 3
6.4)
17
.3 (1
5.8,
19.
0)
7.9
(6.0
, 10.
2)
3.7
(3.1
, 4.5
) 5.
8 (5
.0, 6
.8)
0.4
(0.2
, 0.7
) 1.
8 (1
.3, 2
.4)
100
45–5
9 5.
0 (4
.0, 6
.1)
2.8
(2.2
, 3.6
) 3.
4 (2
.7, 4
.3)
14.8
(13.
2, 1
6.5)
40
.7 (3
8.3,
43.
2)
14.4
(12.
8, 1
6.1)
6.
2 (4
.6, 8
.3)
3.5
(2.9
, 4.4
) 6.
7 (5
.6, 7
.9)
0.5
(0.3
, 0.7
) 2.
0 (1
.5, 2
.8)
100
60+
5.6
(4.2
, 7.3
) 5.
5 (4
.4, 6
.8)
4.3
(3.4
, 5.4
) 13
.5 (1
1.9,
15.
3)
41.0
(38.
1, 4
4.0)
10
.8 (9
.3, 1
2.5)
5.
1 (3
.6, 7
.2)
4.7
(3.7
, 6.0
) 6.
6 (5
.3, 8
.2)
0.8
(0.5
, 1.3
) 2.
0 (1
.4, 2
.9)
100
Resi
denc
e
U
rban
6.
2 (5
.5, 7
.0)
2.9
(2.4
, 3.4
) 3.
1 (2
.6, 3
.5)
16.9
(15.
7, 1
8.1)
33
.5 (3
2.0,
35.
1)
16.5
(15.
4, 1
7.6)
5.
9 (4
.9, 7
.1)
4.0
(3.4
, 4.6
) 6.
6 (5
.9, 7
.4)
0.5
(0.3
, 0.7
) 4.
1 (3
.1, 5
.3)
100
Rura
l 6.
4 (5
.3, 7
.7)
2.8
(2.1
, 3.6
) 2.
9 (2
.3, 3
.6)
16.1
(14.
6, 1
7.8)
38
.5 (3
5.8,
41.
2)
14.7
(13.
3, 1
6.3)
8.
9 (6
.4, 1
2.3)
3.
3 (2
.7, 3
.9)
5.5
(4.6
, 6.6
) 0.
5 (0
.3, 0
.8)
0.4
(0.2
, 0.9
) 10
0
Educ
atio
n le
vel
Less
than
prim
ary
5.2
(4.1
, 6.6
) 4.
4 (3
.4, 5
.6)
3.4
(2.8
, 4.2
) 14
.4 (1
3.0,
16.
0)
42.8
(40.
3, 4
5.3)
12
.0 (1
0.8,
13.
3)
5.9
(4.3
, 8.0
) 3.
9 (3
.2, 4
.8)
5.9
(5.0
, 7.0
) 0.
6 (0
.4, 0
.9)
1.4
(1.0
, 1.9
) 10
0
Prim
ary
6.1
(4.5
, 8.1
) 2.
8 (1
.8, 4
.3)
2.2
(1.5
, 3.2
) 15
.9 (1
3.9,
18.
2)
37.6
(34.
3, 4
1.1)
16
.8 (1
4.7,
19.
1)
9.0
(6.3
, 12.
6)
3.1
(2.3
, 4.3
) 4.
7 (3
.6, 6
.2)
0.5
(0.2
, 1.0
) 1.
3 (0
.9, 1
.9)
100
Seco
ndar
y 6.
9 (5
.8, 8
.2)
2.0
(1.5
, 2.7
) 2.
6 (2
.0, 3
.5)
17.5
(15.
7, 1
9.4)
33
.9 (3
1.3,
36.
7)
15.8
(14.
1, 1
7.6)
9.
5 (7
.3, 1
2.4)
3.
3 (2
.6, 4
.1)
6.2
(5.1
, 7.6
) 0.
4 (0
.2, 0
.8)
1.8
(1.3
, 2.6
) 10
0
Uni
vers
ity
7.2
(5.8
, 8.8
) 2.
2 (1
.6, 3
.0)
3.7
(2.7
, 5.1
) 17
.7 (1
5.7,
19.
8)
31.7
(29.
1, 3
4.4)
18
.2 (1
5.9,
20.
8)
5.7
(4.3
, 7.6
) 3.
9 (3
.1, 5
.0)
6.6
(5.4
, 8.0
) 0.
4 (0
.2, 1
.0)
2.8
(1.9
, 4.1
) 10
0
R egi
on
Bang
kok
5.5
(4.5
, 6.6
) 2.
2 (1
.6, 2
.9)
2.6
(2.0
, 3.4
) 13
.5 (1
2.0,
15.
1)
33.3
(30.
9, 3
5.7)
17
.5 (1
5.7,
19.
4)
5.2
(3.7
, 7.1
) 2.
8 (2
.2, 3
.6)
6.5
(5.5
, 7.7
) 0.
4 (0
.2, 0
.7)
10.6
(8.0
, 14.
0)
100
Cent
ral
6.7
(5.4
, 8.5
) 2.
5 (1
.9, 3
.4)
2.8
(2.1
, 3.6
) 15
.2 (1
3.5,
17.
1)
37.8
(34.
6, 4
1.2)
15
.9 (1
3.8,
18.
2)
7.5
(4.9
, 11.
2)
4.4
(3.5
, 5.5
) 5.
9 (4
.7, 7
.2)
0.4
(0.2
, 0.8
) 1.
0 (0
.5, 1
.9)
100
Nor
ther
n 4.
5 (3
.4, 5
.9)
3.8
(2.7
, 5.2
) 2.
6 (1
.9, 3
.6)
21.0
(18.
2, 2
4.1)
38
.6 (3
4.6,
42.
8)
17.6
(15.
3, 2
0.2)
2.
0 (1
.3, 3
.2)
3.5
(2.6
, 4.6
) 5.
3 (4
.0, 7
.0)
1.0
(0.5
, 1.9
) 0.
0 (0
.0, 0
.3)
100
Nor
thea
ster
n 7.
2 (5
.5, 9
.3)
2.7
(1.7
, 4.1
) 3.
1 (2
.3, 4
.3)
15.0
(12.
9, 1
7.3)
39
.2 (3
5.5,
43.
1)
11.6
(9.8
, 13.
7)
12.5
(8.2
, 18.
6)
2.6
(1.9
, 3.6
) 5.
3 (4
.1, 7
.0)
0.1
(0.1
, 0.3
) 0.
7 (0
.2, 1
.9)
100
Sout
hern
6.
8 (5
.4, 8
.6)
2.9
(2.2
, 4.0
) 3.
6 (2
.4, 5
.3)
18.2
(15.
8, 2
0.9)
28
.2 (2
4.6,
32.
2)
18.6
(16.
5, 2
0.9)
7.
4 (5
.0, 1
0.9)
4.
7 (3
.6, 6
.2)
7.9
(6.2
, 10.
0)
0.8
(0.5
, 1.5
) 0.
8 (0
.4, 1
.6)
100
Soci
oeco
nom
ic s
tatu
s
Low
est
5.9
(4.6
, 7.7
) 4.
2 (3
.0, 5
.8)
3.3
(2.4
, 4.4
) 16
.2 (1
4.1,
18.
5)
36.4
(33.
2, 3
9.8)
12
.7 (1
0.9,
14.
8)
9.3
(6.5
, 13.
3)
3.8
(2.9
, 4.9
) 6.
0 (4
.8, 7
.5)
0.3
(0.1
, 0.5
) 1.
8 (1
.2, 2
.8)
100
Low
5.
1 (3
.8, 6
.6)
2.4
(1.8
, 3.2
) 2.
3 (1
.7, 3
.0)
15.4
(13.
5, 1
7.5)
39
.0 (3
5.8,
42.
3)
16.1
(14.
0, 1
8.3)
8.
1 (6
.0, 1
0.9)
3.
2 (2
.5, 4
.3)
6.3
(5.0
, 7.8
) 0.
8 (0
.4, 1
.5)
1.4
(0.9
, 2.2
) 10
0
Mid
dle
6.6
(5.1
, 8.4
) 2.
8 (2
.0, 3
.8)
2.9
(2.1
, 4.0
) 17
.6 (1
5.5,
20.
0)
36.7
(33.
8, 3
9.8)
13
.8 (1
1.9,
15.
9)
8.5
(5.9
, 12.
0)
3.5
(2.7
, 4.6
) 5.
9 (4
.6, 7
.4)
0.5
(0.3
, 0.9
) 1.
4 (0
.9, 1
.9)
100
Hig
h 7.
5 (5
.9, 9
.4)
1.9
(1.4
, 2.7
) 2.
6 (1
.8, 3
.8)
17.4
(15.
3, 1
9.8)
36
.1 (3
2.9,
39.
3)
17.0
(14.
7, 1
9.5)
6.
3 (4
.8, 8
.3)
3.2
(2.5
, 4.1
) 5.
4 (4
.4, 6
.6)
0.4
(0.2
, 0.8
) 2.
2 (1
.6, 3
.1)
100
Hig
hest
7.
1 (5
.7, 8
.7)
2.2
(1.6
, 3.1
) 3.
7 (2
.8, 4
.9)
15.4
(13.
6, 1
7.4)
34
.4 (3
1.7,
37.
1)
18.7
(16.
6, 2
1.1)
6.
0 (4
.5, 7
.9)
3.9
(3.0
, 4.9
) 6.
0 (4
.8, 7
.4)
0.5
(0.3
, 1.1
) 2.
2 (1
.6, 3
.1)
100
1 PH
Ws:
Pic
toria
l hea
lth w
arni
ng te
xt a
nd p
ictu
res
can
be fo
und
in A
ppen
dix
E.
2 Incl
udes
form
er a
nd n
ever
sm
oker
s Re
mar
ks o
n PH
Ws:
1 =
Cig
aret
te s
mok
e ki
lls p
eopl
e ne
arby
, 2 =
Sm
okin
g ca
uses
bad
bre
ath,
3 =
Sm
okin
g ca
uses
fata
l em
phys
ema,
4 =
Smok
ing
caus
es lu
ng c
ance
r, 5
= S
mok
ing
caus
es o
ral c
ance
r,
6 =
Sm
okin
g ca
uses
lary
ngea
l can
cer,
7 =
Smok
ing
caus
es h
eart
fa
ilure
, 8 =
Sm
okin
g ca
uses
str
oke,
9 =
Cig
aret
te s
mok
e ca
uses
10
type
s of
can
cer,
and
10
= Sm
okin
g ca
uses
foot
gan
gren
e.
Tota
l
9-16 Knowledge, attitudes and perceptions
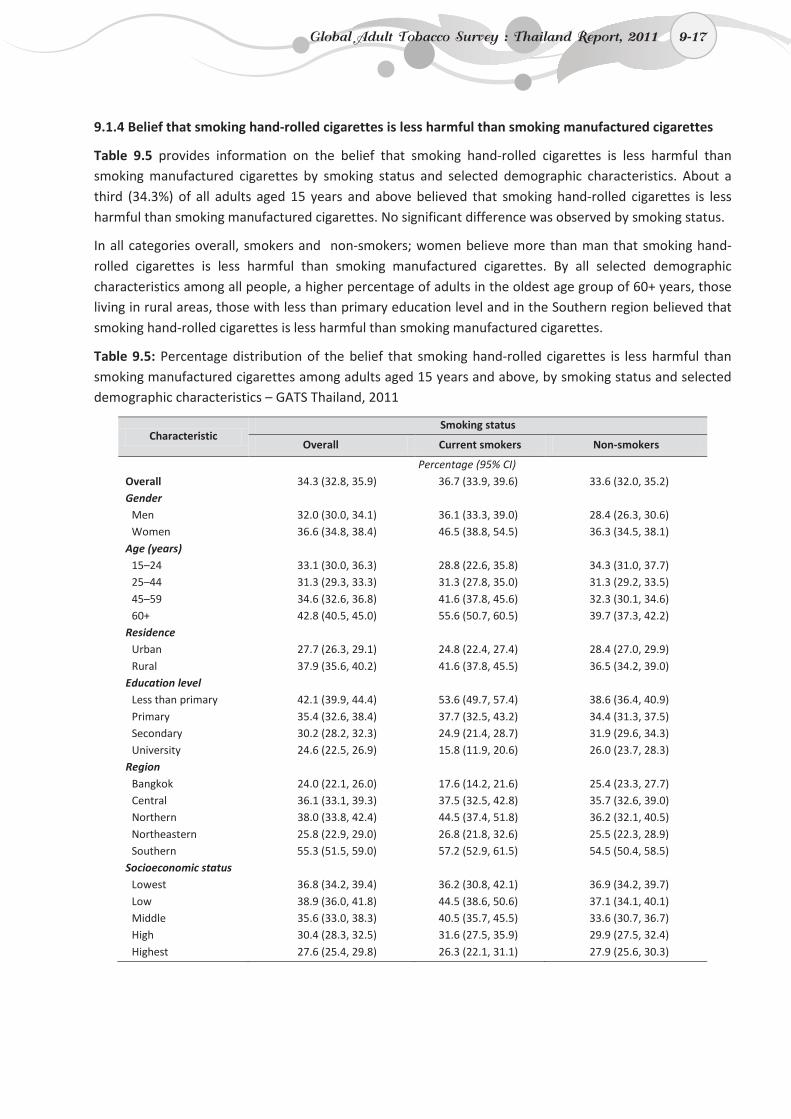
9-17
9.1.4 Belief that smoking hand-rolled cigarettes is less harmful than smoking manufactured cigarettes
Table 9.5 provides information on the belief that smoking hand-rolled cigarettes is less harmful than smoking manufactured cigarettes by smoking status and selected demographic characteristics. About a third (34.3%) of all adults aged 15 years and above believed that smoking hand-rolled cigarettes is less harmful than smoking manufactured cigarettes. No significant difference was observed by smoking status.
In all categories overall, smokers and non-smokers; women believe more than man that smoking hand-rolled cigarettes is less harmful than smoking manufactured cigarettes. By all selected demographic characteristics among all people, a higher percentage of adults in the oldest age group of 60+ years, those living in rural areas, those with less than primary education level and in the Southern region believed that smoking hand-rolled cigarettes is less harmful than smoking manufactured cigarettes.
Table 9.5: Percentage distribution of the belief that smoking hand-rolled cigarettes is less harmful than smoking manufactured cigarettes among adults aged 15 years and above, by smoking status and selected demographic characteristics – GATS Thailand, 2011
Characteristic Smoking status
Overall Current smokers Non-smokers
Percentage (95% CI) Overall 34.3 (32.8, 35.9) 36.7 (33.9, 39.6) 33.6 (32.0, 35.2) Gender
Men 32.0 (30.0, 34.1) 36.1 (33.3, 39.0) 28.4 (26.3, 30.6) Women 36.6 (34.8, 38.4) 46.5 (38.8, 54.5) 36.3 (34.5, 38.1)
Age (years) 15–24 33.1 (30.0, 36.3) 28.8 (22.6, 35.8) 34.3 (31.0, 37.7) 25–44 31.3 (29.3, 33.3) 31.3 (27.8, 35.0) 31.3 (29.2, 33.5) 45–59 34.6 (32.6, 36.8) 41.6 (37.8, 45.6) 32.3 (30.1, 34.6) 60+ 42.8 (40.5, 45.0) 55.6 (50.7, 60.5) 39.7 (37.3, 42.2)
Residence Urban 27.7 (26.3, 29.1) 24.8 (22.4, 27.4) 28.4 (27.0, 29.9) Rural 37.9 (35.6, 40.2) 41.6 (37.8, 45.5) 36.5 (34.2, 39.0)
Education level Less than primary 42.1 (39.9, 44.4) 53.6 (49.7, 57.4) 38.6 (36.4, 40.9) Primary 35.4 (32.6, 38.4) 37.7 (32.5, 43.2) 34.4 (31.3, 37.5) Secondary 30.2 (28.2, 32.3) 24.9 (21.4, 28.7) 31.9 (29.6, 34.3) University 24.6 (22.5, 26.9) 15.8 (11.9, 20.6) 26.0 (23.7, 28.3)
Region Bangkok 24.0 (22.1, 26.0) 17.6 (14.2, 21.6) 25.4 (23.3, 27.7) Central 36.1 (33.1, 39.3) 37.5 (32.5, 42.8) 35.7 (32.6, 39.0) Northern 38.0 (33.8, 42.4) 44.5 (37.4, 51.8) 36.2 (32.1, 40.5) Northeastern 25.8 (22.9, 29.0) 26.8 (21.8, 32.6) 25.5 (22.3, 28.9) Southern 55.3 (51.5, 59.0) 57.2 (52.9, 61.5) 54.5 (50.4, 58.5)
Socioeconomic status Lowest 36.8 (34.2, 39.4) 36.2 (30.8, 42.1) 36.9 (34.2, 39.7) Low 38.9 (36.0, 41.8) 44.5 (38.6, 50.6) 37.1 (34.1, 40.1) Middle 35.6 (33.0, 38.3) 40.5 (35.7, 45.5) 33.6 (30.7, 36.7) High 30.4 (28.3, 32.5) 31.6 (27.5, 35.9) 29.9 (27.5, 32.4) Highest 27.6 (25.4, 29.8) 26.3 (22.1, 31.1) 27.9 (25.6, 30.3)
Global Adult Tobacco Survey : Thailand Report, 2011 9-17
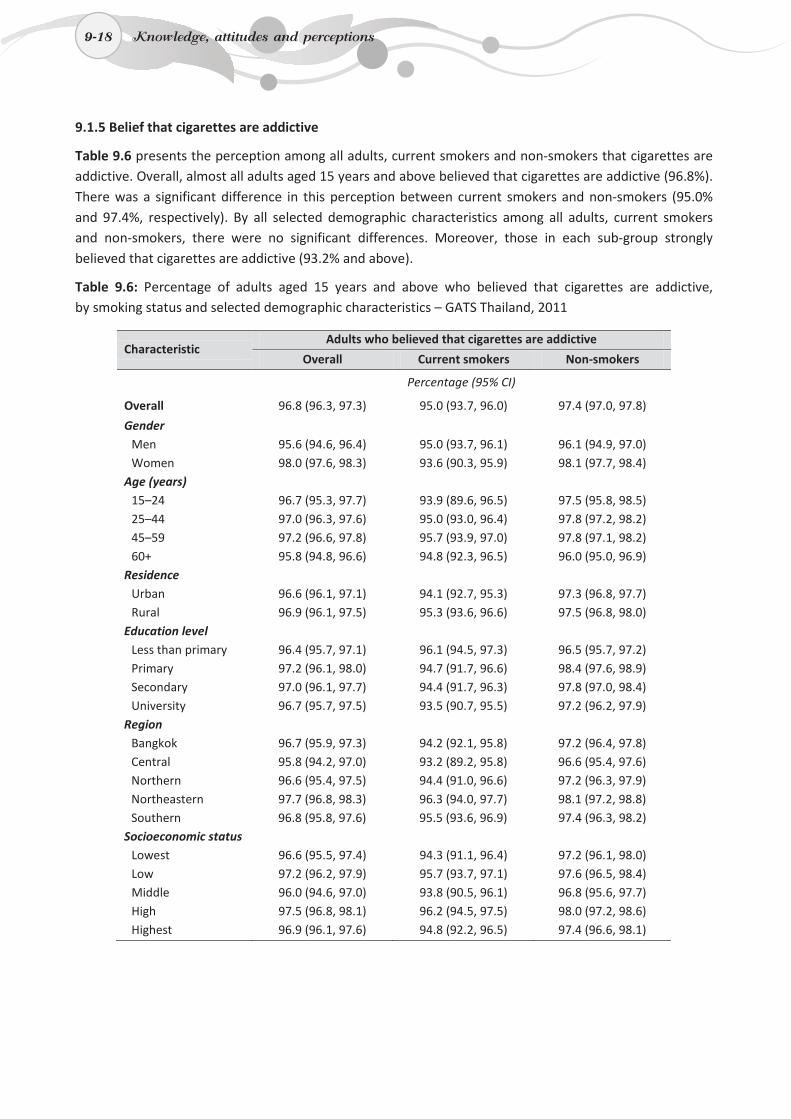
9-18
9.1.5 Belief that cigarettes are addictive
Table 9.6 presents the perception among all adults, current smokers and non-smokers that cigarettes are addictive. Overall, almost all adults aged 15 years and above believed that cigarettes are addictive (96.8%). There was a significant difference in this perception between current smokers and non-smokers (95.0% and 97.4%, respectively). By all selected demographic characteristics among all adults, current smokers and non-smokers, there were no significant differences. Moreover, those in each sub-group strongly believed that cigarettes are addictive (93.2% and above).
Table 9.6: Percentage of adults aged 15 years and above who believed that cigarettes are addictive, by smoking status and selected demographic characteristics – GATS Thailand, 2011
Characteristic Adults who believed that cigarettes are addictive
Overall Current smokers Non-smokers
Percentage (95% CI)
Overall 96.8 (96.3, 97.3) 95.0 (93.7, 96.0) 97.4 (97.0, 97.8)
Gender Men 95.6 (94.6, 96.4) 95.0 (93.7, 96.1) 96.1 (94.9, 97.0) Women 98.0 (97.6, 98.3) 93.6 (90.3, 95.9) 98.1 (97.7, 98.4)
Age (years) 15–24 96.7 (95.3, 97.7) 93.9 (89.6, 96.5) 97.5 (95.8, 98.5) 25–44 97.0 (96.3, 97.6) 95.0 (93.0, 96.4) 97.8 (97.2, 98.2) 45–59 97.2 (96.6, 97.8) 95.7 (93.9, 97.0) 97.8 (97.1, 98.2) 60+ 95.8 (94.8, 96.6) 94.8 (92.3, 96.5) 96.0 (95.0, 96.9)
Residence Urban 96.6 (96.1, 97.1) 94.1 (92.7, 95.3) 97.3 (96.8, 97.7) Rural 96.9 (96.1, 97.5) 95.3 (93.6, 96.6) 97.5 (96.8, 98.0)
Education level Less than primary 96.4 (95.7, 97.1) 96.1 (94.5, 97.3) 96.5 (95.7, 97.2) Primary 97.2 (96.1, 98.0) 94.7 (91.7, 96.6) 98.4 (97.6, 98.9) Secondary 97.0 (96.1, 97.7) 94.4 (91.7, 96.3) 97.8 (97.0, 98.4) University 96.7 (95.7, 97.5) 93.5 (90.7, 95.5) 97.2 (96.2, 97.9)
Region Bangkok 96.7 (95.9, 97.3) 94.2 (92.1, 95.8) 97.2 (96.4, 97.8) Central 95.8 (94.2, 97.0) 93.2 (89.2, 95.8) 96.6 (95.4, 97.6) Northern 96.6 (95.4, 97.5) 94.4 (91.0, 96.6) 97.2 (96.3, 97.9) Northeastern 97.7 (96.8, 98.3) 96.3 (94.0, 97.7) 98.1 (97.2, 98.8) Southern 96.8 (95.8, 97.6) 95.5 (93.6, 96.9) 97.4 (96.3, 98.2)
Socioeconomic status Lowest 96.6 (95.5, 97.4) 94.3 (91.1, 96.4) 97.2 (96.1, 98.0) Low 97.2 (96.2, 97.9) 95.7 (93.7, 97.1) 97.6 (96.5, 98.4) Middle 96.0 (94.6, 97.0) 93.8 (90.5, 96.1) 96.8 (95.6, 97.7) High 97.5 (96.8, 98.1) 96.2 (94.5, 97.5) 98.0 (97.2, 98.6) Highest 96.9 (96.1, 97.6) 94.8 (92.2, 96.5) 97.4 (96.6, 98.1)
9-18 Knowledge, attitudes and perceptions
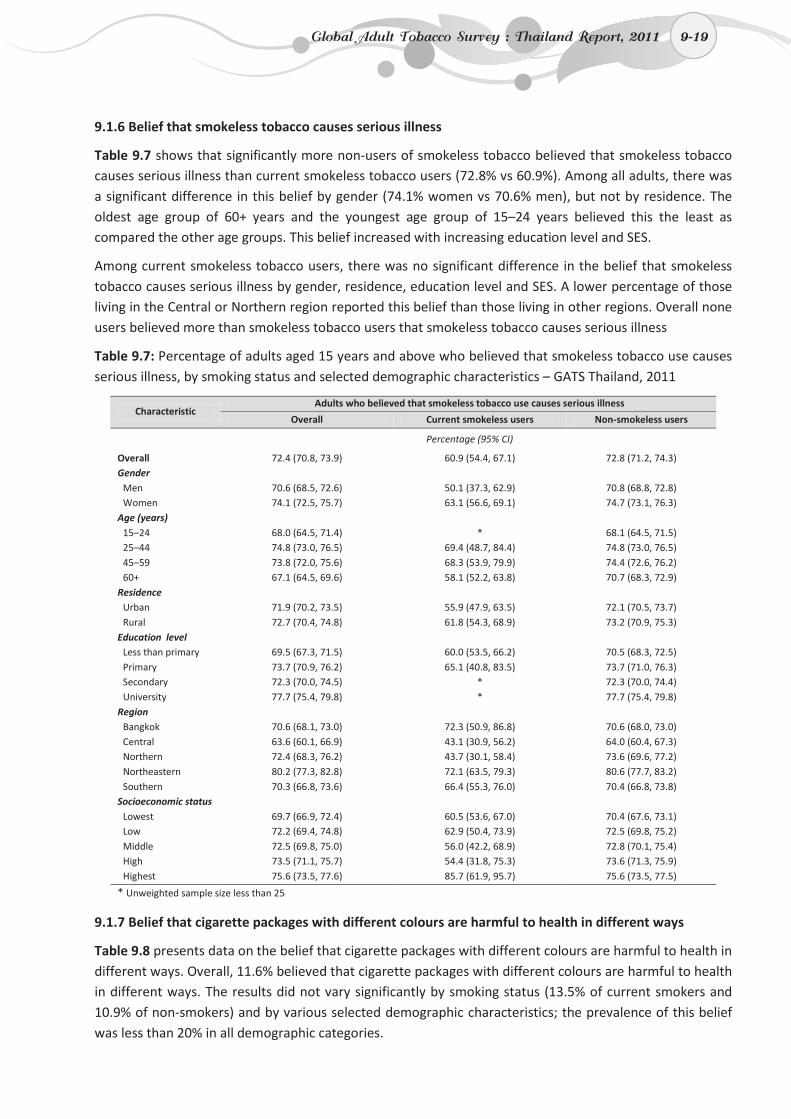
9-19
9.1.6 Belief that smokeless tobacco causes serious illness
Table 9.7 shows that significantly more non-users of smokeless tobacco believed that smokeless tobacco causes serious illness than current smokeless tobacco users (72.8% vs 60.9%). Among all adults, there was a significant difference in this belief by gender (74.1% women vs 70.6% men), but not by residence. The oldest age group of 60+ years and the youngest age group of 15–24 years believed this the least as compared the other age groups. This belief increased with increasing education level and SES.
Among current smokeless tobacco users, there was no significant difference in the belief that smokeless tobacco causes serious illness by gender, residence, education level and SES. A lower percentage of those living in the Central or Northern region reported this belief than those living in other regions. Overall none users believed more than smokeless tobacco users that smokeless tobacco causes serious illness
Table 9.7: Percentage of adults aged 15 years and above who believed that smokeless tobacco use causes serious illness, by smoking status and selected demographic characteristics – GATS Thailand, 2011
Characteristic Adults who believed that smokeless tobacco use causes serious illness
Overall Current smokeless users Non-smokeless users
Percentage (95% CI)
Overall 72.4 (70.8, 73.9) 60.9 (54.4, 67.1) 72.8 (71.2, 74.3) Gender
Men 70.6 (68.5, 72.6) 50.1 (37.3, 62.9) 70.8 (68.8, 72.8) Women 74.1 (72.5, 75.7) 63.1 (56.6, 69.1) 74.7 (73.1, 76.3)
Age (years) 15–24 68.0 (64.5, 71.4) * 68.1 (64.5, 71.5) 25–44 74.8 (73.0, 76.5) 69.4 (48.7, 84.4) 74.8 (73.0, 76.5) 45–59 73.8 (72.0, 75.6) 68.3 (53.9, 79.9) 74.4 (72.6, 76.2) 60+ 67.1 (64.5, 69.6) 58.1 (52.2, 63.8) 70.7 (68.3, 72.9)
Residence Urban 71.9 (70.2, 73.5) 55.9 (47.9, 63.5) 72.1 (70.5, 73.7) Rural 72.7 (70.4, 74.8) 61.8 (54.3, 68.9) 73.2 (70.9, 75.3)
Education level Less than primary 69.5 (67.3, 71.5) 60.0 (53.5, 66.2) 70.5 (68.3, 72.5) Primary 73.7 (70.9, 76.2) 65.1 (40.8, 83.5) 73.7 (71.0, 76.3) Secondary 72.3 (70.0, 74.5) * 72.3 (70.0, 74.4) University 77.7 (75.4, 79.8) * 77.7 (75.4, 79.8)
Region Bangkok 70.6 (68.1, 73.0) 72.3 (50.9, 86.8) 70.6 (68.0, 73.0) Central 63.6 (60.1, 66.9) 43.1 (30.9, 56.2) 64.0 (60.4, 67.3) Northern 72.4 (68.3, 76.2) 43.7 (30.1, 58.4) 73.6 (69.6, 77.2) Northeastern 80.2 (77.3, 82.8) 72.1 (63.5, 79.3) 80.6 (77.7, 83.2) Southern 70.3 (66.8, 73.6) 66.4 (55.3, 76.0) 70.4 (66.8, 73.8)
Socioeconomic status Lowest 69.7 (66.9, 72.4) 60.5 (53.6, 67.0) 70.4 (67.6, 73.1) Low 72.2 (69.4, 74.8) 62.9 (50.4, 73.9) 72.5 (69.8, 75.2) Middle 72.5 (69.8, 75.0) 56.0 (42.2, 68.9) 72.8 (70.1, 75.4) High 73.5 (71.1, 75.7) 54.4 (31.8, 75.3) 73.6 (71.3, 75.9) Highest 75.6 (73.5, 77.6) 85.7 (61.9, 95.7) 75.6 (73.5, 77.5)
* Unweighted sample size less than 25
9.1.7 Belief that cigarette packages with different colours are harmful to health in different ways
Table 9.8 presents data on the belief that cigarette packages with different colours are harmful to health in different ways. Overall, 11.6% believed that cigarette packages with different colours are harmful to health in different ways. The results did not vary significantly by smoking status (13.5% of current smokers and 10.9% of non-smokers) and by various selected demographic characteristics; the prevalence of this belief was less than 20% in all demographic categories.
Global Adult Tobacco Survey : Thailand Report, 2011 9-19
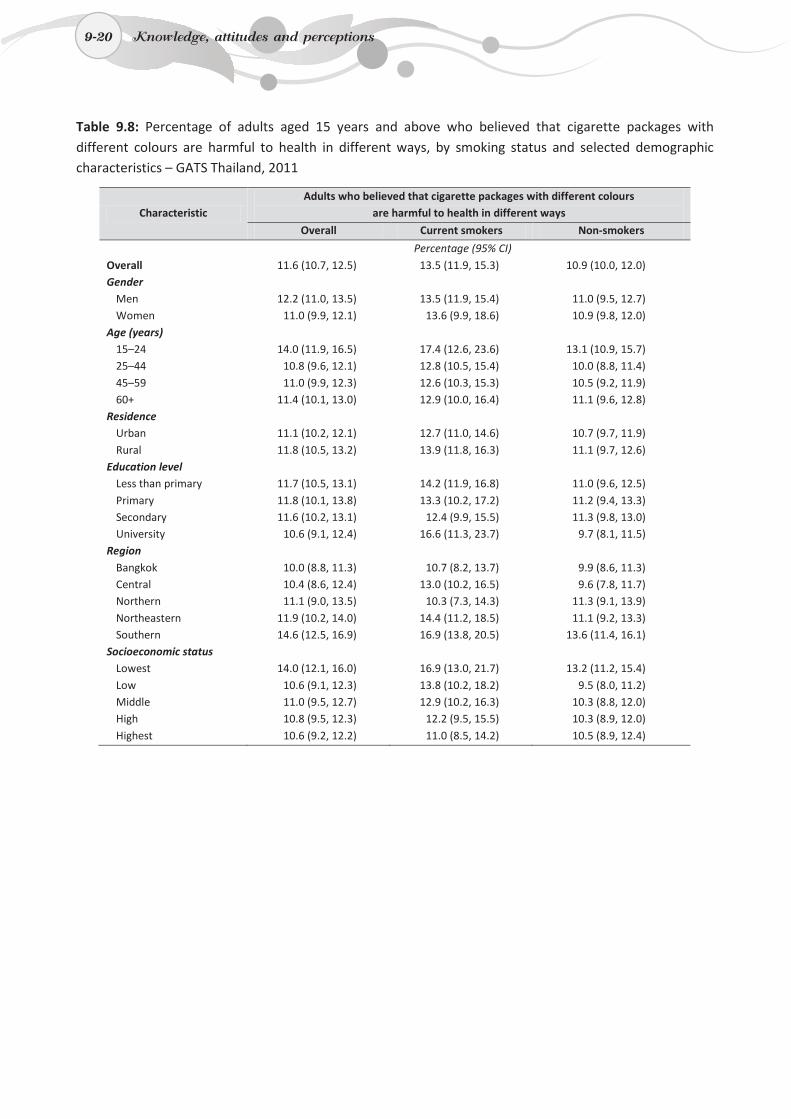
9-20
Table 9.8: Percentage of adults aged 15 years and above who believed that cigarette packages with different colours are harmful to health in different ways, by smoking status and selected demographic characteristics – GATS Thailand, 2011
Characteristic Adults who believed that cigarette packages with different colours
are harmful to health in different ways
Overall Current smokers Non-smokers
Percentage (95% CI)Overall 11.6 (10.7, 12.5) 13.5 (11.9, 15.3) 10.9 (10.0, 12.0) Gender
Men 12.2 (11.0, 13.5) 13.5 (11.9, 15.4) 11.0 (9.5, 12.7) Women 11.0 (9.9, 12.1) 13.6 (9.9, 18.6) 10.9 (9.8, 12.0)
Age (years) 15–24 14.0 (11.9, 16.5) 17.4 (12.6, 23.6) 13.1 (10.9, 15.7) 25–44 10.8 (9.6, 12.1) 12.8 (10.5, 15.4) 10.0 (8.8, 11.4) 45–59 11.0 (9.9, 12.3) 12.6 (10.3, 15.3) 10.5 (9.2, 11.9) 60+ 11.4 (10.1, 13.0) 12.9 (10.0, 16.4) 11.1 (9.6, 12.8)
Residence Urban 11.1 (10.2, 12.1) 12.7 (11.0, 14.6) 10.7 (9.7, 11.9) Rural 11.8 (10.5, 13.2) 13.9 (11.8, 16.3) 11.1 (9.7, 12.6)
Education level Less than primary 11.7 (10.5, 13.1) 14.2 (11.9, 16.8) 11.0 (9.6, 12.5) Primary 11.8 (10.1, 13.8) 13.3 (10.2, 17.2) 11.2 (9.4, 13.3) Secondary 11.6 (10.2, 13.1) 12.4 (9.9, 15.5) 11.3 (9.8, 13.0) University 10.6 (9.1, 12.4) 16.6 (11.3, 23.7) 9.7 (8.1, 11.5)
Region Bangkok 10.0 (8.8, 11.3) 10.7 (8.2, 13.7) 9.9 (8.6, 11.3) Central 10.4 (8.6, 12.4) 13.0 (10.2, 16.5) 9.6 (7.8, 11.7) Northern 11.1 (9.0, 13.5) 10.3 (7.3, 14.3) 11.3 (9.1, 13.9) Northeastern 11.9 (10.2, 14.0) 14.4 (11.2, 18.5) 11.1 (9.2, 13.3) Southern 14.6 (12.5, 16.9) 16.9 (13.8, 20.5) 13.6 (11.4, 16.1)
Socioeconomic status Lowest 14.0 (12.1, 16.0) 16.9 (13.0, 21.7) 13.2 (11.2, 15.4) Low 10.6 (9.1, 12.3) 13.8 (10.2, 18.2) 9.5 (8.0, 11.2) Middle 11.0 (9.5, 12.7) 12.9 (10.2, 16.3) 10.3 (8.8, 12.0) High 10.8 (9.5, 12.3) 12.2 (9.5, 15.5) 10.3 (8.9, 12.0) Highest 10.6 (9.2, 12.2) 11.0 (8.5, 14.2) 10.5 (8.9, 12.4)
9-20 Knowledge, attitudes and perceptions
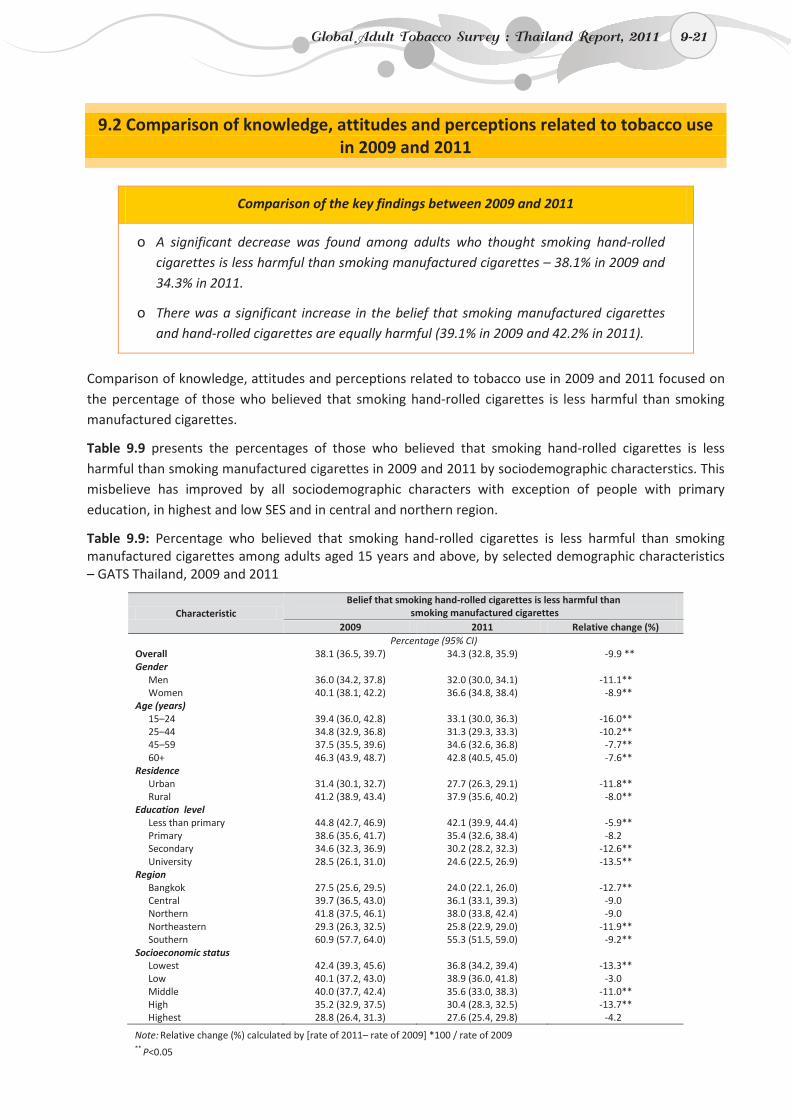
9-21
9.2 Comparison of knowledge, attitudes and perceptions related to tobacco use in 2009 and 2011
Comparison of the key findings between 2009 and 2011
o A significant decrease was found among adults who thought smoking hand-rolled cigarettes is less harmful than smoking manufactured cigarettes – 38.1% in 2009 and 34.3% in 2011.
o There was a significant increase in the belief that smoking manufactured cigarettes and hand-rolled cigarettes are equally harmful (39.1% in 2009 and 42.2% in 2011).
Comparison of knowledge, attitudes and perceptions related to tobacco use in 2009 and 2011 focused on the percentage of those who believed that smoking hand-rolled cigarettes is less harmful than smoking manufactured cigarettes.
Table 9.9 presents the percentages of those who believed that smoking hand-rolled cigarettes is less harmful than smoking manufactured cigarettes in 2009 and 2011 by sociodemographic characterstics. This misbelieve has improved by all sociodemographic characters with exception of people with primary education, in highest and low SES and in central and northern region.
Table 9.9: Percentage who believed that smoking hand-rolled cigarettes is less harmful than smoking manufactured cigarettes among adults aged 15 years and above, by selected demographic characteristics – GATS Thailand, 2009 and 2011
Characteristic Belief that smoking hand-rolled cigarettes is less harmful than
smoking manufactured cigarettes 2009 2011 Relative change (%)
Percentage (95% CI) Overall 38.1 (36.5, 39.7) 34.3 (32.8, 35.9) -9.9 ** Gender
Men 36.0 (34.2, 37.8) 32.0 (30.0, 34.1) -11.1** Women 40.1 (38.1, 42.2) 36.6 (34.8, 38.4) -8.9**
Age (years) 15–24 39.4 (36.0, 42.8) 33.1 (30.0, 36.3) -16.0** 25–44 34.8 (32.9, 36.8) 31.3 (29.3, 33.3) -10.2** 45–59 37.5 (35.5, 39.6) 34.6 (32.6, 36.8) -7.7** 60+ 46.3 (43.9, 48.7) 42.8 (40.5, 45.0) -7.6**
Residence Urban 31.4 (30.1, 32.7) 27.7 (26.3, 29.1) -11.8** Rural 41.2 (38.9, 43.4) 37.9 (35.6, 40.2) -8.0**
Education level Less than primary 44.8 (42.7, 46.9) 42.1 (39.9, 44.4) -5.9** Primary 38.6 (35.6, 41.7) 35.4 (32.6, 38.4) -8.2 Secondary 34.6 (32.3, 36.9) 30.2 (28.2, 32.3) -12.6** University 28.5 (26.1, 31.0) 24.6 (22.5, 26.9) -13.5**
Region Bangkok 27.5 (25.6, 29.5) 24.0 (22.1, 26.0) -12.7** Central 39.7 (36.5, 43.0) 36.1 (33.1, 39.3) -9.0 Northern 41.8 (37.5, 46.1) 38.0 (33.8, 42.4) -9.0 Northeastern 29.3 (26.3, 32.5) 25.8 (22.9, 29.0) -11.9** Southern 60.9 (57.7, 64.0) 55.3 (51.5, 59.0) -9.2**
Socioeconomic status Lowest 42.4 (39.3, 45.6) 36.8 (34.2, 39.4) -13.3** Low 40.1 (37.2, 43.0) 38.9 (36.0, 41.8) -3.0 Middle 40.0 (37.7, 42.4) 35.6 (33.0, 38.3) -11.0** High 35.2 (32.9, 37.5) 30.4 (28.3, 32.5) -13.7** Highest 28.8 (26.4, 31.3) 27.6 (25.4, 29.8) -4.2
Note: Relative change (%) calculated by [rate of 2011– rate of 2009] *100 / rate of 2009 ** P<0.05
Global Adult Tobacco Survey : Thailand Report, 2011 9-21
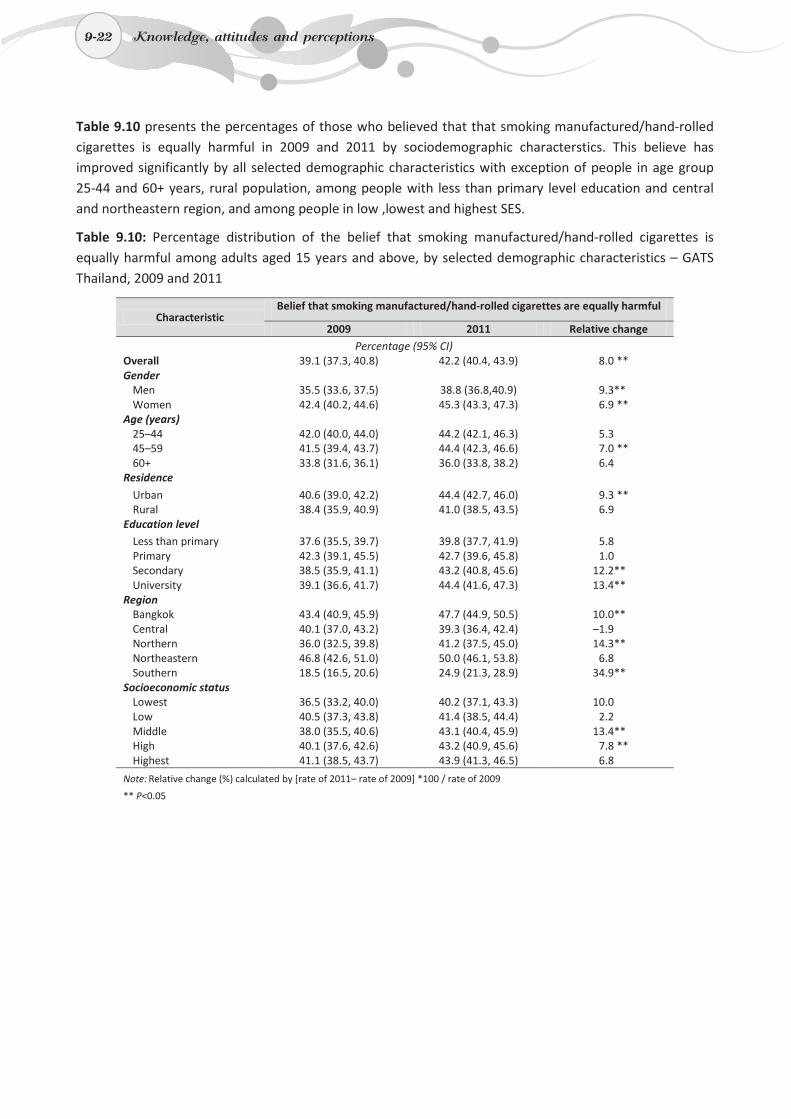
9-22
Table 9.10 presents the percentages of those who believed that that smoking manufactured/hand-rolled cigarettes is equally harmful in 2009 and 2011 by sociodemographic characterstics. This believe has improved significantly by all selected demographic characteristics with exception of people in age group 25-44 and 60+ years, rural population, among people with less than primary level education and central and northeastern region, and among people in low ,lowest and highest SES.
Table 9.10: Percentage distribution of the belief that smoking manufactured/hand-rolled cigarettes is equally harmful among adults aged 15 years and above, by selected demographic characteristics – GATS Thailand, 2009 and 2011
Characteristic Belief that smoking manufactured/hand-rolled cigarettes are equally harmful
2009 2011 Relative change Percentage (95% CI) Overall 39.1 (37.3, 40.8) 42.2 (40.4, 43.9) 8.0 ** Gender
Men 35.5 (33.6, 37.5) 38.8 (36.8,40.9) 9.3** Women 42.4 (40.2, 44.6) 45.3 (43.3, 47.3) 6.9 **
Age (years) 25–44 42.0 (40.0, 44.0) 44.2 (42.1, 46.3) 5.3 45–59 41.5 (39.4, 43.7) 44.4 (42.3, 46.6) 7.0 ** 60+ 33.8 (31.6, 36.1) 36.0 (33.8, 38.2) 6.4
Residence
Urban 40.6 (39.0, 42.2) 44.4 (42.7, 46.0) 9.3 ** Rural 38.4 (35.9, 40.9) 41.0 (38.5, 43.5) 6.9
Education level Less than primary 37.6 (35.5, 39.7) 39.8 (37.7, 41.9) 5.8 Primary 42.3 (39.1, 45.5) 42.7 (39.6, 45.8) 1.0 Secondary 38.5 (35.9, 41.1) 43.2 (40.8, 45.6) 12.2** University 39.1 (36.6, 41.7) 44.4 (41.6, 47.3) 13.4**
Region Bangkok 43.4 (40.9, 45.9) 47.7 (44.9, 50.5) 10.0** Central 40.1 (37.0, 43.2) 39.3 (36.4, 42.4) –1.9 Northern 36.0 (32.5, 39.8) 41.2 (37.5, 45.0) 14.3** Northeastern 46.8 (42.6, 51.0) 50.0 (46.1, 53.8) 6.8 Southern 18.5 (16.5, 20.6) 24.9 (21.3, 28.9) 34.9**
Socioeconomic status Lowest 36.5 (33.2, 40.0) 40.2 (37.1, 43.3) 10.0 Low 40.5 (37.3, 43.8) 41.4 (38.5, 44.4) 2.2 Middle 38.0 (35.5, 40.6) 43.1 (40.4, 45.9) 13.4** High 40.1 (37.6, 42.6) 43.2 (40.9, 45.6) 7.8 ** Highest 41.1 (38.5, 43.7) 43.9 (41.3, 46.5) 6.8
Note: Relative change (%) calculated by [rate of 2011– rate of 2009] *100 / rate of 2009
** P<0.05
9-22 Knowledge, attitudes and perceptions
10. Conclusion and Recommendations
10-1
10. Conclusion and Recommendations
10.1 Conclusion The Global Adult Tobacco Survey (GATS) uses a standard protocol that ensures quality over time as well as international comparability. A similar multi-stage, geographically clustered sample design was used to produce nationally representative data in both 2009 and 2011. The primary sampling units (PSUs) which were the enumeration areas (EAs) in 2009 were used as the PSUs in 2011. New sampled households were selected.
A total household count of 22 144 in 2009 and 21 488 in 2011 were sampled and one individual was randomly selected from each participating household to complete the survey. Survey information was collected electronically using handheld devices. A total of 20 566 in 2009, and 20 606 in 2011 individual surveys were completed with an overall response rate of 94.2% and 96.3%, respectively.
To produce the most reliable results through GATS 2011, the experience and the lessons learned during GATS 2009 were used. We adopted the following steps during GATS 2011:
1. Selection of an experienced survey team: a) In selecting field interviewers (FIs) for the GATS 2011, priority was given to those who had
experience in the GATS 2009. Moreover, all interviewers were fixed-term staff of the National Statistical Office (NSO) who had routine responsibility for household listing and enumeration in at least 10 national-level projects per person per year. Not only did they have good skills, but they were also familiar with the survey areas.
b) The selection of 79 provincial technical officers (PTOs) and 10 field supervisors (FSs) from the central office was almost entirely from the GATS 2009, except those who were new staff, accounting for 35.5% and 40.0%, respectively. They received a separate comprehensive training.
2. Capacity building of field staff: The factors for the success of capacity building for this GATS were as follows: a) A two-day refreshed training course was provided for staff who had experience in the GATS
2009 and a comprehensive three-day training course for new staff. b) All trainers were from the GATS core team of GATS 2009 who had advanced understanding of
and experience in the survey process. Also, in-country as well as international experts in sampling, questionnaires and field implementation served as the resource persons for training.
c) Training was imparted mostly in the Thai language. Part of the training given in English was translated into the Thai language for better understanding of the trainees.
d) Each session was interactive with question and answers. e) The training process gave emphasis to the clear explanation of the questionnaire, including
building up skills by practising, checking accuracy in making code records, training on how to ask each question to get the most reliable answer, and developing training modules.
f) Assessment of the effectiveness of training was done by the interactive checking of questions during training, and by checking the level of understanding of the questionnaire and steps of household enumeration.
Global Adult Tobacco Survey : Thailand Report, 2011 10-1
10-2
3. The application program for data recording: The development of the survey program not only helped the survey team understand the questionnaire in depth, but it also helped in developing a more complex program to improve program efficiency in the dimension of consistency within a record. The outcome was a reduction in workload and time saved during the process of data cleaning. However, the development of the program could not be too complex because the pocket PCs used had a low technical specification after two years of use. The large program affected the speed in opening the GATS program and saving data at the end of the survey.
4. Monitoring the quality of work in the field: Regular and continuous monitoring in the field, especially during the first one to two weeks of the survey, was a very important activity to check how well the FIs understood each question, whether the questions were good enough to obtain reliable answers, and whether there were any problems detected in the field in order to make any immediate corrections.
The process of monitoring field work was undertaken by PTOs and FSs, using several methods, for example, physical field visits, communicating by telephone and electronic mail, and small group meetings every week.
Four main areas of monitoring were (1) progress in data collection, in terms of the number of completed interviews, comparing the amount of work done during the past one week with the target, and any reasons that were causing irregularity in data collection; (2) problems in accessing households and respondents; (3) problems with the pocket PC; and (4) problems with transferring data and quality checking of weekly transferred data.
5. Other precautions: Other examples of unexpected problems or problems beyond control: a) Illness or absence of survey staff: There was a lesson learned that in every selected area, there
should be some trained substitutes who are ready to replace the original FI when he/she cannot perform the task. In case of Thailand, PTOs who had been trained were used as substitutes.
b) Heavy floods in many provinces of Thailand during the field survey period were the main cause of delay of the survey. Moreover, cooperation from respondents was lower during this tragic situation. In order to solve the problem, the PTOs, as senior officers, were sent into areas ahead of the FI to seek cooperation from respondents and ask for their permission to send FIs to interview them. With this approach, the team received satisfactory cooperation.
10-2 Conclusion and Recommendations
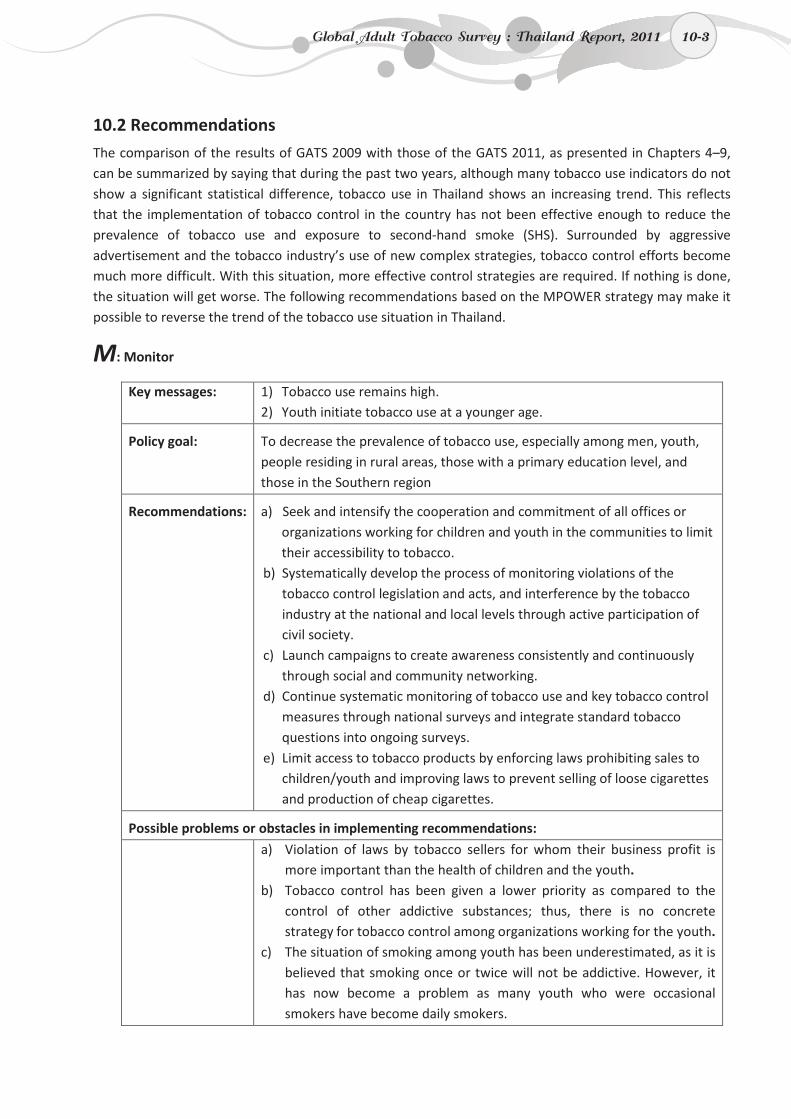
10-3
10.2 Recommendations The comparison of the results of GATS 2009 with those of the GATS 2011, as presented in Chapters 4–9, can be summarized by saying that during the past two years, although many tobacco use indicators do not show a significant statistical difference, tobacco use in Thailand shows an increasing trend. This reflects that the implementation of tobacco control in the country has not been effective enough to reduce the prevalence of tobacco use and exposure to second-hand smoke (SHS). Surrounded by aggressive advertisement and the tobacco industry’s use of new complex strategies, tobacco control efforts become much more difficult. With this situation, more effective control strategies are required. If nothing is done, the situation will get worse. The following recommendations based on the MPOWER strategy may make it possible to reverse the trend of the tobacco use situation in Thailand.
M: Monitor
Key messages: 1) Tobacco use remains high. 2) Youth initiate tobacco use at a younger age.
Policy goal: To decrease the prevalence of tobacco use, especially among men, youth, people residing in rural areas, those with a primary education level, and those in the Southern region
Recommendations:
a) Seek and intensify the cooperation and commitment of all offices or organizations working for children and youth in the communities to limit their accessibility to tobacco.
b) Systematically develop the process of monitoring violations of the tobacco control legislation and acts, and interference by the tobacco industry at the national and local levels through active participation of civil society.
c) Launch campaigns to create awareness consistently and continuously through social and community networking.
d) Continue systematic monitoring of tobacco use and key tobacco control measures through national surveys and integrate standard tobacco questions into ongoing surveys.
e) Limit access to tobacco products by enforcing laws prohibiting sales to children/youth and improving laws to prevent selling of loose cigarettes and production of cheap cigarettes.
Possible problems or obstacles in implementing recommendations:
a) Violation of laws by tobacco sellers for whom their business profit is more important than the health of children and the youth.
b) Tobacco control has been given a lower priority as compared to the control of other addictive substances; thus, there is no concrete strategy for tobacco control among organizations working for the youth.
c) The situation of smoking among youth has been underestimated, as it is believed that smoking once or twice will not be addictive. However, it has now become a problem as many youth who were occasional smokers have become daily smokers.
Global Adult Tobacco Survey : Thailand Report, 2011 10-3
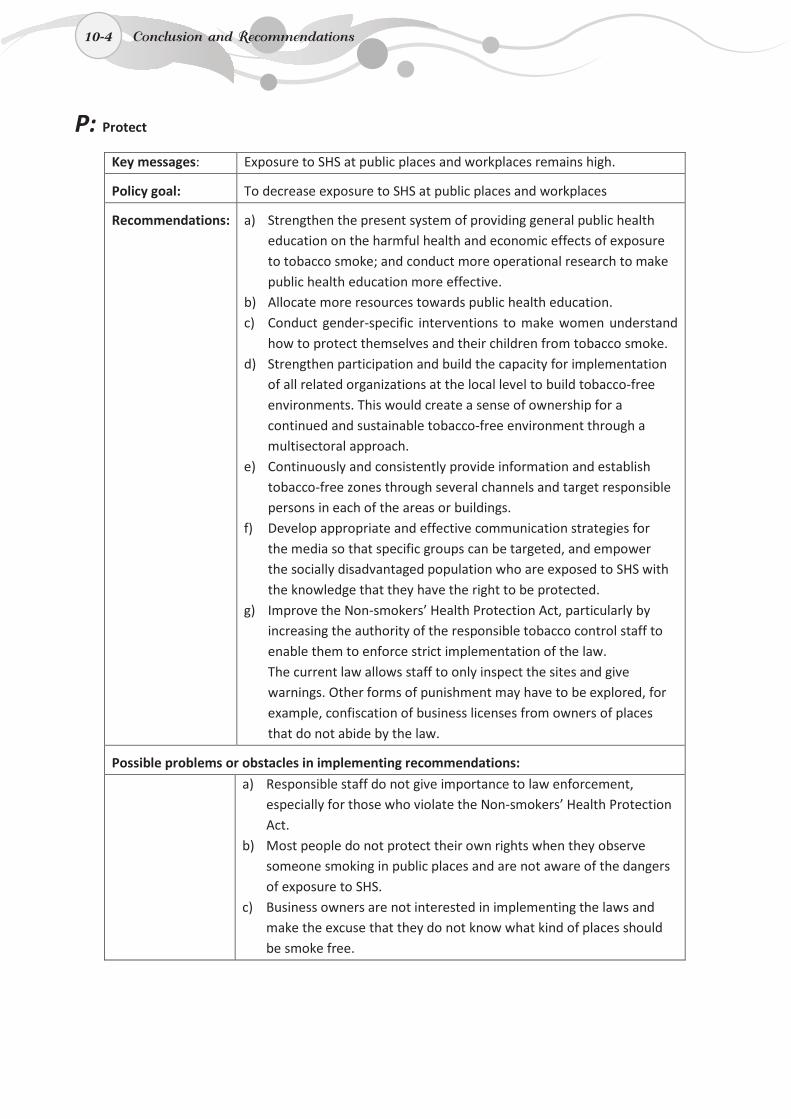
10-4
P: Protect
Key messages: Exposure to SHS at public places and workplaces remains high.
Policy goal: To decrease exposure to SHS at public places and workplaces
Recommendations:
a) Strengthen the present system of providing general public health education on the harmful health and economic effects of exposure to tobacco smoke; and conduct more operational research to make public health education more effective.
b) Allocate more resources towards public health education. c) Conduct gender-specific interventions to make women understand
how to protect themselves and their children from tobacco smoke. d) Strengthen participation and build the capacity for implementation
of all related organizations at the local level to build tobacco-free environments. This would create a sense of ownership for a continued and sustainable tobacco-free environment through a multisectoral approach.
e) Continuously and consistently provide information and establish tobacco-free zones through several channels and target responsible persons in each of the areas or buildings.
f) Develop appropriate and effective communication strategies for the media so that specific groups can be targeted, and empower the socially disadvantaged population who are exposed to SHS with the knowledge that they have the right to be protected.
g) Improve the Non-smokers’ Health Protection Act, particularly by increasing the authority of the responsible tobacco control staff to enable them to enforce strict implementation of the law. The current law allows staff to only inspect the sites and give warnings. Other forms of punishment may have to be explored, for example, confiscation of business licenses from owners of places that do not abide by the law.
Possible problems or obstacles in implementing recommendations:
a) Responsible staff do not give importance to law enforcement, especially for those who violate the Non-smokers’ Health Protection Act.
b) Most people do not protect their own rights when they observe someone smoking in public places and are not aware of the dangers of exposure to SHS.
c) Business owners are not interested in implementing the laws and make the excuse that they do not know what kind of places should be smoke free.
10-4 Conclusion and Recommendations
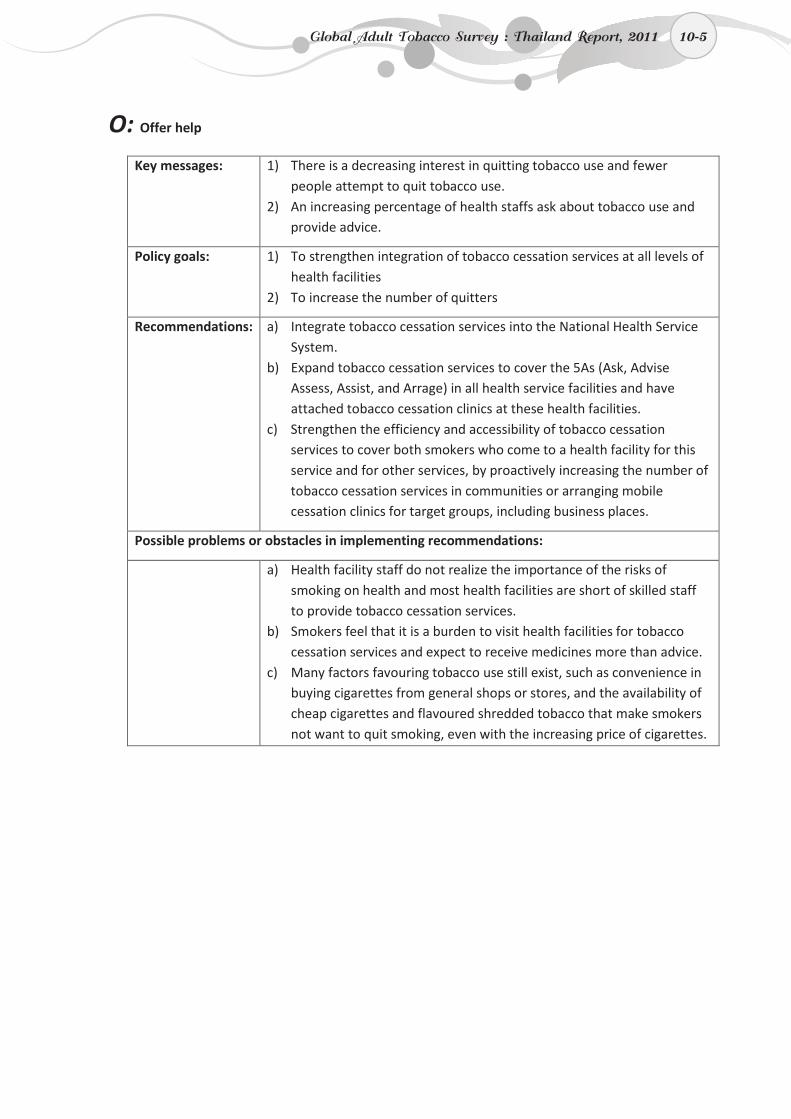
10-5
O: Offer help
Key messages: 1) There is a decreasing interest in quitting tobacco use and fewer people attempt to quit tobacco use.
2) An increasing percentage of health staffs ask about tobacco use and provide advice.
Policy goals: 1) To strengthen integration of tobacco cessation services at all levels of health facilities
2) To increase the number of quitters
Recommendations:
a) Integrate tobacco cessation services into the National Health Service System.
b) Expand tobacco cessation services to cover the 5As (Ask, Advise Assess, Assist, and Arrage) in all health service facilities and have attached tobacco cessation clinics at these health facilities.
c) Strengthen the efficiency and accessibility of tobacco cessation services to cover both smokers who come to a health facility for this service and for other services, by proactively increasing the number of tobacco cessation services in communities or arranging mobile cessation clinics for target groups, including business places.
Possible problems or obstacles in implementing recommendations:
a) Health facility staff do not realize the importance of the risks of smoking on health and most health facilities are short of skilled staff to provide tobacco cessation services.
b) Smokers feel that it is a burden to visit health facilities for tobacco cessation services and expect to receive medicines more than advice.
c) Many factors favouring tobacco use still exist, such as convenience in buying cigarettes from general shops or stores, and the availability of cheap cigarettes and flavoured shredded tobacco that make smokers not want to quit smoking, even with the increasing price of cigarettes.
Global Adult Tobacco Survey : Thailand Report, 2011 10-5
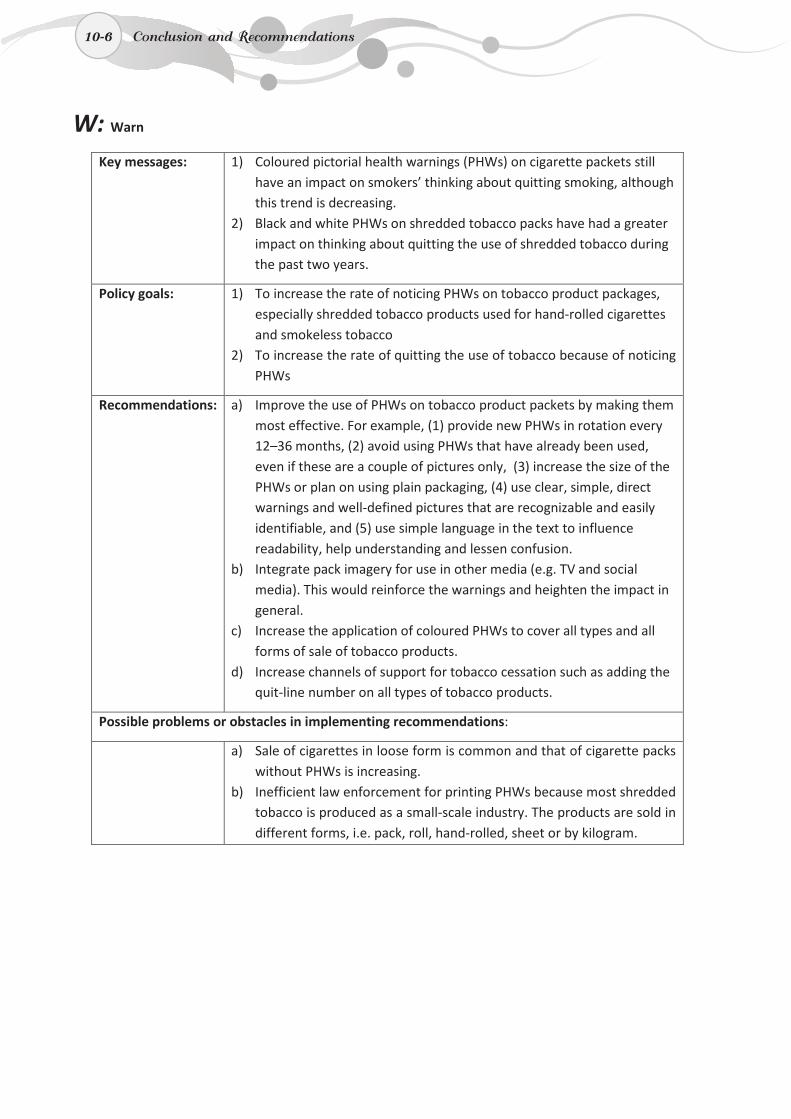
10-6
W: Warn
Key messages: 1) Coloured pictorial health warnings (PHWs) on cigarette packets still have an impact on smokers’ thinking about quitting smoking, although this trend is decreasing.
2) Black and white PHWs on shredded tobacco packs have had a greater impact on thinking about quitting the use of shredded tobacco during the past two years.
Policy goals: 1) To increase the rate of noticing PHWs on tobacco product packages, especially shredded tobacco products used for hand-rolled cigarettes and smokeless tobacco
2) To increase the rate of quitting the use of tobacco because of noticing PHWs
Recommendations: a) Improve the use of PHWs on tobacco product packets by making them most effective. For example, (1) provide new PHWs in rotation every 12–36 months, (2) avoid using PHWs that have already been used, even if these are a couple of pictures only, (3) increase the size of the PHWs or plan on using plain packaging, (4) use clear, simple, direct warnings and well-defined pictures that are recognizable and easily identifiable, and (5) use simple language in the text to influence readability, help understanding and lessen confusion.
b) Integrate pack imagery for use in other media (e.g. TV and social media). This would reinforce the warnings and heighten the impact in general.
c) Increase the application of coloured PHWs to cover all types and all forms of sale of tobacco products.
d) Increase channels of support for tobacco cessation such as adding the quit-line number on all types of tobacco products.
Possible problems or obstacles in implementing recommendations:
a) Sale of cigarettes in loose form is common and that of cigarette packs without PHWs is increasing.
b) Inefficient law enforcement for printing PHWs because most shredded tobacco is produced as a small-scale industry. The products are sold in different forms, i.e. pack, roll, hand-rolled, sheet or by kilogram.
10-6 Conclusion and Recommendations
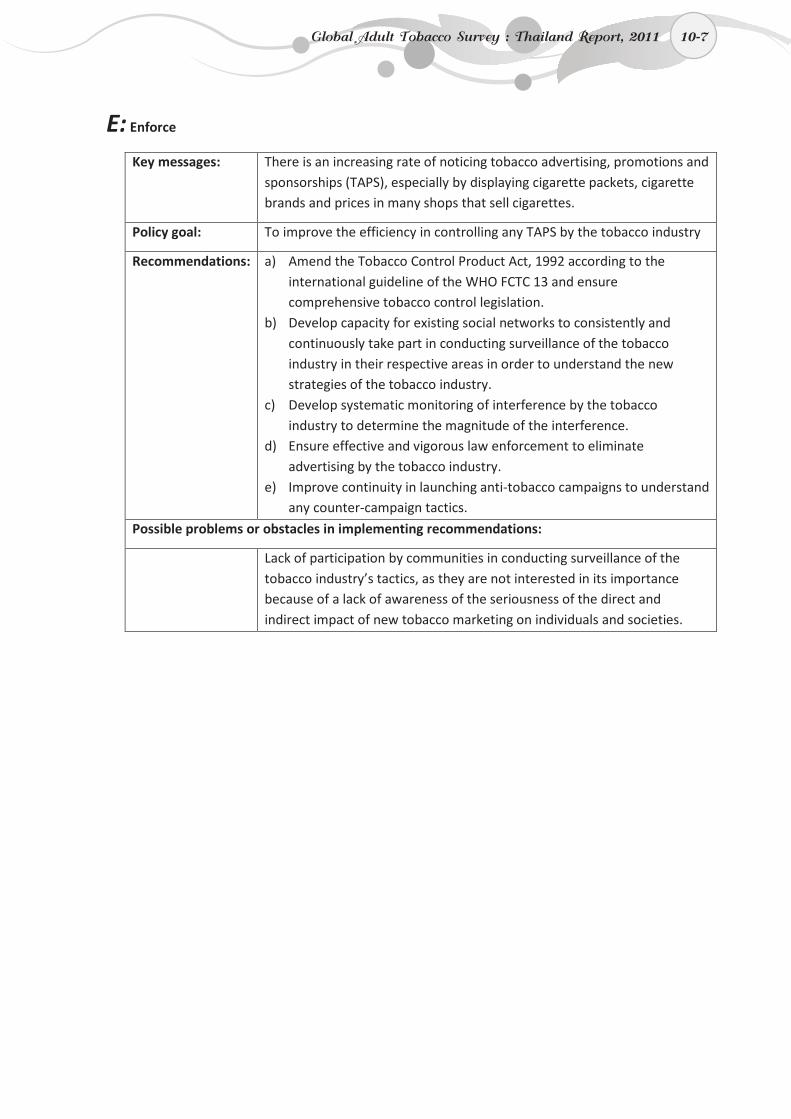
10-7
E: Enforce
Key messages: There is an increasing rate of noticing tobacco advertising, promotions and sponsorships (TAPS), especially by displaying cigarette packets, cigarette brands and prices in many shops that sell cigarettes.
Policy goal: To improve the efficiency in controlling any TAPS by the tobacco industry
Recommendations:
a) Amend the Tobacco Control Product Act, 1992 according to the international guideline of the WHO FCTC 13 and ensure comprehensive tobacco control legislation.
b) Develop capacity for existing social networks to consistently and continuously take part in conducting surveillance of the tobacco industry in their respective areas in order to understand the new strategies of the tobacco industry.
c) Develop systematic monitoring of interference by the tobacco industry to determine the magnitude of the interference.
d) Ensure effective and vigorous law enforcement to eliminate advertising by the tobacco industry.
e) Improve continuity in launching anti-tobacco campaigns to understand any counter-campaign tactics.
Possible problems or obstacles in implementing recommendations:
Lack of participation by communities in conducting surveillance of the tobacco industry’s tactics, as they are not interested in its importance because of a lack of awareness of the seriousness of the direct and indirect impact of new tobacco marketing on individuals and societies.
Global Adult Tobacco Survey : Thailand Report, 2011 10-7
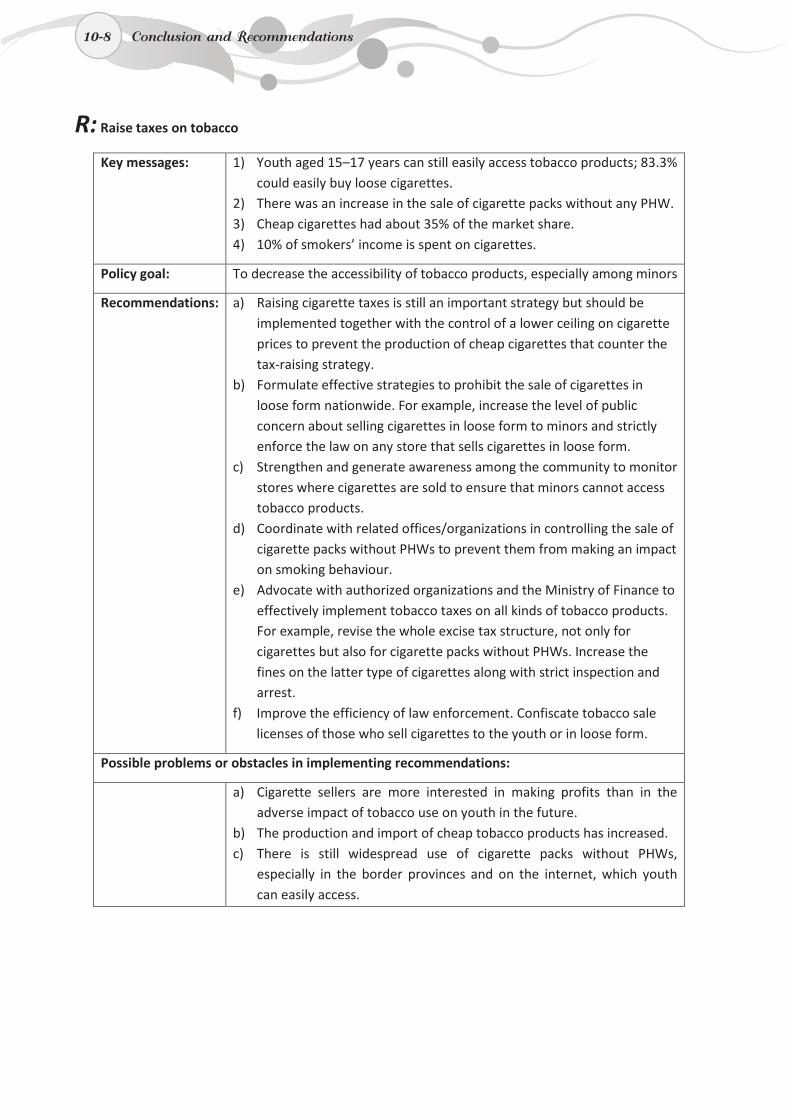
10-8
R: Raise taxes on tobacco
Key messages: 1) Youth aged 15–17 years can still easily access tobacco products; 83.3% could easily buy loose cigarettes.
2) There was an increase in the sale of cigarette packs without any PHW. 3) Cheap cigarettes had about 35% of the market share. 4) 10% of smokers’ income is spent on cigarettes.
Policy goal: To decrease the accessibility of tobacco products, especially among minors
Recommendations:
a) Raising cigarette taxes is still an important strategy but should be implemented together with the control of a lower ceiling on cigarette prices to prevent the production of cheap cigarettes that counter the tax-raising strategy.
b) Formulate effective strategies to prohibit the sale of cigarettes in loose form nationwide. For example, increase the level of public concern about selling cigarettes in loose form to minors and strictly enforce the law on any store that sells cigarettes in loose form.
c) Strengthen and generate awareness among the community to monitor stores where cigarettes are sold to ensure that minors cannot access tobacco products.
d) Coordinate with related offices/organizations in controlling the sale of cigarette packs without PHWs to prevent them from making an impact on smoking behaviour.
e) Advocate with authorized organizations and the Ministry of Finance to effectively implement tobacco taxes on all kinds of tobacco products. For example, revise the whole excise tax structure, not only for cigarettes but also for cigarette packs without PHWs. Increase the fines on the latter type of cigarettes along with strict inspection and arrest.
f) Improve the efficiency of law enforcement. Confiscate tobacco sale licenses of those who sell cigarettes to the youth or in loose form.
Possible problems or obstacles in implementing recommendations:
a) Cigarette sellers are more interested in making profits than in the adverse impact of tobacco use on youth in the future.
b) The production and import of cheap tobacco products has increased. c) There is still widespread use of cigarette packs without PHWs,
especially in the border provinces and on the internet, which youth can easily access.
10-8 Conclusion and Recommendations

References
R-1
References
1. Ekachampaka P, Wattanamano N. Thailand country profile. In: Wibulpolprasert S, ed. Thailand health profile 2008–2010. Bangkok, The War Veterans Organization of Thailand, 2011.
2. Bank of Thailand. Daily foreign exchange rates as of March 29, 2012. Bangkok. Available at: http://www.bot.or.th/Thai/Statistics/FinancialMarkets/ExchangeRate/_layouts/Application/ExchangeRate/ExchangeRate.aspx (accessed 30 March 2012).
3. Knoema. General indicator GDP statistics by country: Thailand World Economic Outlook. September 2011 Available at: http://knoema.com/tbocwag#Thailand (accessed 30 March 2012).
4. Bank of Thailand. Thailand’s macroeconomic indicators. Bangkok. Available at: http://www2.bot.or.th/statistics/BOTWEBSTAT.aspx?reportID=409&language=ENG (accessed 2 May 2012).
5. Ekachampaka P, Wattanamano N. Health status and health problems of Thai people. In: Wibulpolprasert S, ed. Thailand health profile 2008–2010. Bangkok, The War Veterans Organization of Thailand, 2011.
6. Ekachampaka P, Wattanamano N. Situation and trends of health determinants. In: Wibulpolprasert S, ed. Thailand health profile 2008–2010. Bangkok, The War Veterans Organization of Thailand, 2011.
7. Faramnuayphol P, Ekachampaka P, Taverat R. Health service systems in Thailand. In: Wibulpolprasert S, ed. Thailand health profile 2008–2010. Bangkok, The War Veterans Organization of Thailand, 2011.
8. Benjakul S et al. Situation and trend of tobacco use among Thai population, 1991–2009. Nonthaburi, Nice Earth Design, 2010.
9. National Statistical Office. Survey of smoking behavior in Thai population 2011. Bangkok, National Statistical Office, 2012.
10. Global Tobacco Survey Collaborative Group. Tobacco questions for surveys: a subset of key questions from the Global Adult Tobacco Survey (GATS), second edition. Atlanta, GA, CDC, 2010.
11. Bureau of Tobacco Control, Department of Disease Control, Ministry of Public Health, National Statistical Office (NSO) and Faculty of Public Health, Mahidol University. Global Adult Tobacco Survey (GATS): Thailand country report. Bangkok, Thailand, 2009.
12. Leartsakulpanitch J, Nganthavee W, Salole E. The economic burden of smoking-related diseases in Thailand: a prevalence-based analysis. Journal of the Medicine Association of Thailand, 2007, 90 (9):1925–1929.
13. World Health Organization. Global report on mortality attributable to tobacco. Geneva, WHO, 2012.
14. Ekachampaka P, Wattanamano N. Situation and trends of health determinants. In Wibulpolprasert S, ed. Thailand health profile 2005–2007. Bangkok, The War Veterans Organization of Thailand, 2008.
15. Thailand Tobacco Monopoly. Available at: http://www.thaitobacco.or.th/eng/ (accessed 3 May 2012).
16. Termsirikulchai L et al. Thailand tobacco control country profile. Bangkok, World Health Organization, Country Office for Thailand, 2008.
Global Adult Tobacco Survey : Thailand Report, 2011 R-1

R-2
17. World Health Organization. Parties to the WHO Framework Convention on Tobacco Control. Available at: http://www.who.int/fctc/signatories_parties/en/index.html (accessed 30 March 2012).
18. Ministry of Public Health. Notification of the Ministry of Public Health (No.19) B.E.2535 (A.D. 2010), Re: designating names or types of public places where non-smokers’ health is under protection and designating a zone or all areas of such places to be a smoking area or a non-smoking area pursuant to the Non-smoker's Health Protection Act B.E.2535 (A.D. 1992). Available at: http://btc.ddc.moph.go.th/cms/uploads/content/doc/Notification_No19_English.pdf (accessed 2 May 2012).
19. Ministry of Public Health. Notification of the Ministry of Public Health, Re: criteria, procedures and conditions for displaying labels and statements on labels of cigarettes B.E.2552 (A.D. 2009). Available at: http://btc.ddc.moph.go.th/cms/uploads/content/doc/10_Pictorial_Health_Warning__Final.pdf (accessed 2 May 2012).
20. Ministry of Public Health. Notification of the Ministry of Public Health (No.15) B.E.2554 (A.D. 2011), Re: criteria, procedures and conditions of words or statements revealing which may lead to misunderstanding or consumed motivation on the labels of cigarette, cigar, shredded tobacco or blended shredded tobacco pursuant to Tobacco Product Control Act B.E. 2535 (A.D.1992). Available at: http://btc.ddc.moph.go.th/cms/uploads/content/doc/Notification_No15_English.pdf (accessed 2 May 2012).
21. Ministry of Public Health. Notification of the Ministry of Public Health (No.16) B.E.2554 (A.D. 2011), Re: criteria, procedures and conditions for displaying the name of toxin and carcinogenic substances on labels of cigarettes issued under the Tobacco Products Control Act B.E.2535 (A.D.1992). Available at: http://btc.ddc.moph.go.th/cms/uploads/content/doc/12.pdf (accessed 2 May 2012).
22. Bureau of Tobacco Control. 5 years report for WHO FCTC in Thailand. Bureau of Tobacco Control. Department of Disease Control, 2009. (unpublished manuscript)
23. Bureau of Tobacco Control, Department of Disease Control, Ministry of Public Health. National strategic plan for tobacco control 2010–2014. Nonthaburi, Nice Earth Design, 2010.
24. Levy DT et al. The role of tobacco control policies in reducing smoking and deaths in a middle income nation: results from the Thailand SimSmoke simulation model. Tobacco Control Journal, 2008, 17:53–59.
25. Carpenter C, Cook PJ. Cigarette tax and youth smoking: new evidence from national, state, and local youth risk behavior surveys. Journal of Health Economics, 2008, 27 (2):287–299. Available at: http://www.nber.org/papers/w13046 (accessed 31 March 2012).
26. Frank JC, Rosalie LP. The impact of price on youth tobacco use. Available at: http://cancercontrol.cancer.gov/tcrb/monographs/14/m14_12.pdf (accessed 31 March 2012).
27. Global Adult Tobacco Survey Collaborative Group. Global Adult Tobacco Survey (GATS): core questionnaire with optional questions, version 2.0. Atlanta, GA, Centers for Disease Control and Prevention, 2010.
28. Office of the National Economic and Social Development Board (NESDB). Population projection for Thailand 2000–2030. Available at: http:www.nesdb.go.th (accessed 2 November 2009).
R-2 References

Appendix
A-1
Appendix A: Questionnaire
Global Adult Tobacco Survey (GATS)
Core Questionnaire,
Optional Questions and
Specific Questions
---------------------------------
THAILAND, 2011
Global Adult Tobacco Survey : Thailand Report, 2011 A-1
A-2
Contents
GATS Core Questionnaire Formatting Conventions .......................................................................... A-3 Household Questionnaire ............................................................................................................... A-4 Individual Questionnaire ................................................................................................................ A-6
Section A. Background Characteristics A-8 Section B. Tobacco Smoking A-11 Section C. Smokeless Tobacco A-17 Section D1. Cessation - Tobacco Smoking A-23 Section D2. Cessation - Smokeless Tobacco A-25 Section E. Secondhand Smoke A-27 Section F. Economics - Manufactured Cigarettes A-30 Section G. Media A-35 Section H. Knowledge, Attitudes & Perceptions A-38 Section I. Pictorial Health Warnings A-40 Section J. Economics - Shredded Tobacco Products used for hand-rolled cigarettes and
smokless tobacco A-42 End Individual Questionnaire A-44
A-2 Appendix A : Questionnaire
A-3
GATS Core Questionnaire Formatting Conventions
Text in RED FONT = Programming logic and skip instructions.
Text in BLUE ITALICS = Instructions for country-adaptations and wording fills.
Text in [BRACKETS] = Specific question instructions for interviewers—not to be read to the respondents.
Text surrounded by *asterisks* = Words that interviewers should emphasize when reading to respondents.
Item number in YELLOW MARKER = Selected optional questionnaires.
Item number in GREEN MARKER = Specific questionnaires.
Global Adult Tobacco Survey : Thailand Report, 2011 A-3
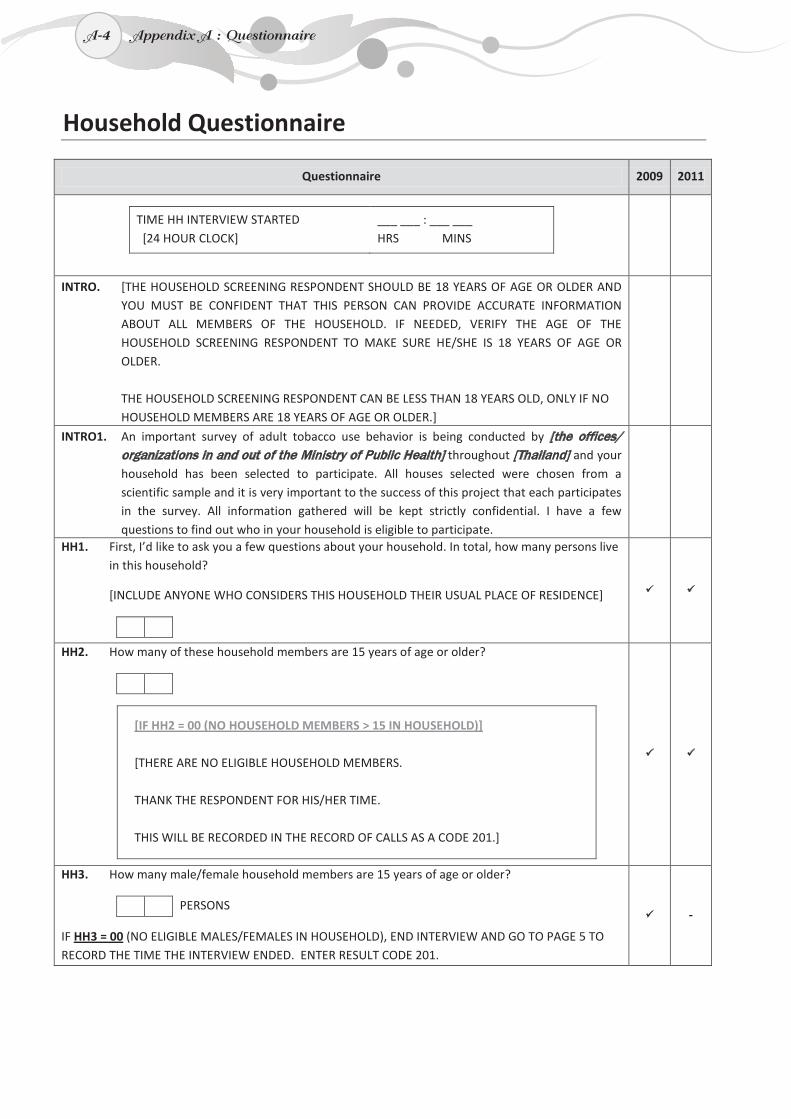
A-4
Household Questionnaire
Questionnaire 2009 2011
TIME HH INTERVIEW STARTED [24 HOUR CLOCK]
___ ___ : ___ ___ HRS MINS
INTRO. [THE HOUSEHOLD SCREENING RESPONDENT SHOULD BE 18 YEARS OF AGE OR OLDER AND YOU MUST BE CONFIDENT THAT THIS PERSON CAN PROVIDE ACCURATE INFORMATION ABOUT ALL MEMBERS OF THE HOUSEHOLD. IF NEEDED, VERIFY THE AGE OF THE HOUSEHOLD SCREENING RESPONDENT TO MAKE SURE HE/SHE IS 18 YEARS OF AGE OR OLDER.
THE HOUSEHOLD SCREENING RESPONDENT CAN BE LESS THAN 18 YEARS OLD, ONLY IF NO HOUSEHOLD MEMBERS ARE 18 YEARS OF AGE OR OLDER.]
INTRO1. An important survey of adult tobacco use behavior is being conducted by [the offices/ organizations in and out of the Ministry of Public Health] throughout [Thailand] and your household has been selected to participate. All houses selected were chosen from a scientific sample and it is very important to the success of this project that each participates in the survey. All information gathered will be kept strictly confidential. I have a few questions to find out who in your household is eligible to participate.
HH1. First, I’d like to ask you a few questions about your household. In total, how many persons live in this household?
[INCLUDE ANYONE WHO CONSIDERS THIS HOUSEHOLD THEIR USUAL PLACE OF RESIDENCE]
HH2. How many of these household members are 15 years of age or older?
[IF HH2 = 00 (NO HOUSEHOLD MEMBERS > 15 IN HOUSEHOLD)] [THERE ARE NO ELIGIBLE HOUSEHOLD MEMBERS. THANK THE RESPONDENT FOR HIS/HER TIME. THIS WILL BE RECORDED IN THE RECORD OF CALLS AS A CODE 201.]
HH3. How many male/female household members are 15 years of age or older?
PERSONS
IF HH3 = 00 (NO ELIGIBLE MALES/FEMALES IN HOUSEHOLD), END INTERVIEW AND GO TO PAGE 5 TO RECORD THE TIME THE INTERVIEW ENDED. ENTER RESULT CODE 201.
-
A-4 Appendix A : Questionnaire
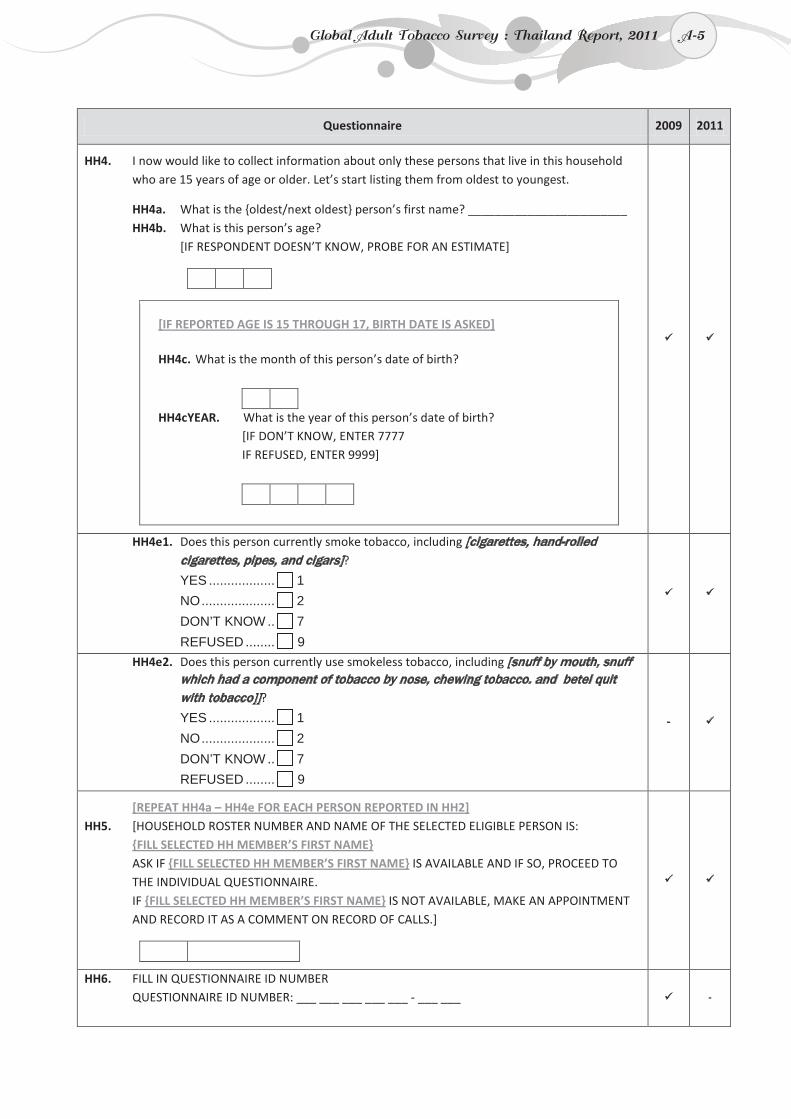
A-5
Questionnaire 2009 2011
HH4. I now would like to collect information about only these persons that live in this household who are 15 years of age or older. Let’s start listing them from oldest to youngest.
HH4a. What is the {oldest/next oldest} person’s first name? ________________________ HH4b. What is this person’s age?
[IF RESPONDENT DOESN’T KNOW, PROBE FOR AN ESTIMATE]
[IF REPORTED AGE IS 15 THROUGH 17, BIRTH DATE IS ASKED]
HH4c. What is the month of this person’s date of birth?
HH4cYEAR. What is the year of this person’s date of birth? [IF DON’T KNOW, ENTER 7777 IF REFUSED, ENTER 9999]
HH4e1. Does this person currently smoke tobacco, including [cigarettes, hand-rolled cigarettes, pipes, and cigars]?
YES .................. 1NO.................... 2
DON’T KNOW .. 7
REFUSED ........ 9
HH4e2. Does this person currently use smokeless tobacco, including [snuff by mouth, snuff which had a component of tobacco by nose, chewing tobacco. and betel quit with tobacco]]?
YES .................. 1NO.................... 2
DON’T KNOW .. 7
REFUSED ........ 9
-
[REPEAT HH4a – HH4e FOR EACH PERSON REPORTED IN HH2] HH5. [HOUSEHOLD ROSTER NUMBER AND NAME OF THE SELECTED ELIGIBLE PERSON IS:
{FILL SELECTED HH MEMBER’S FIRST NAME} ASK IF {FILL SELECTED HH MEMBER’S FIRST NAME} IS AVAILABLE AND IF SO, PROCEED TO THE INDIVIDUAL QUESTIONNAIRE. IF {FILL SELECTED HH MEMBER’S FIRST NAME} IS NOT AVAILABLE, MAKE AN APPOINTMENT AND RECORD IT AS A COMMENT ON RECORD OF CALLS.]
HH6. FILL IN QUESTIONNAIRE ID NUMBER QUESTIONNAIRE ID NUMBER: ___ ___ ___ ___ ___ - ___ ___
-
Global Adult Tobacco Survey : Thailand Report, 2011 A-5
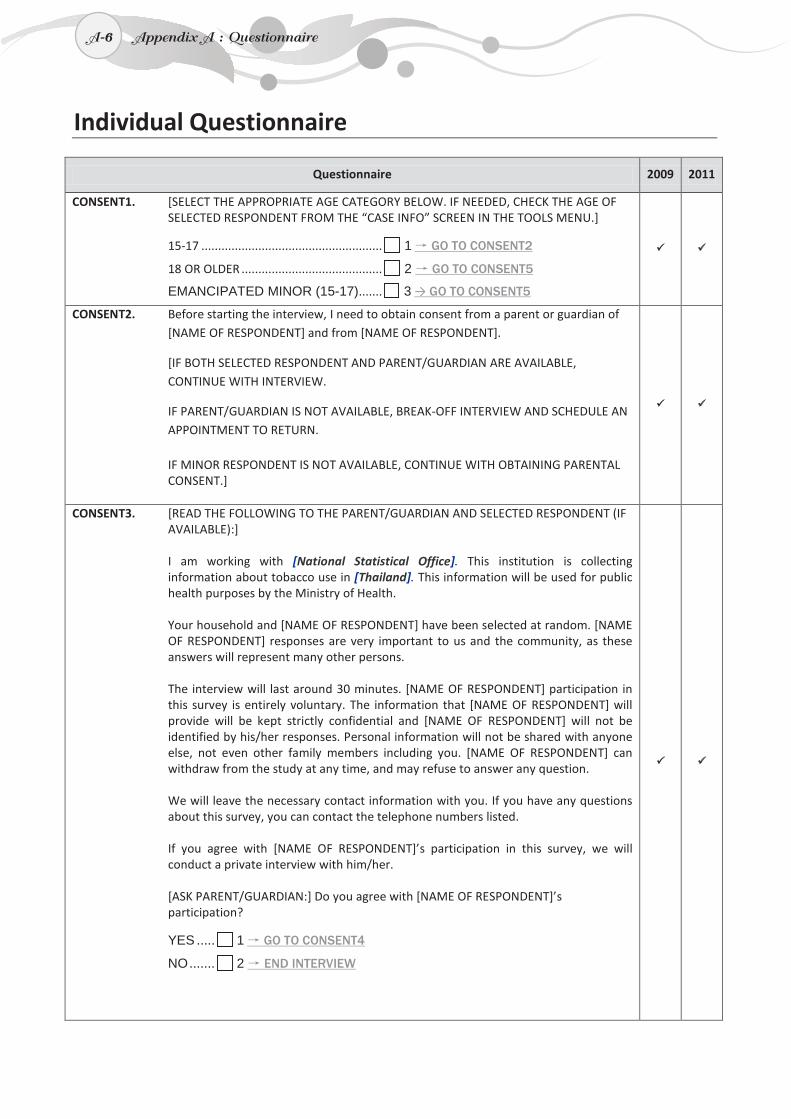
A-6
Individual Questionnaire
Questionnaire 2009 2011
CONSENT1. [SELECT THE APPROPRIATE AGE CATEGORY BELOW. IF NEEDED, CHECK THE AGE OF SELECTED RESPONDENT FROM THE “CASE INFO” SCREEN IN THE TOOLS MENU.]
15-17 ...................................................... 1 → GO TO CONSENT2
18 OR OLDER .......................................... 2 → GO TO CONSENT5
EMANCIPATED MINOR (15-17)....... 3 → GO TO CONSENT5
CONSENT2. Before starting the interview, I need to obtain consent from a parent or guardian of [NAME OF RESPONDENT] and from [NAME OF RESPONDENT].
[IF BOTH SELECTED RESPONDENT AND PARENT/GUARDIAN ARE AVAILABLE, CONTINUE WITH INTERVIEW.
IF PARENT/GUARDIAN IS NOT AVAILABLE, BREAK-OFF INTERVIEW AND SCHEDULE AN APPOINTMENT TO RETURN.
IF MINOR RESPONDENT IS NOT AVAILABLE, CONTINUE WITH OBTAINING PARENTAL CONSENT.]
CONSENT3. [READ THE FOLLOWING TO THE PARENT/GUARDIAN AND SELECTED RESPONDENT (IF AVAILABLE):]
I am working with [National Statistical Office]. This institution is collecting information about tobacco use in [Thailand]. This information will be used for public health purposes by the Ministry of Health.
Your household and [NAME OF RESPONDENT] have been selected at random. [NAME OF RESPONDENT] responses are very important to us and the community, as these answers will represent many other persons.
The interview will last around 30 minutes. [NAME OF RESPONDENT] participation in this survey is entirely voluntary. The information that [NAME OF RESPONDENT] will provide will be kept strictly confidential and [NAME OF RESPONDENT] will not be identified by his/her responses. Personal information will not be shared with anyone else, not even other family members including you. [NAME OF RESPONDENT] can withdraw from the study at any time, and may refuse to answer any question.
We will leave the necessary contact information with you. If you have any questions about this survey, you can contact the telephone numbers listed.
If you agree with [NAME OF RESPONDENT]’s participation in this survey, we will conduct a private interview with him/her.
[ASK PARENT/GUARDIAN:] Do you agree with [NAME OF RESPONDENT]’s participation?
YES ..... 1 → GO TO CONSENT4
NO....... 2 → END INTERVIEW
A-6 Appendix A : Questionnaire
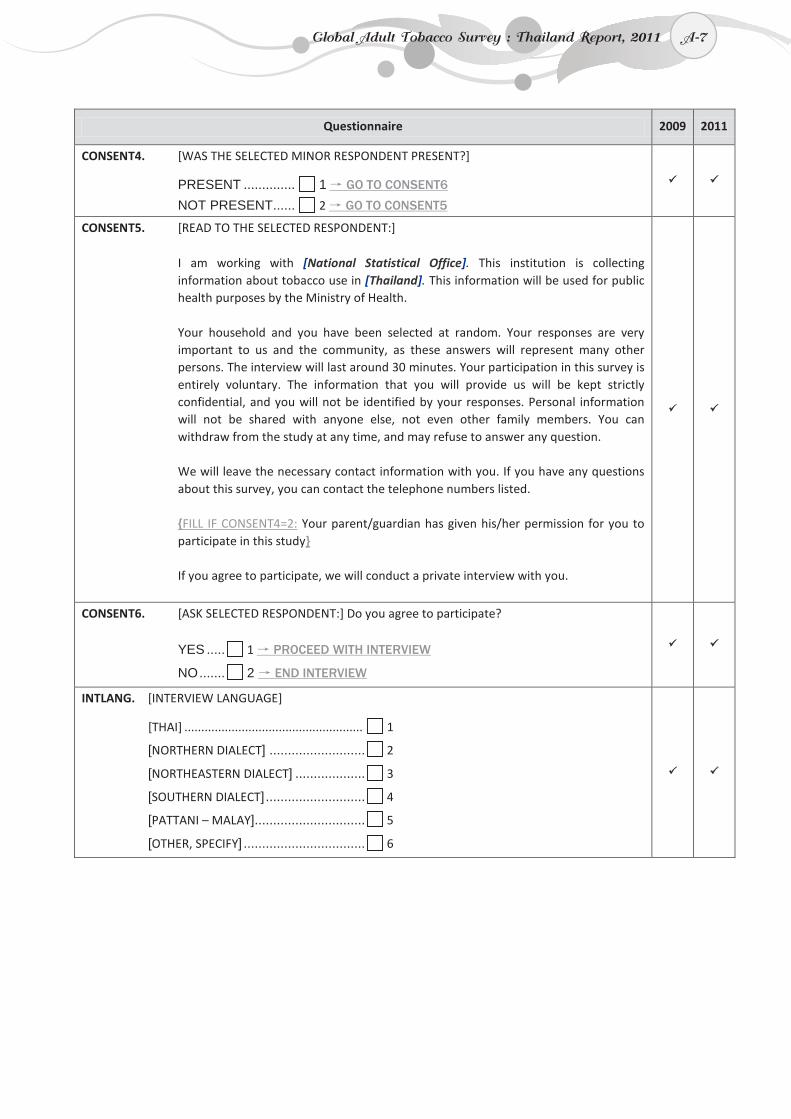
A-7
Questionnaire 2009 2011
CONSENT4. [WAS THE SELECTED MINOR RESPONDENT PRESENT?]
PRESENT .............. 1 → GO TO CONSENT6
NOT PRESENT...... 2 → GO TO CONSENT5
CONSENT5. [READ TO THE SELECTED RESPONDENT:]
I am working with [National Statistical Office]. This institution is collecting information about tobacco use in [Thailand]. This information will be used for public health purposes by the Ministry of Health.
Your household and you have been selected at random. Your responses are very important to us and the community, as these answers will represent many other persons. The interview will last around 30 minutes. Your participation in this survey is entirely voluntary. The information that you will provide us will be kept strictly confidential, and you will not be identified by your responses. Personal information will not be shared with anyone else, not even other family members. You can withdraw from the study at any time, and may refuse to answer any question.
We will leave the necessary contact information with you. If you have any questions about this survey, you can contact the telephone numbers listed.
{FILL IF CONSENT4=2: Your parent/guardian has given his/her permission for you to participate in this study}
If you agree to participate, we will conduct a private interview with you.
CONSENT6. [ASK SELECTED RESPONDENT:] Do you agree to participate?
YES ..... 1 → PROCEED WITH INTERVIEW
NO....... 2 → END INTERVIEW
INTLANG. [INTERVIEW LANGUAGE]
[THAI] ..................................................... 1
[NORTHERN DIALECT] .......................... 2
[NORTHEASTERN DIALECT] ................... 3
[SOUTHERN DIALECT] ........................... 4
[PATTANI – MALAY].............................. 5
[OTHER, SPECIFY] ................................. 6
Global Adult Tobacco Survey : Thailand Report, 2011 A-7
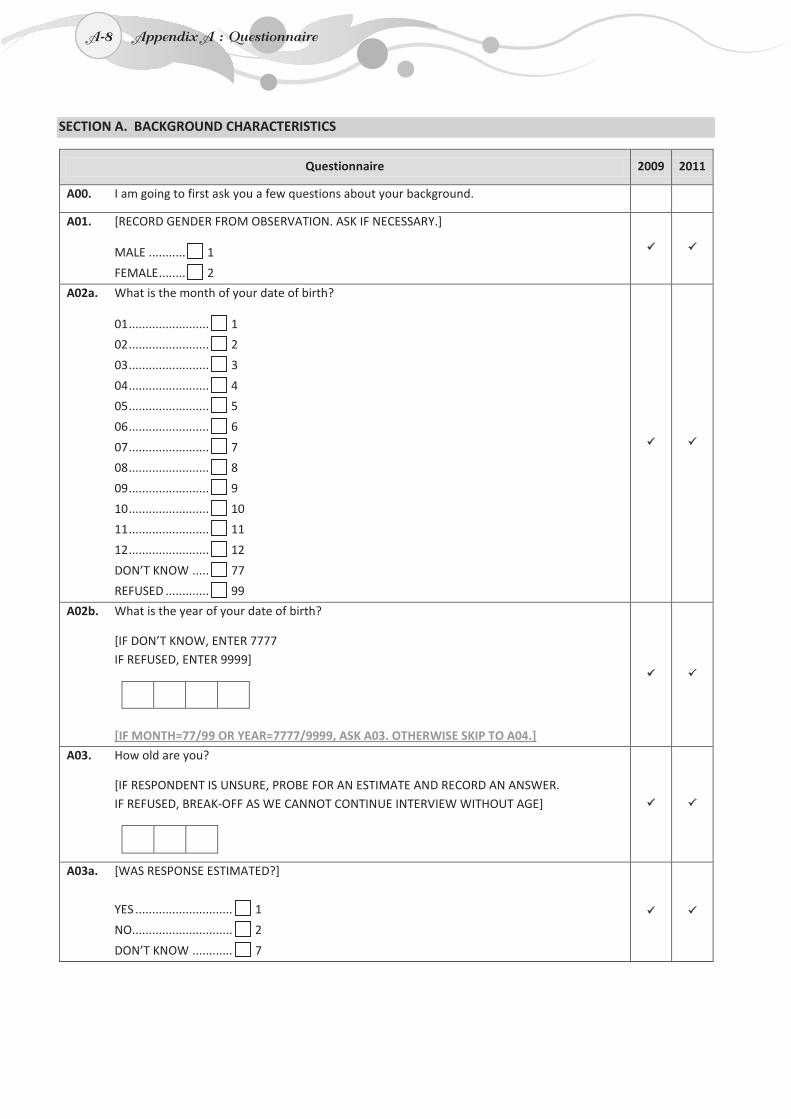
A-8
SECTION A. BACKGROUND CHARACTERISTICS
Questionnaire 2009 2011
A00. I am going to first ask you a few questions about your background.
A01. [RECORD GENDER FROM OBSERVATION. ASK IF NECESSARY.]
MALE ........... 1
FEMALE ........ 2
A02a. What is the month of your date of birth?
01 ........................ 1
02 ........................ 2
03 ........................ 3
04 ........................ 4
05 ........................ 5
06 ........................ 6
07 ........................ 7
08 ........................ 8
09 ........................ 9
10 ........................ 10
11 ........................ 11
12 ........................ 12
DON’T KNOW ..... 77
REFUSED ............. 99
A02b. What is the year of your date of birth?
[IF DON’T KNOW, ENTER 7777 IF REFUSED, ENTER 9999]
[IF MONTH=77/99 OR YEAR=7777/9999, ASK A03. OTHERWISE SKIP TO A04.]
A03. How old are you?
[IF RESPONDENT IS UNSURE, PROBE FOR AN ESTIMATE AND RECORD AN ANSWER. IF REFUSED, BREAK-OFF AS WE CANNOT CONTINUE INTERVIEW WITHOUT AGE]
A03a. [WAS RESPONSE ESTIMATED?]
YES ............................. 1
NO.............................. 2
DON’T KNOW ............ 7
A-8 Appendix A : Questionnaire
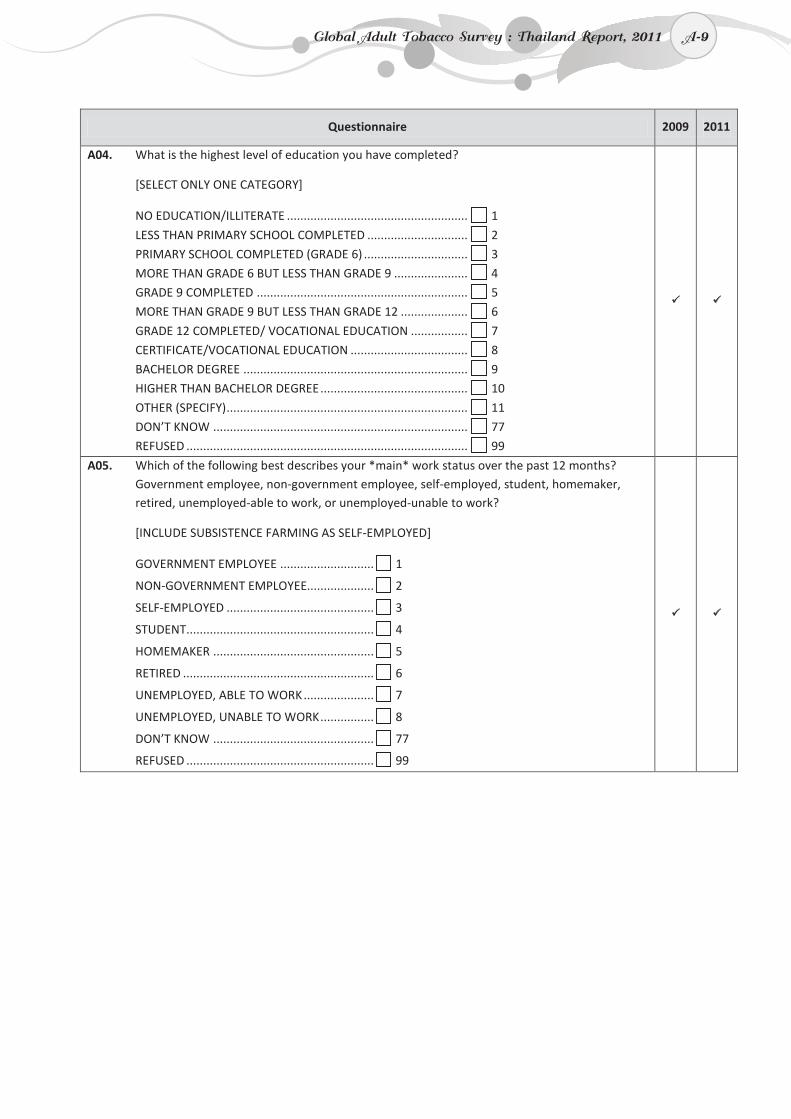
A-9
Questionnaire 2009 2011
A04. What is the highest level of education you have completed?
[SELECT ONLY ONE CATEGORY]
NO EDUCATION/ILLITERATE ...................................................... 1
LESS THAN PRIMARY SCHOOL COMPLETED .............................. 2
PRIMARY SCHOOL COMPLETED (GRADE 6) ............................... 3
MORE THAN GRADE 6 BUT LESS THAN GRADE 9 ...................... 4
GRADE 9 COMPLETED ............................................................... 5
MORE THAN GRADE 9 BUT LESS THAN GRADE 12 .................... 6
GRADE 12 COMPLETED/ VOCATIONAL EDUCATION ................. 7
CERTIFICATE/VOCATIONAL EDUCATION ................................... 8
BACHELOR DEGREE ................................................................... 9
HIGHER THAN BACHELOR DEGREE ............................................ 10
OTHER (SPECIFY) ........................................................................ 11
DON’T KNOW ............................................................................ 77
REFUSED .................................................................................... 99
A05. Which of the following best describes your *main* work status over the past 12 months? Government employee, non-government employee, self-employed, student, homemaker, retired, unemployed-able to work, or unemployed-unable to work?
[INCLUDE SUBSISTENCE FARMING AS SELF-EMPLOYED]
GOVERNMENT EMPLOYEE ............................ 1
NON-GOVERNMENT EMPLOYEE.................... 2
SELF-EMPLOYED ............................................ 3
STUDENT........................................................ 4
HOMEMAKER ................................................ 5
RETIRED ......................................................... 6
UNEMPLOYED, ABLE TO WORK ..................... 7
UNEMPLOYED, UNABLE TO WORK ................ 8
DON’T KNOW ................................................ 77
REFUSED ........................................................ 99
Global Adult Tobacco Survey : Thailand Report, 2011 A-9
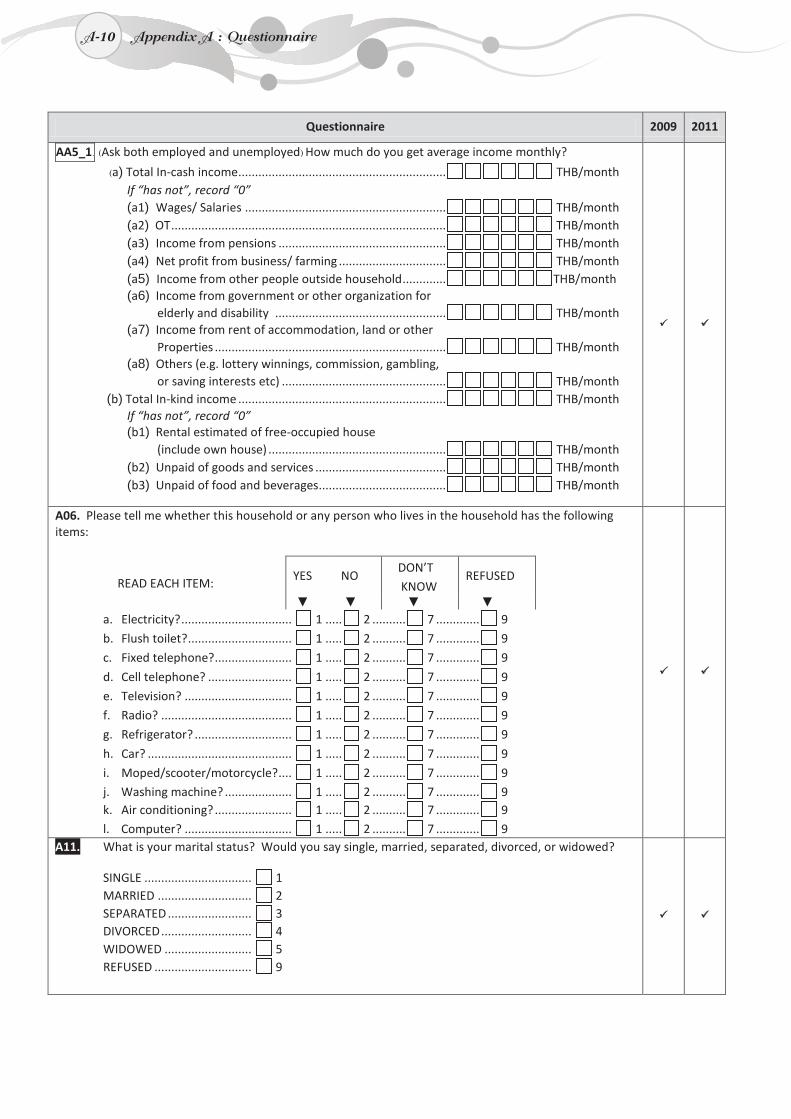
A-10
Questionnaire 2009 2011
AA5_1. (Ask both employed and unemployed) How much do you get average income monthly?
(a) Total In-cash income .............................................................. THB/month If “has not”, record “0” (a1) Wages/ Salaries ............................................................ THB/month (a2) OT .................................................................................. THB/month (a3) Income from pensions .................................................. THB/month (a4) Net profit from business/ farming ................................ THB/month (a5) Income from other people outside household ............. THB/month (a6) Income from government or other organization for elderly and disability ................................................... THB/month (a7) Income from rent of accommodation, land or other Properties ..................................................................... THB/month (a8) Others (e.g. lottery winnings, commission, gambling, or saving interests etc) ................................................. THB/month
(b) Total In-kind income .............................................................. THB/monthIf “has not”, record “0” (b1) Rental estimated of free-occupied house (include own house) ..................................................... THB/month (b2) Unpaid of goods and services ....................................... THB/month (b3) Unpaid of food and beverages ...................................... THB/month
A06. Please tell me whether this household or any person who lives in the household has the following items:
READ EACH ITEM: YES NO
DON’T
KNOW REFUSED
▼ ▼ ▼ ▼ a. Electricity? ................................. 1 ..... 2 .......... 7 ............. 9
b. Flush toilet? ............................... 1 ..... 2 .......... 7 ............. 9
c. Fixed telephone? ....................... 1 ..... 2 .......... 7 ............. 9
d. Cell telephone? ......................... 1 ..... 2 .......... 7 ............. 9
e. Television? ................................ 1 ..... 2 .......... 7 ............. 9
f. Radio? ....................................... 1 ..... 2 .......... 7 ............. 9
g. Refrigerator? ............................. 1 ..... 2 .......... 7 ............. 9
h. Car? ........................................... 1 ..... 2 .......... 7 ............. 9
i. Moped/scooter/motorcycle? .... 1 ..... 2 .......... 7 ............. 9
j. Washing machine? .................... 1 ..... 2 .......... 7 ............. 9 k. Air conditioning? ....................... 1 ..... 2 .......... 7 ............. 9
l. Computer? ................................ 1 ..... 2 .......... 7 ............. 9
A11. What is your marital status? Would you say single, married, separated, divorced, or widowed?
SINGLE ................................ 1 MARRIED ............................ 2 SEPARATED ......................... 3 DIVORCED ........................... 4 WIDOWED .......................... 5 REFUSED ............................. 9
A-10 Appendix A : Questionnaire
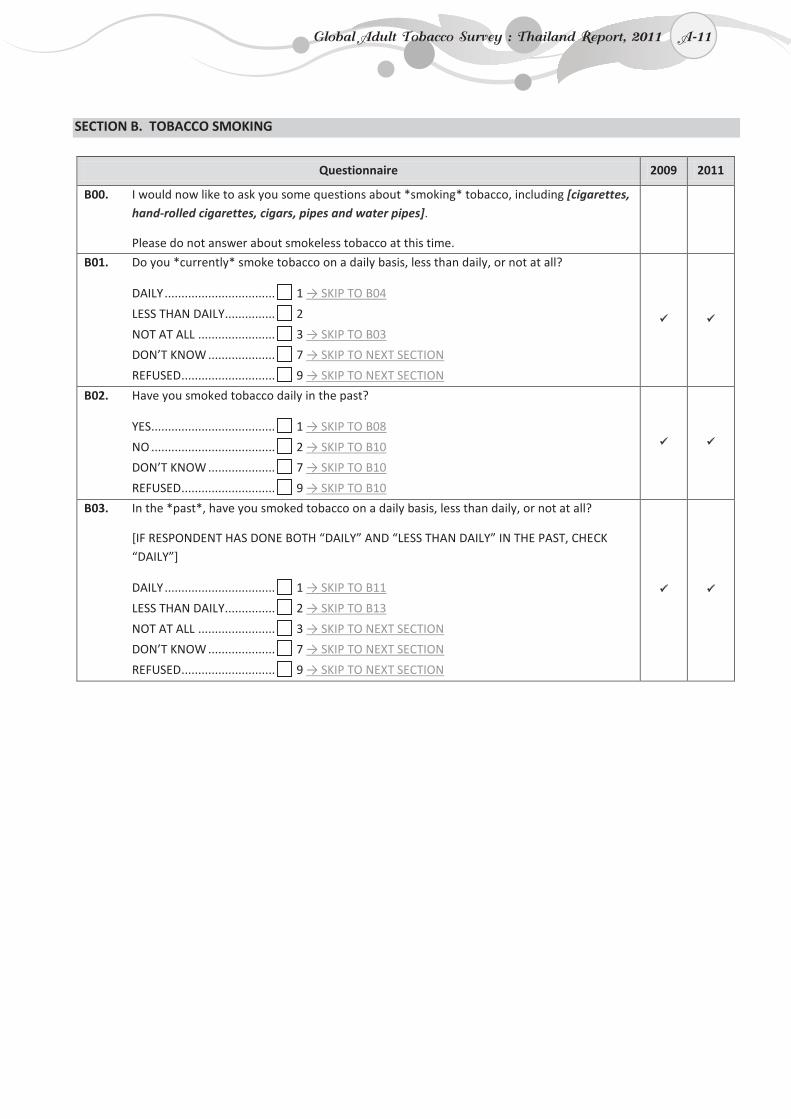
A-11
SECTION B. TOBACCO SMOKING
Questionnaire 2009 2011
B00. I would now like to ask you some questions about *smoking* tobacco, including [cigarettes, hand-rolled cigarettes, cigars, pipes and water pipes].
Please do not answer about smokeless tobacco at this time.
B01. Do you *currently* smoke tobacco on a daily basis, less than daily, or not at all?
DAILY ................................. 1 → SKIP TO B04
LESS THAN DAILY ............... 2
NOT AT ALL ....................... 3 → SKIP TO B03
DON’T KNOW .................... 7 → SKIP TO NEXT SECTION
REFUSED ............................ 9 → SKIP TO NEXT SECTION
B02. Have you smoked tobacco daily in the past?
YES..................................... 1 → SKIP TO B08
NO ..................................... 2 → SKIP TO B10
DON’T KNOW .................... 7 → SKIP TO B10
REFUSED ............................ 9 → SKIP TO B10
B03. In the *past*, have you smoked tobacco on a daily basis, less than daily, or not at all?
[IF RESPONDENT HAS DONE BOTH “DAILY” AND “LESS THAN DAILY” IN THE PAST, CHECK “DAILY”]
DAILY ................................. 1 → SKIP TO B11
LESS THAN DAILY ............... 2 → SKIP TO B13
NOT AT ALL ....................... 3 → SKIP TO NEXT SECTION
DON’T KNOW .................... 7 → SKIP TO NEXT SECTION
REFUSED ............................ 9 → SKIP TO NEXT SECTION
Global Adult Tobacco Survey : Thailand Report, 2011 A-11
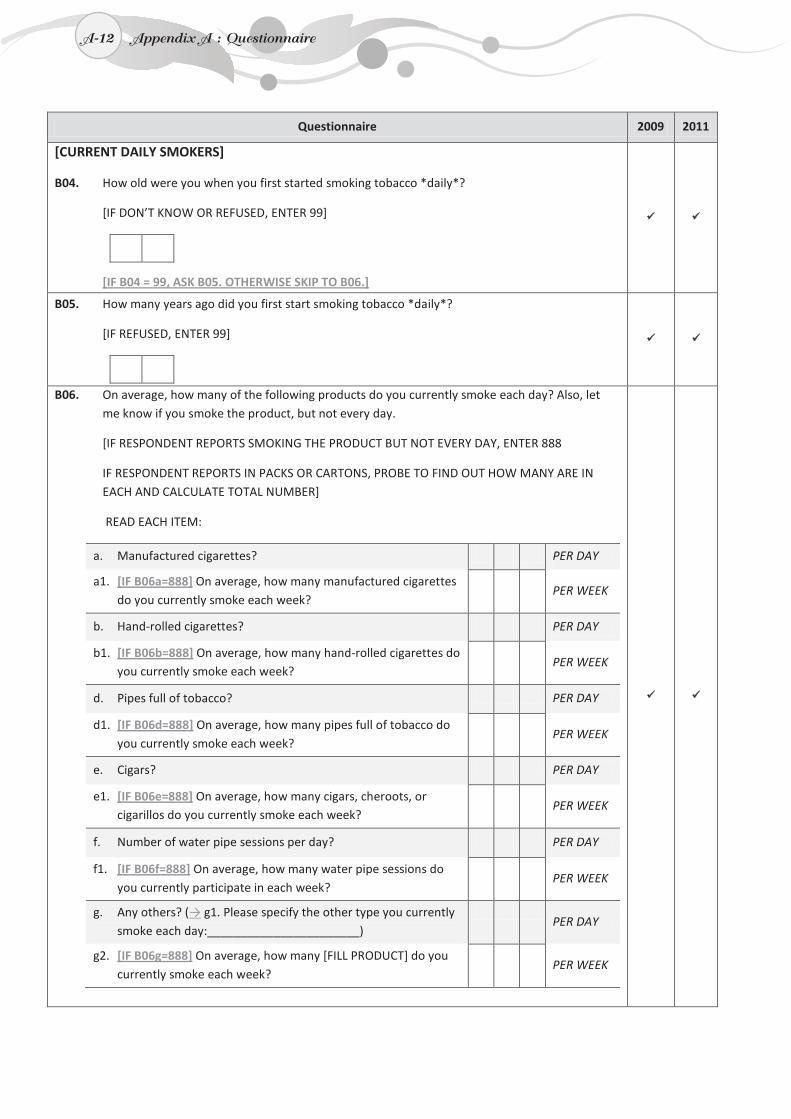
A-12
Questionnaire 2009 2011
[CURRENT DAILY SMOKERS]
B04. How old were you when you first started smoking tobacco *daily*?
[IF DON’T KNOW OR REFUSED, ENTER 99]
[IF B04 = 99, ASK B05. OTHERWISE SKIP TO B06.]
B05. How many years ago did you first start smoking tobacco *daily*?
[IF REFUSED, ENTER 99]
B06. On average, how many of the following products do you currently smoke each day? Also, let me know if you smoke the product, but not every day.
[IF RESPONDENT REPORTS SMOKING THE PRODUCT BUT NOT EVERY DAY, ENTER 888
IF RESPONDENT REPORTS IN PACKS OR CARTONS, PROBE TO FIND OUT HOW MANY ARE IN EACH AND CALCULATE TOTAL NUMBER]
READ EACH ITEM:
a. Manufactured cigarettes? PER DAY
a1. [IF B06a=888] On average, how many manufactured cigarettes do you currently smoke each week?
PER WEEK
b. Hand-rolled cigarettes? PER DAY
b1. [IF B06b=888] On average, how many hand-rolled cigarettes do you currently smoke each week?
PER WEEK
d. Pipes full of tobacco? PER DAY
d1. [IF B06d=888] On average, how many pipes full of tobacco do you currently smoke each week?
PER WEEK
e. Cigars? PER DAY
e1. [IF B06e=888] On average, how many cigars, cheroots, or cigarillos do you currently smoke each week?
PER WEEK
f. Number of water pipe sessions per day? PER DAY
f1. [IF B06f=888] On average, how many water pipe sessions do you currently participate in each week?
PER WEEK
g. Any others? (→ g1. Please specify the other type you currently smoke each day:_______________________)
PER DAY
g2. [IF B06g=888] On average, how many [FILL PRODUCT] do you currently smoke each week?
PER WEEK
A-12 Appendix A : Questionnaire

A-13
Questionnaire 2009 2011
B07. How soon after you wake up do you usually have your first smoke? Would you say within
5 minutes, 6 to 30 minutes, 31 to 60 minutes, or more than 60 minutes?
WITHIN 5 MINUTES ........................ 1
6 TO 30 MINUTES ........................... 2
31 TO 60 MINUTES ......................... 3
MORE THAN 60 MINUTES ............... 4
REFUSED ......................................... 9
[SKIP TO NEXT SECTION]
Global Adult Tobacco Survey : Thailand Report, 2011 A-13
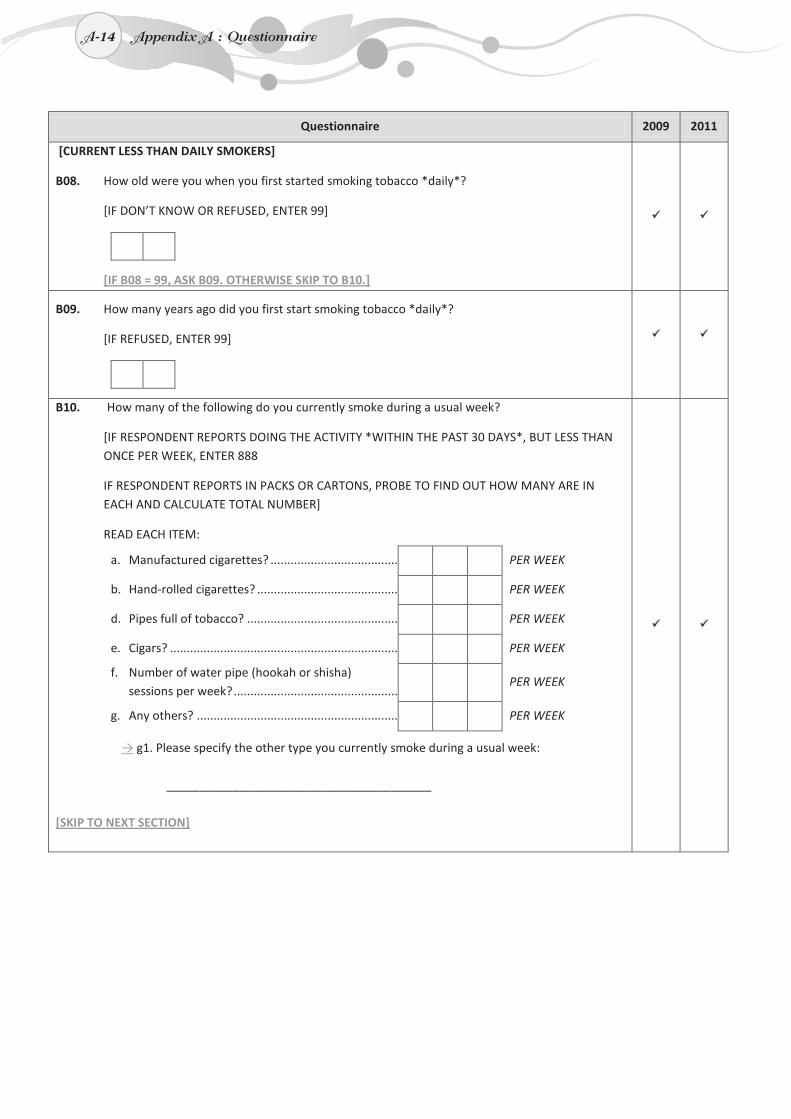
A-14
Questionnaire 2009 2011
[CURRENT LESS THAN DAILY SMOKERS]
B08. How old were you when you first started smoking tobacco *daily*?
[IF DON’T KNOW OR REFUSED, ENTER 99]
[IF B08 = 99, ASK B09. OTHERWISE SKIP TO B10.]
B09. How many years ago did you first start smoking tobacco *daily*?
[IF REFUSED, ENTER 99]
B10. How many of the following do you currently smoke during a usual week?
[IF RESPONDENT REPORTS DOING THE ACTIVITY *WITHIN THE PAST 30 DAYS*, BUT LESS THAN ONCE PER WEEK, ENTER 888
IF RESPONDENT REPORTS IN PACKS OR CARTONS, PROBE TO FIND OUT HOW MANY ARE IN EACH AND CALCULATE TOTAL NUMBER]
READ EACH ITEM:
a. Manufactured cigarettes? ...................................... PER WEEK
b. Hand-rolled cigarettes? .......................................... PER WEEK
d. Pipes full of tobacco? ............................................. PER WEEK
e. Cigars? .................................................................... PER WEEK
f. Number of water pipe (hookah or shisha) sessions per week? .................................................
PER WEEK
g. Any others? ............................................................ PER WEEK
→ g1. Please specify the other type you currently smoke during a usual week:
________________________________________ [SKIP TO NEXT SECTION]
A-14 Appendix A : Questionnaire
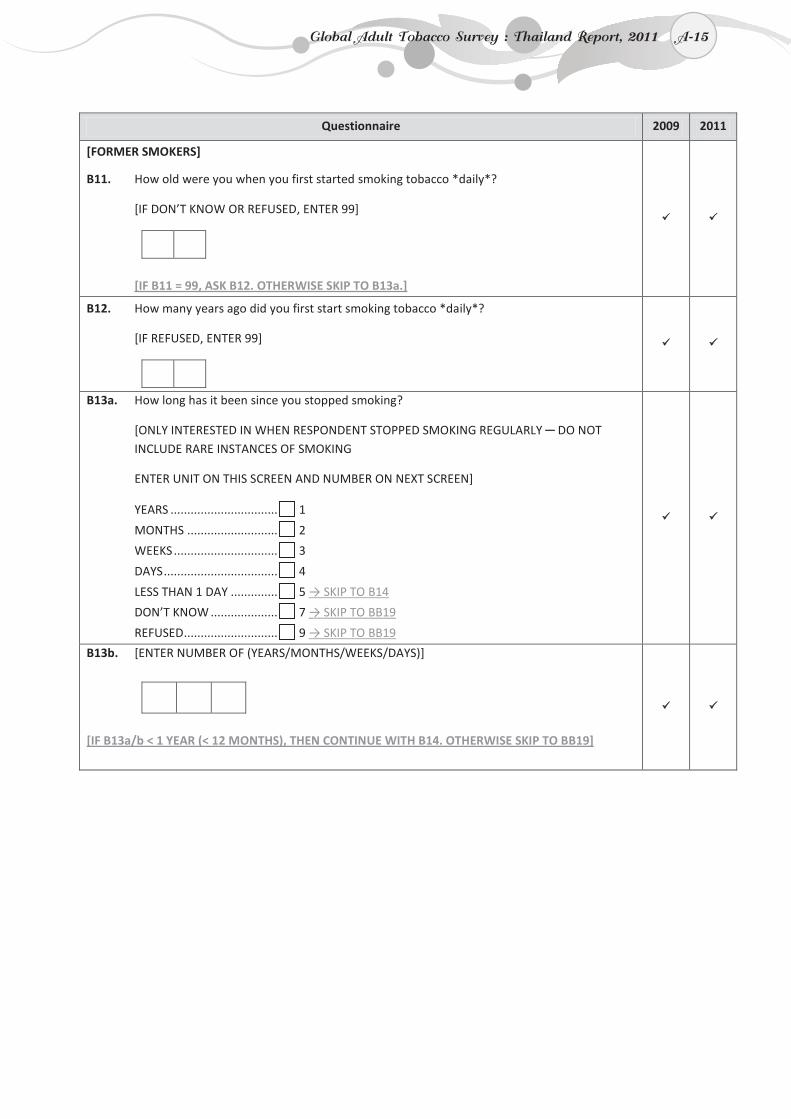
A-15
Questionnaire 2009 2011
[FORMER SMOKERS]
B11. How old were you when you first started smoking tobacco *daily*?
[IF DON’T KNOW OR REFUSED, ENTER 99]
[IF B11 = 99, ASK B12. OTHERWISE SKIP TO B13a.]
B12. How many years ago did you first start smoking tobacco *daily*?
[IF REFUSED, ENTER 99]
B13a. How long has it been since you stopped smoking?
[ONLY INTERESTED IN WHEN RESPONDENT STOPPED SMOKING REGULARLY ─ DO NOT INCLUDE RARE INSTANCES OF SMOKING
ENTER UNIT ON THIS SCREEN AND NUMBER ON NEXT SCREEN]
YEARS ................................ 1
MONTHS ........................... 2
WEEKS ............................... 3
DAYS .................................. 4
LESS THAN 1 DAY .............. 5 → SKIP TO B14
DON’T KNOW .................... 7 → SKIP TO BB19
REFUSED ............................ 9 → SKIP TO BB19
B13b. [ENTER NUMBER OF (YEARS/MONTHS/WEEKS/DAYS)]
[IF B13a/b < 1 YEAR (< 12 MONTHS), THEN CONTINUE WITH B14. OTHERWISE SKIP TO BB19]
Global Adult Tobacco Survey : Thailand Report, 2011 A-15
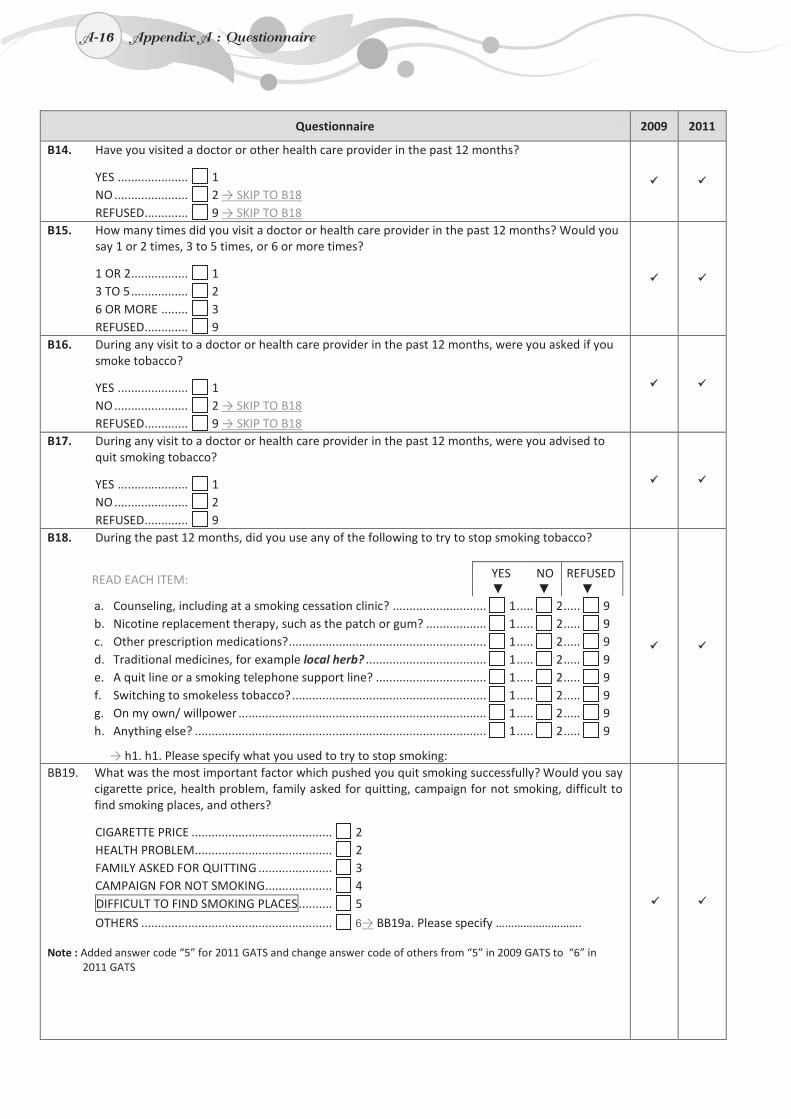
A-16
Questionnaire 2009 2011
B14. Have you visited a doctor or other health care provider in the past 12 months?
YES ..................... 1 NO ...................... 2 → SKIP TO B18 REFUSED............. 9 → SKIP TO B18
B15. How many times did you visit a doctor or health care provider in the past 12 months? Would you say 1 or 2 times, 3 to 5 times, or 6 or more times?
1 OR 2 ................. 1 3 TO 5 ................. 2 6 OR MORE ........ 3 REFUSED............. 9
B16. During any visit to a doctor or health care provider in the past 12 months, were you asked if you smoke tobacco?
YES ..................... 1 NO ...................... 2 → SKIP TO B18 REFUSED............. 9 → SKIP TO B18
B17. During any visit to a doctor or health care provider in the past 12 months, were you advised to quit smoking tobacco?
YES ..................... 1 NO ...................... 2 REFUSED............. 9
B18. During the past 12 months, did you use any of the following to try to stop smoking tobacco?
READ EACH ITEM: YES NO REFUSED ▼ ▼ ▼
a. Counseling, including at a smoking cessation clinic? ............................ 1 ..... 2 ..... 9 b. Nicotine replacement therapy, such as the patch or gum? .................. 1 ..... 2 ..... 9 c. Other prescription medications? ........................................................... 1 ..... 2 ..... 9 d. Traditional medicines, for example local herb? .................................... 1 ..... 2 ..... 9 e. A quit line or a smoking telephone support line? ................................. 1 ..... 2 ..... 9 f. Switching to smokeless tobacco? .......................................................... 1 ..... 2 ..... 9 g. On my own/ willpower .......................................................................... 1 ..... 2 ..... 9 h. Anything else? ....................................................................................... 1 ..... 2 ..... 9
→ h1. h1. Please specify what you used to try to stop smoking:
BB19. What was the most important factor which pushed you quit smoking successfully? Would you say cigarette price, health problem, family asked for quitting, campaign for not smoking, difficult to find smoking places, and others?
CIGARETTE PRICE .......................................... 2 HEALTH PROBLEM......................................... 2 FAMILY ASKED FOR QUITTING ...................... 3 CAMPAIGN FOR NOT SMOKING .................... 4 DIFFICULT TO FIND SMOKING PLACES .......... 5
OTHERS ......................................................... 6→ BB19a. Please specify ……………………….
Note : Added answer code “5” for 2011 GATS and change answer code of others from “5” in 2009 GATS to “6” in 2011 GATS
A-16 Appendix A : Questionnaire
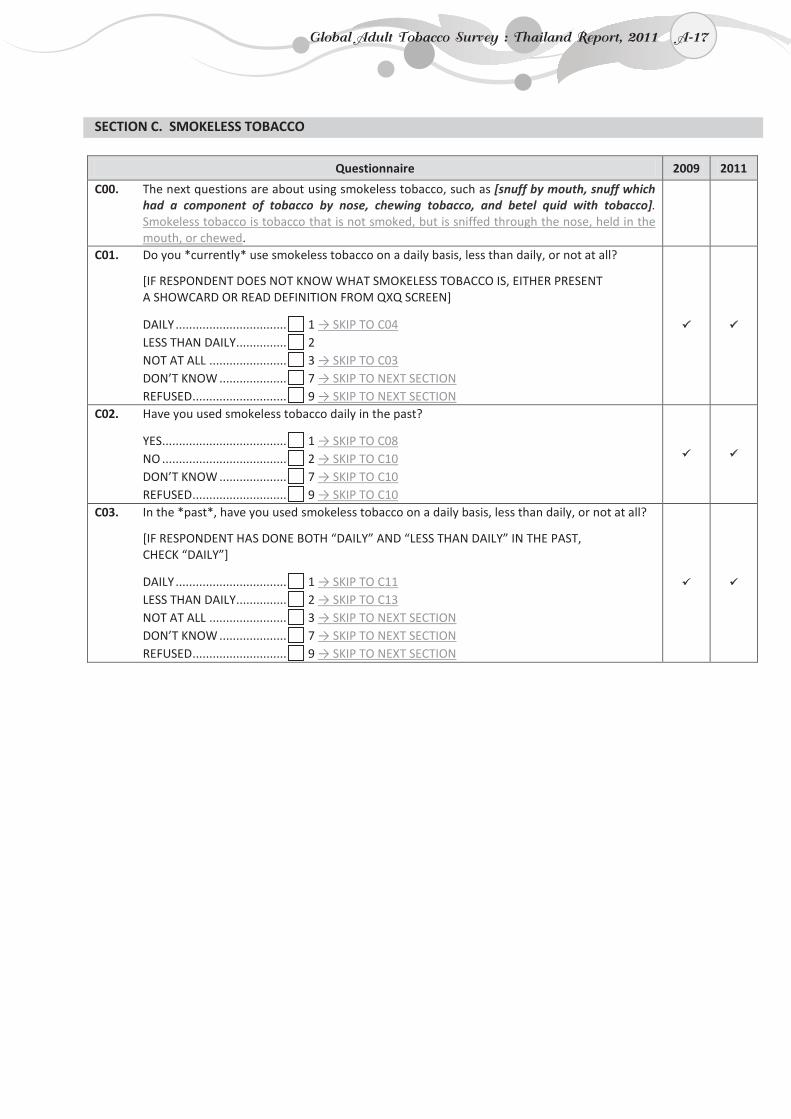
A-17
SECTION C. SMOKELESS TOBACCO
Questionnaire 2009 2011
C00. The next questions are about using smokeless tobacco, such as [snuff by mouth, snuff which had a component of tobacco by nose, chewing tobacco, and betel quid with tobacco]. Smokeless tobacco is tobacco that is not smoked, but is sniffed through the nose, held in the mouth, or chewed.
C01. Do you *currently* use smokeless tobacco on a daily basis, less than daily, or not at all?
[IF RESPONDENT DOES NOT KNOW WHAT SMOKELESS TOBACCO IS, EITHER PRESENT A SHOWCARD OR READ DEFINITION FROM QXQ SCREEN]
DAILY ................................. 1 → SKIP TO C04 LESS THAN DAILY ............... 2 NOT AT ALL ....................... 3 → SKIP TO C03 DON’T KNOW .................... 7 → SKIP TO NEXT SECTION REFUSED ............................ 9 → SKIP TO NEXT SECTION
C02. Have you used smokeless tobacco daily in the past?
YES..................................... 1 → SKIP TO C08 NO ..................................... 2 → SKIP TO C10 DON’T KNOW .................... 7 → SKIP TO C10 REFUSED ............................ 9 → SKIP TO C10
C03. In the *past*, have you used smokeless tobacco on a daily basis, less than daily, or not at all?
[IF RESPONDENT HAS DONE BOTH “DAILY” AND “LESS THAN DAILY” IN THE PAST, CHECK “DAILY”]
DAILY ................................. 1 → SKIP TO C11 LESS THAN DAILY ............... 2 → SKIP TO C13 NOT AT ALL ....................... 3 → SKIP TO NEXT SECTION DON’T KNOW .................... 7 → SKIP TO NEXT SECTION REFUSED ............................ 9 → SKIP TO NEXT SECTION
Global Adult Tobacco Survey : Thailand Report, 2011 A-17
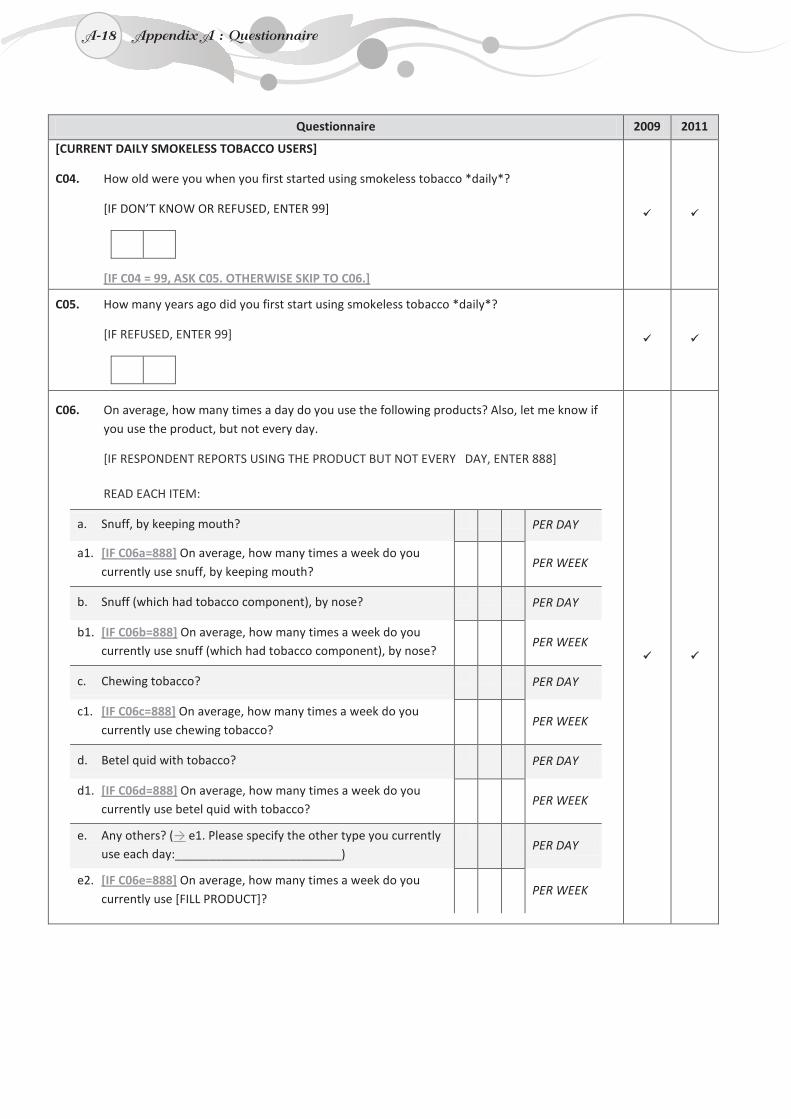
A-18
Questionnaire 2009 2011
[CURRENT DAILY SMOKELESS TOBACCO USERS]
C04. How old were you when you first started using smokeless tobacco *daily*?
[IF DON’T KNOW OR REFUSED, ENTER 99]
[IF C04 = 99, ASK C05. OTHERWISE SKIP TO C06.]
C05. How many years ago did you first start using smokeless tobacco *daily*?
[IF REFUSED, ENTER 99]
C06. On average, how many times a day do you use the following products? Also, let me know if you use the product, but not every day.
[IF RESPONDENT REPORTS USING THE PRODUCT BUT NOT EVERY DAY, ENTER 888]
READ EACH ITEM:
a. Snuff, by keeping mouth? PER DAY
a1. [IF C06a=888] On average, how many times a week do you currently use snuff, by keeping mouth?
PER WEEK
b. Snuff (which had tobacco component), by nose? PER DAY
b1. [IF C06b=888] On average, how many times a week do you currently use snuff (which had tobacco component), by nose?
PER WEEK
c. Chewing tobacco? PER DAY
c1. [IF C06c=888] On average, how many times a week do you currently use chewing tobacco?
PER WEEK
d. Betel quid with tobacco? PER DAY
d1. [IF C06d=888] On average, how many times a week do you currently use betel quid with tobacco?
PER WEEK
e. Any others? (→ e1. Please specify the other type you currently use each day:_________________________)
PER DAY
e2. [IF C06e=888] On average, how many times a week do you currently use [FILL PRODUCT]?
PER WEEK
A-18 Appendix A : Questionnaire

A-19
Questionnaire 2009 2011
C07. How soon after you wake up do you usually use smokeless tobacco for the first time? Would
you say within 5 minutes, 6 to 30 minutes, 31 to 60 minutes, or more than 60 minutes?
WITHIN 5 MINUTES ......................... 1
6 TO 30 MINUTES ............................ 2
31 TO 60 MINUTES .......................... 3
MORE THAN 60 MINUTES ............... 4
REFUSED .......................................... 9
[SKIP TO NEXT SECTION]
Global Adult Tobacco Survey : Thailand Report, 2011 A-19
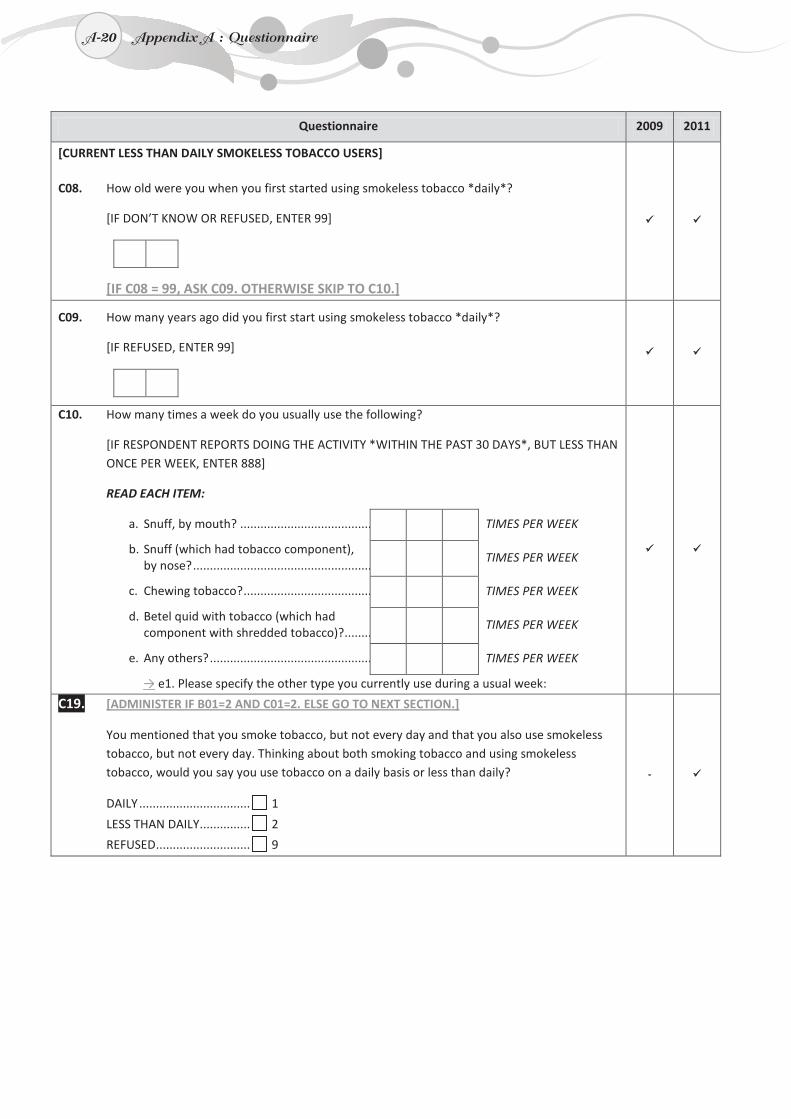
A-20
Questionnaire 2009 2011
[CURRENT LESS THAN DAILY SMOKELESS TOBACCO USERS]
C08. How old were you when you first started using smokeless tobacco *daily*?
[IF DON’T KNOW OR REFUSED, ENTER 99]
[IF C08 = 99, ASK C09. OTHERWISE SKIP TO C10.]
C09. How many years ago did you first start using smokeless tobacco *daily*?
[IF REFUSED, ENTER 99]
C10. How many times a week do you usually use the following?
[IF RESPONDENT REPORTS DOING THE ACTIVITY *WITHIN THE PAST 30 DAYS*, BUT LESS THAN ONCE PER WEEK, ENTER 888]
READ EACH ITEM:
a. Snuff, by mouth? ....................................... TIMES PER WEEK
b. Snuff (which had tobacco component), by nose? .....................................................
TIMES PER WEEK
c. Chewing tobacco? ...................................... TIMES PER WEEK
d. Betel quid with tobacco (which had component with shredded tobacco)? ........
TIMES PER WEEK
e. Any others? ................................................ TIMES PER WEEK
→ e1. Please specify the other type you currently use during a usual week:
C19. [ADMINISTER IF B01=2 AND C01=2. ELSE GO TO NEXT SECTION.]
You mentioned that you smoke tobacco, but not every day and that you also use smokeless tobacco, but not every day. Thinking about both smoking tobacco and using smokeless tobacco, would you say you use tobacco on a daily basis or less than daily?
DAILY ................................. 1
LESS THAN DAILY ............... 2
REFUSED ............................ 9
-
A-20 Appendix A : Questionnaire
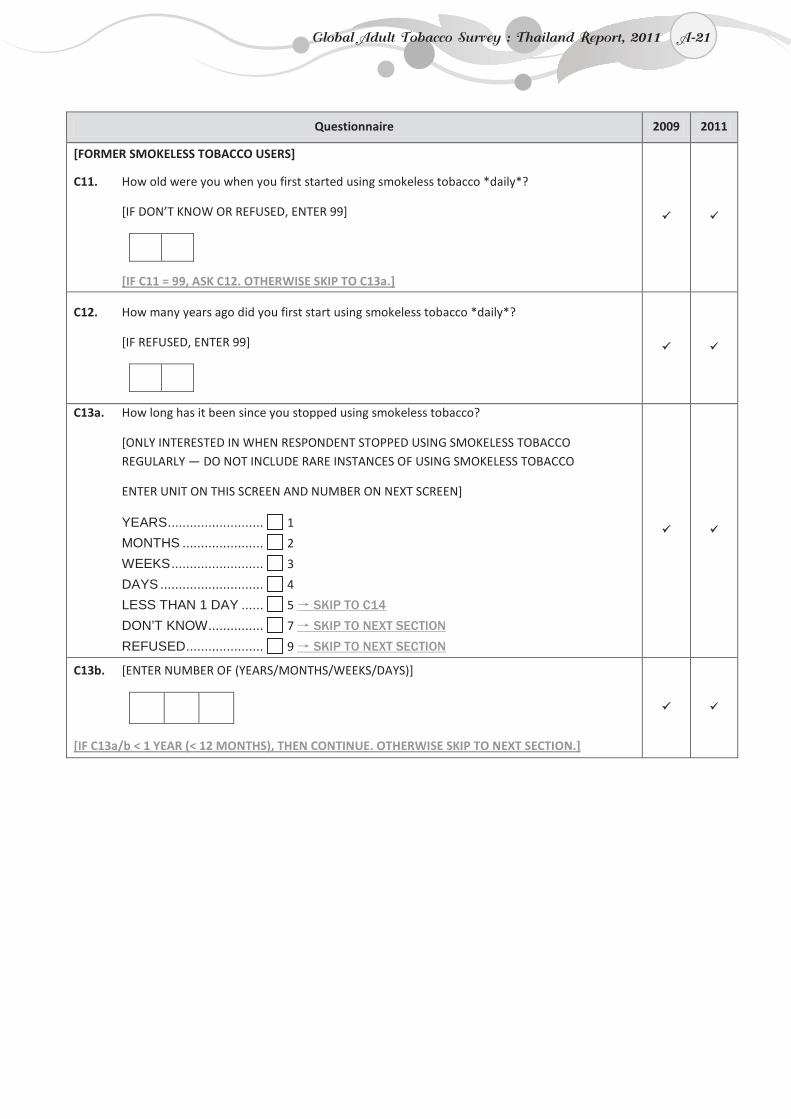
A-21
Questionnaire 2009 2011
[FORMER SMOKELESS TOBACCO USERS]
C11. How old were you when you first started using smokeless tobacco *daily*?
[IF DON’T KNOW OR REFUSED, ENTER 99]
[IF C11 = 99, ASK C12. OTHERWISE SKIP TO C13a.]
C12. How many years ago did you first start using smokeless tobacco *daily*?
[IF REFUSED, ENTER 99]
C13a. How long has it been since you stopped using smokeless tobacco?
[ONLY INTERESTED IN WHEN RESPONDENT STOPPED USING SMOKELESS TOBACCO REGULARLY — DO NOT INCLUDE RARE INSTANCES OF USING SMOKELESS TOBACCO
ENTER UNIT ON THIS SCREEN AND NUMBER ON NEXT SCREEN]
YEARS.......................... 1
MONTHS ...................... 2
WEEKS......................... 3
DAYS ............................ 4
LESS THAN 1 DAY ...... 5 → SKIP TO C14
DON’T KNOW............... 7 → SKIP TO NEXT SECTION
REFUSED..................... 9 → SKIP TO NEXT SECTION
C13b. [ENTER NUMBER OF (YEARS/MONTHS/WEEKS/DAYS)]
[IF C13a/b < 1 YEAR (< 12 MONTHS), THEN CONTINUE. OTHERWISE SKIP TO NEXT SECTION.]
Global Adult Tobacco Survey : Thailand Report, 2011 A-21
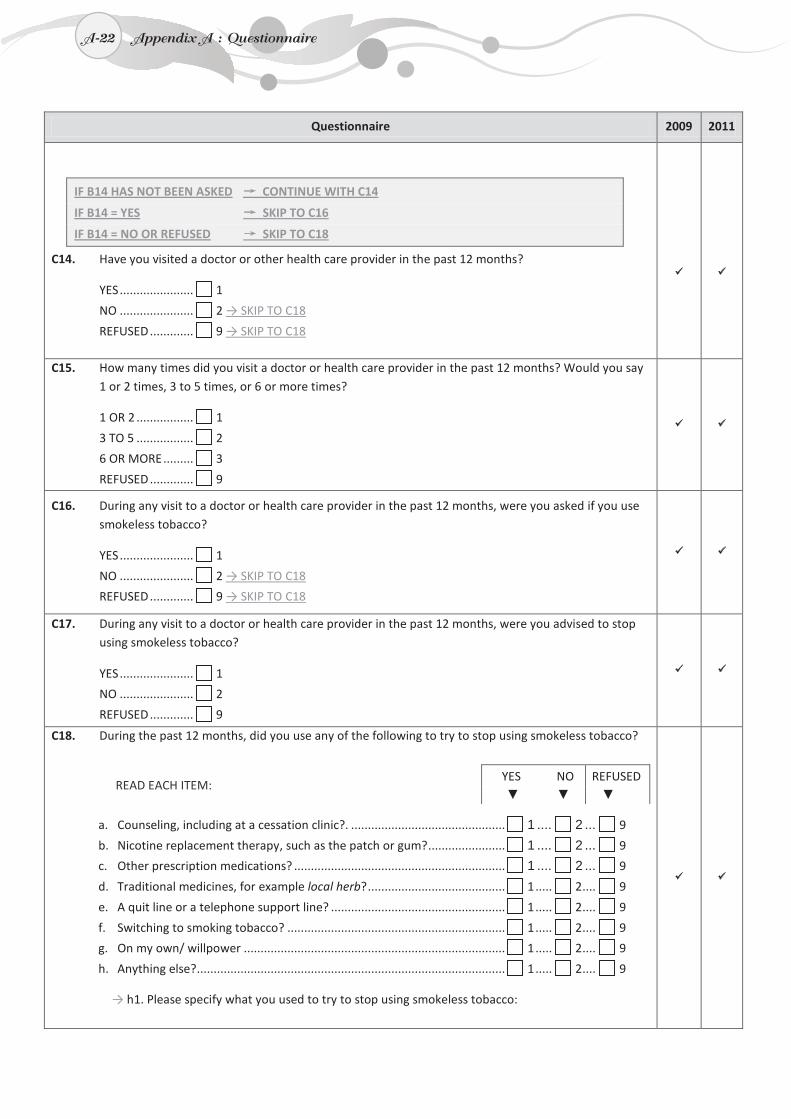
A-22
Questionnaire 2009 2011
IF B14 HAS NOT BEEN ASKED → CONTINUE WITH C14
IF B14 = YES → SKIP TO C16
IF B14 = NO OR REFUSED → SKIP TO C18
C14. Have you visited a doctor or other health care provider in the past 12 months?
YES ...................... 1
NO ...................... 2 → SKIP TO C18
REFUSED ............. 9 → SKIP TO C18
C15. How many times did you visit a doctor or health care provider in the past 12 months? Would you say 1 or 2 times, 3 to 5 times, or 6 or more times?
1 OR 2 ................. 1
3 TO 5 ................. 2
6 OR MORE ......... 3
REFUSED ............. 9
C16. During any visit to a doctor or health care provider in the past 12 months, were you asked if you use smokeless tobacco?
YES ...................... 1
NO ...................... 2 → SKIP TO C18
REFUSED ............. 9 → SKIP TO C18
C17. During any visit to a doctor or health care provider in the past 12 months, were you advised to stop using smokeless tobacco?
YES ...................... 1
NO ...................... 2
REFUSED ............. 9
C18. During the past 12 months, did you use any of the following to try to stop using smokeless tobacco?
READ EACH ITEM: YES NO REFUSED ▼ ▼ ▼
a. Counseling, including at a cessation clinic?. .............................................. 1 .... 2 ... 9
b. Nicotine replacement therapy, such as the patch or gum? ....................... 1 .... 2 ... 9
c. Other prescription medications? ............................................................... 1 .... 2 ... 9
d. Traditional medicines, for example local herb? ......................................... 1 ..... 2 .... 9
e. A quit line or a telephone support line? .................................................... 1 ..... 2 .... 9
f. Switching to smoking tobacco? ................................................................. 1 ..... 2 .... 9
g. On my own/ willpower .............................................................................. 1 ..... 2 .... 9
h. Anything else? ............................................................................................ 1 ..... 2 .... 9
→ h1. Please specify what you used to try to stop using smokeless tobacco:
A-22 Appendix A : Questionnaire
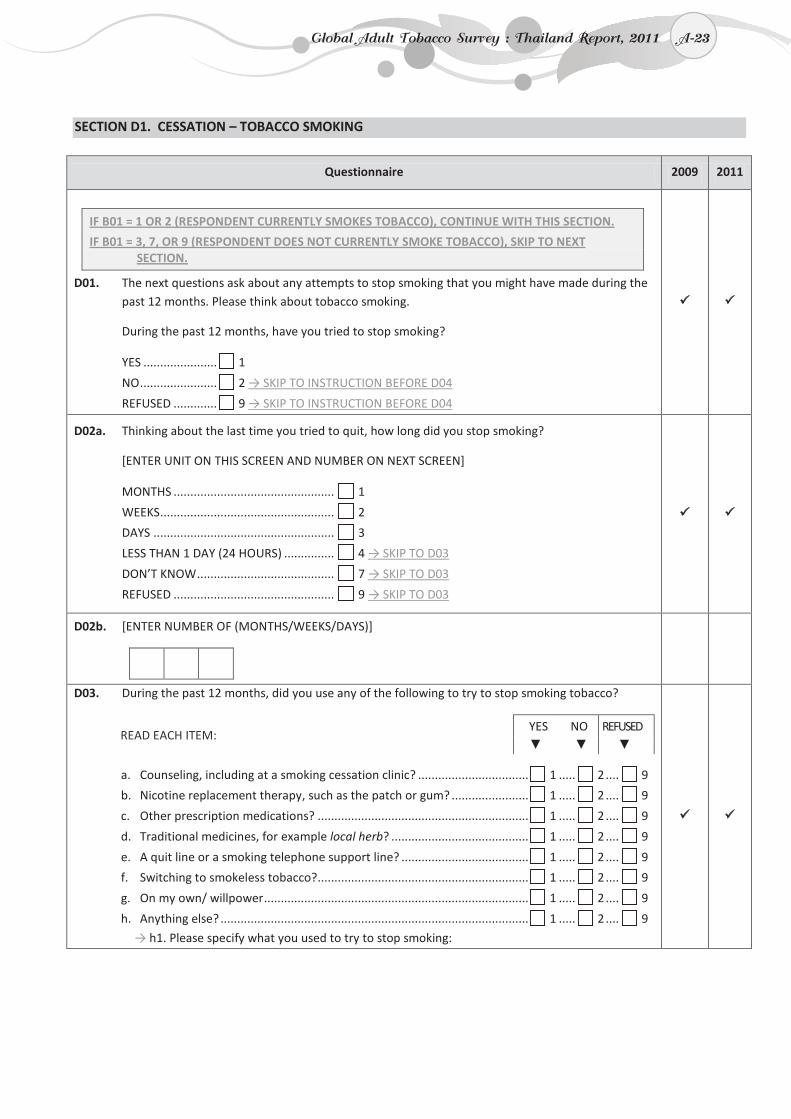
A-23
SECTION D1. CESSATION – TOBACCO SMOKING
Questionnaire 2009 2011
IF B01 = 1 OR 2 (RESPONDENT CURRENTLY SMOKES TOBACCO), CONTINUE WITH THIS SECTION.
IF B01 = 3, 7, OR 9 (RESPONDENT DOES NOT CURRENTLY SMOKE TOBACCO), SKIP TO NEXT SECTION.
D01. The next questions ask about any attempts to stop smoking that you might have made during the past 12 months. Please think about tobacco smoking.
During the past 12 months, have you tried to stop smoking?
YES ...................... 1
NO ....................... 2 → SKIP TO INSTRUCTION BEFORE D04
REFUSED ............. 9 → SKIP TO INSTRUCTION BEFORE D04
D02a. Thinking about the last time you tried to quit, how long did you stop smoking?
[ENTER UNIT ON THIS SCREEN AND NUMBER ON NEXT SCREEN]
MONTHS ................................................ 1
WEEKS .................................................... 2
DAYS ...................................................... 3
LESS THAN 1 DAY (24 HOURS) ............... 4 → SKIP TO D03
DON’T KNOW ......................................... 7 → SKIP TO D03
REFUSED ................................................ 9 → SKIP TO D03
D02b. [ENTER NUMBER OF (MONTHS/WEEKS/DAYS)]
D03. During the past 12 months, did you use any of the following to try to stop smoking tobacco?
READ EACH ITEM: YES NO REFUSED
▼ ▼ ▼
a. Counseling, including at a smoking cessation clinic? ................................. 1 ..... 2 .... 9
b. Nicotine replacement therapy, such as the patch or gum? ....................... 1 ..... 2 .... 9
c. Other prescription medications? ............................................................... 1 ..... 2 .... 9
d. Traditional medicines, for example local herb? ......................................... 1 ..... 2 .... 9
e. A quit line or a smoking telephone support line? ...................................... 1 ..... 2 .... 9
f. Switching to smokeless tobacco? ............................................................... 1 ..... 2 .... 9
g. On my own/ willpower ............................................................................... 1 ..... 2 .... 9
h. Anything else? ............................................................................................ 1 ..... 2 .... 9
→ h1. Please specify what you used to try to stop smoking:
Global Adult Tobacco Survey : Thailand Report, 2011 A-23
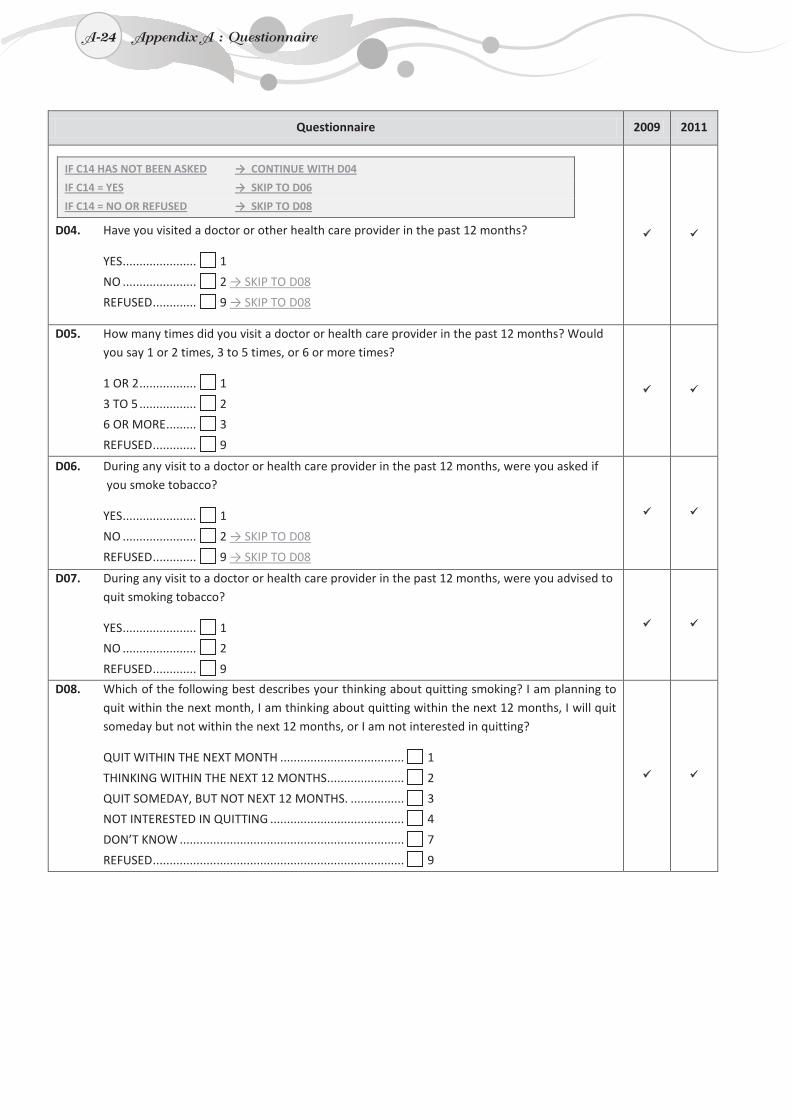
A-24
Questionnaire 2009 2011
IF C14 HAS NOT BEEN ASKED → CONTINUE WITH D04
IF C14 = YES → SKIP TO D06
IF C14 = NO OR REFUSED → SKIP TO D08
D04. Have you visited a doctor or other health care provider in the past 12 months?
YES ...................... 1
NO ...................... 2 → SKIP TO D08
REFUSED ............. 9 → SKIP TO D08
D05. How many times did you visit a doctor or health care provider in the past 12 months? Would you say 1 or 2 times, 3 to 5 times, or 6 or more times?
1 OR 2 ................. 1
3 TO 5 ................. 2
6 OR MORE ......... 3
REFUSED ............. 9
D06. During any visit to a doctor or health care provider in the past 12 months, were you asked if you smoke tobacco?
YES ...................... 1
NO ...................... 2 → SKIP TO D08
REFUSED ............. 9 → SKIP TO D08
D07. During any visit to a doctor or health care provider in the past 12 months, were you advised to quit smoking tobacco?
YES ...................... 1
NO ...................... 2
REFUSED ............. 9
D08. Which of the following best describes your thinking about quitting smoking? I am planning to quit within the next month, I am thinking about quitting within the next 12 months, I will quit someday but not within the next 12 months, or I am not interested in quitting?
QUIT WITHIN THE NEXT MONTH ..................................... 1
THINKING WITHIN THE NEXT 12 MONTHS ....................... 2
QUIT SOMEDAY, BUT NOT NEXT 12 MONTHS. ................ 3
NOT INTERESTED IN QUITTING ........................................ 4
DON’T KNOW ................................................................... 7
REFUSED ........................................................................... 9
A-24 Appendix A : Questionnaire
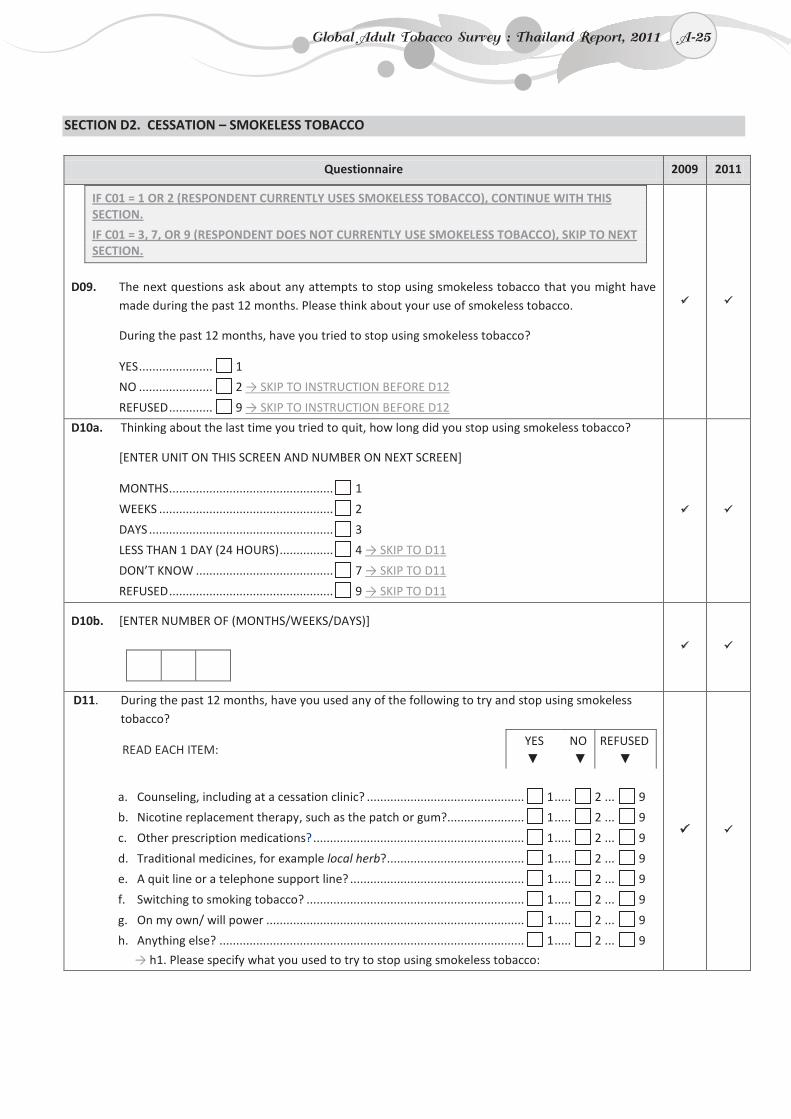
A-25
SECTION D2. CESSATION – SMOKELESS TOBACCO
Questionnaire 2009 2011
IF C01 = 1 OR 2 (RESPONDENT CURRENTLY USES SMOKELESS TOBACCO), CONTINUE WITH THIS SECTION.
IF C01 = 3, 7, OR 9 (RESPONDENT DOES NOT CURRENTLY USE SMOKELESS TOBACCO), SKIP TO NEXT SECTION.
D09. The next questions ask about any attempts to stop using smokeless tobacco that you might have made during the past 12 months. Please think about your use of smokeless tobacco.
During the past 12 months, have you tried to stop using smokeless tobacco?
YES ...................... 1
NO ...................... 2 → SKIP TO INSTRUCTION BEFORE D12
REFUSED ............. 9 → SKIP TO INSTRUCTION BEFORE D12
D10a. Thinking about the last time you tried to quit, how long did you stop using smokeless tobacco?
[ENTER UNIT ON THIS SCREEN AND NUMBER ON NEXT SCREEN]
MONTHS ................................................. 1
WEEKS .................................................... 2
DAYS ....................................................... 3
LESS THAN 1 DAY (24 HOURS) ................ 4 → SKIP TO D11
DON’T KNOW ......................................... 7 → SKIP TO D11
REFUSED ................................................. 9 → SKIP TO D11
D10b. [ENTER NUMBER OF (MONTHS/WEEKS/DAYS)]
D11. During the past 12 months, have you used any of the following to try and stop using smokeless tobacco?
READ EACH ITEM: YES NO REFUSED ▼ ▼ ▼
a. Counseling, including at a cessation clinic? ............................................... 1 ..... 2 ... 9
b. Nicotine replacement therapy, such as the patch or gum?....................... 1 ..... 2 ... 9
c. Other prescription medications? ............................................................... 1 ..... 2 ... 9
d. Traditional medicines, for example local herb? ......................................... 1 ..... 2 ... 9
e. A quit line or a telephone support line? .................................................... 1 ..... 2 ... 9
f. Switching to smoking tobacco? ................................................................. 1 ..... 2 ... 9
g. On my own/ will power ............................................................................. 1 ..... 2 ... 9
h. Anything else? ........................................................................................... 1 ..... 2 ... 9
→ h1. Please specify what you used to try to stop using smokeless tobacco:
Global Adult Tobacco Survey : Thailand Report, 2011 A-25
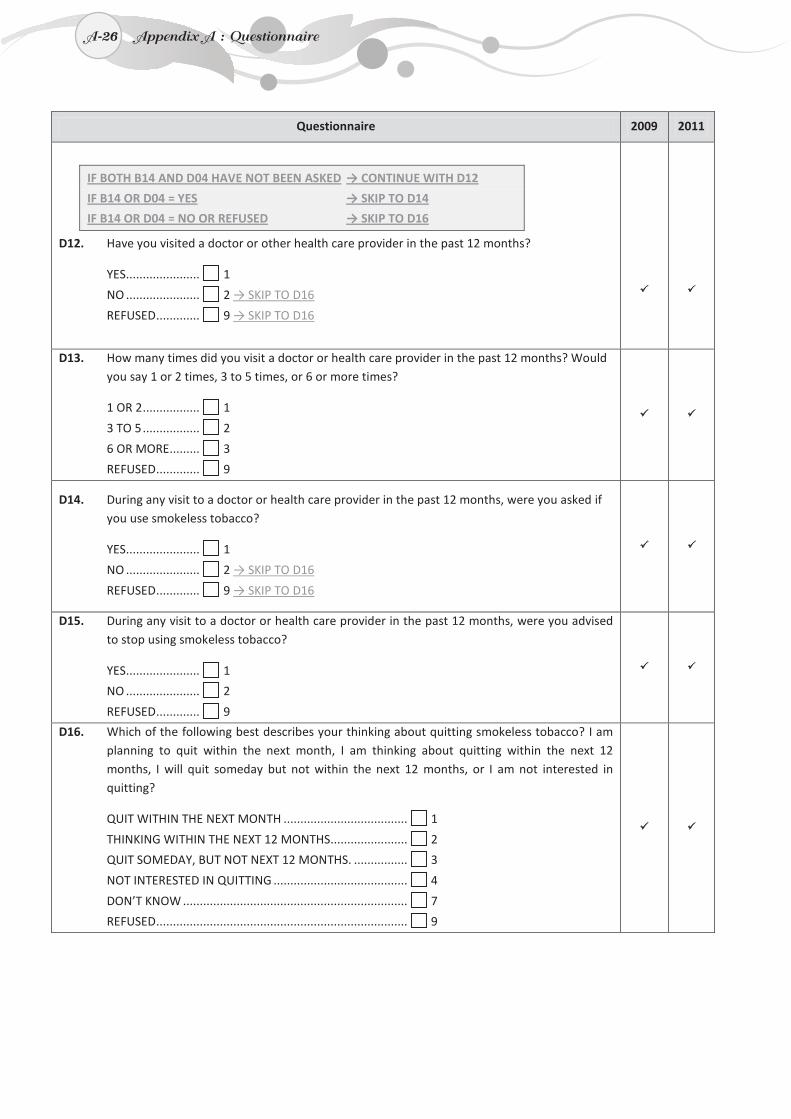
A-26
Questionnaire 2009 2011
IF BOTH B14 AND D04 HAVE NOT BEEN ASKED → CONTINUE WITH D12
IF B14 OR D04 = YES → SKIP TO D14
IF B14 OR D04 = NO OR REFUSED → SKIP TO D16
D12. Have you visited a doctor or other health care provider in the past 12 months?
YES...................... 1
NO ...................... 2 → SKIP TO D16
REFUSED ............. 9 → SKIP TO D16
D13. How many times did you visit a doctor or health care provider in the past 12 months? Would you say 1 or 2 times, 3 to 5 times, or 6 or more times?
1 OR 2 ................. 1
3 TO 5 ................. 2
6 OR MORE......... 3
REFUSED ............. 9
D14. During any visit to a doctor or health care provider in the past 12 months, were you asked if you use smokeless tobacco?
YES...................... 1
NO ...................... 2 → SKIP TO D16
REFUSED ............. 9 → SKIP TO D16
D15. During any visit to a doctor or health care provider in the past 12 months, were you advised to stop using smokeless tobacco?
YES...................... 1
NO ...................... 2
REFUSED ............. 9
D16. Which of the following best describes your thinking about quitting smokeless tobacco? I am planning to quit within the next month, I am thinking about quitting within the next 12 months, I will quit someday but not within the next 12 months, or I am not interested in quitting?
QUIT WITHIN THE NEXT MONTH ..................................... 1
THINKING WITHIN THE NEXT 12 MONTHS....................... 2
QUIT SOMEDAY, BUT NOT NEXT 12 MONTHS. ................ 3
NOT INTERESTED IN QUITTING ........................................ 4
DON’T KNOW ................................................................... 7
REFUSED ........................................................................... 9
A-26 Appendix A : Questionnaire
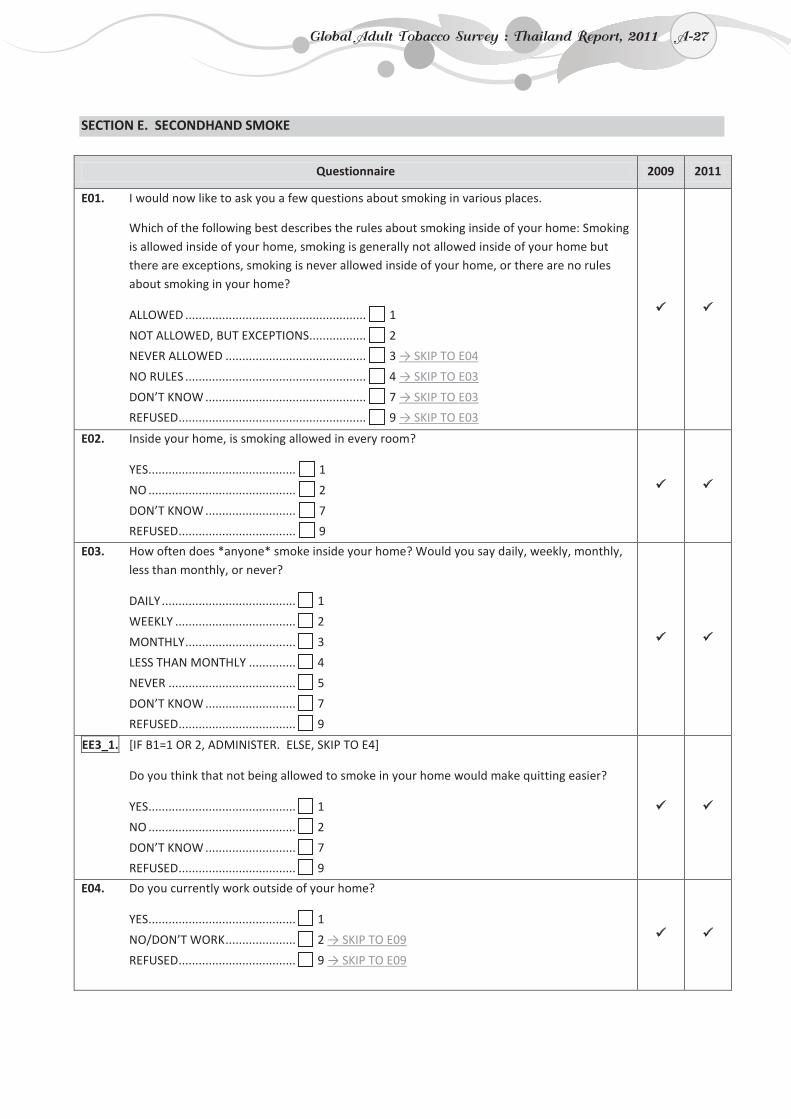
A-27
SECTION E. SECONDHAND SMOKE
Questionnaire 2009 2011
E01. I would now like to ask you a few questions about smoking in various places.
Which of the following best describes the rules about smoking inside of your home: Smoking is allowed inside of your home, smoking is generally not allowed inside of your home but there are exceptions, smoking is never allowed inside of your home, or there are no rules about smoking in your home?
ALLOWED ...................................................... 1
NOT ALLOWED, BUT EXCEPTIONS ................. 2
NEVER ALLOWED .......................................... 3 → SKIP TO E04
NO RULES ...................................................... 4 → SKIP TO E03
DON’T KNOW ................................................ 7 → SKIP TO E03
REFUSED ........................................................ 9 → SKIP TO E03
E02. Inside your home, is smoking allowed in every room?
YES............................................ 1
NO ............................................ 2
DON’T KNOW ........................... 7
REFUSED ................................... 9
E03. How often does *anyone* smoke inside your home? Would you say daily, weekly, monthly, less than monthly, or never?
DAILY ........................................ 1
WEEKLY .................................... 2
MONTHLY ................................. 3
LESS THAN MONTHLY .............. 4
NEVER ...................................... 5
DON’T KNOW ........................... 7
REFUSED ................................... 9
EE3_1. [IF B1=1 OR 2, ADMINISTER. ELSE, SKIP TO E4]
Do you think that not being allowed to smoke in your home would make quitting easier?
YES............................................ 1
NO ............................................ 2
DON’T KNOW ........................... 7
REFUSED ................................... 9
E04. Do you currently work outside of your home?
YES............................................ 1
NO/DON’T WORK ..................... 2 → SKIP TO E09
REFUSED ................................... 9 → SKIP TO E09
Global Adult Tobacco Survey : Thailand Report, 2011 A-27
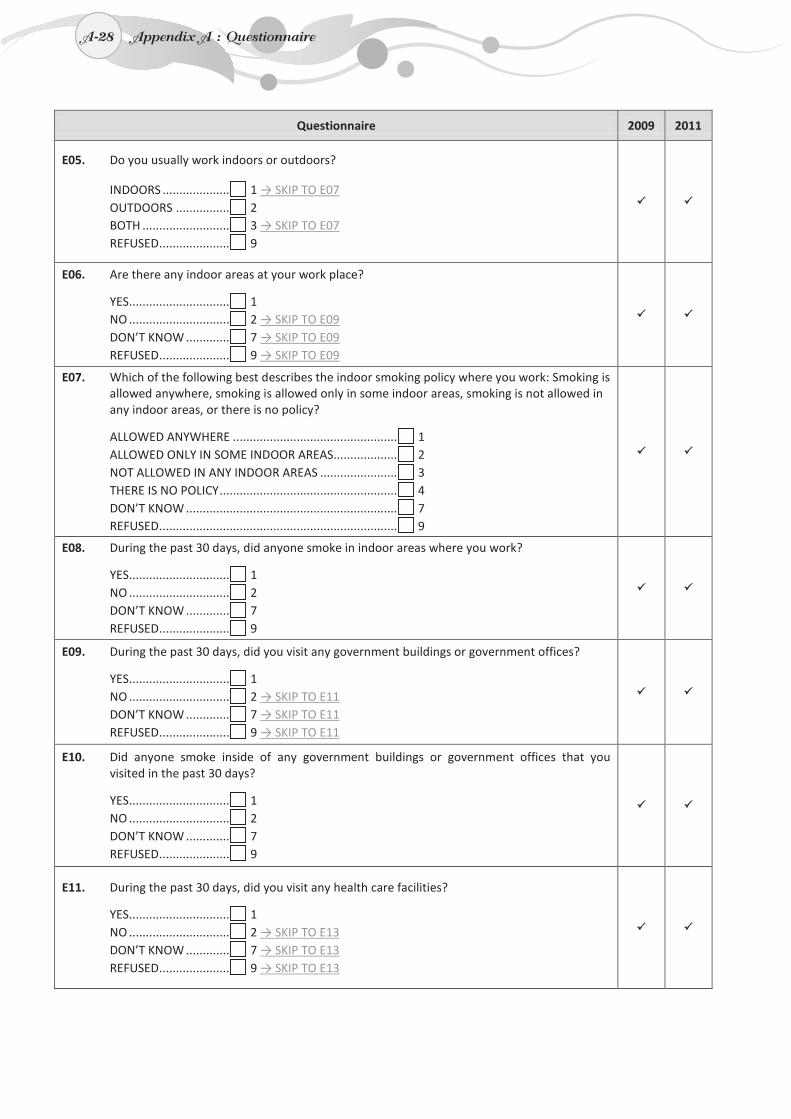
A-28
Questionnaire 2009 2011
E05. Do you usually work indoors or outdoors?
INDOORS .................... 1 → SKIP TO E07 OUTDOORS ................ 2 BOTH .......................... 3 → SKIP TO E07 REFUSED ..................... 9
E06. Are there any indoor areas at your work place?
YES.............................. 1 NO .............................. 2 → SKIP TO E09 DON’T KNOW ............. 7 → SKIP TO E09 REFUSED ..................... 9 → SKIP TO E09
E07. Which of the following best describes the indoor smoking policy where you work: Smoking is allowed anywhere, smoking is allowed only in some indoor areas, smoking is not allowed in any indoor areas, or there is no policy?
ALLOWED ANYWHERE ................................................. 1 ALLOWED ONLY IN SOME INDOOR AREAS................... 2 NOT ALLOWED IN ANY INDOOR AREAS ....................... 3 THERE IS NO POLICY ..................................................... 4 DON’T KNOW ............................................................... 7 REFUSED ....................................................................... 9
E08. During the past 30 days, did anyone smoke in indoor areas where you work?
YES.............................. 1 NO .............................. 2 DON’T KNOW ............. 7 REFUSED ..................... 9
E09. During the past 30 days, did you visit any government buildings or government offices?
YES.............................. 1 NO .............................. 2 → SKIP TO E11 DON’T KNOW ............. 7 → SKIP TO E11 REFUSED ..................... 9 → SKIP TO E11
E10. Did anyone smoke inside of any government buildings or government offices that you visited in the past 30 days?
YES.............................. 1 NO .............................. 2 DON’T KNOW ............. 7 REFUSED ..................... 9
E11. During the past 30 days, did you visit any health care facilities?
YES.............................. 1 NO .............................. 2 → SKIP TO E13 DON’T KNOW ............. 7 → SKIP TO E13 REFUSED ..................... 9 → SKIP TO E13
A-28 Appendix A : Questionnaire
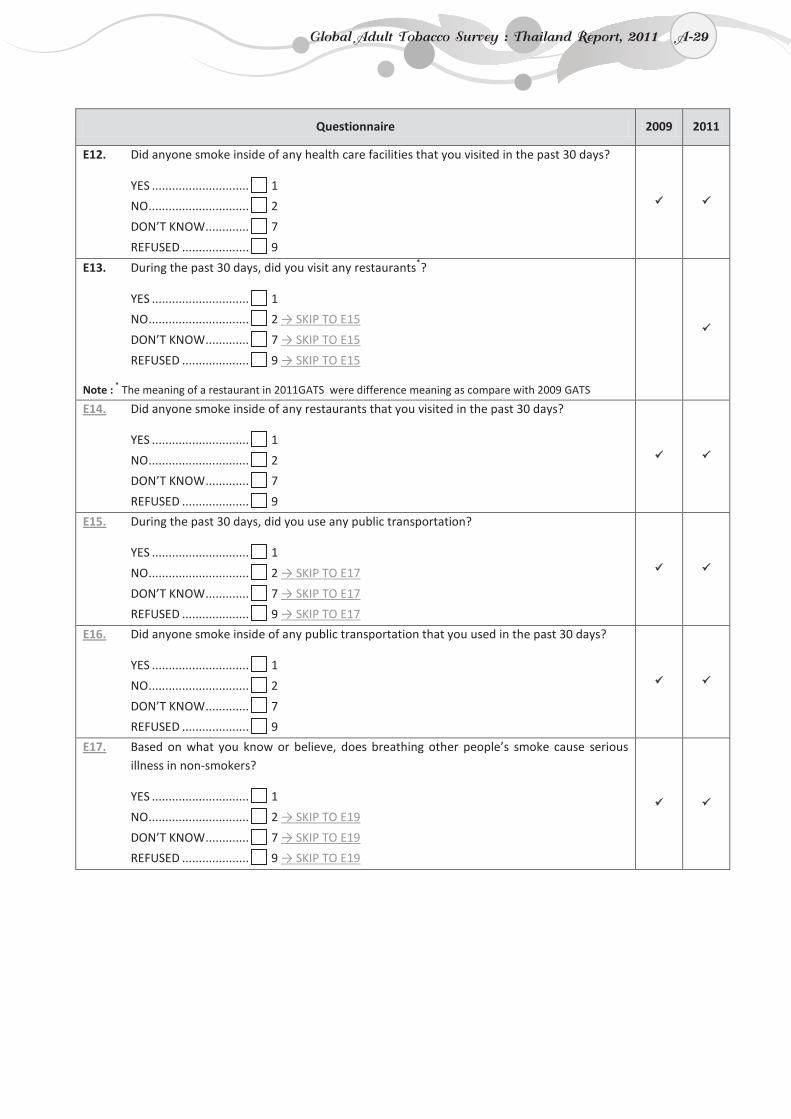
A-29
Questionnaire 2009 2011
E12. Did anyone smoke inside of any health care facilities that you visited in the past 30 days?
YES ............................. 1
NO .............................. 2
DON’T KNOW ............. 7
REFUSED .................... 9
E13. During the past 30 days, did you visit any restaurants*?
YES ............................. 1
NO .............................. 2 → SKIP TO E15
DON’T KNOW ............. 7 → SKIP TO E15
REFUSED .................... 9 → SKIP TO E15
Note : * The meaning of a restaurant in 2011GATS were difference meaning as compare with 2009 GATS
E14. Did anyone smoke inside of any restaurants that you visited in the past 30 days?
YES ............................. 1
NO .............................. 2
DON’T KNOW ............. 7
REFUSED .................... 9
E15. During the past 30 days, did you use any public transportation?
YES ............................. 1
NO .............................. 2 → SKIP TO E17
DON’T KNOW ............. 7 → SKIP TO E17
REFUSED .................... 9 → SKIP TO E17
E16. Did anyone smoke inside of any public transportation that you used in the past 30 days?
YES ............................. 1
NO .............................. 2
DON’T KNOW ............. 7
REFUSED .................... 9
E17. Based on what you know or believe, does breathing other people’s smoke cause serious illness in non-smokers?
YES ............................. 1
NO .............................. 2 → SKIP TO E19
DON’T KNOW ............. 7 → SKIP TO E19
REFUSED .................... 9 → SKIP TO E19
Global Adult Tobacco Survey : Thailand Report, 2011 A-29
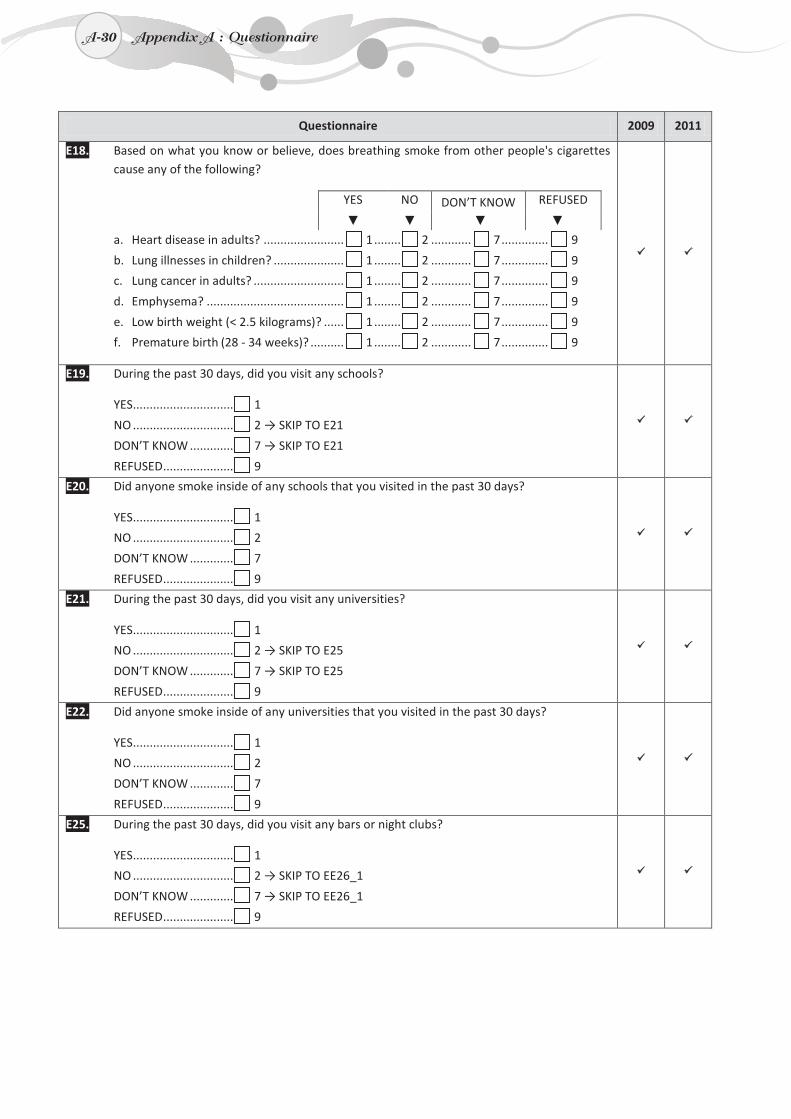
A-30
Questionnaire 2009 2011
E18. Based on what you know or believe, does breathing smoke from other people's cigarettes cause any of the following?
YES NO DON’T KNOW REFUSED
▼ ▼ ▼ ▼
a. Heart disease in adults? ........................ 1 ........ 2 ............ 7 .............. 9
b. Lung illnesses in children? ..................... 1 ........ 2 ............ 7 .............. 9
c. Lung cancer in adults? ........................... 1 ........ 2 ............ 7 .............. 9
d. Emphysema? ......................................... 1 ........ 2 ............ 7 .............. 9
e. Low birth weight (< 2.5 kilograms)? ...... 1 ........ 2 ............ 7 .............. 9
f. Premature birth (28 - 34 weeks)? .......... 1 ........ 2 ............ 7 .............. 9
E19. During the past 30 days, did you visit any schools?
YES.............................. 1
NO .............................. 2 → SKIP TO E21
DON’T KNOW ............. 7 → SKIP TO E21
REFUSED ..................... 9
E20. Did anyone smoke inside of any schools that you visited in the past 30 days?
YES.............................. 1
NO .............................. 2
DON’T KNOW ............. 7
REFUSED ..................... 9
E21. During the past 30 days, did you visit any universities?
YES.............................. 1
NO .............................. 2 → SKIP TO E25
DON’T KNOW ............. 7 → SKIP TO E25
REFUSED ..................... 9
E22. Did anyone smoke inside of any universities that you visited in the past 30 days?
YES.............................. 1
NO .............................. 2
DON’T KNOW ............. 7
REFUSED ..................... 9
E25. During the past 30 days, did you visit any bars or night clubs?
YES.............................. 1
NO .............................. 2 → SKIP TO EE26_1
DON’T KNOW ............. 7 → SKIP TO EE26_1
REFUSED ..................... 9
A-30 Appendix A : Questionnaire
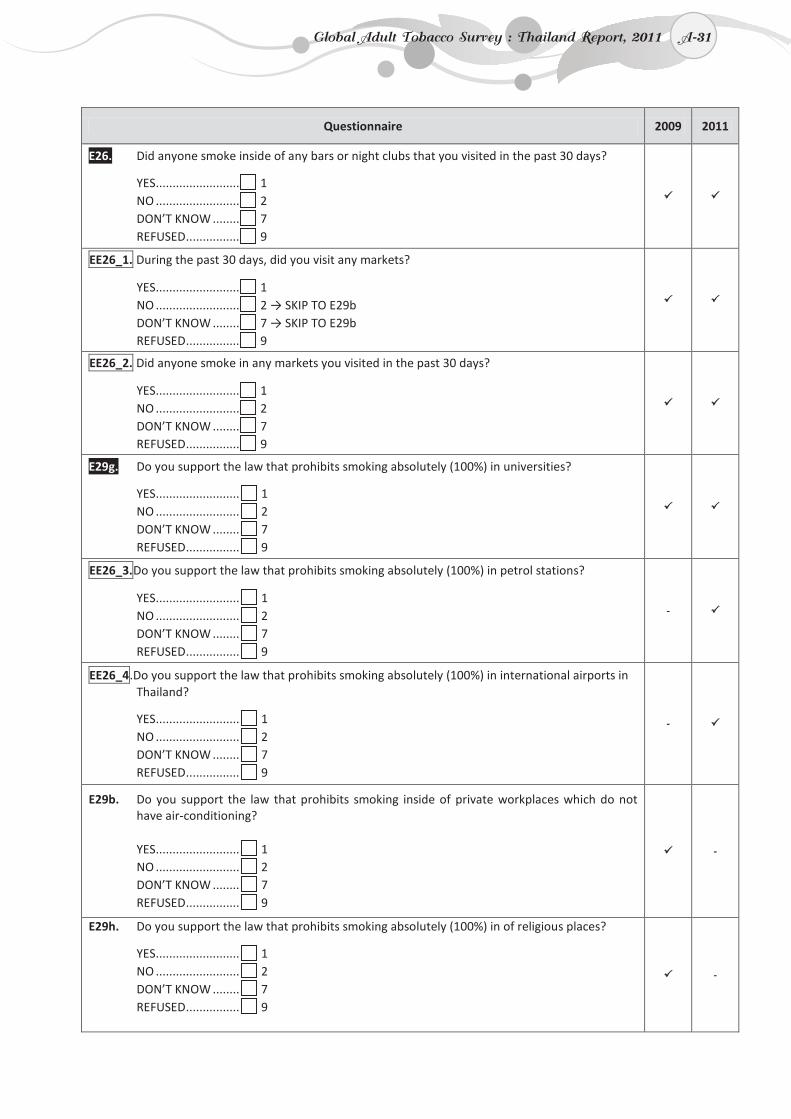
A-31
Questionnaire 2009 2011
E26. Did anyone smoke inside of any bars or night clubs that you visited in the past 30 days?
YES......................... 1 NO ......................... 2 DON’T KNOW ........ 7 REFUSED ................ 9
EE26_1. During the past 30 days, did you visit any markets?
YES......................... 1 NO ......................... 2 → SKIP TO E29b DON’T KNOW ........ 7 → SKIP TO E29b REFUSED ................ 9
EE26_2. Did anyone smoke in any markets you visited in the past 30 days?
YES......................... 1 NO ......................... 2 DON’T KNOW ........ 7 REFUSED ................ 9
E29g. Do you support the law that prohibits smoking absolutely (100%) in universities?
YES......................... 1 NO ......................... 2 DON’T KNOW ........ 7 REFUSED ................ 9
EE26_3.Do you support the law that prohibits smoking absolutely (100%) in petrol stations?
YES......................... 1 NO ......................... 2 DON’T KNOW ........ 7 REFUSED ................ 9
-
EE26_4.Do you support the law that prohibits smoking absolutely (100%) in international airports in Thailand?
YES......................... 1 NO ......................... 2 DON’T KNOW ........ 7 REFUSED ................ 9
-
E29b. Do you support the law that prohibits smoking inside of private workplaces which do not have air-conditioning? YES......................... 1 NO ......................... 2 DON’T KNOW ........ 7 REFUSED ................ 9
-
E29h. Do you support the law that prohibits smoking absolutely (100%) in of religious places?
YES......................... 1 NO ......................... 2 DON’T KNOW ........ 7 REFUSED ................ 9
-
Global Adult Tobacco Survey : Thailand Report, 2011 A-31
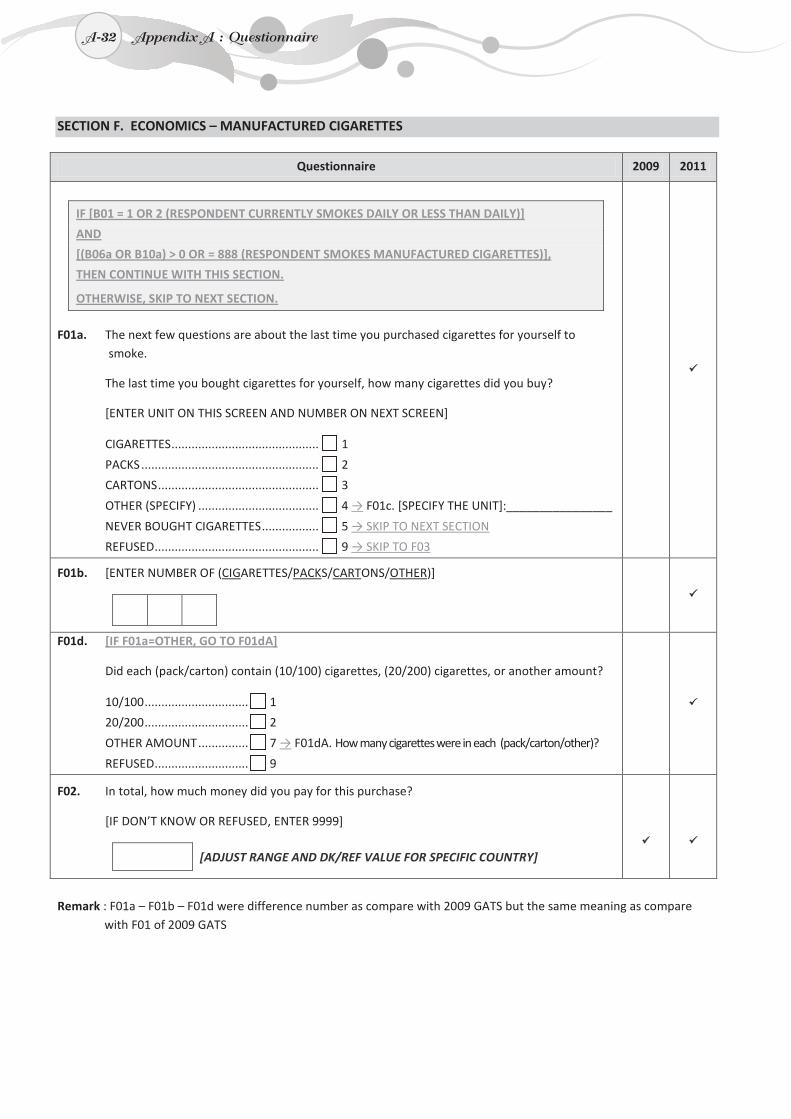
A-32
SECTION F. ECONOMICS – MANUFACTURED CIGARETTES
Questionnaire 2009 2011
IF [B01 = 1 OR 2 (RESPONDENT CURRENTLY SMOKES DAILY OR LESS THAN DAILY)]
AND
[(B06a OR B10a) > 0 OR = 888 (RESPONDENT SMOKES MANUFACTURED CIGARETTES)],
THEN CONTINUE WITH THIS SECTION.
OTHERWISE, SKIP TO NEXT SECTION.
F01a. The next few questions are about the last time you purchased cigarettes for yourself to smoke.
The last time you bought cigarettes for yourself, how many cigarettes did you buy?
[ENTER UNIT ON THIS SCREEN AND NUMBER ON NEXT SCREEN]
CIGARETTES ............................................ 1
PACKS ..................................................... 2
CARTONS ................................................ 3
OTHER (SPECIFY) .................................... 4 → F01c. [SPECIFY THE UNIT]:________________
NEVER BOUGHT CIGARETTES ................. 5 → SKIP TO NEXT SECTION
REFUSED ................................................. 9 → SKIP TO F03
F01b. [ENTER NUMBER OF (CIGARETTES/PACKS/CARTONS/OTHER)]
F01d. [IF F01a=OTHER, GO TO F01dA]
Did each (pack/carton) contain (10/100) cigarettes, (20/200) cigarettes, or another amount?
10/100 ............................... 1
20/200 ............................... 2
OTHER AMOUNT ............... 7 → F01dA. How many cigarettes were in each (pack/carton/other)?
REFUSED ............................ 9
F02. In total, how much money did you pay for this purchase?
[IF DON’T KNOW OR REFUSED, ENTER 9999]
[ADJUST RANGE AND DK/REF VALUE FOR SPECIFIC COUNTRY]
Remark : F01a – F01b – F01d were difference number as compare with 2009 GATS but the same meaning as compare
with F01 of 2009 GATS
A-32 Appendix A : Questionnaire
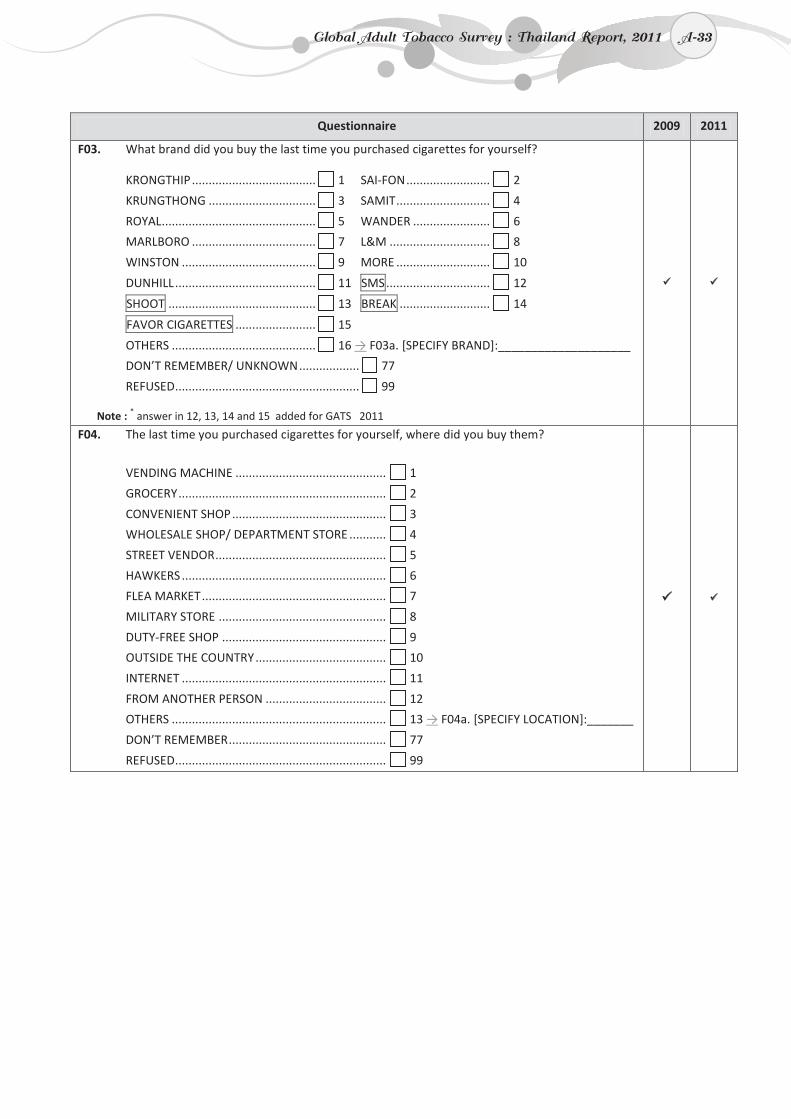
A-33
Questionnaire 2009 2011
F03. What brand did you buy the last time you purchased cigarettes for yourself?
KRONGTHIP ..................................... 1 SAI-FON ......................... 2
KRUNGTHONG ................................ 3 SAMIT ............................ 4
ROYAL .............................................. 5 WANDER ....................... 6
MARLBORO ..................................... 7 L&M .............................. 8
WINSTON ........................................ 9 MORE ............................ 10
DUNHILL .......................................... 11 SMS ............................... 12
SHOOT ............................................ 13 BREAK ........................... 14
FAVOR CIGARETTES ........................ 15
OTHERS ........................................... 16 → F03a. [SPECIFY BRAND]:____________________
DON’T REMEMBER/ UNKNOWN .................. 77
REFUSED ....................................................... 99
Note : * answer in 12, 13, 14 and 15 added for GATS 2011
F04. The last time you purchased cigarettes for yourself, where did you buy them?
VENDING MACHINE ............................................. 1
GROCERY .............................................................. 2
CONVENIENT SHOP .............................................. 3
WHOLESALE SHOP/ DEPARTMENT STORE ........... 4
STREET VENDOR ................................................... 5
HAWKERS ............................................................. 6
FLEA MARKET ....................................................... 7
MILITARY STORE .................................................. 8
DUTY-FREE SHOP ................................................. 9
OUTSIDE THE COUNTRY ....................................... 10
INTERNET ............................................................. 11
FROM ANOTHER PERSON .................................... 12
OTHERS ................................................................ 13 → F04a. [SPECIFY LOCATION]:_______
DON’T REMEMBER ............................................... 77
REFUSED ............................................................... 99
Global Adult Tobacco Survey : Thailand Report, 2011 A-33
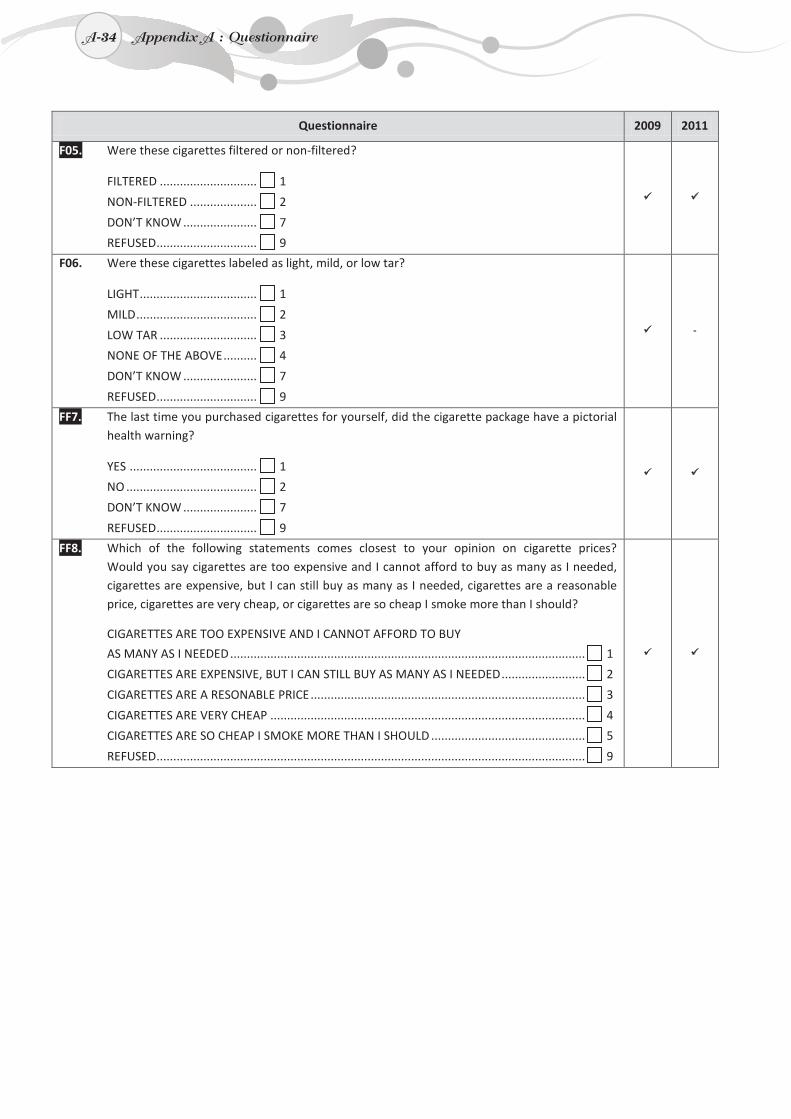
A-34
Questionnaire 2009 2011
F05. Were these cigarettes filtered or non-filtered?
FILTERED ............................. 1
NON-FILTERED .................... 2
DON’T KNOW ...................... 7
REFUSED .............................. 9
F06. Were these cigarettes labeled as light, mild, or low tar?
LIGHT ................................... 1
MILD .................................... 2
LOW TAR ............................. 3
NONE OF THE ABOVE .......... 4
DON’T KNOW ...................... 7
REFUSED .............................. 9
-
FF7. The last time you purchased cigarettes for yourself, did the cigarette package have a pictorial health warning?
YES ...................................... 1
NO ....................................... 2
DON’T KNOW ...................... 7
REFUSED .............................. 9
FF8. Which of the following statements comes closest to your opinion on cigarette prices? Would you say cigarettes are too expensive and I cannot afford to buy as many as I needed, cigarettes are expensive, but I can still buy as many as I needed, cigarettes are a reasonable price, cigarettes are very cheap, or cigarettes are so cheap I smoke more than I should?
CIGARETTES ARE TOO EXPENSIVE AND I CANNOT AFFORD TO BUY
AS MANY AS I NEEDED .......................................................................................................... 1
CIGARETTES ARE EXPENSIVE, BUT I CAN STILL BUY AS MANY AS I NEEDED ......................... 2
CIGARETTES ARE A RESONABLE PRICE .................................................................................. 3
CIGARETTES ARE VERY CHEAP .............................................................................................. 4
CIGARETTES ARE SO CHEAP I SMOKE MORE THAN I SHOULD .............................................. 5
REFUSED ................................................................................................................................ 9
A-34 Appendix A : Questionnaire
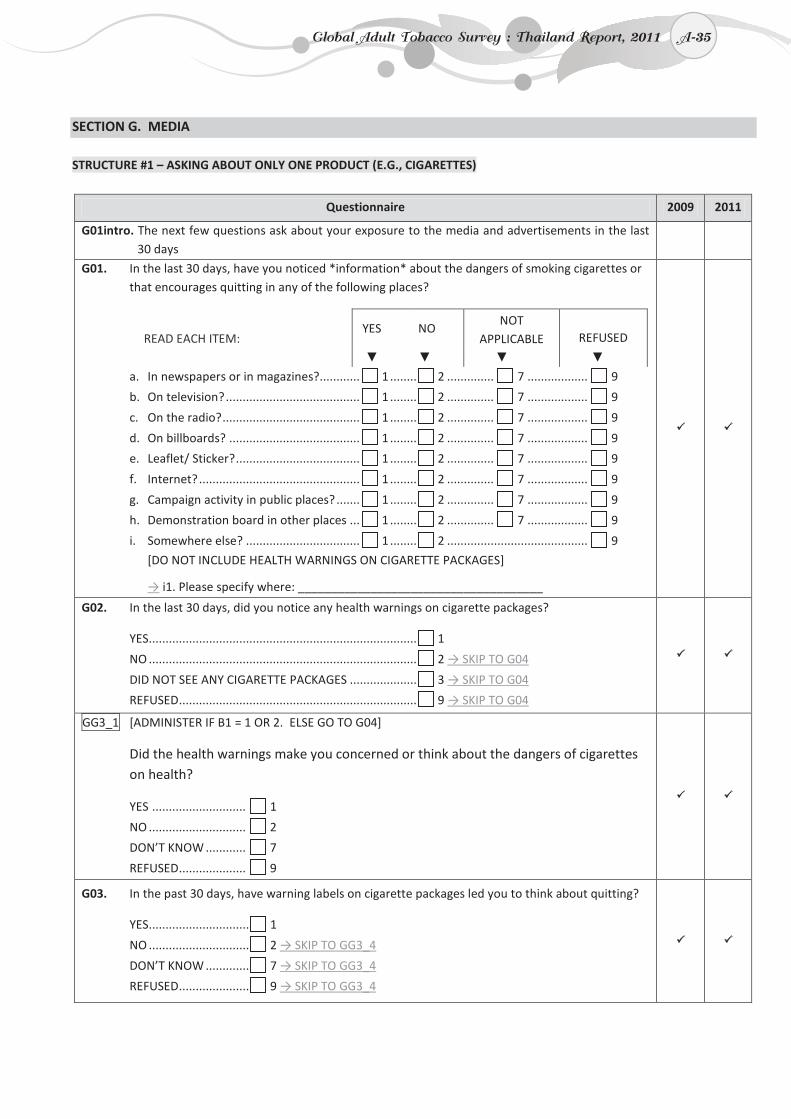
A-35
SECTION G. MEDIA
STRUCTURE #1 – ASKING ABOUT ONLY ONE PRODUCT (E.G., CIGARETTES)
Questionnaire 2009 2011
G01intro. The next few questions ask about your exposure to the media and advertisements in the last 30 days
G01. In the last 30 days, have you noticed *information* about the dangers of smoking cigarettes or that encourages quitting in any of the following places?
READ EACH ITEM: YES NO
NOT APPLICABLE
REFUSED
▼ ▼ ▼ ▼
a. In newspapers or in magazines?............ 1 ........ 2 .............. 7 .................. 9
b. On television? ........................................ 1 ........ 2 .............. 7 .................. 9
c. On the radio? ......................................... 1 ........ 2 .............. 7 .................. 9
d. On billboards? ....................................... 1 ........ 2 .............. 7 .................. 9
e. Leaflet/ Sticker? ..................................... 1 ........ 2 .............. 7 .................. 9
f. Internet? ................................................ 1 ........ 2 .............. 7 .................. 9
g. Campaign activity in public places? ....... 1 ........ 2 .............. 7 .................. 9
h. Demonstration board in other places ... 1 ........ 2 .............. 7 .................. 9
i. Somewhere else? .................................. 1 ........ 2 .......................................... 9
[DO NOT INCLUDE HEALTH WARNINGS ON CIGARETTE PACKAGES]
→ i1. Please specify where: _____________________________________
G02. In the last 30 days, did you notice any health warnings on cigarette packages?
YES................................................................................ 1
NO ................................................................................ 2 → SKIP TO G04
DID NOT SEE ANY CIGARETTE PACKAGES .................... 3 → SKIP TO G04
REFUSED ....................................................................... 9 → SKIP TO G04
GG3_1 [ADMINISTER IF B1 = 1 OR 2. ELSE GO TO G04]
Did the health warnings make you concerned or think about the dangers of cigarettes on health?
YES ............................ 1
NO ............................. 2
DON’T KNOW ............ 7
REFUSED .................... 9
G03. In the past 30 days, have warning labels on cigarette packages led you to think about quitting?
YES.............................. 1
NO .............................. 2 → SKIP TO GG3_4
DON’T KNOW ............. 7 → SKIP TO GG3_4
REFUSED ..................... 9 → SKIP TO GG3_4
Global Adult Tobacco Survey : Thailand Report, 2011 A-35
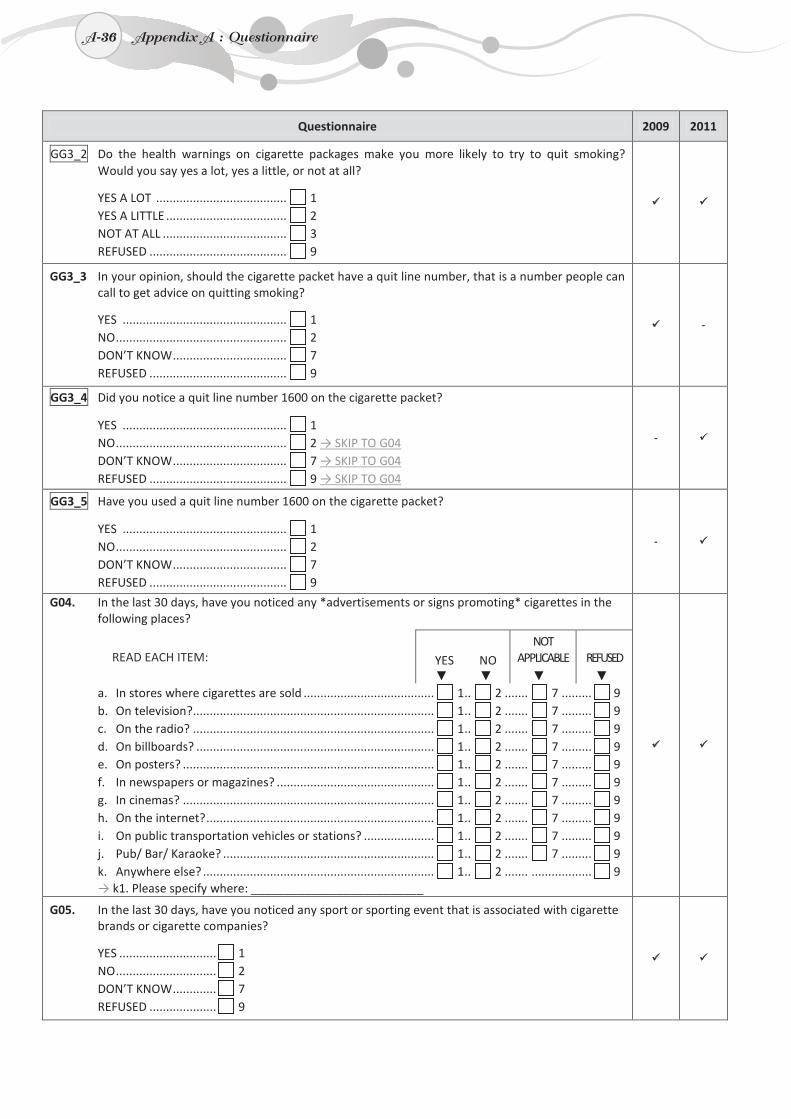
A-36
Questionnaire 2009 2011
GG3_2 Do the health warnings on cigarette packages make you more likely to try to quit smoking? Would you say yes a lot, yes a little, or not at all?
YES A LOT ....................................... 1 YES A LITTLE .................................... 2 NOT AT ALL ..................................... 3 REFUSED ......................................... 9
GG3_3 In your opinion, should the cigarette packet have a quit line number, that is a number people can call to get advice on quitting smoking?
YES ................................................. 1 NO ................................................... 2 DON’T KNOW .................................. 7 REFUSED ......................................... 9
-
GG3_4 Did you notice a quit line number 1600 on the cigarette packet?
YES ................................................. 1 NO ................................................... 2 → SKIP TO G04 DON’T KNOW .................................. 7 → SKIP TO G04 REFUSED ......................................... 9 → SKIP TO G04
-
GG3_5 Have you used a quit line number 1600 on the cigarette packet?
YES ................................................. 1 NO ................................................... 2 DON’T KNOW .................................. 7 REFUSED ......................................... 9
-
G04. In the last 30 days, have you noticed any *advertisements or signs promoting* cigarettes in the following places?
READ EACH ITEM:
YES
NO
NOT APPLICABLE
REFUSED
▼ ▼ ▼ ▼ a. In stores where cigarettes are sold ....................................... 1 .. 2 ....... 7 ......... 9 b. On television?........................................................................ 1 .. 2 ....... 7 ......... 9 c. On the radio? ........................................................................ 1 .. 2 ....... 7 ......... 9 d. On billboards? ....................................................................... 1 .. 2 ....... 7 ......... 9 e. On posters? ........................................................................... 1 .. 2 ....... 7 ......... 9 f. In newspapers or magazines? ............................................... 1 .. 2 ....... 7 ......... 9 g. In cinemas? ........................................................................... 1 .. 2 ....... 7 ......... 9 h. On the internet? .................................................................... 1 .. 2 ....... 7 ......... 9 i. On public transportation vehicles or stations? ..................... 1 .. 2 ....... 7 ......... 9 j. Pub/ Bar/ Karaoke? ............................................................... 1 .. 2 ....... 7 ......... 9 k. Anywhere else? ..................................................................... 1 .. 2 ....... .................. 9 → k1. Please specify where: __________________________
G05. In the last 30 days, have you noticed any sport or sporting event that is associated with cigarette brands or cigarette companies?
YES ............................. 1 NO .............................. 2 DON’T KNOW ............. 7 REFUSED .................... 9
A-36 Appendix A : Questionnaire
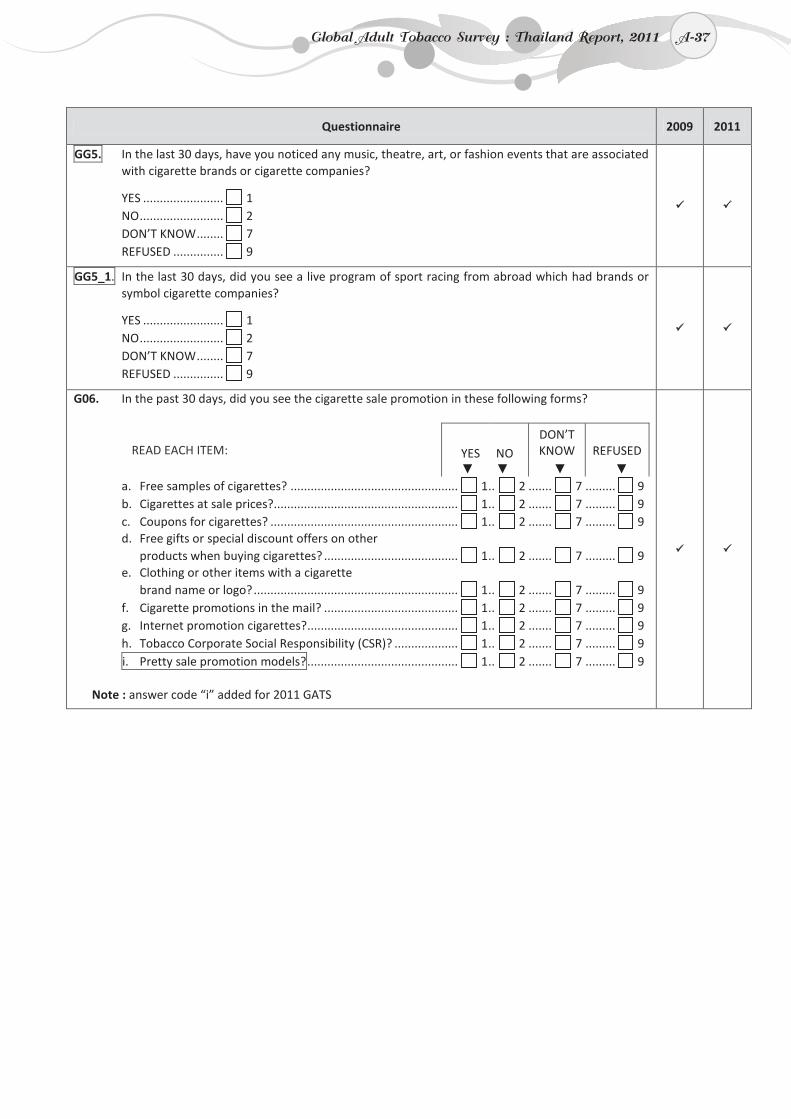
A-37
Questionnaire 2009 2011
GG5. In the last 30 days, have you noticed any music, theatre, art, or fashion events that are associated with cigarette brands or cigarette companies?
YES ........................ 1 NO ......................... 2 DON’T KNOW ........ 7 REFUSED ............... 9
GG5_1. In the last 30 days, did you see a live program of sport racing from abroad which had brands or symbol cigarette companies?
YES ........................ 1 NO ......................... 2 DON’T KNOW ........ 7 REFUSED ............... 9
G06. In the past 30 days, did you see the cigarette sale promotion in these following forms?
READ EACH ITEM: YES
NO
DON’T KNOW
REFUSED
▼ ▼ ▼ ▼ a. Free samples of cigarettes? .................................................. 1 .. 2 ....... 7 ......... 9 b. Cigarettes at sale prices?....................................................... 1 .. 2 ....... 7 ......... 9 c. Coupons for cigarettes? ........................................................ 1 .. 2 ....... 7 ......... 9 d. Free gifts or special discount offers on other
products when buying cigarettes? ........................................ 1 .. 2 ....... 7 ......... 9 e. Clothing or other items with a cigarette
brand name or logo? ............................................................. 1 .. 2 ....... 7 ......... 9 f. Cigarette promotions in the mail? ........................................ 1 .. 2 ....... 7 ......... 9 g. Internet promotion cigarettes? ............................................. 1 .. 2 ....... 7 ......... 9 h. Tobacco Corporate Social Responsibility (CSR)? ................... 1 .. 2 ....... 7 ......... 9 i. Pretty sale promotion models? ............................................. 1 .. 2 ....... 7 ......... 9
Note : answer code “i” added for 2011 GATS
Global Adult Tobacco Survey : Thailand Report, 2011 A-37
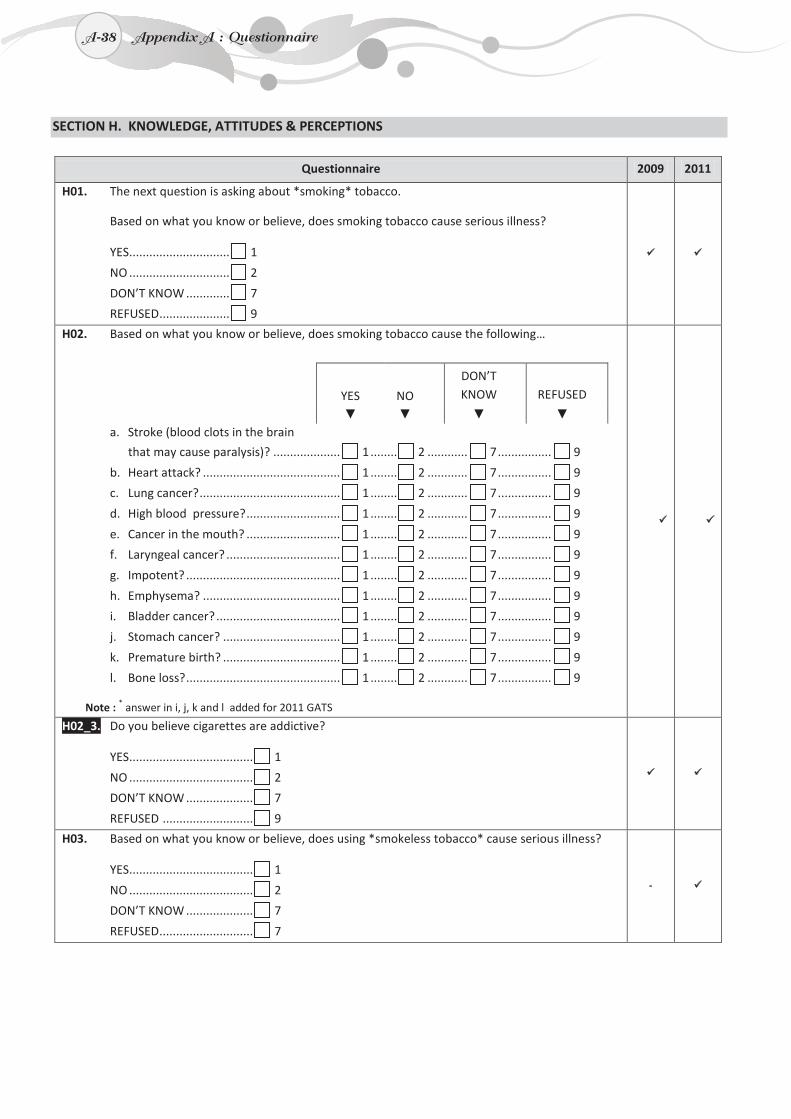
A-38
SECTION H. KNOWLEDGE, ATTITUDES & PERCEPTIONS
Questionnaire 2009 2011
H01. The next question is asking about *smoking* tobacco.
Based on what you know or believe, does smoking tobacco cause serious illness?
YES.............................. 1
NO .............................. 2
DON’T KNOW ............. 7
REFUSED ..................... 9
H02. Based on what you know or believe, does smoking tobacco cause the following…
YES
NO
DON’T KNOW
REFUSED
▼ ▼ ▼ ▼ a. Stroke (blood clots in the brain
that may cause paralysis)? .................... 1 ........ 2 ............ 7 ................ 9
b. Heart attack? ......................................... 1 ........ 2 ............ 7 ................ 9
c. Lung cancer? .......................................... 1 ........ 2 ............ 7 ................ 9
d. High blood pressure? ............................ 1 ........ 2 ............ 7 ................ 9
e. Cancer in the mouth? ............................ 1 ........ 2 ............ 7 ................ 9
f. Laryngeal cancer? .................................. 1 ........ 2 ............ 7 ................ 9
g. Impotent? .............................................. 1 ........ 2 ............ 7 ................ 9
h. Emphysema? ......................................... 1 ........ 2 ............ 7 ................ 9
i. Bladder cancer? ..................................... 1 ........ 2 ............ 7 ................ 9
j. Stomach cancer? ................................... 1 ........ 2 ............ 7 ................ 9
k. Premature birth? ................................... 1 ........ 2 ............ 7 ................ 9
l. Bone loss? .............................................. 1 ........ 2 ............ 7 ................ 9
Note : * answer in i, j, k and l added for 2011 GATS
H02_3. Do you believe cigarettes are addictive?
YES..................................... 1
NO ..................................... 2
DON’T KNOW .................... 7
REFUSED ........................... 9
H03. Based on what you know or believe, does using *smokeless tobacco* cause serious illness?
YES..................................... 1
NO ..................................... 2
DON’T KNOW .................... 7
REFUSED ............................ 7
-
A-38 Appendix A : Questionnaire
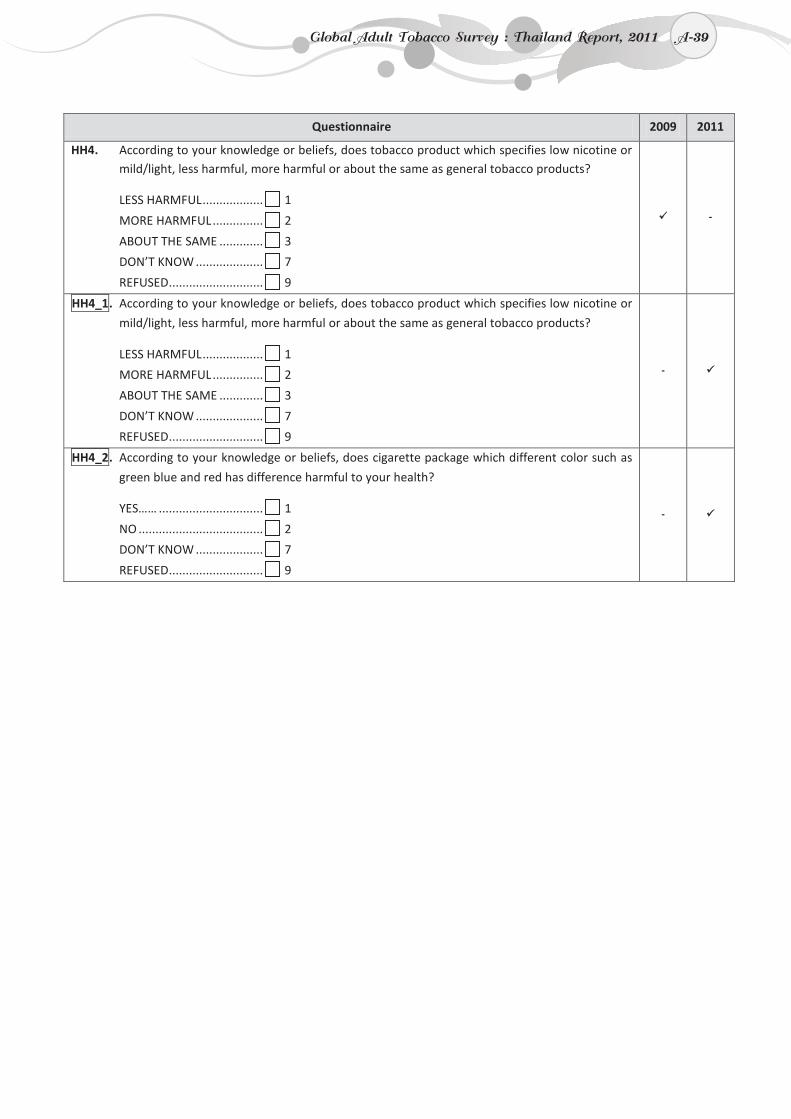
A-39
Questionnaire 2009 2011
HH4. According to your knowledge or beliefs, does tobacco product which specifies low nicotine or mild/light, less harmful, more harmful or about the same as general tobacco products?
LESS HARMFUL .................. 1
MORE HARMFUL ............... 2
ABOUT THE SAME ............. 3
DON’T KNOW .................... 7
REFUSED ............................ 9
-
HH4_1. According to your knowledge or beliefs, does tobacco product which specifies low nicotine or
mild/light, less harmful, more harmful or about the same as general tobacco products?
LESS HARMFUL .................. 1
MORE HARMFUL ............... 2
ABOUT THE SAME ............. 3
DON’T KNOW .................... 7
REFUSED ............................ 9
-
HH4_2. According to your knowledge or beliefs, does cigarette package which different color such as
green blue and red has difference harmful to your health?
YES…… ............................... 1
NO ..................................... 2
DON’T KNOW .................... 7
REFUSED ............................ 9
-
Global Adult Tobacco Survey : Thailand Report, 2011 A-39
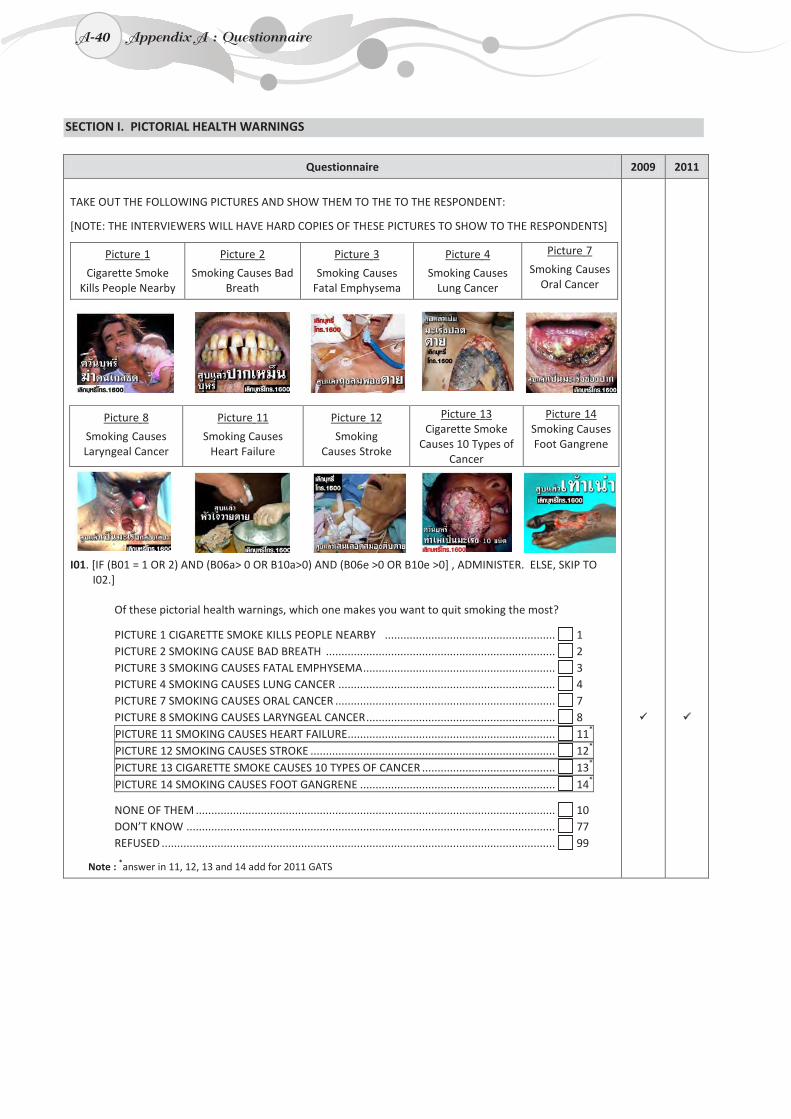
A-40
SECTION I. PICTORIAL HEALTH WARNINGS
Questionnaire 2009 2011
TAKE OUT THE FOLLOWING PICTURES AND SHOW THEM TO THE TO THE RESPONDENT:
[NOTE: THE INTERVIEWERS WILL HAVE HARD COPIES OF THESE PICTURES TO SHOW TO THE RESPONDENTS]
Picture 1
Cigarette Smoke Kills People Nearby
Picture 2
Smoking Causes Bad Breath
Picture 3
Smoking Causes Fatal Emphysema
Picture 4
Smoking Causes Lung Cancer
Picture 7
Smoking Causes Oral Cancer
Picture 8
Smoking Causes Laryngeal Cancer
Picture 11
Smoking Causes Heart Failure
Picture 12
Smoking Causes Stroke
Picture 13 Cigarette Smoke
Causes 10 Types of Cancer
Picture 14 Smoking Causes Foot Gangrene
I01. [IF (B01 = 1 OR 2) AND (B06a> 0 OR B10a>0) AND (B06e >0 OR B10e >0] , ADMINISTER. ELSE, SKIP TO I02.]
Of these pictorial health warnings, which one makes you want to quit smoking the most?
PICTURE 1 CIGARETTE SMOKE KILLS PEOPLE NEARBY ....................................................... 1 PICTURE 2 SMOKING CAUSE BAD BREATH .......................................................................... 2 PICTURE 3 SMOKING CAUSES FATAL EMPHYSEMA .............................................................. 3 PICTURE 4 SMOKING CAUSES LUNG CANCER ...................................................................... 4 PICTURE 7 SMOKING CAUSES ORAL CANCER ....................................................................... 7 PICTURE 8 SMOKING CAUSES LARYNGEAL CANCER ............................................................. 8 PICTURE 11 SMOKING CAUSES HEART FAILURE................................................................... 11* PICTURE 12 SMOKING CAUSES STROKE ............................................................................... 12* PICTURE 13 CIGARETTE SMOKE CAUSES 10 TYPES OF CANCER ........................................... 13* PICTURE 14 SMOKING CAUSES FOOT GANGRENE ............................................................... 14*
NONE OF THEM .................................................................................................................... 10DON’T KNOW ....................................................................................................................... 77 REFUSED ............................................................................................................................... 99
Note : *answer in 11, 12, 13 and 14 add for 2011 GATS
A-40 Appendix A : Questionnaire
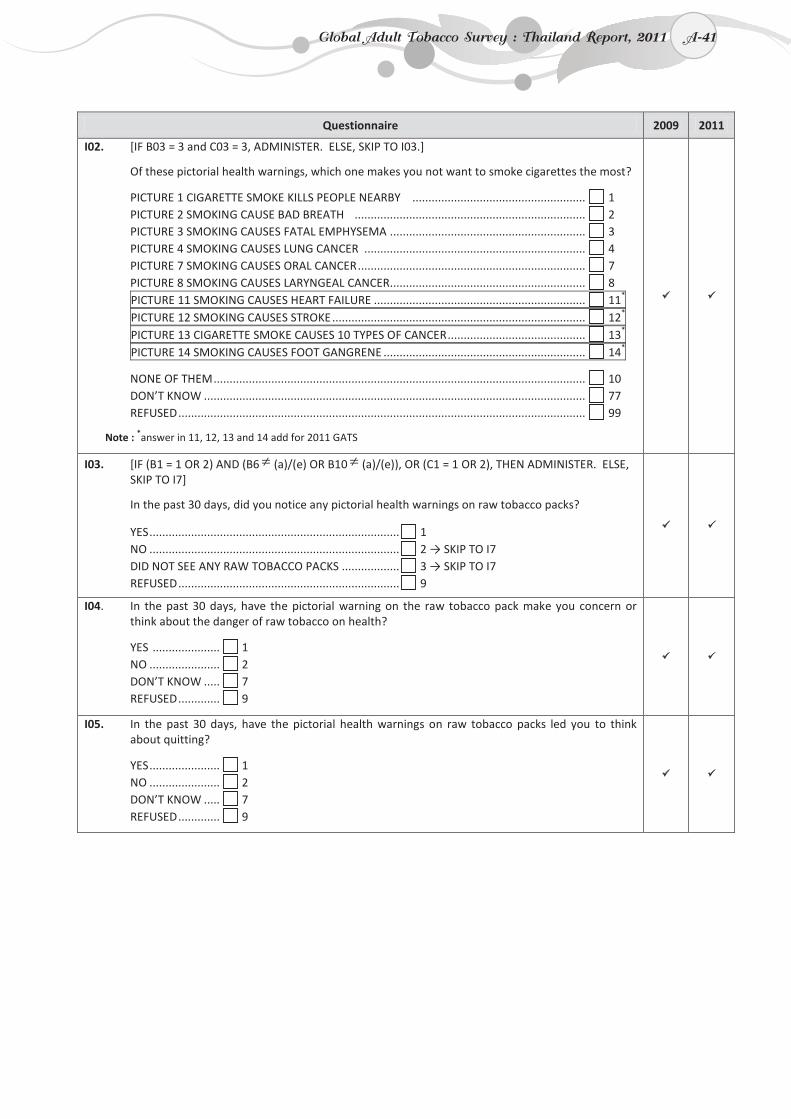
A-41
Questionnaire 2009 2011
I02. [IF B03 = 3 and C03 = 3, ADMINISTER. ELSE, SKIP TO I03.]
Of these pictorial health warnings, which one makes you not want to smoke cigarettes the most?
PICTURE 1 CIGARETTE SMOKE KILLS PEOPLE NEARBY ...................................................... 1 PICTURE 2 SMOKING CAUSE BAD BREATH ........................................................................ 2 PICTURE 3 SMOKING CAUSES FATAL EMPHYSEMA ............................................................. 3 PICTURE 4 SMOKING CAUSES LUNG CANCER ..................................................................... 4 PICTURE 7 SMOKING CAUSES ORAL CANCER ....................................................................... 7 PICTURE 8 SMOKING CAUSES LARYNGEAL CANCER............................................................. 8 PICTURE 11 SMOKING CAUSES HEART FAILURE .................................................................. 11* PICTURE 12 SMOKING CAUSES STROKE ............................................................................... 12* PICTURE 13 CIGARETTE SMOKE CAUSES 10 TYPES OF CANCER ........................................... 13* PICTURE 14 SMOKING CAUSES FOOT GANGRENE ............................................................... 14*
NONE OF THEM .................................................................................................................... 10DON’T KNOW ....................................................................................................................... 77 REFUSED ............................................................................................................................... 99
Note : *answer in 11, 12, 13 and 14 add for 2011 GATS
I03. [IF (B1 = 1 OR 2) AND (B6≠ (a)/(e) OR B10≠ (a)/(e)), OR (C1 = 1 OR 2), THEN ADMINISTER. ELSE, SKIP TO I7]
In the past 30 days, did you notice any pictorial health warnings on raw tobacco packs?
YES .............................................................................. 1 NO .............................................................................. 2 → SKIP TO I7 DID NOT SEE ANY RAW TOBACCO PACKS .................. 3 → SKIP TO I7 REFUSED ..................................................................... 9
I04. In the past 30 days, have the pictorial warning on the raw tobacco pack make you concern or think about the danger of raw tobacco on health?
YES ..................... 1 NO ...................... 2 DON’T KNOW ..... 7 REFUSED ............. 9
I05. In the past 30 days, have the pictorial health warnings on raw tobacco packs led you to think about quitting?
YES ...................... 1 NO ...................... 2 DON’T KNOW ..... 7 REFUSED ............. 9
Global Adult Tobacco Survey : Thailand Report, 2011 A-41
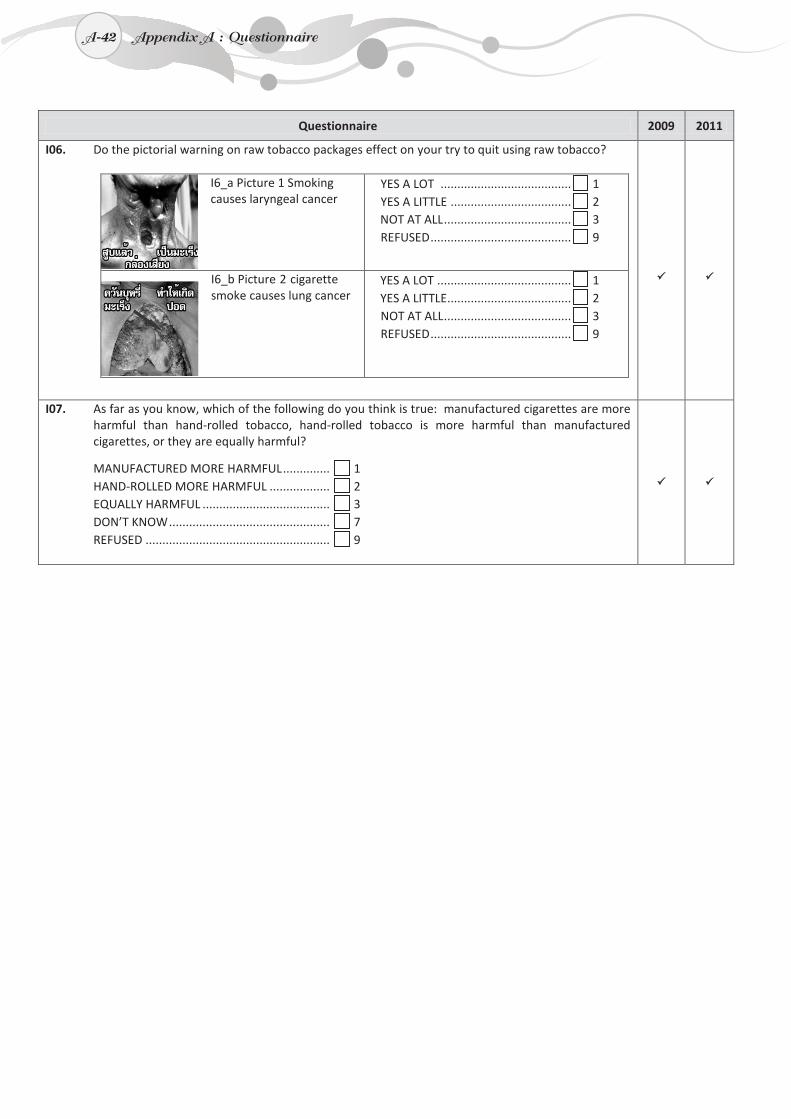
A-42
Questionnaire 2009 2011
I06. Do the pictorial warning on raw tobacco packages effect on your try to quit using raw tobacco?
I6_a Picture 1 Smokingcauses laryngeal cancer
YES A LOT ....................................... 1 YES A LITTLE .................................... 2
NOT AT ALL ...................................... 3 REFUSED .......................................... 9
I6_b Picture 2 cigarette smoke causes lung cancer
YES A LOT ........................................ 1 YES A LITTLE ..................................... 2
NOT AT ALL ...................................... 3 REFUSED .......................................... 9
I07. As far as you know, which of the following do you think is true: manufactured cigarettes are more harmful than hand-rolled tobacco, hand-rolled tobacco is more harmful than manufactured cigarettes, or they are equally harmful?
MANUFACTURED MORE HARMFUL .............. 1 HAND-ROLLED MORE HARMFUL .................. 2 EQUALLY HARMFUL ...................................... 3 DON’T KNOW ................................................ 7 REFUSED ....................................................... 9
A-42 Appendix A : Questionnaire
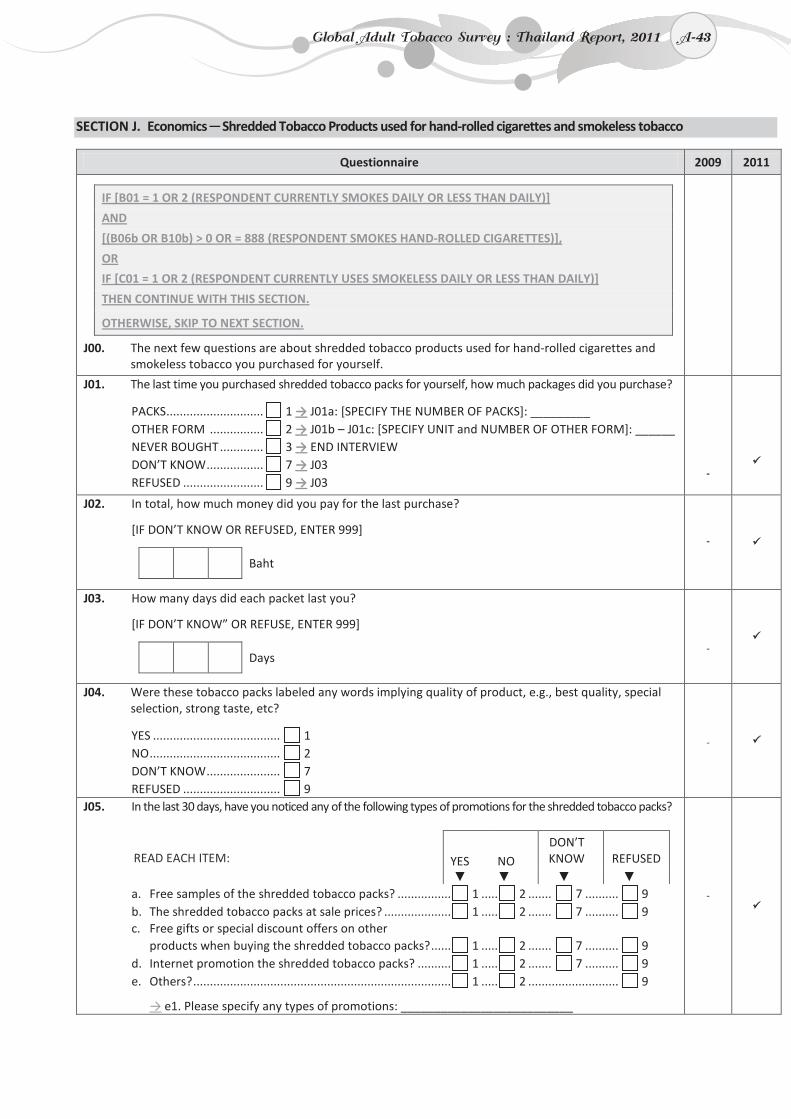
A-43
SECTION J. Economics ─ Shredded Tobacco Products used for hand-rolled cigarettes and smokeless tobacco
Questionnaire 2009 2011
IF [B01 = 1 OR 2 (RESPONDENT CURRENTLY SMOKES DAILY OR LESS THAN DAILY)]
AND
[(B06b OR B10b) > 0 OR = 888 (RESPONDENT SMOKES HAND-ROLLED CIGARETTES)],
OR
IF [C01 = 1 OR 2 (RESPONDENT CURRENTLY USES SMOKELESS DAILY OR LESS THAN DAILY)]
THEN CONTINUE WITH THIS SECTION.
OTHERWISE, SKIP TO NEXT SECTION.
J00. The next few questions are about shredded tobacco products used for hand-rolled cigarettes and smokeless tobacco you purchased for yourself.
J01. The last time you purchased shredded tobacco packs for yourself, how much packages did you purchase?
PACKS ............................. 1 → J01a: [SPECIFY THE NUMBER OF PACKS]: _________ OTHER FORM ................ 2 → J01b – J01c: [SPECIFY UNIT and NUMBER OF OTHER FORM]: ______ NEVER BOUGHT ............. 3 → END INTERVIEW DON’T KNOW ................. 7 → J03 REFUSED ........................ 9 → J03
-
J02. In total, how much money did you pay for the last purchase?
[IF DON’T KNOW OR REFUSED, ENTER 999]
Baht
-
J03. How many days did each packet last you?
[IF DON’T KNOW” OR REFUSE, ENTER 999]
Days
-
J04. Were these tobacco packs labeled any words implying quality of product, e.g., best quality, special selection, strong taste, etc?
YES ...................................... 1 NO ....................................... 2 DON’T KNOW ...................... 7 REFUSED ............................. 9
-
J05. In the last 30 days, have you noticed any of the following types of promotions for the shredded tobacco packs?
READ EACH ITEM:
YES
NO
DON’T KNOW
REFUSED
▼ ▼ ▼ ▼ a. Free samples of the shredded tobacco packs? ................ 1 ..... 2 ....... 7 .......... 9 b. The shredded tobacco packs at sale prices? .................... 1 ..... 2 ....... 7 .......... 9 c. Free gifts or special discount offers on other
products when buying the shredded tobacco packs? ...... 1 ..... 2 ....... 7 .......... 9 d. Internet promotion the shredded tobacco packs? .......... 1 ..... 2 ....... 7 .......... 9 e. Others? ............................................................................. 1 ..... 2 ........................... 9
→ e1. Please specify any types of promotions: __________________________
-
Global Adult Tobacco Survey : Thailand Report, 2011 A-43

A-44
End Individual Questionnaire K00. Those are all of the questions I have. Thank you very much for partcipating in this important survey. K02. [RECORD ANY NOTES ABOUT INTERVIEW:]
_______________________________________________________________________ _______________________________________________________________________ _______________________________________________________________________ _______________________________________________________________________ _______________________________________________________________________
A-44 Appendix A : Questionnaire
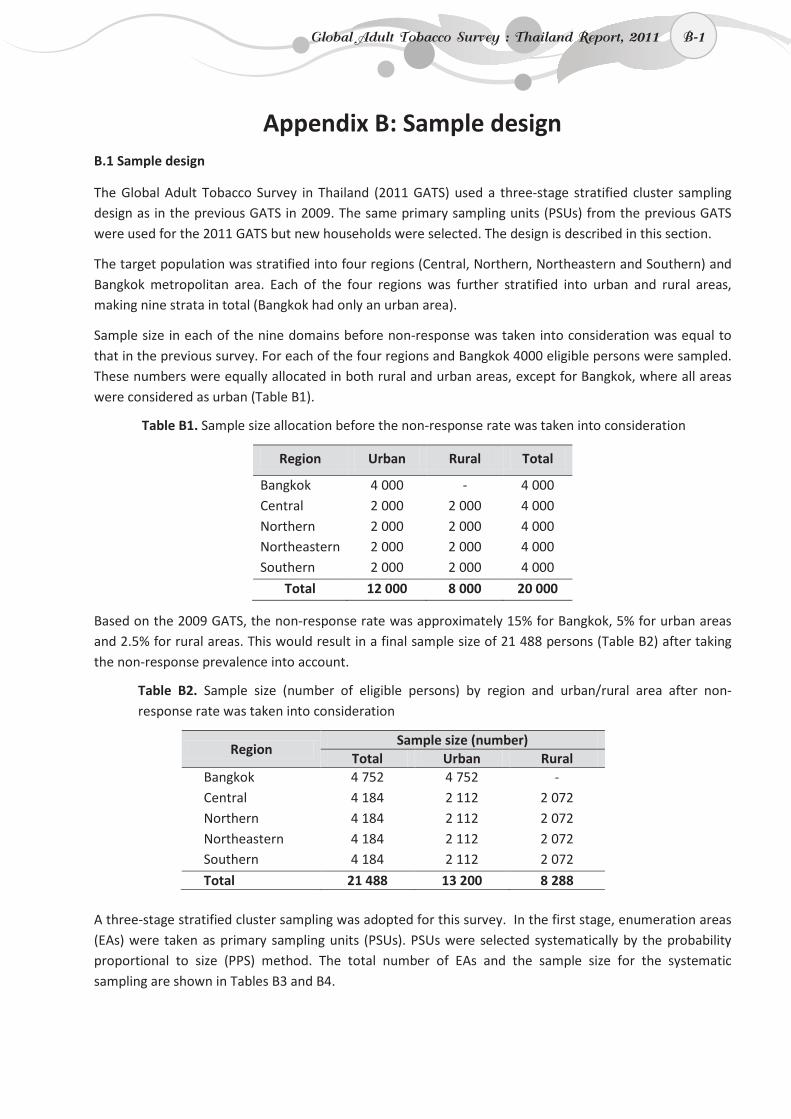
B-1
Appendix B: Sample design B.1 Sample design
The Global Adult Tobacco Survey in Thailand (2011 GATS) used a three-stage stratified cluster sampling design as in the previous GATS in 2009. The same primary sampling units (PSUs) from the previous GATS were used for the 2011 GATS but new households were selected. The design is described in this section.
The target population was stratified into four regions (Central, Northern, Northeastern and Southern) and Bangkok metropolitan area. Each of the four regions was further stratified into urban and rural areas, making nine strata in total (Bangkok had only an urban area).
Sample size in each of the nine domains before non-response was taken into consideration was equal to that in the previous survey. For each of the four regions and Bangkok 4000 eligible persons were sampled. These numbers were equally allocated in both rural and urban areas, except for Bangkok, where all areas were considered as urban (Table B1).
Table B1. Sample size allocation before the non-response rate was taken into consideration
Region Urban Rural Total
Bangkok 4 000 - 4 000 Central 2 000 2 000 4 000 Northern 2 000 2 000 4 000 Northeastern 2 000 2 000 4 000 Southern 2 000 2 000 4 000
Total 12 000 8 000 20 000
Based on the 2009 GATS, the non-response rate was approximately 15% for Bangkok, 5% for urban areas and 2.5% for rural areas. This would result in a final sample size of 21 488 persons (Table B2) after taking the non-response prevalence into account.
Table B2. Sample size (number of eligible persons) by region and urban/rural area after non-response rate was taken into consideration
Region Sample size (number)
Total Urban Rural Bangkok 4 752 4 752 - Central 4 184 2 112 2 072 Northern 4 184 2 112 2 072 Northeastern 4 184 2 112 2 072 Southern 4 184 2 112 2 072
Total 21 488 13 200 8 288 A three-stage stratified cluster sampling was adopted for this survey. In the first stage, enumeration areas (EAs) were taken as primary sampling units (PSUs). PSUs were selected systematically by the probability proportional to size (PPS) method. The total number of EAs and the sample size for the systematic sampling are shown in Tables B3 and B4.
Global Adult Tobacco Survey : Thailand Report, 2011 B-1
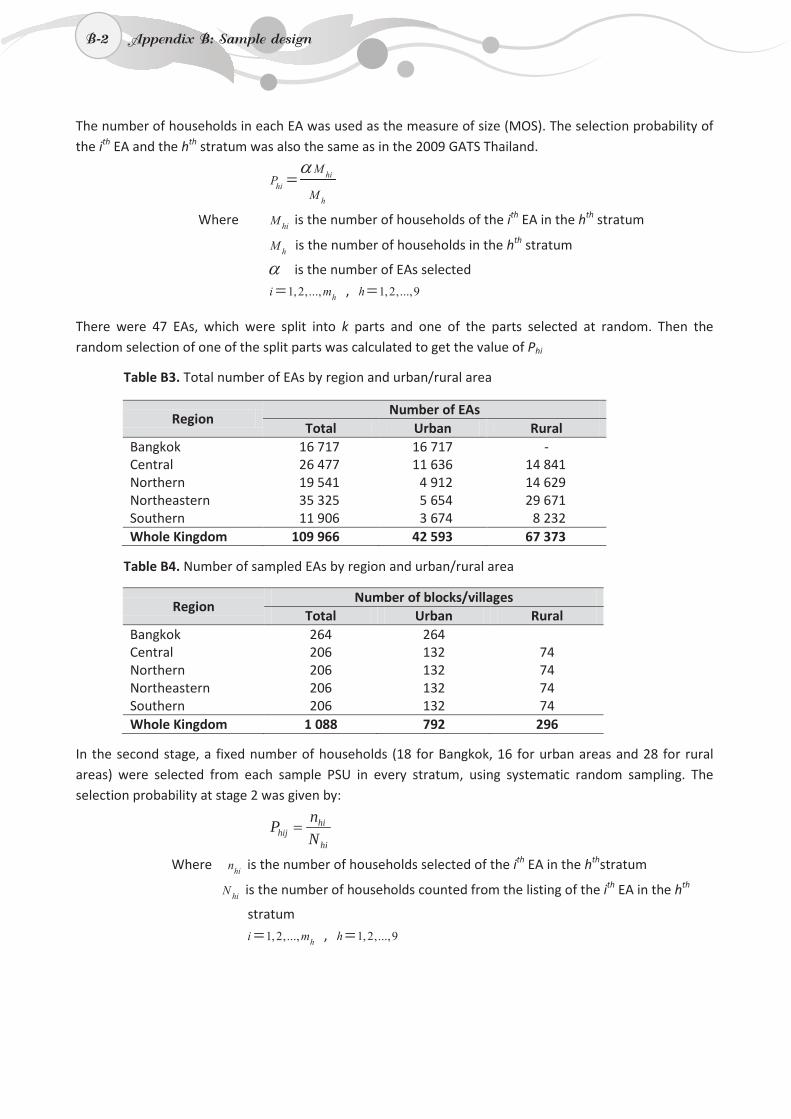
B-2
The number of households in each EA was used as the measure of size (MOS). The selection probability of the ith EA and the hth stratum was also the same as in the 2009 GATS Thailand.
hihi
h
MP
M
α=
Where hiM is the number of households of the ith EA in the hth stratum
hM is the number of households in the hth stratum
α is the number of EAs selected
1,2,..., hi m= , 1,2,...,9h=
There were 47 EAs, which were split into k parts and one of the parts selected at random. Then the random selection of one of the split parts was calculated to get the value of Phi
Table B3. Total number of EAs by region and urban/rural area
Region Number of EAs
Total Urban Rural Bangkok 16 717 16 717 - Central 26 477 11 636 14 841 Northern 19 541 4 912 14 629 Northeastern 35 325 5 654 29 671 Southern 11 906 3 674 8 232 Whole Kingdom 109 966 42 593 67 373
Table B4. Number of sampled EAs by region and urban/rural area
Region Number of blocks/villages
Total Urban Rural Bangkok 264 264 Central 206 132 74 Northern 206 132 74 Northeastern 206 132 74 Southern 206 132 74 Whole Kingdom 1 088 792 296
In the second stage, a fixed number of households (18 for Bangkok, 16 for urban areas and 28 for rural areas) were selected from each sample PSU in every stratum, using systematic random sampling. The selection probability at stage 2 was given by:
hi
hihij N
nP =
Where hin is the number of households selected of the ith EA in the hthstratum
hiN is the number of households counted from the listing of the ith EA in the hth
stratum
1,2,..., hi m= , 1,2,...,9h=
B-2 Appendix B: Sample design
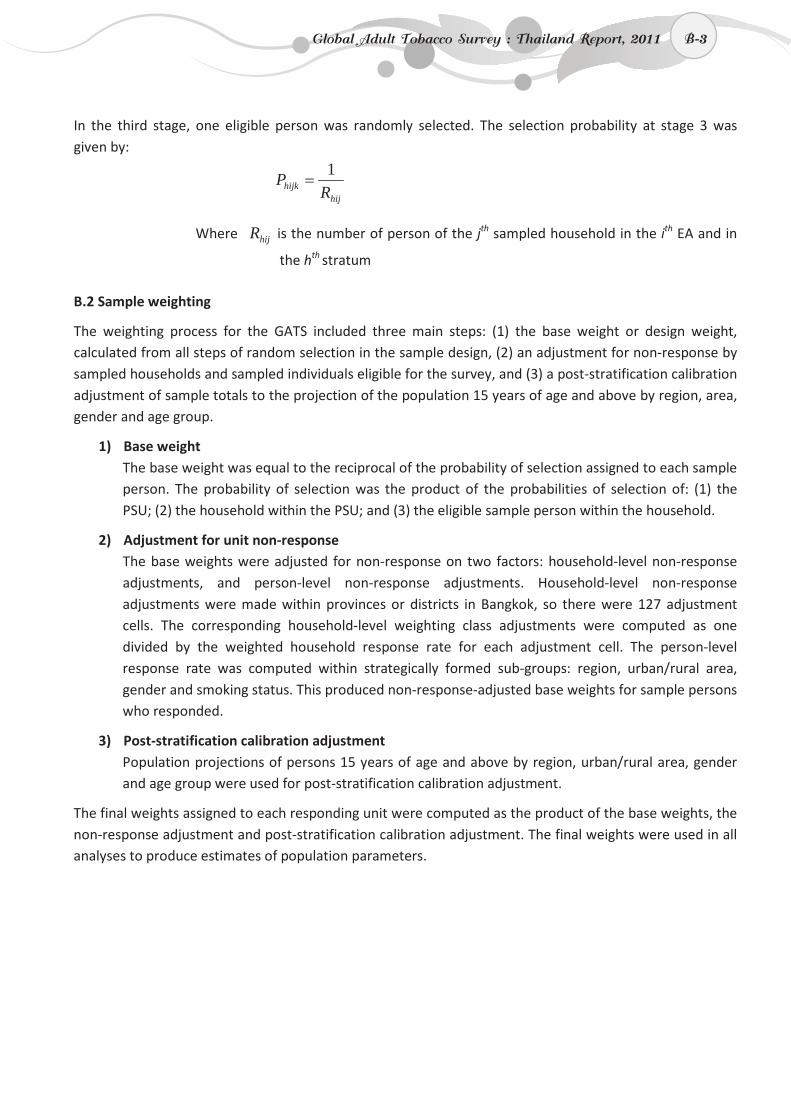
B-3
In the third stage, one eligible person was randomly selected. The selection probability at stage 3 was given by:
hijhijk R
P 1=
Where hijR is the number of person of the jth sampled household in the ith EA and in
the hth stratum
B.2 Sample weighting
The weighting process for the GATS included three main steps: (1) the base weight or design weight, calculated from all steps of random selection in the sample design, (2) an adjustment for non-response by sampled households and sampled individuals eligible for the survey, and (3) a post-stratification calibration adjustment of sample totals to the projection of the population 15 years of age and above by region, area, gender and age group.
1) Base weight The base weight was equal to the reciprocal of the probability of selection assigned to each sample person. The probability of selection was the product of the probabilities of selection of: (1) the PSU; (2) the household within the PSU; and (3) the eligible sample person within the household.
2) Adjustment for unit non-response The base weights were adjusted for non-response on two factors: household-level non-response adjustments, and person-level non-response adjustments. Household-level non-response adjustments were made within provinces or districts in Bangkok, so there were 127 adjustment cells. The corresponding household-level weighting class adjustments were computed as one divided by the weighted household response rate for each adjustment cell. The person-level response rate was computed within strategically formed sub-groups: region, urban/rural area, gender and smoking status. This produced non-response-adjusted base weights for sample persons who responded.
3) Post-stratification calibration adjustment Population projections of persons 15 years of age and above by region, urban/rural area, gender and age group were used for post-stratification calibration adjustment.
The final weights assigned to each responding unit were computed as the product of the base weights, the non-response adjustment and post-stratification calibration adjustment. The final weights were used in all analyses to produce estimates of population parameters.
Global Adult Tobacco Survey : Thailand Report, 2011 B-3
C-1
Appendix C: Estimation of sampling errors
The estimates from a sample survey are affected by two types of errors: (1) non-sampling errors, and (2) sampling errors. Non-sampling errors are the results of mistakes made in implementing data collection and data processing, such as errors in coverage, response errors, non-response errors, faulty questionnaires, interviewer recording errors, processing errors, etc. Although numerous efforts were made during the implementation of the 2011 GATS to minimize such errors, non-sampling errors are impossible to avoid and difficult to evaluate statistically.
The sample of respondents selected for the GATS is only one of the samples that could have been selected from the same population, using the same design and sample size. Each of these samples would yield results that differ somewhat from the results of the actual sample selected. Sampling errors are a measure of the variability between all possible samples. The extent of variability is not known exactly, but can be estimated statistically from the survey results.
The following sampling error measures are presented for each of the selected indicators:
• Standard error (SE): Sampling errors are usually measured in terms of standard errors for particular indicators. The standard error of an estimate is thus simply the square root of the variance of that estimate, and is computed in the same units as the estimate ˆθ .
• Design effect (deff) is the ratio of the actual variance of an indicator, under the sampling method used in the survey, to the variance calculated under the assumption of simple random sampling. The square root of the design effect, called deff, is used to show the efficiency of the sample design. A deft value of 1.0 indicates that the sample design is as efficient as a simple random sample, while a deft value above 1.0 indicates an increase in the standard error due to the use of a more complex sample design. In general, for a well-designed study, the deft usually ranges from 1 to 3. It is common, however, for the deft to be much larger, up to 7 or 8.
• Relative standard error (RSE) is the ratio of the standard error to the value of the indicator.
• Confidence limits are calculated to show the interval within which the true value for the population can be reasonably assumed to fall. For any given statistic calculated from the survey, the value of that statistic will fall within a range of plus or minus twice the standard error of the statistic in 95% of all possible samples of identical size and design.
For calculating sampling errors from the GATS data, SPSS Version 17.0 with the complexity of sample design (CSPLAN module) has been used. The results are shown in the tables that follow. In addition to the sampling error measures described above, the tables also include unweighted and weighted counts of denominators for each indicator (Table C1).
Global Adult Tobacco Survey : Thailand Report, 2011 C-1
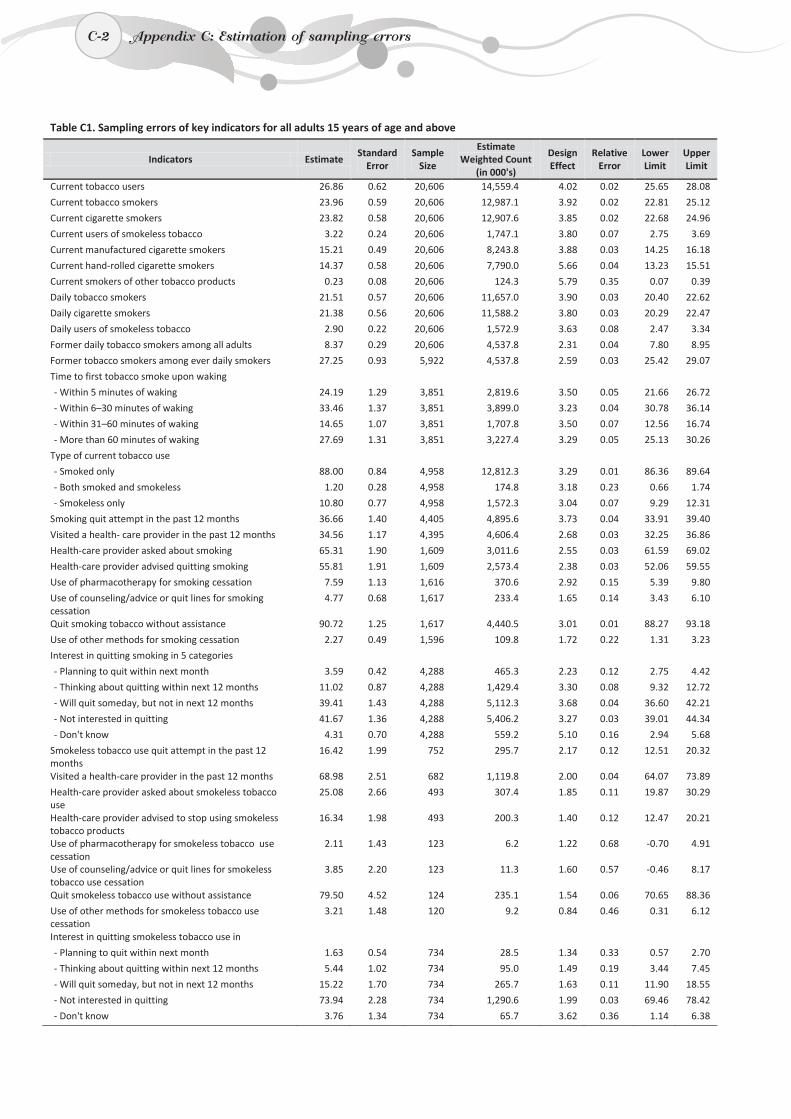
C-2
Table C1. Sampling errors of key indicators for all adults 15 years of age and above
Indicators Estimate Standard
Error Sample
Size
Estimate Weighted Count
(in 000's)
Design Effect
Relative Error
Lower Limit
Upper Limit
Current tobacco users 26.86 0.62 20,606 14,559.4 4.02 0.02 25.65 28.08
Current tobacco smokers 23.96 0.59 20,606 12,987.1 3.92 0.02 22.81 25.12
Current cigarette smokers 23.82 0.58 20,606 12,907.6 3.85 0.02 22.68 24.96
Current users of smokeless tobacco 3.22 0.24 20,606 1,747.1 3.80 0.07 2.75 3.69
Current manufactured cigarette smokers 15.21 0.49 20,606 8,243.8 3.88 0.03 14.25 16.18
Current hand-rolled cigarette smokers 14.37 0.58 20,606 7,790.0 5.66 0.04 13.23 15.51
Current smokers of other tobacco products 0.23 0.08 20,606 124.3 5.79 0.35 0.07 0.39
Daily tobacco smokers 21.51 0.57 20,606 11,657.0 3.90 0.03 20.40 22.62
Daily cigarette smokers 21.38 0.56 20,606 11,588.2 3.80 0.03 20.29 22.47
Daily users of smokeless tobacco 2.90 0.22 20,606 1,572.9 3.63 0.08 2.47 3.34
Former daily tobacco smokers among all adults 8.37 0.29 20,606 4,537.8 2.31 0.04 7.80 8.95
Former tobacco smokers among ever daily smokers 27.25 0.93 5,922 4,537.8 2.59 0.03 25.42 29.07
Time to first tobacco smoke upon waking - Within 5 minutes of waking 24.19 1.29 3,851 2,819.6 3.50 0.05 21.66 26.72
- Within 6–30 minutes of waking 33.46 1.37 3,851 3,899.0 3.23 0.04 30.78 36.14
- Within 31–60 minutes of waking 14.65 1.07 3,851 1,707.8 3.50 0.07 12.56 16.74
- More than 60 minutes of waking 27.69 1.31 3,851 3,227.4 3.29 0.05 25.13 30.26
Type of current tobacco use - Smoked only 88.00 0.84 4,958 12,812.3 3.29 0.01 86.36 89.64
- Both smoked and smokeless 1.20 0.28 4,958 174.8 3.18 0.23 0.66 1.74
- Smokeless only 10.80 0.77 4,958 1,572.3 3.04 0.07 9.29 12.31
Smoking quit attempt in the past 12 months 36.66 1.40 4,405 4,895.6 3.73 0.04 33.91 39.40
Visited a health- care provider in the past 12 months 34.56 1.17 4,395 4,606.4 2.68 0.03 32.25 36.86
Health-care provider asked about smoking 65.31 1.90 1,609 3,011.6 2.55 0.03 61.59 69.02
Health-care provider advised quitting smoking 55.81 1.91 1,609 2,573.4 2.38 0.03 52.06 59.55
Use of pharmacotherapy for smoking cessation 7.59 1.13 1,616 370.6 2.92 0.15 5.39 9.80
Use of counseling/advice or quit lines for smoking cessation
4.77 0.68 1,617 233.4 1.65 0.14 3.43 6.10
Quit smoking tobacco without assistance 90.72 1.25 1,617 4,440.5 3.01 0.01 88.27 93.18
Use of other methods for smoking cessation 2.27 0.49 1,596 109.8 1.72 0.22 1.31 3.23
Interest in quitting smoking in 5 categories - Planning to quit within next month 3.59 0.42 4,288 465.3 2.23 0.12 2.75 4.42
- Thinking about quitting within next 12 months 11.02 0.87 4,288 1,429.4 3.30 0.08 9.32 12.72
- Will quit someday, but not in next 12 months 39.41 1.43 4,288 5,112.3 3.68 0.04 36.60 42.21
- Not interested in quitting 41.67 1.36 4,288 5,406.2 3.27 0.03 39.01 44.34
- Don't know 4.31 0.70 4,288 559.2 5.10 0.16 2.94 5.68
Smokeless tobacco use quit attempt in the past 12 months
16.42 1.99 752 295.7 2.17 0.12 12.51 20.32
Visited a health-care provider in the past 12 months 68.98 2.51 682 1,119.8 2.00 0.04 64.07 73.89
Health-care provider asked about smokeless tobacco use
25.08 2.66 493 307.4 1.85 0.11 19.87 30.29
Health-care provider advised to stop using smokeless tobacco products
16.34 1.98 493 200.3 1.40 0.12 12.47 20.21
Use of pharmacotherapy for smokeless tobacco use cessation
2.11 1.43 123 6.2 1.22 0.68 -0.70 4.91
Use of counseling/advice or quit lines for smokeless tobacco use cessation
3.85 2.20 123 11.3 1.60 0.57 -0.46 8.17
Quit smokeless tobacco use without assistance 79.50 4.52 124 235.1 1.54 0.06 70.65 88.36
Use of other methods for smokeless tobacco use cessation
3.21 1.48 120 9.2 0.84 0.46 0.31 6.12
Interest in quitting smokeless tobacco use in - Planning to quit within next month 1.63 0.54 734 28.5 1.34 0.33 0.57 2.70
- Thinking about quitting within next 12 months 5.44 1.02 734 95.0 1.49 0.19 3.44 7.45
- Will quit someday, but not in next 12 months 15.22 1.70 734 265.7 1.63 0.11 11.90 18.55
- Not interested in quitting 73.94 2.28 734 1,290.6 1.99 0.03 69.46 78.42
- Don't know 3.76 1.34 734 65.7 3.62 0.36 1.14 6.38
C-2 Appendix C: Estimation of sampling errors
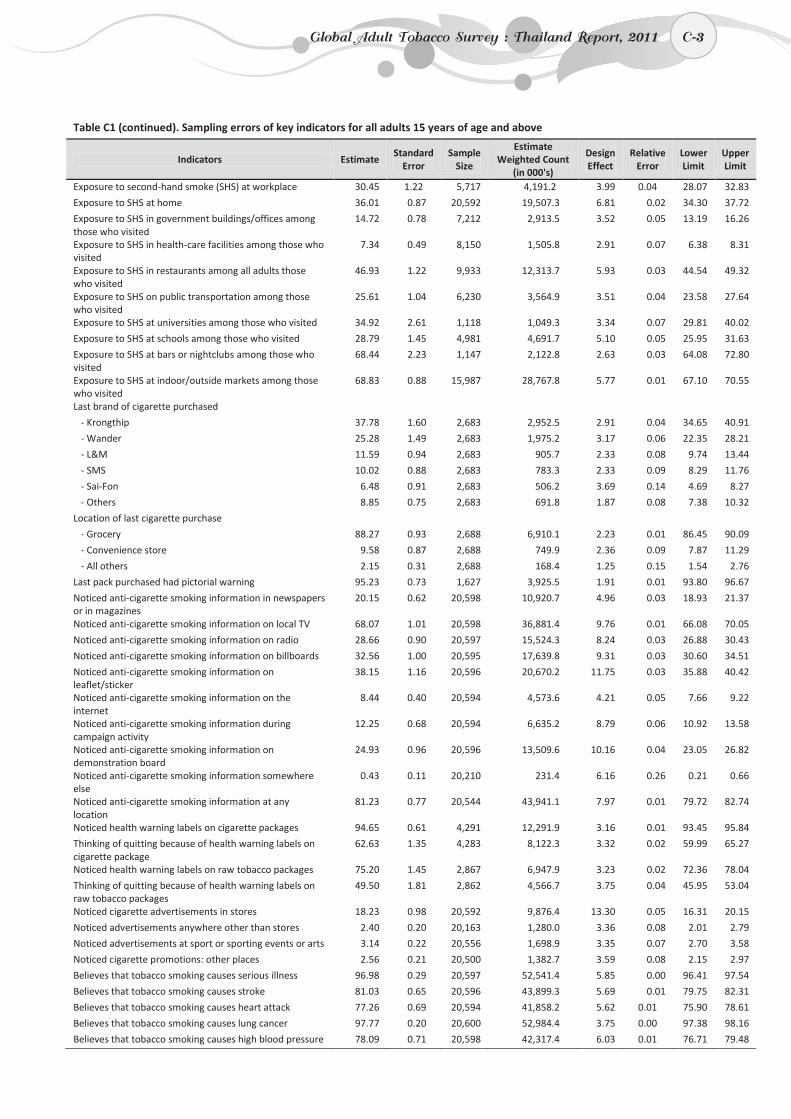
C-3
Table C1 (continued). Sampling errors of key indicators for all adults 15 years of age and above
Indicators Estimate Standard
Error Sample
Size
Estimate Weighted Count
(in 000's)
Design Effect
Relative Error
Lower Limit
Upper Limit
Exposure to second-hand smoke (SHS) at workplace 30.45 1.22 5,717 4,191.2 3.99 0.04 28.07 32.83
Exposure to SHS at home 36.01 0.87 20,592 19,507.3 6.81 0.02 34.30 37.72
Exposure to SHS in government buildings/offices among those who visited
14.72 0.78 7,212 2,913.5 3.52 0.05 13.19 16.26
Exposure to SHS in health-care facilities among those who visited
7.34 0.49 8,150 1,505.8 2.91 0.07 6.38 8.31
Exposure to SHS in restaurants among all adults those who visited
46.93 1.22 9,933 12,313.7 5.93 0.03 44.54 49.32
Exposure to SHS on public transportation among those who visited
25.61 1.04 6,230 3,564.9 3.51 0.04 23.58 27.64
Exposure to SHS at universities among those who visited 34.92 2.61 1,118 1,049.3 3.34 0.07 29.81 40.02
Exposure to SHS at schools among those who visited 28.79 1.45 4,981 4,691.7 5.10 0.05 25.95 31.63
Exposure to SHS at bars or nightclubs among those who visited
68.44 2.23 1,147 2,122.8 2.63 0.03 64.08 72.80
Exposure to SHS at indoor/outside markets among those who visited
68.83 0.88 15,987 28,767.8 5.77 0.01 67.10 70.55
Last brand of cigarette purchased - Krongthip 37.78 1.60 2,683 2,952.5 2.91 0.04 34.65 40.91
- Wander 25.28 1.49 2,683 1,975.2 3.17 0.06 22.35 28.21
- L&M 11.59 0.94 2,683 905.7 2.33 0.08 9.74 13.44
- SMS 10.02 0.88 2,683 783.3 2.33 0.09 8.29 11.76
- Sai-Fon 6.48 0.91 2,683 506.2 3.69 0.14 4.69 8.27
- Others 8.85 0.75 2,683 691.8 1.87 0.08 7.38 10.32
Location of last cigarette purchase - Grocery 88.27 0.93 2,688 6,910.1 2.23 0.01 86.45 90.09
- Convenience store 9.58 0.87 2,688 749.9 2.36 0.09 7.87 11.29
- All others 2.15 0.31 2,688 168.4 1.25 0.15 1.54 2.76
Last pack purchased had pictorial warning 95.23 0.73 1,627 3,925.5 1.91 0.01 93.80 96.67
Noticed anti-cigarette smoking information in newspapers or in magazines
20.15 0.62 20,598 10,920.7 4.96 0.03 18.93 21.37
Noticed anti-cigarette smoking information on local TV 68.07 1.01 20,598 36,881.4 9.76 0.01 66.08 70.05
Noticed anti-cigarette smoking information on radio 28.66 0.90 20,597 15,524.3 8.24 0.03 26.88 30.43
Noticed anti-cigarette smoking information on billboards 32.56 1.00 20,595 17,639.8 9.31 0.03 30.60 34.51
Noticed anti-cigarette smoking information on leaflet/sticker
38.15 1.16 20,596 20,670.2 11.75 0.03 35.88 40.42
Noticed anti-cigarette smoking information on the internet
8.44 0.40 20,594 4,573.6 4.21 0.05 7.66 9.22
Noticed anti-cigarette smoking information during campaign activity
12.25 0.68 20,594 6,635.2 8.79 0.06 10.92 13.58
Noticed anti-cigarette smoking information on demonstration board
24.93 0.96 20,596 13,509.6 10.16 0.04 23.05 26.82
Noticed anti-cigarette smoking information somewhere else
0.43 0.11 20,210 231.4 6.16 0.26 0.21 0.66
Noticed anti-cigarette smoking information at any location
81.23 0.77 20,544 43,941.1 7.97 0.01 79.72 82.74
Noticed health warning labels on cigarette packages 94.65 0.61 4,291 12,291.9 3.16 0.01 93.45 95.84
Thinking of quitting because of health warning labels on cigarette package
62.63 1.35 4,283 8,122.3 3.32 0.02 59.99 65.27
Noticed health warning labels on raw tobacco packages 75.20 1.45 2,867 6,947.9 3.23 0.02 72.36 78.04
Thinking of quitting because of health warning labels on raw tobacco packages
49.50 1.81 2,862 4,566.7 3.75 0.04 45.95 53.04
Noticed cigarette advertisements in stores 18.23 0.98 20,592 9,876.4 13.30 0.05 16.31 20.15
Noticed advertisements anywhere other than stores 2.40 0.20 20,163 1,280.0 3.36 0.08 2.01 2.79
Noticed advertisements at sport or sporting events or arts 3.14 0.22 20,556 1,698.9 3.35 0.07 2.70 3.58
Noticed cigarette promotions: other places 2.56 0.21 20,500 1,382.7 3.59 0.08 2.15 2.97
Believes that tobacco smoking causes serious illness 96.98 0.29 20,597 52,541.4 5.85 0.00 96.41 97.54
Believes that tobacco smoking causes stroke 81.03 0.65 20,596 43,899.3 5.69 0.01 79.75 82.31
Believes that tobacco smoking causes heart attack 77.26 0.69 20,594 41,858.2 5.62 0.01 75.90 78.61
Believes that tobacco smoking causes lung cancer 97.77 0.20 20,600 52,984.4 3.75 0.00 97.38 98.16
Believes that tobacco smoking causes high blood pressure 78.09 0.71 20,598 42,317.4 6.03 0.01 76.71 79.48
Global Adult Tobacco Survey : Thailand Report, 2011 C-3
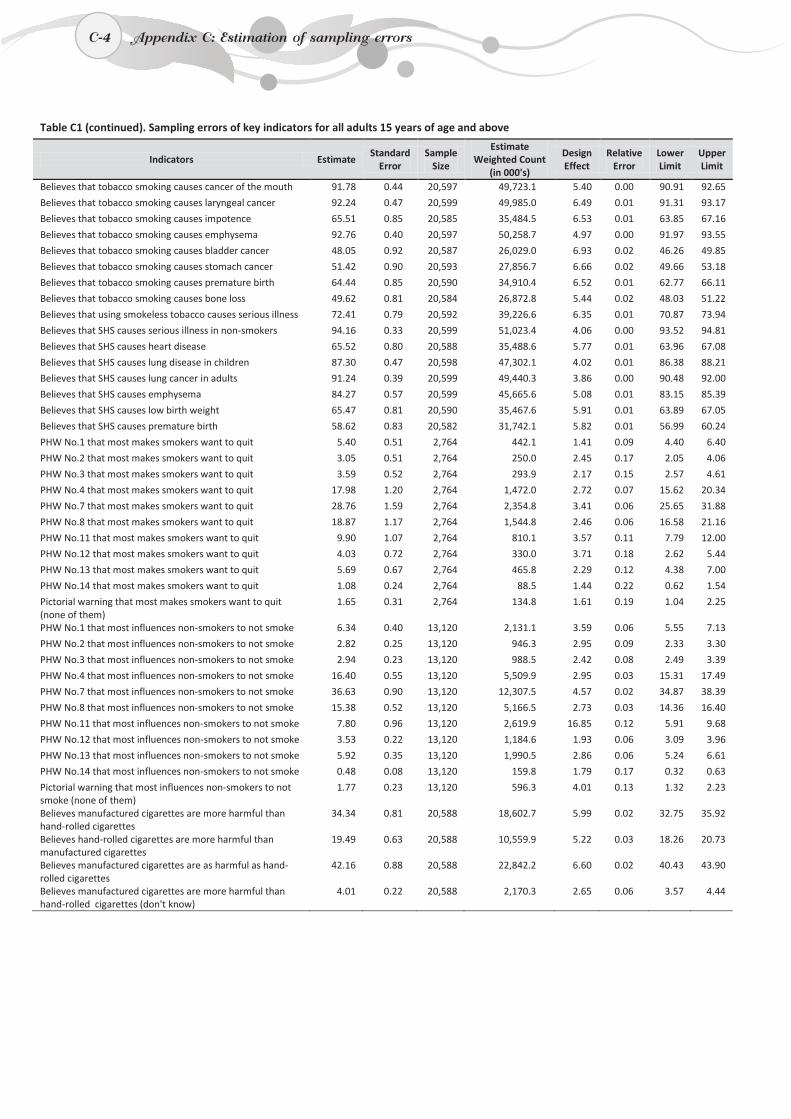
C-4
Table C1 (continued). Sampling errors of key indicators for all adults 15 years of age and above
Indicators Estimate Standard
Error Sample
Size
Estimate Weighted Count
(in 000's)
Design Effect
Relative Error
Lower Limit
Upper Limit
Believes that tobacco smoking causes cancer of the mouth 91.78 0.44 20,597 49,723.1 5.40 0.00 90.91 92.65
Believes that tobacco smoking causes laryngeal cancer 92.24 0.47 20,599 49,985.0 6.49 0.01 91.31 93.17
Believes that tobacco smoking causes impotence 65.51 0.85 20,585 35,484.5 6.53 0.01 63.85 67.16
Believes that tobacco smoking causes emphysema 92.76 0.40 20,597 50,258.7 4.97 0.00 91.97 93.55
Believes that tobacco smoking causes bladder cancer 48.05 0.92 20,587 26,029.0 6.93 0.02 46.26 49.85
Believes that tobacco smoking causes stomach cancer 51.42 0.90 20,593 27,856.7 6.66 0.02 49.66 53.18
Believes that tobacco smoking causes premature birth 64.44 0.85 20,590 34,910.4 6.52 0.01 62.77 66.11
Believes that tobacco smoking causes bone loss 49.62 0.81 20,584 26,872.8 5.44 0.02 48.03 51.22
Believes that using smokeless tobacco causes serious illness 72.41 0.79 20,592 39,226.6 6.35 0.01 70.87 73.94
Believes that SHS causes serious illness in non-smokers 94.16 0.33 20,599 51,023.4 4.06 0.00 93.52 94.81
Believes that SHS causes heart disease 65.52 0.80 20,588 35,488.6 5.77 0.01 63.96 67.08
Believes that SHS causes lung disease in children 87.30 0.47 20,598 47,302.1 4.02 0.01 86.38 88.21
Believes that SHS causes lung cancer in adults 91.24 0.39 20,599 49,440.3 3.86 0.00 90.48 92.00
Believes that SHS causes emphysema 84.27 0.57 20,599 45,665.6 5.08 0.01 83.15 85.39
Believes that SHS causes low birth weight 65.47 0.81 20,590 35,467.6 5.91 0.01 63.89 67.05
Believes that SHS causes premature birth 58.62 0.83 20,582 31,742.1 5.82 0.01 56.99 60.24
PHW No.1 that most makes smokers want to quit 5.40 0.51 2,764 442.1 1.41 0.09 4.40 6.40
PHW No.2 that most makes smokers want to quit 3.05 0.51 2,764 250.0 2.45 0.17 2.05 4.06
PHW No.3 that most makes smokers want to quit 3.59 0.52 2,764 293.9 2.17 0.15 2.57 4.61
PHW No.4 that most makes smokers want to quit 17.98 1.20 2,764 1,472.0 2.72 0.07 15.62 20.34
PHW No.7 that most makes smokers want to quit 28.76 1.59 2,764 2,354.8 3.41 0.06 25.65 31.88
PHW No.8 that most makes smokers want to quit 18.87 1.17 2,764 1,544.8 2.46 0.06 16.58 21.16
PHW No.11 that most makes smokers want to quit 9.90 1.07 2,764 810.1 3.57 0.11 7.79 12.00
PHW No.12 that most makes smokers want to quit 4.03 0.72 2,764 330.0 3.71 0.18 2.62 5.44
PHW No.13 that most makes smokers want to quit 5.69 0.67 2,764 465.8 2.29 0.12 4.38 7.00
PHW No.14 that most makes smokers want to quit 1.08 0.24 2,764 88.5 1.44 0.22 0.62 1.54
Pictorial warning that most makes smokers want to quit (none of them)
1.65 0.31 2,764 134.8 1.61 0.19 1.04 2.25
PHW No.1 that most influences non-smokers to not smoke 6.34 0.40 13,120 2,131.1 3.59 0.06 5.55 7.13
PHW No.2 that most influences non-smokers to not smoke 2.82 0.25 13,120 946.3 2.95 0.09 2.33 3.30
PHW No.3 that most influences non-smokers to not smoke 2.94 0.23 13,120 988.5 2.42 0.08 2.49 3.39
PHW No.4 that most influences non-smokers to not smoke 16.40 0.55 13,120 5,509.9 2.95 0.03 15.31 17.49
PHW No.7 that most influences non-smokers to not smoke 36.63 0.90 13,120 12,307.5 4.57 0.02 34.87 38.39
PHW No.8 that most influences non-smokers to not smoke 15.38 0.52 13,120 5,166.5 2.73 0.03 14.36 16.40
PHW No.11 that most influences non-smokers to not smoke 7.80 0.96 13,120 2,619.9 16.85 0.12 5.91 9.68
PHW No.12 that most influences non-smokers to not smoke 3.53 0.22 13,120 1,184.6 1.93 0.06 3.09 3.96
PHW No.13 that most influences non-smokers to not smoke 5.92 0.35 13,120 1,990.5 2.86 0.06 5.24 6.61
PHW No.14 that most influences non-smokers to not smoke 0.48 0.08 13,120 159.8 1.79 0.17 0.32 0.63
Pictorial warning that most influences non-smokers to not smoke (none of them)
1.77 0.23 13,120 596.3 4.01 0.13 1.32 2.23
Believes manufactured cigarettes are more harmful than hand-rolled cigarettes
34.34 0.81 20,588 18,602.7 5.99 0.02 32.75 35.92
Believes hand-rolled cigarettes are more harmful than manufactured cigarettes
19.49 0.63 20,588 10,559.9 5.22 0.03 18.26 20.73
Believes manufactured cigarettes are as harmful as hand-rolled cigarettes
42.16 0.88 20,588 22,842.2 6.60 0.02 40.43 43.90
Believes manufactured cigarettes are more harmful than hand-rolled cigarettes (don't know)
4.01 0.22 20,588 2,170.3 2.65 0.06 3.57 4.44
C-4 Appendix C: Estimation of sampling errors
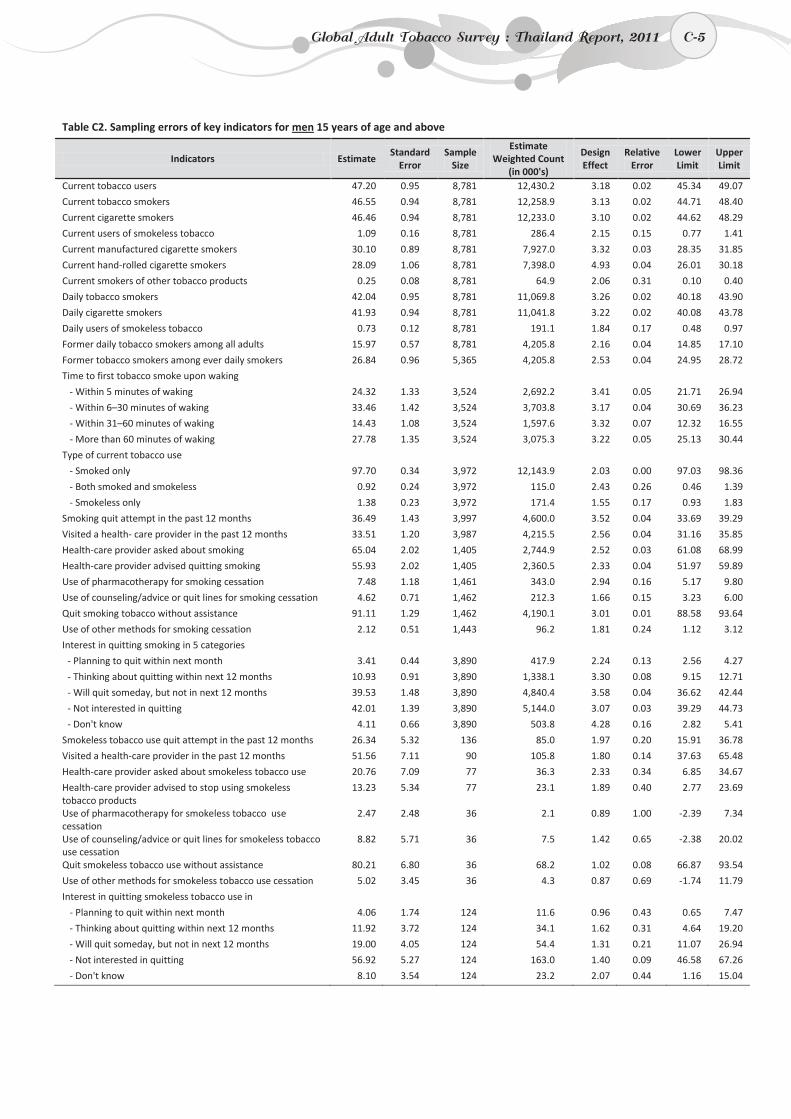
C-5
Table C2. Sampling errors of key indicators for men 15 years of age and above
Indicators Estimate Standard
Error Sample
Size
Estimate Weighted Count
(in 000's)
Design Effect
Relative Error
Lower Limit
Upper Limit
Current tobacco users 47.20 0.95 8,781 12,430.2 3.18 0.02 45.34 49.07
Current tobacco smokers 46.55 0.94 8,781 12,258.9 3.13 0.02 44.71 48.40
Current cigarette smokers 46.46 0.94 8,781 12,233.0 3.10 0.02 44.62 48.29
Current users of smokeless tobacco 1.09 0.16 8,781 286.4 2.15 0.15 0.77 1.41
Current manufactured cigarette smokers 30.10 0.89 8,781 7,927.0 3.32 0.03 28.35 31.85
Current hand-rolled cigarette smokers 28.09 1.06 8,781 7,398.0 4.93 0.04 26.01 30.18
Current smokers of other tobacco products 0.25 0.08 8,781 64.9 2.06 0.31 0.10 0.40
Daily tobacco smokers 42.04 0.95 8,781 11,069.8 3.26 0.02 40.18 43.90
Daily cigarette smokers 41.93 0.94 8,781 11,041.8 3.22 0.02 40.08 43.78
Daily users of smokeless tobacco 0.73 0.12 8,781 191.1 1.84 0.17 0.48 0.97
Former daily tobacco smokers among all adults 15.97 0.57 8,781 4,205.8 2.16 0.04 14.85 17.10
Former tobacco smokers among ever daily smokers 26.84 0.96 5,365 4,205.8 2.53 0.04 24.95 28.72
Time to first tobacco smoke upon waking - Within 5 minutes of waking 24.32 1.33 3,524 2,692.2 3.41 0.05 21.71 26.94
- Within 6–30 minutes of waking 33.46 1.42 3,524 3,703.8 3.17 0.04 30.69 36.23
- Within 31–60 minutes of waking 14.43 1.08 3,524 1,597.6 3.32 0.07 12.32 16.55
- More than 60 minutes of waking 27.78 1.35 3,524 3,075.3 3.22 0.05 25.13 30.44
Type of current tobacco use - Smoked only 97.70 0.34 3,972 12,143.9 2.03 0.00 97.03 98.36
- Both smoked and smokeless 0.92 0.24 3,972 115.0 2.43 0.26 0.46 1.39
- Smokeless only 1.38 0.23 3,972 171.4 1.55 0.17 0.93 1.83
Smoking quit attempt in the past 12 months 36.49 1.43 3,997 4,600.0 3.52 0.04 33.69 39.29
Visited a health- care provider in the past 12 months 33.51 1.20 3,987 4,215.5 2.56 0.04 31.16 35.85
Health-care provider asked about smoking 65.04 2.02 1,405 2,744.9 2.52 0.03 61.08 68.99
Health-care provider advised quitting smoking 55.93 2.02 1,405 2,360.5 2.33 0.04 51.97 59.89
Use of pharmacotherapy for smoking cessation 7.48 1.18 1,461 343.0 2.94 0.16 5.17 9.80
Use of counseling/advice or quit lines for smoking cessation 4.62 0.71 1,462 212.3 1.66 0.15 3.23 6.00
Quit smoking tobacco without assistance 91.11 1.29 1,462 4,190.1 3.01 0.01 88.58 93.64
Use of other methods for smoking cessation 2.12 0.51 1,443 96.2 1.81 0.24 1.12 3.12
Interest in quitting smoking in 5 categories - Planning to quit within next month 3.41 0.44 3,890 417.9 2.24 0.13 2.56 4.27
- Thinking about quitting within next 12 months 10.93 0.91 3,890 1,338.1 3.30 0.08 9.15 12.71
- Will quit someday, but not in next 12 months 39.53 1.48 3,890 4,840.4 3.58 0.04 36.62 42.44
- Not interested in quitting 42.01 1.39 3,890 5,144.0 3.07 0.03 39.29 44.73
- Don't know 4.11 0.66 3,890 503.8 4.28 0.16 2.82 5.41
Smokeless tobacco use quit attempt in the past 12 months 26.34 5.32 136 85.0 1.97 0.20 15.91 36.78
Visited a health-care provider in the past 12 months 51.56 7.11 90 105.8 1.80 0.14 37.63 65.48
Health-care provider asked about smokeless tobacco use 20.76 7.09 77 36.3 2.33 0.34 6.85 34.67
Health-care provider advised to stop using smokeless tobacco products
13.23 5.34 77 23.1 1.89 0.40 2.77 23.69
Use of pharmacotherapy for smokeless tobacco use cessation
2.47 2.48 36 2.1 0.89 1.00 -2.39 7.34
Use of counseling/advice or quit lines for smokeless tobacco use cessation
8.82 5.71 36 7.5 1.42 0.65 -2.38 20.02
Quit smokeless tobacco use without assistance 80.21 6.80 36 68.2 1.02 0.08 66.87 93.54
Use of other methods for smokeless tobacco use cessation 5.02 3.45 36 4.3 0.87 0.69 -1.74 11.79
Interest in quitting smokeless tobacco use in - Planning to quit within next month 4.06 1.74 124 11.6 0.96 0.43 0.65 7.47
- Thinking about quitting within next 12 months 11.92 3.72 124 34.1 1.62 0.31 4.64 19.20
- Will quit someday, but not in next 12 months 19.00 4.05 124 54.4 1.31 0.21 11.07 26.94
- Not interested in quitting 56.92 5.27 124 163.0 1.40 0.09 46.58 67.26
- Don't know 8.10 3.54 124 23.2 2.07 0.44 1.16 15.04
Global Adult Tobacco Survey : Thailand Report, 2011 C-5
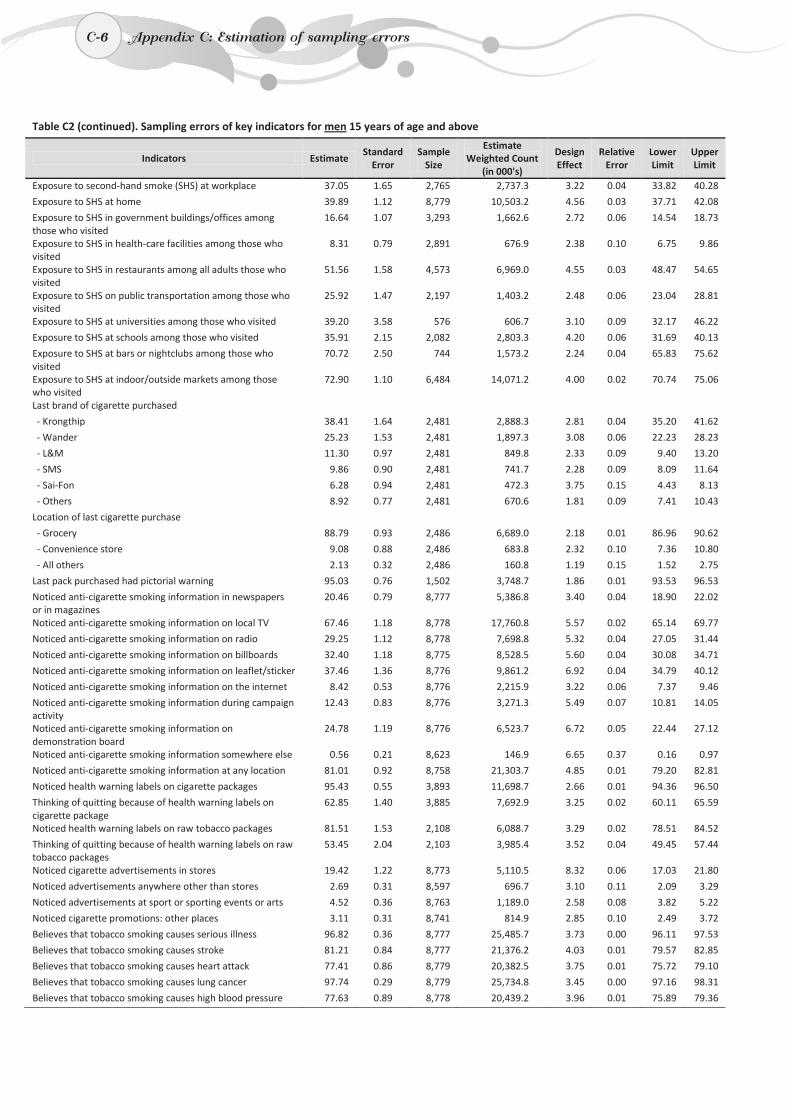
C-6
Table C2 (continued). Sampling errors of key indicators for men 15 years of age and above
Indicators Estimate Standard
Error Sample
Size
Estimate Weighted Count
(in 000's)
Design Effect
Relative Error
Lower Limit
Upper Limit
Exposure to second-hand smoke (SHS) at workplace 37.05 1.65 2,765 2,737.3 3.22 0.04 33.82 40.28
Exposure to SHS at home 39.89 1.12 8,779 10,503.2 4.56 0.03 37.71 42.08
Exposure to SHS in government buildings/offices among those who visited
16.64 1.07 3,293 1,662.6 2.72 0.06 14.54 18.73
Exposure to SHS in health-care facilities among those who visited
8.31 0.79 2,891 676.9 2.38 0.10 6.75 9.86
Exposure to SHS in restaurants among all adults those who visited
51.56 1.58 4,573 6,969.0 4.55 0.03 48.47 54.65
Exposure to SHS on public transportation among those who visited
25.92 1.47 2,197 1,403.2 2.48 0.06 23.04 28.81
Exposure to SHS at universities among those who visited 39.20 3.58 576 606.7 3.10 0.09 32.17 46.22
Exposure to SHS at schools among those who visited 35.91 2.15 2,082 2,803.3 4.20 0.06 31.69 40.13
Exposure to SHS at bars or nightclubs among those who visited
70.72 2.50 744 1,573.2 2.24 0.04 65.83 75.62
Exposure to SHS at indoor/outside markets among those who visited
72.90 1.10 6,484 14,071.2 4.00 0.02 70.74 75.06
Last brand of cigarette purchased - Krongthip 38.41 1.64 2,481 2,888.3 2.81 0.04 35.20 41.62
- Wander 25.23 1.53 2,481 1,897.3 3.08 0.06 22.23 28.23
- L&M 11.30 0.97 2,481 849.8 2.33 0.09 9.40 13.20
- SMS 9.86 0.90 2,481 741.7 2.28 0.09 8.09 11.64
- Sai-Fon 6.28 0.94 2,481 472.3 3.75 0.15 4.43 8.13
- Others 8.92 0.77 2,481 670.6 1.81 0.09 7.41 10.43
Location of last cigarette purchase - Grocery 88.79 0.93 2,486 6,689.0 2.18 0.01 86.96 90.62
- Convenience store 9.08 0.88 2,486 683.8 2.32 0.10 7.36 10.80
- All others 2.13 0.32 2,486 160.8 1.19 0.15 1.52 2.75
Last pack purchased had pictorial warning 95.03 0.76 1,502 3,748.7 1.86 0.01 93.53 96.53
Noticed anti-cigarette smoking information in newspapers or in magazines
20.46 0.79 8,777 5,386.8 3.40 0.04 18.90 22.02
Noticed anti-cigarette smoking information on local TV 67.46 1.18 8,778 17,760.8 5.57 0.02 65.14 69.77
Noticed anti-cigarette smoking information on radio 29.25 1.12 8,778 7,698.8 5.32 0.04 27.05 31.44
Noticed anti-cigarette smoking information on billboards 32.40 1.18 8,775 8,528.5 5.60 0.04 30.08 34.71
Noticed anti-cigarette smoking information on leaflet/sticker 37.46 1.36 8,776 9,861.2 6.92 0.04 34.79 40.12
Noticed anti-cigarette smoking information on the internet 8.42 0.53 8,776 2,215.9 3.22 0.06 7.37 9.46
Noticed anti-cigarette smoking information during campaign activity
12.43 0.83 8,776 3,271.3 5.49 0.07 10.81 14.05
Noticed anti-cigarette smoking information on demonstration board
24.78 1.19 8,776 6,523.7 6.72 0.05 22.44 27.12
Noticed anti-cigarette smoking information somewhere else 0.56 0.21 8,623 146.9 6.65 0.37 0.16 0.97
Noticed anti-cigarette smoking information at any location 81.01 0.92 8,758 21,303.7 4.85 0.01 79.20 82.81
Noticed health warning labels on cigarette packages 95.43 0.55 3,893 11,698.7 2.66 0.01 94.36 96.50
Thinking of quitting because of health warning labels on cigarette package
62.85 1.40 3,885 7,692.9 3.25 0.02 60.11 65.59
Noticed health warning labels on raw tobacco packages 81.51 1.53 2,108 6,088.7 3.29 0.02 78.51 84.52
Thinking of quitting because of health warning labels on raw tobacco packages
53.45 2.04 2,103 3,985.4 3.52 0.04 49.45 57.44
Noticed cigarette advertisements in stores 19.42 1.22 8,773 5,110.5 8.32 0.06 17.03 21.80
Noticed advertisements anywhere other than stores 2.69 0.31 8,597 696.7 3.10 0.11 2.09 3.29
Noticed advertisements at sport or sporting events or arts 4.52 0.36 8,763 1,189.0 2.58 0.08 3.82 5.22
Noticed cigarette promotions: other places 3.11 0.31 8,741 814.9 2.85 0.10 2.49 3.72
Believes that tobacco smoking causes serious illness 96.82 0.36 8,777 25,485.7 3.73 0.00 96.11 97.53
Believes that tobacco smoking causes stroke 81.21 0.84 8,777 21,376.2 4.03 0.01 79.57 82.85
Believes that tobacco smoking causes heart attack 77.41 0.86 8,779 20,382.5 3.75 0.01 75.72 79.10
Believes that tobacco smoking causes lung cancer 97.74 0.29 8,779 25,734.8 3.45 0.00 97.16 98.31
Believes that tobacco smoking causes high blood pressure 77.63 0.89 8,778 20,439.2 3.96 0.01 75.89 79.36
C-6 Appendix C: Estimation of sampling errors
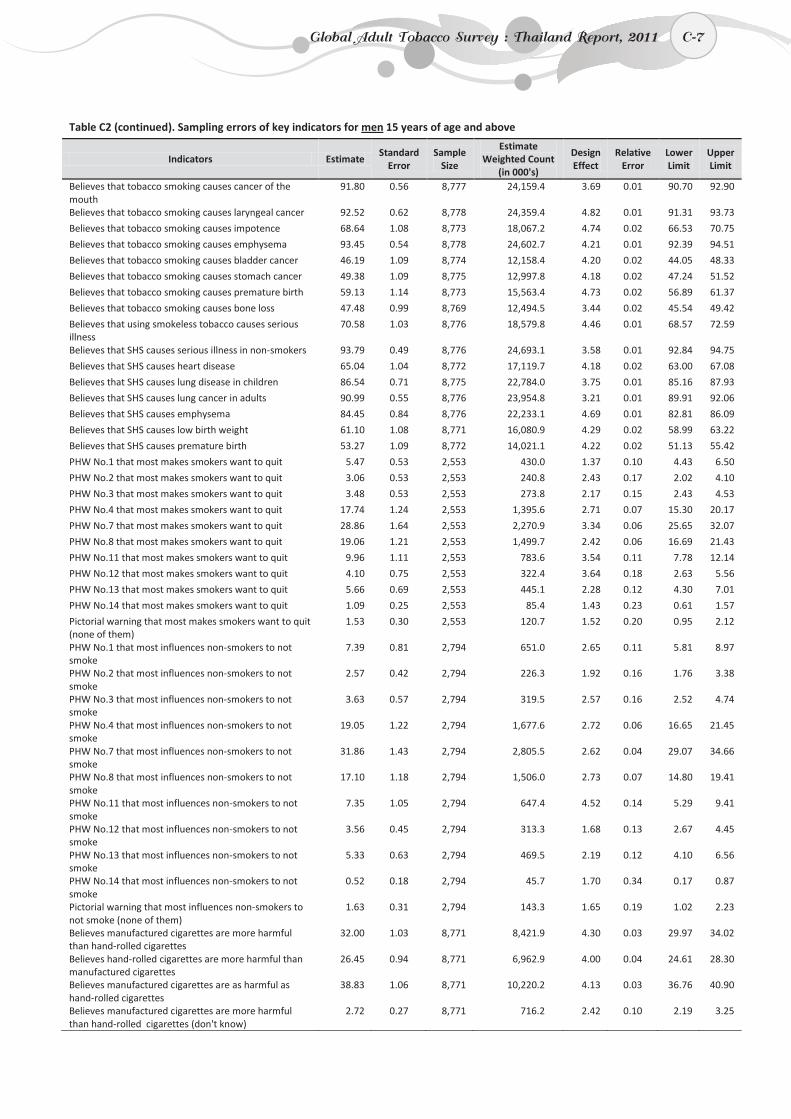
C-7
Table C2 (continued). Sampling errors of key indicators for men 15 years of age and above
Indicators Estimate Standard
Error Sample
Size
Estimate Weighted Count
(in 000's)
Design Effect
Relative Error
Lower Limit
Upper Limit
Believes that tobacco smoking causes cancer of the mouth
91.80 0.56 8,777 24,159.4 3.69 0.01 90.70 92.90
Believes that tobacco smoking causes laryngeal cancer 92.52 0.62 8,778 24,359.4 4.82 0.01 91.31 93.73
Believes that tobacco smoking causes impotence 68.64 1.08 8,773 18,067.2 4.74 0.02 66.53 70.75
Believes that tobacco smoking causes emphysema 93.45 0.54 8,778 24,602.7 4.21 0.01 92.39 94.51
Believes that tobacco smoking causes bladder cancer 46.19 1.09 8,774 12,158.4 4.20 0.02 44.05 48.33
Believes that tobacco smoking causes stomach cancer 49.38 1.09 8,775 12,997.8 4.18 0.02 47.24 51.52
Believes that tobacco smoking causes premature birth 59.13 1.14 8,773 15,563.4 4.73 0.02 56.89 61.37
Believes that tobacco smoking causes bone loss 47.48 0.99 8,769 12,494.5 3.44 0.02 45.54 49.42
Believes that using smokeless tobacco causes serious illness
70.58 1.03 8,776 18,579.8 4.46 0.01 68.57 72.59
Believes that SHS causes serious illness in non-smokers 93.79 0.49 8,776 24,693.1 3.58 0.01 92.84 94.75
Believes that SHS causes heart disease 65.04 1.04 8,772 17,119.7 4.18 0.02 63.00 67.08
Believes that SHS causes lung disease in children 86.54 0.71 8,775 22,784.0 3.75 0.01 85.16 87.93
Believes that SHS causes lung cancer in adults 90.99 0.55 8,776 23,954.8 3.21 0.01 89.91 92.06
Believes that SHS causes emphysema 84.45 0.84 8,776 22,233.1 4.69 0.01 82.81 86.09
Believes that SHS causes low birth weight 61.10 1.08 8,771 16,080.9 4.29 0.02 58.99 63.22
Believes that SHS causes premature birth 53.27 1.09 8,772 14,021.1 4.22 0.02 51.13 55.42
PHW No.1 that most makes smokers want to quit 5.47 0.53 2,553 430.0 1.37 0.10 4.43 6.50
PHW No.2 that most makes smokers want to quit 3.06 0.53 2,553 240.8 2.43 0.17 2.02 4.10
PHW No.3 that most makes smokers want to quit 3.48 0.53 2,553 273.8 2.17 0.15 2.43 4.53
PHW No.4 that most makes smokers want to quit 17.74 1.24 2,553 1,395.6 2.71 0.07 15.30 20.17
PHW No.7 that most makes smokers want to quit 28.86 1.64 2,553 2,270.9 3.34 0.06 25.65 32.07
PHW No.8 that most makes smokers want to quit 19.06 1.21 2,553 1,499.7 2.42 0.06 16.69 21.43
PHW No.11 that most makes smokers want to quit 9.96 1.11 2,553 783.6 3.54 0.11 7.78 12.14
PHW No.12 that most makes smokers want to quit 4.10 0.75 2,553 322.4 3.64 0.18 2.63 5.56
PHW No.13 that most makes smokers want to quit 5.66 0.69 2,553 445.1 2.28 0.12 4.30 7.01
PHW No.14 that most makes smokers want to quit 1.09 0.25 2,553 85.4 1.43 0.23 0.61 1.57
Pictorial warning that most makes smokers want to quit (none of them)
1.53 0.30 2,553 120.7 1.52 0.20 0.95 2.12
PHW No.1 that most influences non-smokers to not smoke
7.39 0.81 2,794 651.0 2.65 0.11 5.81 8.97
PHW No.2 that most influences non-smokers to not smoke
2.57 0.42 2,794 226.3 1.92 0.16 1.76 3.38
PHW No.3 that most influences non-smokers to not smoke
3.63 0.57 2,794 319.5 2.57 0.16 2.52 4.74
PHW No.4 that most influences non-smokers to not smoke
19.05 1.22 2,794 1,677.6 2.72 0.06 16.65 21.45
PHW No.7 that most influences non-smokers to not smoke
31.86 1.43 2,794 2,805.5 2.62 0.04 29.07 34.66
PHW No.8 that most influences non-smokers to not smoke
17.10 1.18 2,794 1,506.0 2.73 0.07 14.80 19.41
PHW No.11 that most influences non-smokers to not smoke
7.35 1.05 2,794 647.4 4.52 0.14 5.29 9.41
PHW No.12 that most influences non-smokers to not smoke
3.56 0.45 2,794 313.3 1.68 0.13 2.67 4.45
PHW No.13 that most influences non-smokers to not smoke
5.33 0.63 2,794 469.5 2.19 0.12 4.10 6.56
PHW No.14 that most influences non-smokers to not smoke
0.52 0.18 2,794 45.7 1.70 0.34 0.17 0.87
Pictorial warning that most influences non-smokers to not smoke (none of them)
1.63 0.31 2,794 143.3 1.65 0.19 1.02 2.23
Believes manufactured cigarettes are more harmful than hand-rolled cigarettes
32.00 1.03 8,771 8,421.9 4.30 0.03 29.97 34.02
Believes hand-rolled cigarettes are more harmful than manufactured cigarettes
26.45 0.94 8,771 6,962.9 4.00 0.04 24.61 28.30
Believes manufactured cigarettes are as harmful as hand-rolled cigarettes
38.83 1.06 8,771 10,220.2 4.13 0.03 36.76 40.90
Believes manufactured cigarettes are more harmful than hand-rolled cigarettes (don't know)
2.72 0.27 8,771 716.2 2.42 0.10 2.19 3.25
Global Adult Tobacco Survey : Thailand Report, 2011 C-7
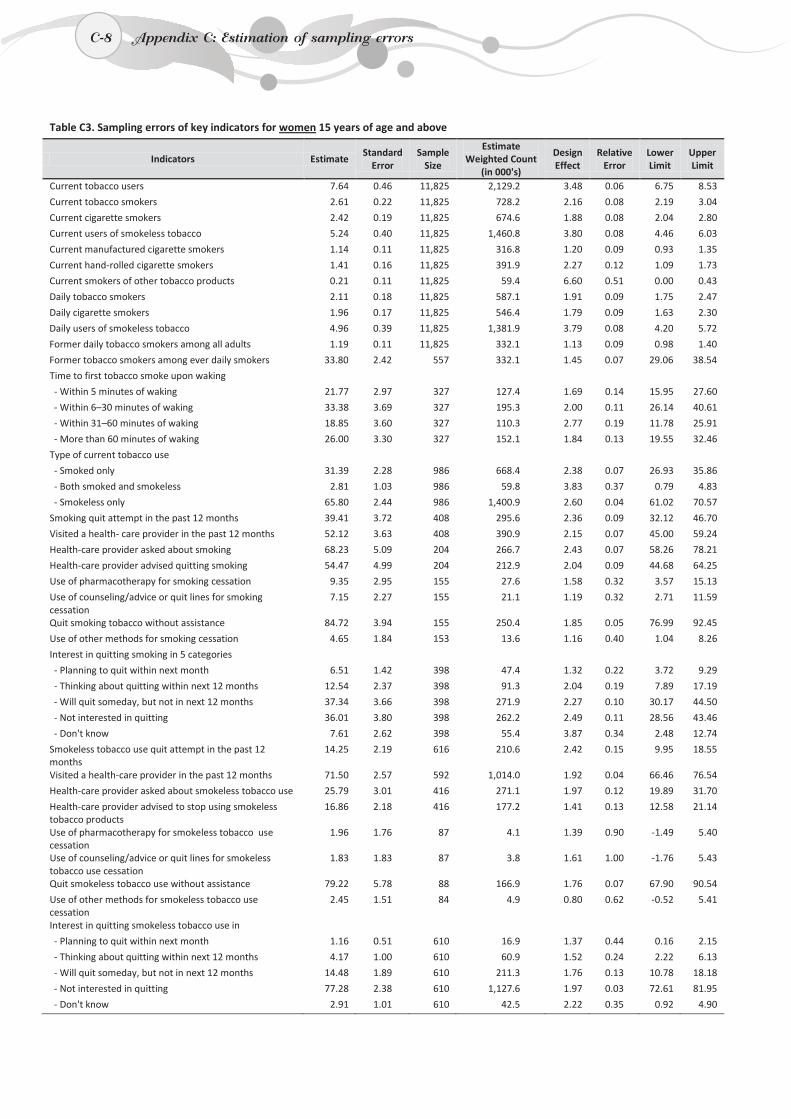
C-8
Table C3. Sampling errors of key indicators for women 15 years of age and above
Indicators Estimate Standard
Error Sample
Size
Estimate Weighted Count
(in 000's)
Design Effect
Relative Error
Lower Limit
Upper Limit
Current tobacco users 7.64 0.46 11,825 2,129.2 3.48 0.06 6.75 8.53
Current tobacco smokers 2.61 0.22 11,825 728.2 2.16 0.08 2.19 3.04
Current cigarette smokers 2.42 0.19 11,825 674.6 1.88 0.08 2.04 2.80
Current users of smokeless tobacco 5.24 0.40 11,825 1,460.8 3.80 0.08 4.46 6.03
Current manufactured cigarette smokers 1.14 0.11 11,825 316.8 1.20 0.09 0.93 1.35
Current hand-rolled cigarette smokers 1.41 0.16 11,825 391.9 2.27 0.12 1.09 1.73
Current smokers of other tobacco products 0.21 0.11 11,825 59.4 6.60 0.51 0.00 0.43
Daily tobacco smokers 2.11 0.18 11,825 587.1 1.91 0.09 1.75 2.47
Daily cigarette smokers 1.96 0.17 11,825 546.4 1.79 0.09 1.63 2.30
Daily users of smokeless tobacco 4.96 0.39 11,825 1,381.9 3.79 0.08 4.20 5.72
Former daily tobacco smokers among all adults 1.19 0.11 11,825 332.1 1.13 0.09 0.98 1.40
Former tobacco smokers among ever daily smokers 33.80 2.42 557 332.1 1.45 0.07 29.06 38.54
Time to first tobacco smoke upon waking - Within 5 minutes of waking 21.77 2.97 327 127.4 1.69 0.14 15.95 27.60
- Within 6–30 minutes of waking 33.38 3.69 327 195.3 2.00 0.11 26.14 40.61
- Within 31–60 minutes of waking 18.85 3.60 327 110.3 2.77 0.19 11.78 25.91
- More than 60 minutes of waking 26.00 3.30 327 152.1 1.84 0.13 19.55 32.46
Type of current tobacco use - Smoked only 31.39 2.28 986 668.4 2.38 0.07 26.93 35.86
- Both smoked and smokeless 2.81 1.03 986 59.8 3.83 0.37 0.79 4.83
- Smokeless only 65.80 2.44 986 1,400.9 2.60 0.04 61.02 70.57
Smoking quit attempt in the past 12 months 39.41 3.72 408 295.6 2.36 0.09 32.12 46.70
Visited a health- care provider in the past 12 months 52.12 3.63 408 390.9 2.15 0.07 45.00 59.24
Health-care provider asked about smoking 68.23 5.09 204 266.7 2.43 0.07 58.26 78.21
Health-care provider advised quitting smoking 54.47 4.99 204 212.9 2.04 0.09 44.68 64.25
Use of pharmacotherapy for smoking cessation 9.35 2.95 155 27.6 1.58 0.32 3.57 15.13
Use of counseling/advice or quit lines for smoking cessation
7.15 2.27 155 21.1 1.19 0.32 2.71 11.59
Quit smoking tobacco without assistance 84.72 3.94 155 250.4 1.85 0.05 76.99 92.45
Use of other methods for smoking cessation 4.65 1.84 153 13.6 1.16 0.40 1.04 8.26
Interest in quitting smoking in 5 categories - Planning to quit within next month 6.51 1.42 398 47.4 1.32 0.22 3.72 9.29
- Thinking about quitting within next 12 months 12.54 2.37 398 91.3 2.04 0.19 7.89 17.19
- Will quit someday, but not in next 12 months 37.34 3.66 398 271.9 2.27 0.10 30.17 44.50
- Not interested in quitting 36.01 3.80 398 262.2 2.49 0.11 28.56 43.46
- Don't know 7.61 2.62 398 55.4 3.87 0.34 2.48 12.74
Smokeless tobacco use quit attempt in the past 12 months
14.25 2.19 616 210.6 2.42 0.15 9.95 18.55
Visited a health-care provider in the past 12 months 71.50 2.57 592 1,014.0 1.92 0.04 66.46 76.54
Health-care provider asked about smokeless tobacco use 25.79 3.01 416 271.1 1.97 0.12 19.89 31.70
Health-care provider advised to stop using smokeless tobacco products
16.86 2.18 416 177.2 1.41 0.13 12.58 21.14
Use of pharmacotherapy for smokeless tobacco use cessation
1.96 1.76 87 4.1 1.39 0.90 -1.49 5.40
Use of counseling/advice or quit lines for smokeless tobacco use cessation
1.83 1.83 87 3.8 1.61 1.00 -1.76 5.43
Quit smokeless tobacco use without assistance 79.22 5.78 88 166.9 1.76 0.07 67.90 90.54
Use of other methods for smokeless tobacco use cessation
2.45 1.51 84 4.9 0.80 0.62 -0.52 5.41
Interest in quitting smokeless tobacco use in - Planning to quit within next month 1.16 0.51 610 16.9 1.37 0.44 0.16 2.15
- Thinking about quitting within next 12 months 4.17 1.00 610 60.9 1.52 0.24 2.22 6.13
- Will quit someday, but not in next 12 months 14.48 1.89 610 211.3 1.76 0.13 10.78 18.18
- Not interested in quitting 77.28 2.38 610 1,127.6 1.97 0.03 72.61 81.95
- Don't know 2.91 1.01 610 42.5 2.22 0.35 0.92 4.90
C-8 Appendix C: Estimation of sampling errors
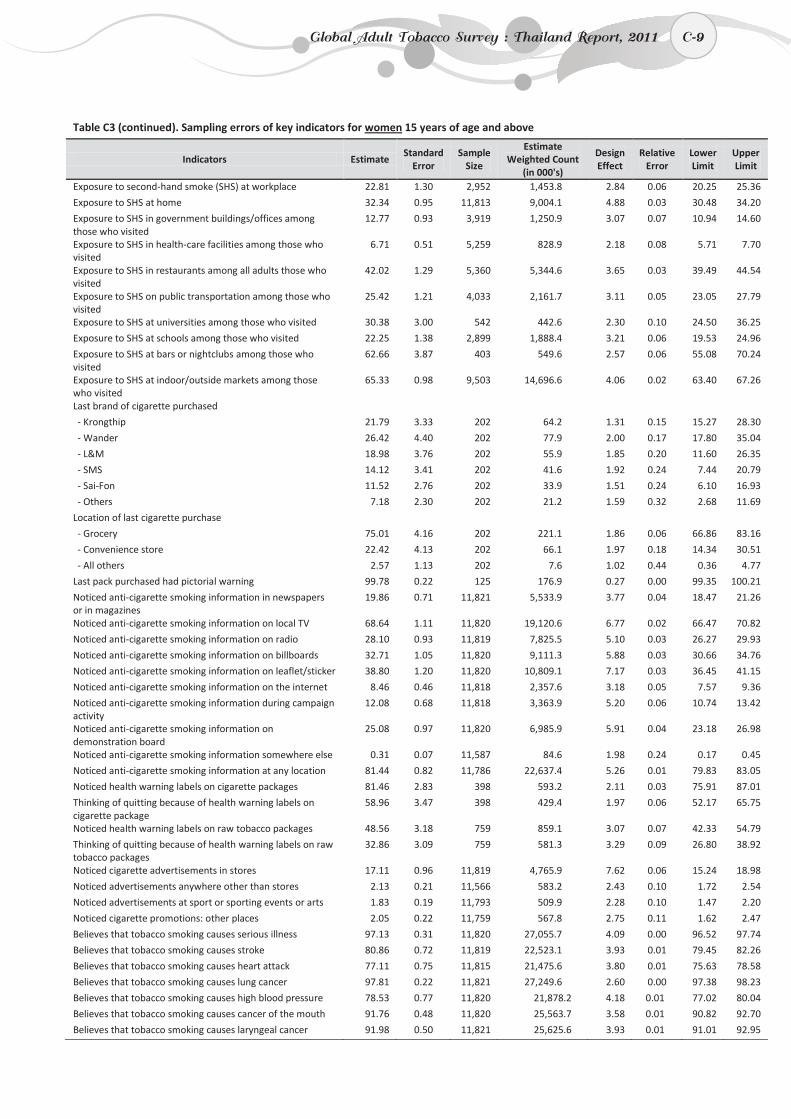
C-9
Table C3 (continued). Sampling errors of key indicators for women 15 years of age and above
Indicators Estimate Standard
Error Sample
Size
Estimate Weighted Count
(in 000's)
Design Effect
Relative Error
Lower Limit
Upper Limit
Exposure to second-hand smoke (SHS) at workplace 22.81 1.30 2,952 1,453.8 2.84 0.06 20.25 25.36
Exposure to SHS at home 32.34 0.95 11,813 9,004.1 4.88 0.03 30.48 34.20
Exposure to SHS in government buildings/offices among those who visited
12.77 0.93 3,919 1,250.9 3.07 0.07 10.94 14.60
Exposure to SHS in health-care facilities among those who visited
6.71 0.51 5,259 828.9 2.18 0.08 5.71 7.70
Exposure to SHS in restaurants among all adults those who visited
42.02 1.29 5,360 5,344.6 3.65 0.03 39.49 44.54
Exposure to SHS on public transportation among those who visited
25.42 1.21 4,033 2,161.7 3.11 0.05 23.05 27.79
Exposure to SHS at universities among those who visited 30.38 3.00 542 442.6 2.30 0.10 24.50 36.25
Exposure to SHS at schools among those who visited 22.25 1.38 2,899 1,888.4 3.21 0.06 19.53 24.96
Exposure to SHS at bars or nightclubs among those who visited
62.66 3.87 403 549.6 2.57 0.06 55.08 70.24
Exposure to SHS at indoor/outside markets among those who visited
65.33 0.98 9,503 14,696.6 4.06 0.02 63.40 67.26
Last brand of cigarette purchased - Krongthip 21.79 3.33 202 64.2 1.31 0.15 15.27 28.30
- Wander 26.42 4.40 202 77.9 2.00 0.17 17.80 35.04
- L&M 18.98 3.76 202 55.9 1.85 0.20 11.60 26.35
- SMS 14.12 3.41 202 41.6 1.92 0.24 7.44 20.79
- Sai-Fon 11.52 2.76 202 33.9 1.51 0.24 6.10 16.93
- Others 7.18 2.30 202 21.2 1.59 0.32 2.68 11.69
Location of last cigarette purchase - Grocery 75.01 4.16 202 221.1 1.86 0.06 66.86 83.16
- Convenience store 22.42 4.13 202 66.1 1.97 0.18 14.34 30.51
- All others 2.57 1.13 202 7.6 1.02 0.44 0.36 4.77
Last pack purchased had pictorial warning 99.78 0.22 125 176.9 0.27 0.00 99.35 100.21
Noticed anti-cigarette smoking information in newspapers or in magazines
19.86 0.71 11,821 5,533.9 3.77 0.04 18.47 21.26
Noticed anti-cigarette smoking information on local TV 68.64 1.11 11,820 19,120.6 6.77 0.02 66.47 70.82
Noticed anti-cigarette smoking information on radio 28.10 0.93 11,819 7,825.5 5.10 0.03 26.27 29.93
Noticed anti-cigarette smoking information on billboards 32.71 1.05 11,820 9,111.3 5.88 0.03 30.66 34.76
Noticed anti-cigarette smoking information on leaflet/sticker 38.80 1.20 11,820 10,809.1 7.17 0.03 36.45 41.15
Noticed anti-cigarette smoking information on the internet 8.46 0.46 11,818 2,357.6 3.18 0.05 7.57 9.36
Noticed anti-cigarette smoking information during campaign activity
12.08 0.68 11,818 3,363.9 5.20 0.06 10.74 13.42
Noticed anti-cigarette smoking information on demonstration board
25.08 0.97 11,820 6,985.9 5.91 0.04 23.18 26.98
Noticed anti-cigarette smoking information somewhere else 0.31 0.07 11,587 84.6 1.98 0.24 0.17 0.45
Noticed anti-cigarette smoking information at any location 81.44 0.82 11,786 22,637.4 5.26 0.01 79.83 83.05
Noticed health warning labels on cigarette packages 81.46 2.83 398 593.2 2.11 0.03 75.91 87.01
Thinking of quitting because of health warning labels on cigarette package
58.96 3.47 398 429.4 1.97 0.06 52.17 65.75
Noticed health warning labels on raw tobacco packages 48.56 3.18 759 859.1 3.07 0.07 42.33 54.79
Thinking of quitting because of health warning labels on raw tobacco packages
32.86 3.09 759 581.3 3.29 0.09 26.80 38.92
Noticed cigarette advertisements in stores 17.11 0.96 11,819 4,765.9 7.62 0.06 15.24 18.98
Noticed advertisements anywhere other than stores 2.13 0.21 11,566 583.2 2.43 0.10 1.72 2.54
Noticed advertisements at sport or sporting events or arts 1.83 0.19 11,793 509.9 2.28 0.10 1.47 2.20
Noticed cigarette promotions: other places 2.05 0.22 11,759 567.8 2.75 0.11 1.62 2.47
Believes that tobacco smoking causes serious illness 97.13 0.31 11,820 27,055.7 4.09 0.00 96.52 97.74
Believes that tobacco smoking causes stroke 80.86 0.72 11,819 22,523.1 3.93 0.01 79.45 82.26
Believes that tobacco smoking causes heart attack 77.11 0.75 11,815 21,475.6 3.80 0.01 75.63 78.58
Believes that tobacco smoking causes lung cancer 97.81 0.22 11,821 27,249.6 2.60 0.00 97.38 98.23
Believes that tobacco smoking causes high blood pressure 78.53 0.77 11,820 21,878.2 4.18 0.01 77.02 80.04
Believes that tobacco smoking causes cancer of the mouth 91.76 0.48 11,820 25,563.7 3.58 0.01 90.82 92.70
Believes that tobacco smoking causes laryngeal cancer 91.98 0.50 11,821 25,625.6 3.93 0.01 91.01 92.95
Global Adult Tobacco Survey : Thailand Report, 2011 C-9
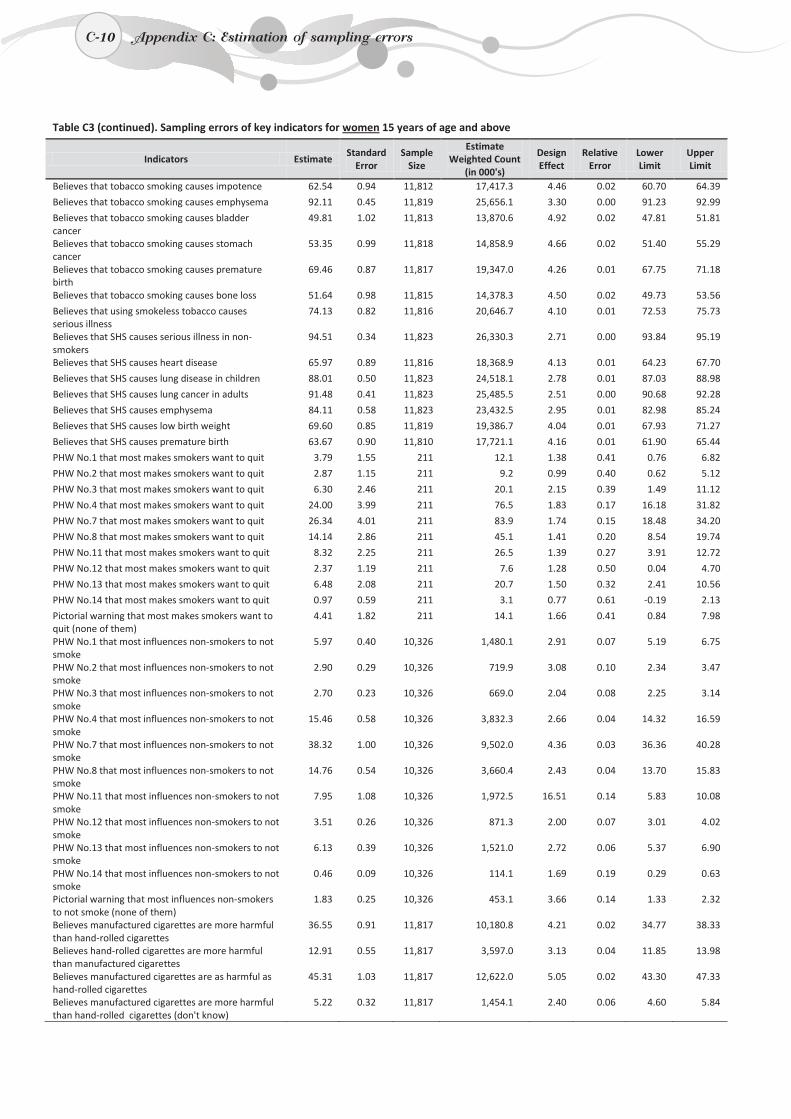
C-10
Table C3 (continued). Sampling errors of key indicators for women 15 years of age and above
Indicators Estimate Standard
Error Sample
Size
Estimate Weighted Count
(in 000's)
Design Effect
Relative Error
Lower Limit
Upper Limit
Believes that tobacco smoking causes impotence 62.54 0.94 11,812 17,417.3 4.46 0.02 60.70 64.39
Believes that tobacco smoking causes emphysema 92.11 0.45 11,819 25,656.1 3.30 0.00 91.23 92.99
Believes that tobacco smoking causes bladder cancer
49.81 1.02 11,813 13,870.6 4.92 0.02 47.81 51.81
Believes that tobacco smoking causes stomach cancer
53.35 0.99 11,818 14,858.9 4.66 0.02 51.40 55.29
Believes that tobacco smoking causes premature birth
69.46 0.87 11,817 19,347.0 4.26 0.01 67.75 71.18
Believes that tobacco smoking causes bone loss 51.64 0.98 11,815 14,378.3 4.50 0.02 49.73 53.56
Believes that using smokeless tobacco causes serious illness
74.13 0.82 11,816 20,646.7 4.10 0.01 72.53 75.73
Believes that SHS causes serious illness in non-smokers
94.51 0.34 11,823 26,330.3 2.71 0.00 93.84 95.19
Believes that SHS causes heart disease 65.97 0.89 11,816 18,368.9 4.13 0.01 64.23 67.70
Believes that SHS causes lung disease in children 88.01 0.50 11,823 24,518.1 2.78 0.01 87.03 88.98
Believes that SHS causes lung cancer in adults 91.48 0.41 11,823 25,485.5 2.51 0.00 90.68 92.28
Believes that SHS causes emphysema 84.11 0.58 11,823 23,432.5 2.95 0.01 82.98 85.24
Believes that SHS causes low birth weight 69.60 0.85 11,819 19,386.7 4.04 0.01 67.93 71.27
Believes that SHS causes premature birth 63.67 0.90 11,810 17,721.1 4.16 0.01 61.90 65.44
PHW No.1 that most makes smokers want to quit 3.79 1.55 211 12.1 1.38 0.41 0.76 6.82
PHW No.2 that most makes smokers want to quit 2.87 1.15 211 9.2 0.99 0.40 0.62 5.12
PHW No.3 that most makes smokers want to quit 6.30 2.46 211 20.1 2.15 0.39 1.49 11.12
PHW No.4 that most makes smokers want to quit 24.00 3.99 211 76.5 1.83 0.17 16.18 31.82
PHW No.7 that most makes smokers want to quit 26.34 4.01 211 83.9 1.74 0.15 18.48 34.20
PHW No.8 that most makes smokers want to quit 14.14 2.86 211 45.1 1.41 0.20 8.54 19.74
PHW No.11 that most makes smokers want to quit 8.32 2.25 211 26.5 1.39 0.27 3.91 12.72
PHW No.12 that most makes smokers want to quit 2.37 1.19 211 7.6 1.28 0.50 0.04 4.70
PHW No.13 that most makes smokers want to quit 6.48 2.08 211 20.7 1.50 0.32 2.41 10.56
PHW No.14 that most makes smokers want to quit 0.97 0.59 211 3.1 0.77 0.61 -0.19 2.13
Pictorial warning that most makes smokers want to quit (none of them)
4.41 1.82 211 14.1 1.66 0.41 0.84 7.98
PHW No.1 that most influences non-smokers to not smoke
5.97 0.40 10,326 1,480.1 2.91 0.07 5.19 6.75
PHW No.2 that most influences non-smokers to not smoke
2.90 0.29 10,326 719.9 3.08 0.10 2.34 3.47
PHW No.3 that most influences non-smokers to not smoke
2.70 0.23 10,326 669.0 2.04 0.08 2.25 3.14
PHW No.4 that most influences non-smokers to not smoke
15.46 0.58 10,326 3,832.3 2.66 0.04 14.32 16.59
PHW No.7 that most influences non-smokers to not smoke
38.32 1.00 10,326 9,502.0 4.36 0.03 36.36 40.28
PHW No.8 that most influences non-smokers to not smoke
14.76 0.54 10,326 3,660.4 2.43 0.04 13.70 15.83
PHW No.11 that most influences non-smokers to not smoke
7.95 1.08 10,326 1,972.5 16.51 0.14 5.83 10.08
PHW No.12 that most influences non-smokers to not smoke
3.51 0.26 10,326 871.3 2.00 0.07 3.01 4.02
PHW No.13 that most influences non-smokers to not smoke
6.13 0.39 10,326 1,521.0 2.72 0.06 5.37 6.90
PHW No.14 that most influences non-smokers to not smoke
0.46 0.09 10,326 114.1 1.69 0.19 0.29 0.63
Pictorial warning that most influences non-smokers to not smoke (none of them)
1.83 0.25 10,326 453.1 3.66 0.14 1.33 2.32
Believes manufactured cigarettes are more harmful than hand-rolled cigarettes
36.55 0.91 11,817 10,180.8 4.21 0.02 34.77 38.33
Believes hand-rolled cigarettes are more harmful than manufactured cigarettes
12.91 0.55 11,817 3,597.0 3.13 0.04 11.85 13.98
Believes manufactured cigarettes are as harmful as hand-rolled cigarettes
45.31 1.03 11,817 12,622.0 5.05 0.02 43.30 47.33
Believes manufactured cigarettes are more harmful than hand-rolled cigarettes (don't know)
5.22 0.32 11,817 1,454.1 2.40 0.06 4.60 5.84
C-10 Appendix C: Estimation of sampling errors
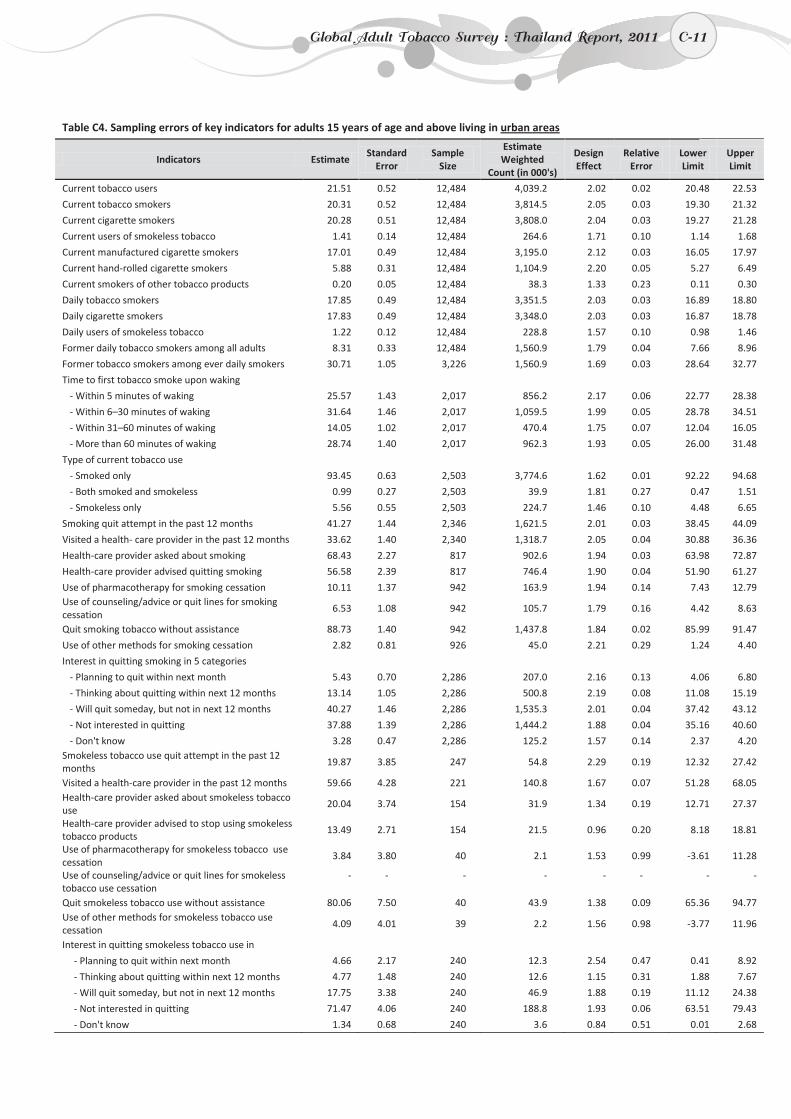
C-11
Table C4. Sampling errors of key indicators for adults 15 years of age and above living in urban areas
Indicators Estimate Standard
Error Sample
Size
Estimate Weighted
Count (in 000's)
Design Effect
Relative Error
Lower Limit
Upper Limit
Current tobacco users 21.51 0.52 12,484 4,039.2 2.02 0.02 20.48 22.53
Current tobacco smokers 20.31 0.52 12,484 3,814.5 2.05 0.03 19.30 21.32
Current cigarette smokers 20.28 0.51 12,484 3,808.0 2.04 0.03 19.27 21.28
Current users of smokeless tobacco 1.41 0.14 12,484 264.6 1.71 0.10 1.14 1.68
Current manufactured cigarette smokers 17.01 0.49 12,484 3,195.0 2.12 0.03 16.05 17.97
Current hand-rolled cigarette smokers 5.88 0.31 12,484 1,104.9 2.20 0.05 5.27 6.49
Current smokers of other tobacco products 0.20 0.05 12,484 38.3 1.33 0.23 0.11 0.30
Daily tobacco smokers 17.85 0.49 12,484 3,351.5 2.03 0.03 16.89 18.80
Daily cigarette smokers 17.83 0.49 12,484 3,348.0 2.03 0.03 16.87 18.78
Daily users of smokeless tobacco 1.22 0.12 12,484 228.8 1.57 0.10 0.98 1.46
Former daily tobacco smokers among all adults 8.31 0.33 12,484 1,560.9 1.79 0.04 7.66 8.96
Former tobacco smokers among ever daily smokers 30.71 1.05 3,226 1,560.9 1.69 0.03 28.64 32.77
Time to first tobacco smoke upon waking
- Within 5 minutes of waking 25.57 1.43 2,017 856.2 2.17 0.06 22.77 28.38
- Within 6–30 minutes of waking 31.64 1.46 2,017 1,059.5 1.99 0.05 28.78 34.51
- Within 31–60 minutes of waking 14.05 1.02 2,017 470.4 1.75 0.07 12.04 16.05
- More than 60 minutes of waking 28.74 1.40 2,017 962.3 1.93 0.05 26.00 31.48
Type of current tobacco use
- Smoked only 93.45 0.63 2,503 3,774.6 1.62 0.01 92.22 94.68
- Both smoked and smokeless 0.99 0.27 2,503 39.9 1.81 0.27 0.47 1.51
- Smokeless only 5.56 0.55 2,503 224.7 1.46 0.10 4.48 6.65
Smoking quit attempt in the past 12 months 41.27 1.44 2,346 1,621.5 2.01 0.03 38.45 44.09
Visited a health- care provider in the past 12 months 33.62 1.40 2,340 1,318.7 2.05 0.04 30.88 36.36
Health-care provider asked about smoking 68.43 2.27 817 902.6 1.94 0.03 63.98 72.87
Health-care provider advised quitting smoking 56.58 2.39 817 746.4 1.90 0.04 51.90 61.27
Use of pharmacotherapy for smoking cessation 10.11 1.37 942 163.9 1.94 0.14 7.43 12.79 Use of counseling/advice or quit lines for smoking cessation
6.53 1.08 942 105.7 1.79 0.16 4.42 8.63
Quit smoking tobacco without assistance 88.73 1.40 942 1,437.8 1.84 0.02 85.99 91.47
Use of other methods for smoking cessation 2.82 0.81 926 45.0 2.21 0.29 1.24 4.40
Interest in quitting smoking in 5 categories
- Planning to quit within next month 5.43 0.70 2,286 207.0 2.16 0.13 4.06 6.80
- Thinking about quitting within next 12 months 13.14 1.05 2,286 500.8 2.19 0.08 11.08 15.19
- Will quit someday, but not in next 12 months 40.27 1.46 2,286 1,535.3 2.01 0.04 37.42 43.12
- Not interested in quitting 37.88 1.39 2,286 1,444.2 1.88 0.04 35.16 40.60
- Don't know 3.28 0.47 2,286 125.2 1.57 0.14 2.37 4.20 Smokeless tobacco use quit attempt in the past 12 months
19.87 3.85 247 54.8 2.29 0.19 12.32 27.42
Visited a health-care provider in the past 12 months 59.66 4.28 221 140.8 1.67 0.07 51.28 68.05 Health-care provider asked about smokeless tobacco use
20.04 3.74 154 31.9 1.34 0.19 12.71 27.37
Health-care provider advised to stop using smokeless tobacco products
13.49 2.71 154 21.5 0.96 0.20 8.18 18.81
Use of pharmacotherapy for smokeless tobacco use cessation
3.84 3.80 40 2.1 1.53 0.99 -3.61 11.28
Use of counseling/advice or quit lines for smokeless tobacco use cessation
- - - - - - - -
Quit smokeless tobacco use without assistance 80.06 7.50 40 43.9 1.38 0.09 65.36 94.77 Use of other methods for smokeless tobacco use cessation
4.09 4.01 39 2.2 1.56 0.98 -3.77 11.96
Interest in quitting smokeless tobacco use in
- Planning to quit within next month 4.66 2.17 240 12.3 2.54 0.47 0.41 8.92
- Thinking about quitting within next 12 months 4.77 1.48 240 12.6 1.15 0.31 1.88 7.67
- Will quit someday, but not in next 12 months 17.75 3.38 240 46.9 1.88 0.19 11.12 24.38
- Not interested in quitting 71.47 4.06 240 188.8 1.93 0.06 63.51 79.43
- Don't know 1.34 0.68 240 3.6 0.84 0.51 0.01 2.68
Global Adult Tobacco Survey : Thailand Report, 2011 C-11
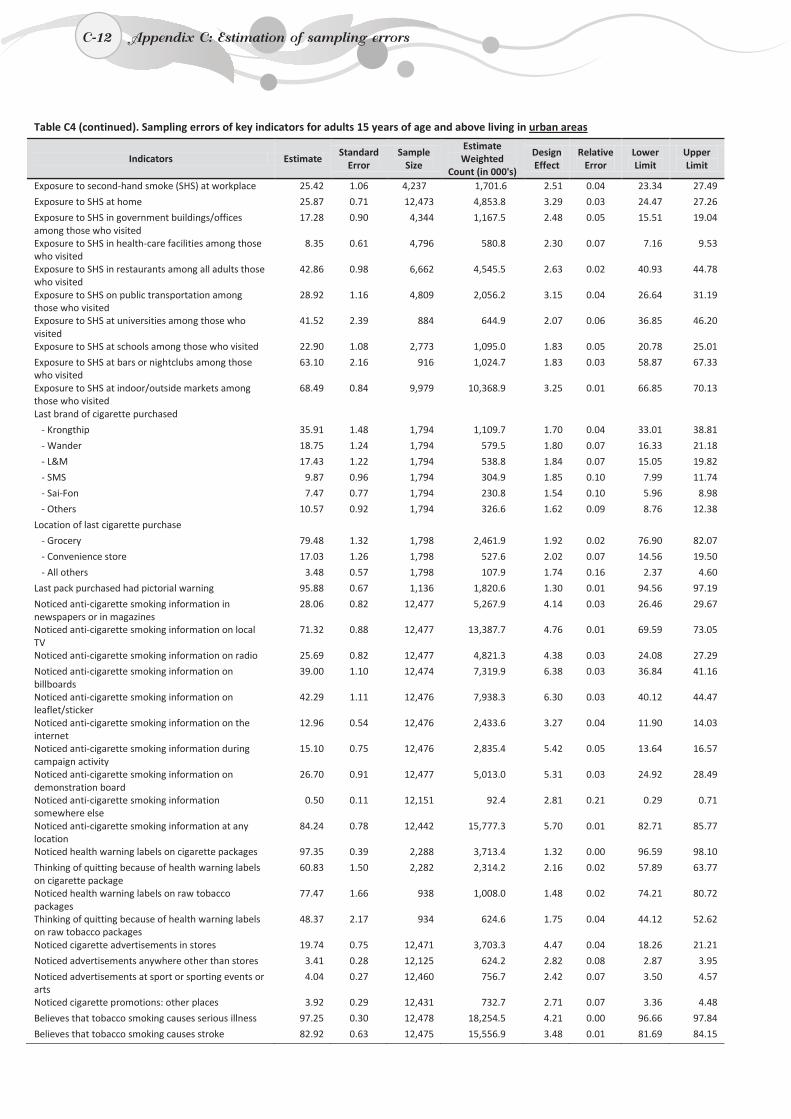
C-12
Table C4 (continued). Sampling errors of key indicators for adults 15 years of age and above living in urban areas
Indicators Estimate Standard
Error Sample
Size
Estimate Weighted
Count (in 000's)
Design Effect
Relative Error
Lower Limit
Upper Limit
Exposure to second-hand smoke (SHS) at workplace 25.42 1.06 4,237 1,701.6 2.51 0.04 23.34 27.49
Exposure to SHS at home 25.87 0.71 12,473 4,853.8 3.29 0.03 24.47 27.26
Exposure to SHS in government buildings/offices among those who visited
17.28 0.90 4,344 1,167.5 2.48 0.05 15.51 19.04
Exposure to SHS in health-care facilities among those who visited
8.35 0.61 4,796 580.8 2.30 0.07 7.16 9.53
Exposure to SHS in restaurants among all adults those who visited
42.86 0.98 6,662 4,545.5 2.63 0.02 40.93 44.78
Exposure to SHS on public transportation among those who visited
28.92 1.16 4,809 2,056.2 3.15 0.04 26.64 31.19
Exposure to SHS at universities among those who visited
41.52 2.39 884 644.9 2.07 0.06 36.85 46.20
Exposure to SHS at schools among those who visited 22.90 1.08 2,773 1,095.0 1.83 0.05 20.78 25.01
Exposure to SHS at bars or nightclubs among those who visited
63.10 2.16 916 1,024.7 1.83 0.03 58.87 67.33
Exposure to SHS at indoor/outside markets among those who visited
68.49 0.84 9,979 10,368.9 3.25 0.01 66.85 70.13
Last brand of cigarette purchased - Krongthip 35.91 1.48 1,794 1,109.7 1.70 0.04 33.01 38.81
- Wander 18.75 1.24 1,794 579.5 1.80 0.07 16.33 21.18
- L&M 17.43 1.22 1,794 538.8 1.84 0.07 15.05 19.82
- SMS 9.87 0.96 1,794 304.9 1.85 0.10 7.99 11.74
- Sai-Fon 7.47 0.77 1,794 230.8 1.54 0.10 5.96 8.98
- Others 10.57 0.92 1,794 326.6 1.62 0.09 8.76 12.38
Location of last cigarette purchase - Grocery 79.48 1.32 1,798 2,461.9 1.92 0.02 76.90 82.07
- Convenience store 17.03 1.26 1,798 527.6 2.02 0.07 14.56 19.50
- All others 3.48 0.57 1,798 107.9 1.74 0.16 2.37 4.60
Last pack purchased had pictorial warning 95.88 0.67 1,136 1,820.6 1.30 0.01 94.56 97.19
Noticed anti-cigarette smoking information in newspapers or in magazines
28.06 0.82 12,477 5,267.9 4.14 0.03 26.46 29.67
Noticed anti-cigarette smoking information on local TV
71.32 0.88 12,477 13,387.7 4.76 0.01 69.59 73.05
Noticed anti-cigarette smoking information on radio 25.69 0.82 12,477 4,821.3 4.38 0.03 24.08 27.29
Noticed anti-cigarette smoking information on billboards
39.00 1.10 12,474 7,319.9 6.38 0.03 36.84 41.16
Noticed anti-cigarette smoking information on leaflet/sticker
42.29 1.11 12,476 7,938.3 6.30 0.03 40.12 44.47
Noticed anti-cigarette smoking information on the internet
12.96 0.54 12,476 2,433.6 3.27 0.04 11.90 14.03
Noticed anti-cigarette smoking information during campaign activity
15.10 0.75 12,476 2,835.4 5.42 0.05 13.64 16.57
Noticed anti-cigarette smoking information on demonstration board
26.70 0.91 12,477 5,013.0 5.31 0.03 24.92 28.49
Noticed anti-cigarette smoking information somewhere else
0.50 0.11 12,151 92.4 2.81 0.21 0.29 0.71
Noticed anti-cigarette smoking information at any location
84.24 0.78 12,442 15,777.3 5.70 0.01 82.71 85.77
Noticed health warning labels on cigarette packages 97.35 0.39 2,288 3,713.4 1.32 0.00 96.59 98.10
Thinking of quitting because of health warning labels on cigarette package
60.83 1.50 2,282 2,314.2 2.16 0.02 57.89 63.77
Noticed health warning labels on raw tobacco packages
77.47 1.66 938 1,008.0 1.48 0.02 74.21 80.72
Thinking of quitting because of health warning labels on raw tobacco packages
48.37 2.17 934 624.6 1.75 0.04 44.12 52.62
Noticed cigarette advertisements in stores 19.74 0.75 12,471 3,703.3 4.47 0.04 18.26 21.21
Noticed advertisements anywhere other than stores 3.41 0.28 12,125 624.2 2.82 0.08 2.87 3.95
Noticed advertisements at sport or sporting events or arts
4.04 0.27 12,460 756.7 2.42 0.07 3.50 4.57
Noticed cigarette promotions: other places 3.92 0.29 12,431 732.7 2.71 0.07 3.36 4.48
Believes that tobacco smoking causes serious illness 97.25 0.30 12,478 18,254.5 4.21 0.00 96.66 97.84
Believes that tobacco smoking causes stroke 82.92 0.63 12,475 15,556.9 3.48 0.01 81.69 84.15
C-12 Appendix C: Estimation of sampling errors
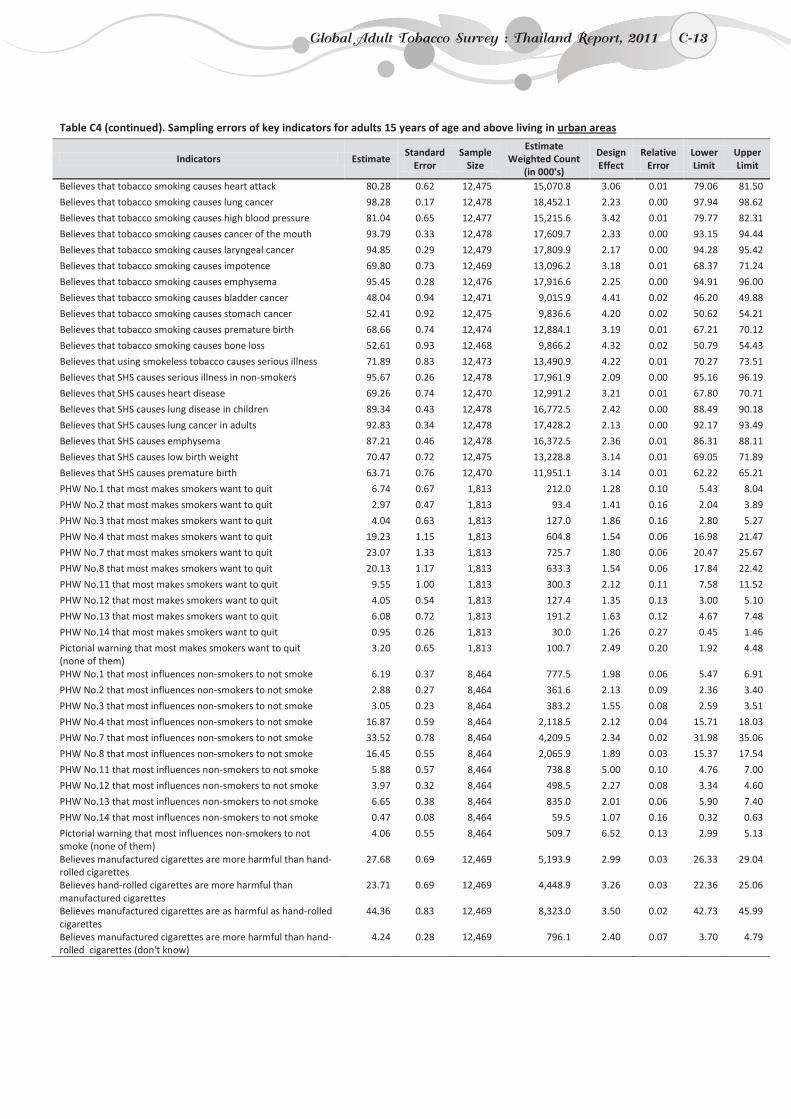
C-13
Table C4 (continued). Sampling errors of key indicators for adults 15 years of age and above living in urban areas
Indicators Estimate Standard
Error Sample
Size
Estimate Weighted Count
(in 000's)
Design Effect
Relative Error
Lower Limit
Upper Limit
Believes that tobacco smoking causes heart attack 80.28 0.62 12,475 15,070.8 3.06 0.01 79.06 81.50
Believes that tobacco smoking causes lung cancer 98.28 0.17 12,478 18,452.1 2.23 0.00 97.94 98.62
Believes that tobacco smoking causes high blood pressure 81.04 0.65 12,477 15,215.6 3.42 0.01 79.77 82.31
Believes that tobacco smoking causes cancer of the mouth 93.79 0.33 12,478 17,609.7 2.33 0.00 93.15 94.44
Believes that tobacco smoking causes laryngeal cancer 94.85 0.29 12,479 17,809.9 2.17 0.00 94.28 95.42
Believes that tobacco smoking causes impotence 69.80 0.73 12,469 13,096.2 3.18 0.01 68.37 71.24
Believes that tobacco smoking causes emphysema 95.45 0.28 12,476 17,916.6 2.25 0.00 94.91 96.00
Believes that tobacco smoking causes bladder cancer 48.04 0.94 12,471 9,015.9 4.41 0.02 46.20 49.88
Believes that tobacco smoking causes stomach cancer 52.41 0.92 12,475 9,836.6 4.20 0.02 50.62 54.21
Believes that tobacco smoking causes premature birth 68.66 0.74 12,474 12,884.1 3.19 0.01 67.21 70.12
Believes that tobacco smoking causes bone loss 52.61 0.93 12,468 9,866.2 4.32 0.02 50.79 54.43
Believes that using smokeless tobacco causes serious illness 71.89 0.83 12,473 13,490.9 4.22 0.01 70.27 73.51
Believes that SHS causes serious illness in non-smokers 95.67 0.26 12,478 17,961.9 2.09 0.00 95.16 96.19
Believes that SHS causes heart disease 69.26 0.74 12,470 12,991.2 3.21 0.01 67.80 70.71
Believes that SHS causes lung disease in children 89.34 0.43 12,478 16,772.5 2.42 0.00 88.49 90.18
Believes that SHS causes lung cancer in adults 92.83 0.34 12,478 17,428.2 2.13 0.00 92.17 93.49
Believes that SHS causes emphysema 87.21 0.46 12,478 16,372.5 2.36 0.01 86.31 88.11
Believes that SHS causes low birth weight 70.47 0.72 12,475 13,228.8 3.14 0.01 69.05 71.89
Believes that SHS causes premature birth 63.71 0.76 12,470 11,951.1 3.14 0.01 62.22 65.21
PHW No.1 that most makes smokers want to quit 6.74 0.67 1,813 212.0 1.28 0.10 5.43 8.04
PHW No.2 that most makes smokers want to quit 2.97 0.47 1,813 93.4 1.41 0.16 2.04 3.89
PHW No.3 that most makes smokers want to quit 4.04 0.63 1,813 127.0 1.86 0.16 2.80 5.27
PHW No.4 that most makes smokers want to quit 19.23 1.15 1,813 604.8 1.54 0.06 16.98 21.47
PHW No.7 that most makes smokers want to quit 23.07 1.33 1,813 725.7 1.80 0.06 20.47 25.67
PHW No.8 that most makes smokers want to quit 20.13 1.17 1,813 633.3 1.54 0.06 17.84 22.42
PHW No.11 that most makes smokers want to quit 9.55 1.00 1,813 300.3 2.12 0.11 7.58 11.52
PHW No.12 that most makes smokers want to quit 4.05 0.54 1,813 127.4 1.35 0.13 3.00 5.10
PHW No.13 that most makes smokers want to quit 6.08 0.72 1,813 191.2 1.63 0.12 4.67 7.48
PHW No.14 that most makes smokers want to quit 0.95 0.26 1,813 30.0 1.26 0.27 0.45 1.46
Pictorial warning that most makes smokers want to quit (none of them)
3.20 0.65 1,813 100.7 2.49 0.20 1.92 4.48
PHW No.1 that most influences non-smokers to not smoke 6.19 0.37 8,464 777.5 1.98 0.06 5.47 6.91
PHW No.2 that most influences non-smokers to not smoke 2.88 0.27 8,464 361.6 2.13 0.09 2.36 3.40
PHW No.3 that most influences non-smokers to not smoke 3.05 0.23 8,464 383.2 1.55 0.08 2.59 3.51
PHW No.4 that most influences non-smokers to not smoke 16.87 0.59 8,464 2,118.5 2.12 0.04 15.71 18.03
PHW No.7 that most influences non-smokers to not smoke 33.52 0.78 8,464 4,209.5 2.34 0.02 31.98 35.06
PHW No.8 that most influences non-smokers to not smoke 16.45 0.55 8,464 2,065.9 1.89 0.03 15.37 17.54
PHW No.11 that most influences non-smokers to not smoke 5.88 0.57 8,464 738.8 5.00 0.10 4.76 7.00
PHW No.12 that most influences non-smokers to not smoke 3.97 0.32 8,464 498.5 2.27 0.08 3.34 4.60
PHW No.13 that most influences non-smokers to not smoke 6.65 0.38 8,464 835.0 2.01 0.06 5.90 7.40
PHW No.14 that most influences non-smokers to not smoke 0.47 0.08 8,464 59.5 1.07 0.16 0.32 0.63
Pictorial warning that most influences non-smokers to not smoke (none of them)
4.06 0.55 8,464 509.7 6.52 0.13 2.99 5.13
Believes manufactured cigarettes are more harmful than hand-rolled cigarettes
27.68 0.69 12,469 5,193.9 2.99 0.03 26.33 29.04
Believes hand-rolled cigarettes are more harmful than manufactured cigarettes
23.71 0.69 12,469 4,448.9 3.26 0.03 22.36 25.06
Believes manufactured cigarettes are as harmful as hand-rolled cigarettes
44.36 0.83 12,469 8,323.0 3.50 0.02 42.73 45.99
Believes manufactured cigarettes are more harmful than hand-rolled cigarettes (don't know)
4.24 0.28 12,469 796.1 2.40 0.07 3.70 4.79
Global Adult Tobacco Survey : Thailand Report, 2011 C-13
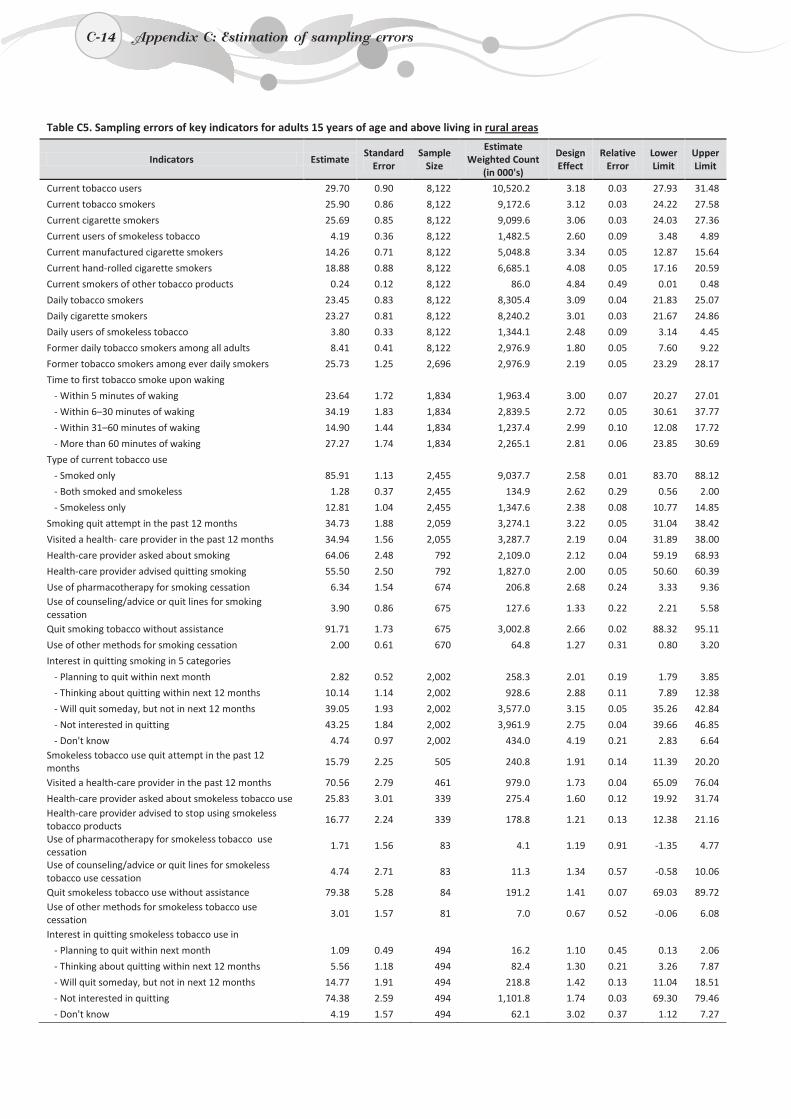
C-14
Table C5. Sampling errors of key indicators for adults 15 years of age and above living in rural areas
Indicators Estimate Standard
Error Sample
Size
Estimate Weighted Count
(in 000's)
Design Effect
Relative Error
Lower Limit
Upper Limit
Current tobacco users 29.70 0.90 8,122 10,520.2 3.18 0.03 27.93 31.48
Current tobacco smokers 25.90 0.86 8,122 9,172.6 3.12 0.03 24.22 27.58
Current cigarette smokers 25.69 0.85 8,122 9,099.6 3.06 0.03 24.03 27.36
Current users of smokeless tobacco 4.19 0.36 8,122 1,482.5 2.60 0.09 3.48 4.89
Current manufactured cigarette smokers 14.26 0.71 8,122 5,048.8 3.34 0.05 12.87 15.64
Current hand-rolled cigarette smokers 18.88 0.88 8,122 6,685.1 4.08 0.05 17.16 20.59
Current smokers of other tobacco products 0.24 0.12 8,122 86.0 4.84 0.49 0.01 0.48
Daily tobacco smokers 23.45 0.83 8,122 8,305.4 3.09 0.04 21.83 25.07
Daily cigarette smokers 23.27 0.81 8,122 8,240.2 3.01 0.03 21.67 24.86
Daily users of smokeless tobacco 3.80 0.33 8,122 1,344.1 2.48 0.09 3.14 4.45
Former daily tobacco smokers among all adults 8.41 0.41 8,122 2,976.9 1.80 0.05 7.60 9.22
Former tobacco smokers among ever daily smokers 25.73 1.25 2,696 2,976.9 2.19 0.05 23.29 28.17
Time to first tobacco smoke upon waking
- Within 5 minutes of waking 23.64 1.72 1,834 1,963.4 3.00 0.07 20.27 27.01
- Within 6–30 minutes of waking 34.19 1.83 1,834 2,839.5 2.72 0.05 30.61 37.77
- Within 31–60 minutes of waking 14.90 1.44 1,834 1,237.4 2.99 0.10 12.08 17.72
- More than 60 minutes of waking 27.27 1.74 1,834 2,265.1 2.81 0.06 23.85 30.69
Type of current tobacco use
- Smoked only 85.91 1.13 2,455 9,037.7 2.58 0.01 83.70 88.12
- Both smoked and smokeless 1.28 0.37 2,455 134.9 2.62 0.29 0.56 2.00
- Smokeless only 12.81 1.04 2,455 1,347.6 2.38 0.08 10.77 14.85
Smoking quit attempt in the past 12 months 34.73 1.88 2,059 3,274.1 3.22 0.05 31.04 38.42
Visited a health- care provider in the past 12 months 34.94 1.56 2,055 3,287.7 2.19 0.04 31.89 38.00
Health-care provider asked about smoking 64.06 2.48 792 2,109.0 2.12 0.04 59.19 68.93
Health-care provider advised quitting smoking 55.50 2.50 792 1,827.0 2.00 0.05 50.60 60.39
Use of pharmacotherapy for smoking cessation 6.34 1.54 674 206.8 2.68 0.24 3.33 9.36 Use of counseling/advice or quit lines for smoking cessation
3.90 0.86 675 127.6 1.33 0.22 2.21 5.58
Quit smoking tobacco without assistance 91.71 1.73 675 3,002.8 2.66 0.02 88.32 95.11
Use of other methods for smoking cessation 2.00 0.61 670 64.8 1.27 0.31 0.80 3.20
Interest in quitting smoking in 5 categories
- Planning to quit within next month 2.82 0.52 2,002 258.3 2.01 0.19 1.79 3.85
- Thinking about quitting within next 12 months 10.14 1.14 2,002 928.6 2.88 0.11 7.89 12.38
- Will quit someday, but not in next 12 months 39.05 1.93 2,002 3,577.0 3.15 0.05 35.26 42.84
- Not interested in quitting 43.25 1.84 2,002 3,961.9 2.75 0.04 39.66 46.85
- Don't know 4.74 0.97 2,002 434.0 4.19 0.21 2.83 6.64 Smokeless tobacco use quit attempt in the past 12 months
15.79 2.25 505 240.8 1.91 0.14 11.39 20.20
Visited a health-care provider in the past 12 months 70.56 2.79 461 979.0 1.73 0.04 65.09 76.04
Health-care provider asked about smokeless tobacco use 25.83 3.01 339 275.4 1.60 0.12 19.92 31.74 Health-care provider advised to stop using smokeless tobacco products
16.77 2.24 339 178.8 1.21 0.13 12.38 21.16
Use of pharmacotherapy for smokeless tobacco use cessation
1.71 1.56 83 4.1 1.19 0.91 -1.35 4.77
Use of counseling/advice or quit lines for smokeless tobacco use cessation
4.74 2.71 83 11.3 1.34 0.57 -0.58 10.06
Quit smokeless tobacco use without assistance 79.38 5.28 84 191.2 1.41 0.07 69.03 89.72 Use of other methods for smokeless tobacco use cessation
3.01 1.57 81 7.0 0.67 0.52 -0.06 6.08
Interest in quitting smokeless tobacco use in
- Planning to quit within next month 1.09 0.49 494 16.2 1.10 0.45 0.13 2.06
- Thinking about quitting within next 12 months 5.56 1.18 494 82.4 1.30 0.21 3.26 7.87
- Will quit someday, but not in next 12 months 14.77 1.91 494 218.8 1.42 0.13 11.04 18.51
- Not interested in quitting 74.38 2.59 494 1,101.8 1.74 0.03 69.30 79.46
- Don't know 4.19 1.57 494 62.1 3.02 0.37 1.12 7.27
C-14 Appendix C: Estimation of sampling errors
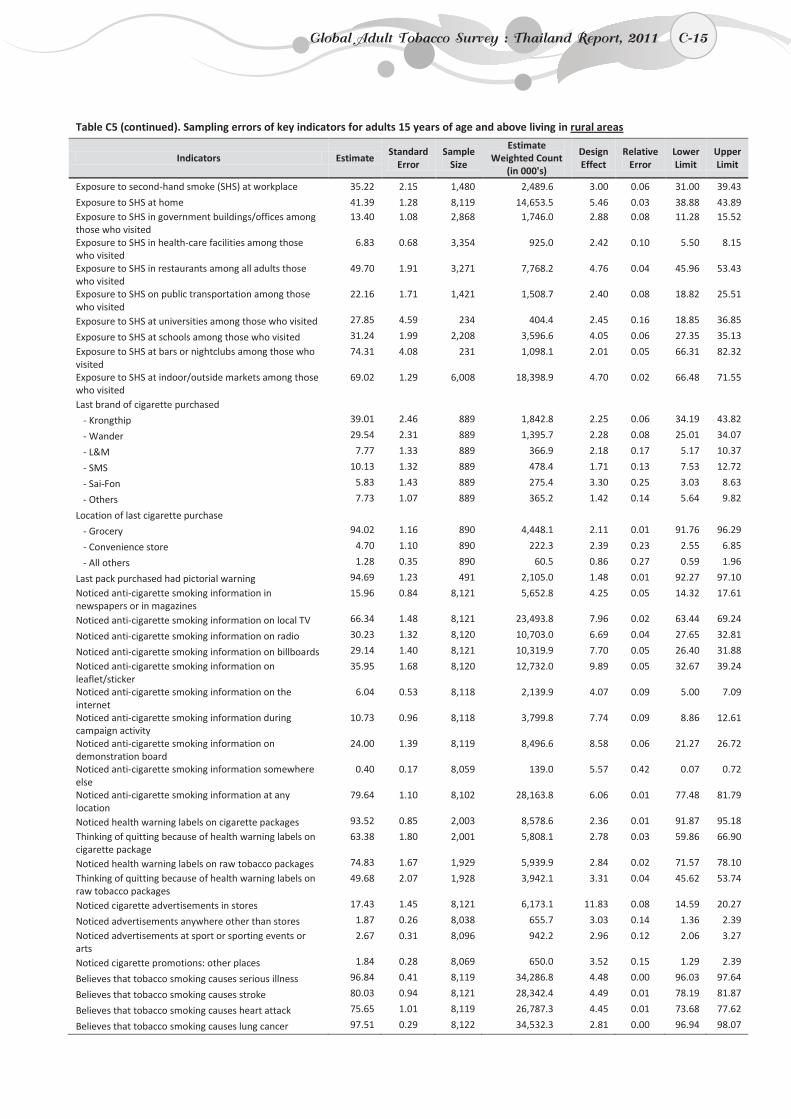
C-15
Table C5 (continued). Sampling errors of key indicators for adults 15 years of age and above living in rural areas
Indicators Estimate Standard
Error Sample
Size
Estimate Weighted Count
(in 000's)
Design Effect
Relative Error
Lower Limit
Upper Limit
Exposure to second-hand smoke (SHS) at workplace 35.22 2.15 1,480 2,489.6 3.00 0.06 31.00 39.43
Exposure to SHS at home 41.39 1.28 8,119 14,653.5 5.46 0.03 38.88 43.89 Exposure to SHS in government buildings/offices among those who visited
13.40 1.08 2,868 1,746.0 2.88 0.08 11.28 15.52
Exposure to SHS in health-care facilities among those who visited
6.83 0.68 3,354 925.0 2.42 0.10 5.50 8.15
Exposure to SHS in restaurants among all adults those who visited
49.70 1.91 3,271 7,768.2 4.76 0.04 45.96 53.43
Exposure to SHS on public transportation among those who visited
22.16 1.71 1,421 1,508.7 2.40 0.08 18.82 25.51
Exposure to SHS at universities among those who visited 27.85 4.59 234 404.4 2.45 0.16 18.85 36.85
Exposure to SHS at schools among those who visited 31.24 1.99 2,208 3,596.6 4.05 0.06 27.35 35.13
Exposure to SHS at bars or nightclubs among those who visited
74.31 4.08 231 1,098.1 2.01 0.05 66.31 82.32
Exposure to SHS at indoor/outside markets among those who visited
69.02 1.29 6,008 18,398.9 4.70 0.02 66.48 71.55
Last brand of cigarette purchased - Krongthip 39.01 2.46 889 1,842.8 2.25 0.06 34.19 43.82
- Wander 29.54 2.31 889 1,395.7 2.28 0.08 25.01 34.07
- L&M 7.77 1.33 889 366.9 2.18 0.17 5.17 10.37
- SMS 10.13 1.32 889 478.4 1.71 0.13 7.53 12.72
- Sai-Fon 5.83 1.43 889 275.4 3.30 0.25 3.03 8.63
- Others 7.73 1.07 889 365.2 1.42 0.14 5.64 9.82
Location of last cigarette purchase - Grocery 94.02 1.16 890 4,448.1 2.11 0.01 91.76 96.29
- Convenience store 4.70 1.10 890 222.3 2.39 0.23 2.55 6.85
- All others 1.28 0.35 890 60.5 0.86 0.27 0.59 1.96
Last pack purchased had pictorial warning 94.69 1.23 491 2,105.0 1.48 0.01 92.27 97.10
Noticed anti-cigarette smoking information in newspapers or in magazines
15.96 0.84 8,121 5,652.8 4.25 0.05 14.32 17.61
Noticed anti-cigarette smoking information on local TV 66.34 1.48 8,121 23,493.8 7.96 0.02 63.44 69.24
Noticed anti-cigarette smoking information on radio 30.23 1.32 8,120 10,703.0 6.69 0.04 27.65 32.81
Noticed anti-cigarette smoking information on billboards 29.14 1.40 8,121 10,319.9 7.70 0.05 26.40 31.88
Noticed anti-cigarette smoking information on leaflet/sticker
35.95 1.68 8,120 12,732.0 9.89 0.05 32.67 39.24
Noticed anti-cigarette smoking information on the internet
6.04 0.53 8,118 2,139.9 4.07 0.09 5.00 7.09
Noticed anti-cigarette smoking information during campaign activity
10.73 0.96 8,118 3,799.8 7.74 0.09 8.86 12.61
Noticed anti-cigarette smoking information on demonstration board
24.00 1.39 8,119 8,496.6 8.58 0.06 21.27 26.72
Noticed anti-cigarette smoking information somewhere else
0.40 0.17 8,059 139.0 5.57 0.42 0.07 0.72
Noticed anti-cigarette smoking information at any location
79.64 1.10 8,102 28,163.8 6.06 0.01 77.48 81.79
Noticed health warning labels on cigarette packages 93.52 0.85 2,003 8,578.6 2.36 0.01 91.87 95.18
Thinking of quitting because of health warning labels on cigarette package
63.38 1.80 2,001 5,808.1 2.78 0.03 59.86 66.90
Noticed health warning labels on raw tobacco packages 74.83 1.67 1,929 5,939.9 2.84 0.02 71.57 78.10
Thinking of quitting because of health warning labels on raw tobacco packages
49.68 2.07 1,928 3,942.1 3.31 0.04 45.62 53.74
Noticed cigarette advertisements in stores 17.43 1.45 8,121 6,173.1 11.83 0.08 14.59 20.27
Noticed advertisements anywhere other than stores 1.87 0.26 8,038 655.7 3.03 0.14 1.36 2.39
Noticed advertisements at sport or sporting events or arts
2.67 0.31 8,096 942.2 2.96 0.12 2.06 3.27
Noticed cigarette promotions: other places 1.84 0.28 8,069 650.0 3.52 0.15 1.29 2.39
Believes that tobacco smoking causes serious illness 96.84 0.41 8,119 34,286.8 4.48 0.00 96.03 97.64
Believes that tobacco smoking causes stroke 80.03 0.94 8,121 28,342.4 4.49 0.01 78.19 81.87
Believes that tobacco smoking causes heart attack 75.65 1.01 8,119 26,787.3 4.45 0.01 73.68 77.62
Believes that tobacco smoking causes lung cancer 97.51 0.29 8,122 34,532.3 2.81 0.00 96.94 98.07
Global Adult Tobacco Survey : Thailand Report, 2011 C-15
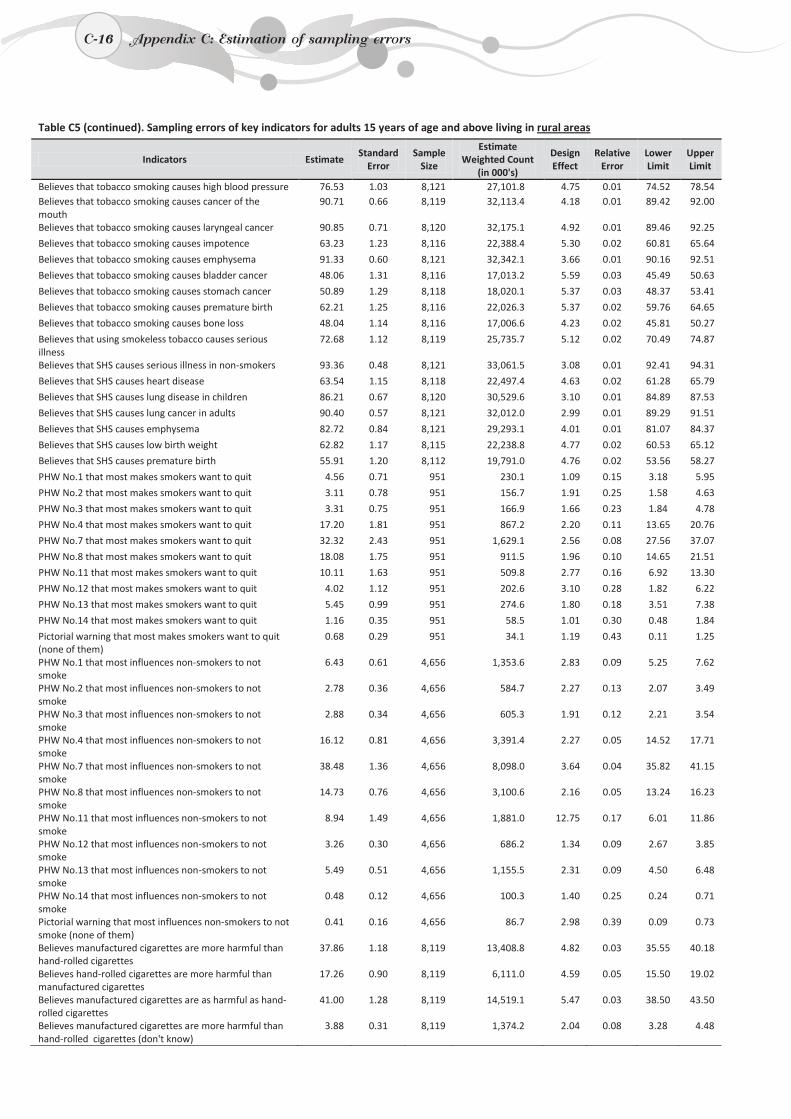
C-16
Table C5 (continued). Sampling errors of key indicators for adults 15 years of age and above living in rural areas
Indicators Estimate Standard
Error Sample
Size
Estimate Weighted Count
(in 000's)
Design Effect
Relative Error
Lower Limit
Upper Limit
Believes that tobacco smoking causes high blood pressure 76.53 1.03 8,121 27,101.8 4.75 0.01 74.52 78.54 Believes that tobacco smoking causes cancer of the mouth
90.71 0.66 8,119 32,113.4 4.18 0.01 89.42 92.00
Believes that tobacco smoking causes laryngeal cancer 90.85 0.71 8,120 32,175.1 4.92 0.01 89.46 92.25
Believes that tobacco smoking causes impotence 63.23 1.23 8,116 22,388.4 5.30 0.02 60.81 65.64
Believes that tobacco smoking causes emphysema 91.33 0.60 8,121 32,342.1 3.66 0.01 90.16 92.51
Believes that tobacco smoking causes bladder cancer 48.06 1.31 8,116 17,013.2 5.59 0.03 45.49 50.63
Believes that tobacco smoking causes stomach cancer 50.89 1.29 8,118 18,020.1 5.37 0.03 48.37 53.41
Believes that tobacco smoking causes premature birth 62.21 1.25 8,116 22,026.3 5.37 0.02 59.76 64.65
Believes that tobacco smoking causes bone loss 48.04 1.14 8,116 17,006.6 4.23 0.02 45.81 50.27
Believes that using smokeless tobacco causes serious illness
72.68 1.12 8,119 25,735.7 5.12 0.02 70.49 74.87
Believes that SHS causes serious illness in non-smokers 93.36 0.48 8,121 33,061.5 3.08 0.01 92.41 94.31
Believes that SHS causes heart disease 63.54 1.15 8,118 22,497.4 4.63 0.02 61.28 65.79
Believes that SHS causes lung disease in children 86.21 0.67 8,120 30,529.6 3.10 0.01 84.89 87.53
Believes that SHS causes lung cancer in adults 90.40 0.57 8,121 32,012.0 2.99 0.01 89.29 91.51
Believes that SHS causes emphysema 82.72 0.84 8,121 29,293.1 4.01 0.01 81.07 84.37
Believes that SHS causes low birth weight 62.82 1.17 8,115 22,238.8 4.77 0.02 60.53 65.12
Believes that SHS causes premature birth 55.91 1.20 8,112 19,791.0 4.76 0.02 53.56 58.27
PHW No.1 that most makes smokers want to quit 4.56 0.71 951 230.1 1.09 0.15 3.18 5.95
PHW No.2 that most makes smokers want to quit 3.11 0.78 951 156.7 1.91 0.25 1.58 4.63
PHW No.3 that most makes smokers want to quit 3.31 0.75 951 166.9 1.66 0.23 1.84 4.78
PHW No.4 that most makes smokers want to quit 17.20 1.81 951 867.2 2.20 0.11 13.65 20.76
PHW No.7 that most makes smokers want to quit 32.32 2.43 951 1,629.1 2.56 0.08 27.56 37.07
PHW No.8 that most makes smokers want to quit 18.08 1.75 951 911.5 1.96 0.10 14.65 21.51
PHW No.11 that most makes smokers want to quit 10.11 1.63 951 509.8 2.77 0.16 6.92 13.30
PHW No.12 that most makes smokers want to quit 4.02 1.12 951 202.6 3.10 0.28 1.82 6.22
PHW No.13 that most makes smokers want to quit 5.45 0.99 951 274.6 1.80 0.18 3.51 7.38
PHW No.14 that most makes smokers want to quit 1.16 0.35 951 58.5 1.01 0.30 0.48 1.84
Pictorial warning that most makes smokers want to quit (none of them)
0.68 0.29 951 34.1 1.19 0.43 0.11 1.25
PHW No.1 that most influences non-smokers to not smoke
6.43 0.61 4,656 1,353.6 2.83 0.09 5.25 7.62
PHW No.2 that most influences non-smokers to not smoke
2.78 0.36 4,656 584.7 2.27 0.13 2.07 3.49
PHW No.3 that most influences non-smokers to not smoke
2.88 0.34 4,656 605.3 1.91 0.12 2.21 3.54
PHW No.4 that most influences non-smokers to not smoke
16.12 0.81 4,656 3,391.4 2.27 0.05 14.52 17.71
PHW No.7 that most influences non-smokers to not smoke
38.48 1.36 4,656 8,098.0 3.64 0.04 35.82 41.15
PHW No.8 that most influences non-smokers to not smoke
14.73 0.76 4,656 3,100.6 2.16 0.05 13.24 16.23
PHW No.11 that most influences non-smokers to not smoke
8.94 1.49 4,656 1,881.0 12.75 0.17 6.01 11.86
PHW No.12 that most influences non-smokers to not smoke
3.26 0.30 4,656 686.2 1.34 0.09 2.67 3.85
PHW No.13 that most influences non-smokers to not smoke
5.49 0.51 4,656 1,155.5 2.31 0.09 4.50 6.48
PHW No.14 that most influences non-smokers to not smoke
0.48 0.12 4,656 100.3 1.40 0.25 0.24 0.71
Pictorial warning that most influences non-smokers to not smoke (none of them)
0.41 0.16 4,656 86.7 2.98 0.39 0.09 0.73
Believes manufactured cigarettes are more harmful than hand-rolled cigarettes
37.86 1.18 8,119 13,408.8 4.82 0.03 35.55 40.18
Believes hand-rolled cigarettes are more harmful than manufactured cigarettes
17.26 0.90 8,119 6,111.0 4.59 0.05 15.50 19.02
Believes manufactured cigarettes are as harmful as hand-rolled cigarettes
41.00 1.28 8,119 14,519.1 5.47 0.03 38.50 43.50
Believes manufactured cigarettes are more harmful than hand-rolled cigarettes (don't know)
3.88 0.31 8,119 1,374.2 2.04 0.08 3.28 4.48
C-16 Appendix C: Estimation of sampling errors
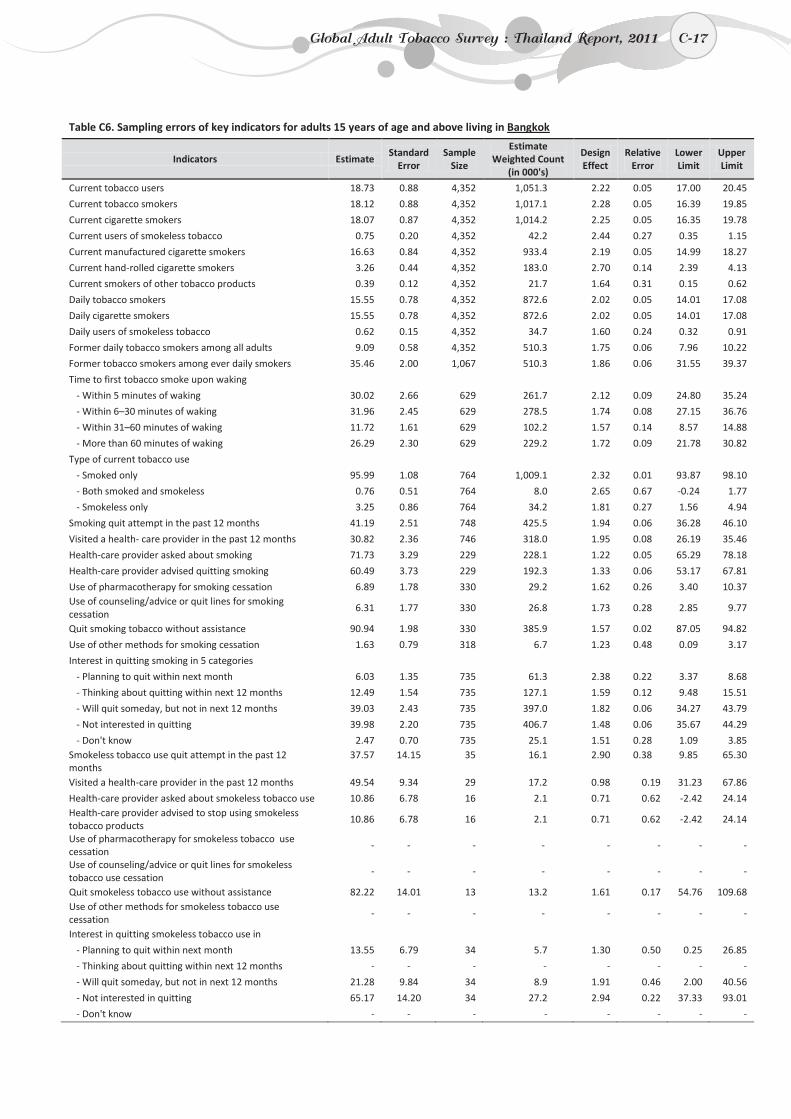
C-17
Table C6. Sampling errors of key indicators for adults 15 years of age and above living in Bangkok
Indicators Estimate Standard
Error Sample
Size
Estimate Weighted Count
(in 000's)
Design Effect
Relative Error
Lower Limit
Upper Limit
Current tobacco users 18.73 0.88 4,352 1,051.3 2.22 0.05 17.00 20.45
Current tobacco smokers 18.12 0.88 4,352 1,017.1 2.28 0.05 16.39 19.85
Current cigarette smokers 18.07 0.87 4,352 1,014.2 2.25 0.05 16.35 19.78
Current users of smokeless tobacco 0.75 0.20 4,352 42.2 2.44 0.27 0.35 1.15
Current manufactured cigarette smokers 16.63 0.84 4,352 933.4 2.19 0.05 14.99 18.27
Current hand-rolled cigarette smokers 3.26 0.44 4,352 183.0 2.70 0.14 2.39 4.13
Current smokers of other tobacco products 0.39 0.12 4,352 21.7 1.64 0.31 0.15 0.62
Daily tobacco smokers 15.55 0.78 4,352 872.6 2.02 0.05 14.01 17.08
Daily cigarette smokers 15.55 0.78 4,352 872.6 2.02 0.05 14.01 17.08
Daily users of smokeless tobacco 0.62 0.15 4,352 34.7 1.60 0.24 0.32 0.91
Former daily tobacco smokers among all adults 9.09 0.58 4,352 510.3 1.75 0.06 7.96 10.22
Former tobacco smokers among ever daily smokers 35.46 2.00 1,067 510.3 1.86 0.06 31.55 39.37
Time to first tobacco smoke upon waking
- Within 5 minutes of waking 30.02 2.66 629 261.7 2.12 0.09 24.80 35.24
- Within 6–30 minutes of waking 31.96 2.45 629 278.5 1.74 0.08 27.15 36.76
- Within 31–60 minutes of waking 11.72 1.61 629 102.2 1.57 0.14 8.57 14.88
- More than 60 minutes of waking 26.29 2.30 629 229.2 1.72 0.09 21.78 30.82
Type of current tobacco use
- Smoked only 95.99 1.08 764 1,009.1 2.32 0.01 93.87 98.10
- Both smoked and smokeless 0.76 0.51 764 8.0 2.65 0.67 -0.24 1.77
- Smokeless only 3.25 0.86 764 34.2 1.81 0.27 1.56 4.94
Smoking quit attempt in the past 12 months 41.19 2.51 748 425.5 1.94 0.06 36.28 46.10
Visited a health- care provider in the past 12 months 30.82 2.36 746 318.0 1.95 0.08 26.19 35.46
Health-care provider asked about smoking 71.73 3.29 229 228.1 1.22 0.05 65.29 78.18
Health-care provider advised quitting smoking 60.49 3.73 229 192.3 1.33 0.06 53.17 67.81
Use of pharmacotherapy for smoking cessation 6.89 1.78 330 29.2 1.62 0.26 3.40 10.37 Use of counseling/advice or quit lines for smoking cessation
6.31 1.77 330 26.8 1.73 0.28 2.85 9.77
Quit smoking tobacco without assistance 90.94 1.98 330 385.9 1.57 0.02 87.05 94.82
Use of other methods for smoking cessation 1.63 0.79 318 6.7 1.23 0.48 0.09 3.17
Interest in quitting smoking in 5 categories
- Planning to quit within next month 6.03 1.35 735 61.3 2.38 0.22 3.37 8.68
- Thinking about quitting within next 12 months 12.49 1.54 735 127.1 1.59 0.12 9.48 15.51
- Will quit someday, but not in next 12 months 39.03 2.43 735 397.0 1.82 0.06 34.27 43.79
- Not interested in quitting 39.98 2.20 735 406.7 1.48 0.06 35.67 44.29
- Don't know 2.47 0.70 735 25.1 1.51 0.28 1.09 3.85 Smokeless tobacco use quit attempt in the past 12 months
37.57 14.15 35 16.1 2.90 0.38 9.85 65.30
Visited a health-care provider in the past 12 months 49.54 9.34 29 17.2 0.98 0.19 31.23 67.86
Health-care provider asked about smokeless tobacco use 10.86 6.78 16 2.1 0.71 0.62 -2.42 24.14 Health-care provider advised to stop using smokeless tobacco products
10.86 6.78 16 2.1 0.71 0.62 -2.42 24.14
Use of pharmacotherapy for smokeless tobacco use cessation
- - - - - - - -
Use of counseling/advice or quit lines for smokeless tobacco use cessation
- - - - - - - -
Quit smokeless tobacco use without assistance 82.22 14.01 13 13.2 1.61 0.17 54.76 109.68 Use of other methods for smokeless tobacco use cessation
- - - - - - - -
Interest in quitting smokeless tobacco use in - Planning to quit within next month 13.55 6.79 34 5.7 1.30 0.50 0.25 26.85
- Thinking about quitting within next 12 months - - - - - - - -
- Will quit someday, but not in next 12 months 21.28 9.84 34 8.9 1.91 0.46 2.00 40.56
- Not interested in quitting 65.17 14.20 34 27.2 2.94 0.22 37.33 93.01
- Don't know - - - - - - - -
Global Adult Tobacco Survey : Thailand Report, 2011 C-17
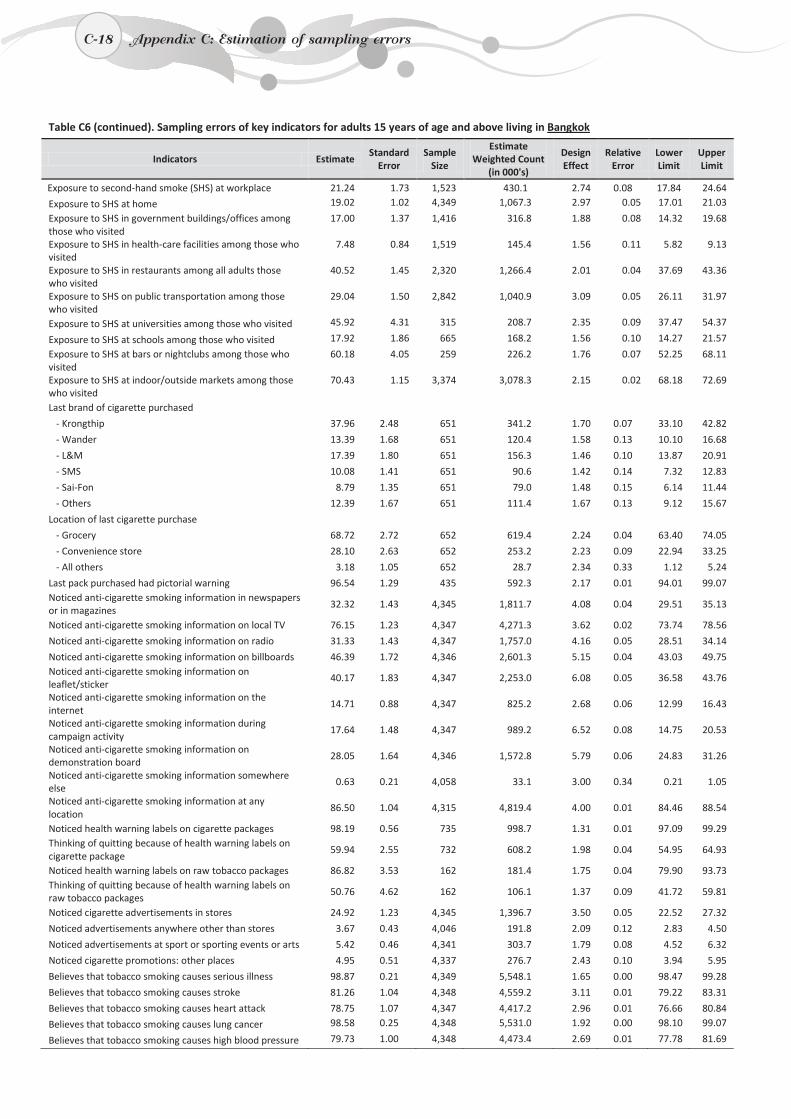
C-18
Table C6 (continued). Sampling errors of key indicators for adults 15 years of age and above living in Bangkok
Indicators Estimate Standard
Error Sample
Size
Estimate Weighted Count
(in 000's)
Design Effect
Relative Error
Lower Limit
Upper Limit
Exposure to second-hand smoke (SHS) at workplace 21.24 1.73 1,523 430.1 2.74 0.08 17.84 24.64
Exposure to SHS at home 19.02 1.02 4,349 1,067.3 2.97 0.05 17.01 21.03
Exposure to SHS in government buildings/offices among those who visited
17.00 1.37 1,416 316.8 1.88 0.08 14.32 19.68
Exposure to SHS in health-care facilities among those who visited
7.48 0.84 1,519 145.4 1.56 0.11 5.82 9.13
Exposure to SHS in restaurants among all adults those who visited
40.52 1.45 2,320 1,266.4 2.01 0.04 37.69 43.36
Exposure to SHS on public transportation among those who visited
29.04 1.50 2,842 1,040.9 3.09 0.05 26.11 31.97
Exposure to SHS at universities among those who visited 45.92 4.31 315 208.7 2.35 0.09 37.47 54.37
Exposure to SHS at schools among those who visited 17.92 1.86 665 168.2 1.56 0.10 14.27 21.57
Exposure to SHS at bars or nightclubs among those who visited
60.18 4.05 259 226.2 1.76 0.07 52.25 68.11
Exposure to SHS at indoor/outside markets among those who visited
70.43 1.15 3,374 3,078.3 2.15 0.02 68.18 72.69
Last brand of cigarette purchased
- Krongthip 37.96 2.48 651 341.2 1.70 0.07 33.10 42.82
- Wander 13.39 1.68 651 120.4 1.58 0.13 10.10 16.68
- L&M 17.39 1.80 651 156.3 1.46 0.10 13.87 20.91
- SMS 10.08 1.41 651 90.6 1.42 0.14 7.32 12.83
- Sai-Fon 8.79 1.35 651 79.0 1.48 0.15 6.14 11.44
- Others 12.39 1.67 651 111.4 1.67 0.13 9.12 15.67
Location of last cigarette purchase
- Grocery 68.72 2.72 652 619.4 2.24 0.04 63.40 74.05
- Convenience store 28.10 2.63 652 253.2 2.23 0.09 22.94 33.25
- All others 3.18 1.05 652 28.7 2.34 0.33 1.12 5.24
Last pack purchased had pictorial warning 96.54 1.29 435 592.3 2.17 0.01 94.01 99.07 Noticed anti-cigarette smoking information in newspapers or in magazines
32.32 1.43 4,345 1,811.7 4.08 0.04 29.51 35.13
Noticed anti-cigarette smoking information on local TV 76.15 1.23 4,347 4,271.3 3.62 0.02 73.74 78.56
Noticed anti-cigarette smoking information on radio 31.33 1.43 4,347 1,757.0 4.16 0.05 28.51 34.14
Noticed anti-cigarette smoking information on billboards 46.39 1.72 4,346 2,601.3 5.15 0.04 43.03 49.75 Noticed anti-cigarette smoking information on leaflet/sticker
40.17 1.83 4,347 2,253.0 6.08 0.05 36.58 43.76
Noticed anti-cigarette smoking information on the internet
14.71 0.88 4,347 825.2 2.68 0.06 12.99 16.43
Noticed anti-cigarette smoking information during campaign activity
17.64 1.48 4,347 989.2 6.52 0.08 14.75 20.53
Noticed anti-cigarette smoking information on demonstration board
28.05 1.64 4,346 1,572.8 5.79 0.06 24.83 31.26
Noticed anti-cigarette smoking information somewhere else
0.63 0.21 4,058 33.1 3.00 0.34 0.21 1.05
Noticed anti-cigarette smoking information at any location
86.50 1.04 4,315 4,819.4 4.00 0.01 84.46 88.54
Noticed health warning labels on cigarette packages 98.19 0.56 735 998.7 1.31 0.01 97.09 99.29 Thinking of quitting because of health warning labels on cigarette package
59.94 2.55 732 608.2 1.98 0.04 54.95 64.93
Noticed health warning labels on raw tobacco packages 86.82 3.53 162 181.4 1.75 0.04 79.90 93.73 Thinking of quitting because of health warning labels on raw tobacco packages
50.76 4.62 162 106.1 1.37 0.09 41.72 59.81
Noticed cigarette advertisements in stores 24.92 1.23 4,345 1,396.7 3.50 0.05 22.52 27.32
Noticed advertisements anywhere other than stores 3.67 0.43 4,046 191.8 2.09 0.12 2.83 4.50
Noticed advertisements at sport or sporting events or arts 5.42 0.46 4,341 303.7 1.79 0.08 4.52 6.32
Noticed cigarette promotions: other places 4.95 0.51 4,337 276.7 2.43 0.10 3.94 5.95
Believes that tobacco smoking causes serious illness 98.87 0.21 4,349 5,548.1 1.65 0.00 98.47 99.28
Believes that tobacco smoking causes stroke 81.26 1.04 4,348 4,559.2 3.11 0.01 79.22 83.31
Believes that tobacco smoking causes heart attack 78.75 1.07 4,347 4,417.2 2.96 0.01 76.66 80.84
Believes that tobacco smoking causes lung cancer 98.58 0.25 4,348 5,531.0 1.92 0.00 98.10 99.07
Believes that tobacco smoking causes high blood pressure 79.73 1.00 4,348 4,473.4 2.69 0.01 77.78 81.69
C-18 Appendix C: Estimation of sampling errors
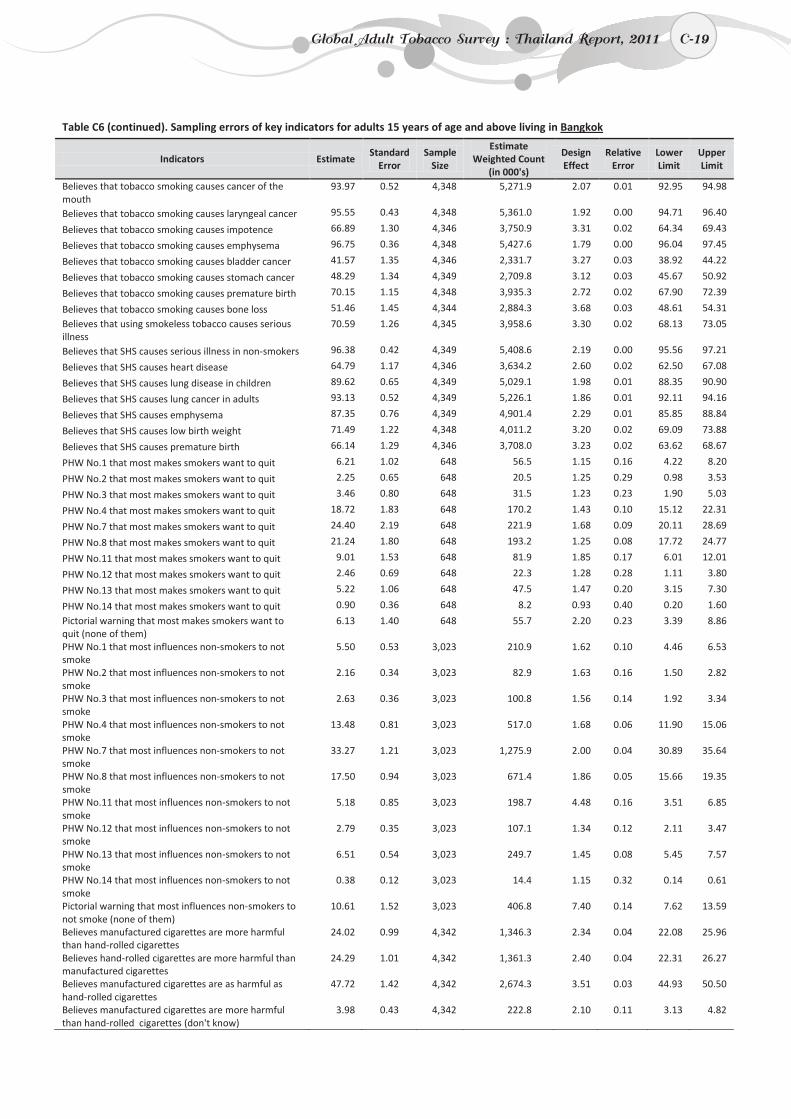
C-19
Table C6 (continued). Sampling errors of key indicators for adults 15 years of age and above living in Bangkok
Indicators Estimate Standard
Error Sample
Size
Estimate Weighted Count
(in 000's)
Design Effect
Relative Error
Lower Limit
Upper Limit
Believes that tobacco smoking causes cancer of the mouth
93.97 0.52 4,348 5,271.9 2.07 0.01 92.95 94.98
Believes that tobacco smoking causes laryngeal cancer 95.55 0.43 4,348 5,361.0 1.92 0.00 94.71 96.40
Believes that tobacco smoking causes impotence 66.89 1.30 4,346 3,750.9 3.31 0.02 64.34 69.43
Believes that tobacco smoking causes emphysema 96.75 0.36 4,348 5,427.6 1.79 0.00 96.04 97.45
Believes that tobacco smoking causes bladder cancer 41.57 1.35 4,346 2,331.7 3.27 0.03 38.92 44.22
Believes that tobacco smoking causes stomach cancer 48.29 1.34 4,349 2,709.8 3.12 0.03 45.67 50.92
Believes that tobacco smoking causes premature birth 70.15 1.15 4,348 3,935.3 2.72 0.02 67.90 72.39
Believes that tobacco smoking causes bone loss 51.46 1.45 4,344 2,884.3 3.68 0.03 48.61 54.31
Believes that using smokeless tobacco causes serious illness
70.59 1.26 4,345 3,958.6 3.30 0.02 68.13 73.05
Believes that SHS causes serious illness in non-smokers 96.38 0.42 4,349 5,408.6 2.19 0.00 95.56 97.21
Believes that SHS causes heart disease 64.79 1.17 4,346 3,634.2 2.60 0.02 62.50 67.08
Believes that SHS causes lung disease in children 89.62 0.65 4,349 5,029.1 1.98 0.01 88.35 90.90
Believes that SHS causes lung cancer in adults 93.13 0.52 4,349 5,226.1 1.86 0.01 92.11 94.16
Believes that SHS causes emphysema 87.35 0.76 4,349 4,901.4 2.29 0.01 85.85 88.84
Believes that SHS causes low birth weight 71.49 1.22 4,348 4,011.2 3.20 0.02 69.09 73.88
Believes that SHS causes premature birth 66.14 1.29 4,346 3,708.0 3.23 0.02 63.62 68.67
PHW No.1 that most makes smokers want to quit 6.21 1.02 648 56.5 1.15 0.16 4.22 8.20
PHW No.2 that most makes smokers want to quit 2.25 0.65 648 20.5 1.25 0.29 0.98 3.53
PHW No.3 that most makes smokers want to quit 3.46 0.80 648 31.5 1.23 0.23 1.90 5.03
PHW No.4 that most makes smokers want to quit 18.72 1.83 648 170.2 1.43 0.10 15.12 22.31
PHW No.7 that most makes smokers want to quit 24.40 2.19 648 221.9 1.68 0.09 20.11 28.69
PHW No.8 that most makes smokers want to quit 21.24 1.80 648 193.2 1.25 0.08 17.72 24.77
PHW No.11 that most makes smokers want to quit 9.01 1.53 648 81.9 1.85 0.17 6.01 12.01
PHW No.12 that most makes smokers want to quit 2.46 0.69 648 22.3 1.28 0.28 1.11 3.80
PHW No.13 that most makes smokers want to quit 5.22 1.06 648 47.5 1.47 0.20 3.15 7.30
PHW No.14 that most makes smokers want to quit 0.90 0.36 648 8.2 0.93 0.40 0.20 1.60
Pictorial warning that most makes smokers want to quit (none of them)
6.13 1.40 648 55.7 2.20 0.23 3.39 8.86
PHW No.1 that most influences non-smokers to not smoke
5.50 0.53 3,023 210.9 1.62 0.10 4.46 6.53
PHW No.2 that most influences non-smokers to not smoke
2.16 0.34 3,023 82.9 1.63 0.16 1.50 2.82
PHW No.3 that most influences non-smokers to not smoke
2.63 0.36 3,023 100.8 1.56 0.14 1.92 3.34
PHW No.4 that most influences non-smokers to not smoke
13.48 0.81 3,023 517.0 1.68 0.06 11.90 15.06
PHW No.7 that most influences non-smokers to not smoke
33.27 1.21 3,023 1,275.9 2.00 0.04 30.89 35.64
PHW No.8 that most influences non-smokers to not smoke
17.50 0.94 3,023 671.4 1.86 0.05 15.66 19.35
PHW No.11 that most influences non-smokers to not smoke
5.18 0.85 3,023 198.7 4.48 0.16 3.51 6.85
PHW No.12 that most influences non-smokers to not smoke
2.79 0.35 3,023 107.1 1.34 0.12 2.11 3.47
PHW No.13 that most influences non-smokers to not smoke
6.51 0.54 3,023 249.7 1.45 0.08 5.45 7.57
PHW No.14 that most influences non-smokers to not smoke
0.38 0.12 3,023 14.4 1.15 0.32 0.14 0.61
Pictorial warning that most influences non-smokers to not smoke (none of them)
10.61 1.52 3,023 406.8 7.40 0.14 7.62 13.59
Believes manufactured cigarettes are more harmful than hand-rolled cigarettes
24.02 0.99 4,342 1,346.3 2.34 0.04 22.08 25.96
Believes hand-rolled cigarettes are more harmful than manufactured cigarettes
24.29 1.01 4,342 1,361.3 2.40 0.04 22.31 26.27
Believes manufactured cigarettes are as harmful as hand-rolled cigarettes
47.72 1.42 4,342 2,674.3 3.51 0.03 44.93 50.50
Believes manufactured cigarettes are more harmful than hand-rolled cigarettes (don't know)
3.98 0.43 4,342 222.8 2.10 0.11 3.13 4.82
Global Adult Tobacco Survey : Thailand Report, 2011 C-19
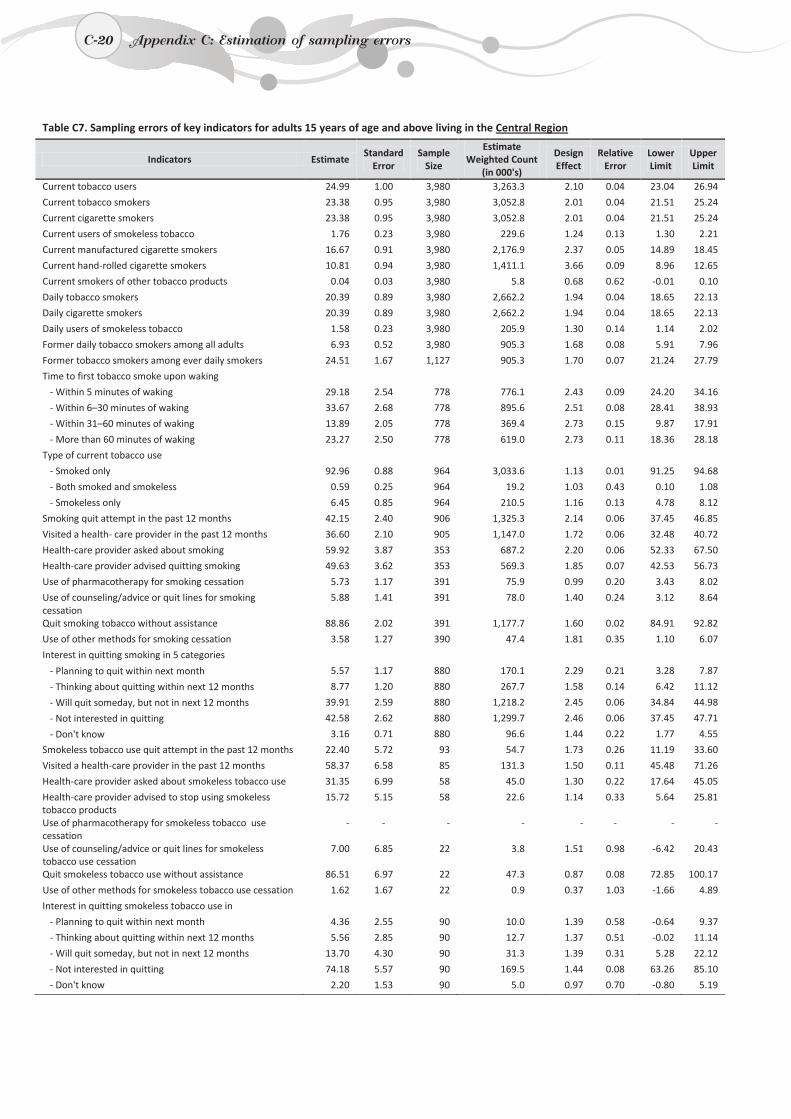
C-20
Table C7. Sampling errors of key indicators for adults 15 years of age and above living in the Central Region
Indicators Estimate Standard
Error Sample
Size
Estimate Weighted Count
(in 000's)
Design Effect
Relative Error
Lower Limit
Upper Limit
Current tobacco users 24.99 1.00 3,980 3,263.3 2.10 0.04 23.04 26.94
Current tobacco smokers 23.38 0.95 3,980 3,052.8 2.01 0.04 21.51 25.24
Current cigarette smokers 23.38 0.95 3,980 3,052.8 2.01 0.04 21.51 25.24
Current users of smokeless tobacco 1.76 0.23 3,980 229.6 1.24 0.13 1.30 2.21
Current manufactured cigarette smokers 16.67 0.91 3,980 2,176.9 2.37 0.05 14.89 18.45
Current hand-rolled cigarette smokers 10.81 0.94 3,980 1,411.1 3.66 0.09 8.96 12.65
Current smokers of other tobacco products 0.04 0.03 3,980 5.8 0.68 0.62 -0.01 0.10
Daily tobacco smokers 20.39 0.89 3,980 2,662.2 1.94 0.04 18.65 22.13
Daily cigarette smokers 20.39 0.89 3,980 2,662.2 1.94 0.04 18.65 22.13
Daily users of smokeless tobacco 1.58 0.23 3,980 205.9 1.30 0.14 1.14 2.02
Former daily tobacco smokers among all adults 6.93 0.52 3,980 905.3 1.68 0.08 5.91 7.96
Former tobacco smokers among ever daily smokers 24.51 1.67 1,127 905.3 1.70 0.07 21.24 27.79
Time to first tobacco smoke upon waking - Within 5 minutes of waking 29.18 2.54 778 776.1 2.43 0.09 24.20 34.16
- Within 6–30 minutes of waking 33.67 2.68 778 895.6 2.51 0.08 28.41 38.93
- Within 31–60 minutes of waking 13.89 2.05 778 369.4 2.73 0.15 9.87 17.91
- More than 60 minutes of waking 23.27 2.50 778 619.0 2.73 0.11 18.36 28.18
Type of current tobacco use - Smoked only 92.96 0.88 964 3,033.6 1.13 0.01 91.25 94.68
- Both smoked and smokeless 0.59 0.25 964 19.2 1.03 0.43 0.10 1.08
- Smokeless only 6.45 0.85 964 210.5 1.16 0.13 4.78 8.12
Smoking quit attempt in the past 12 months 42.15 2.40 906 1,325.3 2.14 0.06 37.45 46.85
Visited a health- care provider in the past 12 months 36.60 2.10 905 1,147.0 1.72 0.06 32.48 40.72
Health-care provider asked about smoking 59.92 3.87 353 687.2 2.20 0.06 52.33 67.50
Health-care provider advised quitting smoking 49.63 3.62 353 569.3 1.85 0.07 42.53 56.73
Use of pharmacotherapy for smoking cessation 5.73 1.17 391 75.9 0.99 0.20 3.43 8.02
Use of counseling/advice or quit lines for smoking cessation
5.88 1.41 391 78.0 1.40 0.24 3.12 8.64
Quit smoking tobacco without assistance 88.86 2.02 391 1,177.7 1.60 0.02 84.91 92.82
Use of other methods for smoking cessation 3.58 1.27 390 47.4 1.81 0.35 1.10 6.07
Interest in quitting smoking in 5 categories - Planning to quit within next month 5.57 1.17 880 170.1 2.29 0.21 3.28 7.87
- Thinking about quitting within next 12 months 8.77 1.20 880 267.7 1.58 0.14 6.42 11.12
- Will quit someday, but not in next 12 months 39.91 2.59 880 1,218.2 2.45 0.06 34.84 44.98
- Not interested in quitting 42.58 2.62 880 1,299.7 2.46 0.06 37.45 47.71
- Don't know 3.16 0.71 880 96.6 1.44 0.22 1.77 4.55
Smokeless tobacco use quit attempt in the past 12 months 22.40 5.72 93 54.7 1.73 0.26 11.19 33.60
Visited a health-care provider in the past 12 months 58.37 6.58 85 131.3 1.50 0.11 45.48 71.26
Health-care provider asked about smokeless tobacco use 31.35 6.99 58 45.0 1.30 0.22 17.64 45.05
Health-care provider advised to stop using smokeless tobacco products
15.72 5.15 58 22.6 1.14 0.33 5.64 25.81
Use of pharmacotherapy for smokeless tobacco use cessation
- - - - - - - -
Use of counseling/advice or quit lines for smokeless tobacco use cessation
7.00 6.85 22 3.8 1.51 0.98 -6.42 20.43
Quit smokeless tobacco use without assistance 86.51 6.97 22 47.3 0.87 0.08 72.85 100.17
Use of other methods for smokeless tobacco use cessation 1.62 1.67 22 0.9 0.37 1.03 -1.66 4.89
Interest in quitting smokeless tobacco use in - Planning to quit within next month 4.36 2.55 90 10.0 1.39 0.58 -0.64 9.37
- Thinking about quitting within next 12 months 5.56 2.85 90 12.7 1.37 0.51 -0.02 11.14
- Will quit someday, but not in next 12 months 13.70 4.30 90 31.3 1.39 0.31 5.28 22.12
- Not interested in quitting 74.18 5.57 90 169.5 1.44 0.08 63.26 85.10
- Don't know 2.20 1.53 90 5.0 0.97 0.70 -0.80 5.19
C-20 Appendix C: Estimation of sampling errors
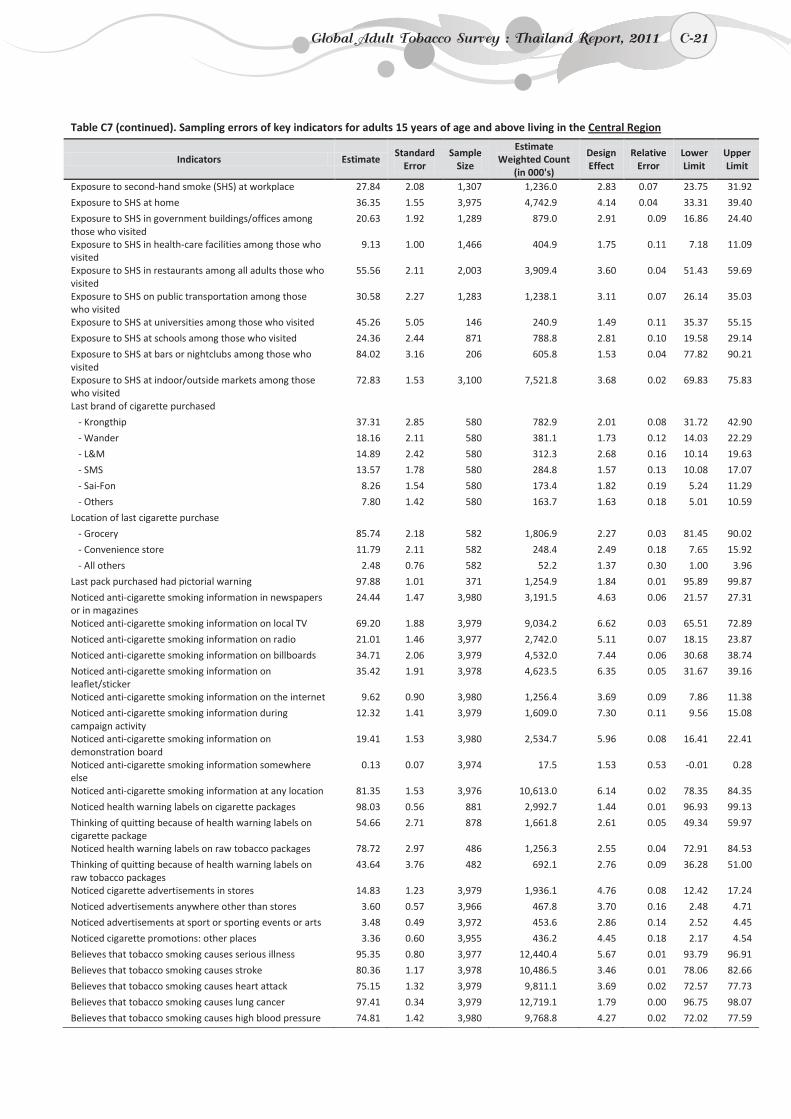
C-21
Table C7 (continued). Sampling errors of key indicators for adults 15 years of age and above living in the Central Region
Indicators Estimate Standard
Error Sample
Size
Estimate Weighted Count
(in 000's)
Design Effect
Relative Error
Lower Limit
Upper Limit
Exposure to second-hand smoke (SHS) at workplace 27.84 2.08 1,307 1,236.0 2.83 0.07 23.75 31.92
Exposure to SHS at home 36.35 1.55 3,975 4,742.9 4.14 0.04 33.31 39.40
Exposure to SHS in government buildings/offices among those who visited
20.63 1.92 1,289 879.0 2.91 0.09 16.86 24.40
Exposure to SHS in health-care facilities among those who visited
9.13 1.00 1,466 404.9 1.75 0.11 7.18 11.09
Exposure to SHS in restaurants among all adults those who visited
55.56 2.11 2,003 3,909.4 3.60 0.04 51.43 59.69
Exposure to SHS on public transportation among those who visited
30.58 2.27 1,283 1,238.1 3.11 0.07 26.14 35.03
Exposure to SHS at universities among those who visited 45.26 5.05 146 240.9 1.49 0.11 35.37 55.15
Exposure to SHS at schools among those who visited 24.36 2.44 871 788.8 2.81 0.10 19.58 29.14
Exposure to SHS at bars or nightclubs among those who visited
84.02 3.16 206 605.8 1.53 0.04 77.82 90.21
Exposure to SHS at indoor/outside markets among those who visited
72.83 1.53 3,100 7,521.8 3.68 0.02 69.83 75.83
Last brand of cigarette purchased - Krongthip 37.31 2.85 580 782.9 2.01 0.08 31.72 42.90
- Wander 18.16 2.11 580 381.1 1.73 0.12 14.03 22.29
- L&M 14.89 2.42 580 312.3 2.68 0.16 10.14 19.63
- SMS 13.57 1.78 580 284.8 1.57 0.13 10.08 17.07
- Sai-Fon 8.26 1.54 580 173.4 1.82 0.19 5.24 11.29
- Others 7.80 1.42 580 163.7 1.63 0.18 5.01 10.59
Location of last cigarette purchase - Grocery 85.74 2.18 582 1,806.9 2.27 0.03 81.45 90.02
- Convenience store 11.79 2.11 582 248.4 2.49 0.18 7.65 15.92
- All others 2.48 0.76 582 52.2 1.37 0.30 1.00 3.96
Last pack purchased had pictorial warning 97.88 1.01 371 1,254.9 1.84 0.01 95.89 99.87
Noticed anti-cigarette smoking information in newspapers or in magazines
24.44 1.47 3,980 3,191.5 4.63 0.06 21.57 27.31
Noticed anti-cigarette smoking information on local TV 69.20 1.88 3,979 9,034.2 6.62 0.03 65.51 72.89
Noticed anti-cigarette smoking information on radio 21.01 1.46 3,977 2,742.0 5.11 0.07 18.15 23.87
Noticed anti-cigarette smoking information on billboards 34.71 2.06 3,979 4,532.0 7.44 0.06 30.68 38.74
Noticed anti-cigarette smoking information on leaflet/sticker
35.42 1.91 3,978 4,623.5 6.35 0.05 31.67 39.16
Noticed anti-cigarette smoking information on the internet 9.62 0.90 3,980 1,256.4 3.69 0.09 7.86 11.38
Noticed anti-cigarette smoking information during campaign activity
12.32 1.41 3,979 1,609.0 7.30 0.11 9.56 15.08
Noticed anti-cigarette smoking information on demonstration board
19.41 1.53 3,980 2,534.7 5.96 0.08 16.41 22.41
Noticed anti-cigarette smoking information somewhere else
0.13 0.07 3,974 17.5 1.53 0.53 -0.01 0.28
Noticed anti-cigarette smoking information at any location 81.35 1.53 3,976 10,613.0 6.14 0.02 78.35 84.35
Noticed health warning labels on cigarette packages 98.03 0.56 881 2,992.7 1.44 0.01 96.93 99.13
Thinking of quitting because of health warning labels on cigarette package
54.66 2.71 878 1,661.8 2.61 0.05 49.34 59.97
Noticed health warning labels on raw tobacco packages 78.72 2.97 486 1,256.3 2.55 0.04 72.91 84.53
Thinking of quitting because of health warning labels on raw tobacco packages
43.64 3.76 482 692.1 2.76 0.09 36.28 51.00
Noticed cigarette advertisements in stores 14.83 1.23 3,979 1,936.1 4.76 0.08 12.42 17.24
Noticed advertisements anywhere other than stores 3.60 0.57 3,966 467.8 3.70 0.16 2.48 4.71
Noticed advertisements at sport or sporting events or arts 3.48 0.49 3,972 453.6 2.86 0.14 2.52 4.45
Noticed cigarette promotions: other places 3.36 0.60 3,955 436.2 4.45 0.18 2.17 4.54
Believes that tobacco smoking causes serious illness 95.35 0.80 3,977 12,440.4 5.67 0.01 93.79 96.91
Believes that tobacco smoking causes stroke 80.36 1.17 3,978 10,486.5 3.46 0.01 78.06 82.66
Believes that tobacco smoking causes heart attack 75.15 1.32 3,979 9,811.1 3.69 0.02 72.57 77.73
Believes that tobacco smoking causes lung cancer 97.41 0.34 3,979 12,719.1 1.79 0.00 96.75 98.07
Believes that tobacco smoking causes high blood pressure 74.81 1.42 3,980 9,768.8 4.27 0.02 72.02 77.59
Global Adult Tobacco Survey : Thailand Report, 2011 C-21
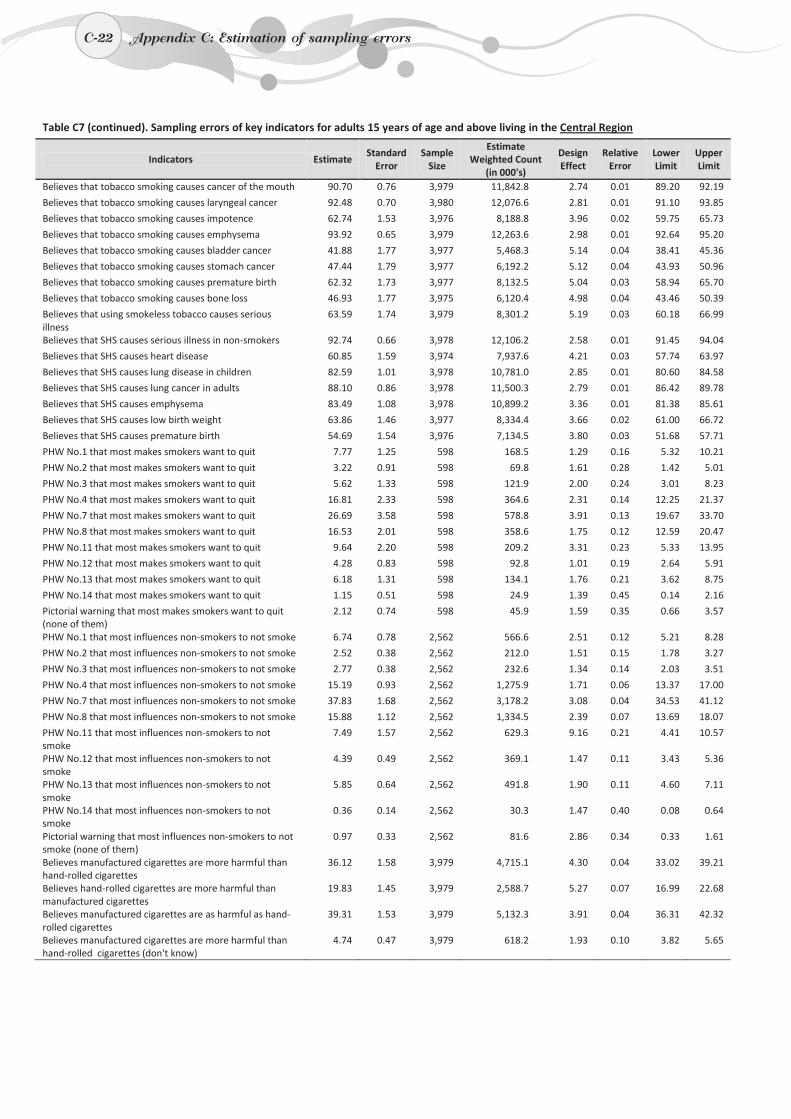
C-22
Table C7 (continued). Sampling errors of key indicators for adults 15 years of age and above living in the Central Region
Indicators Estimate Standard
Error Sample
Size
Estimate Weighted Count
(in 000's)
Design Effect
Relative Error
Lower Limit
Upper Limit
Believes that tobacco smoking causes cancer of the mouth 90.70 0.76 3,979 11,842.8 2.74 0.01 89.20 92.19
Believes that tobacco smoking causes laryngeal cancer 92.48 0.70 3,980 12,076.6 2.81 0.01 91.10 93.85
Believes that tobacco smoking causes impotence 62.74 1.53 3,976 8,188.8 3.96 0.02 59.75 65.73
Believes that tobacco smoking causes emphysema 93.92 0.65 3,979 12,263.6 2.98 0.01 92.64 95.20
Believes that tobacco smoking causes bladder cancer 41.88 1.77 3,977 5,468.3 5.14 0.04 38.41 45.36
Believes that tobacco smoking causes stomach cancer 47.44 1.79 3,977 6,192.2 5.12 0.04 43.93 50.96
Believes that tobacco smoking causes premature birth 62.32 1.73 3,977 8,132.5 5.04 0.03 58.94 65.70
Believes that tobacco smoking causes bone loss 46.93 1.77 3,975 6,120.4 4.98 0.04 43.46 50.39
Believes that using smokeless tobacco causes serious illness
63.59 1.74 3,979 8,301.2 5.19 0.03 60.18 66.99
Believes that SHS causes serious illness in non-smokers 92.74 0.66 3,978 12,106.2 2.58 0.01 91.45 94.04
Believes that SHS causes heart disease 60.85 1.59 3,974 7,937.6 4.21 0.03 57.74 63.97
Believes that SHS causes lung disease in children 82.59 1.01 3,978 10,781.0 2.85 0.01 80.60 84.58
Believes that SHS causes lung cancer in adults 88.10 0.86 3,978 11,500.3 2.79 0.01 86.42 89.78
Believes that SHS causes emphysema 83.49 1.08 3,978 10,899.2 3.36 0.01 81.38 85.61
Believes that SHS causes low birth weight 63.86 1.46 3,977 8,334.4 3.66 0.02 61.00 66.72
Believes that SHS causes premature birth 54.69 1.54 3,976 7,134.5 3.80 0.03 51.68 57.71
PHW No.1 that most makes smokers want to quit 7.77 1.25 598 168.5 1.29 0.16 5.32 10.21
PHW No.2 that most makes smokers want to quit 3.22 0.91 598 69.8 1.61 0.28 1.42 5.01
PHW No.3 that most makes smokers want to quit 5.62 1.33 598 121.9 2.00 0.24 3.01 8.23
PHW No.4 that most makes smokers want to quit 16.81 2.33 598 364.6 2.31 0.14 12.25 21.37
PHW No.7 that most makes smokers want to quit 26.69 3.58 598 578.8 3.91 0.13 19.67 33.70
PHW No.8 that most makes smokers want to quit 16.53 2.01 598 358.6 1.75 0.12 12.59 20.47
PHW No.11 that most makes smokers want to quit 9.64 2.20 598 209.2 3.31 0.23 5.33 13.95
PHW No.12 that most makes smokers want to quit 4.28 0.83 598 92.8 1.01 0.19 2.64 5.91
PHW No.13 that most makes smokers want to quit 6.18 1.31 598 134.1 1.76 0.21 3.62 8.75
PHW No.14 that most makes smokers want to quit 1.15 0.51 598 24.9 1.39 0.45 0.14 2.16
Pictorial warning that most makes smokers want to quit (none of them)
2.12 0.74 598 45.9 1.59 0.35 0.66 3.57
PHW No.1 that most influences non-smokers to not smoke 6.74 0.78 2,562 566.6 2.51 0.12 5.21 8.28
PHW No.2 that most influences non-smokers to not smoke 2.52 0.38 2,562 212.0 1.51 0.15 1.78 3.27
PHW No.3 that most influences non-smokers to not smoke 2.77 0.38 2,562 232.6 1.34 0.14 2.03 3.51
PHW No.4 that most influences non-smokers to not smoke 15.19 0.93 2,562 1,275.9 1.71 0.06 13.37 17.00
PHW No.7 that most influences non-smokers to not smoke 37.83 1.68 2,562 3,178.2 3.08 0.04 34.53 41.12
PHW No.8 that most influences non-smokers to not smoke 15.88 1.12 2,562 1,334.5 2.39 0.07 13.69 18.07
PHW No.11 that most influences non-smokers to not smoke
7.49 1.57 2,562 629.3 9.16 0.21 4.41 10.57
PHW No.12 that most influences non-smokers to not smoke
4.39 0.49 2,562 369.1 1.47 0.11 3.43 5.36
PHW No.13 that most influences non-smokers to not smoke
5.85 0.64 2,562 491.8 1.90 0.11 4.60 7.11
PHW No.14 that most influences non-smokers to not smoke
0.36 0.14 2,562 30.3 1.47 0.40 0.08 0.64
Pictorial warning that most influences non-smokers to not smoke (none of them)
0.97 0.33 2,562 81.6 2.86 0.34 0.33 1.61
Believes manufactured cigarettes are more harmful than hand-rolled cigarettes
36.12 1.58 3,979 4,715.1 4.30 0.04 33.02 39.21
Believes hand-rolled cigarettes are more harmful than manufactured cigarettes
19.83 1.45 3,979 2,588.7 5.27 0.07 16.99 22.68
Believes manufactured cigarettes are as harmful as hand-rolled cigarettes
39.31 1.53 3,979 5,132.3 3.91 0.04 36.31 42.32
Believes manufactured cigarettes are more harmful than hand-rolled cigarettes (don't know)
4.74 0.47 3,979 618.2 1.93 0.10 3.82 5.65
C-22 Appendix C: Estimation of sampling errors
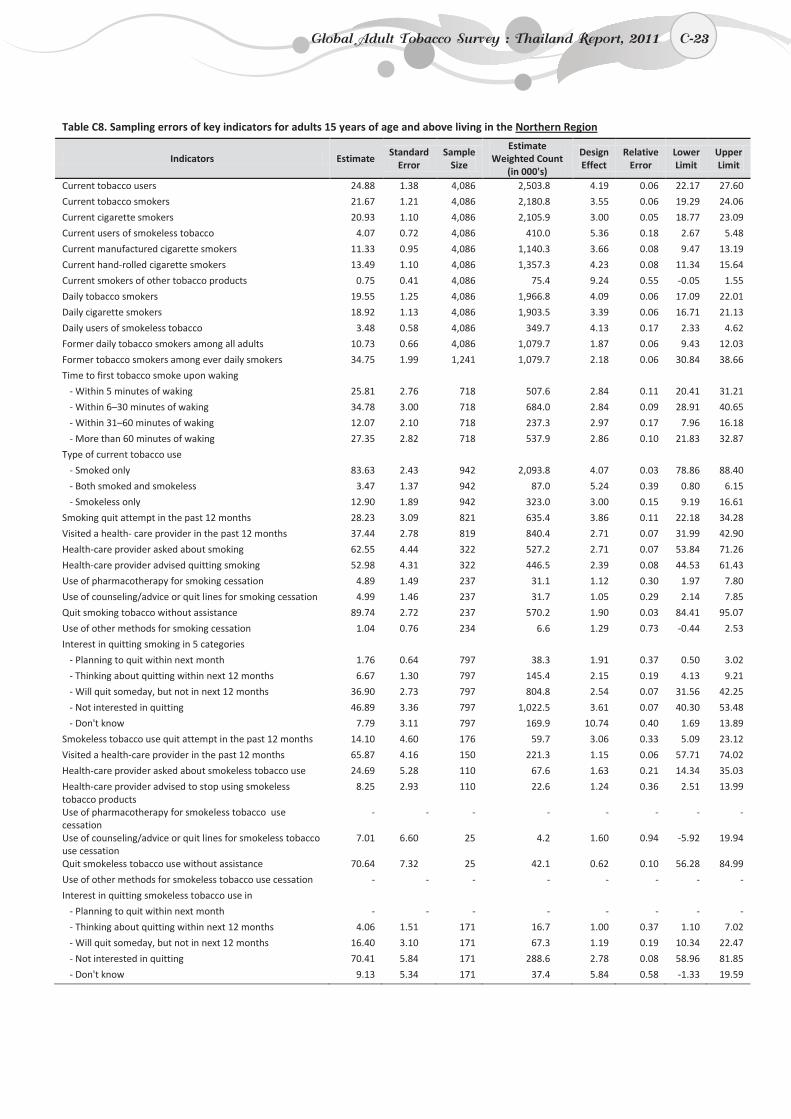
C-23
Table C8. Sampling errors of key indicators for adults 15 years of age and above living in the Northern Region
Indicators Estimate Standard
Error Sample
Size
Estimate Weighted Count
(in 000's)
Design Effect
Relative Error
Lower Limit
Upper Limit
Current tobacco users 24.88 1.38 4,086 2,503.8 4.19 0.06 22.17 27.60
Current tobacco smokers 21.67 1.21 4,086 2,180.8 3.55 0.06 19.29 24.06
Current cigarette smokers 20.93 1.10 4,086 2,105.9 3.00 0.05 18.77 23.09
Current users of smokeless tobacco 4.07 0.72 4,086 410.0 5.36 0.18 2.67 5.48
Current manufactured cigarette smokers 11.33 0.95 4,086 1,140.3 3.66 0.08 9.47 13.19
Current hand-rolled cigarette smokers 13.49 1.10 4,086 1,357.3 4.23 0.08 11.34 15.64
Current smokers of other tobacco products 0.75 0.41 4,086 75.4 9.24 0.55 -0.05 1.55
Daily tobacco smokers 19.55 1.25 4,086 1,966.8 4.09 0.06 17.09 22.01
Daily cigarette smokers 18.92 1.13 4,086 1,903.5 3.39 0.06 16.71 21.13
Daily users of smokeless tobacco 3.48 0.58 4,086 349.7 4.13 0.17 2.33 4.62
Former daily tobacco smokers among all adults 10.73 0.66 4,086 1,079.7 1.87 0.06 9.43 12.03
Former tobacco smokers among ever daily smokers 34.75 1.99 1,241 1,079.7 2.18 0.06 30.84 38.66
Time to first tobacco smoke upon waking - Within 5 minutes of waking 25.81 2.76 718 507.6 2.84 0.11 20.41 31.21
- Within 6–30 minutes of waking 34.78 3.00 718 684.0 2.84 0.09 28.91 40.65
- Within 31–60 minutes of waking 12.07 2.10 718 237.3 2.97 0.17 7.96 16.18
- More than 60 minutes of waking 27.35 2.82 718 537.9 2.86 0.10 21.83 32.87
Type of current tobacco use - Smoked only 83.63 2.43 942 2,093.8 4.07 0.03 78.86 88.40
- Both smoked and smokeless 3.47 1.37 942 87.0 5.24 0.39 0.80 6.15
- Smokeless only 12.90 1.89 942 323.0 3.00 0.15 9.19 16.61
Smoking quit attempt in the past 12 months 28.23 3.09 821 635.4 3.86 0.11 22.18 34.28
Visited a health- care provider in the past 12 months 37.44 2.78 819 840.4 2.71 0.07 31.99 42.90
Health-care provider asked about smoking 62.55 4.44 322 527.2 2.71 0.07 53.84 71.26
Health-care provider advised quitting smoking 52.98 4.31 322 446.5 2.39 0.08 44.53 61.43
Use of pharmacotherapy for smoking cessation 4.89 1.49 237 31.1 1.12 0.30 1.97 7.80
Use of counseling/advice or quit lines for smoking cessation 4.99 1.46 237 31.7 1.05 0.29 2.14 7.85
Quit smoking tobacco without assistance 89.74 2.72 237 570.2 1.90 0.03 84.41 95.07
Use of other methods for smoking cessation 1.04 0.76 234 6.6 1.29 0.73 -0.44 2.53
Interest in quitting smoking in 5 categories - Planning to quit within next month 1.76 0.64 797 38.3 1.91 0.37 0.50 3.02
- Thinking about quitting within next 12 months 6.67 1.30 797 145.4 2.15 0.19 4.13 9.21
- Will quit someday, but not in next 12 months 36.90 2.73 797 804.8 2.54 0.07 31.56 42.25
- Not interested in quitting 46.89 3.36 797 1,022.5 3.61 0.07 40.30 53.48
- Don't know 7.79 3.11 797 169.9 10.74 0.40 1.69 13.89
Smokeless tobacco use quit attempt in the past 12 months 14.10 4.60 176 59.7 3.06 0.33 5.09 23.12
Visited a health-care provider in the past 12 months 65.87 4.16 150 221.3 1.15 0.06 57.71 74.02
Health-care provider asked about smokeless tobacco use 24.69 5.28 110 67.6 1.63 0.21 14.34 35.03
Health-care provider advised to stop using smokeless tobacco products
8.25 2.93 110 22.6 1.24 0.36 2.51 13.99
Use of pharmacotherapy for smokeless tobacco use cessation
- - - - - - - -
Use of counseling/advice or quit lines for smokeless tobacco use cessation
7.01 6.60 25 4.2 1.60 0.94 -5.92 19.94
Quit smokeless tobacco use without assistance 70.64 7.32 25 42.1 0.62 0.10 56.28 84.99
Use of other methods for smokeless tobacco use cessation - - - - - - - -
Interest in quitting smokeless tobacco use in - Planning to quit within next month - - - - - - - -
- Thinking about quitting within next 12 months 4.06 1.51 171 16.7 1.00 0.37 1.10 7.02
- Will quit someday, but not in next 12 months 16.40 3.10 171 67.3 1.19 0.19 10.34 22.47
- Not interested in quitting 70.41 5.84 171 288.6 2.78 0.08 58.96 81.85
- Don't know 9.13 5.34 171 37.4 5.84 0.58 -1.33 19.59
Global Adult Tobacco Survey : Thailand Report, 2011 C-23
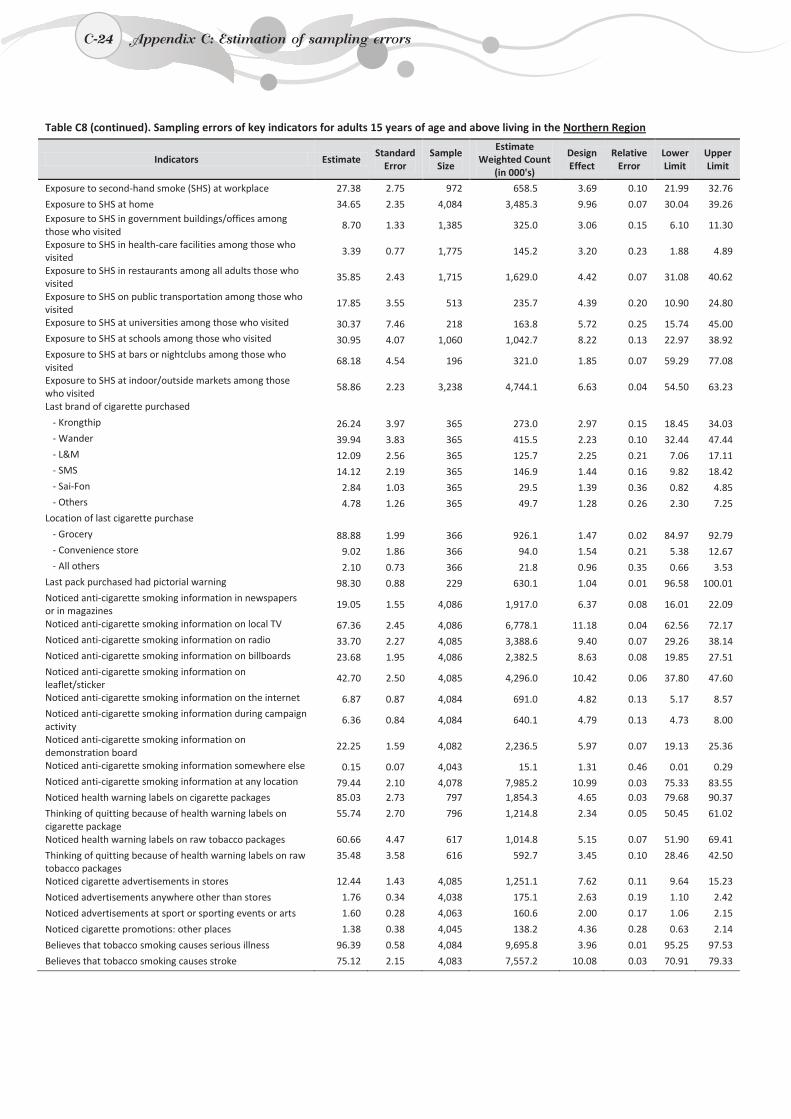
C-24
Table C8 (continued). Sampling errors of key indicators for adults 15 years of age and above living in the Northern Region
Indicators Estimate Standard
Error Sample
Size
Estimate Weighted Count
(in 000's)
Design Effect
Relative Error
Lower Limit
Upper Limit
Exposure to second-hand smoke (SHS) at workplace 27.38 2.75 972 658.5 3.69 0.10 21.99 32.76
Exposure to SHS at home 34.65 2.35 4,084 3,485.3 9.96 0.07 30.04 39.26 Exposure to SHS in government buildings/offices among those who visited
8.70 1.33 1,385 325.0 3.06 0.15 6.10 11.30
Exposure to SHS in health-care facilities among those who visited
3.39 0.77 1,775 145.2 3.20 0.23 1.88 4.89
Exposure to SHS in restaurants among all adults those who visited
35.85 2.43 1,715 1,629.0 4.42 0.07 31.08 40.62
Exposure to SHS on public transportation among those who visited
17.85 3.55 513 235.7 4.39 0.20 10.90 24.80
Exposure to SHS at universities among those who visited 30.37 7.46 218 163.8 5.72 0.25 15.74 45.00 Exposure to SHS at schools among those who visited 30.95 4.07 1,060 1,042.7 8.22 0.13 22.97 38.92 Exposure to SHS at bars or nightclubs among those who visited
68.18 4.54 196 321.0 1.85 0.07 59.29 77.08
Exposure to SHS at indoor/outside markets among those who visited
58.86 2.23 3,238 4,744.1 6.63 0.04 54.50 63.23
Last brand of cigarette purchased
- Krongthip 26.24 3.97 365 273.0 2.97 0.15 18.45 34.03 - Wander 39.94 3.83 365 415.5 2.23 0.10 32.44 47.44 - L&M 12.09 2.56 365 125.7 2.25 0.21 7.06 17.11 - SMS 14.12 2.19 365 146.9 1.44 0.16 9.82 18.42 - Sai-Fon 2.84 1.03 365 29.5 1.39 0.36 0.82 4.85 - Others 4.78 1.26 365 49.7 1.28 0.26 2.30 7.25
Location of last cigarette purchase
- Grocery 88.88 1.99 366 926.1 1.47 0.02 84.97 92.79 - Convenience store 9.02 1.86 366 94.0 1.54 0.21 5.38 12.67 - All others 2.10 0.73 366 21.8 0.96 0.35 0.66 3.53
Last pack purchased had pictorial warning 98.30 0.88 229 630.1 1.04 0.01 96.58 100.01 Noticed anti-cigarette smoking information in newspapers or in magazines
19.05 1.55 4,086 1,917.0 6.37 0.08 16.01 22.09
Noticed anti-cigarette smoking information on local TV 67.36 2.45 4,086 6,778.1 11.18 0.04 62.56 72.17 Noticed anti-cigarette smoking information on radio 33.70 2.27 4,085 3,388.6 9.40 0.07 29.26 38.14 Noticed anti-cigarette smoking information on billboards 23.68 1.95 4,086 2,382.5 8.63 0.08 19.85 27.51 Noticed anti-cigarette smoking information on leaflet/sticker
42.70 2.50 4,085 4,296.0 10.42 0.06 37.80 47.60
Noticed anti-cigarette smoking information on the internet 6.87 0.87 4,084 691.0 4.82 0.13 5.17 8.57 Noticed anti-cigarette smoking information during campaign activity
6.36 0.84 4,084 640.1 4.79 0.13 4.73 8.00
Noticed anti-cigarette smoking information on demonstration board
22.25 1.59 4,082 2,236.5 5.97 0.07 19.13 25.36
Noticed anti-cigarette smoking information somewhere else 0.15 0.07 4,043 15.1 1.31 0.46 0.01 0.29 Noticed anti-cigarette smoking information at any location 79.44 2.10 4,078 7,985.2 10.99 0.03 75.33 83.55 Noticed health warning labels on cigarette packages 85.03 2.73 797 1,854.3 4.65 0.03 79.68 90.37
Thinking of quitting because of health warning labels on cigarette package
55.74 2.70 796 1,214.8 2.34 0.05 50.45 61.02
Noticed health warning labels on raw tobacco packages 60.66 4.47 617 1,014.8 5.15 0.07 51.90 69.41
Thinking of quitting because of health warning labels on raw tobacco packages
35.48 3.58 616 592.7 3.45 0.10 28.46 42.50
Noticed cigarette advertisements in stores 12.44 1.43 4,085 1,251.1 7.62 0.11 9.64 15.23
Noticed advertisements anywhere other than stores 1.76 0.34 4,038 175.1 2.63 0.19 1.10 2.42
Noticed advertisements at sport or sporting events or arts 1.60 0.28 4,063 160.6 2.00 0.17 1.06 2.15
Noticed cigarette promotions: other places 1.38 0.38 4,045 138.2 4.36 0.28 0.63 2.14
Believes that tobacco smoking causes serious illness 96.39 0.58 4,084 9,695.8 3.96 0.01 95.25 97.53
Believes that tobacco smoking causes stroke 75.12 2.15 4,083 7,557.2 10.08 0.03 70.91 79.33
C-24 Appendix C: Estimation of sampling errors
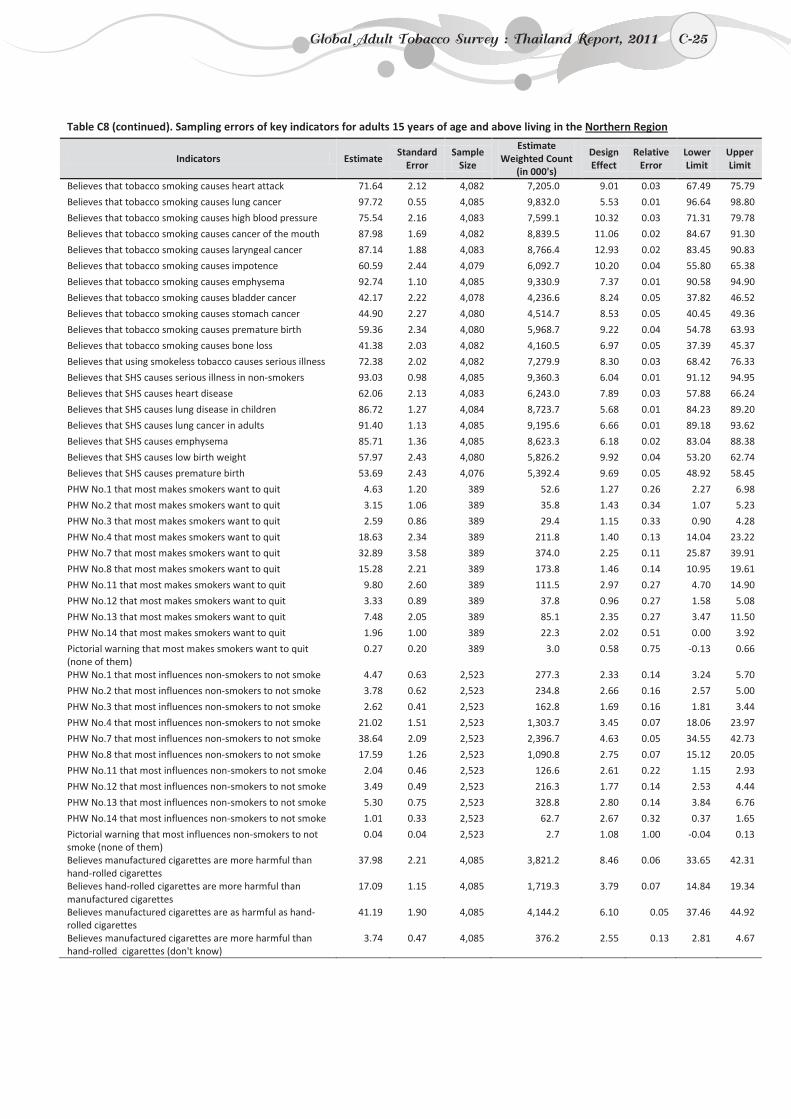
C-25
Table C8 (continued). Sampling errors of key indicators for adults 15 years of age and above living in the Northern Region
Indicators Estimate Standard
Error Sample
Size
Estimate Weighted Count
(in 000's)
Design Effect
Relative Error
Lower Limit
Upper Limit
Believes that tobacco smoking causes heart attack 71.64 2.12 4,082 7,205.0 9.01 0.03 67.49 75.79
Believes that tobacco smoking causes lung cancer 97.72 0.55 4,085 9,832.0 5.53 0.01 96.64 98.80
Believes that tobacco smoking causes high blood pressure 75.54 2.16 4,083 7,599.1 10.32 0.03 71.31 79.78
Believes that tobacco smoking causes cancer of the mouth 87.98 1.69 4,082 8,839.5 11.06 0.02 84.67 91.30
Believes that tobacco smoking causes laryngeal cancer 87.14 1.88 4,083 8,766.4 12.93 0.02 83.45 90.83
Believes that tobacco smoking causes impotence 60.59 2.44 4,079 6,092.7 10.20 0.04 55.80 65.38
Believes that tobacco smoking causes emphysema 92.74 1.10 4,085 9,330.9 7.37 0.01 90.58 94.90
Believes that tobacco smoking causes bladder cancer 42.17 2.22 4,078 4,236.6 8.24 0.05 37.82 46.52
Believes that tobacco smoking causes stomach cancer 44.90 2.27 4,080 4,514.7 8.53 0.05 40.45 49.36
Believes that tobacco smoking causes premature birth 59.36 2.34 4,080 5,968.7 9.22 0.04 54.78 63.93
Believes that tobacco smoking causes bone loss 41.38 2.03 4,082 4,160.5 6.97 0.05 37.39 45.37
Believes that using smokeless tobacco causes serious illness 72.38 2.02 4,082 7,279.9 8.30 0.03 68.42 76.33
Believes that SHS causes serious illness in non-smokers 93.03 0.98 4,085 9,360.3 6.04 0.01 91.12 94.95
Believes that SHS causes heart disease 62.06 2.13 4,083 6,243.0 7.89 0.03 57.88 66.24
Believes that SHS causes lung disease in children 86.72 1.27 4,084 8,723.7 5.68 0.01 84.23 89.20
Believes that SHS causes lung cancer in adults 91.40 1.13 4,085 9,195.6 6.66 0.01 89.18 93.62
Believes that SHS causes emphysema 85.71 1.36 4,085 8,623.3 6.18 0.02 83.04 88.38
Believes that SHS causes low birth weight 57.97 2.43 4,080 5,826.2 9.92 0.04 53.20 62.74
Believes that SHS causes premature birth 53.69 2.43 4,076 5,392.4 9.69 0.05 48.92 58.45
PHW No.1 that most makes smokers want to quit 4.63 1.20 389 52.6 1.27 0.26 2.27 6.98
PHW No.2 that most makes smokers want to quit 3.15 1.06 389 35.8 1.43 0.34 1.07 5.23
PHW No.3 that most makes smokers want to quit 2.59 0.86 389 29.4 1.15 0.33 0.90 4.28
PHW No.4 that most makes smokers want to quit 18.63 2.34 389 211.8 1.40 0.13 14.04 23.22
PHW No.7 that most makes smokers want to quit 32.89 3.58 389 374.0 2.25 0.11 25.87 39.91
PHW No.8 that most makes smokers want to quit 15.28 2.21 389 173.8 1.46 0.14 10.95 19.61
PHW No.11 that most makes smokers want to quit 9.80 2.60 389 111.5 2.97 0.27 4.70 14.90
PHW No.12 that most makes smokers want to quit 3.33 0.89 389 37.8 0.96 0.27 1.58 5.08
PHW No.13 that most makes smokers want to quit 7.48 2.05 389 85.1 2.35 0.27 3.47 11.50
PHW No.14 that most makes smokers want to quit 1.96 1.00 389 22.3 2.02 0.51 0.00 3.92
Pictorial warning that most makes smokers want to quit (none of them)
0.27 0.20 389 3.0 0.58 0.75 -0.13 0.66
PHW No.1 that most influences non-smokers to not smoke 4.47 0.63 2,523 277.3 2.33 0.14 3.24 5.70
PHW No.2 that most influences non-smokers to not smoke 3.78 0.62 2,523 234.8 2.66 0.16 2.57 5.00
PHW No.3 that most influences non-smokers to not smoke 2.62 0.41 2,523 162.8 1.69 0.16 1.81 3.44
PHW No.4 that most influences non-smokers to not smoke 21.02 1.51 2,523 1,303.7 3.45 0.07 18.06 23.97
PHW No.7 that most influences non-smokers to not smoke 38.64 2.09 2,523 2,396.7 4.63 0.05 34.55 42.73
PHW No.8 that most influences non-smokers to not smoke 17.59 1.26 2,523 1,090.8 2.75 0.07 15.12 20.05
PHW No.11 that most influences non-smokers to not smoke 2.04 0.46 2,523 126.6 2.61 0.22 1.15 2.93
PHW No.12 that most influences non-smokers to not smoke 3.49 0.49 2,523 216.3 1.77 0.14 2.53 4.44
PHW No.13 that most influences non-smokers to not smoke 5.30 0.75 2,523 328.8 2.80 0.14 3.84 6.76
PHW No.14 that most influences non-smokers to not smoke 1.01 0.33 2,523 62.7 2.67 0.32 0.37 1.65
Pictorial warning that most influences non-smokers to not smoke (none of them)
0.04 0.04 2,523 2.7 1.08 1.00 -0.04 0.13
Believes manufactured cigarettes are more harmful than hand-rolled cigarettes
37.98 2.21 4,085 3,821.2 8.46 0.06 33.65 42.31
Believes hand-rolled cigarettes are more harmful than manufactured cigarettes
17.09 1.15 4,085 1,719.3 3.79 0.07 14.84 19.34
Believes manufactured cigarettes are as harmful as hand-rolled cigarettes
41.19 1.90 4,085 4,144.2 6.10 0.05 37.46 44.92
Believes manufactured cigarettes are more harmful than hand-rolled cigarettes (don't know)
3.74 0.47 4,085 376.2 2.55 0.13 2.81 4.67
Global Adult Tobacco Survey : Thailand Report, 2011 C-25
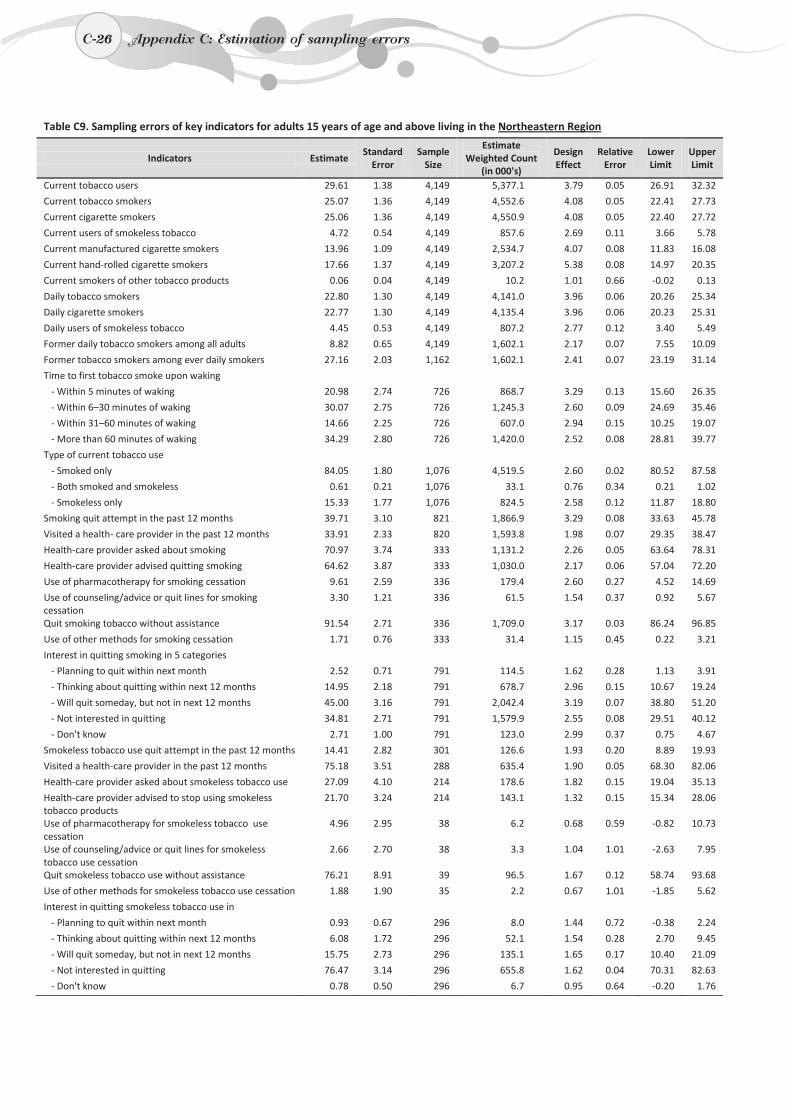
C-26
Table C9. Sampling errors of key indicators for adults 15 years of age and above living in the Northeastern Region
Indicators Estimate Standard
Error Sample
Size
Estimate Weighted Count
(in 000's)
Design Effect
Relative Error
Lower Limit
Upper Limit
Current tobacco users 29.61 1.38 4,149 5,377.1 3.79 0.05 26.91 32.32
Current tobacco smokers 25.07 1.36 4,149 4,552.6 4.08 0.05 22.41 27.73
Current cigarette smokers 25.06 1.36 4,149 4,550.9 4.08 0.05 22.40 27.72
Current users of smokeless tobacco 4.72 0.54 4,149 857.6 2.69 0.11 3.66 5.78
Current manufactured cigarette smokers 13.96 1.09 4,149 2,534.7 4.07 0.08 11.83 16.08
Current hand-rolled cigarette smokers 17.66 1.37 4,149 3,207.2 5.38 0.08 14.97 20.35
Current smokers of other tobacco products 0.06 0.04 4,149 10.2 1.01 0.66 -0.02 0.13
Daily tobacco smokers 22.80 1.30 4,149 4,141.0 3.96 0.06 20.26 25.34
Daily cigarette smokers 22.77 1.30 4,149 4,135.4 3.96 0.06 20.23 25.31
Daily users of smokeless tobacco 4.45 0.53 4,149 807.2 2.77 0.12 3.40 5.49
Former daily tobacco smokers among all adults 8.82 0.65 4,149 1,602.1 2.17 0.07 7.55 10.09
Former tobacco smokers among ever daily smokers 27.16 2.03 1,162 1,602.1 2.41 0.07 23.19 31.14
Time to first tobacco smoke upon waking - Within 5 minutes of waking 20.98 2.74 726 868.7 3.29 0.13 15.60 26.35
- Within 6–30 minutes of waking 30.07 2.75 726 1,245.3 2.60 0.09 24.69 35.46
- Within 31–60 minutes of waking 14.66 2.25 726 607.0 2.94 0.15 10.25 19.07
- More than 60 minutes of waking 34.29 2.80 726 1,420.0 2.52 0.08 28.81 39.77
Type of current tobacco use - Smoked only 84.05 1.80 1,076 4,519.5 2.60 0.02 80.52 87.58
- Both smoked and smokeless 0.61 0.21 1,076 33.1 0.76 0.34 0.21 1.02
- Smokeless only 15.33 1.77 1,076 824.5 2.58 0.12 11.87 18.80
Smoking quit attempt in the past 12 months 39.71 3.10 821 1,866.9 3.29 0.08 33.63 45.78
Visited a health- care provider in the past 12 months 33.91 2.33 820 1,593.8 1.98 0.07 29.35 38.47
Health-care provider asked about smoking 70.97 3.74 333 1,131.2 2.26 0.05 63.64 78.31
Health-care provider advised quitting smoking 64.62 3.87 333 1,030.0 2.17 0.06 57.04 72.20
Use of pharmacotherapy for smoking cessation 9.61 2.59 336 179.4 2.60 0.27 4.52 14.69
Use of counseling/advice or quit lines for smoking cessation
3.30 1.21 336 61.5 1.54 0.37 0.92 5.67
Quit smoking tobacco without assistance 91.54 2.71 336 1,709.0 3.17 0.03 86.24 96.85
Use of other methods for smoking cessation 1.71 0.76 333 31.4 1.15 0.45 0.22 3.21
Interest in quitting smoking in 5 categories - Planning to quit within next month 2.52 0.71 791 114.5 1.62 0.28 1.13 3.91
- Thinking about quitting within next 12 months 14.95 2.18 791 678.7 2.96 0.15 10.67 19.24
- Will quit someday, but not in next 12 months 45.00 3.16 791 2,042.4 3.19 0.07 38.80 51.20
- Not interested in quitting 34.81 2.71 791 1,579.9 2.55 0.08 29.51 40.12
- Don't know 2.71 1.00 791 123.0 2.99 0.37 0.75 4.67
Smokeless tobacco use quit attempt in the past 12 months 14.41 2.82 301 126.6 1.93 0.20 8.89 19.93
Visited a health-care provider in the past 12 months 75.18 3.51 288 635.4 1.90 0.05 68.30 82.06
Health-care provider asked about smokeless tobacco use 27.09 4.10 214 178.6 1.82 0.15 19.04 35.13
Health-care provider advised to stop using smokeless tobacco products
21.70 3.24 214 143.1 1.32 0.15 15.34 28.06
Use of pharmacotherapy for smokeless tobacco use cessation
4.96 2.95 38 6.2 0.68 0.59 -0.82 10.73
Use of counseling/advice or quit lines for smokeless tobacco use cessation
2.66 2.70 38 3.3 1.04 1.01 -2.63 7.95
Quit smokeless tobacco use without assistance 76.21 8.91 39 96.5 1.67 0.12 58.74 93.68
Use of other methods for smokeless tobacco use cessation 1.88 1.90 35 2.2 0.67 1.01 -1.85 5.62
Interest in quitting smokeless tobacco use in - Planning to quit within next month 0.93 0.67 296 8.0 1.44 0.72 -0.38 2.24
- Thinking about quitting within next 12 months 6.08 1.72 296 52.1 1.54 0.28 2.70 9.45
- Will quit someday, but not in next 12 months 15.75 2.73 296 135.1 1.65 0.17 10.40 21.09
- Not interested in quitting 76.47 3.14 296 655.8 1.62 0.04 70.31 82.63
- Don't know 0.78 0.50 296 6.7 0.95 0.64 -0.20 1.76
C-26 Appendix C: Estimation of sampling errors
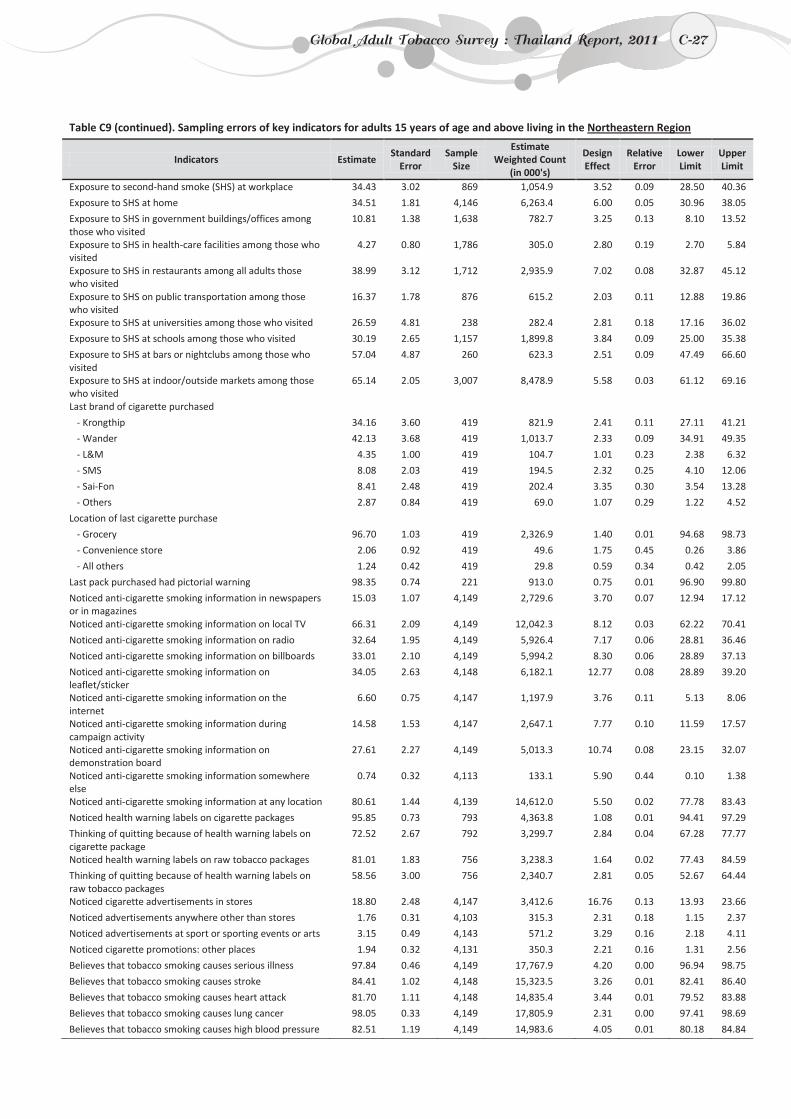
C-27
Table C9 (continued). Sampling errors of key indicators for adults 15 years of age and above living in the Northeastern Region
Indicators Estimate Standard
Error Sample
Size
Estimate Weighted Count
(in 000's)
Design Effect
Relative Error
Lower Limit
Upper Limit
Exposure to second-hand smoke (SHS) at workplace 34.43 3.02 869 1,054.9 3.52 0.09 28.50 40.36
Exposure to SHS at home 34.51 1.81 4,146 6,263.4 6.00 0.05 30.96 38.05
Exposure to SHS in government buildings/offices among those who visited
10.81 1.38 1,638 782.7 3.25 0.13 8.10 13.52
Exposure to SHS in health-care facilities among those who visited
4.27 0.80 1,786 305.0 2.80 0.19 2.70 5.84
Exposure to SHS in restaurants among all adults those who visited
38.99 3.12 1,712 2,935.9 7.02 0.08 32.87 45.12
Exposure to SHS on public transportation among those who visited
16.37 1.78 876 615.2 2.03 0.11 12.88 19.86
Exposure to SHS at universities among those who visited 26.59 4.81 238 282.4 2.81 0.18 17.16 36.02
Exposure to SHS at schools among those who visited 30.19 2.65 1,157 1,899.8 3.84 0.09 25.00 35.38
Exposure to SHS at bars or nightclubs among those who visited
57.04 4.87 260 623.3 2.51 0.09 47.49 66.60
Exposure to SHS at indoor/outside markets among those who visited
65.14 2.05 3,007 8,478.9 5.58 0.03 61.12 69.16
Last brand of cigarette purchased - Krongthip 34.16 3.60 419 821.9 2.41 0.11 27.11 41.21
- Wander 42.13 3.68 419 1,013.7 2.33 0.09 34.91 49.35
- L&M 4.35 1.00 419 104.7 1.01 0.23 2.38 6.32
- SMS 8.08 2.03 419 194.5 2.32 0.25 4.10 12.06
- Sai-Fon 8.41 2.48 419 202.4 3.35 0.30 3.54 13.28
- Others 2.87 0.84 419 69.0 1.07 0.29 1.22 4.52
Location of last cigarette purchase - Grocery 96.70 1.03 419 2,326.9 1.40 0.01 94.68 98.73
- Convenience store 2.06 0.92 419 49.6 1.75 0.45 0.26 3.86
- All others 1.24 0.42 419 29.8 0.59 0.34 0.42 2.05
Last pack purchased had pictorial warning 98.35 0.74 221 913.0 0.75 0.01 96.90 99.80
Noticed anti-cigarette smoking information in newspapers or in magazines
15.03 1.07 4,149 2,729.6 3.70 0.07 12.94 17.12
Noticed anti-cigarette smoking information on local TV 66.31 2.09 4,149 12,042.3 8.12 0.03 62.22 70.41
Noticed anti-cigarette smoking information on radio 32.64 1.95 4,149 5,926.4 7.17 0.06 28.81 36.46
Noticed anti-cigarette smoking information on billboards 33.01 2.10 4,149 5,994.2 8.30 0.06 28.89 37.13
Noticed anti-cigarette smoking information on leaflet/sticker
34.05 2.63 4,148 6,182.1 12.77 0.08 28.89 39.20
Noticed anti-cigarette smoking information on the internet
6.60 0.75 4,147 1,197.9 3.76 0.11 5.13 8.06
Noticed anti-cigarette smoking information during campaign activity
14.58 1.53 4,147 2,647.1 7.77 0.10 11.59 17.57
Noticed anti-cigarette smoking information on demonstration board
27.61 2.27 4,149 5,013.3 10.74 0.08 23.15 32.07
Noticed anti-cigarette smoking information somewhere else
0.74 0.32 4,113 133.1 5.90 0.44 0.10 1.38
Noticed anti-cigarette smoking information at any location 80.61 1.44 4,139 14,612.0 5.50 0.02 77.78 83.43
Noticed health warning labels on cigarette packages 95.85 0.73 793 4,363.8 1.08 0.01 94.41 97.29
Thinking of quitting because of health warning labels on cigarette package
72.52 2.67 792 3,299.7 2.84 0.04 67.28 77.77
Noticed health warning labels on raw tobacco packages 81.01 1.83 756 3,238.3 1.64 0.02 77.43 84.59
Thinking of quitting because of health warning labels on raw tobacco packages
58.56 3.00 756 2,340.7 2.81 0.05 52.67 64.44
Noticed cigarette advertisements in stores 18.80 2.48 4,147 3,412.6 16.76 0.13 13.93 23.66
Noticed advertisements anywhere other than stores 1.76 0.31 4,103 315.3 2.31 0.18 1.15 2.37
Noticed advertisements at sport or sporting events or arts 3.15 0.49 4,143 571.2 3.29 0.16 2.18 4.11
Noticed cigarette promotions: other places 1.94 0.32 4,131 350.3 2.21 0.16 1.31 2.56
Believes that tobacco smoking causes serious illness 97.84 0.46 4,149 17,767.9 4.20 0.00 96.94 98.75
Believes that tobacco smoking causes stroke 84.41 1.02 4,148 15,323.5 3.26 0.01 82.41 86.40
Believes that tobacco smoking causes heart attack 81.70 1.11 4,148 14,835.4 3.44 0.01 79.52 83.88
Believes that tobacco smoking causes lung cancer 98.05 0.33 4,149 17,805.9 2.31 0.00 97.41 98.69
Believes that tobacco smoking causes high blood pressure 82.51 1.19 4,149 14,983.6 4.05 0.01 80.18 84.84
Global Adult Tobacco Survey : Thailand Report, 2011 C-27
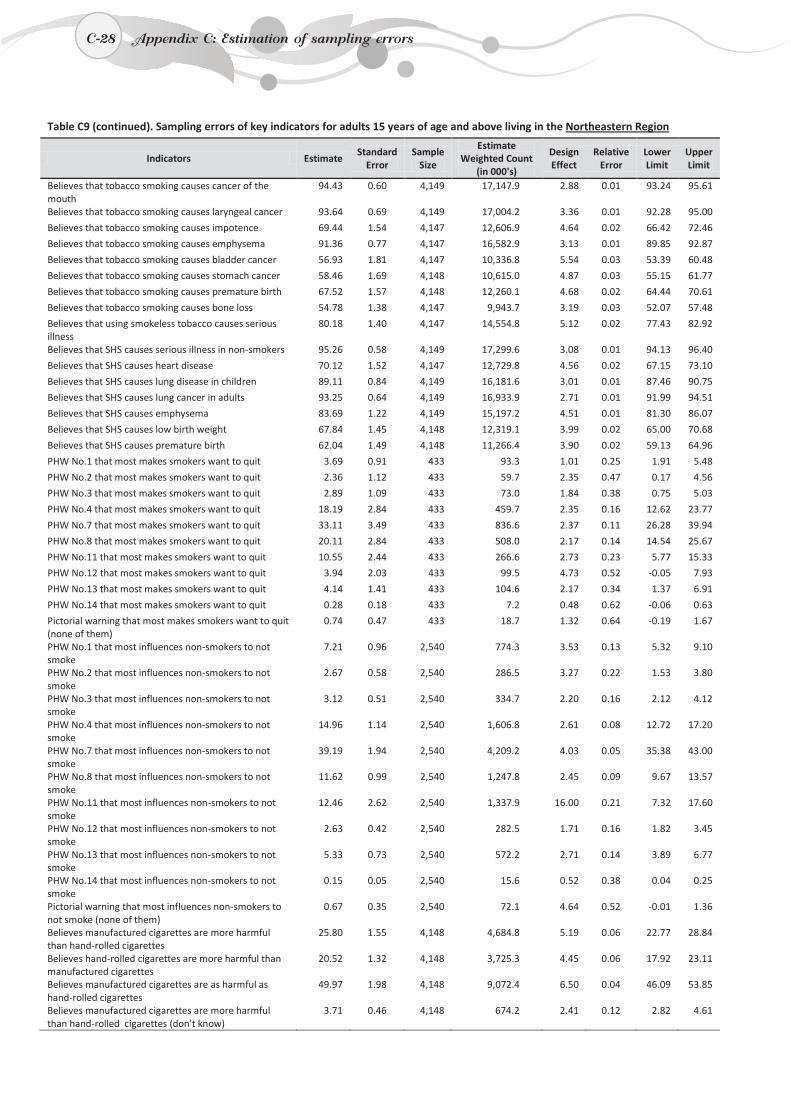
C-28
Table C9 (continued). Sampling errors of key indicators for adults 15 years of age and above living in the Northeastern Region
Indicators Estimate Standard
Error Sample
Size
Estimate Weighted Count
(in 000's)
Design Effect
Relative Error
Lower Limit
Upper Limit
Believes that tobacco smoking causes cancer of the mouth
94.43 0.60 4,149 17,147.9 2.88 0.01 93.24 95.61
Believes that tobacco smoking causes laryngeal cancer 93.64 0.69 4,149 17,004.2 3.36 0.01 92.28 95.00
Believes that tobacco smoking causes impotence 69.44 1.54 4,147 12,606.9 4.64 0.02 66.42 72.46
Believes that tobacco smoking causes emphysema 91.36 0.77 4,147 16,582.9 3.13 0.01 89.85 92.87
Believes that tobacco smoking causes bladder cancer 56.93 1.81 4,147 10,336.8 5.54 0.03 53.39 60.48
Believes that tobacco smoking causes stomach cancer 58.46 1.69 4,148 10,615.0 4.87 0.03 55.15 61.77
Believes that tobacco smoking causes premature birth 67.52 1.57 4,148 12,260.1 4.68 0.02 64.44 70.61
Believes that tobacco smoking causes bone loss 54.78 1.38 4,147 9,943.7 3.19 0.03 52.07 57.48
Believes that using smokeless tobacco causes serious illness
80.18 1.40 4,147 14,554.8 5.12 0.02 77.43 82.92
Believes that SHS causes serious illness in non-smokers 95.26 0.58 4,149 17,299.6 3.08 0.01 94.13 96.40
Believes that SHS causes heart disease 70.12 1.52 4,147 12,729.8 4.56 0.02 67.15 73.10
Believes that SHS causes lung disease in children 89.11 0.84 4,149 16,181.6 3.01 0.01 87.46 90.75
Believes that SHS causes lung cancer in adults 93.25 0.64 4,149 16,933.9 2.71 0.01 91.99 94.51
Believes that SHS causes emphysema 83.69 1.22 4,149 15,197.2 4.51 0.01 81.30 86.07
Believes that SHS causes low birth weight 67.84 1.45 4,148 12,319.1 3.99 0.02 65.00 70.68
Believes that SHS causes premature birth 62.04 1.49 4,148 11,266.4 3.90 0.02 59.13 64.96
PHW No.1 that most makes smokers want to quit 3.69 0.91 433 93.3 1.01 0.25 1.91 5.48
PHW No.2 that most makes smokers want to quit 2.36 1.12 433 59.7 2.35 0.47 0.17 4.56
PHW No.3 that most makes smokers want to quit 2.89 1.09 433 73.0 1.84 0.38 0.75 5.03
PHW No.4 that most makes smokers want to quit 18.19 2.84 433 459.7 2.35 0.16 12.62 23.77
PHW No.7 that most makes smokers want to quit 33.11 3.49 433 836.6 2.37 0.11 26.28 39.94
PHW No.8 that most makes smokers want to quit 20.11 2.84 433 508.0 2.17 0.14 14.54 25.67
PHW No.11 that most makes smokers want to quit 10.55 2.44 433 266.6 2.73 0.23 5.77 15.33
PHW No.12 that most makes smokers want to quit 3.94 2.03 433 99.5 4.73 0.52 -0.05 7.93
PHW No.13 that most makes smokers want to quit 4.14 1.41 433 104.6 2.17 0.34 1.37 6.91
PHW No.14 that most makes smokers want to quit 0.28 0.18 433 7.2 0.48 0.62 -0.06 0.63
Pictorial warning that most makes smokers want to quit (none of them)
0.74 0.47 433 18.7 1.32 0.64 -0.19 1.67
PHW No.1 that most influences non-smokers to not smoke
7.21 0.96 2,540 774.3 3.53 0.13 5.32 9.10
PHW No.2 that most influences non-smokers to not smoke
2.67 0.58 2,540 286.5 3.27 0.22 1.53 3.80
PHW No.3 that most influences non-smokers to not smoke
3.12 0.51 2,540 334.7 2.20 0.16 2.12 4.12
PHW No.4 that most influences non-smokers to not smoke
14.96 1.14 2,540 1,606.8 2.61 0.08 12.72 17.20
PHW No.7 that most influences non-smokers to not smoke
39.19 1.94 2,540 4,209.2 4.03 0.05 35.38 43.00
PHW No.8 that most influences non-smokers to not smoke
11.62 0.99 2,540 1,247.8 2.45 0.09 9.67 13.57
PHW No.11 that most influences non-smokers to not smoke
12.46 2.62 2,540 1,337.9 16.00 0.21 7.32 17.60
PHW No.12 that most influences non-smokers to not smoke
2.63 0.42 2,540 282.5 1.71 0.16 1.82 3.45
PHW No.13 that most influences non-smokers to not smoke
5.33 0.73 2,540 572.2 2.71 0.14 3.89 6.77
PHW No.14 that most influences non-smokers to not smoke
0.15 0.05 2,540 15.6 0.52 0.38 0.04 0.25
Pictorial warning that most influences non-smokers to not smoke (none of them)
0.67 0.35 2,540 72.1 4.64 0.52 -0.01 1.36
Believes manufactured cigarettes are more harmful than hand-rolled cigarettes
25.80 1.55 4,148 4,684.8 5.19 0.06 22.77 28.84
Believes hand-rolled cigarettes are more harmful than manufactured cigarettes
20.52 1.32 4,148 3,725.3 4.45 0.06 17.92 23.11
Believes manufactured cigarettes are as harmful as hand-rolled cigarettes
49.97 1.98 4,148 9,072.4 6.50 0.04 46.09 53.85
Believes manufactured cigarettes are more harmful than hand-rolled cigarettes (don't know)
3.71 0.46 4,148 674.2 2.41 0.12 2.82 4.61
C-28 Appendix C: Estimation of sampling errors
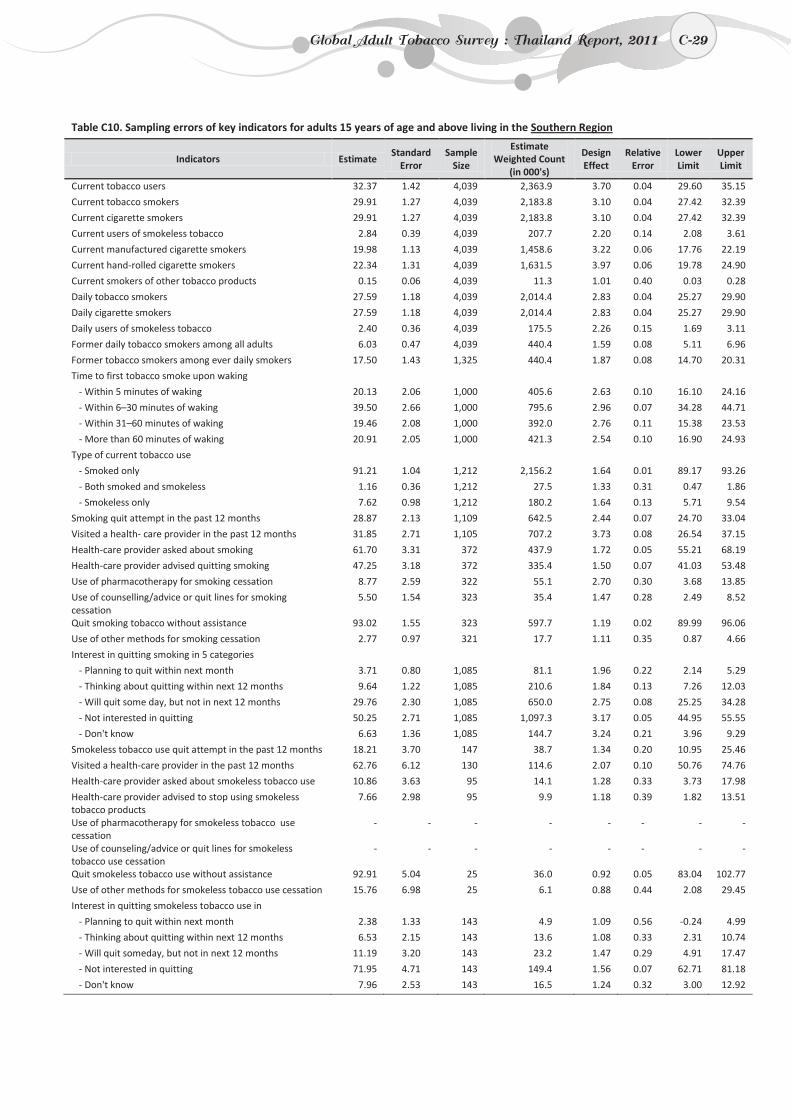
C-29
Table C10. Sampling errors of key indicators for adults 15 years of age and above living in the Southern Region
Indicators Estimate Standard
Error Sample
Size
Estimate Weighted Count
(in 000's)
Design Effect
Relative Error
Lower Limit
Upper Limit
Current tobacco users 32.37 1.42 4,039 2,363.9 3.70 0.04 29.60 35.15
Current tobacco smokers 29.91 1.27 4,039 2,183.8 3.10 0.04 27.42 32.39
Current cigarette smokers 29.91 1.27 4,039 2,183.8 3.10 0.04 27.42 32.39
Current users of smokeless tobacco 2.84 0.39 4,039 207.7 2.20 0.14 2.08 3.61
Current manufactured cigarette smokers 19.98 1.13 4,039 1,458.6 3.22 0.06 17.76 22.19
Current hand-rolled cigarette smokers 22.34 1.31 4,039 1,631.5 3.97 0.06 19.78 24.90
Current smokers of other tobacco products 0.15 0.06 4,039 11.3 1.01 0.40 0.03 0.28
Daily tobacco smokers 27.59 1.18 4,039 2,014.4 2.83 0.04 25.27 29.90
Daily cigarette smokers 27.59 1.18 4,039 2,014.4 2.83 0.04 25.27 29.90
Daily users of smokeless tobacco 2.40 0.36 4,039 175.5 2.26 0.15 1.69 3.11
Former daily tobacco smokers among all adults 6.03 0.47 4,039 440.4 1.59 0.08 5.11 6.96
Former tobacco smokers among ever daily smokers 17.50 1.43 1,325 440.4 1.87 0.08 14.70 20.31
Time to first tobacco smoke upon waking - Within 5 minutes of waking 20.13 2.06 1,000 405.6 2.63 0.10 16.10 24.16
- Within 6–30 minutes of waking 39.50 2.66 1,000 795.6 2.96 0.07 34.28 44.71
- Within 31–60 minutes of waking 19.46 2.08 1,000 392.0 2.76 0.11 15.38 23.53
- More than 60 minutes of waking 20.91 2.05 1,000 421.3 2.54 0.10 16.90 24.93
Type of current tobacco use - Smoked only 91.21 1.04 1,212 2,156.2 1.64 0.01 89.17 93.26
- Both smoked and smokeless 1.16 0.36 1,212 27.5 1.33 0.31 0.47 1.86
- Smokeless only 7.62 0.98 1,212 180.2 1.64 0.13 5.71 9.54
Smoking quit attempt in the past 12 months 28.87 2.13 1,109 642.5 2.44 0.07 24.70 33.04
Visited a health- care provider in the past 12 months 31.85 2.71 1,105 707.2 3.73 0.08 26.54 37.15
Health-care provider asked about smoking 61.70 3.31 372 437.9 1.72 0.05 55.21 68.19
Health-care provider advised quitting smoking 47.25 3.18 372 335.4 1.50 0.07 41.03 53.48
Use of pharmacotherapy for smoking cessation 8.77 2.59 322 55.1 2.70 0.30 3.68 13.85
Use of counselling/advice or quit lines for smoking cessation
5.50 1.54 323 35.4 1.47 0.28 2.49 8.52
Quit smoking tobacco without assistance 93.02 1.55 323 597.7 1.19 0.02 89.99 96.06
Use of other methods for smoking cessation 2.77 0.97 321 17.7 1.11 0.35 0.87 4.66
Interest in quitting smoking in 5 categories - Planning to quit within next month 3.71 0.80 1,085 81.1 1.96 0.22 2.14 5.29
- Thinking about quitting within next 12 months 9.64 1.22 1,085 210.6 1.84 0.13 7.26 12.03
- Will quit some day, but not in next 12 months 29.76 2.30 1,085 650.0 2.75 0.08 25.25 34.28
- Not interested in quitting 50.25 2.71 1,085 1,097.3 3.17 0.05 44.95 55.55
- Don't know 6.63 1.36 1,085 144.7 3.24 0.21 3.96 9.29
Smokeless tobacco use quit attempt in the past 12 months 18.21 3.70 147 38.7 1.34 0.20 10.95 25.46
Visited a health-care provider in the past 12 months 62.76 6.12 130 114.6 2.07 0.10 50.76 74.76
Health-care provider asked about smokeless tobacco use 10.86 3.63 95 14.1 1.28 0.33 3.73 17.98
Health-care provider advised to stop using smokeless tobacco products
7.66 2.98 95 9.9 1.18 0.39 1.82 13.51
Use of pharmacotherapy for smokeless tobacco use cessation
- - - - - - - -
Use of counseling/advice or quit lines for smokeless tobacco use cessation
- - - - - - - -
Quit smokeless tobacco use without assistance 92.91 5.04 25 36.0 0.92 0.05 83.04 102.77
Use of other methods for smokeless tobacco use cessation 15.76 6.98 25 6.1 0.88 0.44 2.08 29.45
Interest in quitting smokeless tobacco use in - Planning to quit within next month 2.38 1.33 143 4.9 1.09 0.56 -0.24 4.99
- Thinking about quitting within next 12 months 6.53 2.15 143 13.6 1.08 0.33 2.31 10.74
- Will quit someday, but not in next 12 months 11.19 3.20 143 23.2 1.47 0.29 4.91 17.47
- Not interested in quitting 71.95 4.71 143 149.4 1.56 0.07 62.71 81.18
- Don't know 7.96 2.53 143 16.5 1.24 0.32 3.00 12.92
Global Adult Tobacco Survey : Thailand Report, 2011 C-29
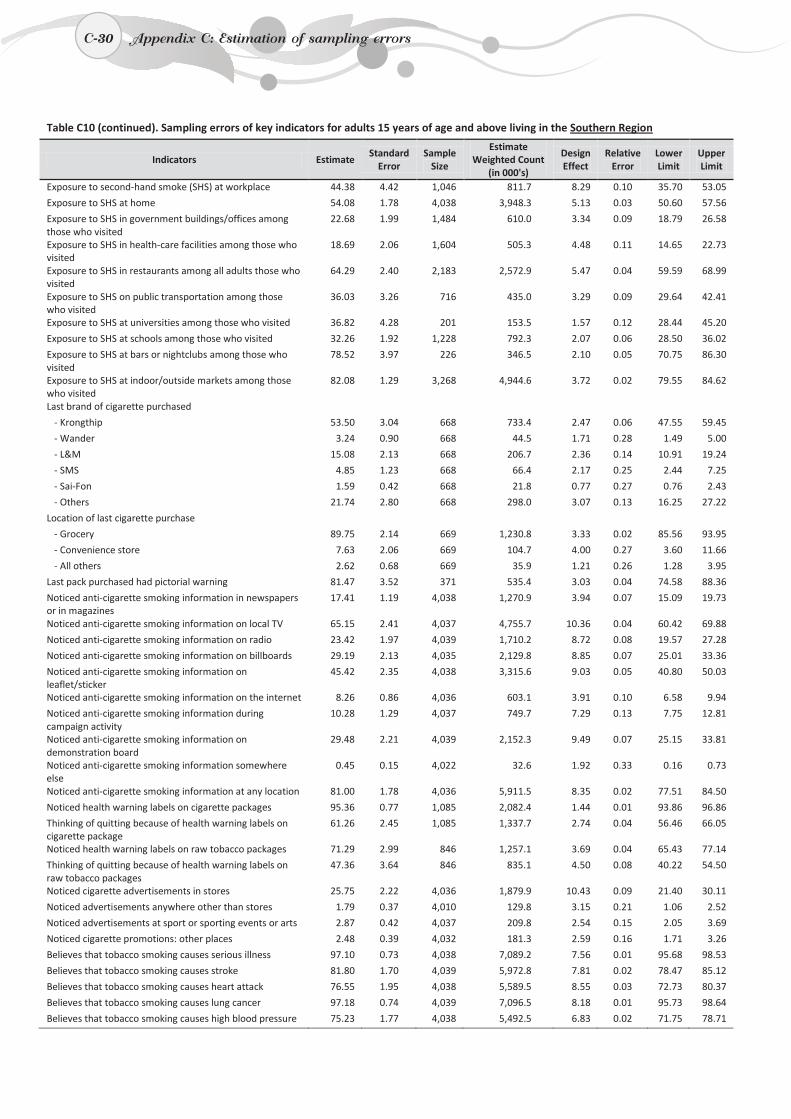
C-30
Table C10 (continued). Sampling errors of key indicators for adults 15 years of age and above living in the Southern Region
Indicators Estimate Standard
Error Sample
Size
Estimate Weighted Count
(in 000's)
Design Effect
Relative Error
Lower Limit
Upper Limit
Exposure to second-hand smoke (SHS) at workplace 44.38 4.42 1,046 811.7 8.29 0.10 35.70 53.05
Exposure to SHS at home 54.08 1.78 4,038 3,948.3 5.13 0.03 50.60 57.56
Exposure to SHS in government buildings/offices among those who visited
22.68 1.99 1,484 610.0 3.34 0.09 18.79 26.58
Exposure to SHS in health-care facilities among those who visited
18.69 2.06 1,604 505.3 4.48 0.11 14.65 22.73
Exposure to SHS in restaurants among all adults those who visited
64.29 2.40 2,183 2,572.9 5.47 0.04 59.59 68.99
Exposure to SHS on public transportation among those who visited
36.03 3.26 716 435.0 3.29 0.09 29.64 42.41
Exposure to SHS at universities among those who visited 36.82 4.28 201 153.5 1.57 0.12 28.44 45.20
Exposure to SHS at schools among those who visited 32.26 1.92 1,228 792.3 2.07 0.06 28.50 36.02
Exposure to SHS at bars or nightclubs among those who visited
78.52 3.97 226 346.5 2.10 0.05 70.75 86.30
Exposure to SHS at indoor/outside markets among those who visited
82.08 1.29 3,268 4,944.6 3.72 0.02 79.55 84.62
Last brand of cigarette purchased - Krongthip 53.50 3.04 668 733.4 2.47 0.06 47.55 59.45
- Wander 3.24 0.90 668 44.5 1.71 0.28 1.49 5.00
- L&M 15.08 2.13 668 206.7 2.36 0.14 10.91 19.24
- SMS 4.85 1.23 668 66.4 2.17 0.25 2.44 7.25
- Sai-Fon 1.59 0.42 668 21.8 0.77 0.27 0.76 2.43
- Others 21.74 2.80 668 298.0 3.07 0.13 16.25 27.22
Location of last cigarette purchase - Grocery 89.75 2.14 669 1,230.8 3.33 0.02 85.56 93.95
- Convenience store 7.63 2.06 669 104.7 4.00 0.27 3.60 11.66
- All others 2.62 0.68 669 35.9 1.21 0.26 1.28 3.95
Last pack purchased had pictorial warning 81.47 3.52 371 535.4 3.03 0.04 74.58 88.36
Noticed anti-cigarette smoking information in newspapers or in magazines
17.41 1.19 4,038 1,270.9 3.94 0.07 15.09 19.73
Noticed anti-cigarette smoking information on local TV 65.15 2.41 4,037 4,755.7 10.36 0.04 60.42 69.88
Noticed anti-cigarette smoking information on radio 23.42 1.97 4,039 1,710.2 8.72 0.08 19.57 27.28
Noticed anti-cigarette smoking information on billboards 29.19 2.13 4,035 2,129.8 8.85 0.07 25.01 33.36
Noticed anti-cigarette smoking information on leaflet/sticker
45.42 2.35 4,038 3,315.6 9.03 0.05 40.80 50.03
Noticed anti-cigarette smoking information on the internet 8.26 0.86 4,036 603.1 3.91 0.10 6.58 9.94
Noticed anti-cigarette smoking information during campaign activity
10.28 1.29 4,037 749.7 7.29 0.13 7.75 12.81
Noticed anti-cigarette smoking information on demonstration board
29.48 2.21 4,039 2,152.3 9.49 0.07 25.15 33.81
Noticed anti-cigarette smoking information somewhere else
0.45 0.15 4,022 32.6 1.92 0.33 0.16 0.73
Noticed anti-cigarette smoking information at any location 81.00 1.78 4,036 5,911.5 8.35 0.02 77.51 84.50
Noticed health warning labels on cigarette packages 95.36 0.77 1,085 2,082.4 1.44 0.01 93.86 96.86
Thinking of quitting because of health warning labels on cigarette package
61.26 2.45 1,085 1,337.7 2.74 0.04 56.46 66.05
Noticed health warning labels on raw tobacco packages 71.29 2.99 846 1,257.1 3.69 0.04 65.43 77.14
Thinking of quitting because of health warning labels on raw tobacco packages
47.36 3.64 846 835.1 4.50 0.08 40.22 54.50
Noticed cigarette advertisements in stores 25.75 2.22 4,036 1,879.9 10.43 0.09 21.40 30.11
Noticed advertisements anywhere other than stores 1.79 0.37 4,010 129.8 3.15 0.21 1.06 2.52
Noticed advertisements at sport or sporting events or arts 2.87 0.42 4,037 209.8 2.54 0.15 2.05 3.69
Noticed cigarette promotions: other places 2.48 0.39 4,032 181.3 2.59 0.16 1.71 3.26
Believes that tobacco smoking causes serious illness 97.10 0.73 4,038 7,089.2 7.56 0.01 95.68 98.53
Believes that tobacco smoking causes stroke 81.80 1.70 4,039 5,972.8 7.81 0.02 78.47 85.12
Believes that tobacco smoking causes heart attack 76.55 1.95 4,038 5,589.5 8.55 0.03 72.73 80.37
Believes that tobacco smoking causes lung cancer 97.18 0.74 4,039 7,096.5 8.18 0.01 95.73 98.64
Believes that tobacco smoking causes high blood pressure 75.23 1.77 4,038 5,492.5 6.83 0.02 71.75 78.71
C-30 Appendix C: Estimation of sampling errors
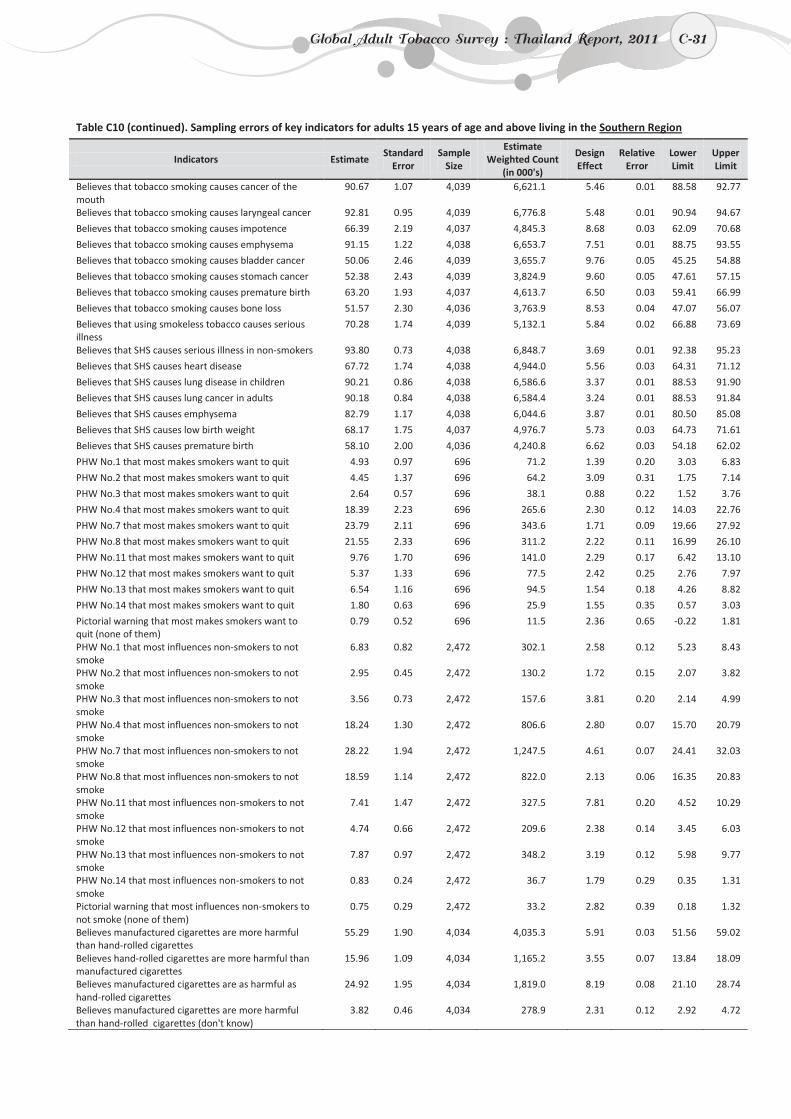
C-31
Table C10 (continued). Sampling errors of key indicators for adults 15 years of age and above living in the Southern Region
Indicators Estimate Standard
Error Sample
Size
Estimate Weighted Count
(in 000's)
Design Effect
Relative Error
Lower Limit
Upper Limit
Believes that tobacco smoking causes cancer of the mouth
90.67 1.07 4,039 6,621.1 5.46 0.01 88.58 92.77
Believes that tobacco smoking causes laryngeal cancer 92.81 0.95 4,039 6,776.8 5.48 0.01 90.94 94.67
Believes that tobacco smoking causes impotence 66.39 2.19 4,037 4,845.3 8.68 0.03 62.09 70.68
Believes that tobacco smoking causes emphysema 91.15 1.22 4,038 6,653.7 7.51 0.01 88.75 93.55
Believes that tobacco smoking causes bladder cancer 50.06 2.46 4,039 3,655.7 9.76 0.05 45.25 54.88
Believes that tobacco smoking causes stomach cancer 52.38 2.43 4,039 3,824.9 9.60 0.05 47.61 57.15
Believes that tobacco smoking causes premature birth 63.20 1.93 4,037 4,613.7 6.50 0.03 59.41 66.99
Believes that tobacco smoking causes bone loss 51.57 2.30 4,036 3,763.9 8.53 0.04 47.07 56.07
Believes that using smokeless tobacco causes serious illness
70.28 1.74 4,039 5,132.1 5.84 0.02 66.88 73.69
Believes that SHS causes serious illness in non-smokers 93.80 0.73 4,038 6,848.7 3.69 0.01 92.38 95.23
Believes that SHS causes heart disease 67.72 1.74 4,038 4,944.0 5.56 0.03 64.31 71.12
Believes that SHS causes lung disease in children 90.21 0.86 4,038 6,586.6 3.37 0.01 88.53 91.90
Believes that SHS causes lung cancer in adults 90.18 0.84 4,038 6,584.4 3.24 0.01 88.53 91.84
Believes that SHS causes emphysema 82.79 1.17 4,038 6,044.6 3.87 0.01 80.50 85.08
Believes that SHS causes low birth weight 68.17 1.75 4,037 4,976.7 5.73 0.03 64.73 71.61
Believes that SHS causes premature birth 58.10 2.00 4,036 4,240.8 6.62 0.03 54.18 62.02
PHW No.1 that most makes smokers want to quit 4.93 0.97 696 71.2 1.39 0.20 3.03 6.83
PHW No.2 that most makes smokers want to quit 4.45 1.37 696 64.2 3.09 0.31 1.75 7.14
PHW No.3 that most makes smokers want to quit 2.64 0.57 696 38.1 0.88 0.22 1.52 3.76
PHW No.4 that most makes smokers want to quit 18.39 2.23 696 265.6 2.30 0.12 14.03 22.76
PHW No.7 that most makes smokers want to quit 23.79 2.11 696 343.6 1.71 0.09 19.66 27.92
PHW No.8 that most makes smokers want to quit 21.55 2.33 696 311.2 2.22 0.11 16.99 26.10
PHW No.11 that most makes smokers want to quit 9.76 1.70 696 141.0 2.29 0.17 6.42 13.10
PHW No.12 that most makes smokers want to quit 5.37 1.33 696 77.5 2.42 0.25 2.76 7.97
PHW No.13 that most makes smokers want to quit 6.54 1.16 696 94.5 1.54 0.18 4.26 8.82
PHW No.14 that most makes smokers want to quit 1.80 0.63 696 25.9 1.55 0.35 0.57 3.03
Pictorial warning that most makes smokers want to quit (none of them)
0.79 0.52 696 11.5 2.36 0.65 -0.22 1.81
PHW No.1 that most influences non-smokers to not smoke
6.83 0.82 2,472 302.1 2.58 0.12 5.23 8.43
PHW No.2 that most influences non-smokers to not smoke
2.95 0.45 2,472 130.2 1.72 0.15 2.07 3.82
PHW No.3 that most influences non-smokers to not smoke
3.56 0.73 2,472 157.6 3.81 0.20 2.14 4.99
PHW No.4 that most influences non-smokers to not smoke
18.24 1.30 2,472 806.6 2.80 0.07 15.70 20.79
PHW No.7 that most influences non-smokers to not smoke
28.22 1.94 2,472 1,247.5 4.61 0.07 24.41 32.03
PHW No.8 that most influences non-smokers to not smoke
18.59 1.14 2,472 822.0 2.13 0.06 16.35 20.83
PHW No.11 that most influences non-smokers to not smoke
7.41 1.47 2,472 327.5 7.81 0.20 4.52 10.29
PHW No.12 that most influences non-smokers to not smoke
4.74 0.66 2,472 209.6 2.38 0.14 3.45 6.03
PHW No.13 that most influences non-smokers to not smoke
7.87 0.97 2,472 348.2 3.19 0.12 5.98 9.77
PHW No.14 that most influences non-smokers to not smoke
0.83 0.24 2,472 36.7 1.79 0.29 0.35 1.31
Pictorial warning that most influences non-smokers to not smoke (none of them)
0.75 0.29 2,472 33.2 2.82 0.39 0.18 1.32
Believes manufactured cigarettes are more harmful than hand-rolled cigarettes
55.29 1.90 4,034 4,035.3 5.91 0.03 51.56 59.02
Believes hand-rolled cigarettes are more harmful than manufactured cigarettes
15.96 1.09 4,034 1,165.2 3.55 0.07 13.84 18.09
Believes manufactured cigarettes are as harmful as hand-rolled cigarettes
24.92 1.95 4,034 1,819.0 8.19 0.08 21.10 28.74
Believes manufactured cigarettes are more harmful than hand-rolled cigarettes (don't know)
3.82 0.46 4,034 278.9 2.31 0.12 2.92 4.72
Global Adult Tobacco Survey : Thailand Report, 2011 C-31
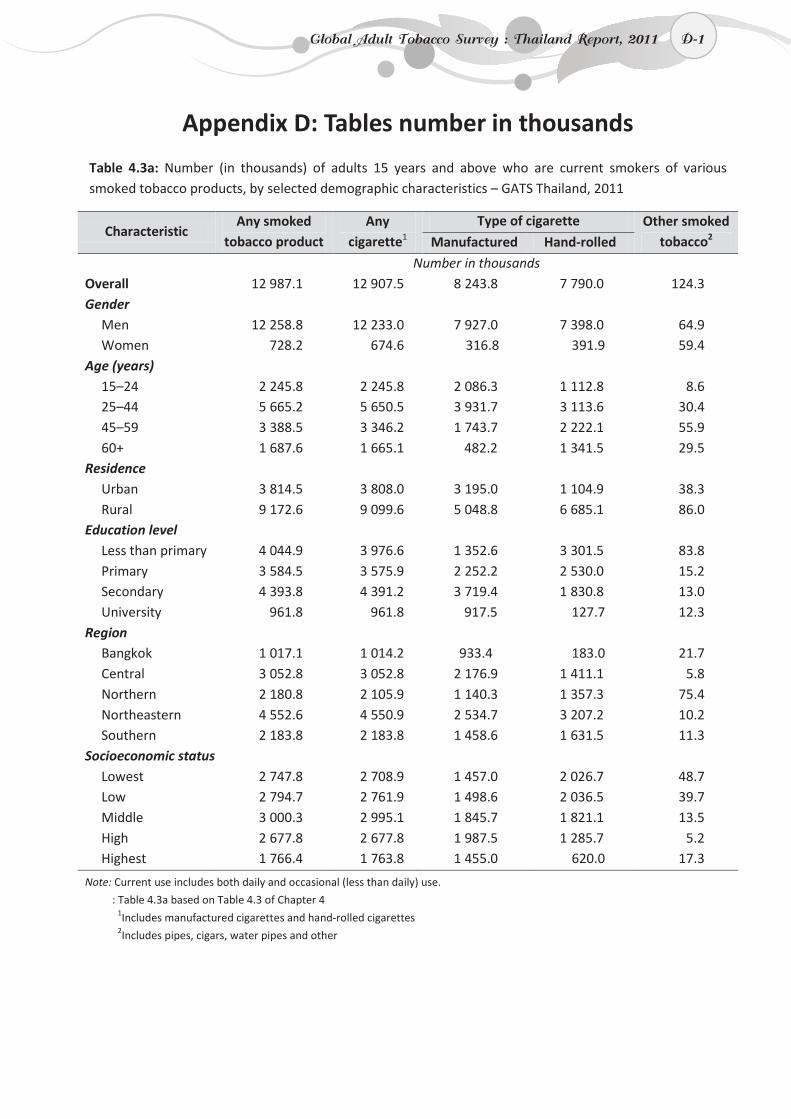
D-1
Appendix D: Tables number in thousands
Table 4.3a: Number (in thousands) of adults 15 years and above who are current smokers of various smoked tobacco products, by selected demographic characteristics – GATS Thailand, 2011
Characteristic Any smoked
tobacco product Any
cigarette1 Type of cigarette Other smoked
tobacco2 Manufactured Hand-rolled
Number in thousands Overall 12 987.1 12 907.5 8 243.8 7 790.0 124.3 Gender
Men 12 258.8 12 233.0 7 927.0 7 398.0 64.9 Women 728.2 674.6 316.8 391.9 59.4
Age (years) 15–24 2 245.8 2 245.8 2 086.3 1 112.8 8.6 25–44 5 665.2 5 650.5 3 931.7 3 113.6 30.4 45–59 3 388.5 3 346.2 1 743.7 2 222.1 55.9 60+ 1 687.6 1 665.1 482.2 1 341.5 29.5
Residence Urban 3 814.5 3 808.0 3 195.0 1 104.9 38.3 Rural 9 172.6 9 099.6 5 048.8 6 685.1 86.0
Education level Less than primary 4 044.9 3 976.6 1 352.6 3 301.5 83.8 Primary 3 584.5 3 575.9 2 252.2 2 530.0 15.2 Secondary 4 393.8 4 391.2 3 719.4 1 830.8 13.0 University 961.8 961.8 917.5 127.7 12.3
Region Bangkok 1 017.1 1 014.2 933.4 183.0 21.7 Central 3 052.8 3 052.8 2 176.9 1 411.1 5.8 Northern 2 180.8 2 105.9 1 140.3 1 357.3 75.4 Northeastern 4 552.6 4 550.9 2 534.7 3 207.2 10.2 Southern 2 183.8 2 183.8 1 458.6 1 631.5 11.3
Socioeconomic status Lowest 2 747.8 2 708.9 1 457.0 2 026.7 48.7 Low 2 794.7 2 761.9 1 498.6 2 036.5 39.7 Middle 3 000.3 2 995.1 1 845.7 1 821.1 13.5 High 2 677.8 2 677.8 1 987.5 1 285.7 5.2 Highest 1 766.4 1 763.8 1 455.0 620.0 17.3
Note: Current use includes both daily and occasional (less than daily) use.
: Table 4.3a based on Table 4.3 of Chapter 4 1Includes manufactured cigarettes and hand-rolled cigarettes 2Includes pipes, cigars, water pipes and other
Global Adult Tobacco Survey : Thailand Report, 2011 D-1
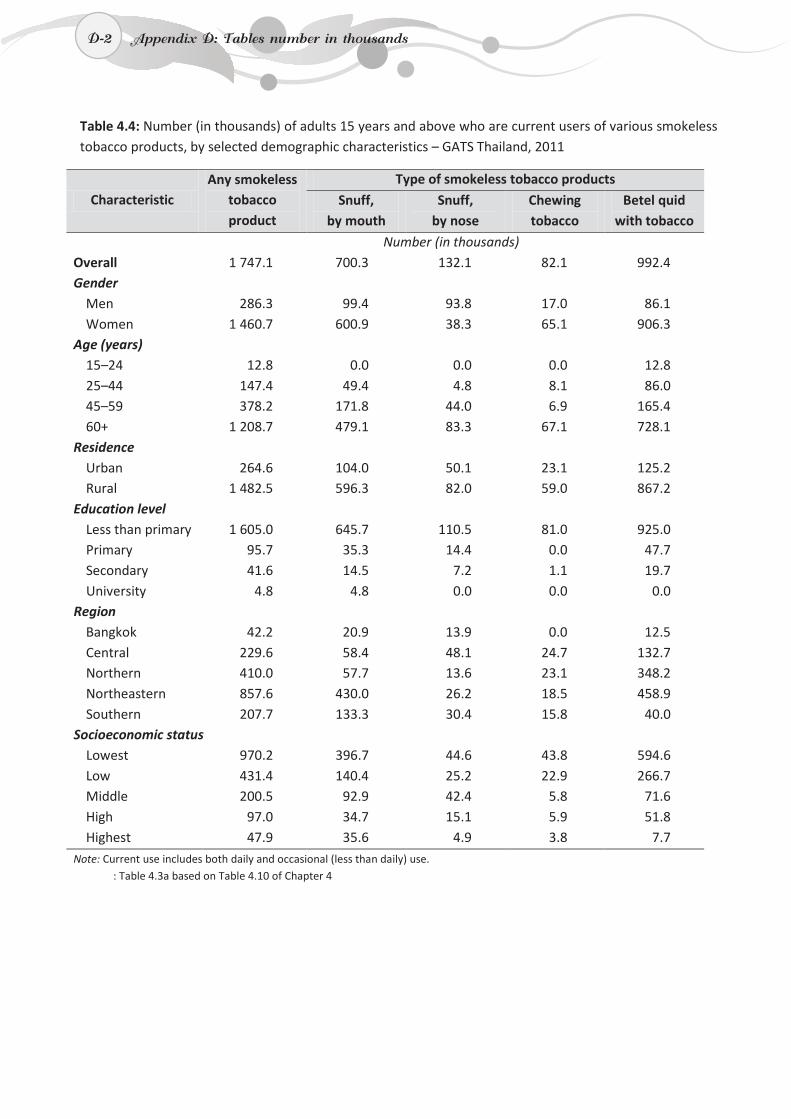
D-2
Table 4.4: Number (in thousands) of adults 15 years and above who are current users of various smokeless tobacco products, by selected demographic characteristics – GATS Thailand, 2011
Characteristic Any smokeless
tobacco product
Type of smokeless tobacco products
Snuff, by mouth
Snuff, by nose
Chewing tobacco
Betel quid with tobacco
Number (in thousands) Overall 1 747.1 700.3 132.1 82.1 992.4 Gender
Men 286.3 99.4 93.8 17.0 86.1 Women 1 460.7 600.9 38.3 65.1 906.3
Age (years) 15–24 12.8 0.0 0.0 0.0 12.8 25–44 147.4 49.4 4.8 8.1 86.0 45–59 378.2 171.8 44.0 6.9 165.4 60+ 1 208.7 479.1 83.3 67.1 728.1
Residence Urban 264.6 104.0 50.1 23.1 125.2 Rural 1 482.5 596.3 82.0 59.0 867.2
Education level Less than primary 1 605.0 645.7 110.5 81.0 925.0 Primary 95.7 35.3 14.4 0.0 47.7 Secondary 41.6 14.5 7.2 1.1 19.7 University 4.8 4.8 0.0 0.0 0.0
Region Bangkok 42.2 20.9 13.9 0.0 12.5 Central 229.6 58.4 48.1 24.7 132.7 Northern 410.0 57.7 13.6 23.1 348.2 Northeastern 857.6 430.0 26.2 18.5 458.9 Southern 207.7 133.3 30.4 15.8 40.0
Socioeconomic status Lowest 970.2 396.7 44.6 43.8 594.6 Low 431.4 140.4 25.2 22.9 266.7 Middle 200.5 92.9 42.4 5.8 71.6 High 97.0 34.7 15.1 5.9 51.8 Highest 47.9 35.6 4.9 3.8 7.7
Note: Current use includes both daily and occasional (less than daily) use. : Table 4.3a based on Table 4.10 of Chapter 4
D-2 Appendix D: Tables number in thousands
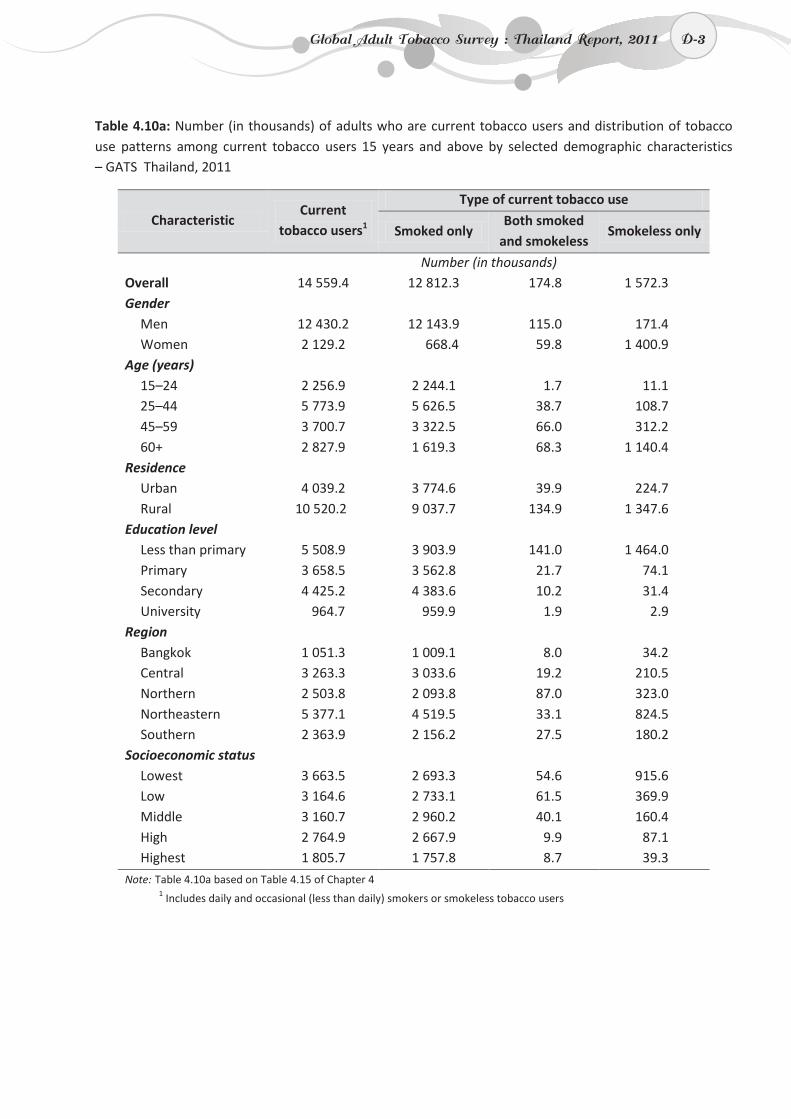
D-3
Table 4.10a: Number (in thousands) of adults who are current tobacco users and distribution of tobacco use patterns among current tobacco users 15 years and above by selected demographic characteristics – GATS Thailand, 2011
Characteristic Current
tobacco users1
Type of current tobacco use
Smoked only Both smoked
and smokeless Smokeless only
Number (in thousands) Overall 14 559.4 12 812.3 174.8 1 572.3 Gender
Men 12 430.2 12 143.9 115.0 171.4 Women 2 129.2 668.4 59.8 1 400.9
Age (years) 15–24 2 256.9 2 244.1 1.7 11.1 25–44 5 773.9 5 626.5 38.7 108.7 45–59 3 700.7 3 322.5 66.0 312.2 60+ 2 827.9 1 619.3 68.3 1 140.4
Residence Urban 4 039.2 3 774.6 39.9 224.7 Rural 10 520.2 9 037.7 134.9 1 347.6
Education level Less than primary 5 508.9 3 903.9 141.0 1 464.0 Primary 3 658.5 3 562.8 21.7 74.1 Secondary 4 425.2 4 383.6 10.2 31.4 University 964.7 959.9 1.9 2.9
Region Bangkok 1 051.3 1 009.1 8.0 34.2 Central 3 263.3 3 033.6 19.2 210.5 Northern 2 503.8 2 093.8 87.0 323.0 Northeastern 5 377.1 4 519.5 33.1 824.5 Southern 2 363.9 2 156.2 27.5 180.2
Socioeconomic status Lowest 3 663.5 2 693.3 54.6 915.6 Low 3 164.6 2 733.1 61.5 369.9 Middle 3 160.7 2 960.2 40.1 160.4 High 2 764.9 2 667.9 9.9 87.1 Highest 1 805.7 1 757.8 8.7 39.3
Note: Table 4.10a based on Table 4.15 of Chapter 4 1 Includes daily and occasional (less than daily) smokers or smokeless tobacco users
Global Adult Tobacco Survey : Thailand Report, 2011 D-3
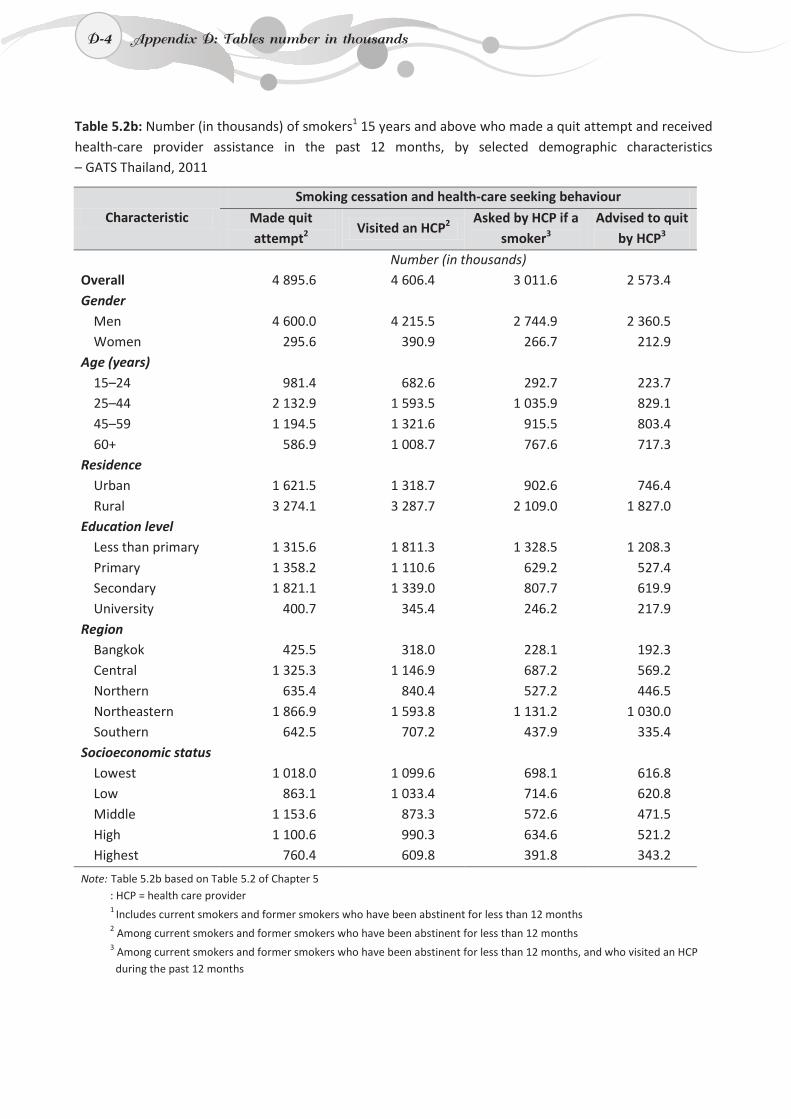
D-4
Table 5.2b: Number (in thousands) of smokers1 15 years and above who made a quit attempt and received health-care provider assistance in the past 12 months, by selected demographic characteristics – GATS Thailand, 2011
Characteristic Smoking cessation and health-care seeking behaviour
Made quit attempt2
Visited an HCP2 Asked by HCP if a
smoker3 Advised to quit
by HCP3
Number (in thousands) Overall 4 895.6 4 606.4 3 011.6 2 573.4 Gender
Men 4 600.0 4 215.5 2 744.9 2 360.5 Women 295.6 390.9 266.7 212.9
Age (years) 15–24 981.4 682.6 292.7 223.7 25–44 2 132.9 1 593.5 1 035.9 829.1 45–59 1 194.5 1 321.6 915.5 803.4 60+ 586.9 1 008.7 767.6 717.3
Residence Urban 1 621.5 1 318.7 902.6 746.4 Rural 3 274.1 3 287.7 2 109.0 1 827.0
Education level Less than primary 1 315.6 1 811.3 1 328.5 1 208.3 Primary 1 358.2 1 110.6 629.2 527.4 Secondary 1 821.1 1 339.0 807.7 619.9 University 400.7 345.4 246.2 217.9
Region Bangkok 425.5 318.0 228.1 192.3 Central 1 325.3 1 146.9 687.2 569.2 Northern 635.4 840.4 527.2 446.5 Northeastern 1 866.9 1 593.8 1 131.2 1 030.0 Southern 642.5 707.2 437.9 335.4
Socioeconomic status Lowest 1 018.0 1 099.6 698.1 616.8 Low 863.1 1 033.4 714.6 620.8 Middle 1 153.6 873.3 572.6 471.5 High 1 100.6 990.3 634.6 521.2 Highest 760.4 609.8 391.8 343.2
Note: Table 5.2b based on Table 5.2 of Chapter 5 : HCP = health care provider 1 Includes current smokers and former smokers who have been abstinent for less than 12 months 2 Among current smokers and former smokers who have been abstinent for less than 12 months 3 Among current smokers and former smokers who have been abstinent for less than 12 months, and who visited an HCP during the past 12 months
D-4 Appendix D: Tables number in thousands
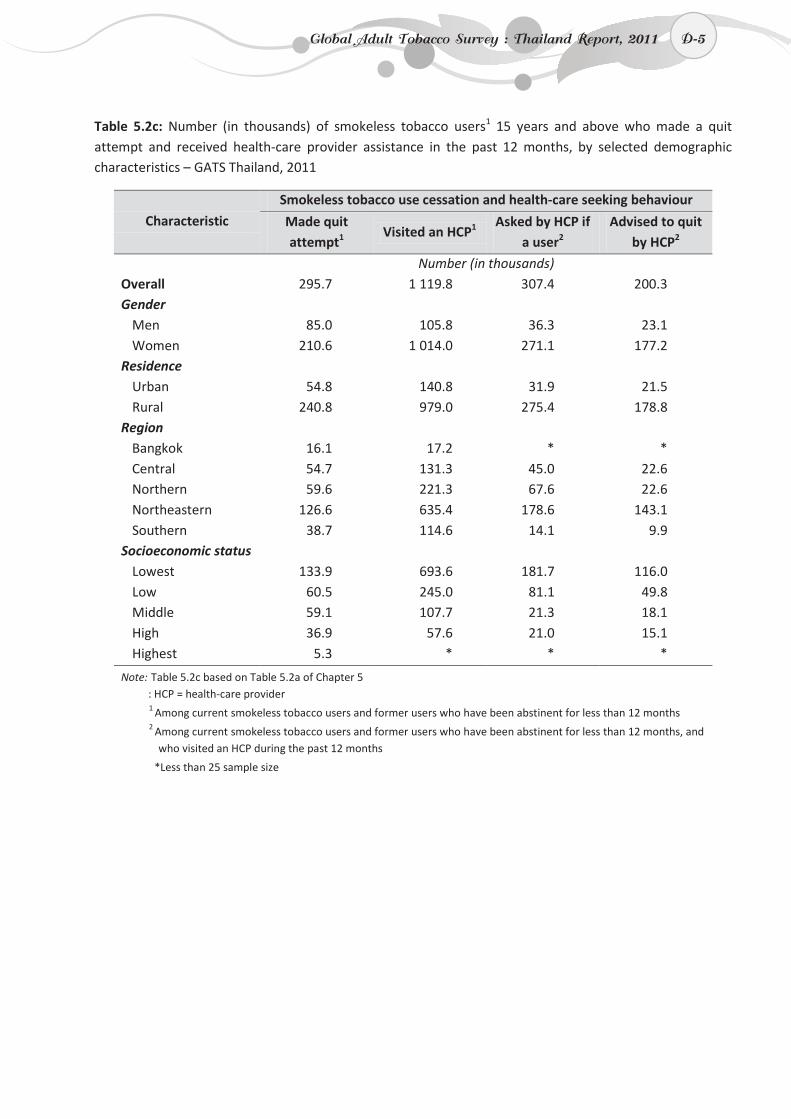
D-5
Table 5.2c: Number (in thousands) of smokeless tobacco users1 15 years and above who made a quit attempt and received health-care provider assistance in the past 12 months, by selected demographic characteristics – GATS Thailand, 2011
Characteristic
Smokeless tobacco use cessation and health-care seeking behaviour
Made quit attempt1
Visited an HCP1 Asked by HCP if
a user2 Advised to quit
by HCP2
Number (in thousands) Overall 295.7 1 119.8 307.4 200.3 Gender
Men 85.0 105.8 36.3 23.1 Women 210.6 1 014.0 271.1 177.2
Residence Urban 54.8 140.8 31.9 21.5 Rural 240.8 979.0 275.4 178.8
Region Bangkok 16.1 17.2 * * Central 54.7 131.3 45.0 22.6 Northern 59.6 221.3 67.6 22.6 Northeastern 126.6 635.4 178.6 143.1 Southern 38.7 114.6 14.1 9.9
Socioeconomic status Lowest 133.9 693.6 181.7 116.0 Low 60.5 245.0 81.1 49.8 Middle 59.1 107.7 21.3 18.1 High 36.9 57.6 21.0 15.1 Highest 5.3 * * *
Note: Table 5.2c based on Table 5.2a of Chapter 5 : HCP = health-care provider
1 Among current smokeless tobacco users and former users who have been abstinent for less than 12 months 2 Among current smokeless tobacco users and former users who have been abstinent for less than 12 months, and
who visited an HCP during the past 12 months
*Less than 25 sample size
Global Adult Tobacco Survey : Thailand Report, 2011 D-5
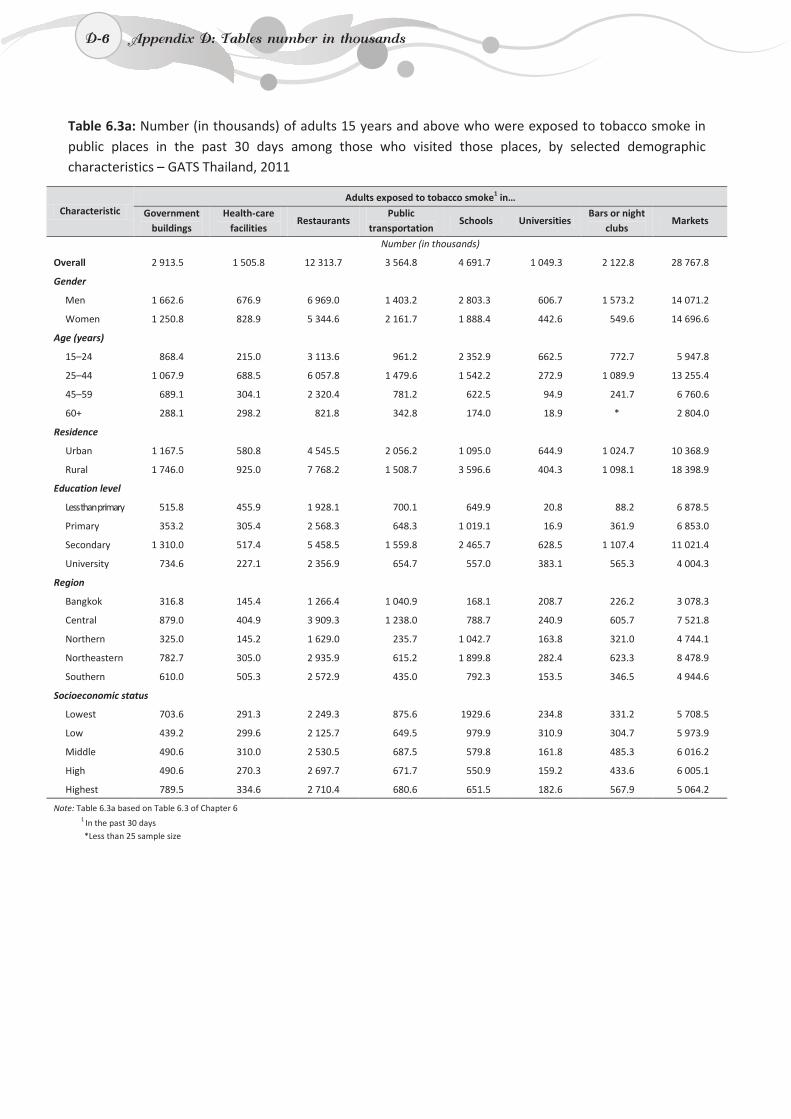
D-6
Table 6.3a: Number (in thousands) of adults 15 years and above who were exposed to tobacco smoke in public places in the past 30 days among those who visited those places, by selected demographic characteristics – GATS Thailand, 2011
Characteristic Adults exposed to tobacco smoke1 in…
Government buildings
Health-care facilities
Restaurants Public
transportation Schools Universities
Bars or night clubs
Markets
Number (in thousands)
Overall 2 913.5 1 505.8 12 313.7 3 564.8 4 691.7 1 049.3 2 122.8 28 767.8
Gender
Men 1 662.6 676.9 6 969.0 1 403.2 2 803.3 606.7 1 573.2 14 071.2
Women 1 250.8 828.9 5 344.6 2 161.7 1 888.4 442.6 549.6 14 696.6
Age (years)
15–24 868.4 215.0 3 113.6 961.2 2 352.9 662.5 772.7 5 947.8
25–44 1 067.9 688.5 6 057.8 1 479.6 1 542.2 272.9 1 089.9 13 255.4
45–59 689.1 304.1 2 320.4 781.2 622.5 94.9 241.7 6 760.6
60+ 288.1 298.2 821.8 342.8 174.0 18.9 * 2 804.0
Residence
Urban 1 167.5 580.8 4 545.5 2 056.2 1 095.0 644.9 1 024.7 10 368.9
Rural 1 746.0 925.0 7 768.2 1 508.7 3 596.6 404.3 1 098.1 18 398.9
Education level
Less than primary 515.8 455.9 1 928.1 700.1 649.9 20.8 88.2 6 878.5
Primary 353.2 305.4 2 568.3 648.3 1 019.1 16.9 361.9 6 853.0
Secondary 1 310.0 517.4 5 458.5 1 559.8 2 465.7 628.5 1 107.4 11 021.4
University 734.6 227.1 2 356.9 654.7 557.0 383.1 565.3 4 004.3
Region
Bangkok 316.8 145.4 1 266.4 1 040.9 168.1 208.7 226.2 3 078.3
Central 879.0 404.9 3 909.3 1 238.0 788.7 240.9 605.7 7 521.8
Northern 325.0 145.2 1 629.0 235.7 1 042.7 163.8 321.0 4 744.1
Northeastern 782.7 305.0 2 935.9 615.2 1 899.8 282.4 623.3 8 478.9
Southern 610.0 505.3 2 572.9 435.0 792.3 153.5 346.5 4 944.6
Socioeconomic status
Lowest 703.6 291.3 2 249.3 875.6 1929.6 234.8 331.2 5 708.5
Low 439.2 299.6 2 125.7 649.5 979.9 310.9 304.7 5 973.9
Middle 490.6 310.0 2 530.5 687.5 579.8 161.8 485.3 6 016.2
High 490.6 270.3 2 697.7 671.7 550.9 159.2 433.6 6 005.1
Highest 789.5 334.6 2 710.4 680.6 651.5 182.6 567.9 5 064.2
Note: Table 6.3a based on Table 6.3 of Chapter 6
1 In the past 30 days *Less than 25 sample size
D-6 Appendix D: Tables number in thousands
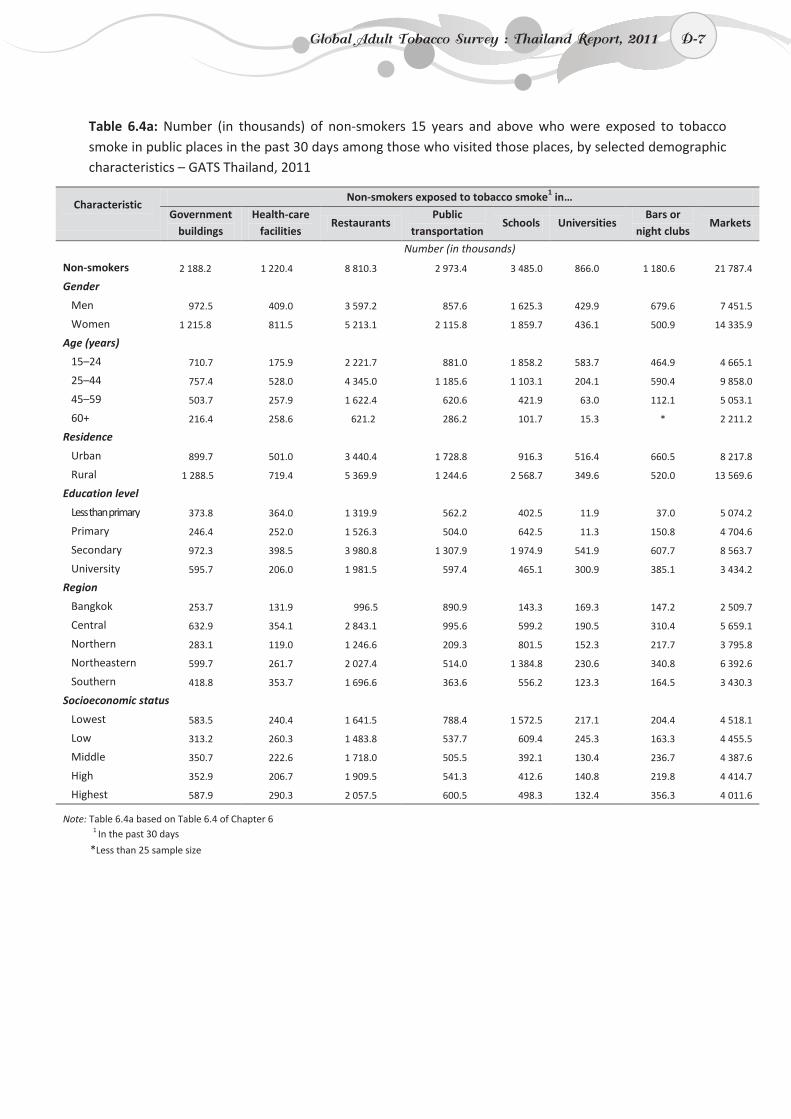
D-7
Table 6.4a: Number (in thousands) of non-smokers 15 years and above who were exposed to tobacco smoke in public places in the past 30 days among those who visited those places, by selected demographic characteristics – GATS Thailand, 2011
Characteristic
Non-smokers exposed to tobacco smoke1 in…
Government buildings
Health-care facilities
Restaurants Public
transportation Schools Universities
Bars or night clubs
Markets
Number (in thousands)
Non-smokers 2 188.2 1 220.4 8 810.3 2 973.4 3 485.0 866.0 1 180.6 21 787.4
Gender
Men 972.5 409.0 3 597.2 857.6 1 625.3 429.9 679.6 7 451.5
Women 1 215.8 811.5 5 213.1 2 115.8 1 859.7 436.1 500.9 14 335.9
Age (years)
15–24 710.7 175.9 2 221.7 881.0 1 858.2 583.7 464.9 4 665.1
25–44 757.4 528.0 4 345.0 1 185.6 1 103.1 204.1 590.4 9 858.0
45–59 503.7 257.9 1 622.4 620.6 421.9 63.0 112.1 5 053.1
60+ 216.4 258.6 621.2 286.2 101.7 15.3 * 2 211.2
Residence
Urban 899.7 501.0 3 440.4 1 728.8 916.3 516.4 660.5 8 217.8
Rural 1 288.5 719.4 5 369.9 1 244.6 2 568.7 349.6 520.0 13 569.6
Education level
Less than primary 373.8 364.0 1 319.9 562.2 402.5 11.9 37.0 5 074.2
Primary 246.4 252.0 1 526.3 504.0 642.5 11.3 150.8 4 704.6
Secondary 972.3 398.5 3 980.8 1 307.9 1 974.9 541.9 607.7 8 563.7
University 595.7 206.0 1 981.5 597.4 465.1 300.9 385.1 3 434.2
Region
Bangkok 253.7 131.9 996.5 890.9 143.3 169.3 147.2 2 509.7
Central 632.9 354.1 2 843.1 995.6 599.2 190.5 310.4 5 659.1
Northern 283.1 119.0 1 246.6 209.3 801.5 152.3 217.7 3 795.8
Northeastern 599.7 261.7 2 027.4 514.0 1 384.8 230.6 340.8 6 392.6
Southern 418.8 353.7 1 696.6 363.6 556.2 123.3 164.5 3 430.3
Socioeconomic status
Lowest 583.5 240.4 1 641.5 788.4 1 572.5 217.1 204.4 4 518.1
Low 313.2 260.3 1 483.8 537.7 609.4 245.3 163.3 4 455.5
Middle 350.7 222.6 1 718.0 505.5 392.1 130.4 236.7 4 387.6
High 352.9 206.7 1 909.5 541.3 412.6 140.8 219.8 4 414.7
Highest 587.9 290.3 2 057.5 600.5 498.3 132.4 356.3 4 011.6
Note: Table 6.4a based on Table 6.4 of Chapter 6
1 In the past 30 days
*Less than 25 sample size
Global Adult Tobacco Survey : Thailand Report, 2011 D-7
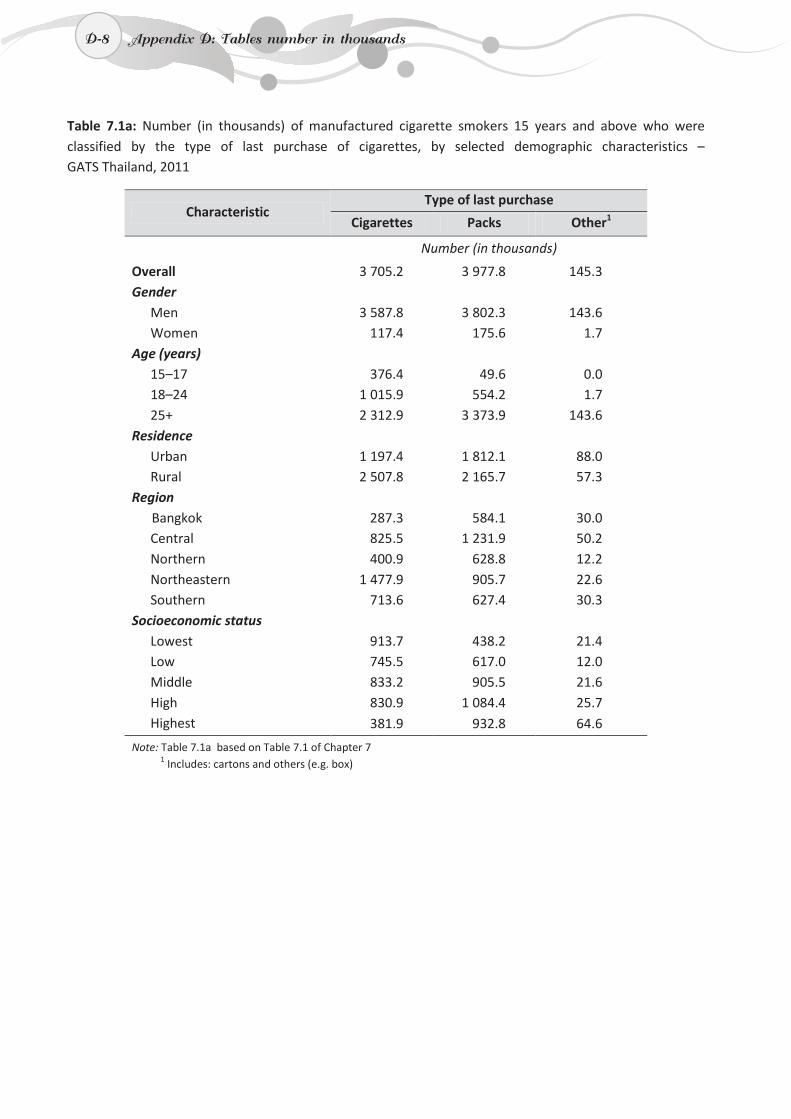
D-8
Table 7.1a: Number (in thousands) of manufactured cigarette smokers 15 years and above who were classified by the type of last purchase of cigarettes, by selected demographic characteristics – GATS Thailand, 2011
Characteristic Type of last purchase
Cigarettes Packs Other1
Number (in thousands)
Overall 3 705.2 3 977.8 145.3 Gender
Men 3 587.8 3 802.3 143.6 Women 117.4 175.6 1.7
Age (years) 15–17 376.4 49.6 0.0 18–24 1 015.9 554.2 1.7 25+ 2 312.9 3 373.9 143.6
Residence Urban 1 197.4 1 812.1 88.0 Rural 2 507.8 2 165.7 57.3
Region Bangkok 287.3 584.1 30.0
Central 825.5 1 231.9 50.2 Northern 400.9 628.8 12.2 Northeastern 1 477.9 905.7 22.6 Southern 713.6 627.4 30.3
Socioeconomic status Lowest 913.7 438.2 21.4 Low 745.5 617.0 12.0 Middle 833.2 905.5 21.6 High 830.9 1 084.4 25.7 Highest 381.9 932.8 64.6
Note: Table 7.1a based on Table 7.1 of Chapter 7
1 Includes: cartons and others (e.g. box)
D-8 Appendix D: Tables number in thousands
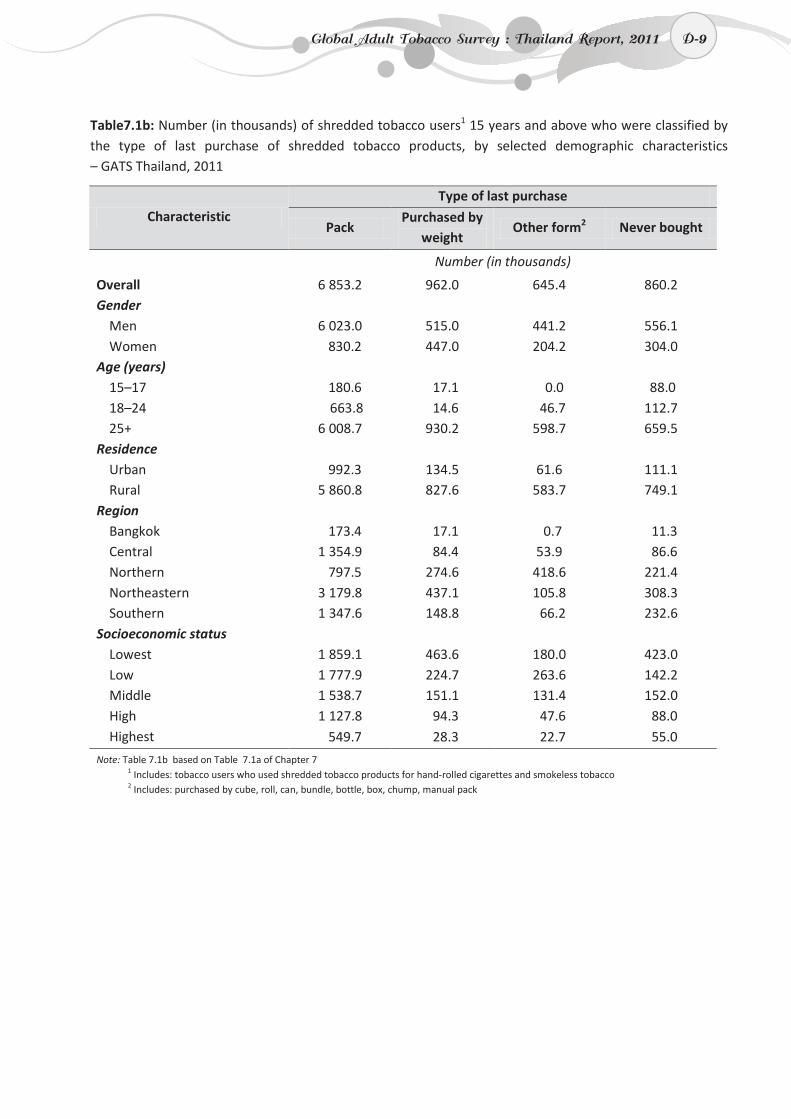
D-9
Table7.1b: Number (in thousands) of shredded tobacco users1 15 years and above who were classified by the type of last purchase of shredded tobacco products, by selected demographic characteristics – GATS Thailand, 2011
Characteristic Type of last purchase
Pack Purchased by
weight Other form2 Never bought
Number (in thousands)
Overall 6 853.2 962.0 645.4 860.2 Gender
Men 6 023.0 515.0 441.2 556.1 Women 830.2 447.0 204.2 304.0
Age (years) 15–17 180.6 17.1 0.0 88.0 18–24 663.8 14.6 46.7 112.7 25+ 6 008.7 930.2 598.7 659.5
Residence Urban 992.3 134.5 61.6 111.1 Rural 5 860.8 827.6 583.7 749.1
Region Bangkok 173.4 17.1 0.7 11.3 Central 1 354.9 84.4 53.9 86.6 Northern 797.5 274.6 418.6 221.4 Northeastern 3 179.8 437.1 105.8 308.3 Southern 1 347.6 148.8 66.2 232.6
Socioeconomic status Lowest 1 859.1 463.6 180.0 423.0 Low 1 777.9 224.7 263.6 142.2 Middle 1 538.7 151.1 131.4 152.0 High 1 127.8 94.3 47.6 88.0 Highest 549.7 28.3 22.7 55.0
Note: Table 7.1b based on Table 7.1a of Chapter 7
1 Includes: tobacco users who used shredded tobacco products for hand-rolled cigarettes and smokeless tobacco 2 Includes: purchased by cube, roll, can, bundle, bottle, box, chump, manual pack
Global Adult Tobacco Survey : Thailand Report, 2011 D-9
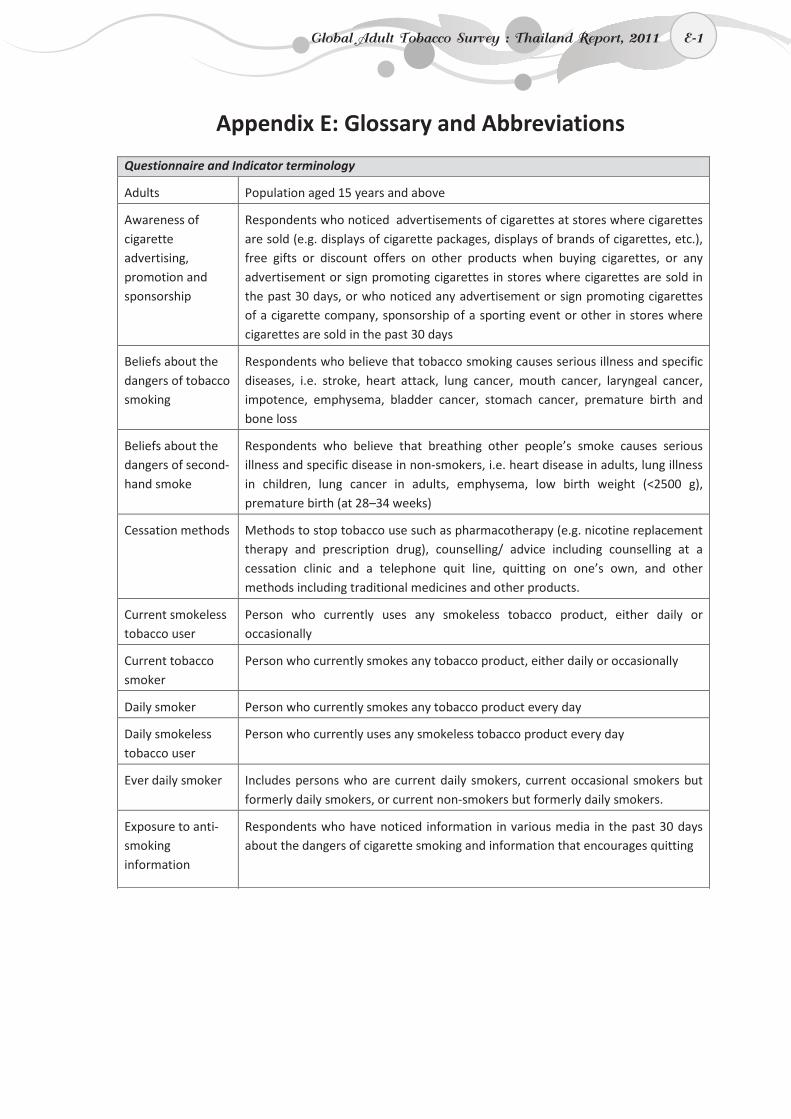
E-1
Appendix E: Glossary and Abbreviations
Questionnaire and Indicator terminology
Adults Population aged 15 years and above
Awareness of cigarette advertising, promotion and sponsorship
Respondents who noticed advertisements of cigarettes at stores where cigarettes are sold (e.g. displays of cigarette packages, displays of brands of cigarettes, etc.), free gifts or discount offers on other products when buying cigarettes, or any advertisement or sign promoting cigarettes in stores where cigarettes are sold in the past 30 days, or who noticed any advertisement or sign promoting cigarettes of a cigarette company, sponsorship of a sporting event or other in stores where cigarettes are sold in the past 30 days
Beliefs about the dangers of tobacco smoking
Respondents who believe that tobacco smoking causes serious illness and specific diseases, i.e. stroke, heart attack, lung cancer, mouth cancer, laryngeal cancer, impotence, emphysema, bladder cancer, stomach cancer, premature birth and bone loss
Beliefs about the dangers of second-hand smoke
Respondents who believe that breathing other people’s smoke causes serious illness and specific disease in non-smokers, i.e. heart disease in adults, lung illness in children, lung cancer in adults, emphysema, low birth weight (<2500 g), premature birth (at 28–34 weeks)
Cessation methods Methods to stop tobacco use such as pharmacotherapy (e.g. nicotine replacement therapy and prescription drug), counselling/ advice including counselling at a cessation clinic and a telephone quit line, quitting on one’s own, and other methods including traditional medicines and other products.
Current smokeless tobacco user
Person who currently uses any smokeless tobacco product, either daily or occasionally
Current tobacco smoker
Person who currently smokes any tobacco product, either daily or occasionally
Daily smoker Person who currently smokes any tobacco product every day
Daily smokeless tobacco user
Person who currently uses any smokeless tobacco product every day
Ever daily smoker Includes persons who are current daily smokers, current occasional smokers but formerly daily smokers, or current non-smokers but formerly daily smokers.
Exposure to anti-smoking information
Respondents who have noticed information in various media in the past 30 days about the dangers of cigarette smoking and information that encourages quitting
Global Adult Tobacco Survey : Thailand Report, 2011 E-1
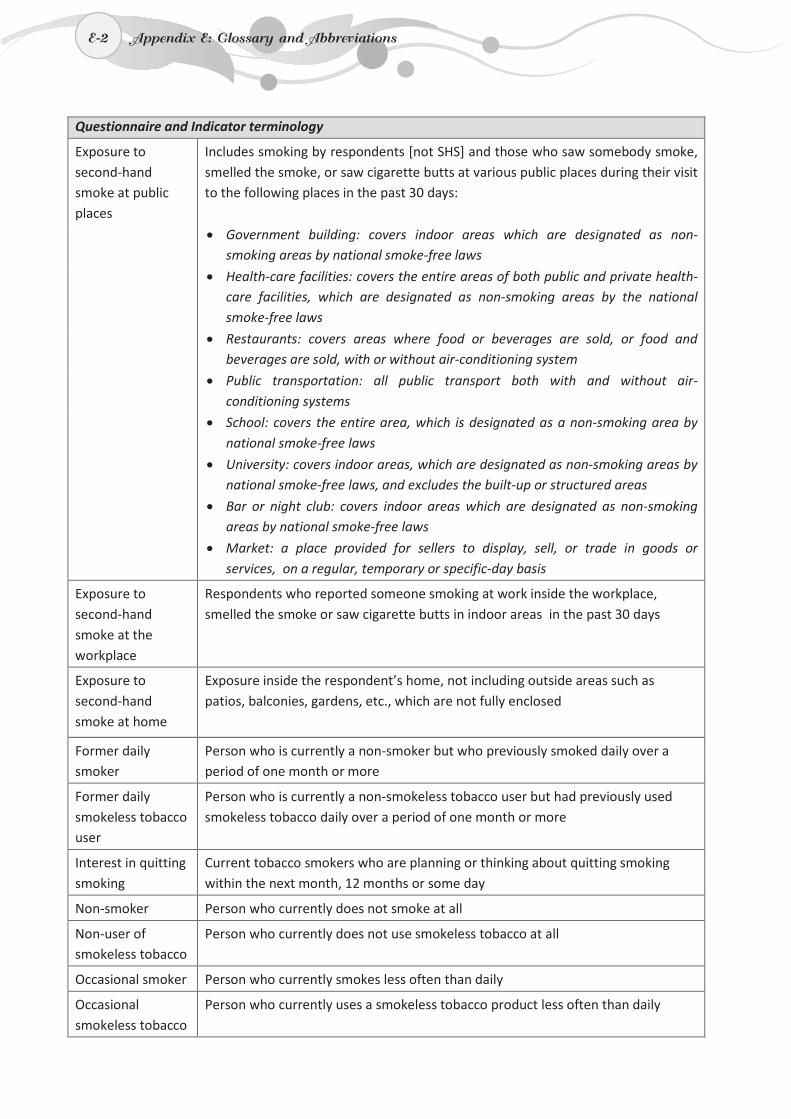
E-2
Questionnaire and Indicator terminology
Exposure to second-hand smoke at public places
Includes smoking by respondents [not SHS] and those who saw somebody smoke, smelled the smoke, or saw cigarette butts at various public places during their visit to the following places in the past 30 days:
• Government building: covers indoor areas which are designated as non-smoking areas by national smoke-free laws
• Health-care facilities: covers the entire areas of both public and private health-care facilities, which are designated as non-smoking areas by the national smoke-free laws
• Restaurants: covers areas where food or beverages are sold, or food and beverages are sold, with or without air-conditioning system
• Public transportation: all public transport both with and without air-conditioning systems
• School: covers the entire area, which is designated as a non-smoking area by national smoke-free laws
• University: covers indoor areas, which are designated as non-smoking areas by national smoke-free laws, and excludes the built-up or structured areas
• Bar or night club: covers indoor areas which are designated as non-smoking areas by national smoke-free laws
• Market: a place provided for sellers to display, sell, or trade in goods or services, on a regular, temporary or specific-day basis
Exposure to second-hand smoke at the workplace
Respondents who reported someone smoking at work inside the workplace, smelled the smoke or saw cigarette butts in indoor areas in the past 30 days
Exposure to second-hand smoke at home
Exposure inside the respondent’s home, not including outside areas such as patios, balconies, gardens, etc., which are not fully enclosed
Former daily smoker
Person who is currently a non-smoker but who previously smoked daily over a period of one month or more
Former daily smokeless tobacco user
Person who is currently a non-smokeless tobacco user but had previously used smokeless tobacco daily over a period of one month or more
Interest in quitting smoking
Current tobacco smokers who are planning or thinking about quitting smoking within the next month, 12 months or some day
Non-smoker Person who currently does not smoke at all
Non-user of smokeless tobacco
Person who currently does not use smokeless tobacco at all
Occasional smoker Person who currently smokes less often than daily
Occasional smokeless tobacco
Person who currently uses a smokeless tobacco product less often than daily
E-2 Appendix E: Glossary and Abbreviations
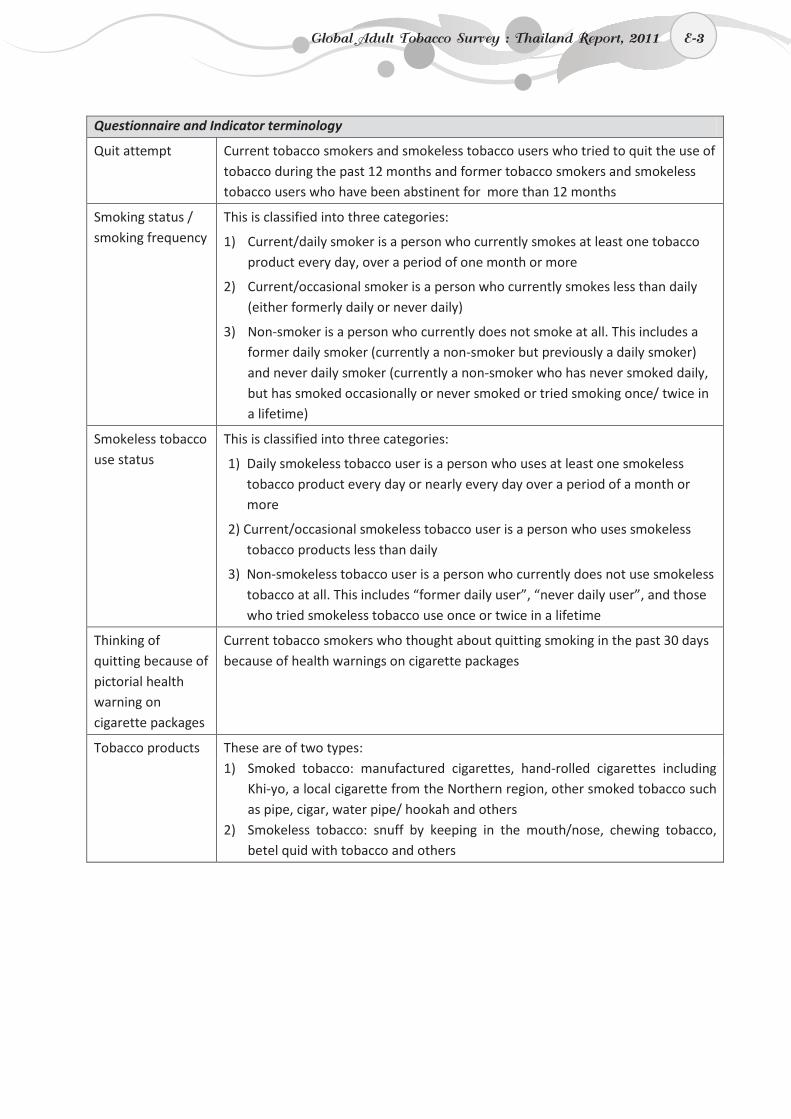
E-3
Questionnaire and Indicator terminology
Quit attempt Current tobacco smokers and smokeless tobacco users who tried to quit the use of tobacco during the past 12 months and former tobacco smokers and smokeless tobacco users who have been abstinent for more than 12 months
Smoking status / smoking frequency
This is classified into three categories:
1) Current/daily smoker is a person who currently smokes at least one tobacco product every day, over a period of one month or more
2) Current/occasional smoker is a person who currently smokes less than daily (either formerly daily or never daily)
3) Non-smoker is a person who currently does not smoke at all. This includes a former daily smoker (currently a non-smoker but previously a daily smoker) and never daily smoker (currently a non-smoker who has never smoked daily, but has smoked occasionally or never smoked or tried smoking once/ twice in a lifetime)
Smokeless tobacco use status
This is classified into three categories:
1) Daily smokeless tobacco user is a person who uses at least one smokeless tobacco product every day or nearly every day over a period of a month or more
2) Current/occasional smokeless tobacco user is a person who uses smokeless tobacco products less than daily
3) Non-smokeless tobacco user is a person who currently does not use smokeless tobacco at all. This includes “former daily user”, “never daily user”, and those who tried smokeless tobacco use once or twice in a lifetime
Thinking of quitting because of pictorial health warning on cigarette packages
Current tobacco smokers who thought about quitting smoking in the past 30 days because of health warnings on cigarette packages
Tobacco products These are of two types: 1) Smoked tobacco: manufactured cigarettes, hand-rolled cigarettes including
Khi-yo, a local cigarette from the Northern region, other smoked tobacco such as pipe, cigar, water pipe/ hookah and others
2) Smokeless tobacco: snuff by keeping in the mouth/nose, chewing tobacco, betel quid with tobacco and others
Global Adult Tobacco Survey : Thailand Report, 2011 E-3
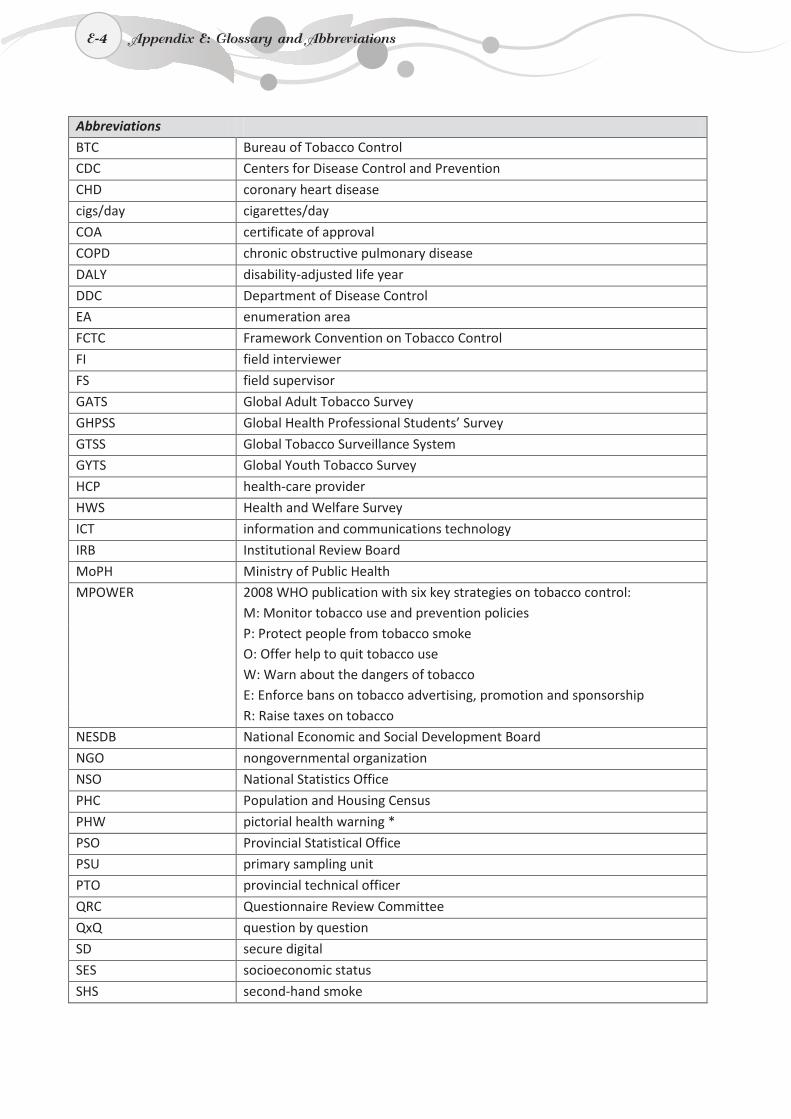
E-4
Abbreviations
BTC Bureau of Tobacco Control
CDC Centers for Disease Control and Prevention
CHD coronary heart disease
cigs/day cigarettes/day
COA certificate of approval
COPD chronic obstructive pulmonary disease
DALY disability-adjusted life year
DDC Department of Disease Control
EA enumeration area
FCTC Framework Convention on Tobacco Control
FI field interviewer
FS field supervisor
GATS Global Adult Tobacco Survey
GHPSS Global Health Professional Students’ Survey
GTSS Global Tobacco Surveillance System
GYTS Global Youth Tobacco Survey
HCP health-care provider
HWS Health and Welfare Survey
ICT information and communications technology
IRB Institutional Review Board
MoPH Ministry of Public Health
MPOWER 2008 WHO publication with six key strategies on tobacco control: M: Monitor tobacco use and prevention policies P: Protect people from tobacco smoke O: Offer help to quit tobacco use W: Warn about the dangers of tobacco E: Enforce bans on tobacco advertising, promotion and sponsorship R: Raise taxes on tobacco
NESDB National Economic and Social Development Board
NGO nongovernmental organization
NSO National Statistics Office
PHC Population and Housing Census
PHW pictorial health warning *
PSO Provincial Statistical Office
PSU primary sampling unit
PTO provincial technical officer
QRC Questionnaire Review Committee
QxQ question by question
SD secure digital
SES socioeconomic status
SHS second-hand smoke
E-4 Appendix E: Glossary and Abbreviations
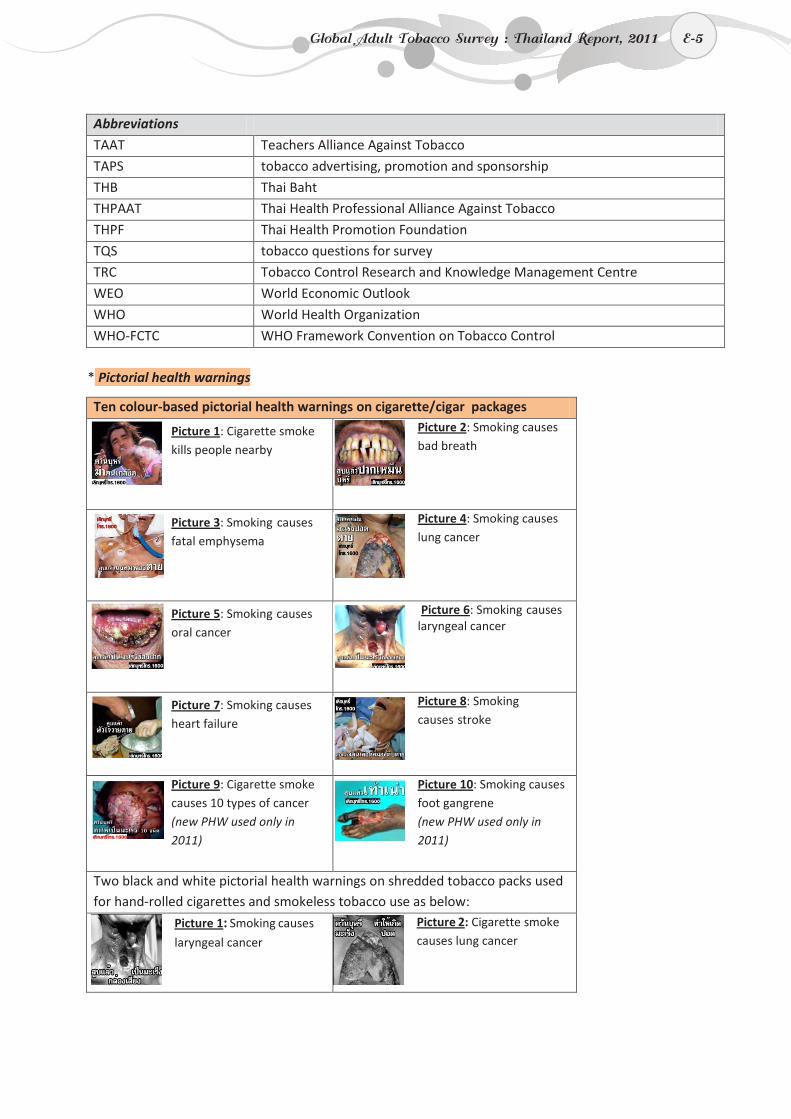
E-5
Abbreviations
TAAT Teachers Alliance Against Tobacco
TAPS tobacco advertising, promotion and sponsorship
THB Thai Baht
THPAAT Thai Health Professional Alliance Against Tobacco
THPF Thai Health Promotion Foundation
TQS tobacco questions for survey
TRC Tobacco Control Research and Knowledge Management Centre
WEO World Economic Outlook
WHO World Health Organization
WHO-FCTC WHO Framework Convention on Tobacco Control
* Pictorial health warnings
Ten colour-based pictorial health warnings on cigarette/cigar packages
Picture 1: Cigarette smoke kills people nearby
Picture 2: Smoking causes bad breath
Picture 3: Smoking causes fatal emphysema
Picture 4: Smoking causes lung cancer
Picture 5: Smoking causes oral cancer
Picture 6: Smoking causes laryngeal cancer
Picture 7: Smoking causes heart failure
Picture 8: Smoking causes stroke
Picture 9: Cigarette smoke causes 10 types of cancer (new PHW used only in 2011)
Picture 10: Smoking causes foot gangrene (new PHW used only in 2011)
Two black and white pictorial health warnings on shredded tobacco packs used for hand-rolled cigarettes and smokeless tobacco use as below:
Picture 1: Smoking causes
laryngeal cancer Picture 2: Cigarette smoke causes lung cancer
Global Adult Tobacco Survey : Thailand Report, 2011 E-5
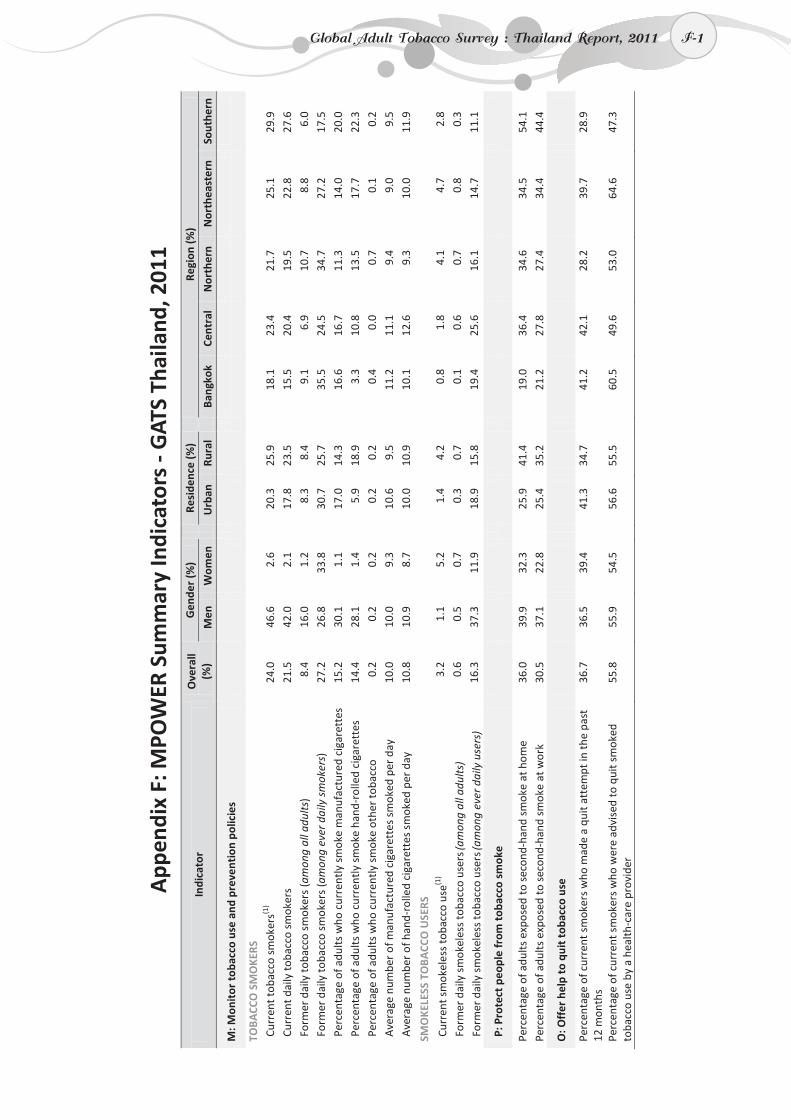
F-1
App
endi
x F:
MPO
WER
Sum
mar
y In
dica
tors
- G
ATS
Thai
land
, 201
1 In
dica
tor
Ove
rall
(%)
Gen
der
(%)
Re
side
nce
(%)
Re
gion
(%)
Men
W
omen
Urb
an
Rura
l
Bang
kok
Cent
ral
Nor
ther
n N
orth
east
ern
Sout
hern
M: M
onit
or to
bacc
o us
e an
d pr
even
tion
pol
icie
s
TOBA
CCO
SM
OKE
RS
Curr
ent t
obac
co s
mok
ers(1
) 24
.0
46.6
2.
6
20.3
25
.9
18
.1
23.4
21
.7
25.1
29
.9
Curr
ent d
aily
toba
cco
smok
ers
21.5
42
.0
2.1
17
.8
23.5
15.5
20
.4
19.5
22
.8
27.6
Fo
rmer
dai
ly to
bacc
o sm
oker
s (a
mon
g al
l adu
lts)
8.4
16.0
1.
2
8.3
8.4
9.
1 6.
9 10
.7
8.8
6.0
Form
er d
aily
toba
cco
smok
ers
(am
ong
ever
dai
ly s
mok
ers)
27
.2
26.8
33
.8
30
.7
25.7
35.5
24
.5
34.7
27
.2
17.5
Pe
rcen
tage
of a
dults
who
cur
rent
ly s
mok
e m
anuf
actu
red
ciga
rett
es
15.2
30
.1
1.1
17
.0
14.3
16.6
16
.7
11.3
14
.0
20.0
Pe
rcen
tage
of a
dults
who
cur
rent
ly s
mok
e ha
nd-r
olle
d ci
gare
ttes
14
.4
28.1
1.
4
5.9
18.9
3.3
10.8
13
.5
17.7
22
.3
Perc
enta
ge o
f adu
lts w
ho c
urre
ntly
sm
oke
othe
r to
bacc
o 0.
2 0.
2 0.
2
0.2
0.2
0.
4 0.
0 0.
7 0.
1 0.
2 A
vera
ge n
umbe
r of
man
ufac
ture
d ci
gare
ttes
sm
oked
per
day
10
.0
10.0
9.
3
10.6
9.
5
11.2
11
.1
9.4
9.0
9.5
Ave
rage
num
ber
of h
and-
rolle
d ci
gare
ttes
sm
oked
per
day
10
.8
10.9
8.
7
10.0
10
.9
10
.1
12.6
9.
3 10
.0
11.9
SMO
KELE
SS T
OBA
CCO
USE
RS
Curr
ent s
mok
eles
s to
bacc
o us
e(1)
3.2
1.1
5.2
1.
4 4.
2
0.8
1.8
4.1
4.7
2.8
Form
er d
aily
sm
okel
ess
toba
cco
user
s (am
ong
all a
dults
) 0.
6 0.
5 0.
7
0.3
0.7
0.
1 0.
6 0.
7 0.
8 0.
3
Form
er d
aily
sm
okel
ess
toba
cco
user
s (am
ong
ever
dai
ly u
sers
) 16
.3
37.3
11
.9
18
.9
15.8
19.4
25
.6
16.1
14
.7
11.1
P: P
rote
ct p
eopl
e fr
om t
obac
co s
mok
e
Perc
enta
ge o
f adu
lts e
xpos
ed t
o se
cond
-han
d sm
oke
at h
ome
36.0
39
.9
32.3
25.9
41
.4
19
.0
36.4
34
.6
34.5
54
.1
Perc
enta
ge o
f adu
lts e
xpos
ed t
o se
cond
-han
d sm
oke
at w
ork
30
.5
37.1
22
.8
25
.4
35.2
21.2
27
.8
27.4
34
.4
44.4
O: O
ffer
hel
p to
qui
t to
bacc
o us
e
Perc
enta
ge o
f cur
rent
sm
oker
s w
ho m
ade
a qu
it at
tem
pt in
the
past
12
mon
ths
36
.7
36.5
39
.4
41
.3
34.7
41.2
42
.1
28.2
39
.7
28.9
Perc
enta
ge o
f cur
rent
sm
oker
s w
ho w
ere
advi
sed
to q
uit s
mok
ed
toba
cco
use
by a
hea
lth-c
are
prov
ider
55
.8
55.9
54
.5
56
.6
55.5
60.5
49
.6
53.0
64
.6
47.3
Global Adult Tobacco Survey : Thailand Report, 2011 F-1
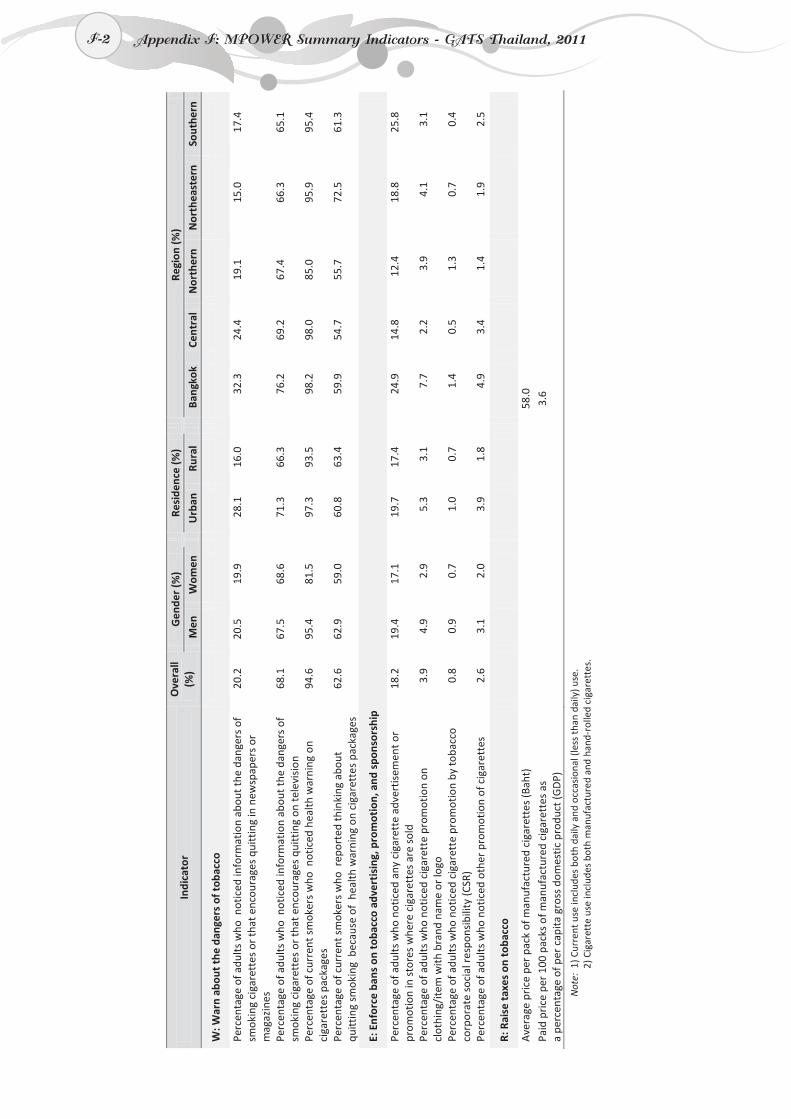
F-2
Indi
cato
r O
vera
ll (%
) G
ende
r (%
)
Resi
denc
e (%
)
Regi
on (%
)
Men
W
omen
Urb
an
Rura
l
Bang
kok
Cent
ral
Nor
ther
n N
orth
east
ern
Sout
hern
W: W
arn
abou
t th
e da
nger
s of
tob
acco
Perc
enta
ge o
f adu
lts w
ho n
otic
ed in
form
atio
n ab
out t
he d
ange
rs o
f sm
okin
g ci
gare
ttes
or
that
enc
oura
ges
quitt
ing
in n
ewsp
aper
s or
m
agaz
ines
20.2
20
.5
19.9
28.1
16
.0
32
.3
24.4
19
.1
15.0
17
.4
Perc
enta
ge o
f adu
lts w
ho n
otic
ed in
form
atio
n ab
out t
he d
ange
rs o
f sm
okin
g ci
gare
ttes
or
that
enc
oura
ges
quitt
ing
on te
levi
sion
68
.1
67.5
68
.6
71
.3
66.3
76.2
69
.2
67.4
66
.3
65.1
Perc
enta
ge o
f cur
rent
sm
oker
s w
ho n
otic
ed h
ealth
war
ning
on
ciga
rett
es p
acka
ges
94
.6
95.4
81
.5
97
.3
93.5
98.2
98
.0
85.0
95
.9
95.4
Perc
enta
ge o
f cur
rent
sm
oker
s w
ho r
epor
ted
thin
king
abo
ut
quitt
ing
smok
ing
bec
ause
of
heal
th w
arni
ng o
n ci
gare
ttes
pac
kage
s
62.6
62
.9
59.0
60.8
63
.4
59
.9
54.7
55
.7
72.5
61
.3
E: E
nfor
ce b
ans
on t
obac
co a
dver
tisi
ng, p
rom
otio
n, a
nd s
pons
orsh
ip
Perc
enta
ge o
f adu
lts w
ho n
otic
ed a
ny c
igar
ette
adv
ertis
emen
t or
prom
otio
n in
sto
res
whe
re c
igar
ette
s ar
e so
ld
18.2
19
.4
17.1
19.7
17
.4
24
.9
14.8
12
.4
18.8
25
.8
Perc
enta
ge o
f adu
lts w
ho n
otic
ed c
igar
ette
pro
mot
ion
on
clot
hing
/ite
m w
ith b
rand
nam
e or
logo
3.
9 4.
9 2.
9
5.3
3.1
7.
7 2.
2 3.
9 4.
1 3.
1
Perc
enta
ge o
f adu
lts w
ho n
otic
ed c
igar
ette
pro
mot
ion
by to
bacc
o co
rpor
ate
soci
al r
espo
nsib
ility
(CSR
) 0.
8 0.
9 0.
7
1.0
0.7
1.
4 0.
5 1.
3 0.
7 0.
4
Perc
enta
ge o
f adu
lts w
ho n
otic
ed o
ther
pro
mot
ion
of c
igar
ette
s
2.6
3.1
2.0
3.
9 1.
8
4.9
3.4
1.4
1.9
2.5
R: R
aise
tax
es o
n to
bacc
o
Ave
rage
pri
ce p
er p
ack
of m
anuf
actu
red
ciga
rett
es (B
aht)
58
.0
Paid
pri
ce p
er 1
00 p
acks
of m
anuf
actu
red
ciga
rett
es a
s
a pe
rcen
tage
of p
er c
apita
gro
ss d
omes
tic
prod
uct (
GD
P)
3.6
Not
e: 1
) Cur
rent
use
incl
udes
bot
h da
ily a
nd o
ccas
iona
l (le
ss t
han
daily
) use
.
2) C
igar
ette
use
incl
udes
bot
h m
anuf
actu
red
and
hand
-rol
led
ciga
rett
es.
F-2 Appendix F: MPOWER Summary Indicators - GATS Thailand, 2011

G-1
Appendix G: Technical and Survey Staffs
Consultants
Organization Position
1. Ministry of Public Health Dr Porntep Siriwanarangsan Director- General of Department of Disease Control (DDC) Dr Nopporn Cheanklin Deputy Director-General of Department of Disease
Control (DDC)
2. National Statistical Office Mr Viboondhat Sudhantanakit Director-General of National Statistical Office Ms Rajana Netsangtip Deputy Director-General of National Statistical Office Ms Wilailuck Chulewatanakul Director of Policy Statistical Techniques Bureau Dr Malee Wongsaroje Director of Information and Communications Technology
Center (ICT Center) Mrs Somsri Watsintham Director of Data Capturing Technology group
3. Action on Smoking and Health Foundation, Thailand Prof. Dr Prakit Vathesatogkit Executive Secretary of Action on Smoking and Health
Foundation, Thailand (ASH Thailand)
4. Faculty of Public Health, Mahidol University Associate Prof. Tharadol Kengganpanich Statistician Associate Prof. Dusit Sujirarat Statistician
5. World Health Organization Dr Chai Krittiyapichatkul National Professional Officer on Tobacco Control
Global Adult Tobacco Survey : Thailand Report, 2011 G-1

G-2
GATS Working Group
Note: 1 Core staff who undertake the role of field supervisors (FSs)
Ms Chitrlada Touchchai1
Mr Apichat Thunyahan1 Mrs Wanpen Toaditep1
Ms Yupawadee Boohchanasap1
Mrs Siriporn Kulboonyiam1
Dr.Sarunya Benjakul Project Investigator, Bureau of Tobacco Control, DDC, MoPH
Assist Prof.Dr Lakkhana Termsirikulchai
Assist Prof.Dr Mondha Kengganpanich
Mrs Hataichanok Puckcharern
Mr Bunpot Teemuangsong
Ms Patarin Siritrakul1
Ms.Tanyawan Sulumping1
Mr Nuttapon Theskayan1
Mrs Chantrarut Pruksasuay1
Ms.Ratchada Gannika1
Ms Areerat Lohtongmongkol
Faculty of Public Health, Mahidol University
Bureau of Tobacco Control, DDC, MoPH
National Statistical Office
ICT Center Policy Statistical Techniques Bureau
Economic Social Bureau
Ms Pornpan Gawsringam
G-2 Appendix G: Technical and Survey Staffs

G-3
Field Staff
1. Northern Region
1.1 Provincial Technical Officers (PTOs)
Mrs Punnapa Rattanaburi Mr Warayut Piyaphanee Mr Vorachai Suwan Mr Nipon Panhong Mr Phakin Wanichde Mrs Ruangvipha Vongsaroj Mr Augsorn Vimol Ms Tongngam Aussawamekagul Ms Supattra Sarapun Ms Kamolthip Chantavarang Ms Patcharaporn Sirivoravejchayangkul Mr Paithul Thrapmak Mrs Songkran Vongsa Mrs Sompong Saidang Ms Piyanuch Tugaew Mrs Theraporn Vichitpanya Mr Chavalit Therakerayut
1.2 Field Interviewers (FIs)
Ms Pharade Boonmawong Mr Apichat Chaiya Mr Pithun Kamjina Mr Sukij Chaowwong Mr Nuttapol Taubon Mr Somsuk Pattamasi Mr Chatre Sukcharoen Mr Narubej Singho Mr Somsak Charoenkhunmueang Ms Jittra Rutragan Mr Apinya Charoenchaikittikul Mrs Siriprapha Kadsanit Ms Lhalana Phinthaprasat Mr Thitikorn Chanawongsa Mr Chanon Gassomboon Mr Pongpun Pruchyasakul Mrs Kodchaporn Thanutvoravanichkul Mr Somjet Judgan Ms Wilaiwan Mahawansri Mr Rapin Reungsongkram Mr Jirapit Singpun Ms Thong Sukmueang
2. Northeastern Region
2.1 Provincial Technical Officers (PTOs)
Ms Ketsara Sripha Mr Tosaporn Wongla Ms Somboon Chalewan Mrs Jiraporn Tienpitak Mr Manoon Sawisit Mrs Thitarporn Phasaweth Mr Sumit Chatchawan Mrs Yupaporn Moonut Mrs Kwanluk Siripobaumporn Mrs Mathuwale Chuntomuk
Ms Chorrak Intanon Mrs Kanlapat Mahipan Mrs Sanyakorn Nasungnern Ms Cheawchai Promwongshay Ms Jutamas Kumguna Mr Nopphadon Paoyaosuk Mr Suphun Chatpaengta Mr Thammasak Srisongkram
Mr Adisorn Jinavil Mr Phanupun Piluk
Global Adult Tobacco Survey : Thailand Report, 2011 G-3

G-4
2. Northeastern Region (Cont.)
2.2 Field Interviewers (FIs)
3. Southern Region
3.1 Provincial Technical Officers (PTOs)
3.2 Field Interviewers (FIs)
Mrs Busara Ratanaphatumwan Mr Panupat Atthachon Ms Kavarin jaikaewairi Mr Suwit Napho Ms Nichapak Jindapee Ms Rapeepan Boonpa Ms Janya Swamechai Ms Parada Kumgungwan Mr Niwat Inhorm Mr Chagkrapong Manade Ms Chotika Nonyai Ms Piyada Sanphu Mr Sumrit Phapol Mr Vatit Samritrin Mr Kawi Nimnual Ms Kantaporn Prapong Mr Prachaup Srinate Ms Pistaya Khunpanya Mrs Nongnuch Sisisat Mr Yutthapong Tonggon Mr Adisak Raksasi Mr Putipong Thongon Mr Aelvit Phromchan Mr Monchai Phasaweth
Mr Somjit Raksrithong Ms Mukdarat Pechtnoo Mr Chaivut Hemtanond Mr Thanes Suwattikul Mr Thakrit Chaleayvares Mrs Aonanong Chunpetch Ms Prapai Pukngarm Mrs Noppawan Punrug Ms Hasana Legheam Ms Methini Chumniturakarn Ms Supakul Rachpibul Ms Chaluay Sannichart Mr Chirat Cheangkriyung Mr Rungsarit Rattanasarid
Mr Withan Deenu Ms Supaporn Kwanchean Mr Winyoo Pislangam Mr Yannapol Thummaro Mr Kriangsak Paensuwan Ms Sirikwan Klaogaw Mrs Suwammine Phromhong Mr Kittipong Rongsamark Mr Nikom Kumleang Ms Jiraporn Rithima Ms Piangjai Sudwilai Mrs Kanda Rakkoeng Mr Somrak Saengarvut Mr Rossalan Benno Ms Pornthip Sonbunpan Mrs Kodchakorn Make Ms Punyanuch Rajasiri Mrs Areeya Satirak Ms Apinya Karawanont Mr Santi Satirak Mrs Pennapa Wattanont
G-4 Appendix G: Technical and Survey Staffs

G-5
4. Central Region
4.1 Provincial Technical Officers (PTOs)
4.2 Field Interviewers (FIs)
Mrs Nichaporn Sangsakul Mrs Aunchale Thanagulmetha Mrs Natchanok Sumetyachan Ms Raweewan Booyakalampa Ms Suttiya Tongsai Mr Yothin Mekarun Ms Nongluck Promrugsa Ms Sidarat Tharasombat Ms Maneerat Sandtuppar Mr Soontorn Fugsil Mrs Raphatsha Phuthakorn Ms Paphopsorn Timsriklum Mrs Rujisaya Mukdajarujinda Ms Sutinee Keyata Ms Kanchana Pajariyapong Ms Muttawan Chaisuwan Ms Pimporn Horasith Mrs Nisra Pheetawee Ms Manapapob Sangansat Ms Waraporn Dejkrob Mrs Nutcharat Lapboon Mr Tepparit Pilanonth Mr Somsak Peerachairat Mrs Athtthan Changphueak Ms Teanjai Panboon
Ms Wararat Chantawad Ms Pucharee Ngachur Ms Nattanan Junsri Mr Tossapol Singtoeaj Ms Chanoknan Thunnthong Ms Nittaya Wongsa Ms Patama Phuging Mr Paruehas Suthipongphan Mr Kritdakorn Lapjeam Ms Wattana Phalahan Ms Nuttaporn Yingsagul Ms Ratchada Dachun Ms Lamai Ritthiherm Mr Samatcha Wisanwong Mr Jedchan Lorprasert Mr Sakkarin Seesom Ms Wandee Gothum Mr Ayutthaya Rugrajchakan Mrs Prajin Klibpan Ms Uraiwan Janthranonth Mrs Wannapa Boonmakul Mr Keatkong Tochumboon Acting sub Lt.Watchara Thongma Mrs Pranom Sukyu Ms Kanokwan Vicheanlang Ms Suviwan Pechtool Mr Aekkachai Gimsri Mrs Najjaree Sutthipan
Global Adult Tobacco Survey : Thailand Report, 2011 G-5

G-6
5. Bangkok Metropolis
5.1 Provincial Technical Officers (PTOs)
5.2 Field Interviewers (FIs)
Mr Somchai Klinkong Mr Wasit Srisengchoti Mr Chumpol Mephat
Ms Kamolthip Pulgeaw Ms Vinitha Pimpila Ms Rungruedee Kaewkalong Ms Jiruttikal Sujinthawong Ms Ratre Srirod Ms Nareumol Panya Ms Phagawadee Kruganonth Ms Patchane Thumcharean Mrs Lakkhana Loiboon Mrs Lapusrada Cheatrakul Mr Jirapat Sangpap Ms Vigave Aekaburt Mr Sripai Srisutham Ms Piyawan Ganchanarug Mr Prasert Sanguansri Ms Rungthiwa Sukchaichanchol
G-6 Appendix G: Technical and Survey Staffs