Embed Size (px)
Citation preview

G l o b a l A d v a n t a g e J A L G r o u p
ANNUAL REPORT
1999 2000 FISCAL YEAR ENDEDMARCH 31, 2000
Japan Airlines

1
$ 15,080,339 14,656,867
423,462 186,226
$ 0.104
$ 9,253,0002,244,367
18,029,971
Thousands ofU.S. dollars
2000Millions of yen
19982000 1999
¥1,581,5591,539,932
41,626(62,918)
¥ (35.37)
¥1,064,235184,961
2,042,7611,778,943
¥1,566,0941,533,237
32,85626,773
¥ 15.05
¥1,066,660216,957
1,955,6221,778,943
¥1,598,5161,553,628
44,88719,740
¥ 11.10
¥ 980,818237,903
1,911,1771,778,943
For the Year:Operating RevenuesOperating ExpensesOperating Income (Loss)Net Income (Loss)Net Income (Loss)Per Share(yen and dollars)
At Year-End:Long-Term DebtStockholders’ EquityTotal AssetsShares Issued (thousands)
Consolidated Financial HighlightsJapan Airlines Company, Ltd. and Consolidated SubsidiariesFor the Years Ended March 31, 2000, 1999 and 1998
Note: The U.S. dollar amounts in this annual report are translated from yen amounts, solely for convenience, at ¥106=U.S.$1.00, the exchange rate prevailingon March 31, 2000 (see Note 2 to the Consolidated Financial Statements ).
3.08.44.91.96.15.22.41.51.82.57.97.12.13.03.0
Change (%)19992000
22,660,77812,831,05235,491,83018,620,41765,472,53784,092,954
63.369.968.3
1,705,44410,184,91411,890,358
52.167.364.6
23,336,70313,909,95137,246,65418,983,20969,495,33088,478,539
65.771.470.1
1,747,88410,990,15112,738,035
54.270.367.6
DomesticInternationalTotalDomesticInternationalTotalDomesticInternationalTotalDomesticInternationalTotalDomesticInternationalTotal
Revenue Passengers Carried:(number of passengers)
Revenue Passenger-Km:(1,000 passenger-km)
Revenue Passenger-Load Factor:(%; percentage point change)
Revenue Ton-Km Performed:(1,000 ton-km)
Revenue Weight-Load Factor:(%; percentage point change)
Consolidated Operating HighlightsJapan Airlines Company, Ltd. and Consolidated SubsidiariesFor the Years Ended March 31, 2000 and 1999
Notes: 1. Ratios and percentages have been rounded to the nearest tenth of a percent.2. Other figures less than one thousand, except for passengers carried, have been discarded.
Contents
Consolidated Financial HighlightsConsolidated Operating HighlightsMessage from the PresidentGlobal Advantage JAL Group Operational safety is our most important mission Strengthening our management system A strong sense of solidarityReview of Operations Passenger Operations (International) Passenger Operations (Domestic) Cargo Operations Other OperationsJAL Route NetworkCorporate CitizenshipFinancial SectionConsolidated SubsidiariesJAL and Its Subsidiaries and AffiliatesDirectoryCorporate OrganizationBoard of DirectorsInvestor Information
............................................................................. 1 ........................................................................... 1
....................................................................................... 2.................................................................................. 4
................................................ 6................................................................ 8
................................................................................... 10................................................................................................ 12
.................................................................... 12......................................................................... 14
................................................................................................ 16
................................................................................................ 17................................................................................................... 18
................................................................................................ 20 ........................................................................................................ 21
........................................................................................... 50........................................................................ 52
.................................................................................................................... 54............................................................................................. 56
...................................................................................................... 58.......................................................................... Inside Back Cover
Japan Airlines Company Ltd. (JAL) and its affiliates, which together comprise the largest air-transport operator in Japan and Asia, serve a global network of 140 international and domestic locations. These services, which we have expanded through our core operations in air transport, encompass hotels and resorts, in-flight meal catering, cargo, trading and logistics, information systems, temporary staffing, and so forth.
JAL, which was established in 1951, began running scheduled domestic air-transport services in October 1952 as Japan’s flagship carrier. In 1987 the company was fully privatized. And today, as one of the world’s largest airlines, the JAL Group is expanding its services to cover numerous other cities, thanks to international alliances and business tie-ups, ensuring further growth for the organization. In our ongoing efforts to build and maintain a stronger, more dynamic JAL group, we continue to set new goals in ensuring safety in flight operations and bringing our customers more of the quality services they expect.

2 3
Results for the Year Ended March 2000
Overall demand for international passenger travel and cargo
operations showed an upward trend during the year in review,
thanks mainly to routes covering our Asian destinations. Domestic
routes also benefited from a strong demand for passenger travel and
cargo, sharing in an increase in air-transport demand brought
about by signs of a gradual recovery in Japan’s economy.
JAL has enhanced its international service network through the
addition of routes and flights, as well as by expanding the number
of code-share flights with American Airlines and other carriers. At
the same time, we have restructured our system of domestic flight
routes for improved profitability, and transferred appropriate routes
to JAL Express in order to ensure greater efficiency. Moreover,
amid the increasingly fierce competition in the air-transport
industry—chiefly as a result of deregulation and the revised
Aviation Act of Japan—JAL has endeavored to boost its market
profile through highly competitive, demand-based airfare pricing.
Regarding associated business operations, as part of our efforts
to realize a strong and healthy JAL Group, we have been
strengthening our general management capabilities. The effort is
being carried forward by the entire organization for the sake of
greater efficiency in operations, and has been accompanied by the
reduction and restructuring of several associated business
operations. This has produced a revenue increase of ¥32.4 billion—
up 2.1% from the previous year–to ¥1,598.5 billion. And thanks to
measures aimed at key cost reductions, we were able to maintain
operating expenses at a minimum level of ¥1,553.6 billion, an
increase of ¥20.3 billion (1.3%). As a result, during the year in
review we achieved a ¥12-billion increase in operating income, to
¥44.8 billion (up 36.6%).
Building a Globally Competitive Group
Safety in flight operations is our top-priority issue, and we have
been striving to instill the concept of “safety first” throughout our
entire employee roster. And in response to the rapidly changing
environment surrounding the airline industry, we are creating a
corporate structure that will bolster our competitiveness in the
international arena.
JAL’s international service network has been enhanced through
the transfer of Asian Pacific resort routes to JALways, a cost-
effective operating unit, as well as by increasing the number of
code-share flights with American Airlines and other carriers. On
the domestic front we have promoted the shift of relatively low-
demand routes to JAL Express (JEX) as part of our dedicated effort
on behalf of low-cost operations. We have done this while actively
restructuring our entire system of routes, thereby enhancing our
profit potential.
JAL’s preparations with regard to the issue of Year 2000
compliance were well underway as far back as 1995, with the
corporate-wide testing of all related systems. Accordingly, we were
able to overcome all Y2K issues, and our air and ground operations
entered the new millennium without any trouble or incident. By
accepting the challenge of Y2K well in advance, we as a group
became versed in the entire spectrum of issues regarding
management risk.
Expediting Comprehensive Management Reform
Although the outlook for the Japanese economy remains somewhat
ambiguous in certain respects, the nation is nevertheless expected to
witness a gradual trend toward a full, self-perpetuating recovery.
And while the demand for air transportation is also expected to
grow, it is likely that JAL will continue facing the challenges of a
harsh, fiercely competitive business environment, both domestically
and overseas. Therefore, even though the general economic picture
will improve, the airline industry will find itself in a prolonged
atmosphere of pricing competition. Moreover, the industry has
reached a major turning point, as exemplified in the reevaluation of
safety regulations and deregulation following the February 2000
revision of the Aviation Act of Japan. These changes go hand in
hand with increases in flight frequency, such as that due to the
opening of Haneda Airport’s new Runway B.
JAL will therefore redouble its efforts in safety management by
sharing information among Group companies and clarifying the
lines of accountability regarding this issue.
In April of 2000 JAL reorganized its passenger sales, cargo and
maintenance operations as in-house companies in order to better
define operational responsibilities, expedite decision-making,
enhance profitability and strengthen group management. In
addition, we launched the JAL Sales Network Co., Ltd., a holding
company set up to supervise JAL Group companies engaged in
passenger sales. In so doing we will achieve a more efficient
structure of sales and thus enhance our marketing capabilities.
Given the rapid progress of information technology, there is
demand for an ever-increasing diversity of sales services.
Accordingly, JAL now offers the latest information on cargo
shipments through the JAL Cargo Tracker Report (JTR), a system
that utilizes advanced information technology. We have also
introduced e-Discount, a new system that applies discounts to
reservations made via the Internet, JAL Online, and i-mode, the
new cellular handheld device from NTT DoCoMo.
Business Process Reengineering (BPR) is another key aspect of the
new high-tech business environment, employing a wealth of
information technology. We are forming a team of professionals in
these fields in order to respond to emerging needs and further
promote e-business and BPR.
The evaluation of a modern corporation must emphasize the
performance of the group to which it belongs. That is why we are
working to shore up our consolidated operation, improve our
income and expense figures, optimize cash flow and, reduce the
value of consolidated, interest-bearing liabilities.
The entire JAL organization shares the fundamental goal of
ensuring safety in flight operations and bringing our customers
more of the quality services they expect. In this way we are aspiring
to be a corporation that can compete and win in any international
market: an airline that meets the expectations of our loyal
shareholders.
August 2000
Isao Kaneko
President
Message from the President
The fiscal year ended March 2000 marked the close of the 20th century. It was also a very important year for Japan Airlines. In the
midterm management plan entitled “Forging a stronger, More Dynamic JAL Group” initiated in 1999, we spelled out the path we
should take as a worldwide organization, and for the past year we have been working steadily toward the implementation of the
corresponding operational reforms. And in response to the ever-changing environment surrounding the air transport industry, we have
developed yet another midterm plan for fiscal years 2000 through 2002, as a means of setting guidelines with which we might further
implement our reforms and strategies.
The efficiency of our overall system, and a structure that facilitates rapid decision making, will enable the entire network of JAL
Group companies to work as one. And with our renewed energy and commitment we will seize upon the winds of change and transform
the Group into a globally competitive organization of the highest quality and integrity.
Isao KanekoPresident

Global Advantage JAL GroupIn 1998 JAL presented its “Forging a stronger, More Dynamic JAL Group” as part of its midterm management planfor fiscal 1999 and 2001. We then immediately began restructuring the JAL group, and have since remainedsteadfast in following through with this plan. In light of the constant and rapid changes in our industry, however,even more foresight is needed, and we have therefore laid out the midterm management plan for fiscal 2000 and2002 as well. Subtitled “Realizing our Vision for Consolidated Management,” this plan includes long-rangestrategies and flexible tactics designed to reinforce our consolidated management. We will continue to do ourutmost to foster the success of these midterm plans.
Safety
CustomerServices
CorporateCitizenship
ShareholderValue
CorporateGovernance
Fundamental Priorities of
the JAL Group
The JAL Group operates with five basic goals in mind:strengthening safety management; delivering a variety of high-quality customer services; respecting our shareholders; fosteringcompany transparency and openness to society; and acting swiftlyand decisively on the Group’s behalf in response to any givensituation. The entire JAL Group focuses on these policies andworks to implement them through a spirit of mutual co-operation.
54

76
Disclosing information on operational safety via theInternetOperational safety is a core principle of the JAL group. It isimperative that safety efforts be made constantly, each and everyday. But safety measures alone are not enough, since there isalways the possibility of a brief lapse in such efforts, which couldquickly expose us to danger. As an ultimate safeguard, safety mustbe of paramount concern not only to those directly involved inflight operations, engineering/maintenance, cabin service, airportoperations, etc., but to every last member of the JAL Group,including our external service providers. Working together withthis issue in the foreground, we can help ensure the safety of everyflight.
In April 1999, in a bold step that expresses our commitment tosafety, JAL became the first of the world’s major airlines to discloseinformation regarding safety and daily operations on its Internetweb site. It is our wish to publicize the quality of our safetymanagement—of which we can be very proud—and our strenuousefforts to maintain and enhance it. Moreover, we believe that suchdisclosure will fortify the public’s trust in the JAL Group, and inthe process further the understanding of our shareholders. Wetherefore update each of the following types of information on atimely basis:
¡Safety information for customers (seatbelts, carry-onbaggage, the use of electronic devices, etc.)
¡Safety-related measures taken by each division anddepartment
¡Aircraft operations, including numbers of flights, numbers
of cancelled flights, returning flights, diverted landings atother airports, etc.
In addition, in order to facilitate the consolidation of Groupmanagement, each of our subsidiary carriers—JALways, Japan AsiaAirways, JAL Express, and Japan Trans Ocean Air—has begundisclosing safety information as of April 2000.
Role of the Engineering & Maintenance CompanyIn April 2000, as a means of ensuring passenger confidencethrough operational safety, JAL introduced an in-house companysystem for the Engineering & Maintenance Division. In order toensure that our aircraft are the safest in the world, the newEngineering & Maintenance Company relies on the combinedtechnologies and creativity of 5,000 highly skilled employees,including those in our group companies. Through their input, thecompany works to maintain and improve the quality of aircraft. Asa result, every model in our fleet has achieved the world’s leadingrecord for on-time departures and midair engine stalls, these beingtypical indices by which the quality of aircraft maintenance ismeasured.
In fiscal 2000, under guidance from aviation authorities inJapan and the US, we have placed new emphasis on safetyrevisions. We have decided to replace heat-insulating materials onthe wall surface of MD-11 aircraft, repair fuel tanks in 747s, andincorporate an enhanced ground proximity warning system(EGPWS). Along with our conventional training programs, we willsoon unveil a safety program that investigates human factor in thequality of maintenance operations.
Aircrew training projectsGiven its direct effect on the safety of air transportation, aircrewtraining is one of the most important tasks for any airline carrier.
Of course, JAL already enjoys a worldwide reputation as a safeand efficient operator of numerous large aircraft, and many of ourroutes are international. In establishing this reputation, we haveconsistently been a world leader in creating new training systems.
Our program includes extensive in-house training for pilotsand training for captains regarding the use of large aircraft. At JALwe take nothing—particularly operational safety—for granted.
According to a worldwide survey on aircraft accidents, over 70percent involve human error on the part of aircrew. To combatsuch error, we have developed Cockpit Resource Management(CRM), an innovative training program that helps crews improvetheir performance through teamwork. CRM aims to break thechains of human error that potentially lead to incident, or evenaccident.
Since the 1986 introduction of the CRM seminar and LOFThigh-efficiency simulation training, JAL has remained thoroughlycommitted to the evolution, improvement, and systematization ofthese programs. In 1999, we developed a specific set of guidelinesfor the CRM skills required of all crew members, and implementedthe training needed to meet these goals. Finally, because the CRMconcept must extend unilaterally to all staff members involved inaircraft operations, JAL has been working to introduce thisprogram in divisions not directly involved with flight operations.
Operational safety isour most important mission
Supreme Safety
JAL A B C D E F Average
Rate of on-schedule departures of major airlines in 1998(a measure of the integrity and quality of aircraft and maintenance services)
95
96
97
98
99
100(%)
JALOther airline companiesAverage
Aircraft type: B747-400Source: The Boeing Company

98
Introducing three in-house companiesBased on the midterm management plan for fiscal years1999–2001, the JAL Group introduced an in-house companysystem in April 2000. Under this system, the Passenger SalesDivision, Cargo Business Division, and Engineering &Maintenance Division are considered three independentcompanies. This gives us the means to clarify our managementplans, facilitate decision-making processes, achieve further costreductions, and shore up our group management.
The Passenger Sales Company—which comprises the HeadOffice Sales Planning Division and Branch Passenger SalesDivision—was introduced to clarify the balance of revenue andexpenses in passenger sales management, as well to examine aspectsof business accountability. Total passenger sales of the JAL Groupare controlled by the JAL Sales Network (JSN), founded inNovember 1999 as a holding company wholly owned by JAL, inorder to enhance our marketing strength. Because this network hasgreatly streamlined our marketing system, we are planning totransfer the Passenger Sales Company to JSN in April 2001, andthereby further enhance the efficiency of JAL Group management.
The Cargo Business Company takes full advantage of thecharacteristics of the cargo business as a self-contained industry. Assuch, it is structured to adapt easily to changes in the salesenvironment. We have been concentrating on cost-efficiency, themonitoring of revenue and expenses, and quality control in orderto maintain and enhance profitability.
The Engineering & Maintenance Company was established forthe purpose of pursuing further cost-competitiveness, whileretaining the greatest degree of operational safety. Our related
maintenance companies continue under the umbrella of this in-house company—together, we aim to improve the quality ofmaintenance and ensure the safety of aircraft for the entire group.
In addition, in April 1999 we established an AccountingCenter to handle the centralized management of accounting forcompanies within the JAL Group. We also established a TreasuryCenter in April 2000 to help rationalize Group financemanagement with particular emphasis on consolidated financialincome and expenditure. We are confident that these two centerswill further strengthen the JAL Group’s system of consolidatedmanagement.
New international partnershipsOne of the most important strategies for improved competitivenessand profits is to establish partnerships with other airlines.
Accordingly, JAL has a long history of business alliances. Infact, we have formed alliances with nineteen major overseas airlinesthrough code-share agreements for passenger and cargo flights, aswell as our frequent flyer program.
JAL established a framework for comprehensive alliance withAmerican Airlines (AA) in 1994. Since then, we have linked withAA for the frequent flyer program (FFP) and the computerreservation system (CRS). In 1999, we reached an agreementregarding code-sharing, and in May of this year, we inauguratedoperation for the Pacific route and its connecting domestic routes,both in Japan and the US. With the world’s largest network—comprising over 100 routes—we can offer our customers aremarkable variety of routes and flight schedules.
We also established a comprehensive alliance with British
Airways (BA) in January 1999, including shared code-share flights,and later, frequent flyer programs starting from June of that year.Plans are underway to expand this alliance into other fields,thereby ensuring long-term customer service.
Airlines throughout the world have recently begun to accruemultiple alliances, and sometimes these relationships far exceed thegoal of basic cooperation. In the last two years alone, severalEuropean airlines have established alliances with more than twoairlines. At JAL, we believe it is most important to maintain andexpand our current partnerships from the perspectives ofintermediate and long-term performance, in recognition of meritssuch as stronger competitiveness worldwide. As to whether weshould form a group with more than two airlines, we must firstconsider the continuation of benefits presently received throughour standing alliances.
Better customer service through e-businessJAL has also been active in the realm of e-business, a phenomenonwith huge potential to change future relations between companiesand their markets. As part of this effort, we have enhanced bothmarketing and public relations on our Internet homepage. In May1999, JALPAK, our operator of package tours, launched amembership system for the travel web site etravel, making itpossible for our customers to make online reservations and pay fortickets using their credit cards. In combination with NTTDoCoMo’s i-mode cellular phones, our popular JAL mobilereservation service lets the customer reserve a domestic flight, makea ticketless flight reservation, and check seat availability at anytime. In June 1999, we introduced JAL Online software for
business travelers who frequently take domestic flights. Thisconvenient package, which allows customers to handlereservations, ticketing, and payment simultaneously, has alreadybeen used by more than 1,000 corporate customers.
The JAL Group is endeavoring to transform itself into an e-business company under the title e-JAL. Through e-JAL we willincrease the efficiency and speed of information flow andoperations within the Group, as well as within and between itsindividual companies. In this way, we are already gaining areputation as a company excelling in the utilization of Internettechnologies.
Strengtheningour management system
Management Structure

1110
Envisioning total management: Incorporating fiveairlines into oneIn addition to Japan Airlines, The JAL Group incorporates fiveother airlines: Japan Asia Airways, JALways, JAL Express, JapanTrans Ocean Air, and J-Air. Each airline has its own uniquecharacteristics. Given the diversity of operations, however, it is notmaximally effective for each of the Group’s airlines to pursue itsown path to management efficiency. Instead, we need to establisha unified structure for the entire JAL Group, both to enhance thestrength of constituent members and to create a strong sense ofsolidarity. Ideally, each route will be operated by the most suitablegroup airline, and each airline will have the proper aircraft to meetcustomer needs and remain the first choice for air travel.Accordingly, we have taken the following steps toward anoptimized management system:
Japan Asia Airways (JAA) will secure a foundation of steadymanagement and pursue further reductions in operating costs,while continuing to offer flights between Japan and Taiwan. InOctober 1999, JALways (JAZ) took over theTokyo–Kona–Honolulu–Tokyo route from JAL, with a view toenhance cost-competitiveness. In April 2000, JAZ took over theGuam-Tokyo route and other routes linking Honolulu withregional airports in Japan. To further improve efficiency, JAZ willalso take over the Saipan-Tokyo and Fukuoka-Honolulu routes inOctober. Meanwhile, JAL Express (JEX) is planning to take over atotal of eight B737s from JAL during fiscal 2000, and to add moreB737s and begin operation of B767s in the near future. JapanTrans Ocean Air (JTA) serves as a hub for the JAL Group inOkinawa and has been gradually upgrading its B737-200 aircraft
to B737-400 models as a means of enhancing productivity. J-Airwill introduce two Bombardier CRJ-200s—small jets with fifty-seat capacities—in fiscal 2000, and in April 2001 J-Air will beginflight operations on long-distance routes with a high demand forthis type of aircraft or regional routes that can yield high profits byserving private passengers.
Cost reductionsThe JAL Group as a whole has continually striven to enhance itscost efficiency, and the results of its efforts have been steady. Wehave transferred routes to JALways and JAL Express, oursubsidiaries pursuing low-cost operations. In addition, we haveimplemented cost reductions in general expenses, personnelstreamlining, management consolidation, and productivityenhancement. In this way, we will continue the corporate strategiesestablished for the sake of customer safety, operating performance,and profitability. With respect to Japanese taxes and surcharges—which are relatively high compared to those of other nations—weand our colleagues have been working to promote more reasonablefees. We have already realized a 33% reduction in landing fees forthe second- and third-tier airports (fiscal 1999), marking the firststep toward greater competitiveness in the international market.
In addition, in order to minimize expenditures from the JALGroup and improve our consolidated cash flow, the entireorganization has been engaged in an exhaustive review of contractsand transaction prices with outside vendors.
In fiscal 1999, despite skyrocketing fuel prices, we succeeded inreducing the cost of transportation by 10 percent per unit versusthe level in fiscal 1997. This ambitious goal was originally
targeted for fiscal 2000.In its midterm management plan for fiscal years 2000–2002,
the JAL Group will work to enhance its competitiveness in termsof cost-efficiency. At the same time, we will play an active role inthe reduction of landing fees, fuel taxes, and other surcharges.Moreover, we will seek greater efficiency in sales operations byrestructuring our marketing system and reinforcing directmarketing. And finally, we will aim at increasing group profits byreducing our interest-bearing debt.
Emphasizing stockholder values and settingmanagement indexesThe JAL Group recognizes that strong management abilities mustbe reinforced by increasing attentiveness to and respect for ourstockholders. With a long-term goal of profit redistribution tostockholders, we will do our best to maintain earnings per share of¥10 or more and a return on assets of at least 2 percent. As anintermediate goal with respect to the achievement of these groupmanagement indexes, we have established an index on cash-flowreturn on investment, which measures investment efficiency perroute on a cash-flow basis, and will be maintaining this index at 10percent or higher.
A strong sense of solidarity
JAL Group
13
Seoul have been increased.JAL expanded its service network during the year in review,
thanks to code-share agreements with other airlines. JAL andAmerican Airlines inaugurated code-share service in May, and havesubsequently achieved a gradual increase in the number of routesand flights. In fact, as of the end of the fiscal year, we operated acombined weekly total of 1,137 flights (including 47 US domesticflights) on 78 routes. Moreover, JAL has signed a code-shareagreement with Cathay Pacific Airways to include the Hong Kongflights from Osaka and Nagoya. We have also inaugurated Zurich-to-Geneva and Amsterdam-to-Madrid flights through code sharingwith Swissair and Iberia, respectively. In all aspects of serviceoperations, we have endeavored to increase revenues through theexpansion of our worldwide service network in the global market.
OutlookIn May 2000, as part of the e-JAL promotion effort on behalf ofWeb-based operations, JAL introduced e-Ticket Service for fast,convenient ticketless travel on international flights. This newservice has been an unqualified success. JAL is the first Japaneseairline to offer ticketless service, which takes information normallyprinted on a paper ticket, such as the date of departure, flight
number, and airfare, and stores it digitally in the JAL computersystem instead. With e-Ticket, the customer is spared therequirement of receiving tickets in advance or present tickets at thecheck-in counter. And itinerary changes can be made simply, withjust a phone call.
Efficiency of flight operations is being enhanced by changingthe numbers of JAL flights in accordance with seasonal fluctuationsin profitability and demand. For example, we will enhance theversatility of our services by changing the number of Tokyo-to-Zurich and Osaka-to-Seoul flights to four and fourteen,respectively. Further, JALways (JAZ)—the Group’s fifth airlinesubsidiary—will take over the operation of short-range flights toPacific resort destinations in order to achieve greater internationalcompetitiveness. Flights to Guam from Tokyo, Osaka and Nagoya,as well as those to Honolulu from other regional airportsthroughout Japan, were turned over to JALways beginning in April2000. Operation of the Saipan routes from Tokyo and Osaka,along with the Fukuoka-to-Honolulu routes, will be transferredbeginning in October. JAL is actively engaged in these transfers tosubsidiary airlines and will continue to investigate new means ofachieving smooth, seamless flight operations.
12
Results: Year Ended March 31, 2000Concern over the Y2K computer problem did produce a temporarydrop in passenger demand over the year-end and New Year’sholiday season. Nevertheless, JAL enjoyed steady growth in itsshort-range flights to Korea, Guam, Saipan, and China. As forseating demand, the First Class category continued its sluggishtrend, and the overall demand for Executive Class was also low,despite signs of improvement toward the end of the fiscal year.
The Economy Class performed well, however, leading to a totalof 13.9 million JAL passengers on a consolidated basis during theperiod in review. There was a decrease in unit revenue due toreduced passenger numbers in First Class and Executive, but ofcourse this was a direct result of slow demand in the businesssector. In addition, there was also a decline in the value of revenuesdue to the rising yen. Nonetheless, non-consolidated revenuesremained on a par with the previous year, standing at ¥580,057million, with consolidated revenues amounting to ¥610,928million.
Highlights of the YearJAL has further enhanced its Goku Series, expanding the range ofofficial discount fares in response to increased preference forindividual travel over group tour packages. As a part of this
initiative, JAL has launched its Special Goku service by issuingMother’s Day Goku, Father’s Day Goku, and Family Goku 28discount tickets. To round out the series, we have added MaeuriGoku 35 and Maeuri Goku 21 advance-purchase discount tickets,which can be purchased one week later than other advance-purchase discount fares. This will further encourage passengerdemand and increase our competitiveness in the global market.
As part of our promotional effort, we have launched the JALLas Vegas campaign and a number of other sales programs in orderto stimulate demand among leisure travelers. And in May 1999, aJAL Group company made etravel available to the public, on acomprehensive membership website that allows users to makereservations and purchase tickets, goods, and other services on-line.Transaction settlement is fast and easy, using the customer’s creditcard.
JAL has also expanded its service selection by adding newroutes and flights. In April, we inaugurated service between Nagoyaand Guam, and in May we began service between Osaka andChicago.
We also increased the number of flights covering Tokyo toDallas and Las Vegas, and in November we added service betweenTokyo and São Paulo via New York. Finally, the numbers of JALflights from Tokyo to Manila, Tokyo to Bangkok, and Osaka to
Review of Operations
Passenger Operations International
Japan Airlines, in its ongoing effort to become the preferred international carrier for more customers, is increasing its number of flights,adding new routes, and expanding its code-share agreements with other airlines. Moreover, we are actively promoting severalpromotional programs, notably the new Reso’cha campaign. To encourage even greater passenger demand, by July 2001 JAL willintroduce ten new Boeing 747-400s, a next-generation jumbo jet distinguished by an impressive range of in-flight entertainmentfeatures. Further, to achieve steady cost reductions, we are expediting the transfer of a number of flight operations to one of our low costsubsidiary airlines, JALways.
Introducing a New Reso’cha Design on JAL AircraftThe Reso’cha Service, a resort service brand launched in 1994 for Pacific Rim routes, has enjoyed continuallyincreasing popularity, thanks to services that create a pleasant “resort” atmosphere. Beginning in April 2000,as part of an effort to increase revenues, our aircraft donned a new design rich in the color and excitement ofa South Pacific summer. New Reso’cha services were also introduced, including many outstandingentertainment features.
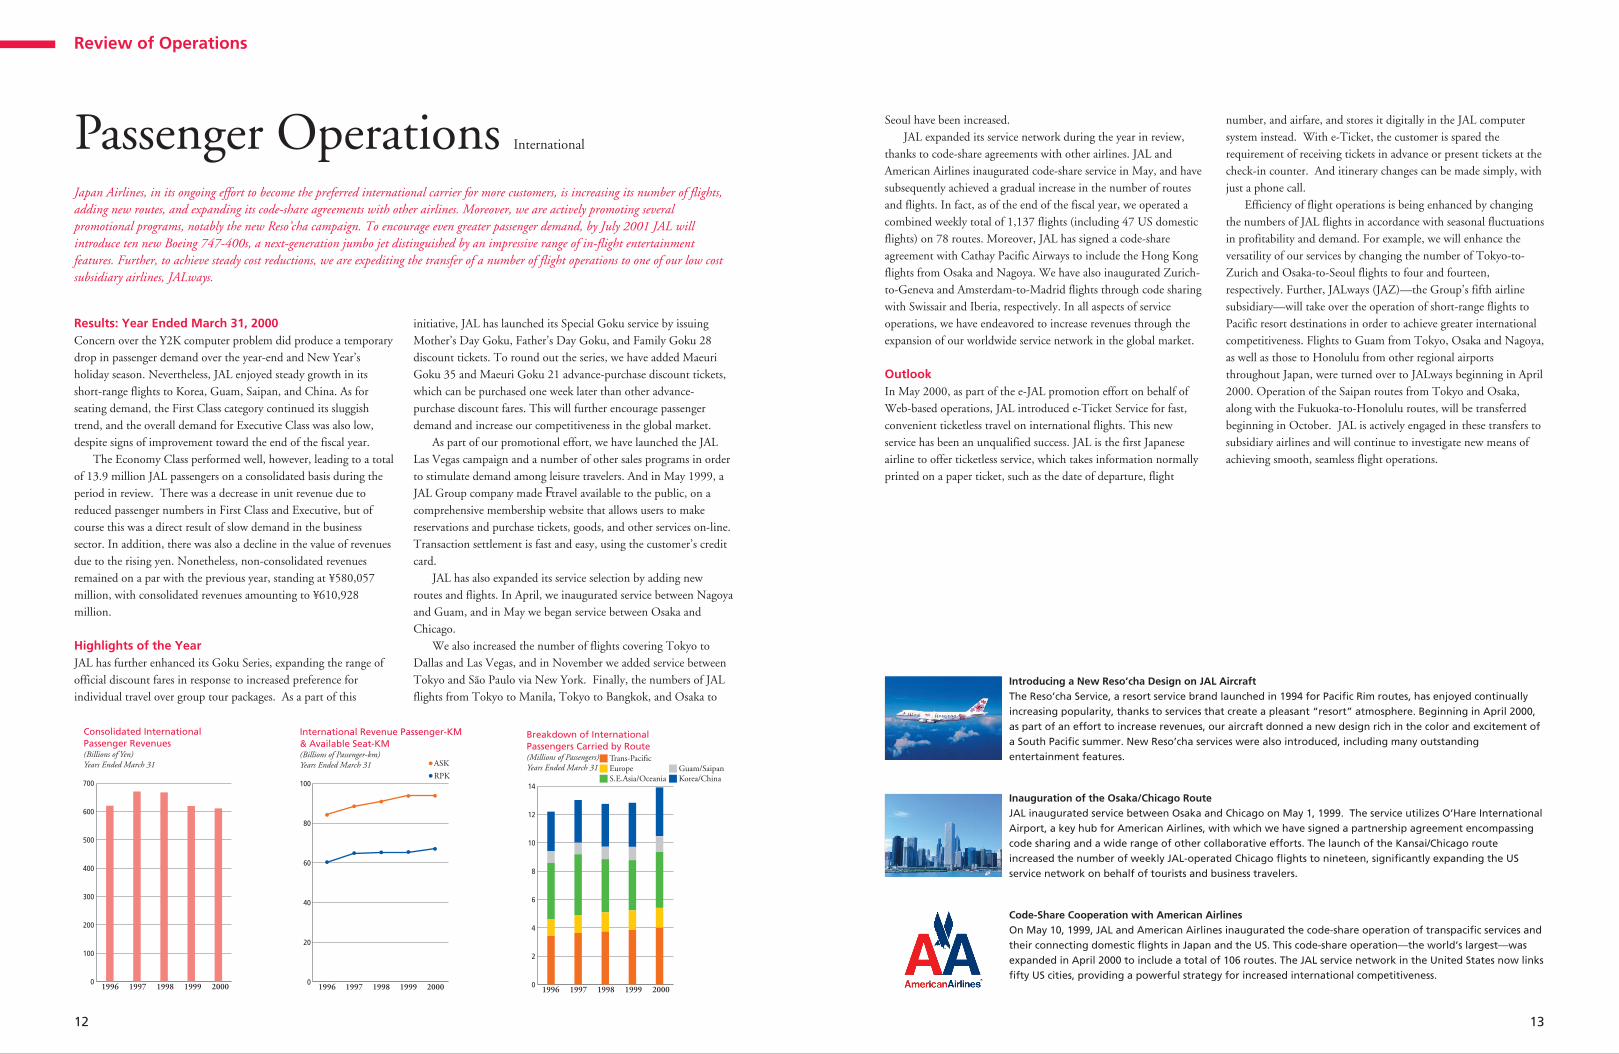
Inauguration of the Osaka/Chicago RouteJAL inaugurated service between Osaka and Chicago on May 1, 1999. The service utilizes O’Hare InternationalAirport, a key hub for American Airlines, with which we have signed a partnership agreement encompassingcode sharing and a wide range of other collaborative efforts. The launch of the Kansai/Chicago routeincreased the number of weekly JAL-operated Chicago flights to nineteen, significantly expanding the USservice network on behalf of tourists and business travelers.
Code-Share Cooperation with American AirlinesOn May 10, 1999, JAL and American Airlines inaugurated the code-share operation of transpacific services andtheir connecting domestic flights in Japan and the US. This code-share operation—the world’s largest—wasexpanded in April 2000 to include a total of 106 routes. The JAL service network in the United States now linksfifty US cities, providing a powerful strategy for increased international competitiveness.
1996 1997 1998 1999 2000
Consolidated International Passenger Revenues(Billions of Yen)Years Ended March 31
0
100
200
300
400
500
600
700
1996 1997 1998 1999 2000
ASK
RPK
International Revenue Passenger-KM & Available Seat-KM (Billions of Passenger-km)Years Ended March 31
0
20
40
60
80
100
EuropeTrans-Pacific
S.E.Asia/OceaniaGuam/SaipanKorea/China
1996 1997 1998 1999 2000
Breakdown of InternationalPassengers Carried by Route (Millions of Passengers)Years Ended March 31
0
2
4
6
8
10
12
14

15
commuting public. The various mileage campaigns implementedby JAL Mileage Bank also have great public appeal. An excellentexample is JAL’s convenient frequent-flyer program, which isattracting an increasing number of customers through its easymileage accumulation and other benefits.
OutlookWith respect to competitiveness in the domestic market—a top-priority goal of JAL—the March 2000 opening of HanedaAirport’s new Runway B is an exciting development. Built 380meters from its predecessor, the new Runway B is 2,500 meterslong and 60 meters wide, and features a parallel taxiway. Thisaddition allowed Haneda airport to increase its takeoff and landingslots as of July 1, and it allowed JAL to add one more daily round-
trip flight to each of its nine routes. The number of flights on theroutes to Nagasaki, Akita, Matsuyama, Komatsu, Miyazaki, andHiroshima has thus been increased from two to three. Flights havealso been added on the high-demand routes to Itami, Kansai, andKagoshima. These increases give JAL a broad array of departureand arrival times, and will greatly enhance our competitive edge.
Further cost reductions will be achieved through JAL’s transferof additional regional-airport domestic flights to JAL Express(JEX).
The previous transfer of route operations from JAL to JEX atthe end of fiscal 1999 resulted in significant improvements in bothincome and expenses. In response, all eight of our B737s will betransferred by the end of fiscal 2000, and further deployments ofB737s and early transfers of B767s are being considered.
14
Results: Year Ended March 31, 2000Domestic air flights enjoyed steady growth in demand, especiallywith regard to trunk routes. This is a result of our active effort insales promotion and airfare pricing to gain a winning edge overcompetitors and newly established airlines, not to mention othertransportation providers. On a consolidated basis, domesticpassenger volume totaled 23.3 million and domestic passengerrevenues amounted to ¥309,531 million.
Highlights of the YearAfter being granted permission, in April 1999, to increase thefrequency of flights at Kansai Airport, JAL added flights to theroutes from Kansai to Haneda, Okinawa, and Sapporo. Beginningin July, we also began offering more flights on theNagoya/Kagoshima routes. With the objective of building demandthroughout the business market, we have enhanced the service ofour routes and flights by phasing in more flights on theNagoya–Fukuoka route. This year, we also began year-roundoperation of the Fukushima-to-Sapporo service inaugurated theprevious year. At the same time, to realize greater efficiency in our
route operations, we have deployed smaller aircraft on routesconnecting regional cities. And we have gradually transferred theresponsibility for certain flights to one of our low-cost subsidiaries,JAL Express.
In order to pass savings due to lower airport fees on tocustomers, JAL has lowered its normal fares for all routes exceptTokyo-Osaka.
In addition, by expanding the range of Tokuuri Kippudiscount tickets for limited flights—primarily for theNagoya–Fukuoka route—and dramatically enhancing the range ofSuper Tokuuri round-trip limited-flight discount tickets for ourTokyo–Fukuoka and Tokyo–Sapporo routes, we have introduced arange of fares that challenge the increasingly fierce competition inour market. These measures allow us to gain a competitive edgenot only over other carriers, but also over other providers oftransportation.
In June 1999, JAL launched its nationwide JAL Online service,a privilege system for domestic business travelers. Providing accessfor corporate customers via their personal computers, JAL Onlineoffers considerably greater convenience for this segment of the
Review of Operations
Passenger Operations Domestic
No Japanese airline can avoid the emerging issue of increased competition, which has been carried forward in an atmosphere ofderegulation and the entry of new carriers. Accordingly, JAL has been working to increase passenger demand by offering its customers awider choice of services and airfares. Especially popular among these offerings is e-Discount. Launched on the Internet as Japan’s firston-line airfare service, e-Discount offers fares at discounts of up to 29 percent. At the same time, JAL is working to build revenuesthrough a number of promotional campaigns launched by the JAL Mileage Bank, which boasts Japan’s largest frequent-flyer program,with nearly 7 million members as of April 2000.
The Gray Jumbo Jet: Celebrating Hakodate–Haneda’s 10th AnniversaryJAL’s Hakodate–Haneda route celebrated its 10th anniversary in July 1999. To commemorate this milestone,JAL launched a tie-up campaign in co-operation with Gray, a popular musical group from Hakodate.Highlights included a band tour aboard the “Gray Jumbo,” a tour plane decorated with images of the bandmembers. The campaign attracted throngs of new customers and was considered a great success.
JMB Membership Reaches Seven MillionMembership in the JAL Mileage Bank (JMB) reached seven million in March 1, 2000. As the frequent-flyerprogram boasting the largest number of members in Japan, JMB runs a variety of campaigns. We willcontinue to improve service for JMB members, enhance our already high customer trust and brandrecognition, and increase revenue through the development and implementation of JMB programs.
JAL Supports the Kyushu–Okinawa SummitIn July 2000, numerous state leaders and VIPs from the G8 nations visited Japan aboard special planes or onJAL scheduled flights to attend a series of summit meetings. Japan Airlines and its group companies offeredtheir assistance—including comprehensive airport services for the special VIP planes—and did their utmost toensure the success of the event.
Introducing e-Discount, Japan’s First Web-Based Domestic Airfare ServiceThe revision of the Aviation Act of Japan has facilitated the introduction of many new fares for JAL. Includedin this offering is the new e-Discount service, providing discounts of up to 29 percent for reservations madethrough the Internet, JAL Online or i-mode via mobile devices. With e-Discount, the reduced fares are appliedto all JAL routes and flights, even when reservations are made on the date of departure. Because of theconvenience and savings it offers, e-Discount is stirring great enthusiasm in the public.
1996 1997 1998 1999 2000
Consolidated Domestic Passenger Revenues(Billions of Yen)Years Ended March 31
0
50
100
150
200
250
300
350
1996 1997 1998 1999 2000
ASK
RPK
Domestic Revenue Passenger-KM & Available Seat-KM (Billions of Passenger-km)Years Ended March 31
0
5
10
15
20
25
30
1996 1997 1998 1999 2000
JTAJAL
JEX
Domestic Passenger Numbers for JAL, JEX, JTA and J-Air(Millions of Passenger-km)Years Ended March 31
0
5
10
15
20
25

16 17
Results: Year Ended March 31, 2000The year ended March 31, 2000 saw favorable growth in outboundinternational cargo demand, as well as continued growth ininternational cargo volumes dispatched from overseas locations.
This was particularly true in the case of US-bound shipmentsfrom Southeast Asia, although the demand for shipments from theUS weakened. Thus, while consolidated international cargo volumecame to 4,394.48 million ton-kilometers, revenues amounted to¥151,163 million, or a level similar to that of the previous year.This was due to a decline in the value of income from internationalcargo dispatches, brought on by the strengthening of the yen.
As for domestic cargo demand, although general cargo showeda sluggish trend, courier service cargo maintained steady growth,with shipments of fresh produce slightly exceeding the level of theprevious year. All in all, the consolidated domestic cargo volumewas 279.09 million ton-kilometers with revenues amounting to¥28,826 million, up 3 percent from the previous year.
Highlights of the YearContemporary demand calls for a comprehensive transportationsystem from material procurement through consumer delivery, andaccordingly, fiscal year 1999/2000 saw a trend towardreorganization in the logistics industry. JAL’s Cargo Company,newly established as an in-house company, has been working todevelop new services that will enable timely, priority transportationin conjunction with a new system for tracking late-breakinginformation. Together, these services will assist customers in theirefforts on behalf of market globalization and optimized localproduction/delivery.
JAL has also endeavored to enhance transportation capacity inresponse to increased demand, thereby improving route operations.In April 1999 we resumed the operation of freighters to Atlanta,and began the weekly scheduled service of three freighter flightsfrom Narita to Seoul. As part of our effort to enhance the qualityof our cargo transportation services, we earned ISO 9001
certification for export operations at the Narita Cargo District infiscal 1998. Furthermore, during the fiscal year in review, wereceived ISO 9001 certification for import/transit shed operations,domestic cargo operations, and consigned export operations.
Our recent promotional effort on behalf of domestic cargooperations included the operation of special freighter flights tomeet growing demand from the courier service industry. We alsoidentified an increase in airfreight demand, which was broughtabout through increased handling of products having shorter lifecycles.
OutlookGiven the trend among shippers toward inventory-lessmanagement and optimized local production, many products willbe allowed shorter life cycles. Thus, it is expected that the demandamong shippers for supply-chain management and e-commerce willaccelerate rapidly. Therefore, beginning in April 2000, we launcheda series of freight-service products. Notable among them is TimeDefinite, which ensures cargo delivery at a precisely scheduled time.
In addition, J Speed (now upgraded) and J Freight are availableas freighter services, combining a loading guarantee and priorityexpress service. The J Special service offers quality transportationfor sensitive cargo such as art pieces and precision machinery, withall the special handling such objects require. These cargo-transportproducts are available through our global network of 25 locations.
The JAL Cargo Tracker Report (JTR)—the industry’s firstsystem featuring automatic e-mail transmission—gives ourcustomers the latest information in the tracking of cargoshipments.
JAL is working to expand its worldwide freighter network, and tothat end we have obtained a code-share agreement on cargo-freighterservice with Northwest Airlines. On September 1, 2000, we willinaugurate the code-share operation of transpacific freighter flights toand from Japan, as well as block cooperation regarding cargo spaceon freighter services between Japan and destinations in Asia.
Air Transport Related Business (“other” segment)To establish a system of consolidated management as defined inthe “Consolidated Management Vision for a Strong and HealthyJAL Group,” we are working to achieve more efficient businessoperations and thus improve our general management capabilities.Specific efforts include the reduction of interest-bearing liabilitiesand improvement of the company’s record of financial income andexpenditure. Accordingly, given the Group’s management policy ofconcentrating operational resources into air-transport operations,JAL Leasing Co., Ltd. and JAL Finance Corporation—oursubsidiaries in financial services—are fronting the initiative toreduce assets not directly linked to operations of the JAL Group, aswell as interest-bearing liabilities.
Travel ServicesDespite a temporary decrease in passenger volume during the year-end and New Year’s holiday season—mainly due to concern overthe Y2K computer problem—the aggregate traveler volumehandled by JALPAK Co., Ltd. increased 6% from the previousyear, indicating steady growth in demand. Accordingly, revenuesgrew 3.7% to ¥350,160 million, while operating income increased¥2,730 million to ¥2,460 million.
JALPAK launched etravel in May of 1999 as a comprehensivemembership Web site that could provide travel information via theWorld Wide Web. This service allows Internet users to getinformation on air tickets, hotels, overseas package tours and other
travel-related topics. Registered members can also make onlinereservations and purchases using their credit cards. Our direct-marketing effort has served to increase demand, boosting ourprofitability. We will continue our e-business promotion effortswith regard to Web-based operations, ensuring a prompt responseto increasingly sophisticated market needs.
Hotel and Resort OperationsIn April of 2000, JAL Hotels Co., Ltd., operator of the world-renowned Nikko Hotels International chain, entered a strategicagreement on business alliance with Le Meridien Hotels &Resorts, an affiliate of the Forte Hotel Group of Britain, regardingthe 22 overseas hotels throughout its network of 44 locations,excluding those in Japan. This collaborative enterprise has thuscreated a global network of nearly 145 hotels in 60 countriesworldwide. We have also sold the Ihilani Hotel in Hawaii,promoting the restructuring of our hotel and resort operations.
These moves resulted in a revenue decrease of 28.7%, to¥40,961 million. Nevertheless, our effort to achieve cost reductionsand enhance profitability has produced operating income of¥1,733 million, a jump of 6% relativeto the previous year. Given thissuccess, we will focus on the merits ofconsigned operations to furtherimprove our profit potential andversatility of operations.
Review of Operations Review of Operations
Cargo OperationsTo meet the emerging needs of supply-chain management and e-commerce, JAL internally spun off its cargo operation and launched thein-house Cargo Company, under whose direct supervision the Cargo Sales Company and Narita Cargo Office were established. Thisallows us to offer reliable solutions for diverse shipper needs, thereby capturing a share of the growing market while maintaining andexpanding our alliances with other carriers. In this way, JAL is reorganizing its domestic sales operations to accommodate regional needs,and is striving to increase operating revenues by way of an enhanced sales force.
Other OperationsAs part of our plan to optimize efficiency and enhance profitability on behalf of the entire Group, we are directing our efforts towardcollaborative operations in which all Group airlines work as one. Toward this end, we have established the JAL Sales Network Co.,Ltd. (founded November, 1999) and given it responsibility for group-wide passenger sales operations. With regard to hotels and resorts,in-flight meal catering, trading and logistics, information systems and temporary staffing, we are enhancing each business segment bycombining companies engaged in the same business. This effort even includes our core companies, in order that every aspect of operationsmight benefit. In so doing we are furthering our long-term strategies and implementing a variety of adaptive tactics.
New International Cargo-Freighter Products Employ Information TechnologyThe Cargo Company, a JAL in-house company, launched three new cargo-freighter services in April 2000: JSpeed, J Freight, and J Special. Accordingly, JAL is extending its quality cargo-transport services throughout aworldwide network of 25 locations. Our JTR Cargo Tracker Report, a significant customer benefit, employs thelatest information-management technology for the tracking and tracing of shipments.
DomesticInternational
199819971996 1999 2000
Consolidated Cargo Revenues (Billions of Yen)Years Ended March 31
0
50
100
150
200

JAL Route NetworkJapan Airlines Company, Ltd., and affiliated companiesAugust 31, 2000
International Routes Domestic Routes
Above cities include code-sharing destinations with these airline companies.
Obihiro
Memanbetsu
Sapporo
Hakodate
Sendai
Akita
Kochi
Nagasaki
Miyazaki
Naha
Yamagata
Fukushima
Tokyo
NaritaNagoya
Komatsu
Kansai Itami
Matsuyama
Hiroshima
Oita
Fukuoka
Kumamoto
Kagoshima
Miyako
Ishigaki
Yonaguni
Okayama
Kume
Hanamaki
Niigata
Nanki-Shirahama
TottoriIzumo
Aguni
Yoron
Kita Daito
Minami Daito
Amami
Kerama
TaramaHateruma
London
Madrid
Barcelona
Paris
RomeMilan
Amsterdam
Frankfurt
ZurichMunich
Istanbul Beijing
Seoul
PusanShanghai
Delhi TaipeiHong Kong Kaohsiung
TokyoMemanbetsu
Sapporo
Obihiro
Hakodate
Akita
Yamagata
Sendai
Fukushima
Niigata
Komatsu
Nagoya
OsakaMatsuyama
Kochi
Hiroshima
Fukuoka
Oita
Kumamoto
Nagasaki
Miyazaki
Kagoshima
Okinawa (Naha)
Manila Saipan
Honolulu
Fairbanks
Anchorage
VancouverSeattle
San FranciscoLas Vegas
Denver
Los Angeles
Mexico City
AtlantaOrlando
MiamiHouston
Dallas
São Paulo
New YorkBoston
St. LouisPhiladelphia
Washington
ChicagoDetroit
Minneapolis
Kona (Hawaii)
Cairns
New Caledonia(Noumea)
Brisbane
Auckland
Christchurch
Sydney
GuamBangkok
Ho Chi Minh City
PenangKuala Lumpur
Singapore
Jakarta
Denpasar
MoscowGothenburg
Geneva
TianjinDalian
Qingdao
Copenhagen
Stockholm
Berlin
San Juan
Air FranceAir New ZealandAlitalia AirlinesAmerican AirlinesBritish AirwaysCanadian Airlines
Cathay Pacific AirwaysIberia AirlinesJapan Air SystemLufthansa Cargo AGMalaysian Airlines SystemQuantas Airways
Scandinavian Airlines SystemSingapore AirlinesSwissairThai Airways InternationalTHY Turkish AirlinesVietnam Airlines
1918

21
Contents
Management’s Review and Analysis of Financial Position .......................................... 22Consolidated Balance Sheets ...................................................................................... 26Consolidated Statements of Operations ...................................................................... 28Consolidated Statements of Stockholders’ Equity ...................................................... 29Consolidated Statements of Cash Flows...................................................................... 30Notes to Consolidated Financial Statements .............................................................. 31Report of Certified Public Accountants ...................................................................... 41Non-Consolidated Balance Sheets .............................................................................. 42Non-Consolidated Statements of Operations.............................................................. 44Non-Consolidated Statements of Stockholders’ Equity .............................................. 45Notes to Non-Consolidated Financial Statements ...................................................... 46Report of Certified Public Accountants ...................................................................... 49
Financial Section
20
Our mission at JAL is to enhance profitability through “safety first”transportation services, and thereby to channel those profits back toour loyal shareholders. Such a mission, however, is dependent onmore than the prioritization of economic efficiency and return oninvestment. We are also involved in a variety of social causes, in thebelief that good corporate citizenship is an essential part of acorporation’s ultimate value. Accordingly, our social activities aredevoted to causes around the globe. We offer synergistic supportfor local communities, promoting artistic and cultural activitiesalong with international cooperative exchange. We also providedisaster rescue assistance and work for protection of the globalenvironment.
Social Activities Tied in with the Airline BusinessThe program known as Fureai no Tsubasa, or “Wings ofFriendship”—a self-guided effort by the JAL Group—waslaunched in 1988 based on a call from our employees to express thecorporate ideal of “gratitude to the customer” in an appreciableform. Now in its thirteenth year, this philanthropic program issupported by monetary contributions and volunteer services fromGroup employees. Wings of Friendship gathers children fromorphanages and institutions for the handicapped from the cities weserve regionally, and brings them to Tokyo for a vacation duringtheir spring break. The 2000 event, for example, enabled 98children from twenty cities in Japan to enjoy a sightseeing trip inTokyo and to experience the wonder of flight in a high-techsimulator. The Wings of Friendship philosophy is gainingwidespread acceptance throughout the JAL Group, as evidenced bythe Wings of Friendship/Nagoya program, in which handicappedand orphaned children from Nagoya are invited to Hokkaido forfun in the snow.
JAL solicits UNICEF donations during flights on itsTokyo–New York route as part of the Change for Good program.We also collect foreign coins for UNICEF and sell UNICEF cards.For the volunteer Association of Medical Doctors of Asia, we offersupport on behalf of emergency rescue activities. In this effort, wehave helped transport materials and medical personnel to assistrefugees in East Timor and victims of a cyclone disaster in India.
Service is always the byword on JAL flights, and this is reflectedin our commitment to passengers having special needs. We treatthem as priority guests, as part of a policy covering persons who arephysically challenged, ill, or elderly. Pregnant women and othertravelers requiring special attention also benefit through ourattention to personal service.
Environmental Protection ProgramsFlight safety is of course our primary concern, and in that regard,preservation of the global environment has been upheld as a corecommitment of management. Since 1990, JAL’s EnvironmentalCommittee, which is comprised of company directors, has heldregular meetings covering key topics in the realm of resourcemanagement and preservation. Our Fundamental Environmental
Philosophy was announced in 1998, and the JAL Group GlobalEnvironmental Conference was formed in July 1999. Theseinitiatives are key parts of the Group’s effort to promoteenvironmental programs. The promotion and assistance ofagencies with similar goals is also important. In 1993, for example,JAL installed Automatic Air Sampling Devices on aircraft on itsJapan-Australia route, and has ever since been helping the JapanMeteorological Agency monitor greenhouse gas levels in the upperatmosphere.
Key environmental activities during the year in review includethe following:
¡The 1998 Environmental Report detailing the JAL Group’senvironmental protection programs was published, and sinceDecember of the following year it has been posted insummary on JAL’s web site.
¡To prevent global warming, air-transport operators muststrive to reduce the level of carbon dioxide emissionsgenerated through fuel consumption. Accordingly, duringthe current fiscal year JAL has worked to achieve greater fuelefficiency by introducing three B 747-400s, two B 777-300s,and other fuel-efficient aircraft.
¡JAL has continued implementing programs in a widespectrum of fields, devoting its efforts to the prevention ofair pollution, protection of the ozone layer, reduction ofaircraft noise, wastewater treatment and recycling, reductionof industrial waste, resource conservation, and recycling.
Corporate Citizenship
To give a face to our social contributions, every JAL-owned aircraft bears theUNICEF emblem. We also support UNICEF through in-flight sales ofUNICEF cards, in-flight UNICEF fundraising campaigns, and UNICEFfundraisers in foreign currencies.
The Wings for Communication program, started thirteen years ago, is one ofthe JAL Group’s social contributions on the JAL corporate ideal: Gratitude toour Customers. Under the program, children with physical and mentalchallenges are invited to other parts of Japan on recreational outings. Forexample, children from special schools in Nagoya are regularly invited toHokkaido.
23
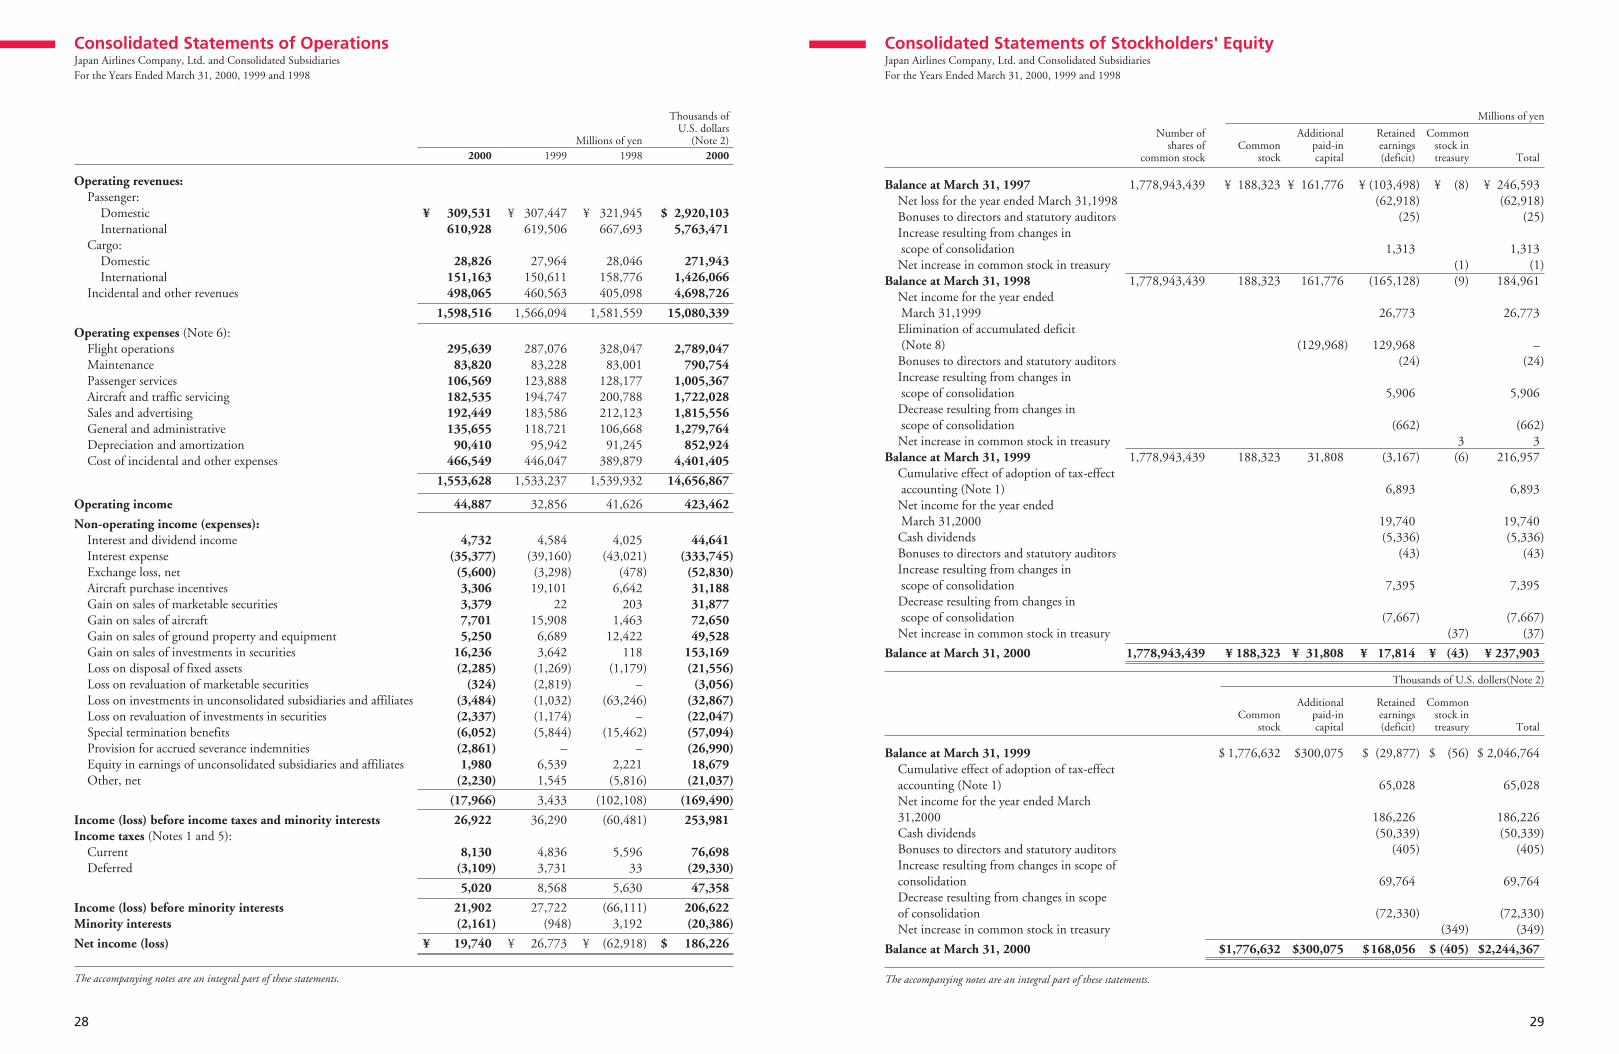
Operating and net incomeOperating expenses were virtually the same as the previous term at¥1,553,628 million. Although fuel prices rose due to higher pricesfor petroleum, expenses in the aircraft and traffic servicing and thesales and advertising categories decreased. This is a reflection of aconcerted cost-containment program. As a result, operatingincome showed a 36.6 percent increase over the previous term, to¥44,887 million.
Due primarily to a decrease in non-operating income, incomebefore income taxes and minority interests showed a ¥9,367million (25.8 percent) decrease from the previous term, to ¥26,922million, and net income decreased by ¥7,032 million (26.3percent) from the previous term, to ¥19,740 million.
PERSONNEL COMPOSITION BY LABOR UNION (JAL ONLY)March 31, 2000
Union Employees Number of Members
Japan Airlines Workers’ Union Ground Staff, cabin crew 11,353
Japan Airlines Cabin Attendants’ Union Cabin crew 1,095
Japan Airlines Flight Crew Union Cockpit crew 1,278
Japan Airlines Captain Association Captains 1,034
Japan Airlines Labor Union Ground staff 269
Japan Airlines Senior Flight Engineer Union Senior flight engineers 85
Total 15,114
Note: These figures exclude union members who are employed by Japan Asia Airways Co., Ltd.
EMPLOYEE STATISTICS FOR JAPAN AIRLINESAND CONSOLIDATED SUBSIDIARIESMarch 31, 2000
Operations by Business Segment Number of Employees
Air-Transport 21,274
Air Transport Related Business(“other” segment) 17,729
Travel Services 3,516
Hotel and Resort Operations 3,138
Total 45,657
Note: These figures represent employees in the actualworkforce.
1996 1997 1998 1999 2000
Consolidated Costs of Flying Operations(Billions of Yen)Years Ended March 31
0
100
200
300
400
1996 1997 1998 1999 2000
Consolidated OperatingIncome(Billions of Yen)Years Ended March 31
0
10
20
30
40
50
1996 1997 1998 1999 2000
Consolidated Net Income (Loss)(Billions of Yen)Years Ended March 31
-75
-60
-45
-30
-15
0
15
30
22
Operating revenuesConsolidated operating revenues increased 2.1 percent from theprevious term to ¥1,598,516 million. Passenger revenues accountedfor ¥920,459 million, cargo revenues for ¥179,989 million, andincidental and other revenues for ¥498,065 million.
International passenger revenues were virtually unchanged at¥610,928 million. Revenue passenger kilometers climbed by 6.1percent to 69,495.33 million, while the number of internationalpassengers carried rose to 13.9 million. However, these increases inpassengers carried were not directly reflected in increased revenue,mainly due to the strong yen and heavy concentration of growthamong economy class passengers.
Domestic passenger revenues were ¥309,531 million. Revenuepassenger kilometers reached 18,983.20 million, while the numberof domestic passengers rose 3.0 percent to 23.33 million. Theserises were the results of efforts to compete aggressively in both
marketing and price with new and existing airlines, as well as withother forms of transportation.
International cargo revenues showed little change, reaching¥151,163 million. In spite of a 10.8 percent increase in revernuecargo-ton kilometers and favorable growth in routes fromSoutheast Asia to North America, among others, the strong yen cutinto revenues.
Domestic cargo revenues increased 3.1 percent, to ¥28,826million. While general cargo was stagnant, home delivery cargoand fresh cargo both increased.
Incidental and other revenues reached ¥498,065 million. Thiswas due primarily to a 6.3percent increase in JALPAK customersand a 3.7percent increase in travel services segment revenues to¥350,160 million.
PERSONNEL (JAL ONLY)March 31, 2000
Ground Staff 9,013
Cockpit Crew 2,694
Cabin Crew 6,828
Total 18,535
Note: These figures exclude directors who have concurrent employeeresponsibilities, personnel dispached to other companies (2,365) andemployees on leave (676).
JAL FLEETMarch 31, 2000Type of Aircraft
Boeing 747-400
Boeing 747LR
Boeing 747SR
Boeing 747F
Boeing 767
Boeing 737
Boeing 777
Douglas MD-11
Douglas DC-10
Total
Owned
31
11
6
0
10
1
4
2
8
73
Leased
8
6
0
4
11
3
6
8
0
46
Total
39
17
6
4
21
4
10
10
8
119
Capacity
266-568 seats
341-468 seats
533-563 seats
115 tons
213-270 seats
150 seats
389-470 seats
233-300 seats
266-318 seats
Management’s Review and Analysis of Financial PositionJapan Airlines Company, Ltd. and Consolidated SubsidiariesFiscal Years Ended March 31, 1999 and 2000
1996 1997 1998 1999 2000
Consolidated OperatingRevenues(Billions of Yen)Years Ended March 31
0
500
1000
1500
2000
25
A first in the Japanese airline industryJAL presents J-Banks, a comprehensive and strategicfinancial system.In April 2000, our Treasury Center, designed for centralizedGroup finance management, began full-fledged operation. Thisimportant launch was set forth in our midterm management planfor fiscal years 2000–2002, entitled "Vision of Regeneration for aStrong and Healthy JAL Group." The Treasury Center representsa major step toward establishing a consolidated managementsystem and increasing the efficiency of our consolidated financemanagement.
Since April 1999, JAL has been operating an AccountingCenter intended to speed up consolidated settlement of accountsand to improve the efficiency of all group tasks related toaccounting.
The Treasury Center, on the other hand, has been establishedto reduce our interest-bearing debt, improve financial balance,decrease transaction costs, and improve the effectiveness of theGroup’s cash flow management.
The Treasury Center operates using J-Banks, a new in-housebanking system that manages Group company payments as well asfinancial accommodations among Group companies on aconsolidated basis. The system was jointly developed over one yearby our information systems subsidiary JAL InformationTechnology Co., Ltd., and the Sanwa Bank Group. This is the firstcomprehensive and strategic financial system in the Japanese airlineindustry to enable reduced interest-bearing debt, improved Groupprofit, and decreased transaction costs.
Participating subsidiaries are connected to the system by eitherthe Intranet or Internet. The system performs the following fourfunctions.
1. Financial accommodation among Group companies2. Provision of a payment agent3. Offset accounting among Group companies4. Financing and management of Group funds
In addition to Sanwa Bank, which developed the multibankcompatible system, ten other banks, including the Industrial Bankof Japan, Dai-ichi Kangyo Bank, Bank of Tokyo-Mitsubishi, andSumitomo Bank, cooperated in the system’s development.
According to the goals of the midterm management plan,implementation of the system will enable reduction of about ¥50billion of ¥350 billion in interest-bearing debt and improve theannual financial income and expenditure by ¥600 million.
JAL will use its midterm management plan to move towardsimplementation of its e-business and information technologystrategies in order to achieve the highest possible account balanceand cash flow. Linking the Group companies to J-Banks is apowerful move toward achieving those goals.
Report on Year 2000 computer issuesJAL began studying the possible impact of the Year 2000 (Y2K)computer bug and taking steps to respond in August 1995. Sincethen, we have followed our original schedule to prepare keysystems vital to safety, on-time departure, and customer service.
This has included the preparation of contingency plans forpassengers, airports, flight control, and maintenance, as well as forother internal systems.
A full 24 hours before the deadline of January 1, 2000, ourY2K Headquarters at the head office established minute-by-minuteintercommunication with Y2K teams in each sector of thecompany and at each airport branch and office. At the same time,to demonstrate his confidence in the measures we had taken, thechair of the Y2K Compliance Committee, President Isao Kaneko,was onboard a New Year’s flight from Hawaii. Although a fewflights were delayed due to air traffic control requirements andairport contingency plans in some countries, the vast majority offlights were on time and there was no direct impact on passengerservice due to problems with aircraft or operations.
Our Year 2000 precautions continued through March 2000.This enabled us to ensure complete preparedness for any leap-yearbugs appearing on February 29, as well as to preempt any problemsduring the April 1 shift to fiscal year 2000. Our Year 2000precautions were finally shut down with no problems havingoccurred in any system.
Net Cash Provided by (Used in) Financing Activities
Net Cash Used in(Provided by) Investing Activities
Net Cash Provided by Operating Activities
1998 1999 2000
Consolidated Cash Flows(Billions of Yen)Years Ended March 31
-200
-150
-100
-50
0
50
100
150
24
Balance sheet analysisTotal assets as of 31 March, 2000 amounted to ¥1,911.1 billion,2.3 percent less than one year earlier. Current assets were essentiallyunchanged from the previous term at ¥582.3 billion, andinvestments and advances assets decreased 19 percent to ¥146.6billion, mainly due to the consolidation of financial assets byfinancial service subsidiaries. Property and equipment showed nonoteworthy changes, declining 1.4 percent compared to theprevious term, to ¥1,102.0 billion.
Total liabilities decreased by 4.2 percent relative to the previousterm, to ¥1,649.6 billion. Long-term debt was down 3.4 percentfrom the previous term, demonstrating our improving financialsituation as we continue working to reduce interest-bearingliabilities. Stockholders’ equity increased 9.7 percent to ¥237.9billion, and the assurance of earnings this term has resulted inelimination of cumulative deficit.
Analysis of cash flowsDue to the restoration of earning power, cash flow from businessoperations increased ¥5.6 billion over the previous term, resultingin a cash inflow of ¥87.3 billion. Despite capital investment inaircraft procurement, cash flow from investing activities saw a ¥7.0billion cash inflow resulting from sales of assets that have norelationship to the airline business. A majority of this cash inflowwas applied to repayment of interest-bearing liabilities, resulting ina ¥6.7 billion increase of cash and cash equivalents to ¥189.7billion at the end of the term.
1996 1997 1998 1999 2000
Consolidated Total Assets(Billions of Yen)Years Ended March 31
0
500
1000
1500
2000
2500
1996 1997 1998 1999 2000
Consolidated Current Liabilities(Billions of Yen)Years Ended March 31
0
100
200
300
400
500
600
700
1996 1997 1998 1999 2000
Consolidated TotalStockholders’ Equity(Billions of Yen)Years Ended March 31
0
50
100
150
200
250
300

27
Thousands ofU.S. dollars
(Note 2)2000
Millions of yen19992000
$ 438,481 1,713,839
1,525,669153,339
39,207520,339
54,273245
884,179
5,329,613
9,253,000
961,528
18,924
222,528
1,776,632300,075168,056
2,244,773
(405)
2,244,367
$ 18,029,971
¥ 79,593136,530
167,93814,5335,477
55,3952,810
1894,896
557,194
1,066,660
97,837
201
16,768
188,32331,808(3,167)
216,964
(6)
216,957
¥1,955,622
¥ 46,479181,667
161,72116,254
4,15655,156
5,75326
93,723
564,939
980,818
101,922
2,006
23,588
188,32331,80817,814
237,946
(43)
237,903
¥1,911,177
Current liabilities:Short-term bank loansCurrent portion of long-term debt (Notes 4 and 11)Accounts payable (Note 11):
TradeConstructionUnconsolidated subsidiaries and affiliates
Accrued expensesAccrued income taxes (Note 5)Deferred income taxes (Notes 1 and 5)Other
Total current liabilities
Long-term debt (Notes 4 and 11)
Accrued severance indemnities
Deferred income taxes (Notes 1 and 5)
Minority interests
Commitments and contingent liabilities (Notes 6, 7 and 11)
Stockholders’ equity:Common stock, ¥50 par value:
Authorized: 6,000,000,000 sharesIssued: 1,778,943,439 shares
Additional paid-in capitalRetained earnings (deficit)
Common stock in treasury, at cost;89,579 shares in 2000 and 21,068 shares in 1999
Total stockholders’ equity
Liabilities and Stockholders’ Equity
The accompanying notes are an integral part of these statements.
26
$ 1,313,603928,386
1,522,575101,433(17,933)544,254
79,820 1,021,556
5,493,716
356,226 1,027,650
1,383,886
14,602,575 7,342,679
21,945,264 (11,614,669)
10,330,584 66,528
10,397,113
149,216 83,867
349,839 172,301
$ 18,029,971
Thousands ofU.S. dollars
(Note 2)2000
Millions of yen19992000
¥ 104,249139,773
153,21320,692(2,464)57,413
303 110,464
583,645
65,332 115,308
180,640
1,557,114 740,704
2,297,818 (1,228,975)
1,068,843 48,188
1,117,032
20,136 3,923
35,896 14,346
¥ 1,955,622
¥ 139,24298,409
161,39310,752(1,901)57,691
8,461 108,285
582,334
37,760 108,931
146,692
1,547,873 778,324
2,326,198 (1,231,155)
1,095,042 7,052
1,102,094
15,817 8,890
37,083 18,264
¥ 1,911,177
Current assets:Cash and time depositsMarketable securities, at cost (Note 3)Accounts receivable (Note 11):
Trade (Note 7)Unconsolidated subsidiaries and affiliatesAllowance for doubtful accounts
Flight equipment spare parts, at costDeferred income taxes (Notes 1 and 5)Prepaid expenses and other
Total current assets
Investments and advances (Note 3):Unconsolidated subsidiaries and affiliatesOther, at cost
Total investments and advances
Property and equipment (Notes 1, 4 and 7):Flight equipmentGround property and equipment
Accumulated depreciation
Advances on aircraft purchases and other (Note 11)
Property and equipment, net
Long-term loans (Note 7)Deferred income taxes (Notes 1 and 5)Other assetsTranslation adjustments
Assets
Consolidated Balance SheetsJapan Airlines Company, Ltd. and Consolidated SubsidiariesMarch 31, 2000 and 1999
29
Balance at March 31, 1997Net loss for the year ended March 31,1998Bonuses to directors and statutory auditorsIncrease resulting from changes in scope of consolidationNet increase in common stock in treasury
Balance at March 31, 1998Net income for the year ended March 31,1999Elimination of accumulated deficit (Note 8)Bonuses to directors and statutory auditorsIncrease resulting from changes in scope of consolidationDecrease resulting from changes in scope of consolidationNet increase in common stock in treasury
Balance at March 31, 1999Cumulative effect of adoption of tax-effectaccounting (Note 1)Net income for the year ended March 31,2000Cash dividendsBonuses to directors and statutory auditorsIncrease resulting from changes inscope of consolidationDecrease resulting from changes inscope of consolidationNet increase in common stock in treasury
Balance at March 31, 2000
Balance at March 31, 1999Cumulative effect of adoption of tax-effectaccounting (Note 1)Net income for the year ended March31,2000Cash dividendsBonuses to directors and statutory auditorsIncrease resulting from changes in scope ofconsolidationDecrease resulting from changes in scopeof consolidationNet increase in common stock in treasury
Balance at March 31, 2000
Consolidated Statements of Stockholders' EquityJapan Airlines Company, Ltd. and Consolidated SubsidiariesFor the Years Ended March 31, 2000, 1999 and 1998
¥ 246,593(62,918)
(25)
1,313 (1)
184,961
26,773
–(24)
5,906
(662)3
216,957
6,893
19,740 (5,336)
(43)
7,395
(7,667)(37)
¥ 237,903
$ 2,046,764
65,028
186,226(50,339)
(405)
69,764
(72,330)(349)
$2,244,367
Total
Commonstock intreasury
Retainedearnings(deficit)
¥ (8)
(1)(9)
3 (6)
(37)
¥ (43)
$ (56)
(349)
$ (405)
¥ (103,498)(62,918)
(25)
1,313
(165,128)
26,773
129,968 (24)
5,906
(662)
(3,167)
6,893
19,740 (5,336)
(43)
7,395
(7,667)
¥ 17,814
$ (29,877)
65,028
186,226(50,339)
(405)
69,764
(72,330)
$168,056
Additionalpaid-incapital
¥ 161,776
161,776
(129,968)
31,808
¥ 31,808
$300,075
$300,075
Commonstock
¥ 188,323
188,323
188,323
¥ 188,323
$ 1,776,632
$1,776,632
Number of shares of
common stock
1,778,943,439
1,778,943,439
1,778,943,439
1,778,943,439
Commonstock
Additionalpaid-incapital
Retainedearnings(deficit)
Commonstock intreasury Total
The accompanying notes are an integral part of these statements.
Millions of yen
Thousands of U.S. dollers(Note 2)
28
$ 2,920,103 5,763,471
271,9431,426,0664,698,726
15,080,339
2,789,047790,754
1,005,3671,722,0281,815,5561,279,764
852,9244,401,405
14,656,867
423,462
44,641(333,745)
(52,830)31,188 31,877 72,650 49,528
153,169 (21,556)
(3,056)(32,867)(22,047)(57,094)(26,990)18,679
(21,037)
(169,490)
253,981
76,698 (29,330)
47,358
206,622 (20,386)
$ 186,226
Thousands ofU.S. dollars
(Note 2)2000
Millions of yen19981999
¥ 321,945667,693
28,046158,776405,098
1,581,559
328,04783,001
128,177200,788212,123106,668
91,245389,879
1,539,932
41,626
4,025(43,021)
(478)6,642
203 1,463
12,422 118
(1,179)–
(63,246)–
(15,462)–
2,221 (5,816)
(102,108)
(60,481)
5,596 33
5,630
(66,111)3,192
¥ (62,918)
¥ 307,447619,506
27,964150,611460,563
1,566,094
287,07683,228
123,888194,747183,586118,721
95,942446,047
1,533,237
32,856
4,584(39,160)
(3,298)19,101
22 15,908
6,689 3,642
(1,269)(2,819)(1,032)(1,174)(5,844)
–6,539 1,545
3,433
36,290
4,836 3,731
8,568
27,722 (948)
¥ 26,773
2000
¥ 309,531610,928
28,826151,163498,065
1,598,516
295,63983,820
106,569182,535192,449135,655
90,410466,549
1,553,628
44,887
4,732(35,377)
(5,600)3,306 3,379 7,701 5,250
16,236 (2,285)
(324)(3,484)(2,337)(6,052)(2,861)1,980
(2,230)
(17,966)
26,922
8,130 (3,109)
5,020
21,902 (2,161)
¥ 19,740
Operating revenues:Passenger:
DomesticInternational
Cargo:DomesticInternational
Incidental and other revenues
Operating expenses (Note 6):Flight operationsMaintenancePassenger servicesAircraft and traffic servicingSales and advertisingGeneral and administrativeDepreciation and amortizationCost of incidental and other expenses
Operating income
Non-operating income (expenses):Interest and dividend incomeInterest expenseExchange loss, netAircraft purchase incentivesGain on sales of marketable securitiesGain on sales of aircraftGain on sales of ground property and equipmentGain on sales of investments in securitiesLoss on disposal of fixed assetsLoss on revaluation of marketable securitiesLoss on investments in unconsolidated subsidiaries and affiliatesLoss on revaluation of investments in securitiesSpecial termination benefitsProvision for accrued severance indemnitiesEquity in earnings of unconsolidated subsidiaries and affiliatesOther, net
Income (loss) before income taxes and minority interestsIncome taxes (Notes 1 and 5):
CurrentDeferred
Income (loss) before minority interestsMinority interests
Net income (loss)
Consolidated Statements of OperationsJapan Airlines Company, Ltd. and Consolidated SubsidiariesFor the Years Ended March 31, 2000, 1999 and 1998
The accompanying notes are an integral part of these statements.
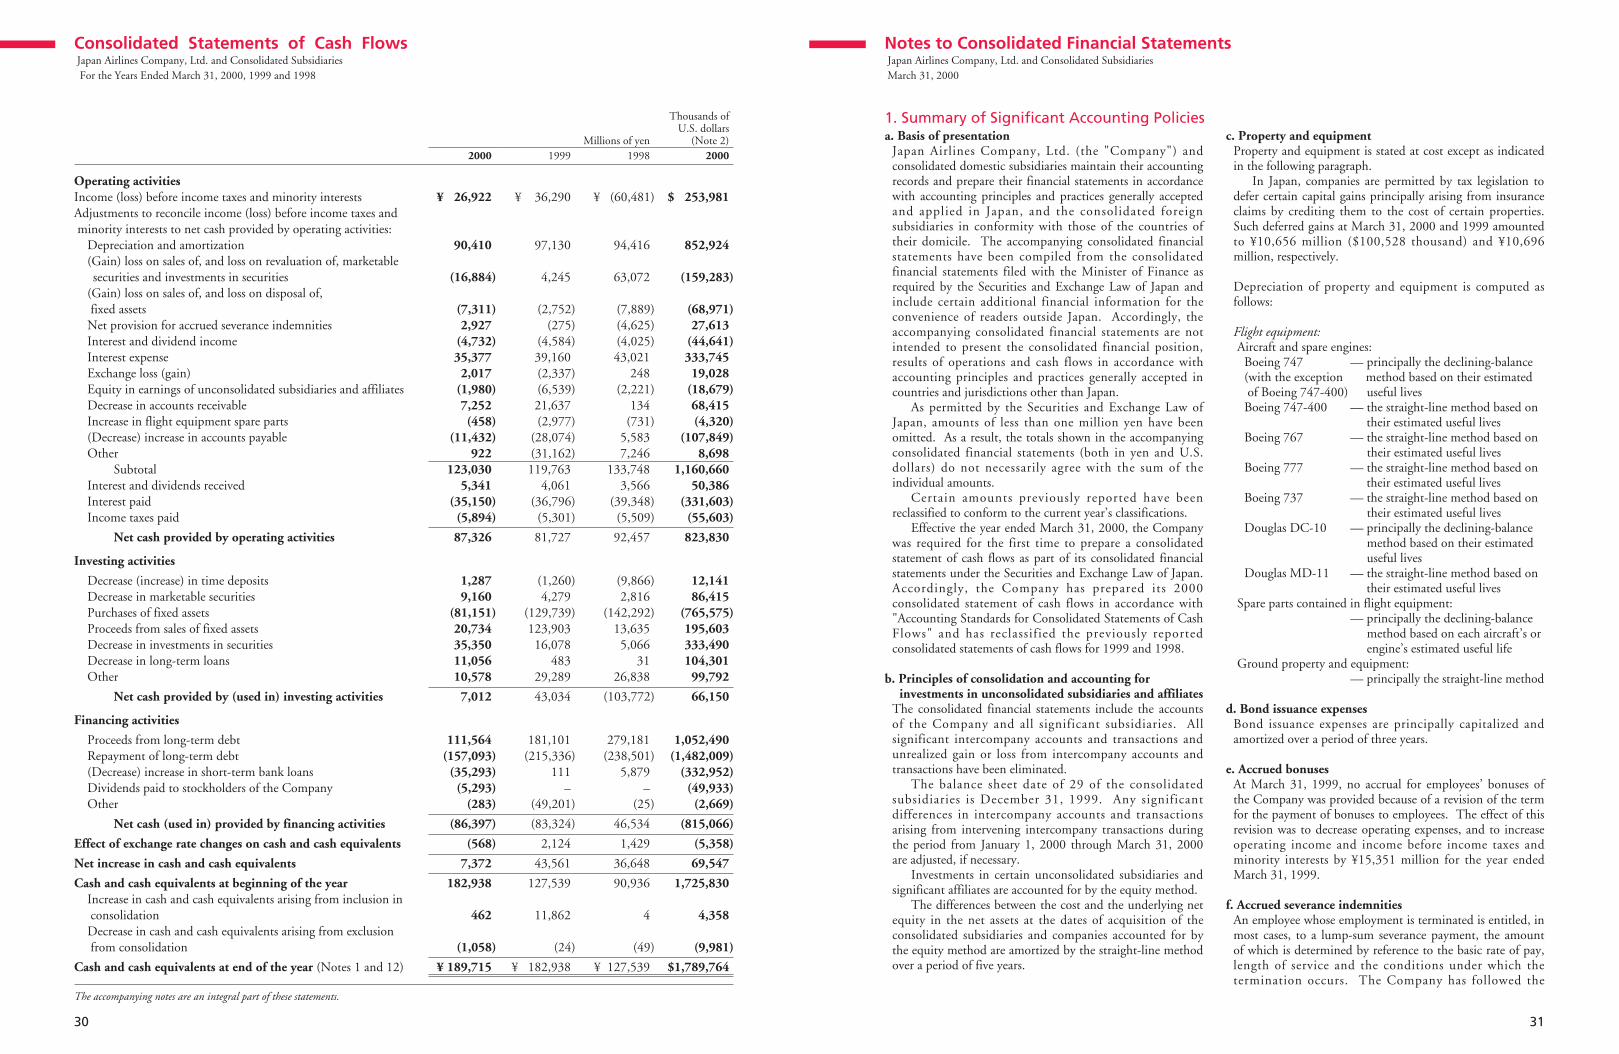
31
a. Basis of presentationJapan Airlines Company, Ltd. (the "Company") andconsolidated domestic subsidiaries maintain their accountingrecords and prepare their financial statements in accordancewith accounting principles and practices generally acceptedand applied in Japan, and the consolidated foreignsubsidiaries in conformity with those of the countries oftheir domicile. The accompanying consolidated financialstatements have been compiled from the consolidatedfinancial statements filed with the Minister of Finance asrequired by the Securities and Exchange Law of Japan andinclude certain additional financial information for theconvenience of readers outside Japan. Accordingly, theaccompanying consolidated financial statements are notintended to present the consolidated financial position,results of operations and cash flows in accordance withaccounting principles and practices generally accepted incountries and jurisdictions other than Japan.
As permitted by the Securities and Exchange Law ofJapan, amounts of less than one million yen have beenomitted. As a result, the totals shown in the accompanyingconsolidated financial statements (both in yen and U.S.dollars) do not necessarily agree with the sum of theindividual amounts.
Certain amounts previously reported have beenreclassified to conform to the current year’s classifications.
Effective the year ended March 31, 2000, the Companywas required for the first time to prepare a consolidatedstatement of cash flows as part of its consolidated financialstatements under the Securities and Exchange Law of Japan.Accordingly, the Company has prepared its 2000consolidated statement of cash flows in accordance with"Accounting Standards for Consolidated Statements of CashFlows" and has reclassified the previously reportedconsolidated statements of cash flows for 1999 and 1998.
b. Principles of consolidation and accounting forinvestments in unconsolidated subsidiaries and affiliates
The consolidated financial statements include the accountsof the Company and all significant subsidiaries. Allsignificant intercompany accounts and transactions andunrealized gain or loss from intercompany accounts andtransactions have been eliminated.
The balance sheet date of 29 of the consolidatedsubsidiaries is December 31, 1999. Any significantdifferences in intercompany accounts and transactionsarising from intervening intercompany transactions duringthe period from January 1, 2000 through March 31, 2000are adjusted, if necessary.
Investments in certain unconsolidated subsidiaries andsignificant affiliates are accounted for by the equity method.
The differences between the cost and the underlying netequity in the net assets at the dates of acquisition of theconsolidated subsidiaries and companies accounted for bythe equity method are amortized by the straight-line methodover a period of five years.
c. Property and equipmentProperty and equipment is stated at cost except as indicatedin the following paragraph.
In Japan, companies are permitted by tax legislation todefer certain capital gains principally arising from insuranceclaims by crediting them to the cost of certain properties.Such deferred gains at March 31, 2000 and 1999 amountedto ¥10,656 million ($100,528 thousand) and ¥10,696million, respectively.
Depreciation of property and equipment is computed asfollows:
Flight equipment:Aircraft and spare engines:
Boeing 747 –– principally the declining-balance (with the exception method based on their estimated of Boeing 747-400) useful livesBoeing 747-400 –– the straight-line method based on
their estimated useful livesBoeing 767 –– the straight-line method based on
their estimated useful livesBoeing 777 –– the straight-line method based on
their estimated useful livesBoeing 737 –– the straight-line method based on
their estimated useful livesDouglas DC-10 –– principally the declining-balance
method based on their estimated useful lives
Douglas MD-11 –– the straight-line method based ontheir estimated useful lives
Spare parts contained in flight equipment:–– principally the declining-balance
method based on each aircraft’s or engine’s estimated useful life
Ground property and equipment:–– principally the straight-line method
d. Bond issuance expensesBond issuance expenses are principally capitalized andamortized over a period of three years.
e. Accrued bonusesAt March 31, 1999, no accrual for employees’ bonuses ofthe Company was provided because of a revision of the termfor the payment of bonuses to employees. The effect of thisrevision was to decrease operating expenses, and to increaseoperating income and income before income taxes andminority interests by ¥15,351 million for the year endedMarch 31, 1999.
f. Accrued severance indemnitiesAn employee whose employment is terminated is entitled, inmost cases, to a lump-sum severance payment, the amountof which is determined by reference to the basic rate of pay,length of service and the conditions under which thetermination occurs. The Company has followed the
Notes to Consolidated Financial StatementsJapan Airlines Company, Ltd. and Consolidated SubsidiariesMarch 31, 2000
1. Summary of Significant Accounting Policies
30
Thousands ofU.S. dollars
(Note 2)20001999
Millions of yen19982000
¥ 26,922
90,410
(16,884)
(7,311)2,927
(4,732)35,377
2,017 (1,980)7,252 (458)
(11,432)922
123,030 5,341
(35,150)(5,894)
87,326
1,287 9,160
(81,151)20,734 35,350 11,056 10,578
7,012
111,564 (157,093)
(35,293)(5,293)
(283)
(86,397)
(568)
7,372
182,938
462
(1,058)
¥ 189,715
¥ 36,290
97,130
4,245
(2,752)(275)
(4,584)39,160 (2,337)(6,539)21,637 (2,977)
(28,074)(31,162)119,763
4,061 (36,796)
(5,301)
81,727
(1,260)4,279
(129,739)123,903
16,078 483
29,289
43,034
181,101 (215,336)
111 –
(49,201)
(83,324)
2,124
43,561
127,539
11,862
(24)
¥ 182,938
¥ (60,481)
94,416
63,072
(7,889)(4,625)(4,025)43,021
248 (2,221)
134 (731)
5,583 7,246
133,748 3,566
(39,348)(5,509)
92,457
(9,866)2,816
(142,292)13,635
5,066 31
26,838
(103,772)
279,181 (238,501)
5,879 –
(25)
46,534
1,429
36,648
90,936
4
(49)
¥ 127,539
$ 253,981
852,924
(159,283)
(68,971)27,613
(44,641)333,745
19,028 (18,679)68,415 (4,320)
(107,849)8,698
1,160,660 50,386
(331,603)(55,603)
823,830
12,141 86,415
(765,575)195,603 333,490 104,301
99,792
66,150
1,052,490 (1,482,009)
(332,952)(49,933)
(2,669)
(815,066)
(5,358)
69,547
1,725,830
4,358
(9,981)
$1,789,764
Operating activitiesIncome (loss) before income taxes and minority interestsAdjustments to reconcile income (loss) before income taxes andminority interests to net cash provided by operating activities:
Depreciation and amortization(Gain) loss on sales of, and loss on revaluation of, marketablesecurities and investments in securities
(Gain) loss on sales of, and loss on disposal of,fixed assetsNet provision for accrued severance indemnitiesInterest and dividend incomeInterest expenseExchange loss (gain)Equity in earnings of unconsolidated subsidiaries and affiliatesDecrease in accounts receivableIncrease in flight equipment spare parts(Decrease) increase in accounts payableOther
SubtotalInterest and dividends receivedInterest paidIncome taxes paid
Net cash provided by operating activities
Investing activities
Decrease (increase) in time depositsDecrease in marketable securitiesPurchases of fixed assetsProceeds from sales of fixed assetsDecrease in investments in securitiesDecrease in long-term loansOther
Net cash provided by (used in) investing activities
Financing activities
Proceeds from long-term debtRepayment of long-term debt(Decrease) increase in short-term bank loansDividends paid to stockholders of the CompanyOther
Net cash (used in) provided by financing activities
Effect of exchange rate changes on cash and cash equivalents
Net increase in cash and cash equivalents
Cash and cash equivalents at beginning of the yearIncrease in cash and cash equivalents arising from inclusion inconsolidationDecrease in cash and cash equivalents arising from exclusionfrom consolidation
Cash and cash equivalents at end of the year (Notes 1 and 12)
Consolidated Statements of Cash FlowsJapan Airlines Company, Ltd. and Consolidated SubsidiariesFor the Years Ended March 31, 2000, 1999 and 1998
The accompanying notes are an integral part of these statements.
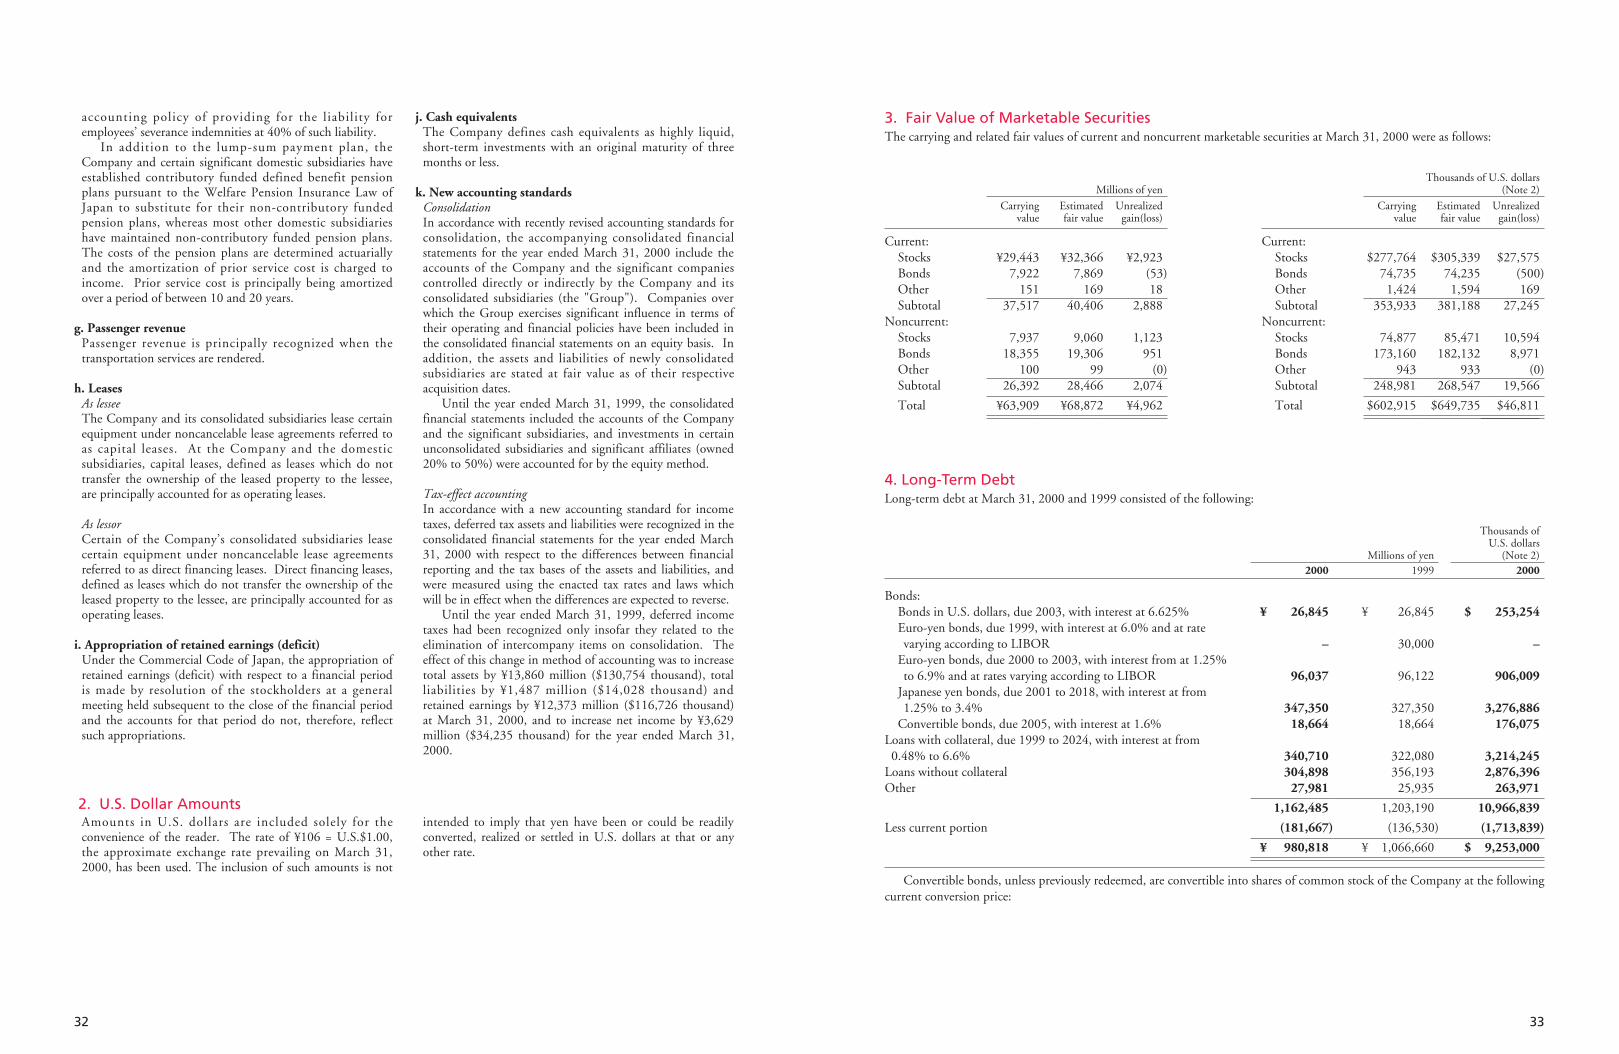
33
Unrealized gain(loss)
Estimated fair value
Carrying value
¥2,923(53)18
2,888
1,123951
(0)2,074
¥4,962
¥32,3667,869
16940,406
9,06019,306
9928,466
¥68,872
¥29,4437,922
15137,517
7,93718,355
10026,392
¥63,909
Current:StocksBondsOtherSubtotal
Noncurrent:StocksBondsOtherSubtotal
Total
3. Fair Value of Marketable SecuritiesThe carrying and related fair values of current and noncurrent marketable securities at March 31, 2000 were as follows:
Millions of yen
Unrealized gain(loss)
Estimated fair value
Carrying value
$27,575 (500)169
27,245
10,5948,971
(0)19,566
$46,811
$305,339 74,2351,594
381,188
85,471182,132
933268,547
$649,735
$277,764 74,735
1,424353,933
74,877173,160
943248,981
$602,915
Current:StocksBondsOtherSubtotal
Noncurrent:StocksBondsOtherSubtotal
Total
Thousands of U.S. dollars(Note 2)
$ 253,254
–
906,009
3,276,886176,075
3,214,2452,876,396
263,971
10,966,839
(1,713,839)
$ 9,253,000
Thousands ofU.S. dollars
(Note 2)2000
Millions of yen19992000
¥ 26,845
30,000
96,122
327,35018,664
322,080356,19325,935
1,203,190
(136,530)
¥ 1,066,660
¥ 26,845
–
96,037
347,35018,664
340,710304,898
27,981
1,162,485
(181,667)
¥ 980,818
Bonds:Bonds in U.S. dollars, due 2003, with interest at 6.625%Euro-yen bonds, due 1999, with interest at 6.0% and at ratevarying according to LIBOR
Euro-yen bonds, due 2000 to 2003, with interest from at 1.25%to 6.9% and at rates varying according to LIBOR
Japanese yen bonds, due 2001 to 2018, with interest at from1.25% to 3.4%
Convertible bonds, due 2005, with interest at 1.6%Loans with collateral, due 1999 to 2024, with interest at from
0.48% to 6.6%Loans without collateralOther
Less current portion
4. Long-Term DebtLong-term debt at March 31, 2000 and 1999 consisted of the following:
Convertible bonds, unless previously redeemed, are convertible into shares of common stock of the Company at the followingcurrent conversion price:
32
accounting policy of providing for the liability foremployees’ severance indemnities at 40% of such liability.
In addition to the lump-sum payment plan, theCompany and certain significant domestic subsidiaries haveestablished contributory funded defined benefit pensionplans pursuant to the Welfare Pension Insurance Law ofJapan to substitute for their non-contributory fundedpension plans, whereas most other domestic subsidiarieshave maintained non-contributory funded pension plans.The costs of the pension plans are determined actuariallyand the amortization of prior service cost is charged toincome. Prior service cost is principally being amortizedover a period of between 10 and 20 years.
g. Passenger revenuePassenger revenue is principally recognized when thetransportation services are rendered.
h. LeasesAs lesseeThe Company and its consolidated subsidiaries lease certainequipment under noncancelable lease agreements referred toas capital leases. At the Company and the domesticsubsidiaries, capital leases, defined as leases which do nottransfer the ownership of the leased property to the lessee,are principally accounted for as operating leases.
As lessorCertain of the Company’s consolidated subsidiaries leasecertain equipment under noncancelable lease agreementsreferred to as direct financing leases. Direct financing leases,defined as leases which do not transfer the ownership of theleased property to the lessee, are principally accounted for asoperating leases.
i. Appropriation of retained earnings (deficit)Under the Commercial Code of Japan, the appropriation ofretained earnings (deficit) with respect to a financial periodis made by resolution of the stockholders at a generalmeeting held subsequent to the close of the financial periodand the accounts for that period do not, therefore, reflectsuch appropriations.
j. Cash equivalentsThe Company defines cash equivalents as highly liquid,short-term investments with an original maturity of threemonths or less.
k. New accounting standardsConsolidationIn accordance with recently revised accounting standards forconsolidation, the accompanying consolidated financialstatements for the year ended March 31, 2000 include theaccounts of the Company and the significant companiescontrolled directly or indirectly by the Company and itsconsolidated subsidiaries (the "Group"). Companies overwhich the Group exercises significant influence in terms oftheir operating and financial policies have been included inthe consolidated financial statements on an equity basis. Inaddition, the assets and liabilities of newly consolidatedsubsidiaries are stated at fair value as of their respectiveacquisition dates.
Until the year ended March 31, 1999, the consolidatedfinancial statements included the accounts of the Companyand the significant subsidiaries, and investments in certainunconsolidated subsidiaries and significant affiliates (owned20% to 50%) were accounted for by the equity method.
Tax-effect accountingIn accordance with a new accounting standard for incometaxes, deferred tax assets and liabilities were recognized in theconsolidated financial statements for the year ended March31, 2000 with respect to the differences between financialreporting and the tax bases of the assets and liabilities, andwere measured using the enacted tax rates and laws whichwill be in effect when the differences are expected to reverse.
Until the year ended March 31, 1999, deferred incometaxes had been recognized only insofar they related to theelimination of intercompany items on consolidation. Theeffect of this change in method of accounting was to increasetotal assets by ¥13,860 million ($130,754 thousand), totalliabilities by ¥1,487 million ($14,028 thousand) andretained earnings by ¥12,373 million ($116,726 thousand)at March 31, 2000, and to increase net income by ¥3,629million ($34,235 thousand) for the year ended March 31,2000.
Amounts in U.S. dollars are included solely for theconvenience of the reader. The rate of ¥106 = U.S.$1.00,the approximate exchange rate prevailing on March 31,2000, has been used. The inclusion of such amounts is not
intended to imply that yen have been or could be readilyconverted, realized or settled in U.S. dollars at that or anyother rate.
2. U.S. Dollar Amounts

35
6. LeasesAs lesseeThe following pro forma amounts represent the acquisition costs, accumulated depreciation and net book value of the leasedproperty as of March 31, 2000 and 1999, and the related depreciation and interest expense for the years ended March 31, 2000and 1999, which would have been reflected in the balance sheets and the related statements of operations if capital leaseaccounting had been applied to the capital leases currently accounted for as operating leases:
Millions of yen Thousands of U.S. dollarsGround Ground
Flight property and Flight property andMarch 31, 2000 equipment equipment Total equipment equipment Total
Acquisition costs ¥430,160 ¥21,955 ¥452,116 $4,058,113 $207,122 $4,265,245Less accumulated depreciation 194,776 14,422 209,198 1,837,509 136,056 1,973,566
Net book value ¥235,384 ¥7,533 ¥242,917 $2,220,603 $ 71,066 $2,291,669
Millions of yenGround
Flight property andMarch 31, 1999 equipment equipment Total
Acquisition costs ¥384,122 ¥26,117 ¥410,240Less accumulated depreciation 158,009 15,971 173,980
Net book value ¥226,113 ¥10,146 ¥236,260
Thousands ofMillions of yen U.S. dollars
Year ended March 31, 2000 1999 2000
Depreciation expence ¥40,245 ¥32,476 $379,669
Interest expence ¥10,203 ¥ 9,762 $ 96,254
Lease expenses relating to capital leases accounted for as operating leases amounted to ¥46,620 million ($439,811 thousand),¥39,499 million and ¥40,380 million for the years ended March 31, 2000, 1999 and 1998, respectively.
The present value of future rental expenses under capital leases accounted for as operating leases outstanding at March 31,2000 and 1999 was as follows:
Thousands of Millions of yen U.S. dollars
2000 1999 2000
Within 1 year ¥ 38,304 ¥ 34,280 $ 361,358Over 1 year 240,767 234,792 2,271,386
¥279,072 ¥269,073 $2,632,754
Future rental expenses under operating leases outstanding at March 31, 2000 and 1999 were as follows:
Thousands of Millions of yen U.S. dollars
2000 1999 2000
Within 1 year ¥12,445 ¥13,915 $117,405Over 1 year 68,422 68,276 645,490
¥80,868 ¥82,191 $762,905
The Company is subject to a number of taxes based ontaxable income, i.e. corporation, inhabitants’ and enterprisetaxes, which, in the aggregate, resulted in statutory rates ofapproximately 40% in 2000, 47% in 1999 and 52% in 1998.
The significant components of deferred tax assets andliabilities and the related valuation allowance at March 31,2000 were as follows:
Millions Thousands of of yen U.S. dollars
Deferred tax assets:Revaluation loss on investments in unconsolidated subsidiaries and affiliates ¥ 35,592 $ 335,773
Accrued severance indemnities 9,137 86,198Accounts payable-trade 2,757 26,009Revaluation loss on flight equipment spare parts 1,901 17,933
Accrued bonuses 1,519 14,330Tax loss carryforwards 48,083 453,613Other 15,223 143,613
114,212 1,077,471Deferred tax liabilities:Reserve for special depreciation (5,320) (50,188)Accumulated earnings of consolidated subsidiaries (1,626) (15,339)
Other (2,654) (25,037)(9,600) (90,566)
Valuation allowance (89,294) (842,396)
Net deferred tax assets ¥ 15,318 $ 144,509
A reconciliation between the Japanese statutory tax rate andthe Company’s effective tax rate for the year ended March 31,2000 is as follows:
Japanese statutory tax rate 40.2%Disallowed expenses, including entertainment expenses 8.2Dividends received (2.1)Equity in earnings of unconsolidated subsidiariesand affiliates (3.0)Inhabitants’ per capita taxes 0.8Change in valuation allowance (25.4)Other (0.1)
Company’s effective tax rate 18.7%
5. Income Taxes
34
Conversion price per share Conversion period
1.6% convertible bonds in yen due 2005 ¥1,751.10 February 1, 1990-March 30,2005
Under the provisions of this issue, the conversion price issubject to adjustment in certain cases which include stocksplits.
The aggregate annual maturities of long-term debtsubsequent to March 31, 2000 are summarized as follows:
Millions Thousands of Year ending March 31, of yen U.S. dollars
2001 ¥ 181,667 $ 1,713,839 2002 187,164 1,765,6982003 147,420 1,390,7542004 128,652 1,213,6982005 and thereafter 517,581 4,882,839
¥1,162,485 $10,966,839
A summary of assets pledged as collateral for long-termdebt at March 31, 2000 is as follows:
Millions Thousands of of yen U.S. dollars
Flight equipment, net of accumulated depreciation ¥402,914 $3,801,075 Ground property and equipment,net of accumulated depreciation,and other 110,992 1,047,094
¥513,907 $4,848,179
The effective interest rates on certain foreign currencybonds, which resulted from hedging the bonds with cross-currency interest rate swaps, were lower than the long-termprime rate in Japan at each issuance date.

37
8. Elimination of Accumulated DeficitThe Company’s non-consolidated accumulated deficit atMarch 31, 1998 consisted of the following:
Millions of yen
Reserve for special depreciation ¥ 8,665Special reserve 5,808Accumulated deficit brought forward (151,772)
¥(137,298)
A proposal for disposition of the Company’s non-consolidatedaccumulated deficit to be carried forward of ¥151,772 millionat March 31, 1998 was approved at a stockholders’ meetingheld on June 26, 1998. A portion of the deficit in theamount of ¥165,128 million at March 31, 1998 was offsetagainst a reversal of additional paid-in capital of ¥129,968million. As a result, at June 26, 1998, the balance ofconsolidated accumulated deficit carried forward amounted to¥35,160 million.
9. Amounts Per ShareNet income (loss) per share and diluted net income per sharehave been computed based on the weighted average numberof shares of common stock outstanding during each year.
Yen U.S. dollarsYear ended March 31, 2000 1999 1998 2000
Net income (loss) ¥11.10 ¥15.05 ¥(35.37) $0.104 Diluted net income ¥11.10 ¥15.05 – $0.104
Net assets per share have been computed based on thenumber of shares of common stock outstanding at eachbalance sheet date.
Yen U.S. dollarsMarch 31, 2000 1999 2000
Net assets ¥133.74 ¥121.96 $1.261
10. Segment InformationThe Company and its consolidated subsidiaries conductworldwide operations in air transportation, travel services,hotel and resort operations, card and lease operations, tradingand other airline-related business. This segmentation hasbeen made for internal management purposes. Businesses
other than the air transportation business, travel services, andhotel and resort operations are insignificant to theconsolidated results of operations of the Company and itsconsolidated subsidiaries and, accordingly, have been includedin "Other."
a. Business segment informationBusiness segment information of the Company and its consolidated subsidiaries for the years ended March 31, 2000, 1999 and1998 is summarized as follows:
Consolidated
General corporateassets and
intercompanyeliminationsTotalOther
Hotel and resortoperations
Travelservices
AirtransportationYear ended March 31, 2000
¥1,598,516–
1,598,5161,553,628
¥ 44,887
¥ 90,410
¥ 81,151
¥1,911,177
¥ –(404,127)
(404,127)(401,603)
¥ (2,524)
¥ (1,525)
¥ (933)
¥ (141,956)
¥1,598,516404,127
2,002,6441,955,232
¥ 47,411
¥ 91,935
¥ 82,085
¥2,053,134
¥159,415228,624
388,040377,618
¥ 10,422
¥ 17,933
¥ 5,396
¥493,543
¥35,5785,382
40,96139,227
¥ 1,733
¥ 3,514
¥ 2,006
¥91,703
¥345,3304,830
350,160347,699
¥ 2,460
¥ 1,059
¥ 2,020
¥ 71,308
¥1,058,191165,290
1,223,4811,190,686
¥ 32,795
¥ 69,427
¥ 72,661
¥1,396,578
Sales to outside partiesIntra-group sales and transfers
TotalOperating expenses
Operating income
Depreciation and amortization
Capital expenditures
Identifiable assets
Millions of yen
As lessorThe following pro forma amounts represent the acquisition costs, accumulated depreciation and net book value of the leasedproperty as of March 31, 2000 and 1999, and the related depreciation and interest revenue for the years ended March 31, 2000and 1999, which would have been reflected in the balance sheets and the related statements of operations if direct financing leaseaccounting had been applied to the capital leases currently accounted for as operating leases:
Millions of yen Thousands of U.S. dollars
Ground Ground Flight property and Flight property and
March 31, 2000 equipment equipment Total equipment equipment Total
Acquisition costs ¥348 ¥6,736 ¥7,084 $3,283 $63,547 $66,830Less accumulated depreciation 185 4,233 4,418 1,745 39,933 41,679Net book value ¥162 ¥2,502 ¥2,665 $1,528 $23,603 $25,141
Millions of yen
Ground Flight property and
March 31, 1999 equipment equipment Total
Acquisition costs ¥348 ¥7,475 ¥7,823Less accumulated depreciation 150 4,023 4,173Net book value ¥197 ¥3,452 ¥3,649
Thousands ofMillions of yen U.S. dollars
Year ended March 31, 2000 1999 2000
Depreciation expense ¥1,118 ¥1,299 $10,547Interest expense ¥ 177 ¥ 207 $ 1,669
Lease revenues relating to direct financing leases accounted for as operating leases amounted to ¥1,321 million ($12,462thousand), ¥1,494 million and ¥1,649 million for the years ended March 31, 2000, 1999 and 1998, respectively.
36
The present value of future rental revenues under direct financing leases accounted for as operating leases outstanding atMarch 31, 2000 and 1999 were as follows:
Thousands of Millions of yen U.S. dollars
2000 1999 2000
Within 1 year ¥ 967 ¥1,153 $ 9,122Over 1 year 1,893 2,689 17,858
¥2,860 ¥3,843 $26,981
Future rental revenues under operating leases outstanding at March 31, 2000 and 1999 were as follows:Thousands of
Millions of yen U.S. dollars2000 1999 2000
Within 1 year ¥128 ¥211 $1,207Over 1 year 46 128 433
¥174 ¥339 $1,641
7. Commitments and Contingent LiabilitiesCommitments outstanding at March 31, 2000 for purchasesof significant property and equipment amounted to ¥430,050million ($4,057,075 thousand).
The Company leases aircraft, office space, warehouses andoffice equipment. These leases are customarily renewed uponexpiration.
At March 31, 2000, contingent liabilities for guarantees,principally for unconsolidated subsidiaries, affiliates andemployees, amounted to ¥19,727 million ($186,103thousand). In addition, at March 31, 2000, contingentliabilities for commitments such as guarantees, keep well
agreements and others, principally for unconsolidatedsubsidiaries, affiliates and employees, amounted to ¥4,118million ($38,849 thousand).
In addition, at March 31, 2000, the Company was liableunder debt assumption agreements for in-substancedefeasance of certain bonds in the aggregate amount of¥60,000 million ($566,037 thousand).
The Company has sold certain receivables and loans tobanks. At March 31, 2000, the aggregate balance of thereceivables and loans sold was ¥66,673 million ($628,990thousand).

39
b. Operating revenues from foreign operationsOperating revenues from foreign operations, which include international passenger and cargo services of the Company and twodomestic subsidiaries, export sales of domestic subsidiaries, and sales of subsidiaries outside Japan, for the years ended March 31,2000 and 1999 were as follows:
Millions of yenAsia and North and
Year ended March 31, 2000 Oceania South America Europe Total
Operating revenues from foreign operations ¥366,822 ¥310,186 ¥190,915 ¥ 867,925Consolidated operating revenues ¥1,598,516Operating revenues from foreign operations as a percentage of consolidated operating revenues 22.9% 19.4% 11.9% 54.3%
Thousands of U.S. dollarsAsia and North and
Year ended March 31, 2000 Oceania South America Europe Total
Operating revenues from foreign operations $3,460,584 $2,926,283 $1,801,084 $ 8,187,971Consolidated operating revenues $15,080,339Operating revenues from foreign operations as a percentage of consolidated operating revenues 22.9% 19.4% 11.9% 54.3%
Millions of yenAsia and North and
Year ended March 31, 1999 Oceania South America Europe Total
Operating revenues from foreign operations ¥340,878 ¥326,148 ¥186,758 ¥ 853,785Consolidated operating revenues ¥1,566,094Operating revenues from foreign operations as a percentage of consolidated operating revenues 21.8% 20.8% 11.9% 54.5%
c. Geographic informationFor the years ended March 31, 2000, 1999 and 1998, operating revenues from operations in Japan represented more than 90%of consolidated operating revenues. As a result, geographic information is not required to be disclosed in accordance withaccounting principles generally accepted in Japan.
The Company and consolidated subsidiaries have utilizedforward exchange and options contracts to hedge certainforeign currency transactions related to foreign purchasecommitments, principally of flight equipment and foreignaccounts receivable and payable, on a consistent basis. TheCompany and consolidated subsidiaries have also utilizedinterest-rate and currency swap agreements and forwardforeign exchange contracts to minimize the impact of foreignexchange and interest-rate movements related to itsoutstanding debt on the Company’s and consolidatedsubsidiaries’ operating results. The Company has also enteredinto a variety of swaps and options in its management of riskexposure related to the commodity prices of fuel.
The purpose of the Company ’s and consolidatedsubsidiaries’ hedging activities in the form of forward foreignexchange contracts, currency options and commodity
derivatives is to protect the Company and consolidatedsubsidiaries from the related market risks. In addition, thepurpose of interest-rate and currency swap agreements iseffectively to modify the characteristics of the interest andunderlying principal of its outstanding debt.
The Company and consolidated subsidiaries are exposedto certain market risks arising from the forward foreignexchange contracts, swap agreements and written currencyoptions referred to above. The Company and consolidatedsubsidiaries are also exposed to the risk of credit loss in theevent of non-performance by the counterparties to thecurrency, interest and commodity derivatives; however, theCompany and consolidated subsidiaries do not anticipatenon-performance by any of these counterparties all of whomare financial institutions with high bond ratings.
11. Derivatives and Hedging Activities
Consolidated
General corporateassets and
intercompanyeliminationsTotalOther
Hotel and resortoperations
Travelservices
AirtransportationYear ended March 31, 2000
$15,080,339 –
15,080,33914,656,867
$ 423,462
$ 852,924
$ 765,575
$18,029,971
$ –(3,812,518)
(3,812,518)(3,788,707)
$ (23,811)
$ (14,386)
$ (8,801)
$(1,339,207)
$15,080,339 3,812,518
18,892,86718,445,584
$ 447,273
$ 867,311
$ 774,386
$19,369,188
$1,503,915 2,156,830
3,660,7543,562,433
$ 98,320
$ 169,179
$ 50,905
$4,656,066
$335,641 50,773
386,424370,066
$ 16,349
$ 33,150
$ 18,924
$865,122
$3,257,830 45,566
3,303,3963,280,179
$ 23,207
$ 9,990
$ 19,056
$ 672,716
$ 9,982,933 1,559,339
11,542,27311,232,886
$390,386
$654,971
$685,481
$13,175,264
Sales to outside partiesIntra-group sales and transfers
TotalOperating expenses
Operating income
Depreciation and amortization
Capital expenditures
Identifiable assets
38
Thousands of U.S. dollars
Millions of yen
Thousands of U.S. dollars
Consolidated
General corporateassets and
intercompanyeliminationsTotalOther
Hotel and resortoperations
Travelservices
AirtransportationYear ended March 31, 1999
¥1,566,094 –
1,566,0941,533,237
¥ 32,856
¥ 86,075
¥ 94,668
¥1,955,622
¥ –(394,946)
(394,946)(391,270)
¥ (3,675)
¥ (929)
¥ (4,556)
¥(174,844)
¥1,566,094 394,946
1,961,0401,924,507
¥ 36,532
¥ 87,005
¥ 99,224
¥2,130,467
¥143,932 214,322
358,254349,137
¥ 9,117
¥ 17,479
¥ 26,741
¥542,974
¥ 52,178 5,249
57,42755,791
¥ 1,635
¥ 5,843
¥ 1,719
¥122,133
¥331,500 6,171
337,672337,942
¥ (270)
¥ 893
¥ 64
¥ 63,750
¥1,038,482 169,202
1,207,6851,181,635
¥ 26,049
¥ 62,789
¥ 70,699
¥1,401,607
Sales to outside partiesIntra-group sales and transfers
TotalOperating expenses
Operating income (loss)
Depreciation
Capital expenditures
Identifiable assets
As described in Note 1-e, during the year ended March 31, 1999, the Company revised the term for the payment of bonusesto its employees. The effect of this revision was to decrease operating expenses and increase operating income in the air transportsegment by ¥15,351 million for the year ended March 31, 1999.
Consolidated
General corporateassets and
intercompanyeliminationsTotalOther
Hotel and resortoperations
Travelservices
AirtransportationYear ended March 31, 1998
¥1,581,559–
1,581,5591,541,376
¥ 40,182
¥ 82,726
¥ 142,861
¥2,042,761
¥ –(309,130)
(309,130)(305,214)
¥ (3,916)
¥ (933)
¥ (154)
¥(223,737)
¥1,581,559309,130
1,890,6901,846,591
¥ 44,099
¥ 83,660
¥ 143,015
¥2,266,498
¥153,926204,203
358,130348,639
¥ 9,491
¥ 14,875
¥ 21,719
¥617,522
¥ 58,6834,948
63,63261,663
¥ 1,969
¥ 7,701
¥ 2,950
¥167,374
¥194,6051,363
195,969197,131
¥ (1,161)
¥ 319
¥ 209
¥ 38,066
¥1,174,34398,614
1,272,9571,239,157
¥ 33,800
¥ 60,763
¥ 118,135
¥1,443,535
Sales to outside partiesIntra-group sales and transfers
TotalOperating expenses
Operating income (loss)
Depreciation
Capital expenditures
Identifiable assets
Operating expenses for fiscal year 1998 include enterprise tax of ¥1,444 million, which was reclassified to income taxes in theaccompanying statement of operations for the year ended March 31, 1998.

41
We have examined the consolidated balance sheets of Japan Airlines Company, Ltd. andconsolidated subsidiaries as of March 31, 2000 and 1999, and the related consolidatedstatements of operations, stockholders’ equity, and cash flows for each of the three yearsin the period ended March 31, 2000, all expressed in yen. Our examinations were madein accordance with auditing standards, procedures and practices generally accepted andapplied in Japan and, accordingly, included such tests of the accounting records andsuch other auditing procedures as we considered necessary in the circumstances.
In our opinion, the accompanying consolidated financial statements, expressed in yen,present fairly the consolidated financial position of Japan Airlines Company, Ltd. andconsolidated subsidiaries at March 31, 2000 and 1999, and the consolidated results oftheir operations and their cash flows for each of the three years in the period endedMarch 31, 2000 in conformity with accounting principles and practices generallyaccepted in Japan applied on a consistent basis.
As described in Note 1 to the consolidated financial statements, Japan AirlinesCompany, Ltd. has adopted new accounting standards for consolidation and tax-effectaccounting in the preparation of its consolidated financial statements for the year endedMarch 31, 2000.
The U.S. dollar amounts in the accompanying consolidated financial statements withrespect to the year ended March 31, 2000 are presented solely for convenience. Ourexamination also included the translation of yen amounts into U.S. dollar amounts and,in our opinion, such translation has been made on the basis described in Note 2 to theconsolidated financial statements.
June 29, 2000
Report of Certified Public AccountantsJapan Airlines Company, Ltd. and Consolidated Subsidiaries
The Board of DirectorsJapan Airlines Company, Ltd.
40
Thousands of U.S. dollarsNotional Carrying Market Unrealizedamounts amounts value gain (loss)
Fuel price protection arrangements:Caps $84,613 $5,556 $5,622 $ 66(Over one year) ($ –)Collars $55,669 $ – $5,415 $5,415(Over one year) ($ 3,150)Floors $29,283 $ 773 $ 556 $ (207)(Over one year) ($ –)Fuel price swaps $ 9,726 $ – $1,424 $1,424(Over one year) ($ –)
12. Cash and Cash EquivalentsThe components of cash and cash equivalents were as follows:
Thousands of Millions of yen U.S. dollars
March 31, 2000 1999 2000Cash and time deposits ¥139,942 ¥104,249 $1,320,207Time deposits with maturities of more than three months (4,611) (12,772) (43,500)Marketable securities with maturities of three months or less 58,021 92,068 547,367Credit balance of current accounts included in short-term loans (2,937) (607) (27,707)
¥189,715 ¥182,938 $1,789,764
At March 31, 2000, the forward foreign exchange contracts outstanding were as follows:Millions of yen
Notional Market Unrealized March 31, 2000 amounts value gain (loss)
Purchased:U.S. dollars ¥15,904 ¥15,950 ¥46Others 5,465 5,412 (52)
¥21,369 ¥21,363 ¥ (6)
(Over one year) (¥ –)
Thousands of U.S.dollarsNotional Unrealizedamounts gain (loss)
Interest-rate option agreements:Collars $ 9,433 $ (160)(Over one year) ($ 3,773)
Interest-rate swap agreements:Fixed-rate into variable-rate obligations $ 428,018 $ 17,301(Over one year) ($ 143,113)Variable-rate into fixed-rate obligations $1,396,518 $(75,349)(Over one year) ($1,115,698)
The above amounts exclude contracts entered into in order to hedge receivables and payables denominated in foreign currencieswhich have been translated and reflected at the corresponding contracted rates in the accompanying balance sheet at March 31,2000.
At March 31, 2000, interest-rate option and interest-rate swap agreements were as follows:
Millions of yenNotional Unrealized
March 31, 2000 amounts gain (loss)
Interest-rate option agreements:Collars ¥ 1,000 ¥ (17)(Over one year) (¥400)
Interest-rate swap agreements:Fixed-rate into variable-rate obligations ¥ 45,370 ¥ 1,834(Over one year) (¥ 15,170)Variable-rate into fixed-rate obligations ¥ 148,031 ¥(7,987)(Over one year) (¥ 118,264) (¥6,170)
The above amounts exclude swap agreements entered into in order to hedge the principal amounts of outstanding debt and therelated interest denominated in foreign currencies, which have been translated and reflected at the corresponding swap rates inthe accompanying balance sheet at March 31, 2000.At March 31, 2000, fuel price commodity derivatives were as follows:
Thousands of U.S. dollarsNotional Market Unrealized
March 31, 2000 amounts value gain (loss)
Purchased:U.S. dollars $150,037 $150,471 $433Others 51,556 51,056 (490)
$201,594 $201,537 $ (56)
(Over one year) ($ –)
Millions of yenNotional Carrying Market Unrealized
March 31, 2000 amounts amounts value gain (loss)
Fuel price protection arrangements:Caps ¥8,969 ¥589 ¥596 ¥ 7(Over one year) (¥–)Collars ¥5,901 ¥ – ¥574 ¥574(Over one year) (¥ 334)Floors ¥3,104 ¥ 82 ¥ 59 ¥ (22)(Over one year) (¥–)Fuel price swaps ¥1,031 ¥ – ¥151 ¥151(Over one year) (¥–)

43
Thousands ofU.S. dollars
(Note 2)2000
Millions of yen19992000
$ 967,839
940,06673,877
432,556285,858
518727,669
3,428,424
7,089,839
772,933
73,264
1,776,632300,075
5,037253,443
2,335,198
$13,699,679
¥ 74,884
109,6138,486
44,27633,065
25076,906
347,484
779,299
82,676
19,709
188,32331,808
–26,282
246,415
¥1,475,584
¥ 102,591
99,6477,831
45,85130,301
5577,133
363,413
751,523
81,931
7,766
188,32331,808
53426,865
247,531
¥1,452,166
Current liabilities:Current portion of long-term debtAccounts payable:
TradeConstructionSubsidiaries and affiliates
Accrued expensesAccrued income taxes (Note 3)Other
Total current liabilities
Long-term debt
Accrued severance indemnities
Reserve for loss on investments in subsidiaries and affiliates
Commitments and contingent liabilities(Notes 5 and 6)
Stockholders' equity:Common stock, ¥50 par value:
Authorized: 6,000,000,000 sharesIssued: 1,778,943,439 shares
Additional paid-in capitalLegal reserve (Note 4)Retained earnings
Total stockholders’ equity
Liabilities and Stockholders' Equity
The accompanying notes are an integral part of these statements.
42
$ 682,650 785,094
755,962412,650
(3,547)515,349
50,132 503,415
3,701,726
1,261,028 366,877
1,627,915
12,487,396 4,273,660
16,761,056 (8,802,009)
7,959,047 60,132
8,019,179
111,773 4,084
234,971
$13,699,679
Thousands ofU.S. dollars
(Note 2)2000
Millions of yen19992000
¥ 31,364 123,182
76,96341,022
(595)54,259
–59,869
386,066
154,063 37,940
192,004
1,302,095 458,501
1,760,596 (943,315)
817,281 44,732
862,014
13,060 –
22,439
¥1,475,584
¥ 72,361 83,220
80,13243,741
(376)54,627
5,314 53,362
392,383
133,669 38,889
172,559
1,323,664 453,008
1,776,672 (933,013)
843,659 6,374
850,033
11,848 433
24,907
¥1,452,166
Current assets:Cash and time depositsMarketable securities, at costAccounts receivable:
Trade (Note 6)Subsidiaries and affiliatesAllowance for doubtful accounts
Flight equipment spare parts, at costDeferred income taxes (Note 3)Prepaid expenses and other
Total current assets
Investments and advances:Subsidiaries and affiliatesOther, at cost
Total investments and advances
Property and equipment (Notes 1 and 6):Flight equipmentGround property and equipment
Accumulated depreciation
Advances on aircraft purchases and other
Property and equipment, net
Long-term loans (Note 6)Deferred income taxes (Note 3)Other assets
Assets
Non-Consolidated Balance SheetsJapan Airlines Company, Ltd.March 31, 2000 and 1999

45
Balance at March 31, 1997Net loss for the year ended March 31,1998
Balance at March 31, 1998Net income for the year ended March31,1999
Elimination of accumulated deficit (Note 7)Balance at March 31, 1999
Cumulative effect of adoption of tax-effectaccounting (Note 3)
Net loss for the year ended March 31,2000Legal reserveCash dividends(¥3 per share)
Balance at March 31, 2000
Balance at March 31, 1999Cumulative effect of adoption of tax-effectaccounting (Note 3)
Net loss for the year ended March 31,2000Legal reserveCash dividends($0.028 per share)
Balance at March 31, 2000
Non-Consolidated Statements of Stockholders' EquityJapan Airlines Company, Ltd.For the Years Ended March 31, 2000, 1999 and 1998
¥314,321(94,189)220,132
26,282–
246,415
12,109
(5,655)–
(5,336)
¥247,531
$ 2,324,169
114,235(53,349)
–(50,339)
$2,335,198
Total
Retainedearnings(deficit)
Legalreserve
(Note 4)
¥ (43,108)(94,189)
(137,298)
26,282137,298 26,282
12,109
(5,655)(534)
(5,336)
¥ 26,865
$247,943
114,235(53,349)(5,037)
(50,339)
$253,443
¥ 7,330
7,330
(7,330) –
534
¥ 534
$ –
5,037
$5,037
Additionalpaid-incapital
¥161,776
161,776
(129,968)31,808
¥ 31,808
$ 300,075
$300,075
Commonstock
¥188,323
188,323
188,323
¥188,323
$ 1,776,632
$1,776,632
Number of shares of
common stock
1,778,943,439
1,778,943,439
1,778,943,439
1,778,943,439
Commonstock
Additionalpaid-incapital
Legalreserve
(Note 4)
Retainedearnings(deficit) Total
The accompanying notes are an integral part of these statements.
Millions of yen
Thousands of U.S. dollars (Note 2)
44
$ 2,602,132 5,472,235
255,3581,350,6691,335,443
11,015,858
3,043,311905,556
1,300,5562,095,6881,736,188
363,311601,141698,792
10,744,584
271,264
42,273(286,339)
(44,349)31,188 46,254 60,094 18,283
220,754 (15,132)
(3,056)(15,000)
(158,773)
(70,858)(57,094)
–(31,179)
(262,952)
8,311
1,650 60,018
$ (53,349)
Thousands ofU.S. dollars
(Note 2)2000
Millions of yen19981999
¥ 293,364 624,469
28,046150,214123,611
1,219,706
349,06894,486
143,456238,547191,953
38,15162,67270,115
1,188,451
31,254
4,739(35,115)
(232)6,642
146 3,259
11,696 42
(858)––
(72,053)
(24,994)(15,203)
(366)(2,793)
(125,091)
(93,836)
353 –
¥ (94,189)
¥ 279,059 581,623
26,768142,395127,807
1,157,653
317,43696,330
137,867234,132177,540
34,42566,66468,436
1,132,833
24,820
8,145(32,687)
(2,596)19,101
0 15,366
2,650 3,765 (834)
(2,819)––
(2,529)(5,414)
(167)373
2,353
27,173
891 –
¥ 26,282
2000
¥ 275,826 580,057
27,068143,171141,557
1,167,681
322,59195,989
137,859222,143184,036
38,51163,72174,072
1,138,926
28,754
4,481(30,352)
(4,701)3,306 4,903 6,370 1,938
23,400 (1,604)
(324)(1,590)
(16,830)
(7,511)(6,052)
–(3,305)
(27,873)
881
175 6,362
¥ (5,655)
Operating revenues:Passenger:
DomesticInternational
Cargo:DomesticInternational
Incidental and other revenues
Operating expenses (Note 5):Flight operationsMaintenancePassenger servicesAircraft and traffic servicingSales and advertisingGeneral and administrativeDepreciation and amortizationCost of incidental and other expenses
Operating income
Non-operating income (expenses):Interest and dividend incomeInterest expenseExchange loss, netAircraft purchase incentivesGain on sales of marketable securitiesGain on sales of aircraftGain on sales of ground property and equipmentGain on sales of investments in securitiesLoss on disposal of fixed assetsLoss on revaluation of marketable securitiesLoss on revaluation of investments in securitiesLoss on investments in subsidiaries and affiliatesProvision for reserve for loss on investments in subsidiaries andaffiliates
Special termination benefitsLoss on liquidation of operations of subsidiaries and affiliatesOther, net
Income (loss) before income taxesIncome taxes (Note 3):
CurrentDeferred
Net (loss) income
Non-Consolidated Statements of OperationsJapan Airlines Company, Ltd.
For the Years Ended March 31, 2000, 1999 and 1998
The accompanying notes are an integral part of these statements.
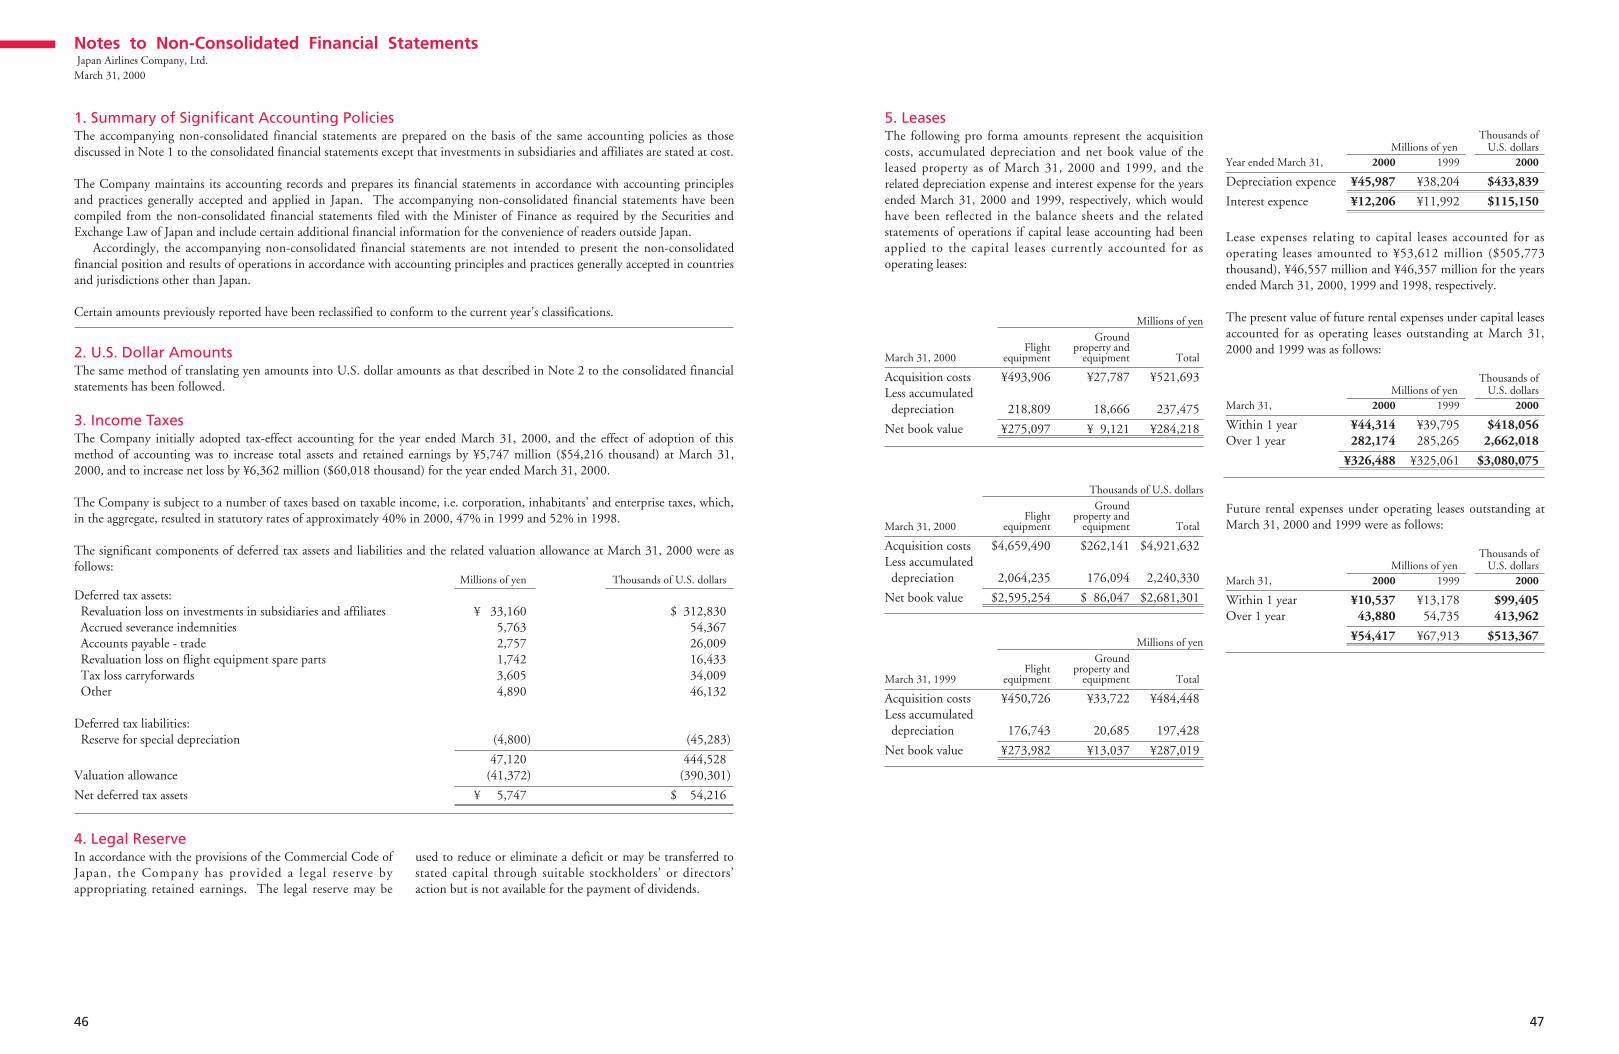
47
The following pro forma amounts represent the acquisitioncosts, accumulated depreciation and net book value of theleased property as of March 31, 2000 and 1999, and therelated depreciation expense and interest expense for the yearsended March 31, 2000 and 1999, respectively, which wouldhave been reflected in the balance sheets and the relatedstatements of operations if capital lease accounting had beenapplied to the capital leases currently accounted for asoperating leases:
Millions of yen
GroundFlight property and
March 31, 2000 equipment equipment Total
Acquisition costs ¥493,906 ¥27,787 ¥521,693Less accumulated
depreciation 218,809 18,666 237,475
Net book value ¥275,097 ¥ 9,121 ¥284,218
Thousands of U.S. dollars
GroundFlight property and
March 31, 2000 equipment equipment Total
Acquisition costs $4,659,490 $262,141 $4,921,632Less accumulated
depreciation 2,064,235 176,094 2,240,330
Net book value $2,595,254 $ 86,047 $2,681,301
Millions of yen
GroundFlight property and
March 31, 1999 equipment equipment Total
Acquisition costs ¥450,726 ¥33,722 ¥484,448Less accumulated
depreciation 176,743 20,685 197,428
Net book value ¥273,982 ¥13,037 ¥287,019
Thousands of Millions of yen U.S. dollars
Year ended March 31, 2000 1999 2000
Depreciation expence ¥45,987 ¥38,204 $433,839
Interest expence ¥12,206 ¥11,992 $115,150
Lease expenses relating to capital leases accounted for asoperating leases amounted to ¥53,612 million ($505,773thousand), ¥46,557 million and ¥46,357 million for the yearsended March 31, 2000, 1999 and 1998, respectively.
The present value of future rental expenses under capital leasesaccounted for as operating leases outstanding at March 31,2000 and 1999 was as follows:
Thousands of Millions of yen U.S. dollars
March 31, 2000 1999 2000
Within 1 year ¥44,314 ¥39,795 $418,056Over 1 year 282,174 285,265 2,662,018
¥326,488 ¥325,061 $3,080,075
Future rental expenses under operating leases outstanding atMarch 31, 2000 and 1999 were as follows:
Thousands of Millions of yen U.S. dollars
March 31, 2000 1999 2000
Within 1 year ¥10,537 ¥13,178 $99,405Over 1 year 43,880 54,735 413,962
¥54,417 ¥67,913 $513,367
5. Leases
46
The accompanying non-consolidated financial statements are prepared on the basis of the same accounting policies as thosediscussed in Note 1 to the consolidated financial statements except that investments in subsidiaries and affiliates are stated at cost.
The Company maintains its accounting records and prepares its financial statements in accordance with accounting principlesand practices generally accepted and applied in Japan. The accompanying non-consolidated financial statements have beencompiled from the non-consolidated financial statements filed with the Minister of Finance as required by the Securities andExchange Law of Japan and include certain additional financial information for the convenience of readers outside Japan.
Accordingly, the accompanying non-consolidated financial statements are not intended to present the non-consolidatedfinancial position and results of operations in accordance with accounting principles and practices generally accepted in countriesand jurisdictions other than Japan.
Certain amounts previously reported have been reclassified to conform to the current year’s classifications.
1. Summary of Significant Accounting Policies
2. U.S. Dollar Amounts
3. Income Taxes
4. Legal Reserve
Notes to Non-Consolidated Financial StatementsJapan Airlines Company, Ltd.
March 31, 2000
The same method of translating yen amounts into U.S. dollar amounts as that described in Note 2 to the consolidated financialstatements has been followed.
The Company initially adopted tax-effect accounting for the year ended March 31, 2000, and the effect of adoption of thismethod of accounting was to increase total assets and retained earnings by ¥5,747 million ($54,216 thousand) at March 31,2000, and to increase net loss by ¥6,362 million ($60,018 thousand) for the year ended March 31, 2000.
The Company is subject to a number of taxes based on taxable income, i.e. corporation, inhabitants’ and enterprise taxes, which,in the aggregate, resulted in statutory rates of approximately 40% in 2000, 47% in 1999 and 52% in 1998.
The significant components of deferred tax assets and liabilities and the related valuation allowance at March 31, 2000 were asfollows:
In accordance with the provisions of the Commercial Code ofJapan, the Company has provided a legal reserve byappropriating retained earnings. The legal reserve may be
used to reduce or eliminate a deficit or may be transferred tostated capital through suitable stockholders’ or directors’action but is not available for the payment of dividends.
Millions of yen Thousands of U.S. dollars
Deferred tax assets:Revaluation loss on investments in subsidiaries and affiliates ¥ 33,160 $ 312,830 Accrued severance indemnities 5,763 54,367Accounts payable - trade 2,757 26,009Revaluation loss on flight equipment spare parts 1,742 16,433Tax loss carryforwards 3,605 34,009Other 4,890 46,132
Deferred tax liabilities:Reserve for special depreciation (4,800) (45,283)
47,120 444,528 Valuation allowance (41,372) (390,301)
Net deferred tax assets ¥ 5,747 $ 54,216
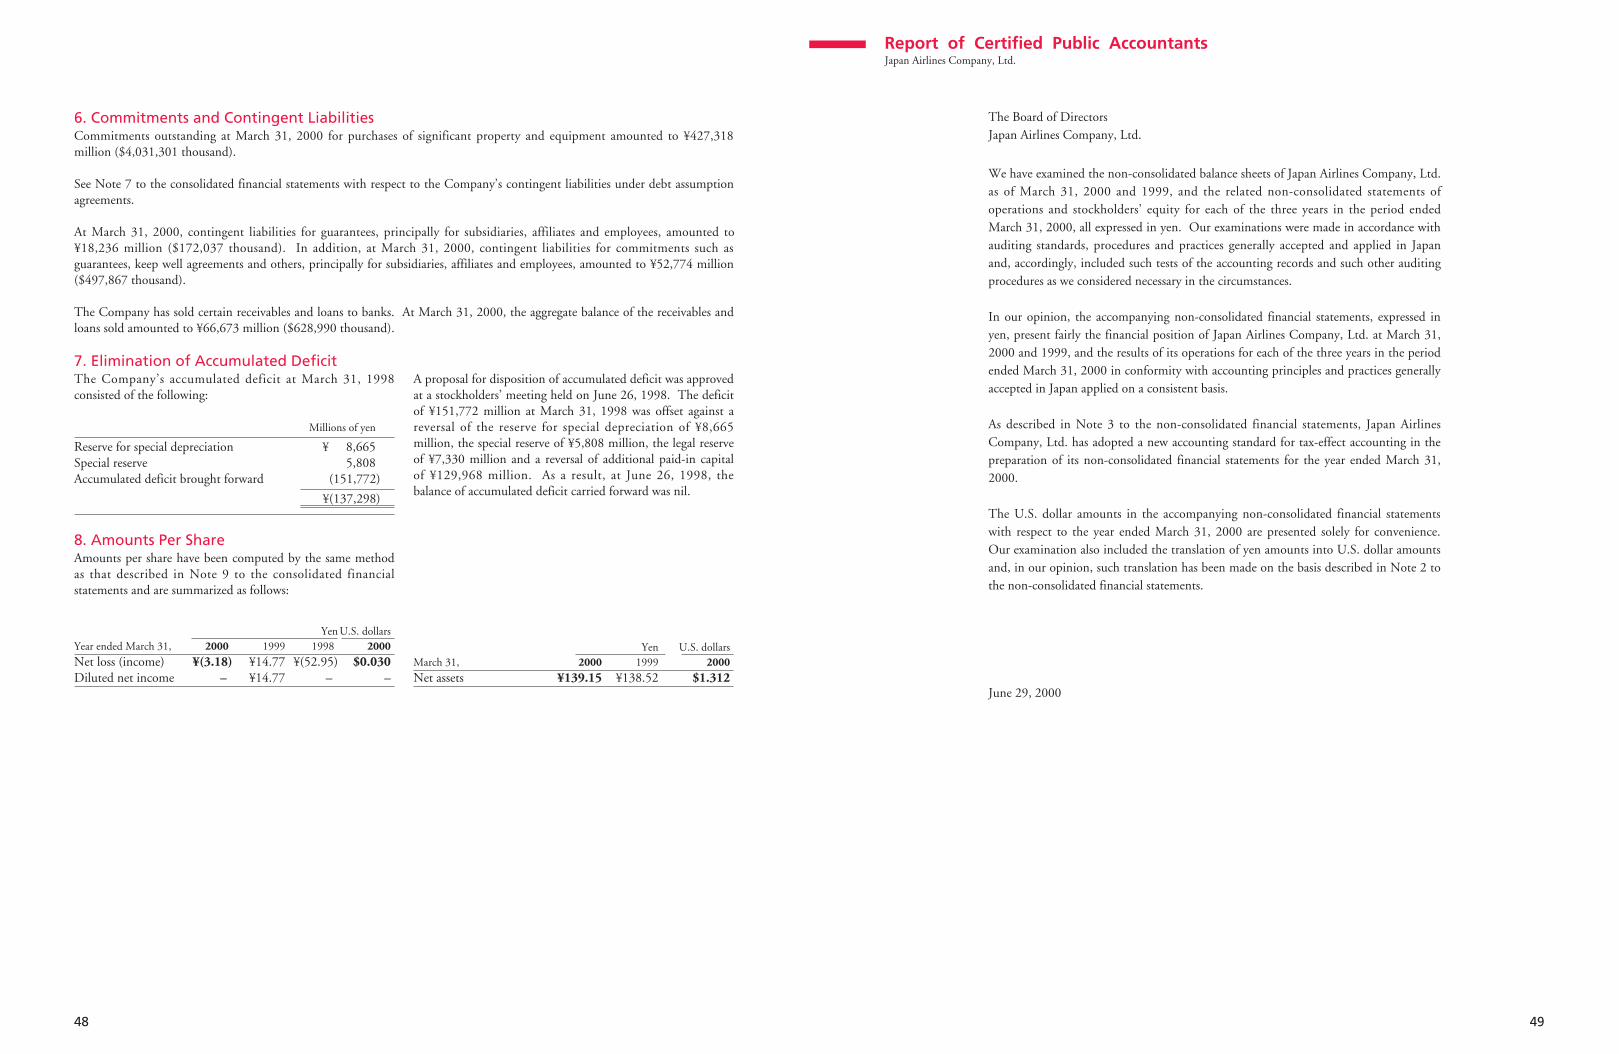
49
We have examined the non-consolidated balance sheets of Japan Airlines Company, Ltd.as of March 31, 2000 and 1999, and the related non-consolidated statements ofoperations and stockholders’ equity for each of the three years in the period endedMarch 31, 2000, all expressed in yen. Our examinations were made in accordance withauditing standards, procedures and practices generally accepted and applied in Japanand, accordingly, included such tests of the accounting records and such other auditingprocedures as we considered necessary in the circumstances.
In our opinion, the accompanying non-consolidated financial statements, expressed inyen, present fairly the financial position of Japan Airlines Company, Ltd. at March 31,2000 and 1999, and the results of its operations for each of the three years in the periodended March 31, 2000 in conformity with accounting principles and practices generallyaccepted in Japan applied on a consistent basis.
As described in Note 3 to the non-consolidated financial statements, Japan AirlinesCompany, Ltd. has adopted a new accounting standard for tax-effect accounting in thepreparation of its non-consolidated financial statements for the year ended March 31,2000.
The U.S. dollar amounts in the accompanying non-consolidated financial statementswith respect to the year ended March 31, 2000 are presented solely for convenience.Our examination also included the translation of yen amounts into U.S. dollar amountsand, in our opinion, such translation has been made on the basis described in Note 2 tothe non-consolidated financial statements.
June 29, 2000
The Board of DirectorsJapan Airlines Company, Ltd.
Report of Certified Public AccountantsJapan Airlines Company, Ltd.
48
7. Elimination of Accumulated DeficitThe Company’s accumulated deficit at March 31, 1998consisted of the following:
Millions of yen
Reserve for special depreciation ¥ 8,665Special reserve 5,808Accumulated deficit brought forward (151,772)
¥(137,298)
8. Amounts Per ShareAmounts per share have been computed by the same methodas that described in Note 9 to the consolidated financialstatements and are summarized as follows:
Yen U.S. dollarsYear ended March 31, 2000 1999 1998 2000
Net loss (income) ¥(3.18) ¥14.77 ¥(52.95) $0.030Diluted net income – ¥14.77 – –
Yen U.S. dollarsMarch 31, 2000 1999 2000
Net assets ¥139.15 ¥138.52 $1.312
6. Commitments and Contingent LiabilitiesCommitments outstanding at March 31, 2000 for purchases of significant property and equipment amounted to ¥427,318million ($4,031,301 thousand).
See Note 7 to the consolidated financial statements with respect to the Company’s contingent liabilities under debt assumptionagreements.
At March 31, 2000, contingent liabilities for guarantees, principally for subsidiaries, affiliates and employees, amounted to¥18,236 million ($172,037 thousand). In addition, at March 31, 2000, contingent liabilities for commitments such asguarantees, keep well agreements and others, principally for subsidiaries, affiliates and employees, amounted to ¥52,774 million($497,867 thousand).
The Company has sold certain receivables and loans to banks. At March 31, 2000, the aggregate balance of the receivables andloans sold amounted to ¥66,673 million ($628,990 thousand).
A proposal for disposition of accumulated deficit was approvedat a stockholders’ meeting held on June 26, 1998. The deficitof ¥151,772 million at March 31, 1998 was offset against areversal of the reserve for special depreciation of ¥8,665million, the special reserve of ¥5,808 million, the legal reserveof ¥7,330 million and a reversal of additional paid-in capitalof ¥129,968 million. As a result, at June 26, 1998, thebalance of accumulated deficit carried forward was nil.
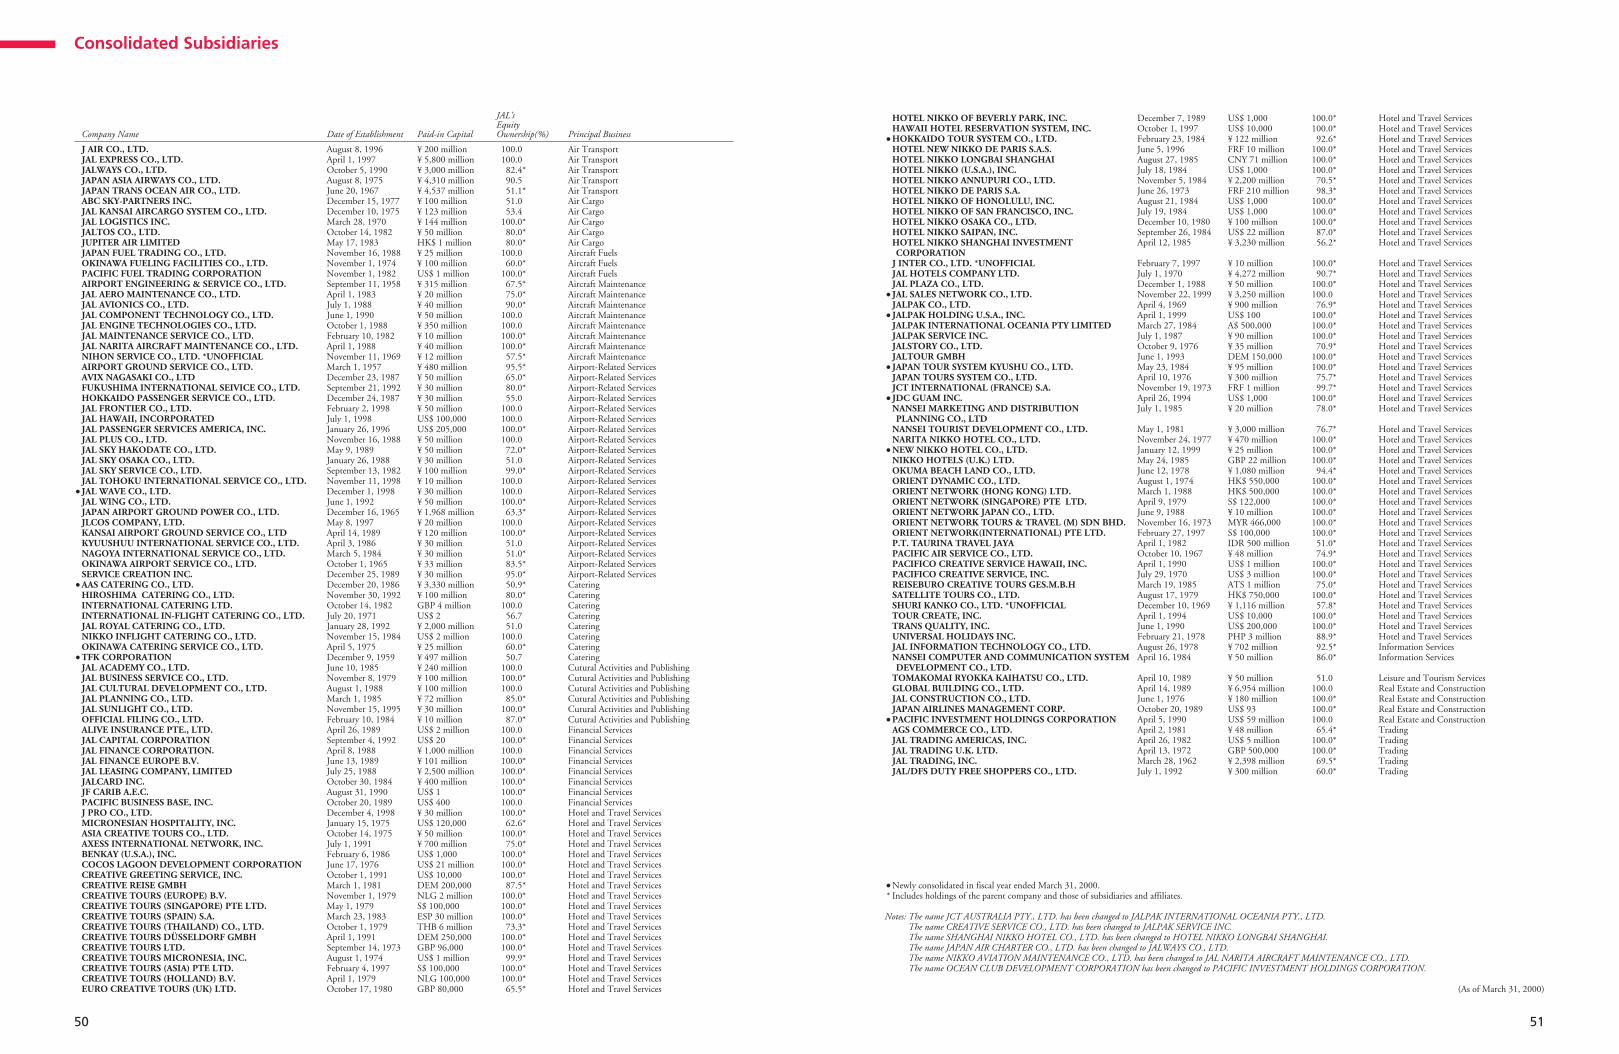
51
100.0*100.0*92.6*
100.0*100.0*100.0*70.5*98.3*
100.0*100.0*100.0*87.0*56.2*
100.0*90.7*
100.0*100.076.9*
100.0*100.0*100.0*70.9*
100.0*100.0*75.7*99.7*
100.0*78.0*
76.7*100.0*100.0*100.0*94.4*
100.0*100.0*100.0*100.0*100.0*100.0*51.0*74.9*
100.0*100.0*75.0*
100.0*57.8*
100.0*100.0*88.9*92.5*86.0*
51.0100.0100.0*100.0*100.065.4*
100.0*100.0*69.5*60.0*
Hotel and Travel ServicesHotel and Travel ServicesHotel and Travel ServicesHotel and Travel ServicesHotel and Travel ServicesHotel and Travel ServicesHotel and Travel ServicesHotel and Travel ServicesHotel and Travel ServicesHotel and Travel ServicesHotel and Travel ServicesHotel and Travel ServicesHotel and Travel Services
Hotel and Travel ServicesHotel and Travel ServicesHotel and Travel ServicesHotel and Travel ServicesHotel and Travel ServicesHotel and Travel ServicesHotel and Travel ServicesHotel and Travel ServicesHotel and Travel ServicesHotel and Travel ServicesHotel and Travel ServicesHotel and Travel ServicesHotel and Travel ServicesHotel and Travel ServicesHotel and Travel Services
Hotel and Travel ServicesHotel and Travel ServicesHotel and Travel ServicesHotel and Travel ServicesHotel and Travel ServicesHotel and Travel ServicesHotel and Travel ServicesHotel and Travel ServicesHotel and Travel ServicesHotel and Travel ServicesHotel and Travel ServicesHotel and Travel ServicesHotel and Travel ServicesHotel and Travel ServicesHotel and Travel ServicesHotel and Travel ServicesHotel and Travel ServicesHotel and Travel ServicesHotel and Travel ServicesHotel and Travel ServicesHotel and Travel ServicesInformation ServicesInformation Services
Leisure and Tourism ServicesReal Estate and ConstructionReal Estate and ConstructionReal Estate and ConstructionReal Estate and ConstructionTradingTradingTradingTradingTrading
US$ 1,000 US$ 10,000 ¥ 122 millionFRF 10 millionCNY 71 millionUS$ 1,000 ¥ 2,200 millionFRF 210 millionUS$ 1,000 US$ 1,000 ¥ 100 millionUS$ 22 million¥ 3,230 million
¥ 10 million¥ 4,272 million¥ 50 million¥ 3,250 million¥ 900 millionUS$ 100 A$ 500,000 ¥ 90 million¥ 35 millionDEM 150,000 ¥ 95 million¥ 300 millionFRF 1 millionUS$ 1,000 ¥ 20 million
¥ 3,000 million¥ 470 million¥ 25 millionGBP 22 million¥ 1,080 millionHK$ 550,000 HK$ 500,000 S$ 122,000 ¥ 10 millionMYR 466,000 S$ 100,000 IDR 500 million¥ 48 millionUS$ 1 millionUS$ 3 millionATS 1 millionHK$ 750,000 ¥ 1,116 millionUS$ 10,000 US$ 200,000 PHP 3 million¥ 702 million¥ 50 million
¥ 50 million¥ 6,954 million¥ 180 millionUS$ 93 US$ 59 million¥ 48 millionUS$ 5 millionGBP 500,000 ¥ 2,398 million¥ 300 million
December 7, 1989October 1, 1997February 23, 1984June 5, 1996August 27, 1985July 18, 1984November 5, 1984June 26, 1973August 21, 1984July 19, 1984December 10, 1980September 26, 1984April 12, 1985
February 7, 1997July 1, 1970December 1, 1988November 22, 1999April 4, 1969April 1, 1999March 27, 1984July 1, 1987October 9, 1976June 1, 1993May 23, 1984April 10, 1976November 19, 1973April 26, 1994July 1, 1985
May 1, 1981November 24, 1977January 12, 1999May 24, 1985June 12, 1978August 1, 1974March 1, 1988April 9, 1979June 9, 1988November 16, 1973February 27, 1997April 1, 1982October 10, 1967April 1, 1990July 29, 1970March 19, 1985August 17, 1979December 10, 1969April 1, 1994June 1, 1990February 21, 1978August 26, 1978April 16, 1984
April 10, 1989April 14, 1989June 1, 1976October 20, 1989April 5, 1990April 2, 1981April 26, 1982April 13, 1972March 28, 1962July 1, 1992
HOTEL NIKKO OF BEVERLY PARK, INC.HAWAII HOTEL RESERVATION SYSTEM, INC.
¡HOKKAIDO TOUR SYSTEM CO., LTD.HOTEL NEW NIKKO DE PARIS S.A.S.HOTEL NIKKO LONGBAI SHANGHAIHOTEL NIKKO (U.S.A.), INC.HOTEL NIKKO ANNUPURI CO., LTD.HOTEL NIKKO DE PARIS S.A.HOTEL NIKKO OF HONOLULU, INC.HOTEL NIKKO OF SAN FRANCISCO, INC.HOTEL NIKKO OSAKA CO., LTD.HOTEL NIKKO SAIPAN, INC.HOTEL NIKKO SHANGHAI INVESTMENTCORPORATION
J INTER CO., LTD. *UNOFFICIALJAL HOTELS COMPANY LTD.JAL PLAZA CO., LTD.
¡JAL SALES NETWORK CO., LTD.JALPAK CO., LTD.
¡JALPAK HOLDING U.S.A., INC.JALPAK INTERNATIONAL OCEANIA PTY LIMITEDJALPAK SERVICE INC.JALSTORY CO., LTD.JALTOUR GMBH
¡JAPAN TOUR SYSTEM KYUSHU CO., LTD.JAPAN TOURS SYSTEM CO., LTD.JCT INTERNATIONAL (FRANCE) S.A.
¡JDC GUAM INC.NANSEI MARKETING AND DISTRIBUTIONPLANNING CO., LTD
NANSEI TOURIST DEVELOPMENT CO., LTD.NARITA NIKKO HOTEL CO., LTD.
¡NEW NIKKO HOTEL CO., LTD.NIKKO HOTELS (U.K.) LTD.OKUMA BEACH LAND CO., LTD.ORIENT DYNAMIC CO., LTD.ORIENT NETWORK (HONG KONG) LTD.ORIENT NETWORK (SINGAPORE) PTE LTD.ORIENT NETWORK JAPAN CO., LTD.ORIENT NETWORK TOURS & TRAVEL (M) SDN BHD.ORIENT NETWORK(INTERNATIONAL) PTE LTD.P.T. TAURINA TRAVEL JAYAPACIFIC AIR SERVICE CO., LTD.PACIFICO CREATIVE SERVICE HAWAII, INC.PACIFICO CREATIVE SERVICE, INC.REISEBURO CREATIVE TOURS GES.M.B.HSATELLITE TOURS CO., LTD.SHURI KANKO CO., LTD. *UNOFFICIALTOUR CREATE, INC.TRANS QUALITY, INC.UNIVERSAL HOLIDAYS INC.JAL INFORMATION TECHNOLOGY CO., LTD.NANSEI COMPUTER AND COMMUNICATION SYSTEMDEVELOPMENT CO., LTD.
TOMAKOMAI RYOKKA KAIHATSU CO., LTD.GLOBAL BUILDING CO., LTD.JAL CONSTRUCTION CO., LTD.JAPAN AIRLINES MANAGEMENT CORP.
¡PACIFIC INVESTMENT HOLDINGS CORPORATIONAGS COMMERCE CO., LTD.JAL TRADING AMERICAS, INC.JAL TRADING U.K. LTD.JAL TRADING, INC.JAL/DFS DUTY FREE SHOPPERS CO., LTD.
¡Newly consolidated in fiscal year ended March 31, 2000.* Includes holdings of the parent company and those of subsidiaries and affiliates.
Notes: The name JCT AUSTRALIA PTY., LTD. has been changed to JALPAK INTERNATIONAL OCEANIA PTY., LTD.The name CREATIVE SERVICE CO., LTD. has been changed to JALPAK SERVICE INC.The name SHANGHAI NIKKO HOTEL CO., LTD. has been changed to HOTEL NIKKO LONGBAI SHANGHAI.The name JAPAN AIR CHARTER CO., LTD. has been changed to JALWAYS CO., LTD.The name NIKKO AVIATION MAINTENANCE CO., LTD. has been changed to JAL NARITA AIRCRAFT MAINTENANCE CO., LTD.The name OCEAN CLUB DEVELOPMENT CORPORATION has been changed to PACIFIC INVESTMENT HOLDINGS CORPORATION.
(As of March 31, 2000)
50
100.0100.082.4*90.551.1*51.053.4
100.0*80.0*80.0*
100.060.0*
100.0*67.5*75.0*90.0*
100.0100.0100.0*100.0*57.5*95.5*65.0*80.0*55.0
100.0100.0100.0*100.072.0*51.099.0*
100.0100.0100.0*63.3*
100.0100.0*51.051.0*83.5*95.0*50.9*80.0*
100.056.751.0
100.060.0*50.7
100.0100.0*100.085.0*
100.0*87.0*
100.0100.0*100.0100.0*100.0*100.0*100.0*100.0100.0*62.6*
100.0*75.0*
100.0*100.0*100.0*87.5*
100.0*100.0*100.0*73.3*
100.0*100.0*99.9*
100.0*100.0*65.5*
Air TransportAir TransportAir TransportAir TransportAir TransportAir CargoAir CargoAir CargoAir CargoAir CargoAircraft FuelsAircraft FuelsAircraft FuelsAircraft MaintenanceAircraft MaintenanceAircraft MaintenanceAircraft MaintenanceAircraft MaintenanceAircraft MaintenanceAircraft MaintenanceAircraft MaintenanceAirport-Related ServicesAirport-Related ServicesAirport-Related ServicesAirport-Related ServicesAirport-Related ServicesAirport-Related ServicesAirport-Related ServicesAirport-Related ServicesAirport-Related ServicesAirport-Related ServicesAirport-Related ServicesAirport-Related ServicesAirport-Related ServicesAirport-Related ServicesAirport-Related ServicesAirport-Related ServicesAirport-Related ServicesAirport-Related ServicesAirport-Related ServicesAirport-Related ServicesAirport-Related ServicesCateringCateringCateringCateringCateringCateringCateringCateringCutural Activities and PublishingCutural Activities and PublishingCutural Activities and PublishingCutural Activities and PublishingCutural Activities and PublishingCutural Activities and PublishingFinancial ServicesFinancial ServicesFinancial ServicesFinancial ServicesFinancial ServicesFinancial ServicesFinancial ServicesFinancial ServicesHotel and Travel ServicesHotel and Travel ServicesHotel and Travel ServicesHotel and Travel ServicesHotel and Travel ServicesHotel and Travel ServicesHotel and Travel ServicesHotel and Travel ServicesHotel and Travel ServicesHotel and Travel ServicesHotel and Travel ServicesHotel and Travel ServicesHotel and Travel ServicesHotel and Travel ServicesHotel and Travel ServicesHotel and Travel ServicesHotel and Travel ServicesHotel and Travel Services
Date of Establishment Paid-in Capital
JAL’s Equity Ownership(%) Principal Business
¥ 200 million¥ 5,800 million¥ 3,000 million¥ 4,310 million¥ 4,537 million¥ 100 million¥ 123 million¥ 144 million¥ 50 millionHK$ 1 million¥ 25 million¥ 100 millionUS$ 1 million¥ 315 million¥ 20 million¥ 40 million¥ 50 million¥ 350 million¥ 10 million¥ 40 million¥ 12 million¥ 480 million¥ 50 million¥ 30 million¥ 30 million¥ 50 millionUS$ 100,000 US$ 205,000 ¥ 50 million¥ 50 million¥ 30 million¥ 100 million¥ 10 million¥ 30 million¥ 50 million¥ 1,968 million¥ 20 million¥ 120 million¥ 30 million¥ 30 million¥ 33 million¥ 30 million¥ 3,330 million¥ 100 millionGBP 4 millionUS$ 2 ¥ 2,000 millionUS$ 2 million¥ 25 million¥ 497 million¥ 240 million¥ 100 million¥ 100 million¥ 72 million¥ 30 million¥ 10 millionUS$ 2 millionUS$ 20 ¥ 1,000 million¥ 101 million¥ 2,500 million¥ 400 millionUS$ 1 US$ 400 ¥ 30 millionUS$ 120,000 ¥ 50 million¥ 700 millionUS$ 1,000 US$ 21 millionUS$ 10,000 DEM 200,000 NLG 2 millionS$ 100,000 ESP 30 millionTHB 6 millionDEM 250,000 GBP 96,000 US$ 1 millionS$ 100,000 NLG 100,000 GBP 80,000
August 8, 1996April 1, 1997October 5, 1990August 8, 1975June 20, 1967December 15, 1977December 10, 1975March 28, 1970October 14, 1982May 17, 1983November 16, 1988November 1, 1974November 1, 1982September 11, 1958April 1, 1983July 1, 1988June 1, 1990October 1, 1988February 10, 1982April 1, 1988November 11, 1969March 1, 1957December 23, 1987September 21, 1992December 24, 1987February 2, 1998July 1, 1998January 26, 1996November 16, 1988May 9, 1989January 26, 1988September 13, 1982November 11, 1998December 1, 1998June 1, 1992December 16, 1965May 8, 1997April 14, 1989April 3, 1986March 5, 1984October 1, 1965December 25, 1989December 20, 1986November 30, 1992October 14, 1982July 20, 1971January 28, 1992November 15, 1984April 5, 1975December 9, 1959June 10, 1985November 8, 1979August 1, 1988March 1, 1985November 15, 1995February 10, 1984April 26, 1989September 4, 1992April 8, 1988June 13, 1989July 25, 1988October 30, 1984August 31, 1990October 20, 1989December 4, 1998January 15, 1975October 14, 1975July 1, 1991February 6, 1986June 17, 1976October 1, 1991March 1, 1981November 1, 1979May 1, 1979March 23, 1983October 1, 1979April 1, 1991September 14, 1973August 1, 1974February 4, 1997April 1, 1979October 17, 1980
J AIR CO., LTD.JAL EXPRESS CO., LTD.JALWAYS CO., LTD.JAPAN ASIA AIRWAYS CO., LTD.JAPAN TRANS OCEAN AIR CO., LTD.ABC SKY-PARTNERS INC.JAL KANSAI AIRCARGO SYSTEM CO., LTD.JAL LOGISTICS INC.JALTOS CO., LTD.JUPITER AIR LIMITEDJAPAN FUEL TRADING CO., LTD.OKINAWA FUELING FACILITIES CO., LTD.PACIFIC FUEL TRADING CORPORATIONAIRPORT ENGINEERING & SERVICE CO., LTD.JAL AERO MAINTENANCE CO., LTD.JAL AVIONICS CO., LTD.JAL COMPONENT TECHNOLOGY CO., LTD.JAL ENGINE TECHNOLOGIES CO., LTD.JAL MAINTENANCE SERVICE CO., LTD.JAL NARITA AIRCRAFT MAINTENANCE CO., LTD.NIHON SERVICE CO., LTD. *UNOFFICIALAIRPORT GROUND SERVICE CO., LTD.AVIX NAGASAKI CO., LTDFUKUSHIMA INTERNATIONAL SEIVICE CO., LTD.HOKKAIDO PASSENGER SERVICE CO., LTD.JAL FRONTIER CO., LTD.JAL HAWAII, INCORPORATEDJAL PASSENGER SERVICES AMERICA, INC.JAL PLUS CO., LTD.JAL SKY HAKODATE CO., LTD.JAL SKY OSAKA CO., LTD.JAL SKY SERVICE CO., LTD.JAL TOHOKU INTERNATIONAL SERVICE CO., LTD.
¡JAL WAVE CO., LTD.JAL WING CO., LTD.JAPAN AIRPORT GROUND POWER CO., LTD.JLCOS COMPANY, LTD.KANSAI AIRPORT GROUND SERVICE CO., LTDKYUUSHUU INTERNATIONAL SERVICE CO., LTD.NAGOYA INTERNATIONAL SERVICE CO., LTD.OKINAWA AIRPORT SERVICE CO., LTD.SERVICE CREATION INC.
¡AAS CATERING CO., LTD.HIROSHIMA CATERING CO., LTD.INTERNATIONAL CATERING LTD.INTERNATIONAL IN-FLIGHT CATERING CO., LTD.JAL ROYAL CATERING CO., LTD.NIKKO INFLIGHT CATERING CO., LTD.OKINAWA CATERING SERVICE CO., LTD.
¡TFK CORPORATIONJAL ACADEMY CO., LTD.JAL BUSINESS SERVICE CO., LTD.JAL CULTURAL DEVELOPMENT CO., LTD.JAL PLANNING CO., LTD.JAL SUNLIGHT CO., LTD.OFFICIAL FILING CO., LTD.ALIVE INSURANCE PTE., LTD.JAL CAPITAL CORPORATIONJAL FINANCE CORPORATION.JAL FINANCE EUROPE B.V.JAL LEASING COMPANY, LIMITEDJALCARD INC.JF CARIB A.E.C.PACIFIC BUSINESS BASE, INC.J PRO CO., LTD.MICRONESIAN HOSPITALITY, INC.ASIA CREATIVE TOURS CO., LTD.AXESS INTERNATIONAL NETWORK, INC.BENKAY (U.S.A.), INC.COCOS LAGOON DEVELOPMENT CORPORATIONCREATIVE GREETING SERVICE, INC.CREATIVE REISE GMBHCREATIVE TOURS (EUROPE) B.V.CREATIVE TOURS (SINGAPORE) PTE LTD.CREATIVE TOURS (SPAIN) S.A.CREATIVE TOURS (THAILAND) CO., LTD.CREATIVE TOURS DÜSSELDORF GMBHCREATIVE TOURS LTD.CREATIVE TOURS MICRONESIA, INC.CREATIVE TOURS (ASIA) PTE LTD.CREATIVE TOURS (HOLLAND) B.V.EURO CREATIVE TOURS (UK) LTD.
Consolidated Subsidiaries
Company Name

JALPAK CO., LTD.JALPAK DE MEXICO S.A. DE C.V.JALPAK HOLDING U.S.A., INC.JALPAK INTERNATIONAL OCEANIA PTYLIMITED
JALPAK SERVICE INC.JALSTORY CO., LTD.JALTOUR GMBHJAPAN AIRLINES DEVELOPMENT GMBHDÜSSELDORF
JAPAN COUPON SERVICE CO., LTD.JAPAN TOUR SYSTEM KYUSHU CO., LTD.JAPAN TOURS SYSTEM CO., LTD.JAPAN TOURS SYSTEM EHIME CO., LTD.JAPAN TOURS SYSTEM FUKUSHIMA CO., LTD.JAPAN TOURS SYSTEM HIROSHIMA CO., LTD.JAPAN TOURS SYSTEM SAGA CO., LTD.JAPAN TOURS SYSTEM TOCHIGI CO., LTD.JCT INTERNATIONAL (FRANCE) S.A.JDC (PACIFIC) LTD.JDC GUAM INC.JHC GLOBAL SERVICE CO., LTD.
¡JIMNA LIMITED¡MTJ DEVELOPMENT SDN. BHD.
NAHA GENERAL BUILDING SERVICE CO.,LTD.
NANSEI MARKETING AND DISTRIBUTIONPLANNING CO.,LTD
¡NANSEI TOURIST DEVELOPMENT CO., LTD.NARITA NIKKO HOTEL CO., LTD.NEW NIKKO HOTEL CO., LTD.NIKKO CREATIVE SERVICE S.A.NIKKO HOTEL MANAGEMENT (THAILAND)CO., LTD.
¡NIKKO HOTELS (U.K.) LTD.NIKKO HOTELS AUSTRALIA PTY. LTD.
¡OKUMA BEACH LAND CO., LTD.ORIENT DYNAMIC CO., LTD.ORIENT NETWORK (HONG KONG) LTD.ORIENT NETWORK (SINGAPORE) PTE LTD.ORIENT NETWORK JAPAN CO., LTD.ORIENT NETWORK TOURS & TRAVEL (M)SDN BHD.
ORIENT NETWORK(INTERNATIONAL) PTELTD.
P.T. TAURINA TRAVEL JAYAPACIFIC AIR SERVICE CO., LTD.PACIFICO CREATIVE SERVICE HAWAII, INC.PACIFICO CREATIVE SERVICE, INC.
¡PAN PACIFIC HOTELIERS, INC.PARIS LIMOUSINE SERVICE S.A.R.L.REISEBURO CREATIVE TOURS GES.M.B.HSATELLITE TOURS CO., LTD.SHURI KANKO CO., LTD. STS ENTERPRISE INC.SUN INTERNATIONAL TRAVEL, INC.SUPER SONIC TOURIST INC.
¡TNN GUAM INC.TOKYO BAY RESTAURANT CO., LTD.
¡TOKYO HUMANIA ENTERPRISE INC.TOUR CREATE, INC.TRANS QUALITY, INC.TRAVEL MARKETING SERVICE, INC.TROPICAL LAUNDRY AND LINEN SUPPLYCO., LTD.
UNIVERSAL HOLIDAYS INC.¡VIEW WORLD COMPANY LIMITED
Information Services¡AVICOM JAPAN CO., LTD.
AVIONET (THAILAND) COMPANY LTD.¡AVIONET (USA) LTD.
AVIONET COMPUTER LTD.¡AVIONET (H.K.) LTD.
JAL AVIONET SYSTEMS, INC.¡JAL AVIONET (EUROPE) LTD.¡JAL INFORMATION TECHNOLOGY CO., LTD.
NANSEI COMPUTER AND COMMUNICATION
SYSTEM DEVELOPMENT CO., LTD.POWERED AGE CRPORATION
Leisure and Tourism ServicesASIA WINDS DEVELOPMENT CO., LTD.
¡HIROKAWA RESORT TOWN CO., LTD. ¡J & N CRUISE PTE., LTD.¡JAPAN SUBMARINE TOURISM CO., LTD
KGC MANAGEMENT, INC.¡TOMAKOMAI RYOKKA KAIHATSU CO., LTD.
Limousine Services¡AIRPORT TRANSPORT SERVICE CO., LTD.
AZUMA KOTSU CO., LTD. *UNOFFICIAL¡KANSAI AIRPORT TRANSPORTATION
ENTERPRISE¡OSAKA AIRPORT TRANSPORT CO., LTD.¡SOUTHERN AIRPORT KOTSU CO., LTD.
Real Estate and ConstructionBLANCO VENDE, LTD.
¡GLOBAL BUILDING CO., LTD.¡JAL CONSTRUCTION CO., LTD.
JAPAN AIRLINES MANAGEMENT CORP.KOKEN CO., LTD. *UNOFFICIAL
¡PACIFIC INVESTMENT HOLDINGSCORPORATION
REAL KEEN LTD.RINKU FACILITIES CO., LTD.
¡TERMINAL ONE MANAGEMENT INC.TOKYO FLIGHT KITCHEN RESTAURANTESLTDA.
Technology DevelopmentHSST DEVELOPMENT CORPORATION
TradingAGS COMMERCE CO., LTD.INTERNATIONAL AIRPORT CLEANING CO.,LTD.
JAL TRADING AMERICAS, INC.JAL TRADING ASIA CO., LTD.JAL TRADING BLUE SKY, INC.JAL TRADING HAWAII INC.JAL TRADING U.K. LTD.
¡JAL TRADING, INC.JAL/DFS DUTY FREE SHOPPERS CO., LTD.MARUYOSHI CO., LTD.NEW TOKYO SERVICE CO., LTD.NICCO LETTANJS COMPANY, LTD.NORDIS CO., LTD.SHURI RYUTSU LIMITED.TOKYO KINAI YOHIN SEISAKUSHO CO., LTD. TOKYO KOKU CLEANING CO., LTD.
¡Indicates subsidiaries and affiliates in which JAL hasdirect equity investments.
53
RAM JET LEASING CO., LTD.REDOME LEASING CO., LTD.RIB LEASING CO., LTD.RUDDER LEASING CO., LTD.SCRUM JET LEASING CO., LTD.SELCAL LEASING CO., LTD.SLAT LEASING CO., LTD.SPAR LEASING CO., LTD.SPINNER LEASING CO., LTD.STABILIZER LEASING CO., LTD.STAR JET LEASING CO., LTD.STRINGER LEASING CO., LTD.SUBSONIC LEASING CO., LTD.TAB LEASING CO., LTD.TILLER LEASING CO., LTD.TOGA LEASING CO., LTD.TRIM LEASING CO., LTD.
¡TRIPLE A LIMITEDTWIN CRANE LEASING CO., LTD.WINGLET LEASING CO., LTD.
Hotel and Travel ServicesJ PRO CO., LTD.MICRONESIAN HOSPITALITY, INC.A AND P TRAVEL, INC.AIRPORT HOTEL MANAGEMENT CO., LTD.AMERASIA REPRESENTACIONES C.A.ASIA CREATIVE TOURS CO., LTD.ASIA CREATIVE TOURS HONGKONG LTD.
¡AXESS INTERNATIONAL NETWORK, INC.¡BENKAY (U.S.A.), INC.
CARGO CREATIVE SERVICE CO., LTD.CHITOSE INTERNATIONAL HOTEL CO., LTD.
¡COCOS LAGOON DEVELOPMENTCORPORATION
COCOS LAGOON UTILITY CORPORATIONCREATIVE GREETING SERVICE, INC.CREATIVE MARKETING MANAGEMENT, INC.CREATIVE REISE GMBHCREATIVE TOURS (EUROPE) B.V.CREATIVE TOURS (SINGAPORE) PTE LTD.CREATIVE TOURS (SPAIN) S.A.CREATIVE TOURS (THAILAND) CO., LTD.CREATIVE TOURS DÜSSELDORF GMBHCREATIVE TOURS LTD.CREATIVE TOURS MICRONESIA, INC.CREATIVE TOURS (ASIA) PTE LTD.CREATIVE TOURS (HOLLAND) B.V.CREATIVE TRAVEL (TAIWAN) LTD.,EURO CREATIVE TOURS (UK) LTD.FOOD DESIGN INC.HOTEL NIKKO OF BEVERLY PARK, INC.HAWAII HOTEL RESERVATION SYSTEM, INC.HOKKAIDO TOUR SYSTEM CO., LTD.HOTEL NEW NIKKO DE PARIS S.A.S.HOTEL NIKKO LONGBAI SHANGHAIHOTEL NIKKO (U.S.A.), INC.
¡HOTEL NIKKO ANNUPURI CO., LTD.HOTEL NIKKO DE PARIS S.A.HOTEL NIKKO MICRONESIA, INC.HOTEL NIKKO OF HONOLULU, INC.
¡HOTEL NIKKO OF NEW YORK, INC.¡HOTEL NIKKO OF SAN FRANCISCO, INC.
HOTEL NIKKO OSAKA CO., LTD.¡HOTEL NIKKO SAIPAN, INC.
HOTEL NIKKO SHANGHAI INVESTMENTCORPORATION
HOTELES NIKKO S.A. DE C.V.HUAYA DEVELOPMENT CO., LTD.IHILANI RESORT, INC.IMPERIAL TRAVEL SERVICE CO., LTD.INCONTRA, INC.
¡INDO JAPAN AIR SERVICES PVT. LTD.INTERNATIONAL FOODS CO., LTD.J INTER CO., LTD. *UNOFFICIAL
¡JAL HOTELS COMPANY LTD.¡JAL PLAZA CO., LTD.¡JAL SALES NETWORK CO., LTD.
52
Air TransportJAPAN AIRLINES CO., LTD.
¡J AIR CO., LTD.¡JAL EXPRESS CO., LTD.¡JALWAYS CO., LTD.¡JAPAN ASIA AIRWAYS CO., LTD.¡JAPAN TRANS OCEAN AIR CO., LTD.
RYUKYU AIR COMMUTER CO., LTD.
Air Cargo¡ABC SKY-PARTNERS INC.
CONTACT AIR CARGO SERVICES, INC.CONTACT MIDWEST INC.DAIWA AIRPORT SERVICE CO., LTD.F.B. ON BOARD COURIER SERVICES INC.
¡FACT INCFAIRWAY EXPRESS CO, LTD.FLEETPAK ENTERPRISES PTE. LTD.
¡FUKUOKA AIR CARGO TERMINAL CO., LTD¡GLOBAL LOGISTICS SYSTEM ASIA COMPANY
LTD.¡GLOBAL LOGISTICS SYSTEM ASIA PACIFIC
CO., LTD.¡GLOBAL LOGISTICS SYSTEM WORLDWIDE
GMBHINTEGRATED EXPRESS LIMITED
¡JAL KANSAI AIRCARGO SYSTEM CO., LTD.¡JAL LOGISTICS INC.¡JALTOS CO., LTD.
JET FRESH THAILAND CO., LTD.J-TRANS CO, LTD.JUPICOM COMPANY LIMITED
¡JUPITER AIR LIMITEDJUPITER AIR (CANADA) LTD.JUPITER AIR (HONG KONG) LIMITEDJUPITER AIR (UK) LIMITEDJUPITER AIR OCEANIA LIMITEDJUPITER AIR SERVICES (MALAYSIA) SDN. BHD.JUPITER JAPAN CO., LTD.JUPITER LOGISTICS PHILIPPINES, INC.JUPITER PACIFIC FORWARDING JOINTVENTURE CO., LTD.
JUPITER SINGAPORE PTE. LTD.¡LANOVAC, INC.
MERCURY INTERNATIONAL CO., LTD.¡NISHINIHON AIR CARGO SERVICE
COMPANY LIMITEDNISHINIHON PASSENGER SERVICE CO., LTD.
¡OSAKA AIR MAIL CO., LTD. *UNOFFICIAL¡OVER SEAS AIR CARGO CO., LTD.
PAN JUPITER TRANSPORT CO., LTD.SHEEN CHART LIMITEDSOUTHERN TRANSPORT SERVICE
¡TOKYO AIR CARGO CITY TERMINAL CO.,LTD.
TRENDY AIR SERVICES SDN. BHD.U-FREIGHT JAPAN CO., LTD.WHOLESALE COURIER (S) PTE. LTD.
Aircraft Fuels¡CHITOSE AIRPORT FUELLING FACILITIES
COMPANY, LTD.¡FUKUSHIMA AIRPORT FUELLING FACILITIES
CO., LTD.¡HIROSHIMA AIRPORT FUELLING FACILITIES
COMPANY, LTD.JAMAL INC.
¡JAPAN AIRPORT FUELING SERVICE CO., LTD.¡JAPAN FUEL TRADING CO., LTD.¡KOKUSAI AVIATION FUELING CO., LTD.¡OKINAWA FUELING FACILITIES CO., LTD.¡OSAKA HYDRANT CO., LTD.¡PACIFIC AIRCRAFT & AIRPORT SERVICE CO.,
LTD.PACIFIC FUEL TRADING CORPORATION
¡SAGA AIRPORT FUELING FACILITIES CO.,LTD.
Aircraft MaintenanceAIR COMPONENT MAINTENANCECOMPANY
¡AIRPORT ENGINEERING & SERVICE CO.,LTD.
FUKUOKA A.E.C. CO., LTD.¡JAL AERO MAINTENANCE CO., LTD.¡JAL AVIONICS CO., LTD.¡JAL COMPONENT TECHNOLOGY CO., LTD.¡JAL ENGINE TECHNOLOGIES CO., LTD.¡JAL FLIGHT ACADEMY CO., LTD.¡JAL MAINTENANCE SERVICE CO., LTD.¡JAL NARITA AIRCRAFT MAINTENANCE CO.,
LTD.¡JAMCO CORPORATION¡JAPAN TURBINE TECHNOLOGIES CO., LTD.
KANTO KIGYO CO., LTD. ¡KUKOU BOUSAI CO., LTD.
NARITA A.E.C. SERVICE CO., LTD.NIHON SERVICE CO., LTD. OAS MAINTENANCE CO., LTD.
Airport-Related ServicesABC AIRPORT SERVICE INC.AGP DEVELOPMENT CO., LTD.AGP HOKKAIDO CO., LTD.AGP KANSAI CO., LTD.AGP KYUSHU CO., LTD.AGS AIR CARGO SERVICE COMPANY,LIMITED
AIRPORT AVIATION SERVICE CO., LTD.¡AIRPORT FACILITIES CO., LTD.¡AIRPORT GROUND SERVICE CO., LTD.¡AVIX NAGASAKI CO., LTD¡FUKUOKA AIRPORT BUILDING CO., LTD.
FUKUOKA TAS CORPORATION¡FUKUSHIMA INTERNATIONAL SEIVICE CO.,
LTD.¡HOKKAIDO PASSENGER SERVICE CO., LTD.
JAL AVIATION CONSULTINGINCORPORATED
¡JAL FRONTIER CO., LTD.¡JAL HAWAII, INCORPORATED¡JAL PASSENGER SERVICES AMERICA, INC.¡JAL PLUS CO., LTD.¡JAL SKY HAKODATE CO., LTD.¡JAL SKY OSAKA CO., LTD.¡JAL SKY SERVICE CO., LTD.¡JAL TOHOKU INTERNATIONAL SERVICE CO.,
LTD.¡JAL WAVE CO., LTD.¡JAL WING CO., LTD.¡JAPAN AIRPORT GROUND POWER CO., LTD.
JAPAN GROUND SERVICE CO., LTD.JAPAN SECURITY SUPPORT CO., LTD.
¡JLCOS COMPANY, LTD.JUPITER GROUND SERVICE LIMITEDKANSAI AIRPORT GROUND SERVICE CO.,LTD.
KYUSHU AIRPORT SERVICE CO., LTD.¡KYUSHU INTERNATIONAL SERVICE CO.,
LTD.LAO-JAPAN AIRPORT TERMINAL SERVICESCO., LTD.
¡NAGOYA GROUND SERVICE CO., LTD.¡NAGOYA INTERNATIONAL SERVICE CO.,
LTD.NAHA AIRPORT GROUND SERVICE CO., LTD.NAHA AIRPORT PASSENGER SERVICE CO.,LTD.
NEW CHITOSE AIRPORT SERVICE CO., LTD.NISHINIHON AIRPORT SERVICE CO., LTD.
¡OKINAWA AIRPORT SERVICE CO., LTD.SANEI MAINTENANCE CO., LTD.
¡SERVICE CREATION INC.¡SHIMOJISHIMA AIRPORT FACILITY CO., LTD.
SUN MAINTENANCE CO., LTD.¡TOKYO CITY AIR TERMINAL CO., LTD.
TSURUYA KOGYO CO., LTD.
Catering¡AAS CATERING CO.,LTD.
CATE CO., LTD.¡HIROSHIMA CATERING CO., LTD.¡INTERNATIONAL CATERING LTD.¡INTERNATIONAL IN-FLIGHT CATERING CO.,
LTD.¡JAL ROYAL CATERING CO., LTD.¡NAGOYA AIR CATERING CO., LTD.
NARITA DRY ICE CO., LTD.NIHON FOOD SERVICE CO., LTD.
¡NIKKO INFLIGHT CATERING CO., LTD.¡OKINAWA CATERING SERVICE CO., LTD.¡TFK CORPORATION
TFK DEVELOPMENT CO., LTD.TFK INTERNATIONAL (N,Z) LIMITEDYAMATO SHOKUZAI CO., LTD.
Cultural Activities and PublishingCHICAGO TOKYO TELEVISION, INC.
¡JAL ACADEMY CO., LTD.¡JAL BUSINESS SERVICE CO., LTD.
JAL BUSINESS SERVICE MINAMI KYUSYU CO.,LTD.
JAL CULTURAL DEVELOPMENT CO., LTD.¡JAL INTERNATIONAL SERVICE INC.¡JAL PLANNING CO., LTD.¡JAL SUNLIGHT CO., LTD.¡OFFICIAL FILING CO., LTD.
SINO ASIA CULTURE ENTERPRISECORPORATION
TOURISM ESSENTIALS INC.WINDS PUBLICATIONS CO., LTD.
Financial ServicesACRES LEASING CO., LTD.AILERON LEASING CO., LTD.AIMS LEASING CO., LTD.
¡ALIVE INSURANCE PTE., LTD.AVIONET LEASING INC.AVIONET LEASING LTD.CAMBER LEASING CO., LTD.FANS LEASING CO., LTD.FILLET LEASING CO., LTD.FLAP LEASING CO., LTD.GEAR LEASING CO., LTD.HIGH SKY LEASING CO., LTD.HONEYCOMB LEASING CO., LTD.HORIZONTAL LEASING CO.,LTD.JAL CAPITAL CORPORATION
¡JAL FINANCE CORPORATION.JAL FINANCE EUROPE B.V.
¡JAL FSC LESSEE (CHI) COMPANY, LTD.¡JAL FSC LESSEE (NC) COMPANY, LTD.¡JAL FSC LESSEE (NC2) COMPANY, LTD.¡JAL FSC LESSEE (PB) COMPANY, LTD.¡JAL FSC LESSEE (PB2) COMPANY, LTD.
JAL LEASING (AMERICA), INC.JAL LEASING (CAYMAN) CO., LTD.JAL LEASING (NETHERLANDS) B.V.JAL LEASING ASSET MANAGEMENT CO., LTD.
¡JAL LEASING COMPANY, LIMITEDJALCARD INC.JET LINER LEASING CO., LTD.JF CARIB A.E.C.JL AIRCRAFT LEASING CO., LTD.JLMC AVIATION SERVICE CO., LTD.KEEL LEASING CO., LTD.LIFT LEASING CO., LTD.NACELLE LEASING CO., LTD.
¡PACIFIC BUSINESS BASE, INC.¡PACIFIC WORLD CORPORATION
PITOT LEASING CO., LTD.PNEUMATIC LEASING CO., LTD.PULSEJET LEASING CO., LTD.PYLON LEASING CO., LTD.
JAL and Its Subsidiaries and Affiliates

TAIPEIJapan Asia AirwaysIBM Bldg., No. 2, Tun Hua S. Rd.,Taipei, TaiwanPhone: (02)8771-6003
TAICHUNGJapan Asia AirwaysEnterprise Bldg. 4F No. 393 Sec 1, TaichungKang Rd., Taichung, TaiwanPhone: (04)321-7700
TIANJIN1st Floor, Tianjin International Bldg.,75 Nanjing Road, Tianjin, P.R. of CHINAPhone: (010)6513-0888(Reservations)
(022)2313-9766(Ticketing)
TORONTO21st Floor, 130 Adelaide St.West Tronto, Ontario, CANADA M5H 3P5Phone: 1-800-525-3663(Reservations)
(416)364-7229(Sales)
VANCOUVER7th Floor, 777 Hornby St.,Vancouver, B.C. CANADA, V6Z 1S4Phone: 1-800-525-3663(Reservations)
VIENNAKärntnerstrasse 11/4 Stock Eingang:Weihburggasse 2, A-1010 Vienna, AUSTRIAPhone: (01)5029-18888
(Reservations & Information)(01)512-7522(Ticketing)
WASHINGTON, D.C.1050 Connecticut Ave., N.W. Suite 200,Washington, D.C. 20036, U.S.A.Phone: 1-800-525-3663(Reservations)
(202)223-3310(Sales)
YANGONRoom No. 1 FM1 Centre, Ground Floor,No. 380 Bogyoke Aung San St., PabedanTownship, Yangon, MYANMARPhone: (01)243030
ZURICHSihlstrasse 55, 8001Zurich, SWITZERLANDPhone: 0844-888-700
(Reservations & Information)
JAPANHead Office:4-11, Higashi-shinagawa 2-chome,Shinagawa-ku, Tokyo 140-8637, JAPANToll-free general reservations:0120-25-5931(International)0120-25-5971(Domestic)
KitamiObihiroSapporoHakodateAkitaSendaiYamagataFukushimaTokyoNiigataNagoyaOsakaKanazawaHiroshimaMatsuyamaKochiFukuokaNagasakiKumamotoOitaMiyazakiKagoshimaOkinawa
55
NEWYORK655 5th Ave., New York, New York 10022,U.S.A.Phone: 1-800-525-3663(Reservations)
(212)310-1318(Sales)
PARIS1, Rond-Point des Champs Elysées,Marcel Dassault, 75008 Paris, FRANCEPhone: 0801-747-700
(Reservations & Information)0144355525(Administration)
PUSAN6th Floor, Kookje Bldg.,6-69 Jungang-Dong, Jung-Ku,Pusan, KOREAPhone: (051)469-1215
(Reservations & Ticketing)
QINGDAO1st Floor, Hotel Equatorial(Guidu)Qingdao, 28, XianggangZhong Lu, 266071 Qingdao, P.R. of CHINAPhone: (0532)571-0088
ROMERome Leonardo Da Vinci International Airport,00050, Fiumicino, Rome, ITALYPhone: 1-478-74700
(Reservations & Information)
SAIPANP.O. Box 469, Saipan, MP 96950, U.S.A.Phone: 234-6553~4(Reservations & Ticketing)
SAN FRANCISCO5th Floor, Hotel Nikko San Francisco,222 Mason St., Suite 508San Francisco, California 94102, U.S.A.Phone: 1-800-525-3663(Reservations)
(415)765-8555(Sales)
SÃO PAULOAv. Paulista No. 542 2nd/3rd Andar Bela Vista,São Paulo-SP., BRAZILPhone: (011)251-5222(Reservations)
(011)288-9055(Sales)
SEOULPaiknam Bldg., 188-3, Eulchi-Ro,1-Ka Chung-Ku, Seoul, KOREAPhone: (02)757-1711(Reservations)
SHANGHAIRoom 201, Shanghai Rui Jin Bldg.,205 Mao Ming Nan Lu,Shanghai, P.R. of CHINAPhone: (021)6472-3000
(Reservations & Ticketing)
SINGAPORE16 Raffles Quay #03-01,Hong Leong Bldg., Singapore 048581Phone: 2210522
SYDNEY14th Floor Darling Park, 201 Sussex Street,Sydney, NSW 2000, AUSTRALIAPhone: (02)9272-1111(Reservations)
(02)9272-1100(Sales)
54
AMSTERDAMOffice Centre Bldg. 2nd FloorJozef Israelskade 48e1072 SB Amsterdam, THE NETHERLANDSPhone: 0900-747-7000
(Reservations & Information)
AUCKLANDJalpak International Oceania Pty. Ltd.12th Floor, Westpac Trust Tower,120 Albert Street, P.O.Box 4479, Auckland DX CP23510Phone: (09)3799-906
BANGKOKJAL Bldg., 254/1 Ratchadaphisek RoadHuaykwang, Bangkok, 10320, THAILANDPhone: (02)692-5151~60(Reservations)
Suriwongse Road Ticket Office:21st Floor, Wall Street Tower,33/33-34 Suriwongse Road,Bangkok, 10500, THAILANDPhone:(02)234-9114~5(Ticketing)
BARCELONA2nd Floor, Paseo de Gracia 5308007 Barcelona, SPAINPhone: 9011-74770
(Reservations & Information)(93)215-5385(Sales)
BEIJING1st Floor, Chang Fu Gong Office Bldg.,Jianguo Menwai Dajie,Beijing, P.R. of CHINAPhone: (010)6513-0888
BOSTONSuite 606, The Statler Bldg., 20 Park Plaza,Boston, Massachusetts 02116, U.S.A.Phone: 1-800-525-3663(Reservations)
(617)695-3525(Sales)
BRUSSELSAvenue Louise 283, Box 6,1050 Brussels, BELGIUMPhone: (02)745-4400
(Reservations & Information)
CAIRO1, El Saleh Ayoub St., ZamalekCairo, EGYPTPhone: (02)738-1422
CHICAGOBldg. 516, Express Center DriveO'Hare International Airport,Chicago Illinois 60666, U.S.A.Phone: 1-800-525-3663(Reservations)
CINCINNATI36 East 4th St., Suite 801,Cincinnati, Ohio 45202, U.S.A.Phone: 1-800-525-3663(Reservations)
DALIAN14th Floor Senmao Bldg., 147 Zhongshan Road,Xigang District, Dalian, P.R. of CHINAPhone: (0411)369-2525
DALLAS1425 Greenway Drive, Suite 375 Irving,Texas 75038 U.S.A.Phone: 1-800-525-3663(Reservations)
DETROIT3000 Town Center, Suite 710,Southfield, Michigan 48075, U.S.A. Phone: 1-800-525-3663(Reservations)
1-800-553-4525(Sales)
DÜSSELDORF1st Floor, Deutsch-Japanisches Center,Immermannstrasse 43B,40210 Düsseldorf, GERMANYPhone: 01802228700
(Reservations & Information)(0211)1679150(Administration)
FRANKFURTRossmarkt 15,60311 Frankfurt/Main 1, GERMANYPhone: 01802228700
(Reservations & Information)(069)13600(Administration)
GENEVA42, Rue De Lausanne,CH-1201 Geneva, SWITZERLANDPhone: 0844-888-700
(Reservations & Information)(022)731-7160(Sales)
HO CHI MINH CITYO.S.C Travel (S.M.I Group) Co., LtdSun Wah Tower 17F, 115 Nguyen Hue St.Dist. 1 Ho Chi Minh City, VIETNAMPhone: (8)8219098
HONG KONG20th Floor, Gloucester Tower,The Landmark, 11 Pedder St.,Hong Kong S.A.R., P.R. of CHINAPhone: 2523-0081(Reservations)
HONOLULU999 Bishop St., Suite 1800,Honolulu, Hawaii 96813, U.S.A.Phone: 1-800-525-3663,(808)521-1441
(Reservations)(808)544-8202(Sales)
JAKARTAKyoei Prince Building Ground Floor, JL.,Jenderal Sudirman, Kav. 3-4,Jakarta, 10220 INDONESIAPhone: (021)572-3211(Reservations)
(021)572-3223(Sales)(021)572-3227(Ticketing)
KAOHSIUNGJapan Asia AirwaysKaohsiung Chung-Cheng Bldg. 4F 2,Chung-Cheng 3rd., Kaohsiung, TaiwanPhone: (07)223-1156
KUALA LUMPURSuite 20·03 Level 20 Menara Lion 165Jalan Ampang, 50450 Kuala Lumpur, MALAYSIAPhone: (03)2611722~6(Reservations)
(03)2611733(Sales)
LONDONHanover Court, 5 Hanover Square,London W1R 0DR, U.K.Phone: (0845)7-747-700, (0345)747-700
(Reservations & Information)
LOS ANGELES300 N. Continental Blvd., Suite 401,El Segundo CA 90245, U.S.A.Phone: 1-800-525-3663
(Reservations & Ticketing)(310)607-2330(Sales)
MADRIDC/Luchana, 23 6-228010 Madrid, SPAINPhone: 9011-74770
(Reservations & Information)(91)594-0299(Sales)
MANILA2nd Floor 6788 Ayala Avenue, Oledan Square,Makati City, Manila, PHILIPPINESPhone: (02)886-6868(Reservations)
MEXICO CITYPaseo de la Reforma, 295,06500 Mexico City, D.F. MEXICOPhone: (5)242-0149~0154
MILANVia San Clemente 1, 20122 Milan, ITALYPhone: 1-478-74700
(Reservations & Information)
MONTREAL2000 Peel #620Montreal, Quebec, CANADA H3A 2W5Phone: 1-800-525-3663(Reservations)
(514)286-3880(Sales)
MOSCOWKuznetsky Most 3, Moscow, RUSSIAPhone: (095)921-6448, 921-6648
NEW DELHIIndo Japan Air Services. PVT. Ltd.Chandrelak 36, Janpath,New Delhi-110 001, INDIAPhone: (011)3327104, 3327108
DirectoryJapan Airlines Company, Ltd.

5756
Corporate OrganizationJapan Airlines Company, Ltd.
Corporate Affairs Office
General Affairs Department,Narita
Shareholders' ServiceDepartment
Personnel & OrganizationDepartment
Industrial RelationsDepartment
Medical Services Office
Accounting Department
Finance Department
Revenue AccountingDepartment
Purchasing Administration Department
Facilities & Airport ProjectsDepartment
General Affairs Department,Haneda
ExecutiveManagementBoard
Flight SafetyCommittee
OperatingManagingCommittee
RestructuringCommittee
InformationSystemsCommittee
CustomerSatisfactionPromotionCommittee
EnvironmentalCommittee
BusinessActivitiesReappraisalCommittee
Flight SafetyBoard
OperationsDivision
CabinAttendantsDivision
PassengerMarketingDivision
Cargo Company
Operations &EngineeringGroup
Aviation Security& Risk ManagementDepartment
Flight OperationsCenter
Operations ServicesDepartment
Training Department
Administration& PlanningDepartment
Administration& ServicesDepartment
In-flight CSPromotion Department
The 1st CabinAttendantsDepartment
InternationalFlight & PassengerDepartment
The 2nd CabinAttendantsDepartment
InternationalPassenger SalesPlanning Department
DomesticPassenger SalesPlanning Department
Administration &Planning, Passenger Sales Department
Product Planning &Marketing Department
Cabin ServicesDepartment
Passenger SystemsDepartment
Passenger MarketingDepartment
Field ManagementSupport Department
AdvertisingDepartment
Mileage CenterDepartment
Cabin Services PlanningDepartment
Alliances DepartmentInt'l Affairs Department CS Promotion Department
Area Office &Field Organizations
Area Offices: HONG KONG (Asia & Oceania) LONDON (Europe, Middle East & Africa) NEW YORK (The Americas)
Planning & MarketingDepartment
Cargo Sales Company
Services PromotionDepartment
AdministrationDepartment
Flight OperationsDivision
Engineering &Maintenance Company
President
(As of July 1, 2000)
Business ActivitiesReappraisal Department
Corporate SafetyDepartment
Secretariat ofEnvironmental Committee
Legal Affairs Department
Associated Business Office
Information Systems Office
Corporate Planning Office
Customer Relations Office

Investor Information
Date of Foundation: August 1, 1951
Head Office: 4-11, Higashi-shinagawa 2-chome, Shinagawa-ku, Tokyo 140-8637, JapanPhone: 03-5460-3191 Fax: 03-5460-5929
Domestic Offices: 23 offices in major cities, including Sapporo, Tokyo, Nagoya, Osaka,Fukuoka, and Naha
Overseas Offices: 32 offices in major cities, including New York, London, Paris, Moscow,Sydney, Beijing, and Hong Kong
Paid-in Capital: ¥188,323,835,984
Number of Shares of Common Stock:
Stock Listings: Tokyo, Osaka, and Nagoya stock exchanges; Depositary receipts tradedthrough the NASDAQ System and SEAQ International
Fiscal Year-End: March 31
General Meeting of Stockholders: June
Stock Transfer Agent: The Toyo Trust & Banking Co., Ltd.
Share Handling Office: 10-11, Higashi-Suna 7-chome, Koto-ku, Tokyo 137-8081, Japan
Date for Confirmation of Stock Ownership: March 31
Newspaper for Public Notices: Nihon Keizai Shimbun
Auditor: Century Ota Showa & Co.
Authorized
Issued
6,000,000,000 shares
1,778,943,439 shares
Eitaro Itoyama
The Tokio Marine and Fire Insurance Co., Ltd.
The Industrial Bank of Japan, Limited
The Bank of Tokyo-Mitsubishi, Ltd.
The Dowa Fire and Marine Insurance Co., Ltd.
Fukoku Mutual Life Insurance Company
Nippon Life Insurance Company
The Yasuda Fire and Marine Insurance Co., Ltd.
The Dai-ichi Kangyo Bank, Limited
Kokusai Kogyo Co., Ltd.
70,000/3.9
51,131/2.9
50,042/2.8
44,341/2.5
44,222/2.5
43,401/2.4
41,723/2.3
34,876/2.0
34,752/2.0
34,627/1.9
Number of Shares Held(Thousands)/Percentage of Total Shares OutstandingName
(As of March 31, 2000)
Floating Stock: 32.89%
Number of Stockholders: 241,437, including 470 non-Japanese
Major Stockholders:
58
Isao Kaneko*PresidentChairman, Flight Safety BoardChairman, Restructuring CommitteeChairman, CS Promotion CommitteeChairman, Business Activities Reappraisal Committee
Yasushi Yuasa*Executive Vice PresidentChief Officer, Operations & Engineering GroupSenior Vice President, Flight Operations DivisionSenior Vice President, Flight Safety BoardChairman, Flight Safety Committee
Zenta Yokoyama*Executive Vice PresidentChief Officer, Industrial RelationsSenior Vice President,¡Corporate Planning¡IT planningChairman, Information Systems Committee
Masahide OchiSenior Managing DirectorChief Officer, Airport ProjectsSenior Vice President,¡Facilities & Airport Projects¡Legal Affairs¡Purchasing¡Business Activities Reappraisal¡Customer Relations
Katsuo HanedaManaging DirectorSenior Vice PresidentPassenger Marketing
Norio OgoManaging DirectorSenior Vice PresidentEngineering & Maintenance DivisionPresident, Engineering & Maintenance CompanyChairman, Environmental Committee
Toshiki OkazakiManaging DirectorSenior Vice President, Passenger SalesPresident Passenger Sales Company
Takashi MasukoManaging DirectorSenior Vice President, Cabin Attendants Division
Toshiyuki ShinmachiManaging DirectorSenior Vice President, Corporate Affairs¡Executive Office¡Strategic Research¡Public RelationsSenior Vice President, Associated Business
Hidekazu NishizukaSenior Vice President, Human Resources,¡Personnel & Organization Administration¡Industrial RelationsSenior Vice President & General Manager, Medical
ServicesSenior Vice President & Deputy General Manager,
Associated Business
Hiroyuki FunayamaSenior Vice President, OperationsSenior Vice President & Deputy general manager,
Passenger MarketingSenior Vice President, Field Management Support,
Passenger SystemsSenior Vice President, Shareholders' Service
Juntaro ShimizuSenior Vice President, Cargo & MailPresident,Cargo Company
Gentaro MaruyamaSenior Vice President, Finance,¡Accounting¡Finance¡Revenue AccountingSenior Vice President & Deputy General Manager,
Corporate Planning¡BudgetSenior Vice President & Deputy General Manager,¡Associated Business¡Shareholders' Service
Shunji KonoSenior Vice President
Ken MoroiSenior Vice President
Corporate Auditors of the Board
Sadao HaraAuditor (full time)
Yasunaka FurukawaAuditor (full time)
Yoshihisa AkiyamaAuditor
Masao NishimuraAuditor
* Representative Director
(As of June 29, 2000)
Board of DirectorsJapan Airlines Company, Ltd.
Japan Airlines Co., Ltd.4-11, Higashi-shinagawa 2-chome, Shinagawa-ku, Tokyo 140-8637, Japan
Printed in Japan