Embed Size (px)
Citation preview

GlobalBurdenofDisease:MagnitudesandMeasures
KevinChan,MD,MPH,FRCPC,FAAPAssistantProfessor,UniversityofTorontoandHospitalfor
SickChildrenandFellow,
MunkCentreforGlobalStudies
Prepared as part of an education project of the Global Health Education Consortium and collaborating partners
August 2012

2
LearningObjec9ves
• LookattheCausesofMortality• DescribeHowDeathsaredefined• Describe4methodstogeneratehealthvalues• HighlightSummaryMeasuresofPopulaJonHealth• DescribetheGlobalBurdenofDiseaseProject• CalculatetheDisability‐AdjustedLifeYear(DALY)• HighlightcommoncriJcismofDALY• LookatmortalityandDALYsprojectedto2030
See Notes
3
WorldPopula9onBirthsandDeaths
See Notes

4
CausesofDeathintheWorld,2002
Total Deaths = 57 million
See Notes

5
Howaredeathsdefined?
• ManualoftheInternaJonalStaJsJcalClassificaJonofDiseases,Injuries,andCausesofDeath,currentlyinits10thediJon(ICD‐10)
• Deathis“theunderlyingcauseofdiseaseorinjuriesleadingdirectlytodeath,orthecircumstancesofanaccidentorviolencethatproducedthefatalinjury.”
• FormoreinformaJonondeathcerJficates,see:
hXp://en.wikipedia.org/wiki/Death_cerJficate
See Notes

6
Top10CausesofDeathWorldwide
High-Income Middle Income Low Income
CHD (17.1%) Stroke (14.6%) CHD (10.8%) Stroke (9.8%) CHD (13.4%) LRI (10%) Lung Cancer (5.8%) COPD (7.6%) HIV/AIDS (7.5%) LRI (4.3%) LRI (3.3%) Perinatal (6.4%) COPD (3.9%) HIV/AIDS (3%) Stroke (6%) Colon CA (3.3%) Perinatal (2.9%) Diarrheal disease (5.4%) Alzheimer (2.7%) Stomach CA (2.8%) Malaria (4.4%) Diabetes (2.7%) Lung CA (2.7%) TB (3.8%) Breast CA (1.9%) Road traffic (2.6%) COPD (3.1%) Stomach CA (1.8%) Hypertensive HD (2.6%) Road traffic (1.9%)
See Notes

7
WhatisHealth?
• Physicalhealth?• Mentalhealth?
• Socialhealth?• Spiritualhealth?
• Whatiscommonacrossage,culture,race,andgender?
See Notes

8
Genera9ngvaluesofhealth
TherearefourgeneralwaystohelpcalculatehealthvaluestohelpcombinetwoimportanthealthoutcomeaXributes,survivalduraJonandthequalityoflife.Themethodsare:
1. StandardGamble2. TimeTrade‐off3. PersonTrade‐off4. RaJngorvisualanalogscales

9
StandardGamble
Thestandardgambleistheriskyou’rewillingtotaketoachieveperfecthealthversusdeath,againstacertainchronicstateforagivenperiodofJme.Youhave2choices:
Choice1:Apersonisreturnedtonormalhealthandwilllive‘x’yearswithaprobabilityp,orwilldieimmediatelywithaprobability1‐p.
Choice2:Apersonwilllivewithachronicdiseasefor‘x’years
Theprobability‘p’referstothehealthuJlityvaluegivenforthechronicstate.ThegamblereferstotheriskthatonewouldbewillingtotaketoavoidachronicanddebilitaJngdisease.

10
TimeTrade‐Off
Youhave2choices:Choice1:Imagineliving10yearswithadisease.Choice2:Howmany‘x’yearswouldthisbeequivalenttoinfullhealth?
ThequesJonishowmuchJmewouldyoubewillingtoliveinfullhealthascomparedwiththespecifiedchronicdisease?
See Notes

11
PersonTrade‐Off
Youhavetofindapointofequivalency:
“HowmanypeoplecuredofcondiJonAisthesameas100peoplecuredofcondiJonB?”Forexample,howmanypeoplecuredofAIDSistheequivalentof100personscuredofTB?
Thepurposeistofindpointsofequivalenceofdifferentstates.Ingeneral,theseshouldbesimilaracrossdifferentcondiJons.
Source: http://www.juliantrubin.com/imageses/scale.gif
See Notes

12
Ra9ngorVisualAnalogScale
0 10
Individualsrank(raJng)orplace(visualanalogscale)wheretheythinkhowmuchadiseaseshouldberated
(Wherewouldyouputonthelinepneumonia,cancer,
diabetes,arthriJs,aseverecold?)
See Notes
13
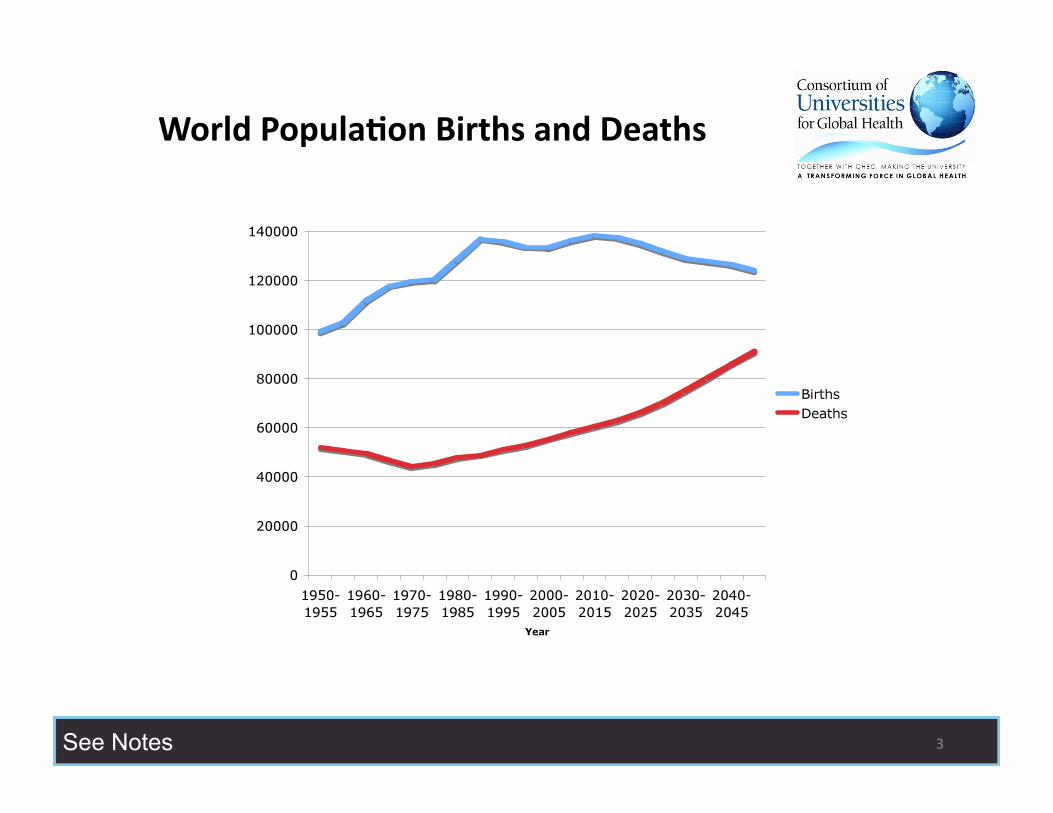
MeasuresofPopula9onHealth
• TherearefourmeasuresgaugeapopulaJon’shealthstatus.1. Lifeexpectancyatbirth2. QualityAdjustedLifeYears(QALY)3. HealthAdjustedLifeExpectancy(analternaJve
measureofQALY)4. DisabilityAdjustedLifeYears(DALY)

14
LifeExpectancy
• Measurestheexpectedageofdeathatbirth.
• LifeexpectancyissensiJvetochildhooddeaths.
• Highestlifeexpectancyatbirth:Japanat82.6years(79.0formales,86.1forfemales)in2006
• Lowestlifeexpectancy:Mozambiqueat39.2years(38.3formales,39.9forfemales)in2006
0 80
Source: WPP 2006
See Notes

15
QualityAdjustedLifeYears(QALYs)
• CombinesquanJtyandqualityoflife
• Measurestheeffectonanindividualoverayear,andaggregaJngittothepopulaJon
• HasdiscounJng(3%peryear)– e.g.(alifeworth1.00in2012is
worth0.97in2013)
0 80
See Notes
16
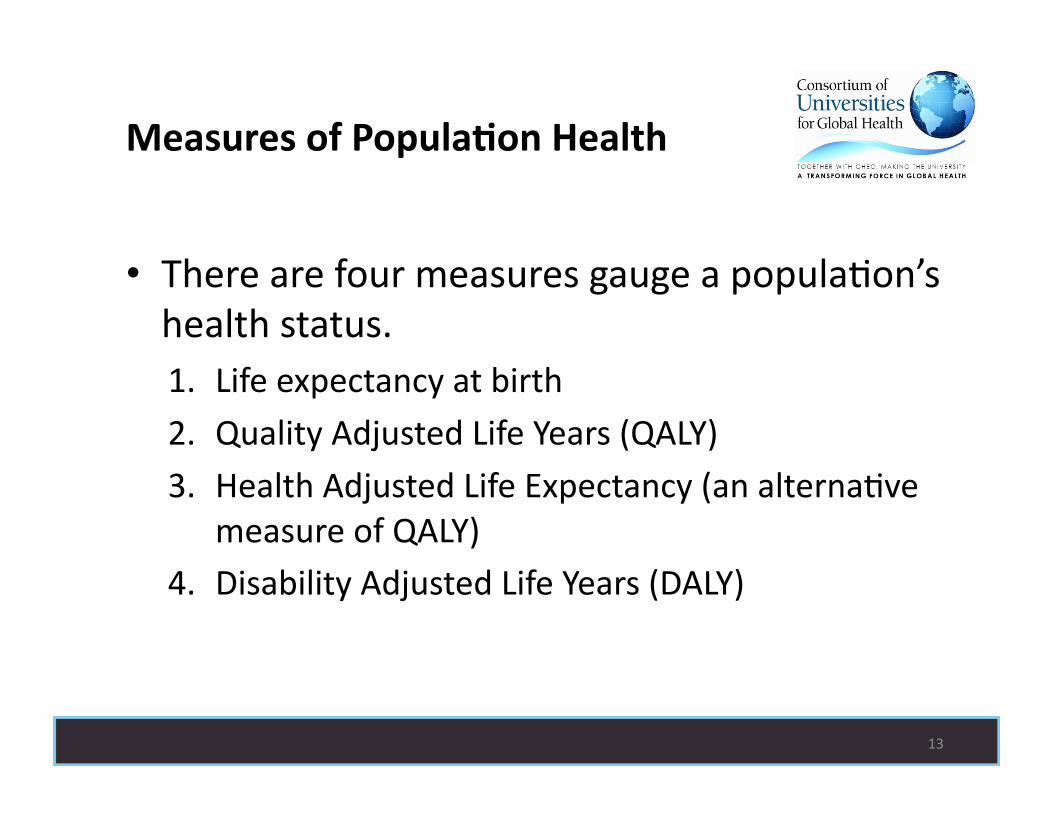
QALYcalcula9ons
Health Utility
1
0.5
6 12 Months
QALY = 1*(6/12) + 0.5*(6/12) = 0.75
0
The simplest way to understand how to calculate QALYs is to measure the rectangles. For example, if there was full health for 6 months, and 0.5 health for the next 6 months. The QALY calculations would suggest that the QALY for the year was 0.75.

17
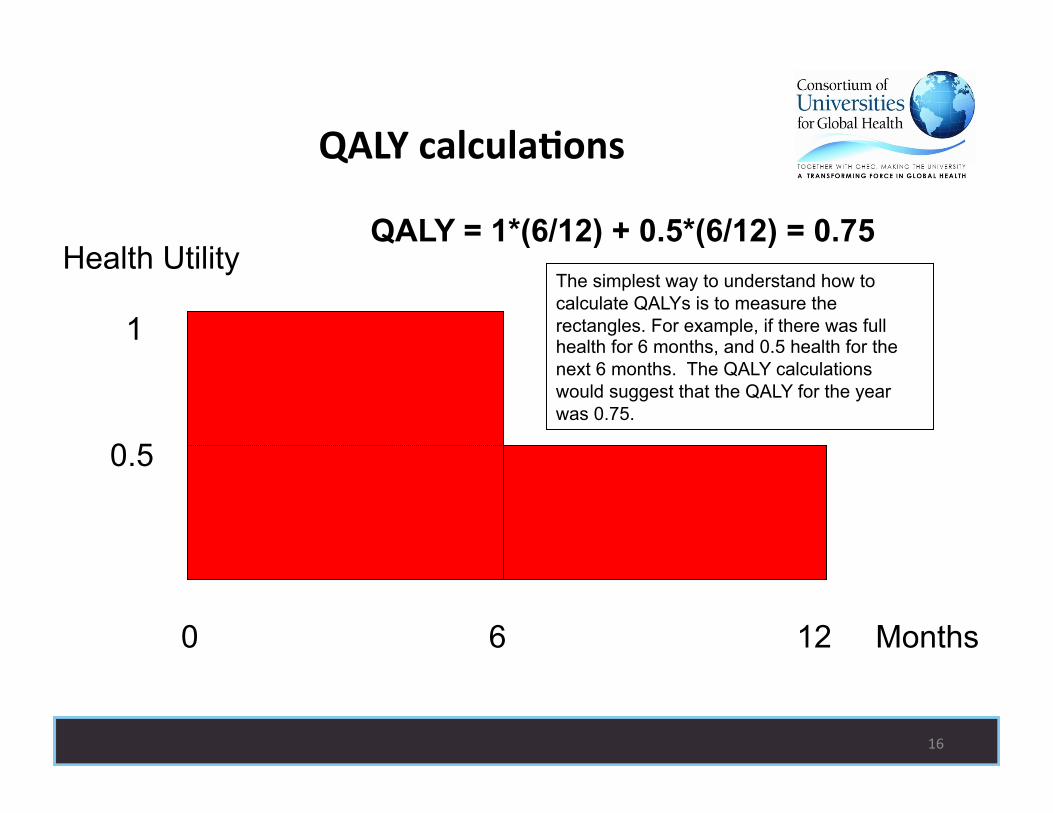
MoreQALYcalcula9ons
Health Utility
1
0.5
40 80 Years 0
See Notes

18
Health‐AdjustedLifeExpectancy(HALE)
• Lifeexpectancyminustheperiodoflessthanafullhealthylife.
• UsesHealthUJlityIndexforresidenJalandthoseinhospitalinsJtuJons
• GeneratedbyJmetrade‐off
• HighestHALEisJapanat75.0years(72.3formales,77.7forfemales).
0 80
75
See Notes

19
TheGlobalBurdenofDiseaseStudy
Five‐yearstudywiththreegoals:
1) InfuseinformaJonaboutmorbidityintodebatesonhealthpolicy
2) Decoupleepidemiologicalassessmentfromadvocacy
3) DefineameasurementtoolthatdeterminesrelaJvemagnitudeofdiseases,combiningmortalityandmorbidity,andatoolforcost‐effecJvenessanalysis
See Notes

20
BurdenofDiseaseMeasures
• AXempttocapturethereducJoninthelengthand/orqualityoflife
• Burdenforallhealthoutcomesshouldbethesame• Non‐healthoutcomesshouldberestrictedtoageandsex
• DALYmeasureshealthgaps,nothealthuJlity– “UJlity”asusedineconomicsisameasureofsaJsfacJontoa
consumerofagood,service,orinthiscase,healthstatus
• Asumofmortalityandmorbidityeffects
See Notes

21
DALYCalcula9ons
• DALY=DisabilityAdjustedLifeYear– Rangesfrom0(nodisability)to1(death)– ConverseoftheQALY(qualityadjustedlifeyear)– UseslifetabletocomparewithmaximumlifeexpectancyofJapan(80.0yearsformales,82.5yearsforfemales)
– Useshealthprofessionalexpertgroupstodefinevalues
See Notes

22
MoreDALYCalcula9onsHealth Utility
1
0
80 0
Healthy Living
Health Gap
Years While QALYs or HALEs look at Healthy living, DALYs look at a health gap from an ideal life expectancy. Note, that if you live longer than this ideal life expectancy, the DALY is NOT measured.

23
TheDALY
DALY=YearsofLifeLost(YLL)+YearsofLifewith Disability(YLD)
YLL=(MaximumLifeExpectancy‐AgeatDeath)+ AgeWeighJngFactor+DiscountRate
YLD=(MaximumLifeExpectancy‐AgeofDisability)+ AgeWeighJngFactor+DiscountRate+Disability Weight
See Notes

24
AgeWeigh9ng
• Maximumatage25• Ideaistomaximizevaluesofyearsduringthemost“producJveyears”versustheagesrequiringhelp
• ThusdisabiliJesduringchildhoodandpost‐reJrementyearsaregivenlessweight
0 25 80
See Notes

25
Discoun9ng
• Mostpeoplepreferbenefitsnowratherthanlater
• ThestandardfortheDALYis3%peryear• DiscounJngandJmepreferencearenotsynonymous.TimepreferencereferstoapreferenceforuJlity(ie,improvedhealthstatus)soonerratherthanlater
See Notes

26
DisabilityWeights
• ThesearetheweightsaXachedtospecificdisabiliJes.
• 7classesofdisabilityweightshavebeencreated
See Notes

27
Cri9cismsoftheDALY
1. PaJentversuscommunityversushealthexperts’valuaJonsofhealth
2. Age‐basedweighJngdoesnotfavortheyoungorold.3. DisabiliJesareaddiJveinnatureandcouldaddupto
morethan1“death”forpersonshavingmorethanonedisability
4. Nopriorityisgiventothoseworseoff,unliketheusualsocietaltendenciestohelpthoseworseoff
5. DiscriminatesagainstpeoplewithlimitedtreatmentpotenJal,e.g.,thosewithcancer,strokeparalysis
See Notes

28
MoreCri9cismsoftheDALY
6. DoesnotassessqualitaJvedifferenceinoutcomes.
7. Differenceinthelengthoflifelost8. Discountsfuturehealthoutcomes
See Notes

29
Mortalityby2030
High-Income Middle Income Low Income CHD (15.8%) Stroke (14.4%) CHD (13.4%) Stroke (9.0%) CHD (12.7%) HIV/AIDS (13.2%) Lung Cancer (5.1%) COPD (12.0%) Stroke (8.2%) Diabetes (4.8%) HIV/AIDS (6.2%) COPD (5.5%) COPD (4.1%) Lung CA (4.3%) LRI (5.1%) LRI (3.6%) Diabetes (3.7%) Perinatal (3.9%) Alzheimer (3.6%) Stomach CA (3.4%) Road traffic (3.7%) Colon CA (3.3%) Hypertensive HD (2.7%) Diarrheal disease (2.3%) Stomach CA (1.9%) Road traffic (2.5%) Diabetes (2.1%) Prostate CA (1.8%) Liver CA (2.2%) Malaria (1.8%)
See Notes

30
DALYsby2030
High-Income Middle Income Low Income Depression (9.8%) HIV/AIDS (9.8%) HIV/AIDS (14.6%) CHD (5.9%) Depression (6.7%) Perinatal (5.8%) Alzheimer (5.8%) Stroke (6.0%) Depression (4.7%) Alcohol (4.7%) CHD (4.7%) Road traffic (4.6%) Diabetes (4.5%) COPD (4.7%) CHD (4.5%) Stroke (4.5%) Road traffic (4.0%) LRI (4.4%) Hearing loss (4.1%) Violence (2.9%) Diarrheal disease (2.8%) Lung CA (3.0%) Vision loss, age (2.9%) Stroke (2.8%) Osteoarthritis (2.9%) Hearing loss (2.9%) Cataracts (2.8%) COPD (2.5%) Diabetes (2.6%) Malaria (2.5%)
See Notes

31
WhatmeasuresoftheGlobalBurdenofDiseaseareUsedToday?
• DespitecriJcism,DALYspredominatehealthprioritydebates
• MortalitysJllhasaroleintheassessments
• PoliJcalpressureonneglecteddiseases,suchasHIV/AIDS,TB,andmalaria,canhaveamajorimpactonpoliciesandprograms
See Notes

32
Summary
• TheworldpopulaJonconJnuestogrow,withincreasingnumberofdeaths
• Differentmethodstogeneratevaluesofmorbidity:StandardGamble,TimeTrade‐Off,PersonTrade‐Off,andRaJng/VisualAnalogScales
• DifferentSummaryMeasuresofPopulaJonHealth:Lifeexpectancy,QALYs(includeHALE)andDALYs
• QALY:CombinesquanJtyandqualityoflife• DALY:Health‐Gapmeasure

33
Summary(con9nued)
• GlobalBurdenofDisease– AXemptedtoaddmorbidity– Decoupledepidemiologyfromadvocacy– ProvidedtheDALY
• KnowtheassumpJonsbehindtheDALYandhowthey’recalculated
• BeawareofthecriJcismsoftheDALY• TheDALYprovidesadifferenthealthprioritylisJngthanmortality

34
The next five slides provide a short quiz. Note your answers on a separate piece of paper and then compare your results with the answers that follow.

35
1. The death certificate reads as follows: “Mr. X died from cardiac arrest stemming from right-sided heart failure due to renal failure from Alport’s nephritis?” How would ICD-10 classify the cause of death?
A Cardiac arrest
B Right-sided heart failure
C Renal failure
D Alport’s nephritis

36
2. What is the number one cause of death worldwide?
A Heart disease
B Stroke
C HIV/AIDS
D Lower Respiratory Tract Infection pneumonia)
E Lung Cancer

37
3. You have to find a point of equivalency: “How many people cured of condition A is the same as 100 people cured of condition B?” What measurement method would you use?
A Standard Gamble
B Interview
C Time Trade-Off
D Person Trade-Off
E Visual Analog Scale

38
4. Which of these does NOT describe the QALY?
A Combines quantity and quality of life measures
B Utilizes a health utility index.
C Recognized as a health gap measure.
D Usually has discounting.
E HALE is a type of QALY

39
5. Which of the following is not a component of the DALY?
A Age Weighting
B Discounting
C Disability Weight
D Happiness
E Age of Death

40
1. The death certificate reads as follows: “Mr. X died from cardiac arrest stemming from right-sided heart failure due to renal failure from Alport’s nephritis?” How would ICD-10 classify the cause of death?
A Cardiac arrest Incorrect.
This is an immediate cause of death. It is not the underlying cause of death. The correct answer is Alport’s nephritis.
B Right-sided heart failure Incorrect.
This is an immediate cause of death. It is not the underlying cause of death. The correct answer is Alport’s nephritis.
C Renal failure Incorrect.
This is an immediate cause of death. It is not the underlying cause of death. The correct answer is Alport’s nephritis.
D Alport’s nephritis Correct.
This is the underlying cause of death. This is the correct answer

41
2. What is the number one cause of death worldwide?
A Heart disease Correct.
This is the number one cause of death worldwide.
It causes 12.6% of deaths worldwide.
B Stroke Incorrect.
This is the number two cause of death worldwide.
It causes 9.7% of deaths worldwide. Heart disease is the number one cause..
C HIV/AIDS Incorrect.
This is the number four cause of death worldwide. It causes 4.9% of deaths worldwide. Heart disease is the number one cause..
D Lower Respiratory Tract Infection (pneumonia)
Incorrect.
This is the number three cause of death worldwide. It causes 6.8% of deaths worldwide.
E Lung Cancer Incorrect.
This is the number eight cause of death worldwide. It causes 2.2% of deaths worldwide. Heart disease is the number one cause..

42
3. You have to find a point of equivalency: “How many people cured of condition A is the same as 100 people cured of condition B?” What measurement method would you use?
A Standard Gamble Incorrect
The correct answer is the person trade-off (D)
B Interview Incorrect
This is not one of the standard methods.
The correct answer is the person trade-off (D)
C Time Trade-Off incorrect
The correct answer is the person trade-off (D)
D Person Trade-Off Correct
E Visual Analog Scale Incorrect
The correct answer is the person trade-off (D)

43
4. Which of these does NOT describe the QALY?
A Combines quantity and quality of life measures
Incorrect.
This is true. Answer (c), “Recognized as a health gap measure,“ does not describe a QALY.
B Utilizes a health utility index. Incorrect.
This is true. Answer (c), “Recognized as a health gap measure,“ does not describe a QALY.
C Recognized as a health gap measure. Correct.
This is false. The DALY is a health gap measure. The QALY is a health expectancy measure
D Usually has discounting. Incorrect.
This is true. Answer (c), “Recognized as a health gap measure,“ does not describe a QALY.
E HALE is a type of QALY Incorrect.
This is true. Answer (c), “Recognized as a health gap measure,“ does not describe a QALY.

44
5. Which of the following is not a component of the DALY?
A Age Weighting Incorrect.
This is part of the DALY.
B Discounting Incorrect.
This is part of the DALY.
C Disability Weight Incorrect.
This is part of the DALY.
D Happiness Correct.
This is #9 on the global list.
E Age of Death Incorrect.
This is part of the DALY.

45
Papers
Anand S, Hanson K. “Disability-adjusted life years: a critical review.” Journal of Health Economics. 1997; 16 (6): 685-702. Gold MR, Stevenson D, Fryback DG. “HALYs and QALYs and DALYs, Oh My: Similarities and Differences in Summary Measures of Population Health.” Annual Review of Public Health. 2002; 23: 115-134. Mathers CD, Stein C, Fat DM, et al. “Global Burden of Disease 2000: Version 2 methods and results.” Global Programme on Evidence for Health Policy Discussion Paper No. 50: World Health Organization, 2002. (Version 2 estimates are from 2000). Mathers CD, Loncar D. “Projections of Global Mortality and Burden of Disease from 2002 to 2030.” PLoS Medicine. 2006; 3 (11): e442. Murray CJL, Acharya AK. “Understanding DALYs.” Journal of Health Economics. 1997; 16: 703-730. Murray CJL, Lopez AD. “Mortality by cause for eight regions of the world: Global Burden of Disease Study.” Lancet. 1997; 349: 1269-1276.

46
Papers
Murray CJL, Lopez AD. “Regional patterns of disability-free life expectancy and disability-adjusted life expectancy.” Lancet. 1997; 349: 1347-1352. Murray CJL, Lopez AD. “Global mortality, disability and the contribution of risk factors: Global Burden of Disease Study.” Lancet. 1997; 349: 1436-1442. Murray CJL, Lopez AD. “Alternative projections of mortality and disability by cause 1990-2020: Global Burden of Disease Study.” Lancet. 1997; 349: 1498-1504. Ubel PA, Loewenstein G, Scanlon D, Kamlet M. “Individuals utilities are inconsistent with rationing choices: A partial explanation of why Oregon’s cost-effectiveness list failed.” Medical Decision Making. 1996; 16: 108-116.

47
Books
Murray CJL, Lopez AD. The Global Burden of Disease. A Comprehensive Assessment of Mortality and Disability from Diseases, Injuries, and Risk Factors in 1990 and Project to 2020. Cambridge: Harvard University Press, 1996. World Bank. World Development Report 1993: Investing in Health. New York: Oxford University Press, 1993.
Web links
World Population Prospects: 2006 Revision Population Database. http://esa.un.org/unpp/index.asp?panel=2 This is the current database on world population projections until 2050.

The Global Health Education Consortium and the Consortium of Universities for Global Health gratefully
acknowledge the support provided for developing teaching modules from the:
Margaret Kendrick Blodgett Foundation The Josiah Macy, Jr. Foundation
Arnold P. Gold Foundation
This work is licensed under a Creative Commons Attribution-Noncommercial-No Derivative Works 3.0
United States License.

Page 1 of 11
Supplementary notes for Module #21
Module title Global Burden of Disease: Magnitudes and Measures
Lead author Kevin Chan
University of Toronto
Date August 8, 2012

CUGH Module 21 - Supplementary contents
Page 2 of 11
Slide notes
Notes on Learning Objectives
This module will go through the current state of mortality, and describe how deaths are defined. It will then look at different methods for valuation of health states, specifically looking at 4 common methods to help determine morbidity. The module will then look at common summary measures of population health. It will then describe the Global Burden of Disease Project and its key measure, the Disability-Adjusted Life Year (DALY). The module concludes with projections of mortality and DALYs for the year 2030.
Back to Module
Notes on World Birth and Deaths
This figure shows the continuing growth in world population. A few things should be noted. First, there are more births than deaths throughout the time frame up to 2050. The world population is projected to grow to 8.9 billion by 2050.
Second, there has been evidence of a demographic transition, which implies a sudden growth in the population that occurred around 1980-1985 (as seen by an increase in the gap between births minus deaths, and then a subsequent narrowing). This demographic transition was triggered by a significant decrease in childhood mortality.
Third, there is a continuous rise in the number of deaths. This is most likely due to older populations dying, rather than childhood deaths. We will explore the causes of deaths throughout the next few slides.
Back to Module
Notes on Causes of Death in the World, 2002
GBD and the WHO use 3 broad category definitions. The first category is a broad term for communicable, disease with maternal, perinatal and nutritional conditions. Maternal conditions refer to any cause of death during pregnancy and labor. Perinatal conditions refer to death that occurs in the child during or just after birth, such as birth asphyxia, and low birth weight. Nutritional conditions refer to caloric malnutrition, and micronutrient deficiencies that may lead to death.

CUGH Module 21 - Supplementary contents
Page 3 of 11
The second category is noncommunicable diseases, such as heart attacks, stroke, and cancer. The final category is injuries, including motor vehicle accidents, homicide, and suicide.
In developed countries, 77% of deaths are from non-communicable disease, 14% of deaths are from communicable disease, and 9% of deaths from injuries. In developing countries, 55% of deaths are from communicable disease, 37% of deaths are from non-communicable disease, and 8% from injuries.
Two broad statements can be concluded from these findings. First, communicable disease is still a disproportionate burden in developing countries. Second, non-communicable disease plays a role in both developed and developing countries.
Back to Module
Notes on How are Deaths Defined?
In North America, the causes of death are obtained from medical records from death certificates by a physician or coroner. On most death certificates, there are spaces to provide causes of death, including the immediate, intervening and underlying cause. The underlying cause is what is utilized to derive figures and reports of death.
The causes of death utilize the Manual of the International Statistical Classification of Disease, Injuries and Causes of Death, Tenth Revision (ICD-10). The importance is that individuals should be aware with that more accurate assessment of diagnoses or definitional changes in diseases may change over time.
For more information on death certificates, see http://en.wikipedia.org/wiki/Death_certificate
Back to Module
Notes on Top 10 Causes of Death Worldwide
CHD refers to coronary heart disease.
LRI refers to lower respiratory tract infection (mostly pneumonia)
COPD refers to chronic obstructive pulmonary disease, mainly emphysema.
CA refers to cancer.
HD refers to heart disease.
These income groups refer to World Bank Classifications, and the source of the data is:

CUGH Module 21 - Supplementary contents
Page 4 of 11
Mathers CD, Stein C, Fat DM, et al. “Global Burden of Disease 2000: Version 2 methods and results.” Global Programme on Evidence for Health Policy Discussion Paper No. 50: World Health Organization, 2002. (Version 2 estimates are from 2000).
A few general observations should be made. In every case, coronary heart disease is a major contributor to death. Lower respiratory traction infections are seen in all groups. As well, noncommunicable diseases are more prominent in the higher income groups with little impact from communicable disease. However, both communicable and non-communicable diseases are prominent in the lower income groups, reflecting the “dual burden” of disease in middle and low income countries.
Back to Module
Notes on What is Health?
Before we get to the various types of measurements, we need to examine what is meant by “health”. It is easy to measure death or perfect health as the extremes of measures, but for less than perfect health states, how do we measure them?
Is it just physical health, or could it also include mental, social, and spiritual health?
How we define these are extremely difficult and our perception of our own health (“self-rated health”) may differ from the perceptions of the same health condition of other individuals (“community-rated health”), because we fail to take into account an individual’s adaptation to a specific health state.
Back to Module
Notes on Time Trade-Off
The time trade-off is the measure of time you’re willing to trade-off in a perfectly healthy state, as compared to living a full duration in a less than perfectly healthy state.
For example, say you were going to have 10 years of life with arthritis. The trade-off question would be, how many years of living perfectly healthy, would you be willing to trade to avoid these 10 years with arthritis?
Back to Module
Notes on Person Trade-Off
The person trade-off utilizes person-equivalents to measure the trade-off between two different states. By comparing various diseases, a method of finding an equivalent health state should occur.

CUGH Module 21 - Supplementary contents
Page 5 of 11
One problem is that not all results are internally consistent.
For example, if 200 people are cured for disease 2 compared to 100 people cured for disease 1, and 300 people are cured from disease 3 compared to 100 people cured for disease 2, it suggests that 600 people cured for disease should be the same as people cured for disease 1. However, testing rarely shows this consistency. (Ubel 1996)
Back to Module
Notes on Rating or Visual Analog Scale
The Rating or Visual Analog Scale asks individuals to place where they think a disease is rated on a scale of 1-10. It is the simplest method to help evaluate the burden of a specific illness, but does not ask for comparisons to other diseases.
For example, you might right diabetes as an 8, and lung cancer as a 5. However, determining the appropriate scale differs from individual to individual.
Many people believe that respondents need to think less with these scales. Some scales that use rating or Visual Analog Scales include the Quality of Well-Being (QWB) scale and the EuroQol EQ-5D (in part).
Back to Module
Notes on Life Expectancy
The first summary measure of population health is generally used is a country’s life expectancy at birth. According to WHO figures, Japan has the highest life expectancy, and Mozambique has the lowest life expectancy.
It is important to note that early childhood and infant deaths can lower the average life expectancy significantly. Thus, two poor countries may have very different life expectancies at birth but not much difference for life expectancies for those at age five.
Furthermore, measurements of life expectancy concentrate on mortality (death), but do not assess morbidity (illness).
Back to Module
Notes on Quality Adjusted Life Years (QALYs)
QALYs were developed in the 1960s primarily for use in cost-effectiveness analysis. It allowed the comparison of obtaining an extra unit of health per dollar, when pitting one intervention versus another. QALY attempts to combine mortality

CUGH Module 21 - Supplementary contents
Page 6 of 11
and morbidity components by taking into account the “burden of illness” from achieving full health.
The QALY highlights the “quality of life” is an important outcome measure for health care and helps prioritize assessments of medical care, technology and public health interventions. The key is to measure the preference of different health outcomes from death (0) to perfect health (1.0), using Health Related Quality of Life (HRQL) weights.
They can be described by the individual itself (patient weights) or by how others would describe them (community weights), or by an outside “expert panel” (expert weights).
Back to Module
Notes on More QALY Calculations
Over a period of time, the areas underneath the curve can be summated together to calculate the full amount of QALYs. In this diagram, it is the sum of the rectangles. In reality, it’s impossible to measure every single day, so that some degree of precision is lost in the calculation of the QALYs.
A calculation for the average QALY per person is made (irrespective of the distribution), and then the total population is multiplied by the average QALY to provide the total QALYs per population. By using average figures, there is a loss of precision in the individual variation.
Back to Module
Notes on Health-Adjusted Life Expectancy (HALE)
The Health-Adjusted Life Expectancy (HALE) uses the Health Utility Index.
The Health Utility Index is a survey that looked at eight areas of personal health: vision, hearing, speech, mobility, emotional state, thinking and memory, dexterity and the level of pain and discomfort, and validity through a rank preference survey. This is combined to provide the Health Utility Index (ranging from 0 to 1, representing full health). To develop the Health Utility Index, a time trade-off measure is used.
A cross-sectional life table is created, and the corresponding mean Health Utility Index is used to help calculate the HALE, for both those in residential living and those that live in hospital institutions.
The gap between life expectancy and HALE represents a measure of the burden of ill health. The HALE is important for looking at the concept of compression/expansion of morbidity. The question that we’re interested in over time is not only if people are living longer, but are the living longer with less

CUGH Module 21 - Supplementary contents
Page 7 of 11
disability. If a population is living 5 years longer, an improvement in health would see the HALE increasing by 5 years or more.
Over the past 30 years, there has been evidence of compression of morbidity (that is, people are living longer and healthier).
Back to Module
Notes on The Global Burden of Disease Study
The Global Burden of Disease Study was first published and explained in the World Development Report 1993, by the World Bank. The purpose behind the Global Burden of Disease was noted to be three-fold:
1) To put a clearly summary measure of disability;
2) To clearly define and systematically address issues between public health advocacy and the epidemiological evidence of mortality and morbidity (i.e. “What is the real evidence of the burden of a specific disease?”); and
3) To provide a summary tool that could measure the mortality and morbidity combination and use it as a tool for cost-effectiveness analysis.
Back to Module
Notes on Burden of Disease Measures
The Burden of Disease means a combination of the reduction in the length of life, and the reduction in the quality of life. It measures the amount of a lost life year, which is the gap between a population’s current health status and some reference ideal. This health gap is the burden of disease. Unlike the Quality Adjusted Life Year (QALY), DALY is a negative concept, and measures health gaps, NOT health utility.
DALY is the measure of the gap between a population’s health and its “ideal health achievement.”
The underlying principle is there is a common measurement for health outcomes, and that non-health outcome differences should be restricted to age and sex.
Back to Module
Notes on DALY Calculations
The DALY can be viewed as the opposite to the QALY calculations, where the scale runs from 0 for no disability up to 1 for death.

CUGH Module 21 - Supplementary contents
Page 8 of 11
The DALY uses a theoretical maximum life expectancy, using Japan as the ideal country. Back in 1993, the ideal calculations worked to a life expectancy of 80 years for males, and 82.5 years for females.
The process by how the DALYs were calculated was an iterative, deliberative process across different conditions and injuries. The DALY used a person trade-off method to determine different diseases. In the end, the Global Burden of Disease came up with 7 disability classes for the variety of diseases from full health to death.
Back to Module
Notes on The DALY
The DALY uses a combination of mortality and morbidity.
The Years of Life Lost (YLL), is a function of the gap between the maximal life expectancy (80.0 years for males, 82.5 years for females) and the age of death.
There is also an age weighting factor and a discount weight that we’ll explore over the next few slides.
The Years of Life with Disability (YLD) uses a similar formula but with a disability weight attached.
Back to Module
Notes on Age Weighting
Age weighting refers to the concept that some ages are “valued” more than others. In the Global Burden of Disease, the emphasis was placed on the youngest productive age groups (around the age of 25), while children or more elderly individuals have their values discounted, because of their need for “support”, which reflects the concept that maximizes human capital.
Murray and Acharya (1997) frame the issue as follows:
Imagine the situation where there is only one course of antibiotics available and two individuals with meningitis arrive simulataneously at the emergency room. The only difference between the two that we know about is their age: one is 2 years old and the other is 22. Their prognosis is identical. Which patient would you choose to treat?
Age weighting “discounts” the effects of children, but their values are incorporated as they go through the “prime ages” of early adulthood.
Back to Module

CUGH Module 21 - Supplementary contents
Page 9 of 11
Notes on Discounting
Discounting is the concept that adjusts for relieving the burden of illness today as compared to down the road. The standard used in the Global Burden of Disease is 3%. Discounting is most commonly used in finance to reflect that a given amount of money, corrected for inflation, is more valuable now than a year from now, and the year after is worth even less.
The reason behind this is because of the disease eradication versus health research paradox. Without discounting and with improving technology to eradicate disease, it would suggest that disease prevention should be delayed until the technology is available to eradicate disease.
There is also a time paradox, where mortality rates are declining and costs are increasing, which would not be reflected without discounting.
Back to Module
Notes on Disability Weights
Each disease has a “disability weight” attached to them. The Global Burden of Disease classified them into 7 distinct categories. The disability weights used the person-trade-off methodology to look at social preferences.
There have been some concerns with using the person trade-off methodology. First, there is a problem of adaptation. In theory, an individual may have a significant worsening of health during the acute phase, but over time, he/she may adapt to the situation, and have an increased view of health. If one was to utilize pre-adaptation figures, it makes prevention and rehabilitation cost effective, but treatment for keeping an individual alive, less cost-effective. However, if post-adaptation figures are used, the opposite effect is observed.
A second concern is that the valuation of quantity and quality of life for “other people’s preferences” may be different than the valuation of quantity and quality of life for oneself.
Finally, the framing of how questions are worded may lead to different results.
Back to Module
Notes on Criticisms of the DALY
The first criticism against the DALY is that the decision to utilize health professional experts as against community and individual assessments may lead to an over-inflation of the value put against disabilities.
The second concern is differential age-weighting, which seems to be an especially large penalty on the elderly, whose valuation of disability seems to be lessoned. A

CUGH Module 21 - Supplementary contents
Page 10 of 11
similar argument has been made against children that their diseases have been age-weighted against their diseases being deemed a priority.
The third concern is that disabilities are additive in nature. Therefore, if someone has 2 diseases, the interactions are not calculated, but the disabilities are just added to each other. For example, if being blind has a DALY of 0.5, and being deaf has a DALY of 0.3, the DALY burden would be 0.8. In theory, the DALY weight could be more than 1.0 (which is the value of death).
The fourth concern was that there was no equity value placed in the DALY. In general, health tends to prioritize those that are “worse off”. The DALY attempts to make no consideration for the “worse off”.
The fifth concern is there is that those with limited treatment potentials (e.g. cancer patients), have no prioritization under this scheme.
The sixth criticism is that the quality differences in outcomes aren’t taken into account. For example, treatment of life-saving decisions which benefit a few versus health-improving interventions across a lot of people is distinctly different.
Back to Module
Notes on More Criticisms of the DALY
The seventh criticism is there is a difference between the maximum life expectancy between males and females. In general, the observed sex difference between males and females is 7 years in wealthy nations. Some of these differences were due to lifestyle differences in tobacco and alcohol, and a 2.5 year arbitrary difference was decided.
The final criticism is that the discount measure of health outcomes may be too high or too low, and that 3% is an arbitrary figure. In calculations for other health outcomes in develop##[do you mean “developed”] countries, 7% may be a figure that is used. However, Murray justifies this as a low estimate that may be more applicable to developing countries.
Back to Module
Notes on Mortality by 2030
The work by Mathers and Loncar (2006) shows that mortality predictions are still quite consistent with the original work by Murray and Lopez (1997). In high income countries, non-communicable diseases include heart disease, stroke, and lung cancer predominate.
In middle income countries, stroke, heart disease, and COPD (emphysema) predominate. Interestingly, lung cancer is also high on the list, implying that

CUGH Module 21 - Supplementary contents
Page 11 of 11
tobacco use is becoming rampant in middle income countries, and HIV/AIDS is become a bigger problem.
In low income countries, heart disease and HIV/AIDS, and stroke are big killers. However, communicable diseases (LRI, diarrheal disease, and malaria) play a major role as well.
Back to Module
Notes on DALYs by 2030
When we take a look at DALYs, the emphasis shifts.
High on the priority list is depression and its related co-morbidities across all income groups. This is surprising, because it does not show up on the radar in the mortality lists, but plays a large contributor of burden to society.
In high income countries, issues of affluence are also a problem, including heart disease, alcohol, and diabetes. Alzheimer’s dementia also plays an important role.
In middle and low income countries, HIV/AIDS is a major contributor.
In middle income countries, stroke, heart disease, and emphysema are important. In low income countries, perinatal mortality is still playing a role, and basic prevention from road traffic accidents.
Back to Module
Notes on What Measures of Global Burden of Disease are Used Today?
Despite the criticisms of the DALY, it is still the predominate measure used today in global health priority debates. Although mortality is sometimes used, mortality is recognized as being insufficient, and a measure that includes morbidity is preferred.
Political pressure on specific special-interest diseases still occurs, but the DALY is increasingly being used to inform our debates on the burden of disease and the priorities that should be made in informing health.
Back to Module