Embed Size (px)
Citation preview
Global Chinese Art Auction Market Report 2018 3

Contents
2 Global Chinese Art Auction Market Report 2018
Global Chinese Art Auction Market Report 2018 3
Foreword 4
About artnet 6
About the China Association of Auctioneers 8
2018 Key Findings 101.0 The Chinese Art Market in 2018 181.1 Market Overview 191.2 Mainland China Market 201.3 Overseas Market 212.0 Sector Breakdown and Price Distribution 242.1 Performance by Price Segments 252.2 Performance by Sector 282.3 Market Structure 32
Appendix 1 35Top 50 Auction Houses by Total Sales Value of Chinese Art and Antiques in 2018
Appendix 2 37 Top 50 Auction Houses in Mainland China by Value Paid, 2018 Appendix 3 38Top 50 Chinese Art and Antiques by Sale Price in 2018
Notes 40
Contact 44

4 Global Chinese Art Auction Market Report 2018
Foreword
4 Global Chinese Art Auction Market Report 2018
Global Chinese Art Auction Market Report 2018 5
artnet and the China Association of Auctioneers (CAA) are pleased to pres-ent the seventh annual edition of the Global Chinese Art Auction Market Report, offering an in-depth look at the market for Chinese art and antiques in 2018.
Global auction sales of Chinese art and antiques totaled $6.4 billion in 2018, decreasing by 10% year-on-year. Amidst economic uncertainties and ongo-ing US-China trade talks, the total auction sales value in mainland China declined by 17% in 2018, totaling $4.2 billion, the lowest level since 2010. North America also saw a 36% decline in the total sales value of Chinese art and antiques year-on-year.
At its peak, total auction sales of Chinese art and antiques accounted for 50% of the global art auction sales. However, influenced by the slowdown in China’s economic growth and the shifting geopolitical landscape, this market share had declined to 31% in 2018.
By drawing from the wealth of reliable market data for which both artnet and the CAA are known, the Global Chinese Art Auction Market Report provides an in-depth look at the market size, sector trends, and key players in Chi-nese art and antiques auctions around the world. Over the past seven years, data from mainland China provided by the CAA has also been integrated into the artnet Price Database, making vetted auction results from mainland China readily available to the rest of the world for the first time.
Once again, we would like to express our sincerest appreciation to all who have made this report possible.
6 Global Chinese Art Auction Market Report 2018
About artnet
6 Global Chinese Art Auction Market Report 2018
Global Chinese Art Auction Market Report 2018 7
artnet is the leading online resource for the inter- national art market, and the destination to buy, sell, and research art online. Founded in 1989 with the goal of bringing transparency to the art world, artnet’s comprehensive suite of products offers a variety of art market resources to our audience of collectors, dealers, and art enthusiasts.
The Price Database offers the most comprehensive archive of auction results in the world. Host to over 13 million results spanning over 30 years, every lot is catalogued, translated, and edited by a team of multilingual specialists. The database is a valuation tool used by appraisers, dealers, and collectors, allowing users to make informed decisions about buying or selling art.
Market Alerts informs users of buying opportunities, enabling them to receive email notifications whenev-er works by their favorite artists hit the market at any major auction house, gallery, or event. With the Auction Results Alerts add-on, users can also be informed of recent auction results for the artists they follow.
Introduced in 1995, the Gallery Network is an online platform that connects galleries and collectors from around the world. With over 200,000 artworks, it is the largest network of its kind, drawing a broad audience and generating inquiries from both serious collectors and first-time buyers.
With 24/7 bidding, artnet Auctions is the first online auctions platform for buying and selling Modern and contemporary paintings, prints, photographs, sculpture, and more. Its curated auctions provide a unique collecting experience with instant turnaround and lower commissions, and are accessed by millions of monthly visitors worldwide.
Analytics Reports allows users to create customized reports that delve deeper into specific art market trends. Each report includes graphs and charts that visualize market patterns, drawing from the millions of auction results in the Price Database.
Auction House Partnerships offers auction houses the ability to showcase their works to artnet’s global community. Each partnership includes links between artnet and the auction house’s proprietary site, driving more traffic and gaining exposure for their sales.
In 2012, artnet launched a 24-hour global art newswire: artnet News. Serving as a one-stop platform for the events, trends, and people that shape the art market and global industry, artnet News provides up-to-the-minute analysis and expert commentary.
Today, artnet continues to provide reliable informa-tion and market transparency to an audience of millions of monthly users from around the world. As the art market continues to grow and change, artnet will always find new ways for people to connect with the art they love.
8 Global Chinese Art Auction Market Report 2018
About the Chinese Association of Auctioneers (CAA)
8 Global Chinese Art Auction Market Report 2018
Global Chinese Art Auction Market Report 2018 9
The China Association of Auctioneers (CAA) is the only national association of the auction industry in China. Its functions include auctioneers administration, auction house regulation, and industry supervision, as well as industry guidance, policy coordination, industry statistics, consulting services, resources platform and international platform development.
Established in 1995, the CAA has been making every effort to promote the healthy development of China’s auction industry and market, serving as the most important auction platform for fostering connections within China and with the rest of the world.. Revital-ized in 1986 and now led by the CAA, the Chinese auction industry has entered a new era.
In 1996, the Auction Law of the People’s Republic of China was issued under the promotion of CAA. As the first auction law in China, it laid a solid founda-tion for the standardization of China’s auction industry.
In 1997, the CAA designated the first group of national certified auctioneers. Currently, over 13,000 national auctioneers have been trained and certified, and serve as the backbone of the industry.
In 2000, the CAA founded the Chinese Cultural Artifacts Auction Professional Committee to specifi-cally fulfill its regulatory, guiding, administrative, and supervisory responsibilities of the art and antiques auction industry in China.
The number of the CAA’s auction house members reached 1,000 in 2005. Today, it has over 3,000 members who constitute the majority of the auction houses currently operating in mainland China.
China’s Ministry of Commerce issued the Standard for Auction of Cultural Relics and Art Works in 2010. Drafted by the CAA, this document marked the beginning of the standardization process. Today, the industry is regulated by three national standards and five industry codes of practice.
Since 2012, the CAA has continued promoting standardization in the industry by vetting auction houses in mainland China according to the Standard for Auction of Cultural Relics and Art Works, effec-tively catalyzed the shift from quantity-driven to quality-driven growth. So far, 56 antiques and art auction houses have been certified as meeting the industry standard.
The CAA partnered with artnet in 2014 to successful-ly co-host an international summit, The Chinese Art Market: Present and Future, in New York. During the summit, the CAA proposed the establishment of an international auctioneers association.
In 2015, the CAA completed the framework of a credit system and an international platform for the antiques and art auction market in China, thus establishing the foundation for sustainable growth and a global strategy for the industry.
In 2016, the CAA founded Auction of Cultural Relics and Art Works Awards, “Qinghua Awards,” the highest honor in the field of Chinese art auctions.
The CAA hosted the fourth Chinese Art Auction International Summit in 2017. The summit explored the development and transition alongside the global Chinese art auction under globalization trends.
In the future, the CAA will continue to play a leading role in the Chinese auction industry, and work with its colleagues around the world in promoting the integration and development of the global auction market.
10 Global Chinese Art Auction Market Report 2018
1.
2018 Key Findings
10 Global Chinese Art Auction Market Report 2018
Key Findings 2018 11
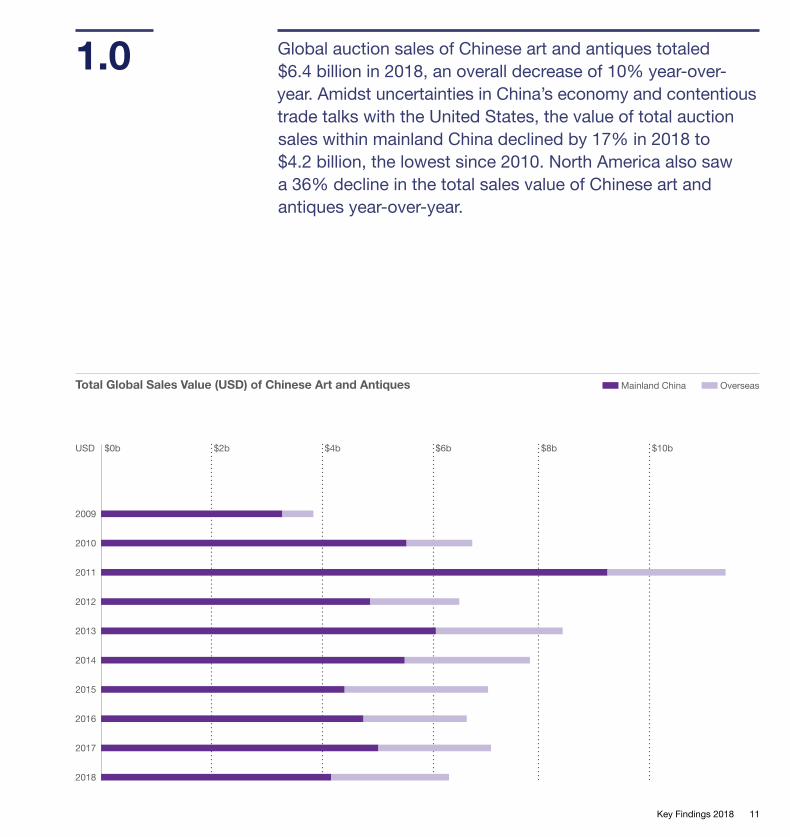
Global auction sales of Chinese art and antiques totaled $6.4 billion in 2018, an overall decrease of 10% year-over- year. Amidst uncertainties in China’s economy and contentious trade talks with the United States, the value of total auction sales within mainland China declined by 17% in 2018 to $4.2 billion, the lowest since 2010. North America also saw a 36% decline in the total sales value of Chinese art and antiques year-over-year.
1.0
Total Global Sales Value (USD) of Chinese Art and Antiques
$2b$0bUSD $4b $6b $8b $10b
Mainland China Overseas
2009
2010
2011
2012
2013
2014
2015
2016
2017
2018
12 Global Chinese Art Auction Market Report 2018
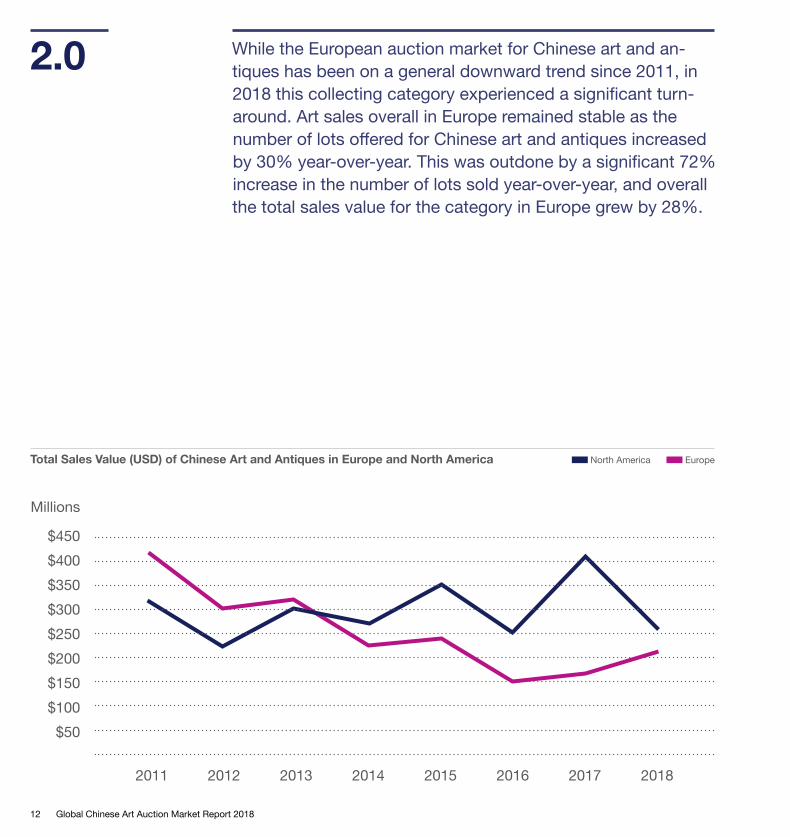
While the European auction market for Chinese art and an-tiques has been on a general downward trend since 2011, in 2018 this collecting category experienced a significant turn-around. Art sales overall in Europe remained stable as the number of lots offered for Chinese art and antiques increased by 30% year-over-year. This was outdone by a significant 72% increase in the number of lots sold year-over-year, and overall the total sales value for the category in Europe grew by 28%.
2.0
2011 2012 2013 2014 2015 2016 2017 2018
$50$100$150$200$250$300$350$400$450
Millions
EuropeNorth AmericaTotal Sales Value (USD) of Chinese Art and Antiques in Europe and North America
Key Findings 2018 13
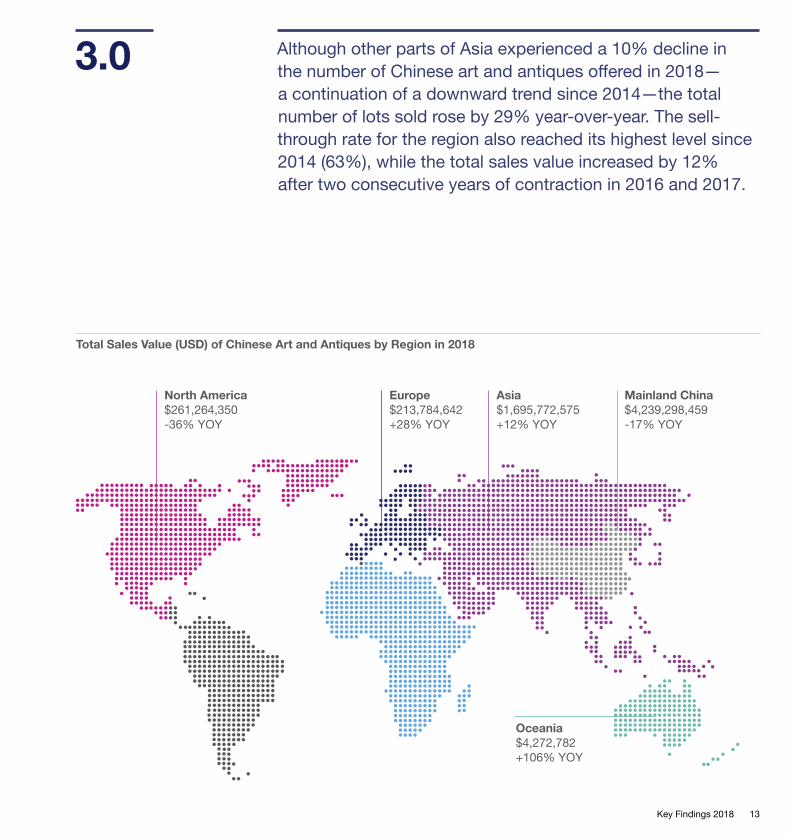
Although other parts of Asia experienced a 10% decline in the number of Chinese art and antiques offered in 2018— a continuation of a downward trend since 2014—the total number of lots sold rose by 29% year-over-year. The sell-through rate for the region also reached its highest level since 2014 (63%), while the total sales value increased by 12% after two consecutive years of contraction in 2016 and 2017.
3.0
Mainland China$4,239,298,459-17% YOY
Asia $1,695,772,575 +12% YOY
Oceania$4,272,782 +106% YOY
Europe $213,784,642 +28% YOY
North America$261,264,350-36% YOY
Total Sales Value (USD) of Chinese Art and Antiques by Region in 2018
14 Global Chinese Art Auction Market Report 2018
4.0
0
5
10
15
20
25
30
35
40
2012 2013 2014 2015 2016 2017 2018
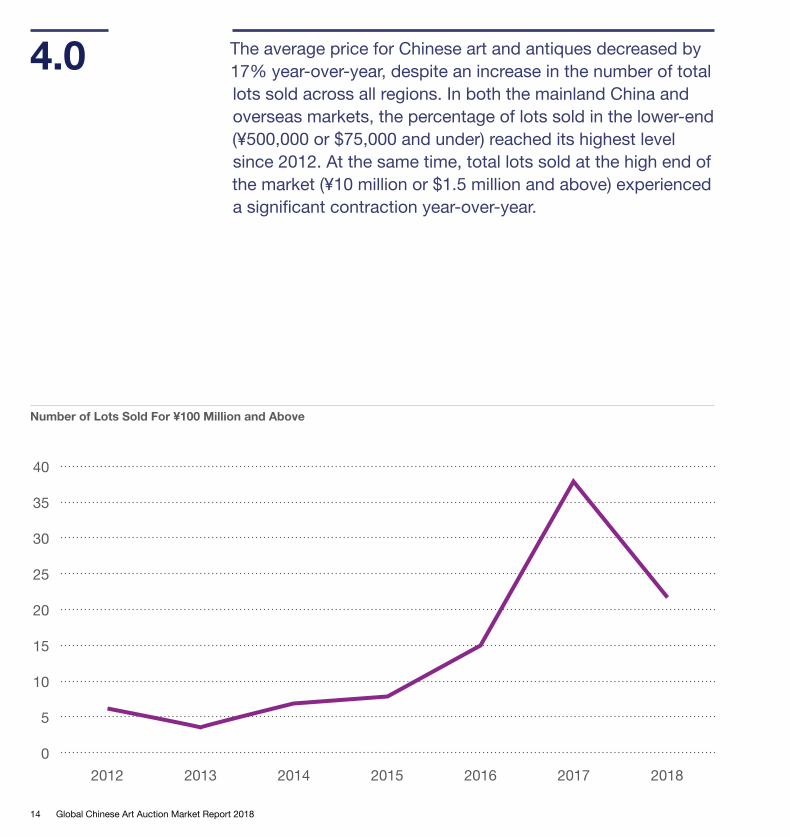
Number of Lots Sold For ¥100 Million and Above
The average price for Chinese art and antiques decreased by 17% year-over-year, despite an increase in the number of total lots sold across all regions. In both the mainland China and overseas markets, the percentage of lots sold in the lower-end (¥500,000 or $75,000 and under) reached its highest level since 2012. At the same time, total lots sold at the high end of the market (¥10 million or $1.5 million and above) experienced a significant contraction year-over-year.
Key Findings 2018 15
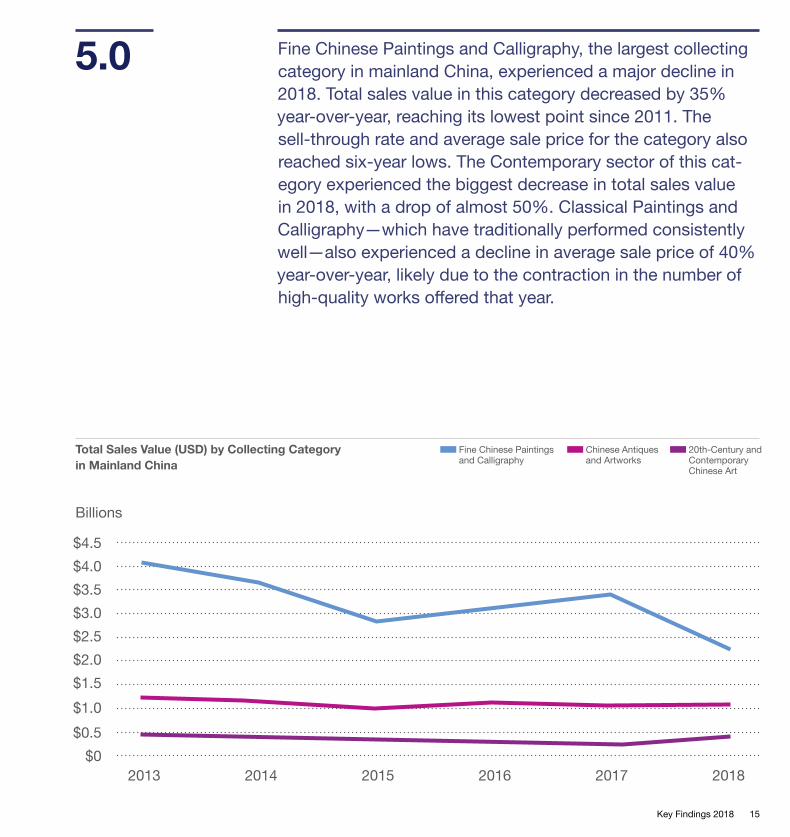
Fine Chinese Paintings and Calligraphy, the largest collecting category in mainland China, experienced a major decline in 2018. Total sales value in this category decreased by 35% year-over-year, reaching its lowest point since 2011. The sell-through rate and average sale price for the category also reached six-year lows. The Contemporary sector of this cat-egory experienced the biggest decrease in total sales value in 2018, with a drop of almost 50%. Classical Paintings and Calligraphy—which have traditionally performed consistently well—also experienced a decline in average sale price of 40% year-over-year, likely due to the contraction in the number of high-quality works offered that year.
5.0
2013 2014 2015 2016 2017 2018$0
$0.5$1.0$1.5$2.0$2.5$3.0$3.5$4.0$4.5
Total Sales Value (USD) by Collecting Category in Mainland China
Chinese Antiques and Artworks
20th-Century and Contemporary Chinese Art
Fine Chinese Paintings and Calligraphy
Billions
16 Global Chinese Art Auction Market Report 2018
6.0
2011 2012 2013 2014 2015 2016 2017 2018
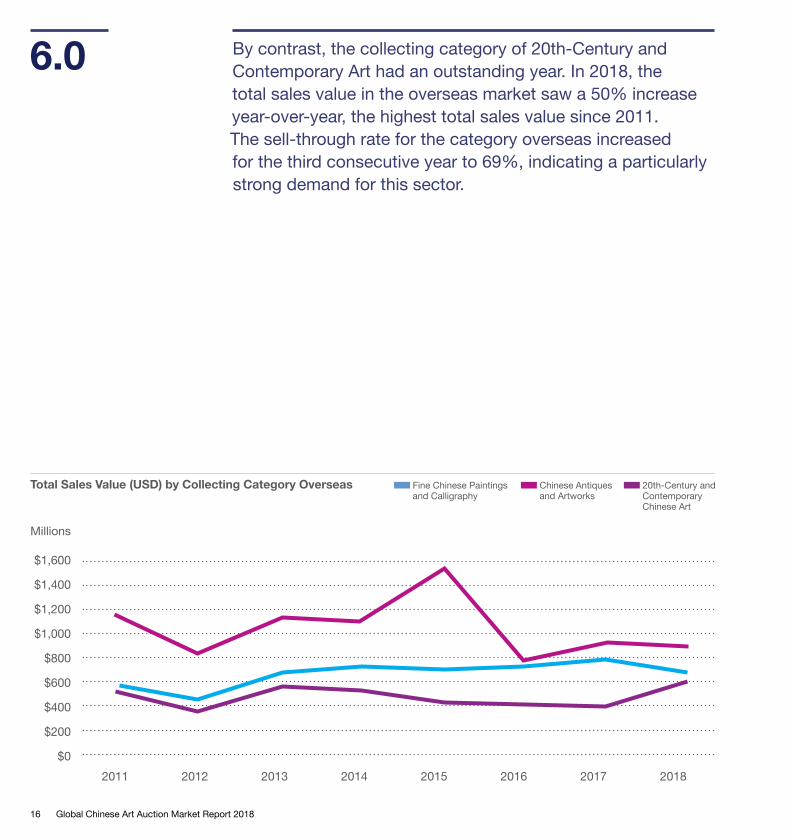
Total Sales Value (USD) by Collecting Category Overseas Chinese Antiques and Artworks
20th-Century and Contemporary Chinese Art
Fine Chinese Paintings and Calligraphy
By contrast, the collecting category of 20th-Century and Contemporary Art had an outstanding year. In 2018, the total sales value in the overseas market saw a 50% increase year-over-year, the highest total sales value since 2011. The sell-through rate for the category overseas increased for the third consecutive year to 69%, indicating a particularly strong demand for this sector.
$200
$0
$400
$600
$800
$1,000
$1,200
$1,400
$1,600
Millions

Global Chinese Art Auction Market Report 2018 17
18 Global Chinese Art Auction Market Report 2018
1.
The Chinese Art Market in 2018
1.018 Global Chinese Art Auction Market Report 2018
The Chinese Art Market in 2018 19
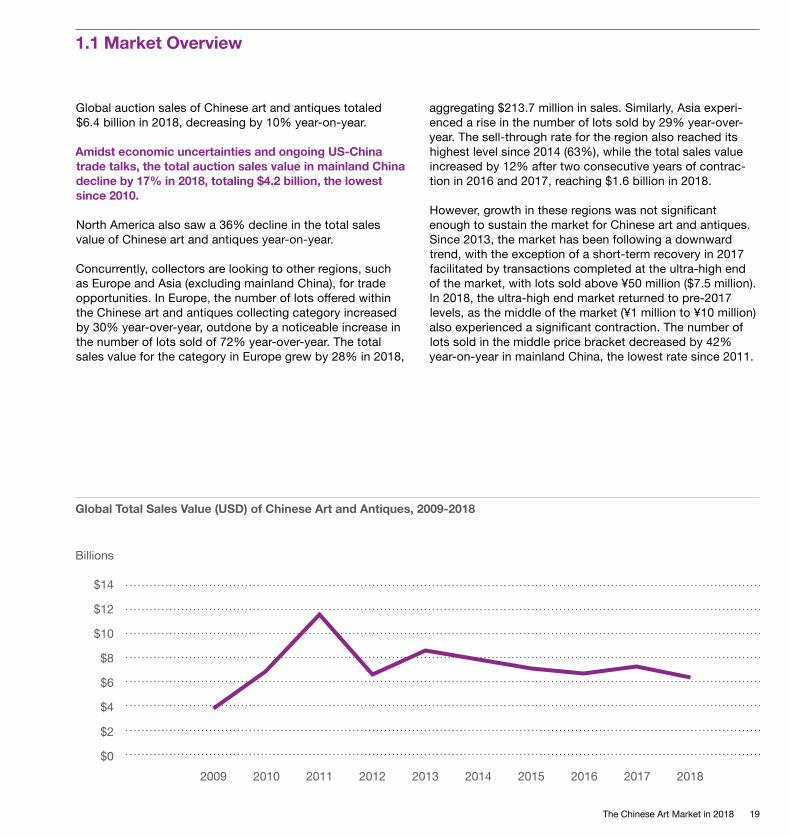
Global auction sales of Chinese art and antiques totaled $6.4 billion in 2018, decreasing by 10% year-on-year.
Amidst economic uncertainties and ongoing US-China trade talks, the total auction sales value in mainland China decline by 17% in 2018, totaling $4.2 billion, the lowest since 2010.
North America also saw a 36% decline in the total sales value of Chinese art and antiques year-on-year.
Concurrently, collectors are looking to other regions, such as Europe and Asia (excluding mainland China), for trade opportunities. In Europe, the number of lots offered within the Chinese art and antiques collecting category increased by 30% year-over-year, outdone by a noticeable increase in the number of lots sold of 72% year-over-year. The total sales value for the category in Europe grew by 28% in 2018,
aggregating $213.7 million in sales. Similarly, Asia experi-enced a rise in the number of lots sold by 29% year-over-year. The sell-through rate for the region also reached its highest level since 2014 (63%), while the total sales value increased by 12% after two consecutive years of contrac-tion in 2016 and 2017, reaching $1.6 billion in 2018.
However, growth in these regions was not significant enough to sustain the market for Chinese art and antiques. Since 2013, the market has been following a downward trend, with the exception of a short-term recovery in 2017 facilitated by transactions completed at the ultra-high end of the market, with lots sold above ¥50 million ($7.5 million). In 2018, the ultra-high end market returned to pre-2017 levels, as the middle of the market (¥1 million to ¥10 million) also experienced a significant contraction. The number of lots sold in the middle price bracket decreased by 42% year-on-year in mainland China, the lowest rate since 2011.
1.1 Market Overview
Billions
2009 2010 2011 2012 2013 2014 2015 2016 2017 2018
Global Total Sales Value (USD) of Chinese Art and Antiques, 2009-2018
$0
$2
$4
$6
$8
$10
$12
$14
20 Global Chinese Art Auction Market Report 2018
2011 2012 2013 2014 2015 2016 2017 2018
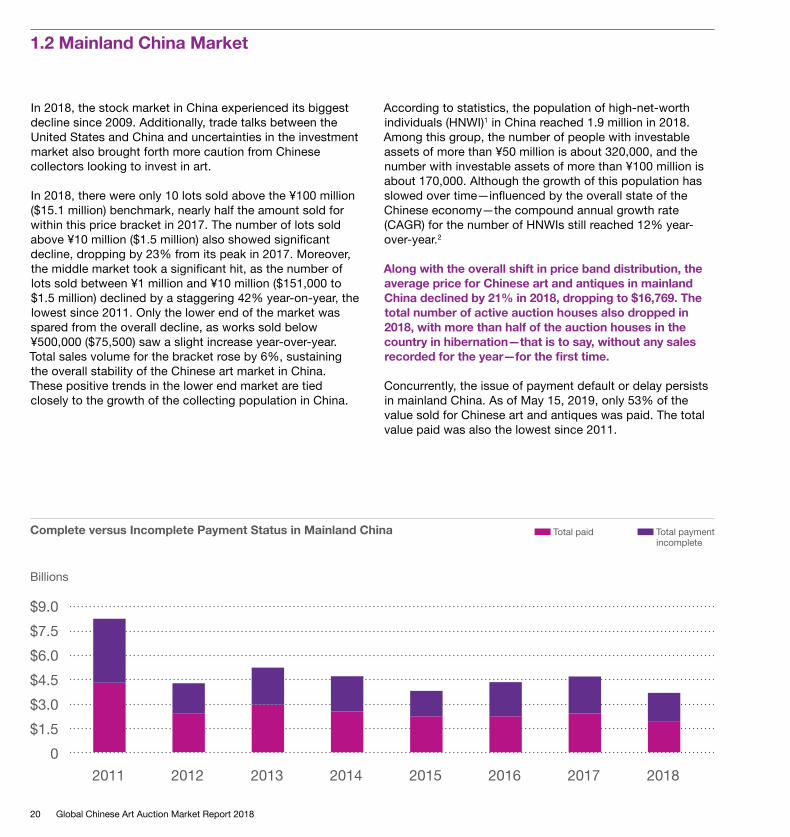
Complete versus Incomplete Payment Status in Mainland China Total paid Total payment incomplete
In 2018, the stock market in China experienced its biggest decline since 2009. Additionally, trade talks between the United States and China and uncertainties in the investment market also brought forth more caution from Chinese collectors looking to invest in art.
In 2018, there were only 10 lots sold above the ¥100 million ($15.1 million) benchmark, nearly half the amount sold for within this price bracket in 2017. The number of lots sold above ¥10 million ($1.5 million) also showed significant decline, dropping by 23% from its peak in 2017. Moreover, the middle market took a significant hit, as the number of lots sold between ¥1 million and ¥10 million ($151,000 to $1.5 million) declined by a staggering 42% year-on-year, the lowest since 2011. Only the lower end of the market was spared from the overall decline, as works sold below ¥500,000 ($75,500) saw a slight increase year-over-year. Total sales volume for the bracket rose by 6%, sustaining the overall stability of the Chinese art market in China. These positive trends in the lower end market are tied closely to the growth of the collecting population in China.
According to statistics, the population of high-net-worth individuals (HNWI)1 in China reached 1.9 million in 2018. Among this group, the number of people with investable assets of more than ¥50 million is about 320,000, and the number with investable assets of more than ¥100 million is about 170,000. Although the growth of this population has slowed over time—influenced by the overall state of the Chinese economy—the compound annual growth rate (CAGR) for the number of HNWIs still reached 12% year-over-year.2
Along with the overall shift in price band distribution, the average price for Chinese art and antiques in mainland China declined by 21% in 2018, dropping to $16,769. The total number of active auction houses also dropped in 2018, with more than half of the auction houses in the country in hibernation—that is to say, without any sales recorded for the year—for the first time.
Concurrently, the issue of payment default or delay persists in mainland China. As of May 15, 2019, only 53% of the value sold for Chinese art and antiques was paid. The total value paid was also the lowest since 2011.
1.2 Mainland China Market
0$1.5$3.0$4.5$6.0$7.5$9.0
Billions
The Chinese Art Market in 2018 21
Along with the growth in the overall art market, the total sales value for Chinese art and antiques overseas grew by 4% year-on-year, reaching $2.2 billion.
Although Asia (excluding mainland China) experienced a 10% contraction in the number of Chinese art and antiques offered in 2018, which continued a downward trend that began in 2014, the total lots sold in Asia rose by 29% year-over-year. The sell-through rate for the region also reached the highest levels since 2014 (63%), while the total sales value increased by 12% after two consecutive years of contraction in 2016 and 2017.
Within the region, Hong Kong saw a significant increase in its popularity as a trading center for Chinese art and antiques in 2018. The total sales value for the territory grew by 9% year-over-year, reaching $1.5 billion. The sell-through rate also soared, from 43% in 2017 to 64% in 2018. Although Taiwan and Japan have smaller markets for this collecting category, both countries’ sales expand-ed in 2018, growing in dollar value by 58% and 67%, respectively.
While European sales for Chinese art and antiques have been on a general downward trend since 2011, in 2018 the category showed significant signs of a positive future. As overall art sales in Europe remained stable in 2018, the number of lots offered for Chinese art and antiques increased by 30% year-over-year, outdone by a noticeable increase in the number of lots sold of 72% year-over-year. The total sales value for the category in Europe grew by 28% in 2018, reaching $213.7 million.
That being said, Chinese art and antiques is still a niche market within the European and North American art markets. Its total sales value can often be influenced significantly by a few individual sales of high-profile lots. In 2017, the sale “Important Chinese Art from the Fujita Museum” offered by Christie’s New York brought in $262.4 million in one night, more than the total sales value for Chinese art and antiques for the entire region in 2016. Museum collection sales of that caliber are not, however, yearly phenomena. As expected, therefore, the total sales value in North America for Chinese art and antiques suffered a 36% decline in 2018, going back to levels last seen in 2016.
1.3 Overseas Market
1 HNWI, or high-net-worth individuals, refers to individuals with over $1.5 million (¥10 million) in investable assets.
2 Bain Consulting and China Merchants Bank: 2019 China Private Wealth Report, p5
22 Global Chinese Art Auction Market Report 2018
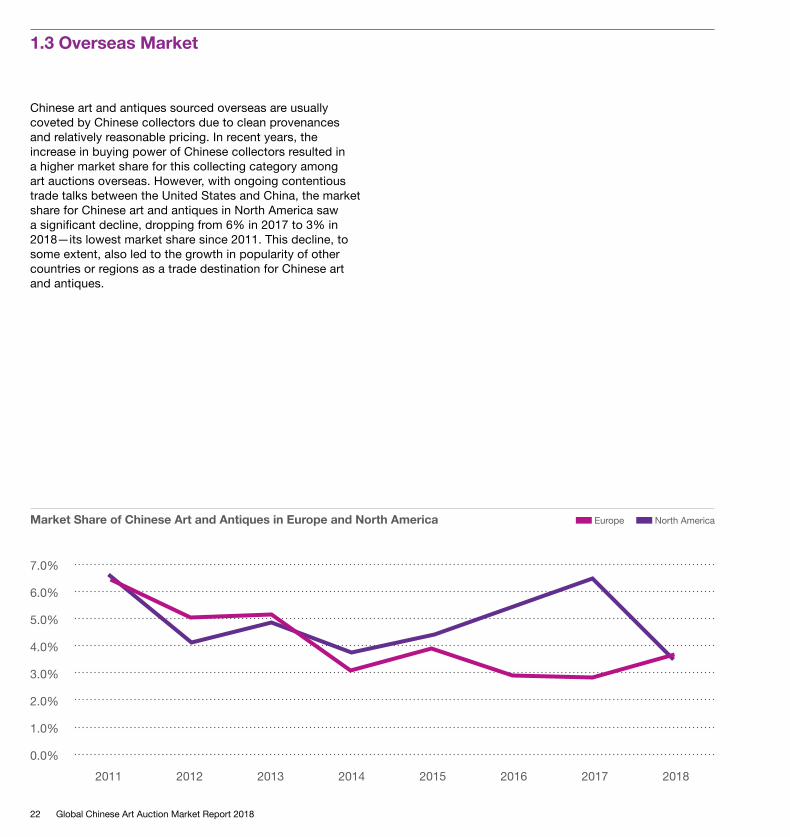
Chinese art and antiques sourced overseas are usually coveted by Chinese collectors due to clean provenances and relatively reasonable pricing. In recent years, the increase in buying power of Chinese collectors resulted in a higher market share for this collecting category among art auctions overseas. However, with ongoing contentious trade talks between the United States and China, the market share for Chinese art and antiques in North America saw a significant decline, dropping from 6% in 2017 to 3% in 2018—its lowest market share since 2011. This decline, to some extent, also led to the growth in popularity of other countries or regions as a trade destination for Chinese art and antiques.
1.3 Overseas Market
Market Share of Chinese Art and Antiques in Europe and North America North AmericaEurope
2011 2012 2013 2014 2015 2016 2017 20180.0%
1.0%
2.0%
3.0%
4.0%
5.0%
6.0%
7.0%

Global Chinese Art Auction Market Report 2018 23
24 Global Chinese Art Auction Market Report 2018
1.
Sector Breakdown and Price Distribution
2.024 Global Chinese Art Auction Market Report 2018
Sector Breakdown and Price Distribution 25
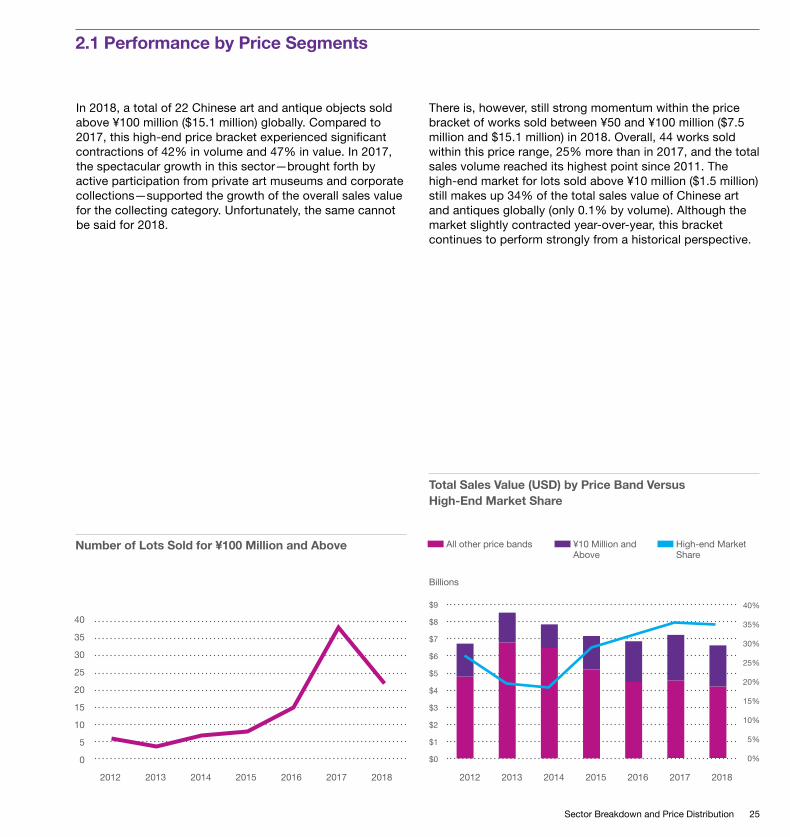
In 2018, a total of 22 Chinese art and antique objects sold above ¥100 million ($15.1 million) globally. Compared to 2017, this high-end price bracket experienced significant contractions of 42% in volume and 47% in value. In 2017, the spectacular growth in this sector—brought forth by active participation from private art museums and corporate collections—supported the growth of the overall sales value for the collecting category. Unfortunately, the same cannot be said for 2018.
There is, however, still strong momentum within the price bracket of works sold between ¥50 and ¥100 million ($7.5 million and $15.1 million) in 2018. Overall, 44 works sold within this price range, 25% more than in 2017, and the total sales volume reached its highest point since 2011. The high-end market for lots sold above ¥10 million ($1.5 million) still makes up 34% of the total sales value of Chinese art and antiques globally (only 0.1% by volume). Although the market slightly contracted year-over-year, this bracket continues to perform strongly from a historical perspective.
0
2012 2013 2014 2015 2016 2017 2018 2012 2013 2014 2015 2016 2017 2018
5
10
15
20
25
30
35
4040%
35%
30%
25%
20%
15%
10%
5%
$0 0%
2.1 Performance by Price Segments
$9
$8
$7
$6
$5
$4
$3
$2
$1
Billions
Number of Lots Sold for ¥100 Million and Above
Total Sales Value (USD) by Price Band Versus High-End Market Share
¥10 Million and Above
High-end Market Share
All other price bands
26 Global Chinese Art Auction Market Report 2018
The growth in market share of blue-chip works comes at a cost.
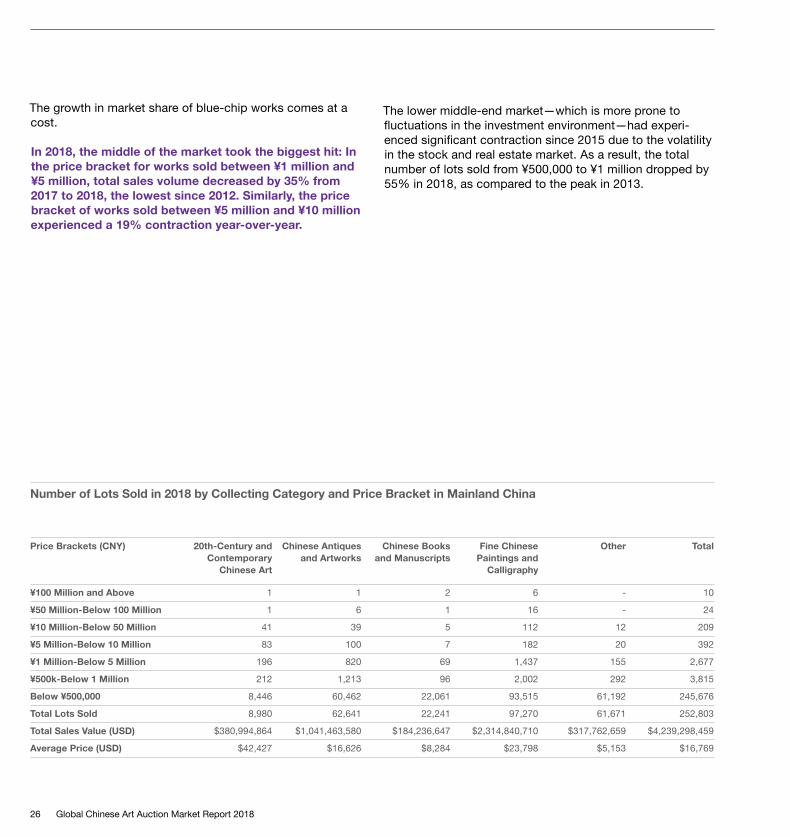
In 2018, the middle of the market took the biggest hit: In the price bracket for works sold between ¥1 million and ¥5 million, total sales volume decreased by 35% from 2017 to 2018, the lowest since 2012. Similarly, the price bracket of works sold between ¥5 million and ¥10 million experienced a 19% contraction year-over-year.
Number of Lots Sold in 2018 by Collecting Category and Price Bracket in Mainland China
Price Brackets (CNY) 20th-Century and Chinese Antiques Chinese Books Fine Chinese Other Total Contemporary and Artworks and Manuscripts Paintings and Chinese Art Calligraphy
¥100 Million and Above 1 1 2 6 - 10
¥50 Million-Below 100 Million 1 6 1 16 - 24
¥10 Million-Below 50 Million 41 39 5 112 12 209
¥5 Million-Below 10 Million 83 100 7 182 20 392
¥1 Million-Below 5 Million 196 820 69 1,437 155 2,677
¥500k-Below 1 Million 212 1,213 96 2,002 292 3,815
Below ¥500,000 8,446 60,462 22,061 93,515 61,192 245,676
Total Lots Sold 8,980 62,641 22,241 97,270 61,671 252,803
Total Sales Value (USD) $380,994,864 $1,041,463,580 $184,236,647 $2,314,840,710 $317,762,659 $4,239,298,459
Average Price (USD) $42,427 $16,626 $8,284 $23,798 $5,153 $16,769
The lower middle-end market—which is more prone to fluctuations in the investment environment—had experi-enced significant contraction since 2015 due to the volatility in the stock and real estate market. As a result, the total number of lots sold from ¥500,000 to ¥1 million dropped by 55% in 2018, as compared to the peak in 2013.
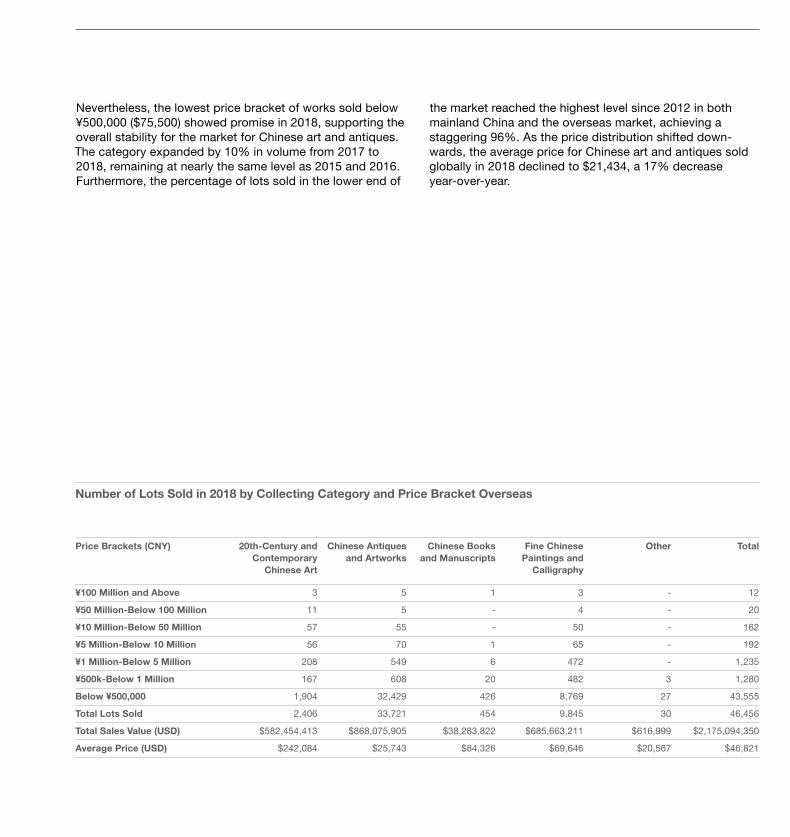
Nevertheless, the lowest price bracket of works sold below ¥500,000 ($75,500) showed promise in 2018, supporting the overall stability for the market for Chinese art and antiques. The category expanded by 10% in volume from 2017 to 2018, remaining at nearly the same level as 2015 and 2016. Furthermore, the percentage of lots sold in the lower end of
the market reached the highest level since 2012 in both mainland China and the overseas market, achieving a staggering 96%. As the price distribution shifted down-wards, the average price for Chinese art and antiques sold globally in 2018 declined to $21,434, a 17% decrease year-over-year.
Number of Lots Sold in 2018 by Collecting Category and Price Bracket Overseas
Price Brackets (CNY) 20th-Century and Chinese Antiques Chinese Books Fine Chinese Other Total Contemporary and Artworks and Manuscripts Paintings and Chinese Art Calligraphy
¥100 Million and Above 3 5 1 3 - 12
¥50 Million-Below 100 Million 11 5 - 4 - 20
¥10 Million-Below 50 Million 57 55 - 50 - 162
¥5 Million-Below 10 Million 56 70 1 65 - 192
¥1 Million-Below 5 Million 208 549 6 472 - 1,235
¥500k-Below 1 Million 167 608 20 482 3 1,280
Below ¥500,000 1,904 32,429 426 8,769 27 43,555
Total Lots Sold 2,406 33,721 454 9,845 30 46,456
Total Sales Value (USD) $582,454,413 $868,075,905 $38,283,822 $685,663,211 $616,999 $2,175,094,350
Average Price (USD) $242,084 $25,743 $84,326 $69,646 $20,567 $46,821
28 Global Chinese Art Auction Market Report 2018 Sector Breakdown and Price Distribution 28
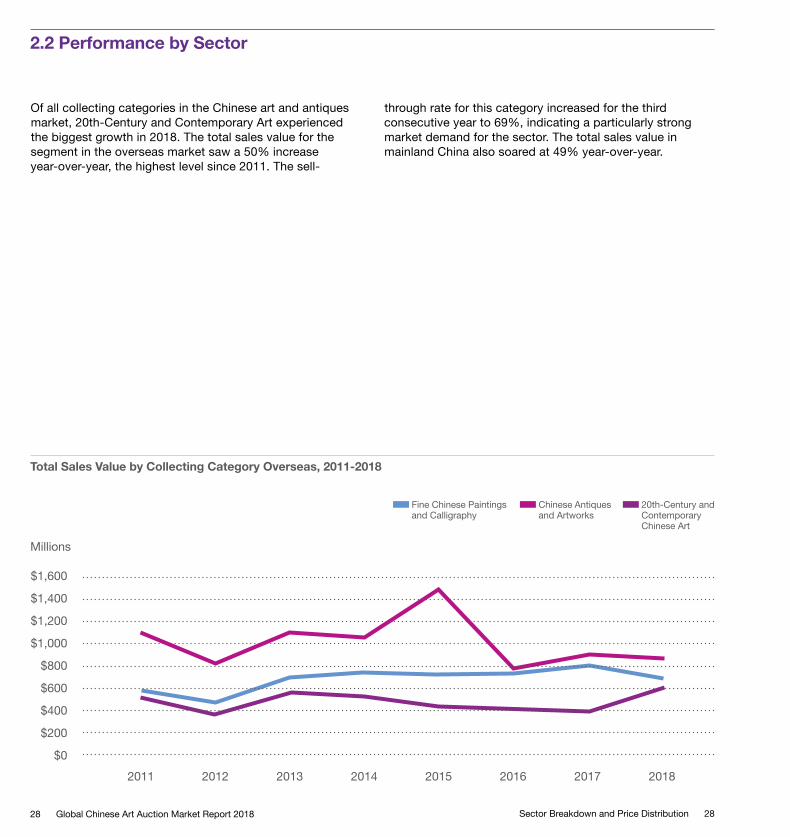
Of all collecting categories in the Chinese art and antiques market, 20th-Century and Contemporary Art experienced the biggest growth in 2018. The total sales value for the segment in the overseas market saw a 50% increase year-over-year, the highest level since 2011. The sell-
through rate for this category increased for the third consecutive year to 69%, indicating a particularly strong market demand for the sector. The total sales value in mainland China also soared at 49% year-over-year.
2.2 Performance by Sector
2011 2012 2013 2014 2015 2016 2017 2018
Total Sales Value by Collecting Category Overseas, 2011-2018
Chinese Antiques and Artworks
20th-Century and Contemporary Chinese Art
Fine Chinese Paintings and Calligraphy
$0
$200
$400
$600
$800
$1,000
$1,200
$1,400
$1,600
Millions

Sector Breakdown and Price Distribution 29
Total Sales Volume by Collecting Category in Mainland China, 2013-2018
Chinese Antiques and Artworks
20th-Century and Contemporary Chinese Art
Fine Chinese Paintings and Calligraphy
2013 2014 2015 2016 2017 2018
In both mainland China and overseas, the collecting category saw a particularly strong growth in the number of lots sold above ¥5 million ($755,000), confirming the category’s strengthening performance for the third consecutive year. The average price for 20th-Century and Contemporary Chinese Art overseas in 2018 soared to $242,084, a record amount for the category, and a 16% improvement from 2017.
Leading the growth in the sector was the celebrated artist Zao Wou-Ki, whose record-breaking sale of the painting Juin-Octobre 1985 elevated his price status to the likes of artists Pablo Picasso, Willem de Kooning, and Jackson Pollock. Zao Wou-Ki’s canvas fetched $65.2 million (HK$510.4 million) at Sotheby’s Hong Kong, the highest price achieved by the artist at auction.
Billions
$0
$0.5
$1.0
$1.5
$2.0
$2.5
$3.0
$3.5
$4.0
$4.5
30 Global Chinese Art Auction Market Report 2018
Fine Chinese Paintings and Calligraphy, the largest collecting category in mainland China, experienced a major decline in 2018. Total sales value in this category decreased by 35% year-over-year, reaching its lowest point since 2011. The sell-through rate (41%) and average sale price ($23,000) for the category both reached six-year lows.
Within Fine Chinese Paintings and Calligraphy, the Contem-porary sector experienced the biggest decrease in total sales value in 2018, with a drop of almost 50%. Classical paintings and calligraphy that traditionally have performed consistently well also experienced a decline in average sale price of 40% year-over-year, likely due to the contraction in the number of high-quality works being offered to the market.
Globally, the Chinese Paintings and Calligraphy category had 24 lots sold over ¥100 million in 2017, in contrast to the nine artworks reaching this price threshold in 2018. In mainland China in particular, the middle market experienced a significant contraction. Lots sold between ¥5 million and ¥10 million dropped by 48% in volume year-on-year; lots sold between ¥1 million and ¥5 million declined by 37% as well—both price brackets for Chinese Paintings and Calligraphy recorded the lowest number of works sold since 2011. This decline in confidence can be linked to a scandal uncovered in early 2018, as a network of forgers and dealers of counterfeit Chinese painting and calligraphy was arrested by Chinese police.
Global Chinese Art Auction Market Report 2018 31
In contrast, the Chinese Antiques and Artworks category remained relatively stable in 2018. The number of lots sold and sell-through rate experienced growth both in mainland China and overseas. Average price, however, declined in both regions, following the overall trend for Chinese art and antiques as price distribution shifted downwards.
Although much smaller in size than other collecting catego-ries, Chinese Books and Manuscripts have experienced a steady upward trend in sales in recent years. In mainland China, the sell-through rate grew in 2017 and 2018 even as the number of lots offered steadily increased.
The average price for Books and Manuscripts in mainland China also saw an 88% increase year-over-year, reaching $8,283, the highest since 2011. Overseas, the market experienced a spike in volume in 2013, thanks to the increasing global presence of Chinese collectors. In 2018, three Books and Manuscripts objects sold for over ¥100 million at auction, a threshold that has not included the collecting category since 2012.
32 Global Chinese Art Auction Market Report 2018
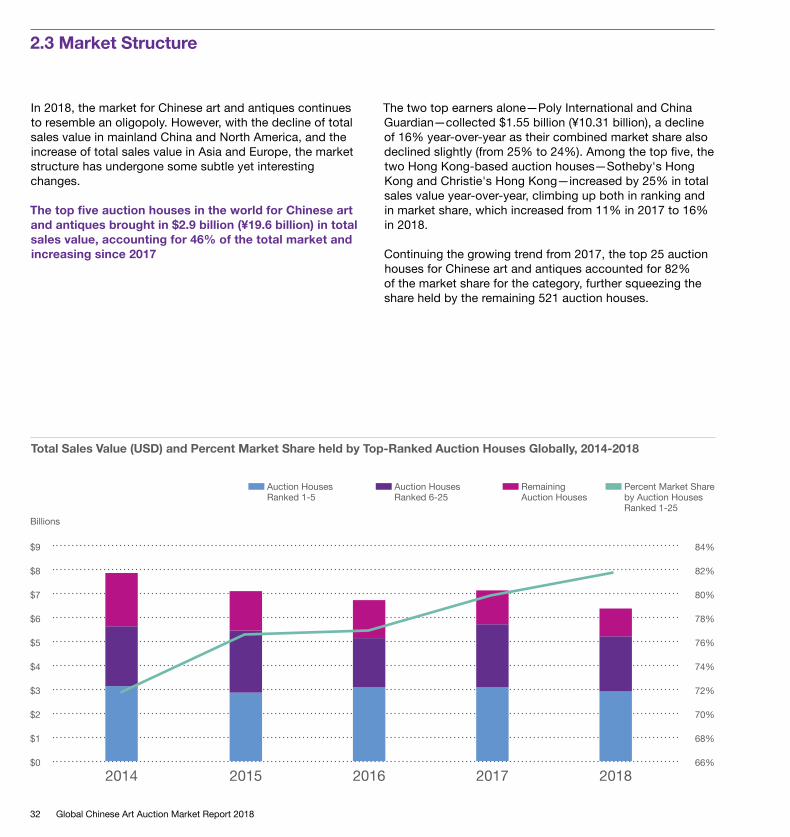
In 2018, the market for Chinese art and antiques continues to resemble an oligopoly. However, with the decline of total sales value in mainland China and North America, and the increase of total sales value in Asia and Europe, the market structure has undergone some subtle yet interesting changes.
The top five auction houses in the world for Chinese art and antiques brought in $2.9 billion (¥19.6 billion) in total sales value, accounting for 46% of the total market and increasing since 2017
The two top earners alone—Poly International and China Guardian—collected $1.55 billion (¥10.31 billion), a decline of 16% year-over-year as their combined market share also declined slightly (from 25% to 24%). Among the top five, the two Hong Kong-based auction houses—Sotheby's Hong Kong and Christie's Hong Kong—increased by 25% in total sales value year-over-year, climbing up both in ranking and in market share, which increased from 11% in 2017 to 16% in 2018.
Continuing the growing trend from 2017, the top 25 auction houses for Chinese art and antiques accounted for 82% of the market share for the category, further squeezing the share held by the remaining 521 auction houses.
2.3 Market Structure
20152014 2016 2017 201866%
68%
70%
72%
74%
76%
78%
80%
82%
84%
Total Sales Value (USD) and Percent Market Share held by Top-Ranked Auction Houses Globally, 2014-2018
Remaining Auction Houses
Percent Market Share by Auction Houses Ranked 1-25
Auction Houses Ranked 6-25
Auction Houses Ranked 1-5
$0
$1
$2
$3
$4
$5
$6
$7
$8
$9
Billions
Sector Breakdown and Price Distribution 33
$0
$0.5
$1
$1.5
$2
$2.5
$3
$1
$0
$2
$3
$4
$5
$6
74%76%78%
82%80%
84%86%88%90%
50%
55%
60%
65%
70%
75%
80%
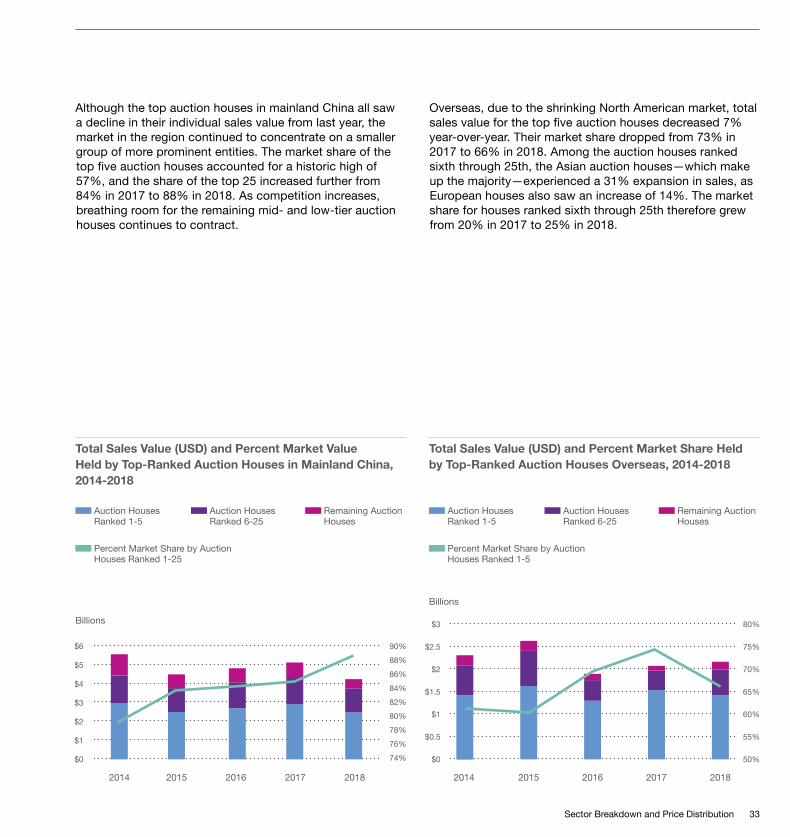
Although the top auction houses in mainland China all saw a decline in their individual sales value from last year, the market in the region continued to concentrate on a smaller group of more prominent entities. The market share of the top five auction houses accounted for a historic high of 57%, and the share of the top 25 increased further from 84% in 2017 to 88% in 2018. As competition increases, breathing room for the remaining mid- and low-tier auction houses continues to contract.
Overseas, due to the shrinking North American market, total sales value for the top five auction houses decreased 7% year-over-year. Their market share dropped from 73% in 2017 to 66% in 2018. Among the auction houses ranked sixth through 25th, the Asian auction houses—which make up the majority—experienced a 31% expansion in sales, as European houses also saw an increase of 14%. The market share for houses ranked sixth through 25th therefore grew from 20% in 2017 to 25% in 2018.
2015 2016 2017 20182014
Total Sales Value (USD) and Percent Market Share Held by Top-Ranked Auction Houses Overseas, 2014-2018
Auction Houses Ranked 6-25
Remaining Auction Houses
Auction Houses Ranked 1-5
Percent Market Share by Auction Houses Ranked 1-5
2014 2015 2016 2017 2018
Billions
Billions
Total Sales Value (USD) and Percent Market Value Held by Top-Ranked Auction Houses in Mainland China, 2014-2018
Auction Houses Ranked 6-25
Remaining Auction Houses
Auction Houses Ranked 1-5
Percent Market Share by Auction Houses Ranked 1-25
34 Global Chinese Art Auction Market Report 2018
Appendices
34 Global Chinese Art Auction Market Report 2018
Appendices 35
# Region Auction House Lots Offered
Lots Sold
Sell-Through Rate (%)
Price Realized (RMB, Premium)
Price Realized (USD, Premium)
1 Beijing and Tianjin Region
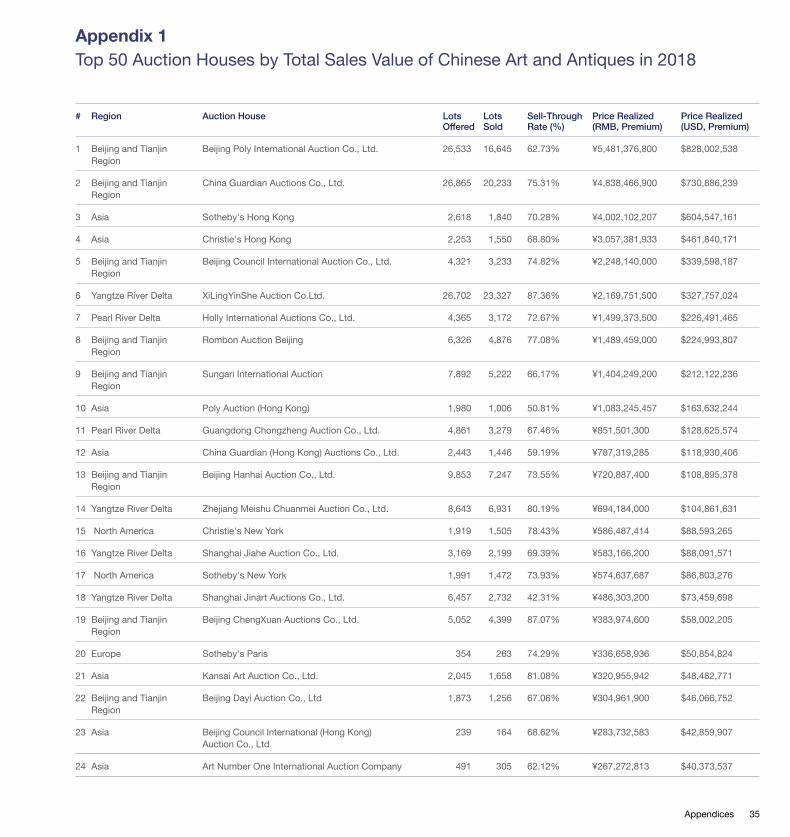
Beijing Poly International Auction Co., Ltd. 26,533 16,645 62.73% ¥5,481,376,800 $828,002,538
2 Beijing and Tianjin Region
China Guardian Auctions Co., Ltd. 26,865 20,233 75.31% ¥4,838,466,900 $730,886,239
3 Asia Sotheby's Hong Kong 2,618 1,840 70.28% ¥4,002,102,207 $604,547,161
4 Asia Christie's Hong Kong 2,253 1,550 68.80% ¥3,057,381,933 $461,840,171
5 Beijing and Tianjin Region
Beijing Council International Auction Co., Ltd. 4,321 3,233 74.82% ¥2,248,140,000 $339,598,187
6 Yangtze River Delta XiLingYinShe Auction Co.Ltd. 26,702 23,327 87.36% ¥2,169,751,500 $327,757,024
7 Pearl River Delta Holly International Auctions Co., Ltd. 4,365 3,172 72.67% ¥1,499,373,500 $226,491,465
8 Beijing and Tianjin Region
Rombon Auction Beijing 6,326 4,876 77.08% ¥1,489,459,000 $224,993,807
9 Beijing and Tianjin Region
Sungari International Auction 7,892 5,222 66.17% ¥1,404,249,200 $212,122,236
10 Asia Poly Auction (Hong Kong) 1,980 1,006 50.81% ¥1,083,245,457 $163,632,244
11 Pearl River Delta Guangdong Chongzheng Auction Co., Ltd. 4,861 3,279 67.46% ¥851,501,300 $128,625,574
12 Asia China Guardian (Hong Kong) Auctions Co., Ltd. 2,443 1,446 59.19% ¥787,319,285 $118,930,406
13 Beijing and Tianjin Region
Beijing Hanhai Auction Co., Ltd. 9,853 7,247 73.55% ¥720,887,400 $108,895,378
14 Yangtze River Delta Zhejiang Meishu Chuanmei Auction Co., Ltd. 8,643 6,931 80.19% ¥694,184,000 $104,861,631
15 North America Christie's New York 1,919 1,505 78.43% ¥586,487,414 $88,593,265
16 Yangtze River Delta Shanghai Jiahe Auction Co., Ltd. 3,169 2,199 69.39% ¥583,166,200 $88,091,571
17 North America Sotheby's New York 1,991 1,472 73.93% ¥574,637,687 $86,803,276
18 Yangtze River Delta Shanghai Jinart Auctions Co., Ltd. 6,457 2,732 42.31% ¥486,303,200 $73,459,698
19 Beijing and Tianjin Region
Beijing ChengXuan Auctions Co., Ltd. 5,052 4,399 87.07% ¥383,974,600 $58,002,205
20 Europe Sotheby's Paris 354 263 74.29% ¥336,658,936 $50,854,824
21 Asia Kansai Art Auction Co., Ltd. 2,045 1,658 81.08% ¥320,955,942 $48,482,771
22 Beijing and Tianjin Region
Beijing Dayi Auction Co., Ltd 1,873 1,256 67.06% ¥304,961,900 $46,066,752
23 Asia Beijing Council International (Hong Kong) Auction Co., Ltd
239 164 68.62% ¥283,732,583 $42,859,907
24 Asia Art Number One International Auction Company 491 305 62.12% ¥267,272,813 $40,373,537
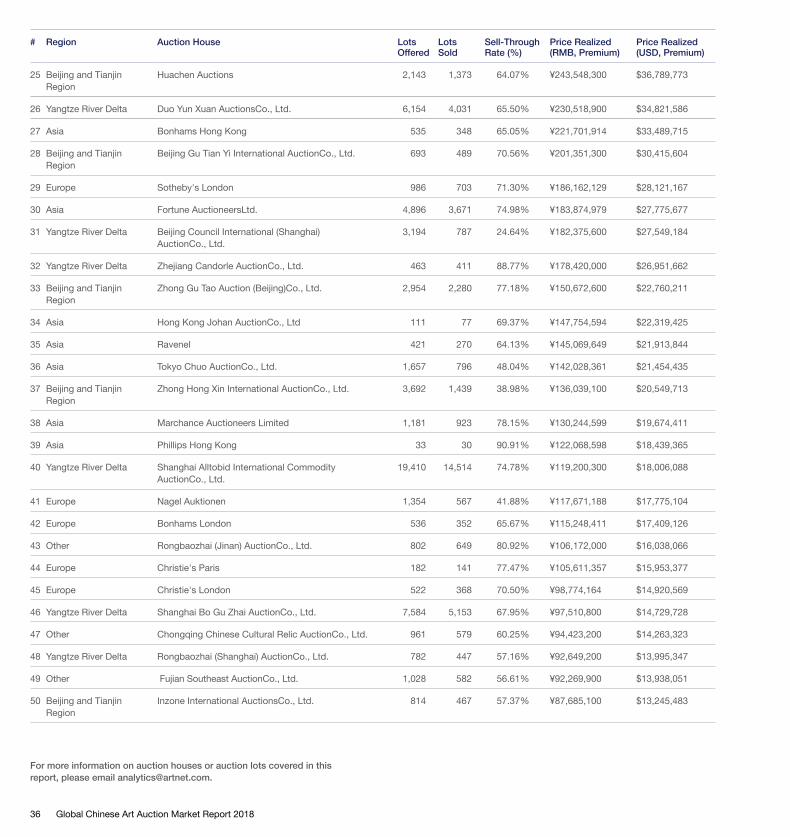
Appendix 1 Top 50 Auction Houses by Total Sales Value of Chinese Art and Antiques in 2018
36 Global Chinese Art Auction Market Report 2018
# Region Auction House Lots Offered
Lots Sold
Sell-Through Rate (%)
Price Realized (RMB, Premium)
Price Realized (USD, Premium)
25 Beijing and Tianjin Region
Huachen Auctions 2,143 1,373 64.07% ¥243,548,300 $36,789,773
26 Yangtze River Delta Duo Yun Xuan AuctionsCo., Ltd. 6,154 4,031 65.50% ¥230,518,900 $34,821,586
27 Asia Bonhams Hong Kong 535 348 65.05% ¥221,701,914 $33,489,715
28 Beijing and Tianjin Region
Beijing Gu Tian Yi International AuctionCo., Ltd. 693 489 70.56% ¥201,351,300 $30,415,604
29 Europe Sotheby's London 986 703 71.30% ¥186,162,129 $28,121,167
30 Asia Fortune AuctioneersLtd. 4,896 3,671 74.98% ¥183,874,979 $27,775,677
31 Yangtze River Delta Beijing Council International (Shanghai) AuctionCo., Ltd.
3,194 787 24.64% ¥182,375,600 $27,549,184
32 Yangtze River Delta Zhejiang Candorle AuctionCo., Ltd. 463 411 88.77% ¥178,420,000 $26,951,662
33 Beijing and Tianjin Region
Zhong Gu Tao Auction (Beijing)Co., Ltd. 2,954 2,280 77.18% ¥150,672,600 $22,760,211
34 Asia Hong Kong Johan AuctionCo., Ltd 111 77 69.37% ¥147,754,594 $22,319,425
35 Asia Ravenel 421 270 64.13% ¥145,069,649 $21,913,844
36 Asia Tokyo Chuo AuctionCo., Ltd. 1,657 796 48.04% ¥142,028,361 $21,454,435
37 Beijing and Tianjin Region
Zhong Hong Xin International AuctionCo., Ltd. 3,692 1,439 38.98% ¥136,039,100 $20,549,713
38 Asia Marchance Auctioneers Limited 1,181 923 78.15% ¥130,244,599 $19,674,411
39 Asia Phillips Hong Kong 33 30 90.91% ¥122,068,598 $18,439,365
40 Yangtze River Delta Shanghai Alltobid International Commodity AuctionCo., Ltd.
19,410 14,514 74.78% ¥119,200,300 $18,006,088
41 Europe Nagel Auktionen 1,354 567 41.88% ¥117,671,188 $17,775,104
42 Europe Bonhams London 536 352 65.67% ¥115,248,411 $17,409,126
43 Other Rongbaozhai (Jinan) AuctionCo., Ltd. 802 649 80.92% ¥106,172,000 $16,038,066
44 Europe Christie's Paris 182 141 77.47% ¥105,611,357 $15,953,377
45 Europe Christie's London 522 368 70.50% ¥98,774,164 $14,920,569
46 Yangtze River Delta Shanghai Bo Gu Zhai AuctionCo., Ltd. 7,584 5,153 67.95% ¥97,510,800 $14,729,728
47 Other Chongqing Chinese Cultural Relic AuctionCo., Ltd. 961 579 60.25% ¥94,423,200 $14,263,323
48 Yangtze River Delta Rongbaozhai (Shanghai) AuctionCo., Ltd. 782 447 57.16% ¥92,649,200 $13,995,347
49 Other Fujian Southeast AuctionCo., Ltd. 1,028 582 56.61% ¥92,269,900 $13,938,051
50 Beijing and Tianjin Region
Inzone International AuctionsCo., Ltd. 814 467 57.37% ¥87,685,100 $13,245,483
For more information on auction houses or auction lots covered in this report, please email [email protected].
Appendices 37
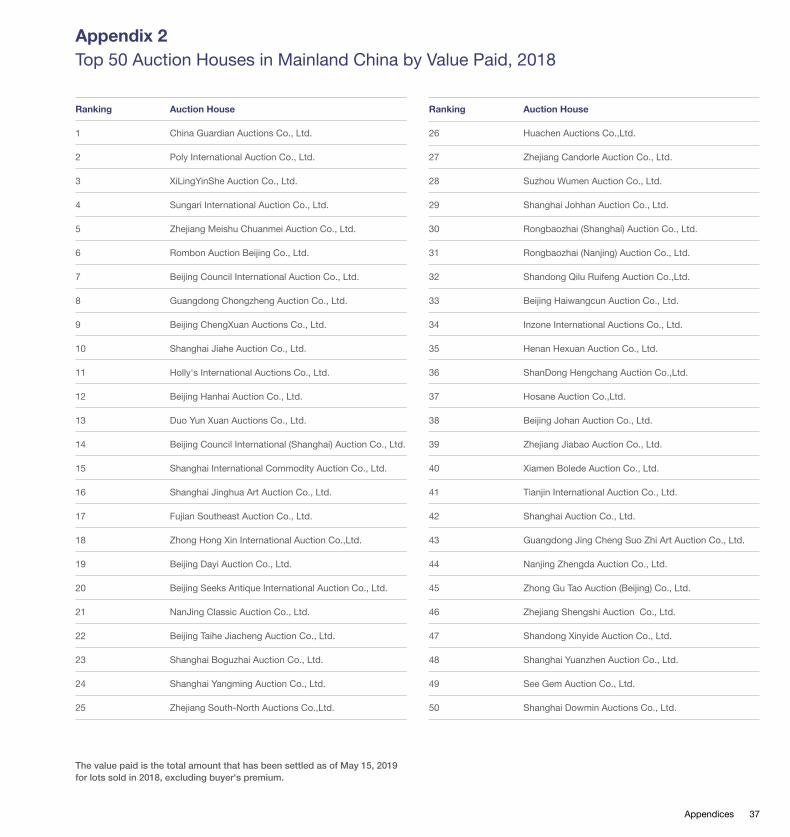
Appendix 2 Top 50 Auction Houses in Mainland China by Value Paid, 2018
Ranking Auction House
26 Huachen Auctions Co.,Ltd.
27 Zhejiang Candorle Auction Co., Ltd.
28 Suzhou Wumen Auction Co., Ltd.
29 Shanghai Johhan Auction Co., Ltd.
30 Rongbaozhai (Shanghai) Auction Co., Ltd.
31 Rongbaozhai (Nanjing) Auction Co., Ltd.
32 Shandong Qilu Ruifeng Auction Co.,Ltd.
33 Beijing Haiwangcun Auction Co., Ltd.
34 Inzone International Auctions Co., Ltd.
35 Henan Hexuan Auction Co., Ltd.
36 ShanDong Hengchang Auction Co.,Ltd.
37 Hosane Auction Co.,Ltd.
38 Beijing Johan Auction Co., Ltd.
39 Zhejiang Jiabao Auction Co., Ltd.
40 Xiamen Bolede Auction Co., Ltd.
41 Tianjin International Auction Co., Ltd.
42 Shanghai Auction Co., Ltd.
43 Guangdong Jing Cheng Suo Zhi Art Auction Co., Ltd.
44 Nanjing Zhengda Auction Co., Ltd.
45 Zhong Gu Tao Auction (Beijing) Co., Ltd.
46 Zhejiang Shengshi Auction Co., Ltd.
47 Shandong Xinyide Auction Co., Ltd.
48 Shanghai Yuanzhen Auction Co., Ltd.
49 See Gem Auction Co., Ltd.
50 Shanghai Dowmin Auctions Co., Ltd.
The value paid is the total amount that has been settled as of May 15, 2019 for lots sold in 2018, excluding buyer's premium.
Ranking Auction House
1 China Guardian Auctions Co., Ltd.
2 Poly International Auction Co., Ltd.
3 XiLingYinShe Auction Co., Ltd.
4 Sungari International Auction Co., Ltd.
5 Zhejiang Meishu Chuanmei Auction Co., Ltd.
6 Rombon Auction Beijing Co., Ltd.
7 Beijing Council International Auction Co., Ltd.
8 Guangdong Chongzheng Auction Co., Ltd.
9 Beijing ChengXuan Auctions Co., Ltd.
10 Shanghai Jiahe Auction Co., Ltd.
11 Holly's International Auctions Co., Ltd.
12 Beijing Hanhai Auction Co., Ltd.
13 Duo Yun Xuan Auctions Co., Ltd.
14 Beijing Council International (Shanghai) Auction Co., Ltd.
15 Shanghai International Commodity Auction Co., Ltd.
16 Shanghai Jinghua Art Auction Co., Ltd.
17 Fujian Southeast Auction Co., Ltd.
18 Zhong Hong Xin International Auction Co.,Ltd.
19 Beijing Dayi Auction Co., Ltd.
20 Beijing Seeks Antique International Auction Co., Ltd.
21 NanJing Classic Auction Co., Ltd.
22 Beijing Taihe Jiacheng Auction Co., Ltd.
23 Shanghai Boguzhai Auction Co., Ltd.
24 Shanghai Yangming Auction Co., Ltd.
25 Zhejiang South-North Auctions Co.,Ltd.
38 Global Chinese Art Auction Market Report 2018
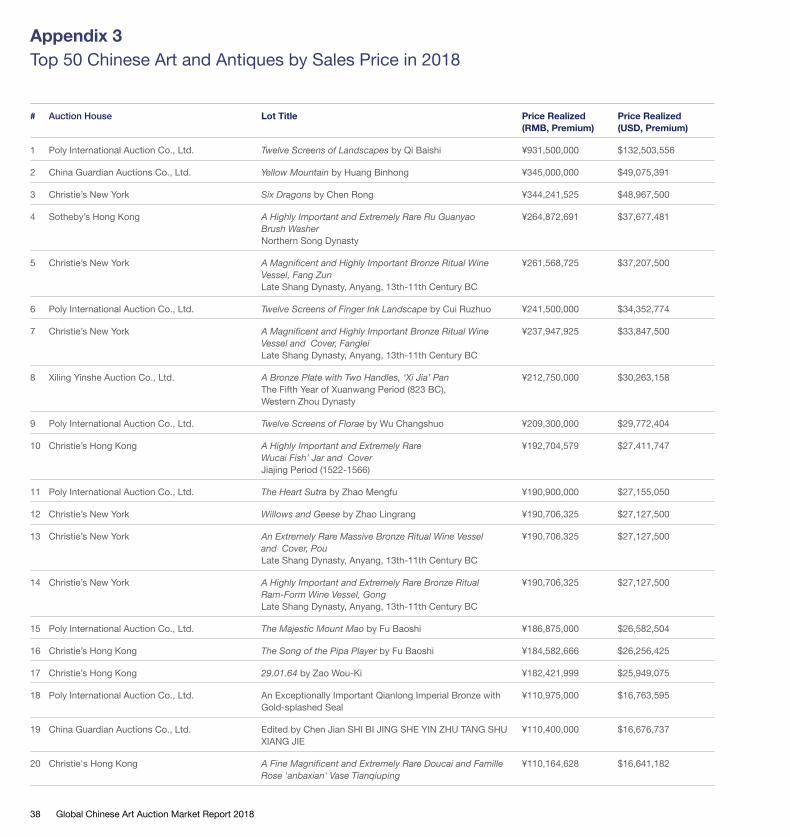
Appendix 3 Top 50 Chinese Art and Antiques by Sales Price in 2018
# Auction House Lot Title Price Realized (RMB, Premium)
Price Realized (USD, Premium)
1 Poly International Auction Co., Ltd. Twelve Screens of Landscapes by Qi Baishi ¥931,500,000 $132,503,556
2 China Guardian Auctions Co., Ltd. Yellow Mountain by Huang Binhong ¥345,000,000 $49,075,391
3 Christie’s New York Six Dragons by Chen Rong ¥344,241,525 $48,967,500
4 Sotheby’s Hong Kong A Highly Important and Extremely Rare Ru Guanyao Brush Washer Northern Song Dynasty
¥264,872,691 $37,677,481
5 Christie’s New York A Magnificent and Highly Important Bronze Ritual Wine Vessel, Fang Zun Late Shang Dynasty, Anyang, 13th-11th Century BC
¥261,568,725 $37,207,500
6 Poly International Auction Co., Ltd. Twelve Screens of Finger Ink Landscape by Cui Ruzhuo ¥241,500,000 $34,352,774
7 Christie’s New York A Magnificent and Highly Important Bronze Ritual Wine Vessel and Cover, Fanglei Late Shang Dynasty, Anyang, 13th-11th Century BC
¥237,947,925 $33,847,500
8 Xiling Yinshe Auction Co., Ltd. A Bronze Plate with Two Handles, ‘Xi Jia’ Pan The Fifth Year of Xuanwang Period (823 BC), Western Zhou Dynasty
¥212,750,000 $30,263,158
9 Poly International Auction Co., Ltd. Twelve Screens of Florae by Wu Changshuo ¥209,300,000 $29,772,404
10 Christie’s Hong Kong A Highly Important and Extremely Rare Wucai Fish’ Jar and Cover Jiajing Period (1522-1566)
¥192,704,579 $27,411,747
11 Poly International Auction Co., Ltd. The Heart Sutra by Zhao Mengfu ¥190,900,000 $27,155,050
12 Christie’s New York Willows and Geese by Zhao Lingrang ¥190,706,325 $27,127,500
13 Christie’s New York An Extremely Rare Massive Bronze Ritual Wine Vessel and Cover, Pou Late Shang Dynasty, Anyang, 13th-11th Century BC
¥190,706,325 $27,127,500
14 Christie’s New York A Highly Important and Extremely Rare Bronze Ritual Ram-Form Wine Vessel, Gong Late Shang Dynasty, Anyang, 13th-11th Century BC
¥190,706,325 $27,127,500
15 Poly International Auction Co., Ltd. The Majestic Mount Mao by Fu Baoshi ¥186,875,000 $26,582,504
16 Christie’s Hong Kong The Song of the Pipa Player by Fu Baoshi ¥184,582,666 $26,256,425
17 Christie’s Hong Kong 29.01.64 by Zao Wou-Ki ¥182,421,999 $25,949,075
18 Poly International Auction Co., Ltd. An Exceptionally Important Qianlong Imperial Bronze with Gold-splashed Seal
¥110,975,000 $16,763,595
19 China Guardian Auctions Co., Ltd. Edited by Chen Jian SHI BI JING SHE YIN ZHU TANG SHU XIANG JIE
¥110,400,000 $16,676,737
20 Christie's Hong Kong A Fine Magnificent and Extremely Rare Doucai and Famille Rose 'anbaxian' Vase Tianqiuping
¥110,164,628 $16,641,182
Appendices 39
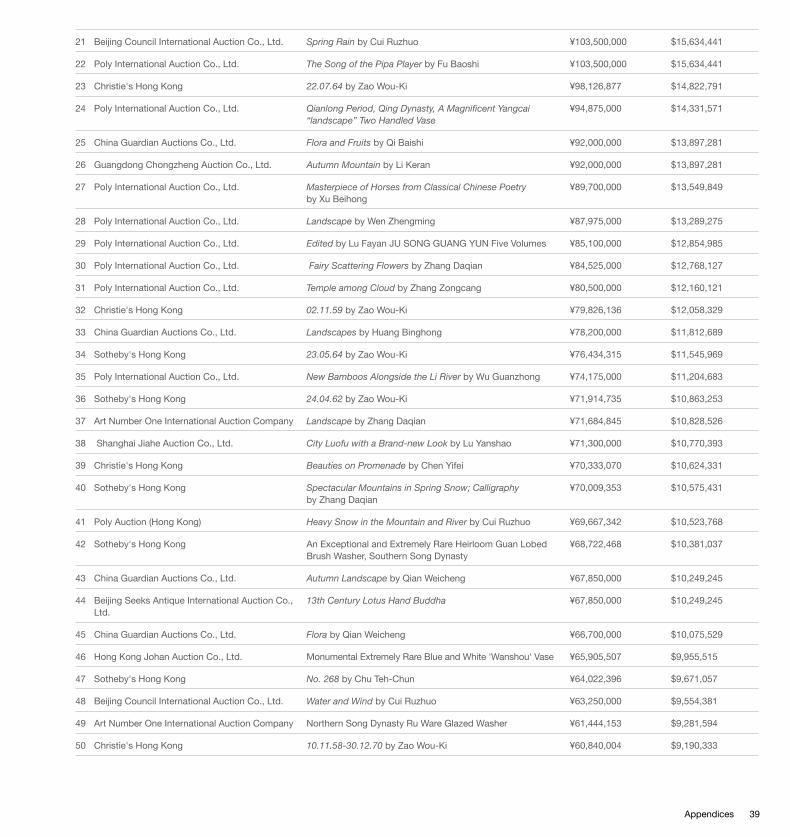
21 Beijing Council International Auction Co., Ltd. Spring Rain by Cui Ruzhuo ¥103,500,000 $15,634,441
22 Poly International Auction Co., Ltd. The Song of the Pipa Player by Fu Baoshi ¥103,500,000 $15,634,441
23 Christie's Hong Kong 22.07.64 by Zao Wou-Ki ¥98,126,877 $14,822,791
24 Poly International Auction Co., Ltd. Qianlong Period, Qing Dynasty, A Magnificent Yangcai “landscape” Two Handled Vase
¥94,875,000 $14,331,571
25 China Guardian Auctions Co., Ltd. Flora and Fruits by Qi Baishi ¥92,000,000 $13,897,281
26 Guangdong Chongzheng Auction Co., Ltd. Autumn Mountain by Li Keran ¥92,000,000 $13,897,281
27 Poly International Auction Co., Ltd. Masterpiece of Horses from Classical Chinese Poetry by Xu Beihong
¥89,700,000 $13,549,849
28 Poly International Auction Co., Ltd. Landscape by Wen Zhengming ¥87,975,000 $13,289,275
29 Poly International Auction Co., Ltd. Edited by Lu Fayan JU SONG GUANG YUN Five Volumes ¥85,100,000 $12,854,985
30 Poly International Auction Co., Ltd. Fairy Scattering Flowers by Zhang Daqian ¥84,525,000 $12,768,127
31 Poly International Auction Co., Ltd. Temple among Cloud by Zhang Zongcang ¥80,500,000 $12,160,121
32 Christie's Hong Kong 02.11.59 by Zao Wou-Ki ¥79,826,136 $12,058,329
33 China Guardian Auctions Co., Ltd. Landscapes by Huang Binghong ¥78,200,000 $11,812,689
34 Sotheby's Hong Kong 23.05.64 by Zao Wou-Ki ¥76,434,315 $11,545,969
35 Poly International Auction Co., Ltd. New Bamboos Alongside the Li River by Wu Guanzhong ¥74,175,000 $11,204,683
36 Sotheby's Hong Kong 24.04.62 by Zao Wou-Ki ¥71,914,735 $10,863,253
37 Art Number One International Auction Company Landscape by Zhang Daqian ¥71,684,845 $10,828,526
38 Shanghai Jiahe Auction Co., Ltd. City Luofu with a Brand-new Look by Lu Yanshao ¥71,300,000 $10,770,393
39 Christie's Hong Kong Beauties on Promenade by Chen Yifei ¥70,333,070 $10,624,331
40 Sotheby's Hong Kong Spectacular Mountains in Spring Snow; Calligraphy by Zhang Daqian
¥70,009,353 $10,575,431
41 Poly Auction (Hong Kong) Heavy Snow in the Mountain and River by Cui Ruzhuo ¥69,667,342 $10,523,768
42 Sotheby's Hong Kong An Exceptional and Extremely Rare Heirloom Guan Lobed Brush Washer, Southern Song Dynasty
¥68,722,468 $10,381,037
43 China Guardian Auctions Co., Ltd. Autumn Landscape by Qian Weicheng ¥67,850,000 $10,249,245
44 Beijing Seeks Antique International Auction Co., Ltd.
13th Century Lotus Hand Buddha ¥67,850,000 $10,249,245
45 China Guardian Auctions Co., Ltd. Flora by Qian Weicheng ¥66,700,000 $10,075,529
46 Hong Kong Johan Auction Co., Ltd. Monumental Extremely Rare Blue and White 'Wanshou' Vase ¥65,905,507 $9,955,515
47 Sotheby's Hong Kong No. 268 by Chu Teh-Chun ¥64,022,396 $9,671,057
48 Beijing Council International Auction Co., Ltd. Water and Wind by Cui Ruzhuo ¥63,250,000 $9,554,381
49 Art Number One International Auction Company Northern Song Dynasty Ru Ware Glazed Washer ¥61,444,153 $9,281,594
50 Christie's Hong Kong 10.11.58-30.12.70 by Zao Wou-Ki ¥60,840,004 $9,190,333

40 Global Chinese Art Auction Market Report 2018
Notes
40 Global Chinese Art Auction Market Report 2018
Notes 41
Mainland China Data
In this report, all data on works sold in mainland China were collected directly from auction houses by the China Association of Auctioneers (CAA). Data submission requests were sent out on April 22, 2019, to all mainland Chinese auction houses, who then submitted their auction data through CAA’s official website between May 1 and 15, 2019. The CAA then verified all data to ensure thoroughness and accuracy.
Data submission requests were sent to all main-land Chinese auction houses that were licensed to sell art and cultural relics in mainland China as of December 31, 2018. Of those, 345 auction houses submitted their auction data on time.
Payment status and the total value of commissions earned by mainland Chinese auction houses were reported as of May 15, 2019.
The categories of works sold in mainland China include
· Chinese Antiques and Artworks: porcelain (cultural relics), jade, bamboo, wood, ivory and horncarvings, metalware, lacquer, textiles, furniture, teaware, etc.
· Fine Chinese Paintings and Calligraphy: Classical, Modern, and contemporary Chinese paintings in the traditional style.
· 20th-Century and Contemporary Chinese Art: 20th- and 21st-century paintings, sculpture, installations, photographs, etc.
· Chinese Books and Manuscripts: ancient books, manuscripts, calligraphy inscriptions, etc.
· Other: stamps, coins, contemporary jewelry, jadeite, watches, wine, tea, contemporary craft and design objects, etc.
· For more details about the auction market in mainland China, please refer to the 2018 China Antiques and Artworks Auction Market Statistical Annual Report published by CAA.
42 Global Chinese Art Auction Market Report 2018
Overseas Data
The categories of works sold overseas include:
· Chinese Antiques and Artworks: porcelain, jade, bamboo, wood, ivory and horn carvings, metal ware, lacquer, textiles, furniture, teaware, etc.
· Fine Chinese Paintings and Calligraphy: Classi cal, Modern, and contemporary Chinese paint ings in the traditional style.
· 20th-Century and Contemporary Chinese Art: paintings, sculpture, installations, photographs, etc. · Chinese Books and Manuscripts: ancient books, manuscripts, calligraphy inscriptions, etc. · Other: 20th- and 21st-century design objects.
In this report, all data on works sold overseas were compiled from the artnet Price Database Fine Art and Design and the artnet Price Database Decora-tive Art. The Price Database includes over 13 million auction results from more than 1,800 international auction houses dating back to 1985. This report includes data from all 285 auction houses outside of mainland China that sold Chinese art and antiques in 2018.
Sales occurring in Hong Kong and Taiwan fall within the overseas section of this report.
Lots offered at auction with a low estimate under 500 USD are omitted from the overseas data.
Notes 43
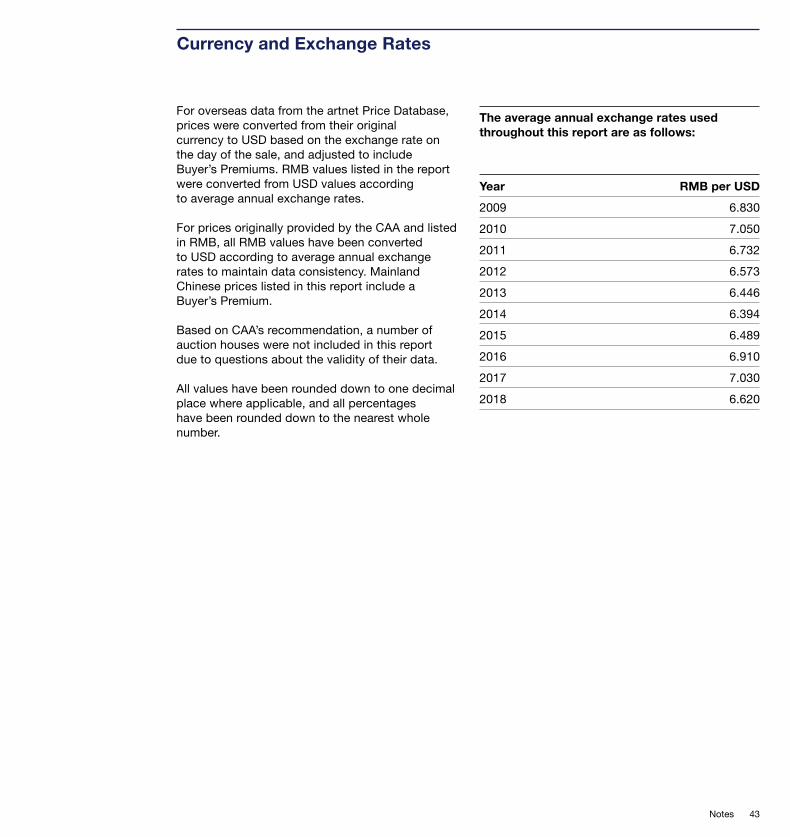
Currency and Exchange Rates
Year RMB per USD2009 6.8302010 7.0502011 6.7322012 6.5732013 6.4462014 6.3942015 6.4892016 6.9102017 7.0302018 6.620
The average annual exchange rates used throughout this report are as follows:
For overseas data from the artnet Price Database, prices were converted from their original currency to USD based on the exchange rate on the day of the sale, and adjusted to include Buyer’s Premiums. RMB values listed in the report were converted from USD values according to average annual exchange rates.
For prices originally provided by the CAA and listed in RMB, all RMB values have been converted to USD according to average annual exchange rates to maintain data consistency. Mainland Chinese prices listed in this report include a Buyer’s Premium.
Based on CAA’s recommendation, a number of auction houses were not included in this report due to questions about the validity of their data.
All values have been rounded down to one decimal place where applicable, and all percentages have been rounded down to the nearest whole number.
44 Global Chinese Art Auction Market Report 2018
Contact
44 Global Chinese Art Auction Market Report 2018
Contact 45
Artnet Worldwide Corporation 233 Broadway, 26th Floor New York, NY 10279 USA T +1-212-497-9700 F +1-212-497-9707 [email protected] www.artnet.com For Inquiries About the Report Ning Lu [email protected]
For Press Inquiries Annie Wang [email protected]
For Advertising and artnet Product Inquiries Jay [email protected]
To Consign on artnet Auctions Colleen Cash [email protected]
China Association of Auctioneers Beichen Huiyuan Mansion, H Section 25, Floor A, Suite 2511, Beichen Dong Road, No.8 Yard Chaoyang District, Beijing, 100834China T +86 10 64931499 ext. 8009 F +86 10 64931030
[email protected] www.caa123.org.cn For Inquiries About the Report Yu Jinsheng [email protected]
For Press Inquiries Pang Lifang [email protected]
For Online Auctions Liu Yan [email protected]
For International Communication Liu Cong [email protected]
46 Global Chinese Art Auction Market Report 2018
Global Chinese Art Auction Market Report 2018 ©2019 Artnet Worldwide Corporation. ©2019 China Association of Auctioneers. All rights reserved. The information included in this report, written or oral, from artnet® or the CAA, their officers, or representatives, is not an appraisal, opinion, or legal, tax, accounting, investment, or other expert advice. The report is based on auction sales data that has been consolidated and aggregated, allowing users to visualize specific market trends. artnet® and the CAA do not guarantee this report will be entirely free from errors. artnet® and the CAA decline all responsibility for any loss or damage whatsoever resulting from omissions or inaccuracies in the report regardless of how it was caused. artnet® is a registered trademark of Artnet Worldwide Corporation, and the trademarks, service marks, logos, patents, and design trademarks owned by Artnet Worldwide Corporation cannot be used without its prior written consent by any party. It is unlawful to duplicate or distribute the information contained in the report without the prior written consent of artnet® and the CAA. artnet- and the CAA decline all responsibility for any and all claims, actions, demands, legal proceedings, losses, damages, liabilities, and costs and expenses (including, but not limited to, legal fees) arising from the misuse of any content contained in this report.
AuthorsNing Lu, AuthorMichaela Ben Yehuda, AuthorYu Jinsheng, Consultant
PublishersArtnet Worldwide Corporation China Association of Auctioneers
Copy EditorTatiana Berg
Design Schober Design