Embed Size (px)
Citation preview
Global energy interconnection
®
White Paper
IEC
WP
GEI:2
016-
10(e
n)
3
Global energy interconnection (GEI) represents
the ultimate evolution of the trend towards greater
interconnection of power systems. It embodies
high-level integration of the flow of energy, flow of
information and flow of business as an intelligent,
automated and networked-based system for
ensuring energy security on a universal scale.
Fueled by global economic growth, world energy
consumption rose from 5,4 billion tons of coal
equivalent in 1965 to 18,5 billion tons in 2014.
Fossil energy accounted for more than 85% of
the total. The world’s energy consumption will
maintain a growing trend in the future, as it is
difficult to reverse the long-established patterns of
intensive energy consumption.
Seeking a solution to these trends, the
implementation of GEI would integrate a large-
scale deployment of clean energy led by variable
renewables with a Smart Grid incorporating high
levels of interoperability and supported by a
ultra-high voltage (UHV) grid backbone including
extensive interconnections across countries,
continents, technical domains, hierarchies and
equipment life cycle phases.
Though such levels of deployment are highly
ambitious, the technologies themselves are
largely available or are currently in the pipeline.
The technical difficulties for large-scale,
transcontinental or global energy interconnection,
on the other hand, will come from the
unprecedented degree of system integration that
will be required. To help surmount this challenge,
consensus-based International Standards and
Specifications will form an indispensable basis
on which to build concrete solutions. Standards,
specifically those at the systems level, will facilitate
procurement and national and international
acceptance and will play a stabilizing role by
pursuing research activities on which real market
opportunities are built.
This White Paper examines the readiness of
potential markets for GEI, identifies the technical
and economic trends in related technologies and
evaluates at a high level the impact on energy,
environment, technologies and policies.
Taking the large-scale concepts connected with
GEI to actual realization will require significant
efforts in standardization – e.g. development of
initiatives to enable multi-system interoperability.
Thus this White Paper aims to highlight the
concept of GEI and begin laying the foundations
for identifying and addressing the standardization
needs for large-scale, transcontinental and global
energy interconnection.
Executive summary
4
Executive summary
Acknowledgments
This White Paper has been prepared by the
Global Energy Interconnection project team,
in the IEC Market Strategy Board (MSB), with
major contributions from the project partner, the
International Energy Agency (IEA) and the project
leader, State Grid Corporation of China (SGCC).
The project team met three times – in January
2016 (Beijing, China), March 2016 (Beijing, China)
and June 2016 (Paris, France). The project team is
listed below:
Dr. Yinbiao Shu, SGCC, IEC Vice President,
MSB Convenor, Project Director
Dr. Luis Munuera, IEA, Project Partner
Dr. Jun Yu, SGCC, Project Manager
Dr. Jianbin Fan, SGCC
Dr. Caihao Liang, CEPRI
Dr. Geng Dan, Climate Parliament of China
Dr. Wei Wang, SGCC
Dr. Xing Lu (Ms.), State Grid Energy Research
Institute (of China)
Mr. Richard Schomberg, EDF
Dr. Dongil Lee, KEPCO
Dr. Jae Young Yoon, KERI
Dr. Chan-Ki Kim, KEPCO
Dr. Ho-Keun Kim, KEPCO
Dr. Stefan Engelhardt, SAP SE
Dr. Alexander Rentschler, Siemens AG
Mr. Shinichi Suganuma, TEPCO
Mr. Chengwei Dai, China Datang Corporation
Mr. Yan Qin, China Datang Corporation
Dr. Hao Hu, SGCC
Mr. Peter Lanctot, IEC, MSB Secretary

5
List of abbreviations 7
Glossary 11
Section 1 Introduction 131.1 Scope 14
Section 2 A vision for GEI 152.1 Global energy challenges 15
2.1.1 Energy security 15
2.1.2 Climate change 16
2.1.3 Environmental pollution 17
2.2 The GEI concept 17
2.2.1 Why larger-scale interconnection? 17
2.2.2 What is GEI? 18
2.2.3 Potential benefits of GEI 19
2.2.4 GEI vision 20
Section 3 Energy trends and market readiness for GEI 213.1 Global energy resources and energy demands 21
3.1.1 Energy resources 21
3.1.2 Energy demand 24
3.2 Trends in cost reduction of key technologies for GEI 26
3.2.1 Market trends for wind power generation 27
3.2.2 Market trends for solar power generation 29
3.2.3 Market trends for other geographically-constrained RE technologies 32
3.3 Practical experiences of power system interconnection around the world 33
3.3.1 Experiences with large-scale national transmission interconnection 33
3.3.2 Practical experiences of regional interconnection 38
3.3.3 Transnational interconnection initiatives 46
3.4 Economic feasibility of GEI 48
Table of contents
6
Table of contents
Section 4 Enabling technologies for GEI 514.1 Transmission technologies 51
4.1.1 UHV transmission technologies 51
4.1.2 Flexible AC/DC transmission 53
4.1.3 Other emerging technologies 56
4.2 Smart Grid technologies 56
4.2.1 Large grid operation and control technologies 56
4.2.2 Information and communication technologies (ICT) 58
4.2.3 The need for an IT/OT integration platform 59
4.2.4 Advanced planning, operation and maintenance of the grid with Asset Intelligence Networks 62
4.2.5 Metering, billing and settlement of energy flows and related services 67
4.2.6 GEI market communication platform 67
Section 5 Standardization for GEI 695.1 Present situation 69
5.1.1 Transmission 69
5.1.2 Clean energy – renewable generation and energy storage 69
5.1.3 Smart Grids 70
5.2 Future standardization needs 70
5.2.1 Systems standards 71
5.2.2 Management standards 71
5.2.3 Standards for information exchange 72
5.2.4 Standards for new materials and equipment 72
Section 6 Conclusion and recommendations 736.1 Recommendations addressed to policy-makers and regulators 73
6.2 Recommendations addressed toward meeting industrial needs 74
6.3 Recommendations addressed to the IEC and its committees 74
Bibliography 77
7
AC alternating current
AC advisory committee (of the IEC)
AIN asset intelligence network
BI business intelligence
BOS balance of system
CBA cost-benefit analysis
COP conference of the parties
CRM customer relationship management
CSC current source converter
CSP concentrated solar power
DC direct current
DMS document management system
DNI direct normal irradiance
EAM environmental assessment and management
EDI electronic data interchange
EES electrical energy storage
EPC engineering, procurement and construction (company)
ERP enterprise resource planning
FACTS flexible AC transmission system
FCF frequency converter facility
FMEA failure mode and effects analysis
FTU field terminal unit
GDP gross domestic product
GEI global energy interconnection
GHG greenhouse gas
GIS geographical information system
HES head-end system
HTS high-temperature superconducting
List of abbreviations
Technical and scientific terms
8
List of abbreviations
HVAC high-voltage alternating current
HVDC high-voltage direct current
HWACT half-wavelength AC transmission
ICT information and communication technology
IEA-OES Ocean Energy Systems Technology Collaboration Programme of the IEA
IoT Internet of Things
IT information technology
LCC line-commutated converter
LCOE levelized cost of energy
MDM meter data management
MTDC multi-terminal direct current
OEM original equipment manufacturer
OLTP online transaction processing
OT operational technology
PMU phaser measurement unit
PV photovoltaic
RE renewable energy
SC subcommittee (of the IEC)
SCADA/EMS supervisory control and data acquisition/energy management system
SDO standards developing organization
STE solar thermal energy
SyC systems committee (of the IEC)
TC technical committee (of the IEC)
TSO transmission system operator
UHV ultra-high voltage
UHVAC ultra-high-voltag alternating current
UHVDC ultra-high-voltage direct current
VSC voltage source converter
WAMS wide area monitoring system
9
List of abbreviations
ASEAN Association of Southeast Asian Nations
ASG Asian Super Grid
ATSOI Association of the Transmission System Operators of Ireland
BALTSO Baltic Transmission System Operators
CEPRI China Electric Power Research Institute
CIGRE International council on large electric systems
COP21 21st Conference of the Parties, 2015 United Nations Climate Change Conference
CSPG China Southern Power Grid
EDF Electricité de France
ENTSO-E European Network of Transmission System Operators for Electricity
EPRI Electric Power Research Institute
ERCOT Electric Reliability Council of Texas
ETSO European Transmission System Operators
EU European Union
HAPUA Heads of ASEAN Power Utilities/Authorities
IEA International Energy Agency
IEC International Electrotechnical Commission
IPCC Intergovernmental Panel on Climate Change
IPS/UPS Integrated Power System/Unified Power System
ISO International Organization for Standardization
KEPCO Korea Electric Power Corporation
KERI Korea Electrotechnology Research Institute
MSB Market Strategy Board
NEC National Electrotechnical Committee
NERC Northern American Electric Reliability Corporation
NGET National Grid Electricity Transmission
OECD Organisation for Economic Co-operation and Development
SAPP Southern African Power Pool
SE4ALL United Nations Sustainable Energy for All initiative
SGCC State Grid Corporation of China
Organizations, institutions and companies

10
SMB Standardization Management Board (of the IEC)
TEPCO Tokyo Electric Power Company
TüV technischer Überwachungsverein (technical inspection association)
UCTE Union for the Coordination of the Transmission of Electricity
UKTSOA United Kingdom Transmission System Operators Association
UN United Nations
UNFCCC United Nations Framework Convention on Climate Change
List of abbreviations
11
Glossary
asset intelligence network
AIN
cloud-based hub that facilitates collaborative
asset management and allows companies take full
advantage of the Internet of Things (IoT)
back-to-back system
two independent neighbouring systems with
different and incompatible electrical parameters
(frequency/voltage level/short-circuit power level)
that are connected via a DC link
NOTE High-voltage direct current (HVDC) trans-
mission systems connect two separate high volt-
age AC systems via a DC link. The basic principle
of operation of an HVDC system is based on the
conversion of AC to DC and vice-versa by means
of converter valves, which are the heart of a con-
verter station.
balance of system
BOS
quantity encompassing all components of a
photovoltaic system other than the photovoltaic
panels
NOTE This includes wiring, switches, a mounting
system, one or many solar inverters, a battery
bank and battery charger.
conference of the parties
COP
governing body of an international convention
NOTE The most well-known United Nations
conference of the parties involves countries that
have ratified the UN Framework Convention on
Climate Change (UNFCCC) adopted in 1992 at
the Earth Summit in Rio de Janeiro, Brazil. The
2015 United Nations Climate Change Conference,
or COP21, was held in Paris, France, from
30 November to 12 December 2015. The
conference was the 21st such event to take place
since the signing of the UNFCCC, hence COP21.
exajoule
EJ
unit of energy equal to one quintillion (1018) joules
NOTE In describing national or global energy
budgets, it is common practice to use large-scale
units based upon the joule: 1 EJ = 1018 J. A joule
is the SI unit of work or energy equal to the work
done by a force of one newton when its point of
application moves one metre in the direction of
action of the force, equivalent to one 3 600th of a
watt-hour.
frequency converter facility
FCF
facility where an electronic or electromechanical
device converts alternating current of one
frequency to alternating current of another
frequency
global energy intensity
amount of energy used to produce a unit of gross
domestic product (GDP) at market exchange rates
levelized cost of energy
LCOE
measure of a power source which attempts
to compare different methods of electricity
generation on a comparable basis
12
Glossary
solar thermal energy
STE
form of energy and technology for harnessing solar
energy to generate thermal energy or electrical
energy
terawatt
TW
unit of power equal to one trillion (1012) watts
TüV
technischer Überwachungsverein (technical
inspection association)
German organization that works to validate the
safety of products of all kinds to protect humans
and the environment against hazards
UHV
ultra-high voltage
voltage above 800 kV
13
Section 1Introduction
Achieving a sustainable, secure and affordable
supply of energy has traditionally been the goal of
both national and international energy policies. At
the centre of achieving sustainability in the energy
system lies the challenge of climate change, a
factor recently brought to the fore by the Paris
accords. The rise of electricity as the key energy
carrier due to its high quality and versatility has
determined its current role as a central vehicle for
decarbonizing the supply of energy. Dramatic cost
reductions in renewable energy (RE), particularly
wind and solar, have made extensive deployment
of such energies attractive on a global scale, with
emphasis being placed on how to integrate these
resources widely. Reducing reliance on fossil fuels
by substituting low carbon electricity for the input
of energy end-uses that rely on them (e.g. through
electric vehicles in transport or electrification
of industrial processes), will only increase
overall demand for electricity. At the same time,
large portions of the global population remain
without access to electricity. Following a logical
progression in power systems, as generation and
demand continue to evolve in response to these
trends, power grids will become more and more
interconnected at the transnational and regional
levels. This is reflected in the recent introduction of
the concept of global energy interconnection (GEI).
GEI would represent the ultimate stage in the
evolution of power grids towards greater levels
of interconnectivity: a global energy network
of intercontinental and cross-border backbone
networks of high and ultra-high voltage (UHV),
as well as smart power grids (transmission
and distribution networks) in all interconnected
countries at various voltage levels. A GEI could
connect the power grids of all continents and
take advantage of the diversity of different time
zones and seasons, thus supporting a balanced
coordination of power supply for all interconnected
countries.
As one of the international organizations
participating in the United Nations Sustainable
Energy for All initiative (SE4ALL), the IEC and its
International Standards play a major role in meeting
fundamental energy challenges. IEC’s purpose
in issuing this White Paper is to highlight the
concept of GEI and begin laying the foundations
for identifying and addressing the standardization
needs of large-scale, transcontinental and global
energy interconnection.
The main objectives of this White Paper are as
follows:
§ To provide a high-level assessment of the
potential worldwide needs, benefits and
conditions of GEI
§ To examine the readiness of potential markets
for the technologies that would underpin GEI
§ To identify technical and economic trends in
related technologies
§ To evaluate at a high level the impact on
energy, environment, technologies, policies
and relevant Standards
§ To provide an outline of how standardization
could be conducted from a high level and
recommendations for different stakeholders to
participate in the standardization work
14
Introduction
1.1 Scope
This White Paper begins by assessing worldwide
industrial, commercial application needs and
energy resource allocation, development and
utilization, as well as the potential benefits in
light of the GEI concept, by collecting relevant
data from international organizations. Several
global transmission schemes are discussed and
analyzed by scenario comparison.
The White Paper then examines the readiness
of potential markets for GEI. Based on the
current status of equipment and technologies
from transmission system operators (TSOs) and
suppliers, it identifies the technical and business
trends (i.e. economic aspects) and challenges in
related areas, including clean energy, UHV, Smart
Grid, energy storage and grid control. The White
Paper also addresses the environmental impact
aspects of the concept, including carbon emission
reduction, footprint of transmission lines, etc.
Finally the White Paper discusses how GEI will
influence present energy system standards and
highlights the need for new standardization.
15
Section 2A vision for GEI
2.1 Global energy challenges
Global primary energy supply has grown ten-fold
in the last 100 years, and more than doubled in
the last 40 years. But for the first time in 2006,
developing countries (i.e. those not members
of the Organisation for Economic Co-operation
and Development (OECD)) accounted for a larger
share of energy use than developed economies;
in 2013 the ratio was 61:39. The shifting of the
traditional centres of energy demand to China,
India and South Asia are reflected in global trends:
China has accounted for the largest increase in
primary energy demand and CO2 emission over
the last decade, and yet the added pace of RE
deployment and drastic improvements in energy
intensity have reduced its annual growth in CO2
emissions to levels not seen before 2004, with
recent signs of decoupling. India alone has been
responsible for almost 10% of the increase in
global energy demand since 2000, while Indonesia
has seen the largest growth in coal use globally.
A combination of emissions caps, a reduction in
economic activity, and rapid growth in renewables
has drastically altered the energy landscape in
Europe. Developments in unconventional oil and
gas technology and exploitation are dramatically
changing energy prospects in the US and its status
as an energy importer. Moreover clean energy
added more capacity for the first time in 2014 than
all other power generation sources combined.
In spite of these developments, anthropogenic
energy-related global CO2 emissions reached
a record 31,6 gigatons CO2 (GtCO2) in 2012,
warming reached a 1 °C increase above pre-
industrial levels, and 1,3 billion people remain
without access to clean energy around the world.
The challenges facing the world in terms of
providing secure, affordable and clean energy are
greater than they have ever been, framed against
an array of pressures at an unprecedented scale
and a landscape of rapid technological change.
2.1.1 Energy security
Fueled by global economic growth, world energy
consumption rose from 5,4 billion tons of standard
coal in 1965 to 18,5 billion tons in 2014. Fossil
energy accounted for more than 85% of the total.
The world’s energy consumption will maintain
a growing trend in the future, as it is difficult to
reverse the long-established pattern of intensive
energy consumption.
Energy security can be understood as “the
uninterrupted availability of energy sources at
an affordable price”. Energy security has many
dimensions: long-term energy security mainly
involves timely investments to supply energy in
line with economic developments and sustainable
environmental needs. Short-term energy security
focuses on the ability of the energy system to react
promptly to sudden changes within the supply-
demand.
Concern related to physical unavailability of
supply is more prevalent in energy markets in
which networks and systems must be kept in
constant balance, such as electricity and, to some
extent, natural gas. This is particularly the case
in instances where capacity constraints exist or
where prices cannot function as an adjustment
mechanism to balance supply and demand in the
short term.
16
A vision for GEI
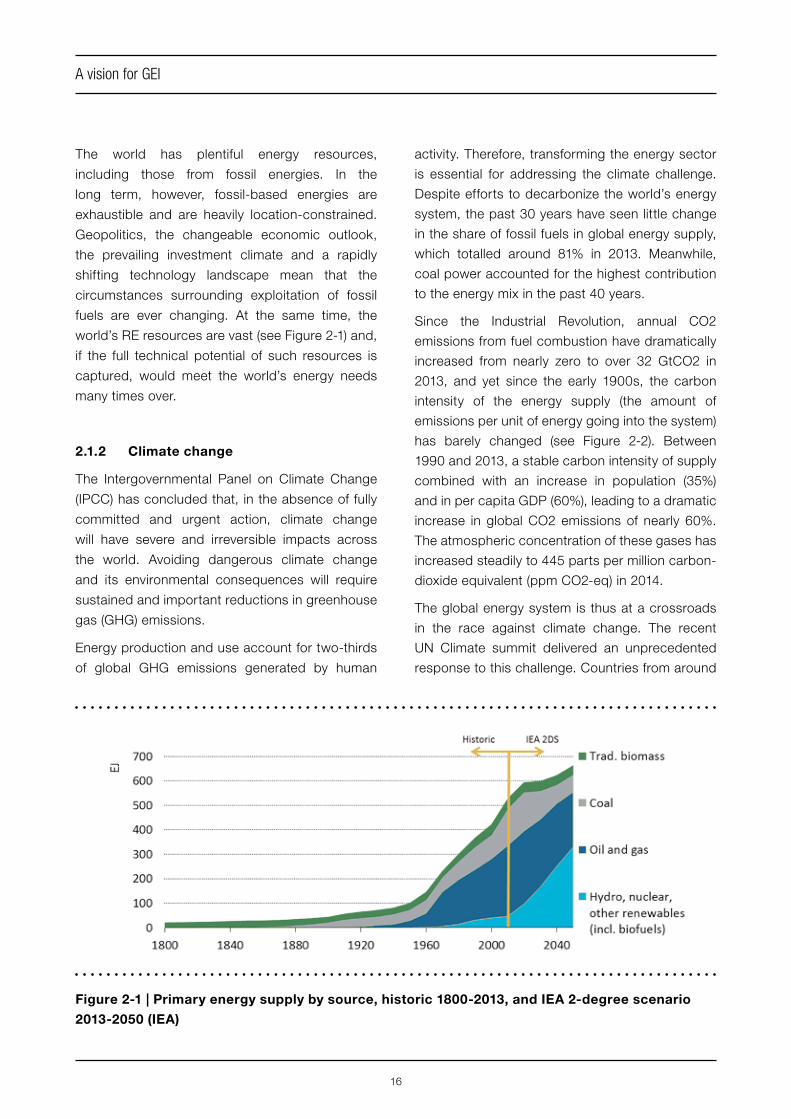
The world has plentiful energy resources,
including those from fossil energies. In the
long term, however, fossil-based energies are
exhaustible and are heavily location-constrained.
Geopolitics, the changeable economic outlook,
the prevailing investment climate and a rapidly
shifting technology landscape mean that the
circumstances surrounding exploitation of fossil
fuels are ever changing. At the same time, the
world’s RE resources are vast (see Figure 2-1) and,
if the full technical potential of such resources is
captured, would meet the world’s energy needs
many times over.
2.1.2 Climate change
The Intergovernmental Panel on Climate Change
(IPCC) has concluded that, in the absence of fully
committed and urgent action, climate change
will have severe and irreversible impacts across
the world. Avoiding dangerous climate change
and its environmental consequences will require
sustained and important reductions in greenhouse
gas (GHG) emissions.
Energy production and use account for two-thirds
of global GHG emissions generated by human
activity. Therefore, transforming the energy sector
is essential for addressing the climate challenge.
Despite efforts to decarbonize the world’s energy
system, the past 30 years have seen little change
in the share of fossil fuels in global energy supply,
which totalled around 81% in 2013. Meanwhile,
coal power accounted for the highest contribution
to the energy mix in the past 40 years.
Since the Industrial Revolution, annual CO2
emissions from fuel combustion have dramatically
increased from nearly zero to over 32 GtCO2 in
2013, and yet since the early 1900s, the carbon
intensity of the energy supply (the amount of
emissions per unit of energy going into the system)
has barely changed (see Figure 2-2). Between
1990 and 2013, a stable carbon intensity of supply
combined with an increase in population (35%)
and in per capita GDP (60%), leading to a dramatic
increase in global CO2 emissions of nearly 60%.
The atmospheric concentration of these gases has
increased steadily to 445 parts per million carbon-
dioxide equivalent (ppm CO2-eq) in 2014.
The global energy system is thus at a crossroads
in the race against climate change. The recent
UN Climate summit delivered an unprecedented
response to this challenge. Countries from around
Figure 2-1 | Primary energy supply by source, historic 1800-2013, and IEA 2-degree scenario
2013-2050 (IEA)

17
A vision for GEI
the world gathered in Paris for the 21st Conference
of the Parties (COP21) to negotiate an international
agreement and set a direction for combating
climate change within the next decade and beyond
– one that aims to reach global peaking of GHG
emissions as soon as possible, with an ambition
to limit the global average temperature rise to
well below 2 °C and pursue efforts to limit the
temperature increase to 1,5 °C. The international
commitment to keep the increase in long-term
average temperatures to within this target of
temperature rise relative to pre-industrial levels
will require substantial and sustained reductions in
global emissions.
GHG remain in the atmosphere for many
years – what matters for climate change is the
concentration of GHG that accumulates over a
period of time. The world had emitted an estimated
1 970 GtCO2 by 2014. The IPCC estimated that
the cumulative amount of CO2 emitted between
1991 and 2100 would have to remain below
approximately 3 000 Gt to maintain a 50% chance
of keeping global warming below 2 °C. Taking into
account estimated non-energy related emissions
of GHG, around 880 Gt to 1 180 Gt could be
emitted by the energy sector between now and
2100 – around 60% of what was emitted during
the last century.
Figure 2-2 | Carbon intensity of global energy supply, 1800-2013 (IEA)
2.1.3 Environmental pollution
An estimated 6,5 million annual deaths are linked
to air pollution, a number that will only increase
unless the energy sector takes greater action to
curb emissions. Premature deaths due to outdoor
air pollution are projected to rise from 3 million
today to 4,5 million by 2040, concentrated mainly
in developing Asia. The IEA estimates that under a
clean air scenario, premature deaths from outdoor
pollution would decline by 1,7 million in 2040 – a
scenario that would only require a 7% increase in
total energy investment
2.2 The GEI concept
2.2.1 Why larger-scale interconnection?
The challenge of providing an affordable and secure
supply of energy, and one that is sustainable and
adequately mitigates the risk of dangerous climate
change, requires unprecedented investments in
new energy infrastructure and technology, and the
large-scale retrofitting of existing energy delivery
systems. Crucially, a future energy system that
meets these goals will have to dramatically reduce
its reliance on fossil fuels, improve the efficiency
of supply and increase the share of renewable
and clean energy sources. At the crossroads
18
A vision for GEI
of this challenge is the progressive large-scale
interconnection of power systems.
The key renewable resources are to a large degree
constrained both in time and space. The best wind
and solar resources are often located far from
centres of energy demand; sites with the most
extensive such resources (e.g. wind in Northern
China or solar in the Southwestern US) are often
located in remote regions far from the major
demand centres. While technological progress
in wind and solar photovoltaic (PV) is opening
new deployment possibilities in less favourable
resource areas, transmission expansion is often
the only possible way to utilize most attractive
resources. Hydropower, the largest clean energy
power source today, is constrained by the
geographic location of suitable natural resources,
and the same is true for less deployed renewable
technologies such as geothermal, wave or tidal
power.
In the case of wind and solar, the output of such
energies fluctuates depending on wind speed
and solar irradiation at any given moment.
Transmission interconnection is proving to be a
valuable flexibility tool for facilitating the integration
of variable renewable resources, as it allows the
smoothing of generation profiles.
Similarly, hourly patterns of energy demand vary
greatly from country to country, depending on time
zones, behaviours or the structure of an economy.
Demand patterns exhibit considerable variability
due to differences in overall economic structure
as well as in the spread of air conditioning and
electric heating in various regions.
Interconnection allows for balancing of electricity
demands across larger areas: linking winter peak
demand regions with summer peak demand
regions and separate regions in different time
zones yields large benefits by smoothing daily
peak/valley and seasonal loads. Similarly, there is
a regional disparity between renewable production
patterns and resource endowment. As a result, a
strong transmission interconnection can increase
the flexibility of the power system and achieve
measurable savings in peak capacity needs.
The trend towards extensive interconnection has
been present in many countries. While continental-
scale interconnected and frequency-harmonized
systems have existed for decades, large-scale
long-distance power flows have been limited
(often focussing on connection of distant hydro
resources), and interconnections have primarily
served system security purposes. Interconnecting
regions and continents on a much larger scale
can bring significant benefits to any sustainable
energy scenario. Within this context, achieving
interconnection on a global scale could become a
possible solution to many energy challenges.
2.2.2 What is GEI?
GEI would constitute the ultimate stage of a natural
progression of power grids towards ever-greater
interconnection: a globally interconnected power
system, supported by Smart Grid infrastructure,
and making optimal use of UHV technology to
transmit power over great distances. Such large-
scale power grids would form the backbone for
the extensive deployment of clean energy, allowing
for an appropriate allocation of power generation
plants where resources are best.
Scenarios that would benefit from higher levels of
interconnection and GEI would also contemplate
much higher electricity demand than that of today,
with greatly increased levels of electrification of
industrial processes that have traditionally relied
on fossil fuels, transport – particularly private
transportation – and increased demand for electric
heating, cooling and appliance energy use in the
residential and commercial sectors.
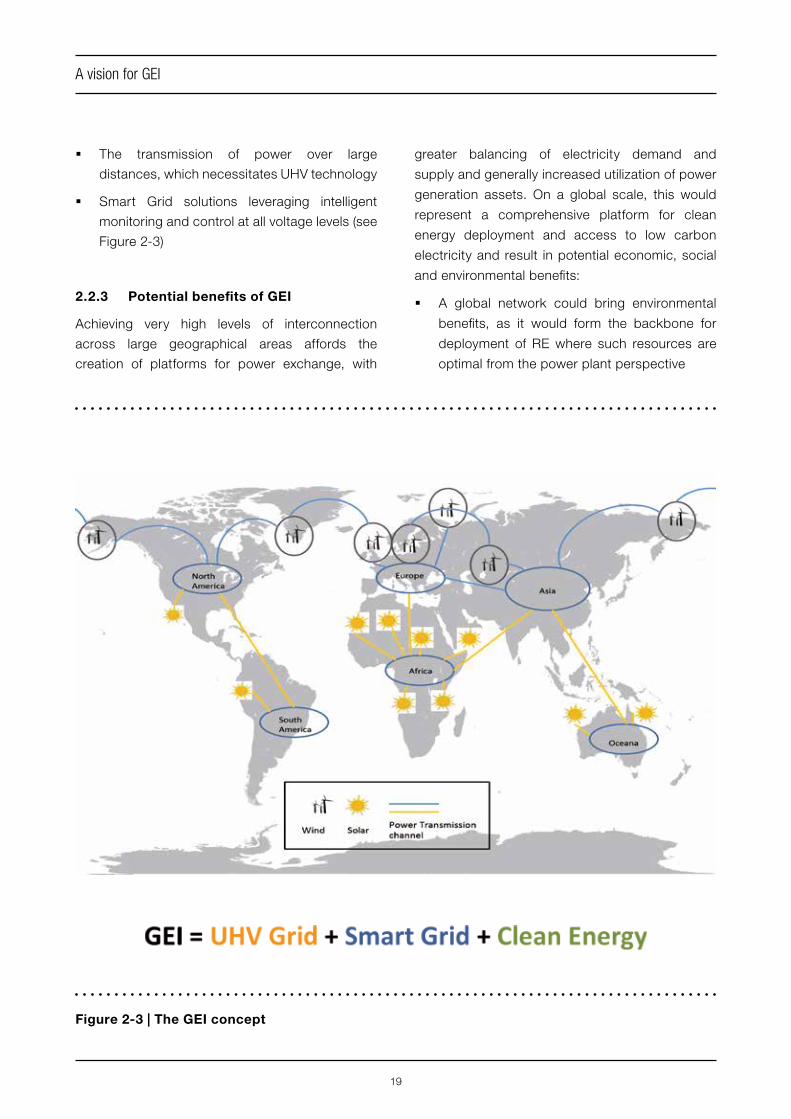
The GEI concept is thus built on three pillars:
§ A large-scale deployment of clean energy,
particularly variable renewables, coupled with
high levels of electrification
19
A vision for GEI
§ The transmission of power over large
distances, which necessitates UHV technology
§ Smart Grid solutions leveraging intelligent
monitoring and control at all voltage levels (see
Figure 2-3)
2.2.3 Potential benefits of GEI
Achieving very high levels of interconnection
across large geographical areas affords the
creation of platforms for power exchange, with
greater balancing of electricity demand and
supply and generally increased utilization of power
generation assets. On a global scale, this would
represent a comprehensive platform for clean
energy deployment and access to low carbon
electricity and result in potential economic, social
and environmental benefits:
§ A global network could bring environmental
benefits, as it would form the backbone for
deployment of RE where such resources are
optimal from the power plant perspective
Figure 2-3 | The GEI concept

20
A vision for GEI
§ While cost trends between now and 2050
cannot be predicted, low carbon scenarios
aimed at assessing the lowest cost of
decarbonizing the global energy system
have identified RE as the key pillar of
decarbonization
§ The large-scale deployment of transmission
grids and low carbon power would bring
social benefits to developing countries in the
form of energy access to clean power and
opportunities for local capacity building and
employment
2.2.4 GEI vision
GEI would constitute an organic whole. The
development of national grids would be coordinated
with increased levels of interconnection in
transnational and transcontinental grids. UHV
transmission technology and technologies
affording smart monitoring and control of electricity
grids would form the backbone of such grids, laid
out to facilitate connections to wind power bases
in northern latitudes and the Arctic, solar energy
bases in the equatorial regions as well as major
RE bases and main load centres on all continents.
An integrated view of concurrent electrification,
generation deployment and transmission and
distribution capacity, would split the future
development of a globally interconnected energy
network into three distinct phases at a high level:
§ A first phase, in which alignment on the
objective of increasing the degree of
interconnection to levels much higher than
those of today would be progressively
reached by governments, system owners and
operators, utilities and other stakeholders.
During this phase domestic grids would
continue to be upgraded and strengthened
and national power systems would be
progressively decarbonized
§ A second phase, in which transnational
interconnection would be promoted within
each continent and large-scale clean energy
bases would be developed (e.g. Northern
European wind, Western China wind and solar,
Northen Africa solar power)
§ A third and final phase, in which more distant
energy hubs would begin development of
wind power in northern latitudes and the
Arctic and solar power around the equator,
and transcontinental interconnection would
start to emerge
21
Section 3Energy trends and market readiness for GEI
3.1 Global energy resources and energy demands
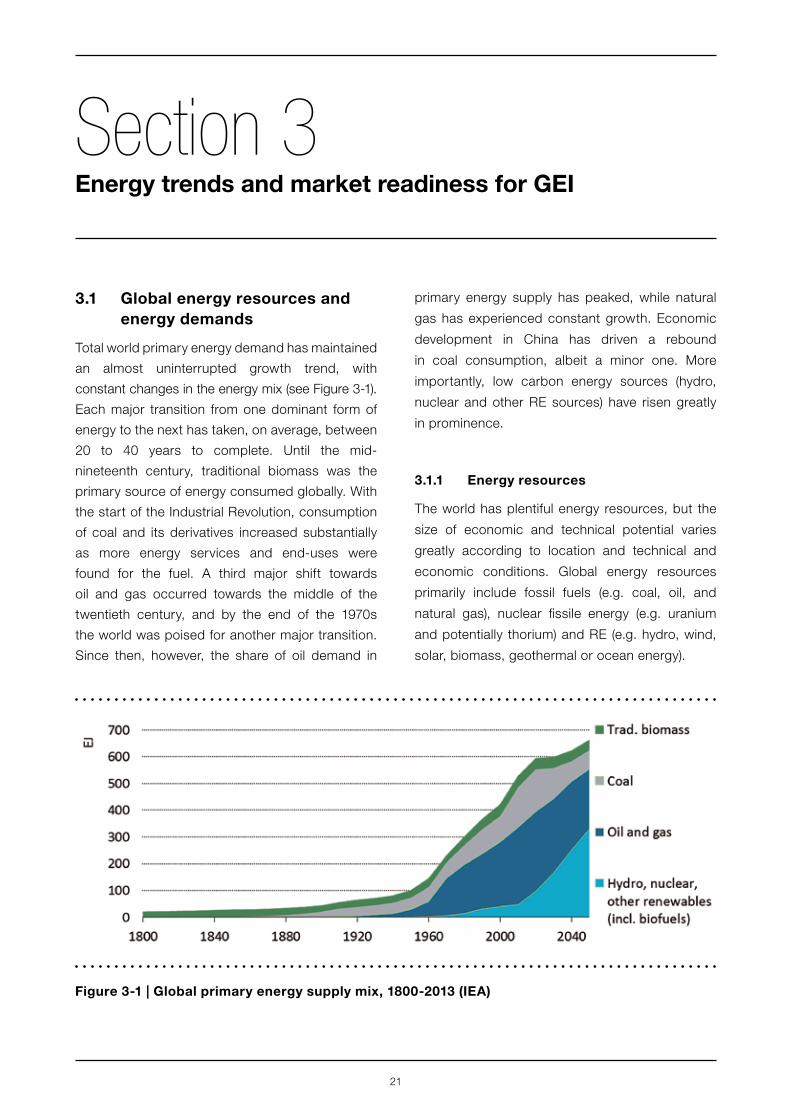
Total world primary energy demand has maintained
an almost uninterrupted growth trend, with
constant changes in the energy mix (see Figure 3-1).
Each major transition from one dominant form of
energy to the next has taken, on average, between
20 to 40 years to complete. Until the mid-
nineteenth century, traditional biomass was the
primary source of energy consumed globally. With
the start of the Industrial Revolution, consumption
of coal and its derivatives increased substantially
as more energy services and end-uses were
found for the fuel. A third major shift towards
oil and gas occurred towards the middle of the
twentieth century, and by the end of the 1970s
the world was poised for another major transition.
Since then, however, the share of oil demand in
primary energy supply has peaked, while natural
gas has experienced constant growth. Economic
development in China has driven a rebound
in coal consumption, albeit a minor one. More
importantly, low carbon energy sources (hydro,
nuclear and other RE sources) have risen greatly
in prominence.
3.1.1 Energy resources
The world has plentiful energy resources, but the
size of economic and technical potential varies
greatly according to location and technical and
economic conditions. Global energy resources
primarily include fossil fuels (e.g. coal, oil, and
natural gas), nuclear fissile energy (e.g. uranium
and potentially thorium) and RE (e.g. hydro, wind,
solar, biomass, geothermal or ocean energy).
Figure 3-1 | Global primary energy supply mix, 1800-2013 (IEA)
22
Energy trends and market readiness for GEI
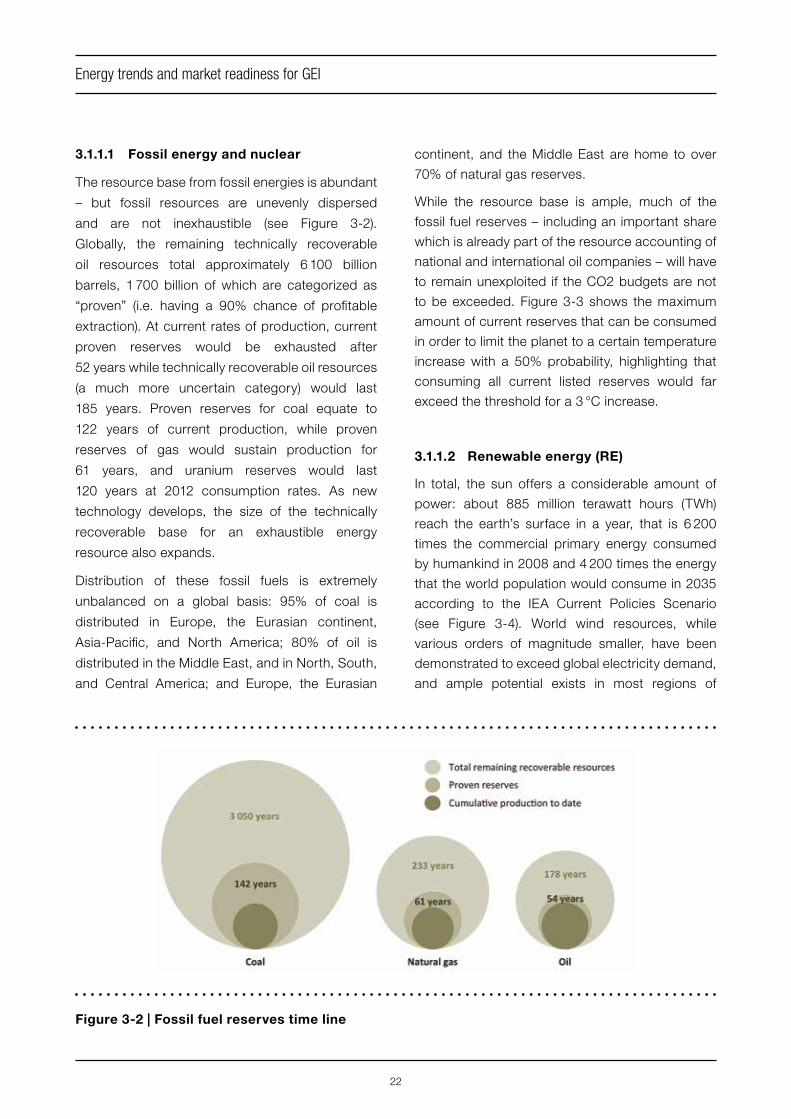
3.1.1.1 Fossil energy and nuclear
The resource base from fossil energies is abundant
– but fossil resources are unevenly dispersed
and are not inexhaustible (see Figure 3-2).
Globally, the remaining technically recoverable
oil resources total approximately 6 100 billion
barrels, 1 700 billion of which are categorized as
“proven” (i.e. having a 90% chance of profitable
extraction). At current rates of production, current
proven reserves would be exhausted after
52 years while technically recoverable oil resources
(a much more uncertain category) would last
185 years. Proven reserves for coal equate to
122 years of current production, while proven
reserves of gas would sustain production for
61 years, and uranium reserves would last
120 years at 2012 consumption rates. As new
technology develops, the size of the technically
recoverable base for an exhaustible energy
resource also expands.
Distribution of these fossil fuels is extremely
unbalanced on a global basis: 95% of coal is
distributed in Europe, the Eurasian continent,
Asia-Pacific, and North America; 80% of oil is
distributed in the Middle East, and in North, South,
and Central America; and Europe, the Eurasian
continent, and the Middle East are home to over
70% of natural gas reserves.
While the resource base is ample, much of the
fossil fuel reserves – including an important share
which is already part of the resource accounting of
national and international oil companies – will have
to remain unexploited if the CO2 budgets are not
to be exceeded. Figure 3-3 shows the maximum
amount of current reserves that can be consumed
in order to limit the planet to a certain temperature
increase with a 50% probability, highlighting that
consuming all current listed reserves would far
exceed the threshold for a 3 °C increase.
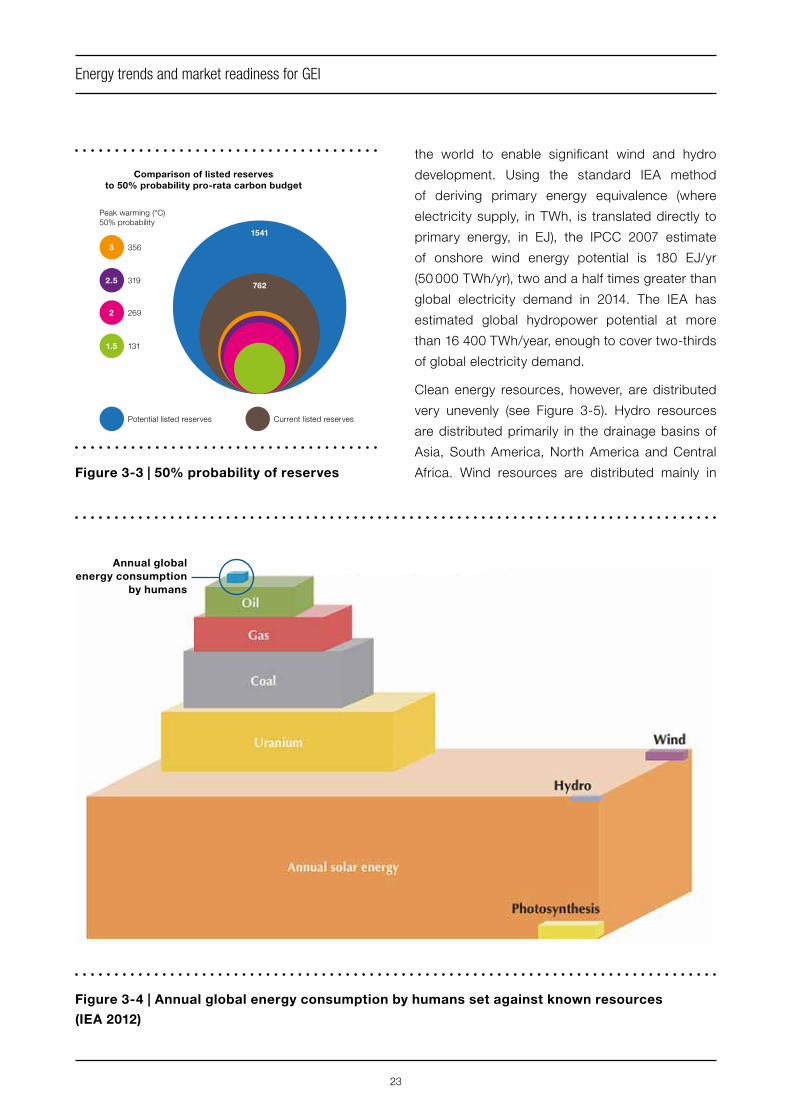
3.1.1.2 Renewable energy (RE)
In total, the sun offers a considerable amount of
power: about 885 million terawatt hours (TWh)
reach the earth’s surface in a year, that is 6 200
times the commercial primary energy consumed
by humankind in 2008 and 4 200 times the energy
that the world population would consume in 2035
according to the IEA Current Policies Scenario
(see Figure 3-4). World wind resources, while
various orders of magnitude smaller, have been
demonstrated to exceed global electricity demand,
and ample potential exists in most regions of
Figure 3-2 | Fossil fuel reserves time line
23
Energy trends and market readiness for GEI
Figure 3-4 | Annual global energy consumption by humans set against known resources
(IEA 2012)
Comparison of listed reservesto 50% probability pro-rata carbon budget
Peak warming (°C)50% probability
131
Potential listed reserves Current listed reserves
1.5
2692
3192.5
3563
1541
762
Figure 3-3 | 50% probability of reserves
the world to enable significant wind and hydro
development. Using the standard IEA method
of deriving primary energy equivalence (where
electricity supply, in TWh, is translated directly to
primary energy, in EJ), the IPCC 2007 estimate
of onshore wind energy potential is 180 EJ/yr
(50 000 TWh/yr), two and a half times greater than
global electricity demand in 2014. The IEA has
estimated global hydropower potential at more
than 16 400 TWh/year, enough to cover two-thirds
of global electricity demand.
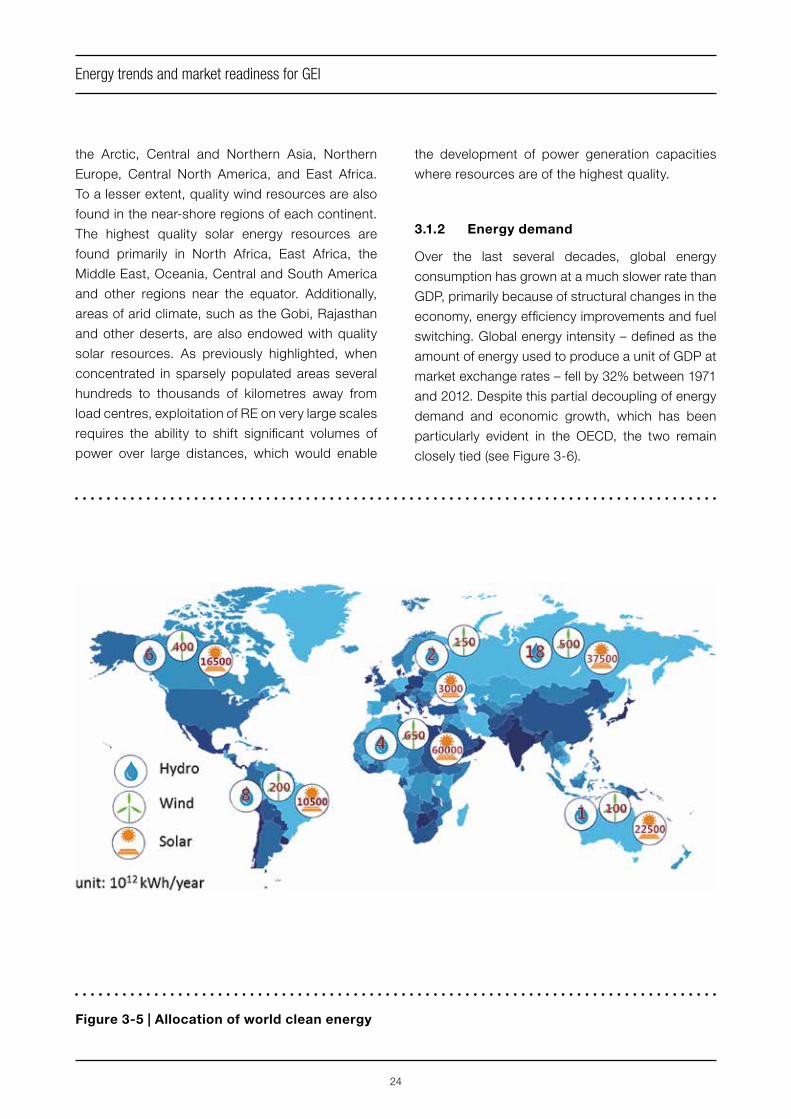
Clean energy resources, however, are distributed
very unevenly (see Figure 3-5). Hydro resources
are distributed primarily in the drainage basins of
Asia, South America, North America and Central
Africa. Wind resources are distributed mainly in
Annual global energy consumption
by humans
24
Energy trends and market readiness for GEI
the Arctic, Central and Northern Asia, Northern
Europe, Central North America, and East Africa.
To a lesser extent, quality wind resources are also
found in the near-shore regions of each continent.
The highest quality solar energy resources are
found primarily in North Africa, East Africa, the
Middle East, Oceania, Central and South America
and other regions near the equator. Additionally,
areas of arid climate, such as the Gobi, Rajasthan
and other deserts, are also endowed with quality
solar resources. As previously highlighted, when
concentrated in sparsely populated areas several
hundreds to thousands of kilometres away from
load centres, exploitation of RE on very large scales
requires the ability to shift significant volumes of
power over large distances, which would enable
the development of power generation capacities
where resources are of the highest quality.
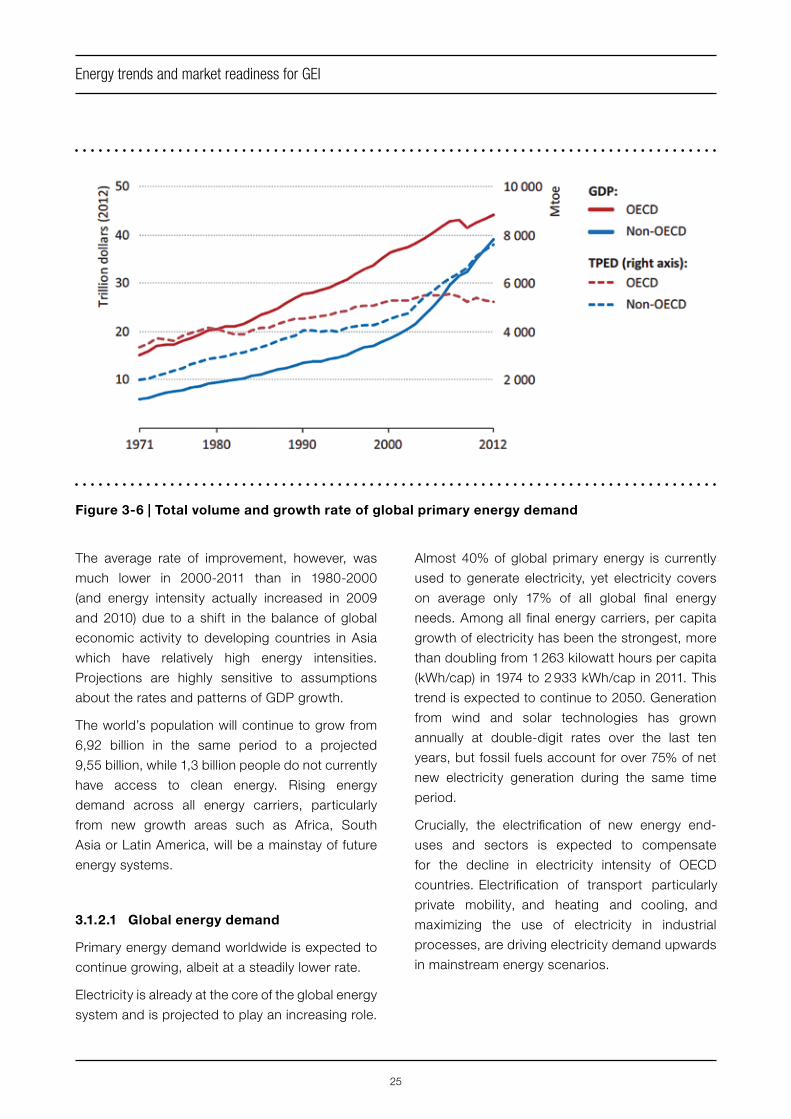
3.1.2 Energy demand
Over the last several decades, global energy
consumption has grown at a much slower rate than
GDP, primarily because of structural changes in the
economy, energy efficiency improvements and fuel
switching. Global energy intensity – defined as the
amount of energy used to produce a unit of GDP at
market exchange rates – fell by 32% between 1971
and 2012. Despite this partial decoupling of energy
demand and economic growth, which has been
particularly evident in the OECD, the two remain
closely tied (see Figure 3-6).
Figure 3-5 | Allocation of world clean energy
25
Energy trends and market readiness for GEI
The average rate of improvement, however, was
much lower in 2000-2011 than in 1980-2000
(and energy intensity actually increased in 2009
and 2010) due to a shift in the balance of global
economic activity to developing countries in Asia
which have relatively high energy intensities.
Projections are highly sensitive to assumptions
about the rates and patterns of GDP growth.
The world’s population will continue to grow from
6,92 billion in the same period to a projected
9,55 billion, while 1,3 billion people do not currently
have access to clean energy. Rising energy
demand across all energy carriers, particularly
from new growth areas such as Africa, South
Asia or Latin America, will be a mainstay of future
energy systems.
3.1.2.1 Global energy demand
Primary energy demand worldwide is expected to
continue growing, albeit at a steadily lower rate.
Electricity is already at the core of the global energy
system and is projected to play an increasing role.
Figure 3-6 | Total volume and growth rate of global primary energy demand
Almost 40% of global primary energy is currently
used to generate electricity, yet electricity covers
on average only 17% of all global final energy
needs. Among all final energy carriers, per capita
growth of electricity has been the strongest, more
than doubling from 1 263 kilowatt hours per capita
(kWh/cap) in 1974 to 2 933 kWh/cap in 2011. This
trend is expected to continue to 2050. Generation
from wind and solar technologies has grown
annually at double-digit rates over the last ten
years, but fossil fuels account for over 75% of net
new electricity generation during the same time
period.
Crucially, the electrification of new energy end-
uses and sectors is expected to compensate
for the decline in electricity intensity of OECD
countries. Electrification of transport particularly
private mobility, and heating and cooling, and
maximizing the use of electricity in industrial
processes, are driving electricity demand upwards
in mainstream energy scenarios.
26
Energy trends and market readiness for GEI
3.1.2.2 Regional electricity demand
Growth in electricity demand has been uneven
across regions, in part reflecting the global
economic recession or a shift away from increasing
industrial development to a more service-oriented
economy. Electricity system reliability has been
questioned due to ageing infrastructure, while also
being put to the test by deployment of renewables
and increased intense weather patterns.
The share of developed economies in Europe
and America in total global electricity demand will
decline substantially, in contrast to a significantly
higher share for Asia, Africa, and South America.
In 1990, non-OECD countries accounted for only
35% of the world’s total electricity. More recently,
driven by the fast-growing electricity consumption
among emerging economies, non-OECD countries
accounted for 51% of total global consumption in
2010, a figure that rose to 53% in 2013.
3.2 Trends in cost reduction of key technologies for GEI
While renewable technologies are becoming
increasingly competitive on a cost basis in a rising
number of regions and circumstances, public
support remains necessary to facilitate their
implementation in the vast majority of countries.
Power generation from renewables grew by a
record 128 gigawatts (GW) in 2014, accounting
for nearly half of all new plants. Around 69% of all
investment in new capacity went to RE sources.
Over half of all power sector investments were
accounted for by variable renewable generation
technologies, namely wind and solar PV, with
14% of investments going towards hydro. Of the
anticipated annual output of all capacity that came
online in 2015, and assuming current load factors,
new wind and solar plants would represent a fifth.
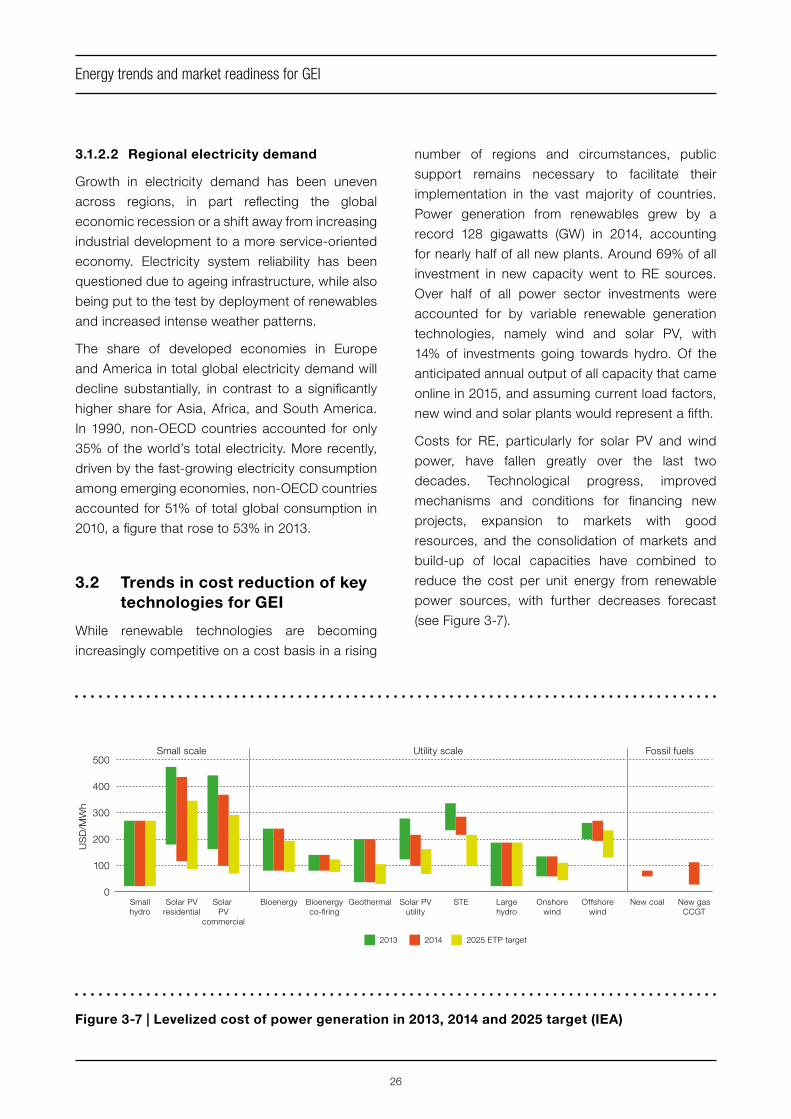
Costs for RE, particularly for solar PV and wind
power, have fallen greatly over the last two
decades. Technological progress, improved
mechanisms and conditions for financing new
projects, expansion to markets with good
resources, and the consolidation of markets and
build-up of local capacities have combined to
reduce the cost per unit energy from renewable
power sources, with further decreases forecast
(see Figure 3-7).
500
400
300
US
D/M
Wh
Small scale
Solar PVresidential
Solar PV
commercial
Bioenergy Bioenergyco-firing
Geothermal Solar PVutility
STE Largehydro
Onshorewind
Offshorewind
New coal New gasCCGT
Smallhydro
Utility scale Fossil fuels
200
100
0
2013 2014 2025 ETP target
Figure 3-7 | Levelized cost of power generation in 2013, 2014 and 2025 target (IEA)

27
Energy trends and market readiness for GEI
Figure 3-8 | Change trend of wind power cost under different wind [1])
3.2.1 Market trends for wind power
generation
The cost per kWh of wind power depends
on various factors, including wind resources,
investment costs, operation and maintenance
costs, finance costs, as well as the ability of the
conversion technology to turn wind output into
electricity, generally measured as a capacity factor.
Larger hub heights with larger swept areas result
in higher capacity factors and a greater amount of
electricity generated, all else being equal.
3.2.1.1 Onshore wind power generation
Onshore wind power is a mature technology
with a global supply chain. Onshore technology
has gradually evolved to maximize the electricity
produced for every megawatt installed.
Turbines have increased in height, with larger
swept areas and often greater generating
capacities. The result has been an increase in
investment costs, but also a reduction in costs
on a per unit energy basis due to the greater
capacity factors achieved (see Figure 3-8).
New turbines with a greater swept area per
megawatt have unlocked low- and medium-wind
sites that previously were not viable to develop.
The trend responds to three factors. In some
countries, such as Denmark and Germany, the
relatively high penetration of wind power has
reduced the availability of high quality wind sites.
The reduction of incentives in some countries
has squeezed profit margins for wind developers,
adding pressure to maximize generation per
megawatt (MW) installed. Finally, the trend away
from uncompetitive feed-in tariff schemes and
towards auctions and competitive tenders has
increased competition.
An estimated 65% to 80% of the costs of wind
power are accounted for by turbines. Costs
associated with construction, grid connection and
soft costs can also impact cost reduction trends.
While competition, local production and market
potential are major indicators of country-level
turbine pricing, the drivers for other system costs
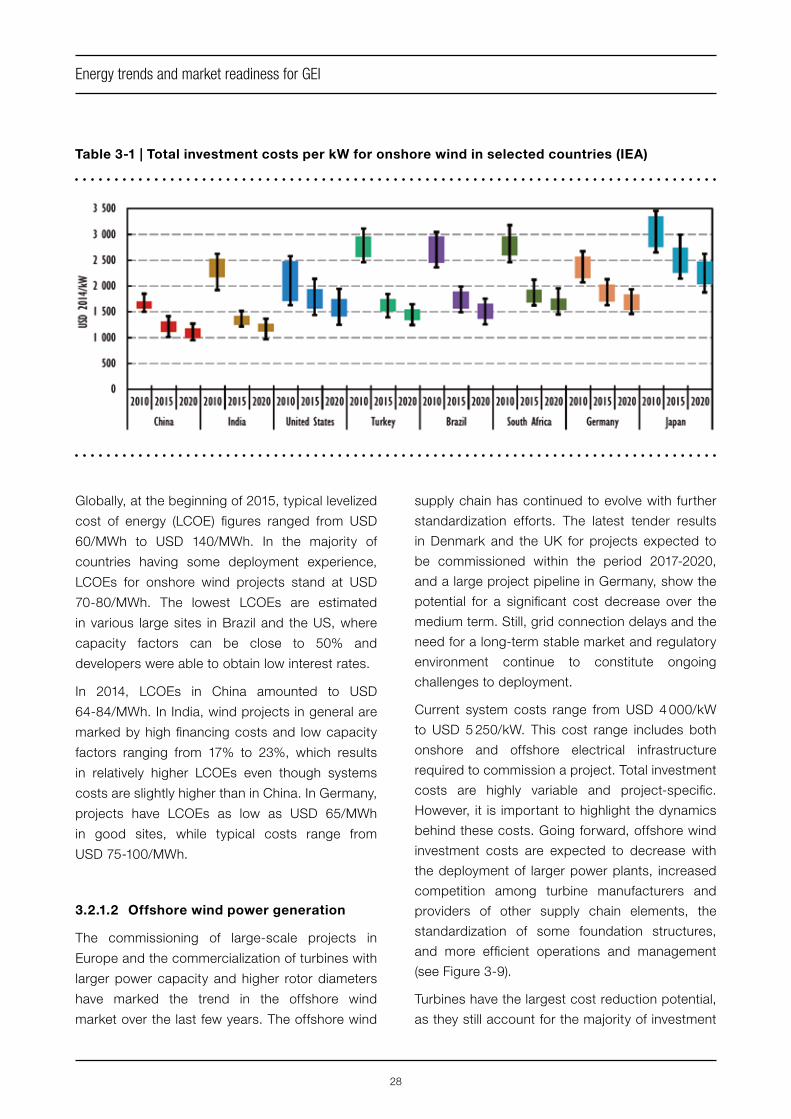
are more complex. Table 3-1 shows the expected
cost reductions in wind power out to 2020 in
selected regions.
28
Energy trends and market readiness for GEI
Globally, at the beginning of 2015, typical levelized
cost of energy (LCOE) figures ranged from USD
60/MWh to USD 140/MWh. In the majority of
countries having some deployment experience,
LCOEs for onshore wind projects stand at USD
70-80/MWh. The lowest LCOEs are estimated
in various large sites in Brazil and the US, where
capacity factors can be close to 50% and
developers were able to obtain low interest rates.
In 2014, LCOEs in China amounted to USD
64-84/MWh. In India, wind projects in general are
marked by high financing costs and low capacity
factors ranging from 17% to 23%, which results
in relatively higher LCOEs even though systems
costs are slightly higher than in China. In Germany,
projects have LCOEs as low as USD 65/MWh
in good sites, while typical costs range from
USD 75-100/MWh.
3.2.1.2 Offshore wind power generation
The commissioning of large-scale projects in
Europe and the commercialization of turbines with
larger power capacity and higher rotor diameters
have marked the trend in the offshore wind
market over the last few years. The offshore wind
Table 3-1 | Total investment costs per kW for onshore wind in selected countries (IEA)
supply chain has continued to evolve with further
standardization efforts. The latest tender results
in Denmark and the UK for projects expected to
be commissioned within the period 2017-2020,
and a large project pipeline in Germany, show the
potential for a significant cost decrease over the
medium term. Still, grid connection delays and the
need for a long-term stable market and regulatory
environment continue to constitute ongoing
challenges to deployment.
Current system costs range from USD 4 000/kW
to USD 5 250/kW. This cost range includes both
onshore and offshore electrical infrastructure
required to commission a project. Total investment
costs are highly variable and project-specific.
However, it is important to highlight the dynamics
behind these costs. Going forward, offshore wind
investment costs are expected to decrease with
the deployment of larger power plants, increased
competition among turbine manufacturers and
providers of other supply chain elements, the
standardization of some foundation structures,
and more efficient operations and management
(see Figure 3-9).
Turbines have the largest cost reduction potential,
as they still account for the majority of investment

29
Energy trends and market readiness for GEI
costs, and increasing competition among offshore
turbine manufacturers should reduce prices over
the medium term. In addition, the increasing
generator capacity of turbines is expected to
lower construction costs significantly, as fewer
foundations and array cables will be required.
Floating offshore wind installations may offer
innovative solutions in the years to come, including
the use of vertical-axis turbines, a design that
has been outpaced on shore but may have some
advantages on floating platforms.
3.2.2 Market trends for solar power
generation
3.2.2.1 Solar PV
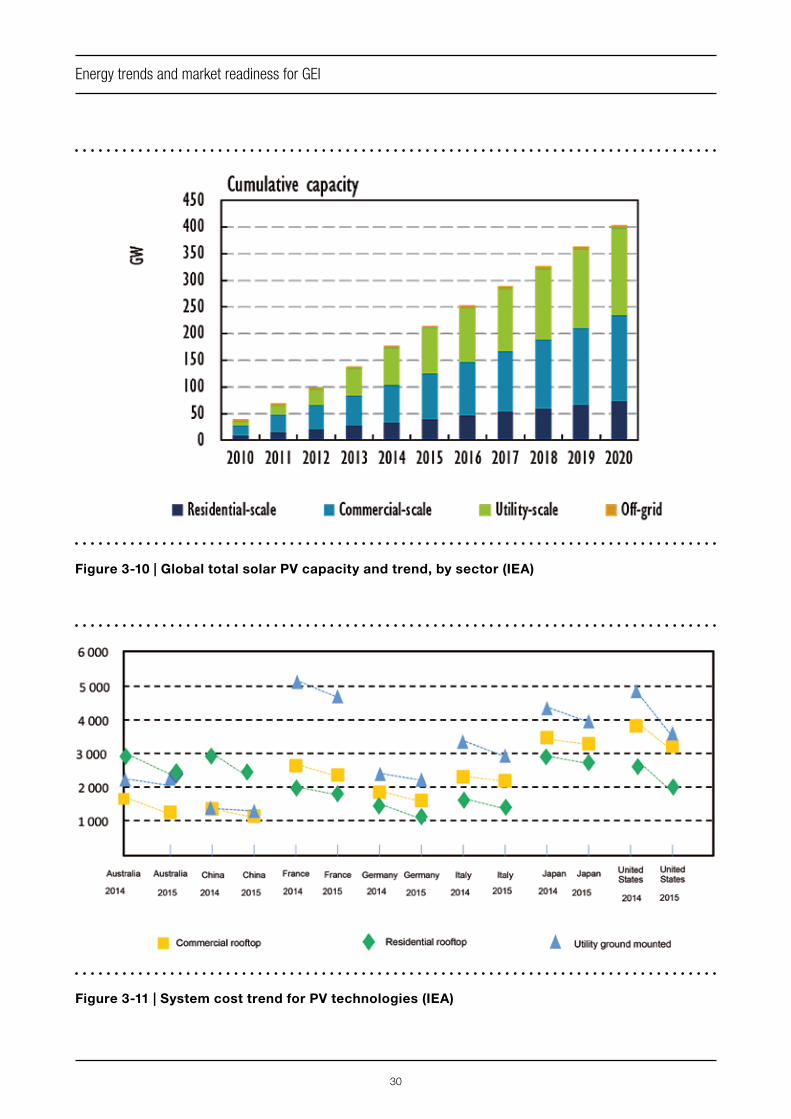
By the end of 2014, the global total solar PV
capacity reached 177 GW, with about 40 GW of
capacity added in 2014 itself (see Figure 3-10).
From 2008 to 2012, solar PV module prices
were divided by five, and solar PV system prices
divided by three in mature markets such as Italy
due to sustained technology improvement and
great economies of scale. In 2013 and 2014,
module prices declined by 15%-18% annually in
Figure 3-9 | European offshore wind farm investment cost components and trend (IEA)
markets such as Japan and Germany, however,
they remained largely stable in China, with several
months of higher prices. In early 2015, average
module prices stood at USD 0,60-0,70 per watt,
and differentials between markets have narrowed,
though China still occupies the lower end of the
price range. Increased domestic demand has
been an important driver for stabilizing module
prices in China, the source of almost half of global
module shipments in 2014.
Technology improvement has been and will
continue to act as an important driver for sustained
investment cost reductions in solar PV systems
(see Figure 3-11). Technology evolution will likely
be marked by three broad trends:
§ Incremental progress towards higher
conversion efficiency, which would allow for
smaller module sizes
§ Lower materials usage
§ Streamlined and more innovative manufactur-
ing processes
Still, given uncertainty in trying to predict
technology trends as well as separating the
effects from industrial competition, some debate
30
Energy trends and market readiness for GEI
Figure 3-10 | Global total solar PV capacity and trend, by sector (IEA)
Figure 3-11 | System cost trend for PV technologies (IEA)
31
Energy trends and market readiness for GEI
has emerged over the trajectory of the PV module
learning curve going forward.
Even as module price decreases have somewhat
slowed, balance of system (BOS) costs have
experienced an accelerated decrease. In
2015, typical utility-scale solar PV prices were
estimated to be as low as USD 1 300/kW in
China and Germany. Commercial-scale solar
PV prices were at USD 1 150/kW in China and
USD 1 300 in Australia. Meanwhile, the lowest
residential-scale systems still remained at levels of
USD 2 000/kW and higher. In general, most new
utility-scale projects in the world can currently be
developed at investment costs of between USD
1 000-2 000/kW, depending on the market.
Going forward, solar PV investment costs are
likely to decline due to a combination of continued
global learning in module production and local
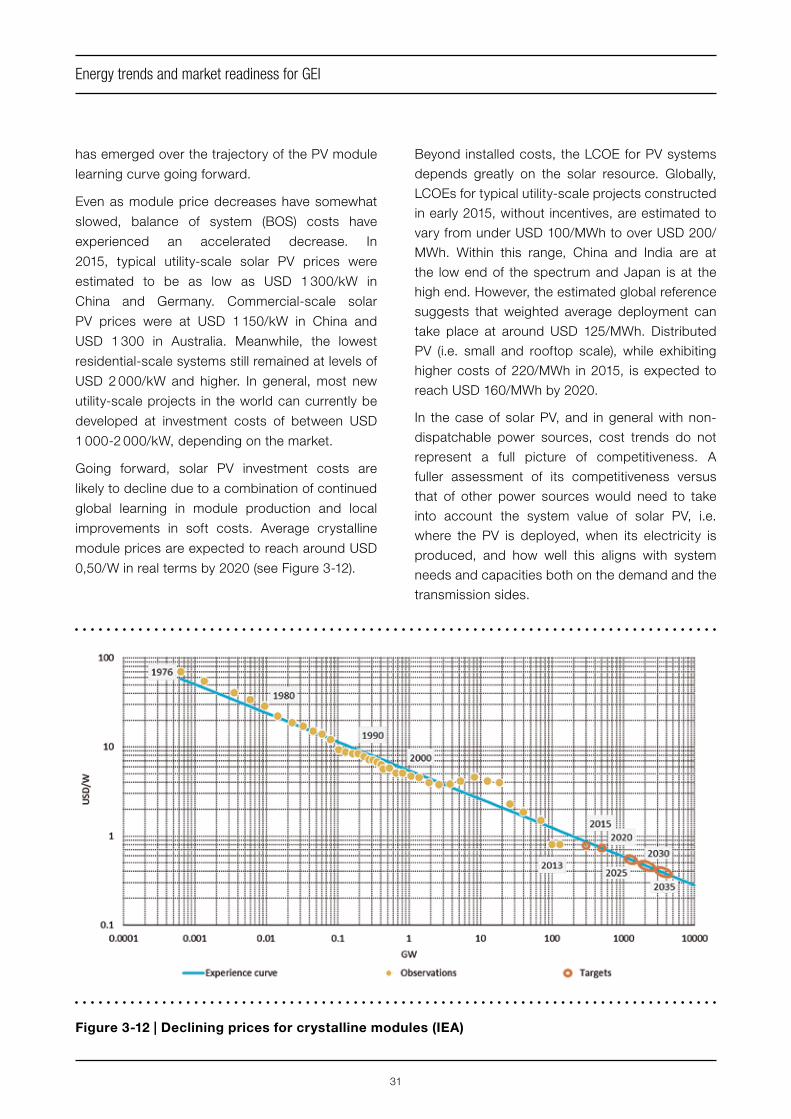
improvements in soft costs. Average crystalline
module prices are expected to reach around USD
0,50/W in real terms by 2020 (see Figure 3-12).
Figure 3-12 | Declining prices for crystalline modules (IEA)
Beyond installed costs, the LCOE for PV systems
depends greatly on the solar resource. Globally,
LCOEs for typical utility-scale projects constructed
in early 2015, without incentives, are estimated to
vary from under USD 100/MWh to over USD 200/
MWh. Within this range, China and India are at
the low end of the spectrum and Japan is at the
high end. However, the estimated global reference
suggests that weighted average deployment can
take place at around USD 125/MWh. Distributed
PV (i.e. small and rooftop scale), while exhibiting
higher costs of 220/MWh in 2015, is expected to
reach USD 160/MWh by 2020.
In the case of solar PV, and in general with non-
dispatchable power sources, cost trends do not
represent a full picture of competitiveness. A
fuller assessment of its competitiveness versus
that of other power sources would need to take
into account the system value of solar PV, i.e.
where the PV is deployed, when its electricity is
produced, and how well this aligns with system
needs and capacities both on the demand and the
transmission sides.
32
Energy trends and market readiness for GEI
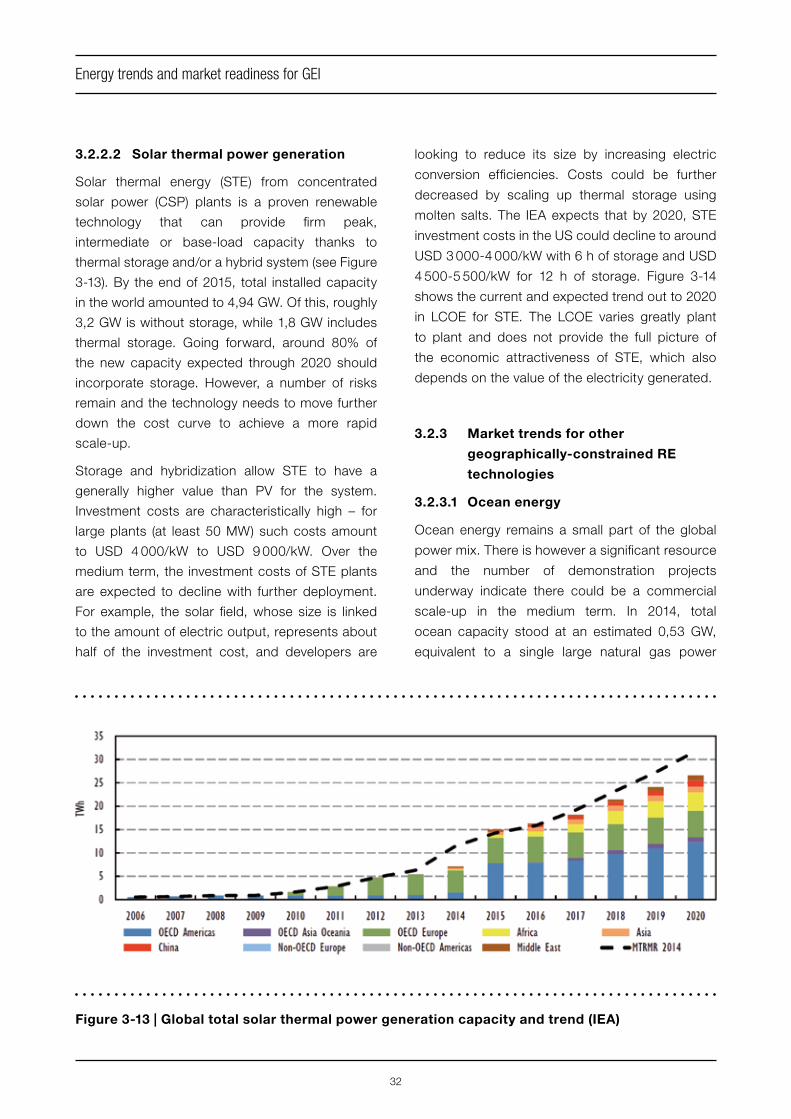
3.2.2.2 Solar thermal power generation
Solar thermal energy (STE) from concentrated
solar power (CSP) plants is a proven renewable
technology that can provide firm peak,
intermediate or base-load capacity thanks to
thermal storage and/or a hybrid system (see Figure
3-13). By the end of 2015, total installed capacity
in the world amounted to 4,94 GW. Of this, roughly
3,2 GW is without storage, while 1,8 GW includes
thermal storage. Going forward, around 80% of
the new capacity expected through 2020 should
incorporate storage. However, a number of risks
remain and the technology needs to move further
down the cost curve to achieve a more rapid
scale-up.
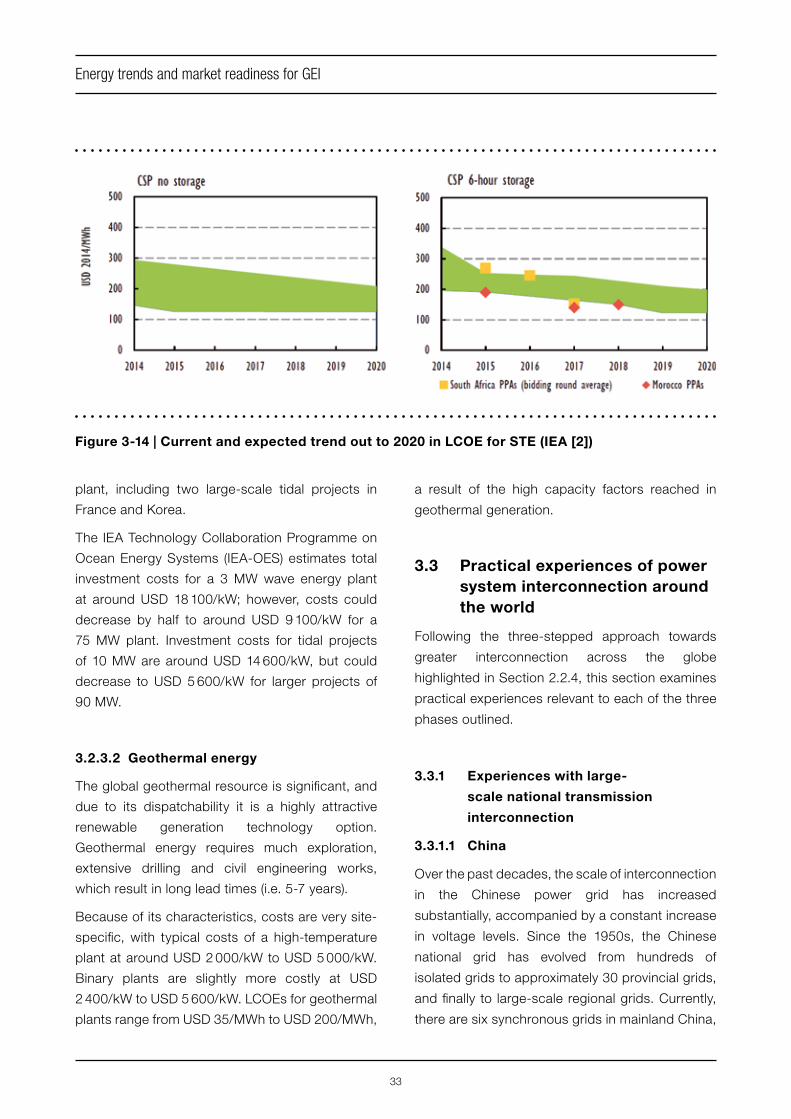
Storage and hybridization allow STE to have a
generally higher value than PV for the system.
Investment costs are characteristically high – for
large plants (at least 50 MW) such costs amount
to USD 4 000/kW to USD 9 000/kW. Over the
medium term, the investment costs of STE plants
are expected to decline with further deployment.
For example, the solar field, whose size is linked
to the amount of electric output, represents about
half of the investment cost, and developers are
looking to reduce its size by increasing electric
conversion efficiencies. Costs could be further
decreased by scaling up thermal storage using
molten salts. The IEA expects that by 2020, STE
investment costs in the US could decline to around
USD 3 000-4 000/kW with 6 h of storage and USD
4 500-5 500/kW for 12 h of storage. Figure 3-14
shows the current and expected trend out to 2020
in LCOE for STE. The LCOE varies greatly plant
to plant and does not provide the full picture of
the economic attractiveness of STE, which also
depends on the value of the electricity generated.
3.2.3 Market trends for other
geographically-constrained RE
technologies
3.2.3.1 Ocean energy
Ocean energy remains a small part of the global
power mix. There is however a significant resource
and the number of demonstration projects
underway indicate there could be a commercial
scale-up in the medium term. In 2014, total
ocean capacity stood at an estimated 0,53 GW,
equivalent to a single large natural gas power
Figure 3-13 | Global total solar thermal power generation capacity and trend (IEA)
33
Energy trends and market readiness for GEI
plant, including two large-scale tidal projects in
France and Korea.
The IEA Technology Collaboration Programme on
Ocean Energy Systems (IEA-OES) estimates total
investment costs for a 3 MW wave energy plant
at around USD 18 100/kW; however, costs could
decrease by half to around USD 9 100/kW for a
75 MW plant. Investment costs for tidal projects
of 10 MW are around USD 14 600/kW, but could
decrease to USD 5 600/kW for larger projects of
90 MW.
3.2.3.2 Geothermal energy
The global geothermal resource is significant, and
due to its dispatchability it is a highly attractive
renewable generation technology option.
Geothermal energy requires much exploration,
extensive drilling and civil engineering works,
which result in long lead times (i.e. 5-7 years).
Because of its characteristics, costs are very site-
specific, with typical costs of a high-temperature
plant at around USD 2 000/kW to USD 5 000/kW.
Binary plants are slightly more costly at USD
2 400/kW to USD 5 600/kW. LCOEs for geothermal
plants range from USD 35/MWh to USD 200/MWh,
Figure 3-14 | Current and expected trend out to 2020 in LCOE for STE (IEA [2])
a result of the high capacity factors reached in
geothermal generation.
3.3 Practical experiences of power system interconnection around the world
Following the three-stepped approach towards
greater interconnection across the globe
highlighted in Section 2.2.4, this section examines
practical experiences relevant to each of the three
phases outlined.
3.3.1 Experiences with large-
scale national transmission
interconnection
3.3.1.1 China
Over the past decades, the scale of interconnection
in the Chinese power grid has increased
substantially, accompanied by a constant increase
in voltage levels. Since the 1950s, the Chinese
national grid has evolved from hundreds of
isolated grids to approximately 30 provincial grids,
and finally to large-scale regional grids. Currently,
there are six synchronous grids in mainland China,
34
Energy trends and market readiness for GEI
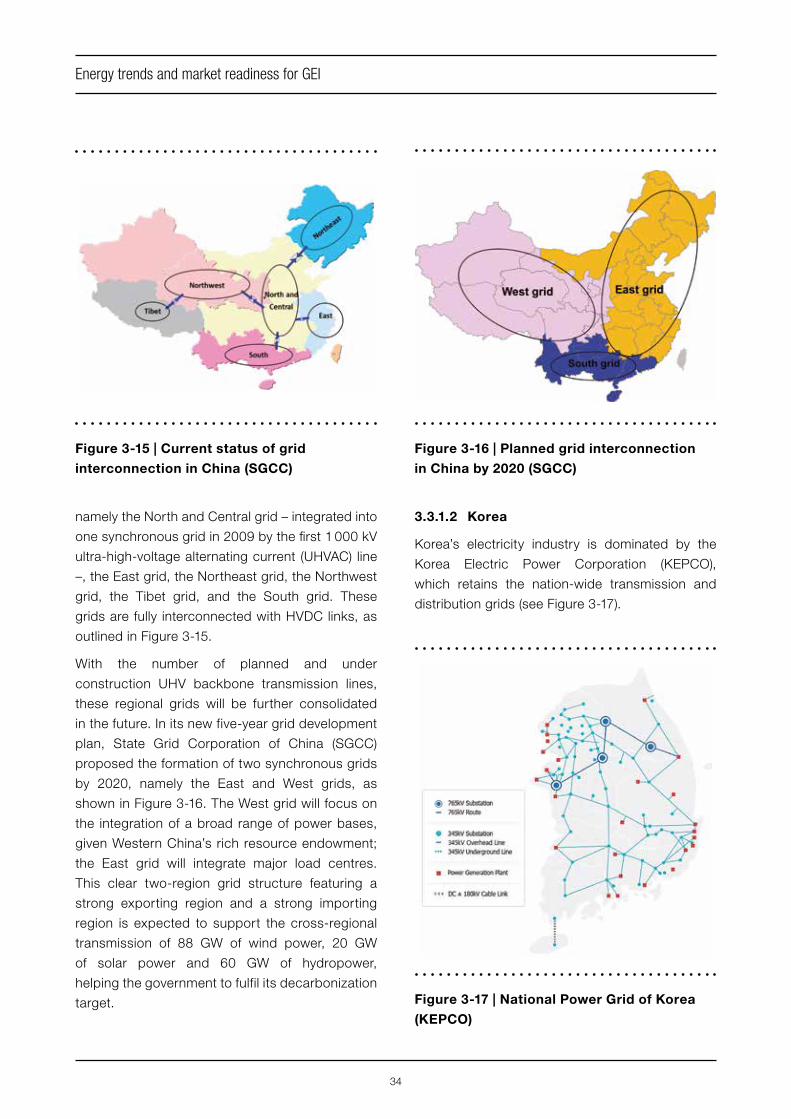
namely the North and Central grid – integrated into
one synchronous grid in 2009 by the first 1 000 kV
ultra-high-voltage alternating current (UHVAC) line
–, the East grid, the Northeast grid, the Northwest
grid, the Tibet grid, and the South grid. These
grids are fully interconnected with HVDC links, as
outlined in Figure 3-15.
With the number of planned and under
construction UHV backbone transmission lines,
these regional grids will be further consolidated
in the future. In its new five-year grid development
plan, State Grid Corporation of China (SGCC)
proposed the formation of two synchronous grids
by 2020, namely the East and West grids, as
shown in Figure 3-16. The West grid will focus on
the integration of a broad range of power bases,
given Western China’s rich resource endowment;
the East grid will integrate major load centres.
This clear two-region grid structure featuring a
strong exporting region and a strong importing
region is expected to support the cross-regional
transmission of 88 GW of wind power, 20 GW
of solar power and 60 GW of hydropower,
helping the government to fulfil its decarbonization
target.
3.3.1.2 Korea
Korea’s electricity industry is dominated by the
Korea Electric Power Corporation (KEPCO),
which retains the nation-wide transmission and
distribution grids (see Figure 3-17).
Figure 3-15 | Current status of grid
interconnection in China (SGCC)
Figure 3-17 | National Power Grid of Korea
(KEPCO)
Figure 3-16 | Planned grid interconnection
in China by 2020 (SGCC)
35
Energy trends and market readiness for GEI
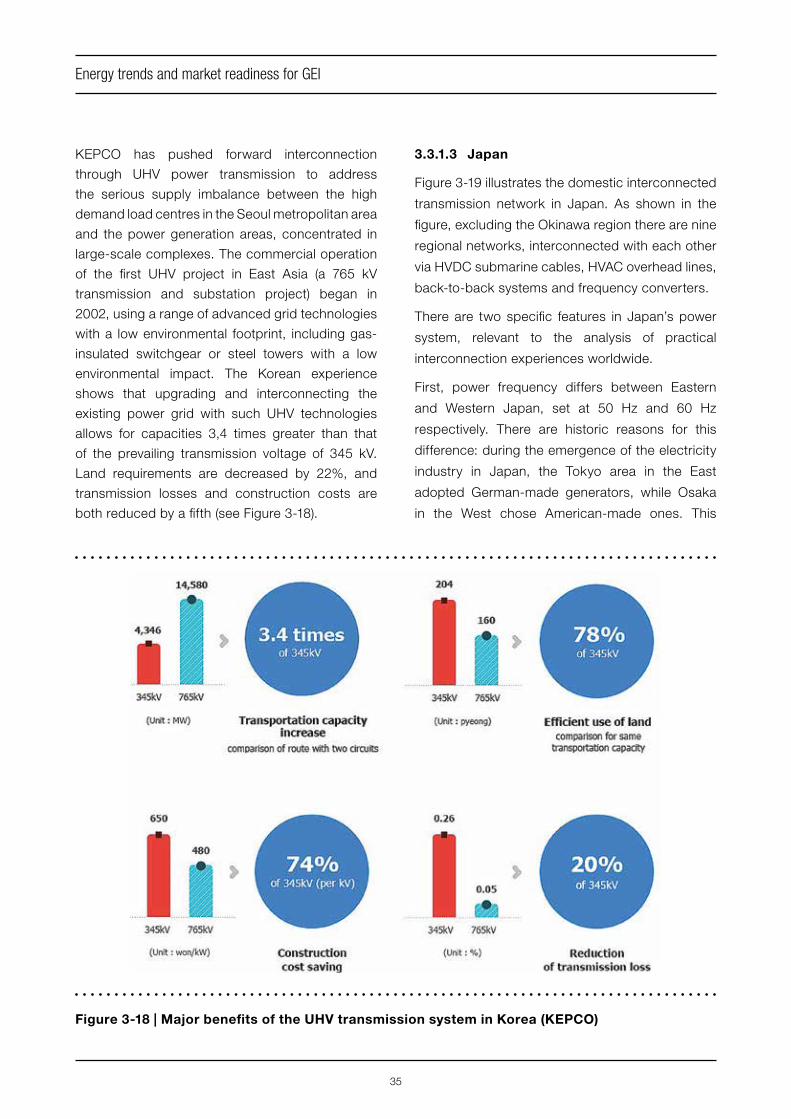
KEPCO has pushed forward interconnection
through UHV power transmission to address
the serious supply imbalance between the high
demand load centres in the Seoul metropolitan area
and the power generation areas, concentrated in
large-scale complexes. The commercial operation
of the first UHV project in East Asia (a 765 kV
transmission and substation project) began in
2002, using a range of advanced grid technologies
with a low environmental footprint, including gas-
insulated switchgear or steel towers with a low
environmental impact. The Korean experience
shows that upgrading and interconnecting the
existing power grid with such UHV technologies
allows for capacities 3,4 times greater than that
of the prevailing transmission voltage of 345 kV.
Land requirements are decreased by 22%, and
transmission losses and construction costs are
both reduced by a fifth (see Figure 3-18).
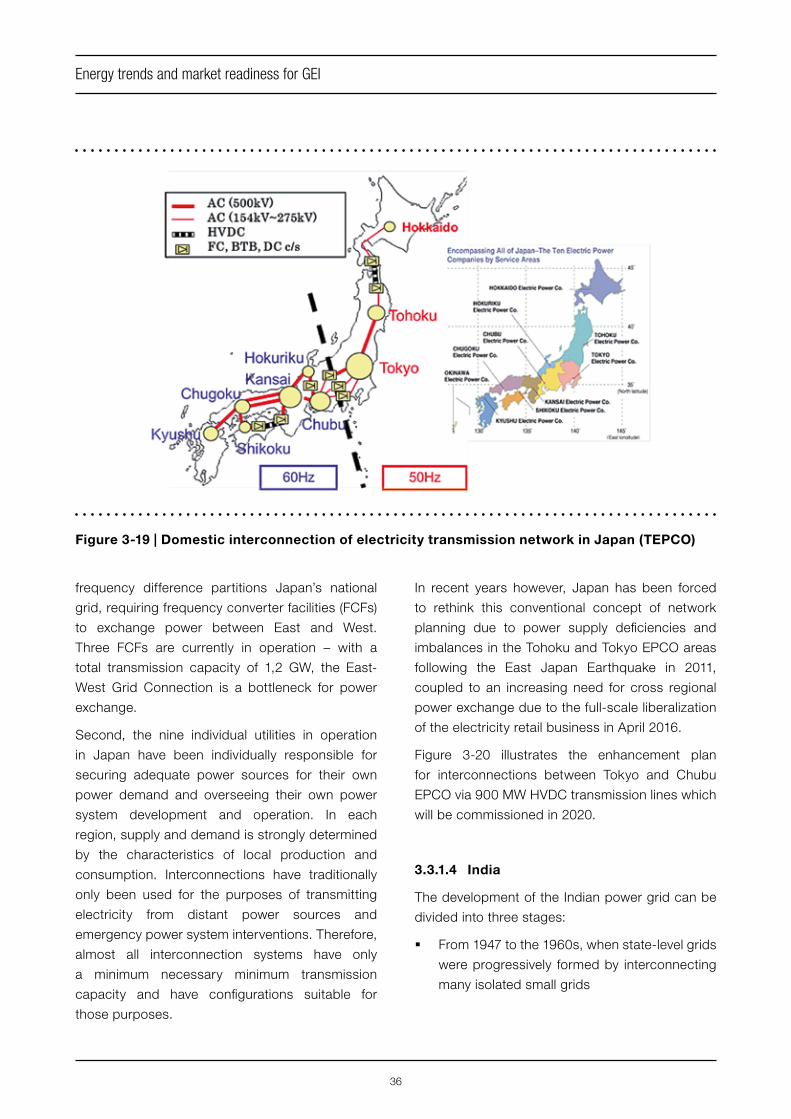
3.3.1.3 Japan
Figure 3-19 illustrates the domestic interconnected
transmission network in Japan. As shown in the
figure, excluding the Okinawa region there are nine
regional networks, interconnected with each other
via HVDC submarine cables, HVAC overhead lines,
back-to-back systems and frequency converters.
There are two specific features in Japan’s power
system, relevant to the analysis of practical
interconnection experiences worldwide.
First, power frequency differs between Eastern
and Western Japan, set at 50 Hz and 60 Hz
respectively. There are historic reasons for this
difference: during the emergence of the electricity
industry in Japan, the Tokyo area in the East
adopted German-made generators, while Osaka
in the West chose American-made ones. This
Figure 3-18 | Major benefits of the UHV transmission system in Korea (KEPCO)
36
Energy trends and market readiness for GEI
Figure 3-19 | Domestic interconnection of electricity transmission network in Japan (TEPCO)
frequency difference partitions Japan’s national
grid, requiring frequency converter facilities (FCFs)
to exchange power between East and West.
Three FCFs are currently in operation – with a
total transmission capacity of 1,2 GW, the East-
West Grid Connection is a bottleneck for power
exchange.
Second, the nine individual utilities in operation
in Japan have been individually responsible for
securing adequate power sources for their own
power demand and overseeing their own power
system development and operation. In each
region, supply and demand is strongly determined
by the characteristics of local production and
consumption. Interconnections have traditionally
only been used for the purposes of transmitting
electricity from distant power sources and
emergency power system interventions. Therefore,
almost all interconnection systems have only
a minimum necessary minimum transmission
capacity and have configurations suitable for
those purposes.
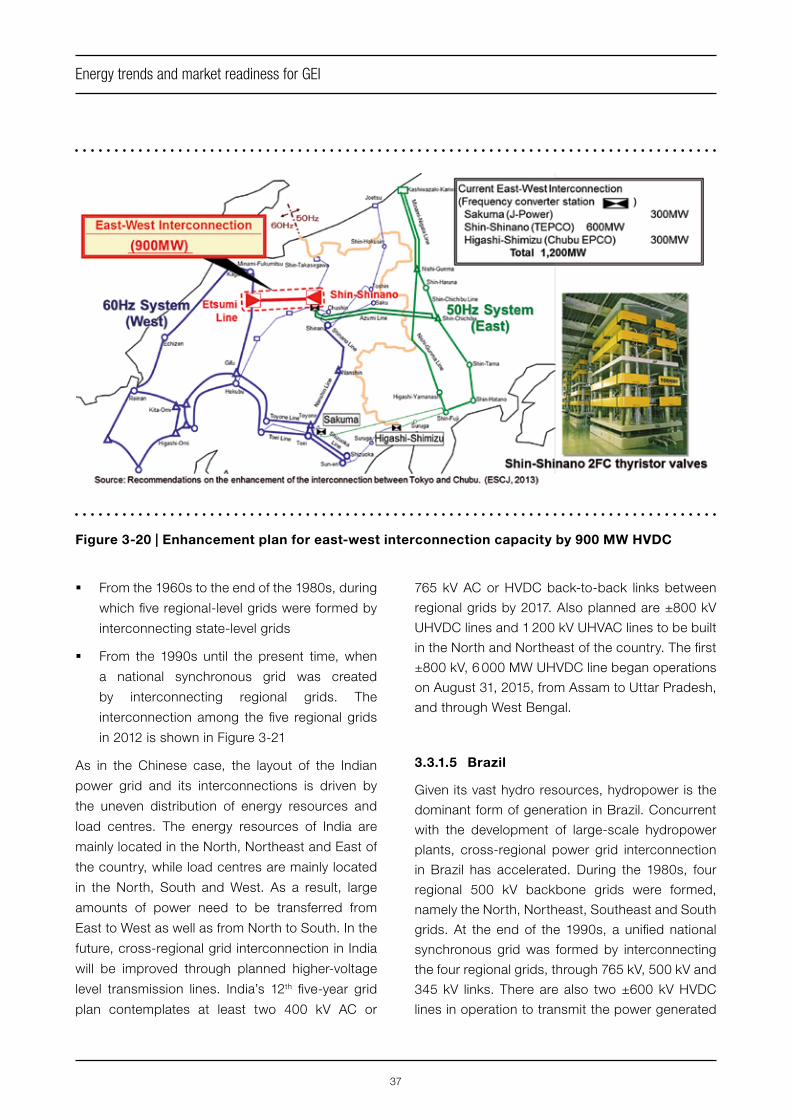
In recent years however, Japan has been forced
to rethink this conventional concept of network
planning due to power supply deficiencies and
imbalances in the Tohoku and Tokyo EPCO areas
following the East Japan Earthquake in 2011,
coupled to an increasing need for cross regional
power exchange due to the full-scale liberalization
of the electricity retail business in April 2016.
Figure 3-20 illustrates the enhancement plan
for interconnections between Tokyo and Chubu
EPCO via 900 MW HVDC transmission lines which
will be commissioned in 2020.
3.3.1.4 India
The development of the Indian power grid can be
divided into three stages:
§ From 1947 to the 1960s, when state-level grids
were progressively formed by interconnecting
many isolated small grids
37
Energy trends and market readiness for GEI
Figure 3-20 | Enhancement plan for east-west interconnection capacity by 900 MW HVDC
§ From the 1960s to the end of the 1980s, during
which five regional-level grids were formed by
interconnecting state-level grids
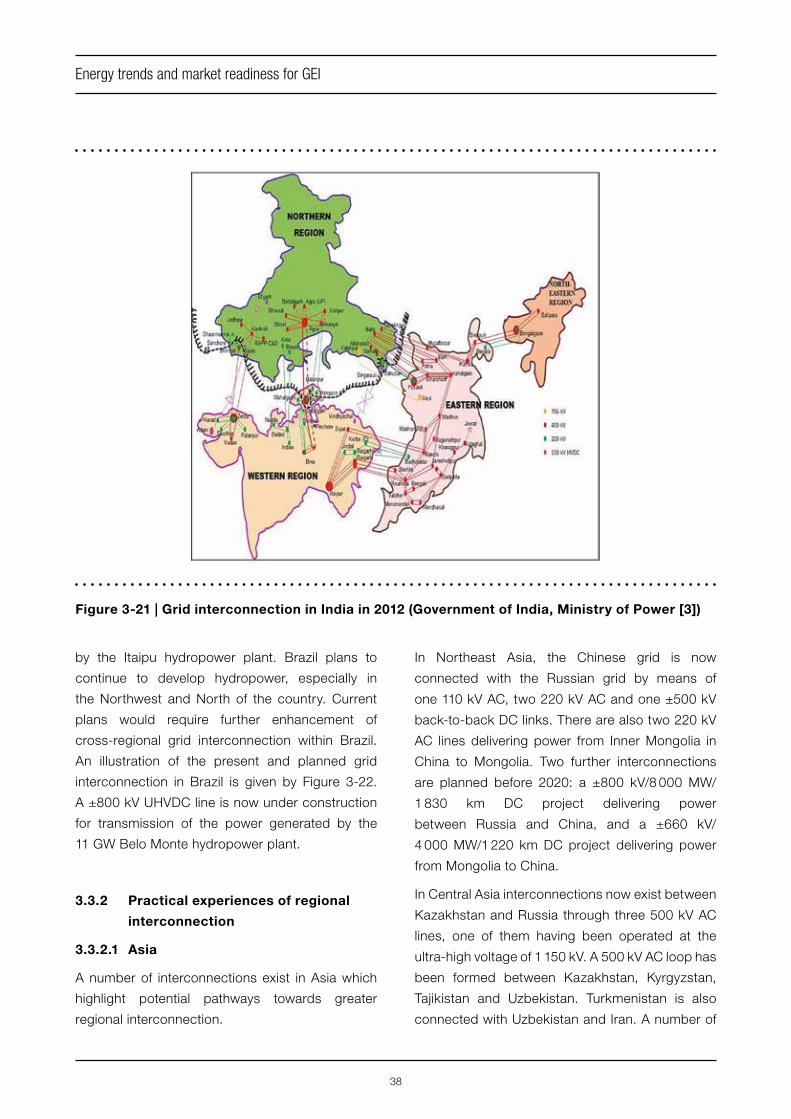
§ From the 1990s until the present time, when
a national synchronous grid was created
by interconnecting regional grids. The
interconnection among the five regional grids
in 2012 is shown in Figure 3-21
As in the Chinese case, the layout of the Indian
power grid and its interconnections is driven by
the uneven distribution of energy resources and
load centres. The energy resources of India are
mainly located in the North, Northeast and East of
the country, while load centres are mainly located
in the North, South and West. As a result, large
amounts of power need to be transferred from
East to West as well as from North to South. In the
future, cross-regional grid interconnection in India
will be improved through planned higher-voltage
level transmission lines. India’s 12th five-year grid
plan contemplates at least two 400 kV AC or
765 kV AC or HVDC back-to-back links between
regional grids by 2017. Also planned are ±800 kV
UHVDC lines and 1 200 kV UHVAC lines to be built
in the North and Northeast of the country. The first
±800 kV, 6 000 MW UHVDC line began operations
on August 31, 2015, from Assam to Uttar Pradesh,
and through West Bengal.
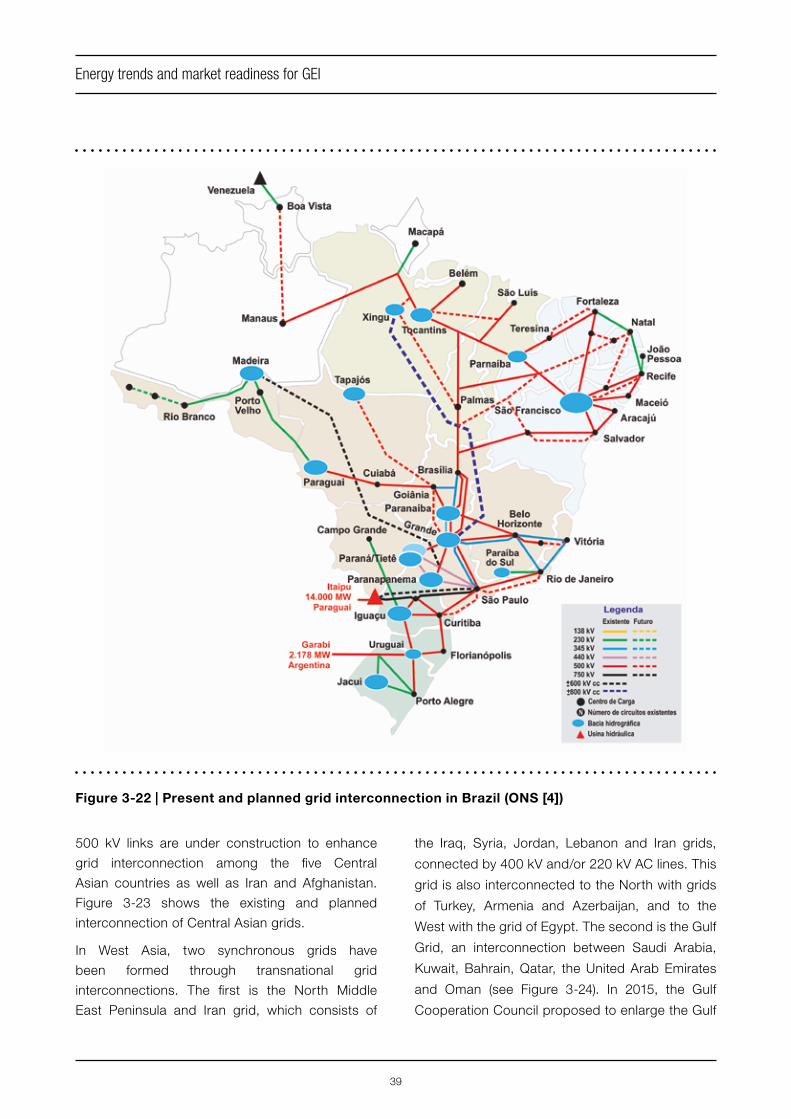
3.3.1.5 Brazil
Given its vast hydro resources, hydropower is the
dominant form of generation in Brazil. Concurrent
with the development of large-scale hydropower
plants, cross-regional power grid interconnection
in Brazil has accelerated. During the 1980s, four
regional 500 kV backbone grids were formed,
namely the North, Northeast, Southeast and South
grids. At the end of the 1990s, a unified national
synchronous grid was formed by interconnecting
the four regional grids, through 765 kV, 500 kV and
345 kV links. There are also two ±600 kV HVDC
lines in operation to transmit the power generated
38
Energy trends and market readiness for GEI
Figure 3-21 | Grid interconnection in India in 2012 (Government of India, Ministry of Power [3])
by the Itaipu hydropower plant. Brazil plans to
continue to develop hydropower, especially in
the Northwest and North of the country. Current
plans would require further enhancement of
cross-regional grid interconnection within Brazil.
An illustration of the present and planned grid
interconnection in Brazil is given by Figure 3-22.
A ±800 kV UHVDC line is now under construction
for transmission of the power generated by the
11 GW Belo Monte hydropower plant.
3.3.2 Practical experiences of regional
interconnection
3.3.2.1 Asia
A number of interconnections exist in Asia which
highlight potential pathways towards greater
regional interconnection.
In Northeast Asia, the Chinese grid is now
connected with the Russian grid by means of
one 110 kV AC, two 220 kV AC and one ±500 kV
back-to-back DC links. There are also two 220 kV
AC lines delivering power from Inner Mongolia in
China to Mongolia. Two further interconnections
are planned before 2020: a ±800 kV/8 000 MW/
1 830 km DC project delivering power
between Russia and China, and a ±660 kV/
4 000 MW/1 220 km DC project delivering power
from Mongolia to China.
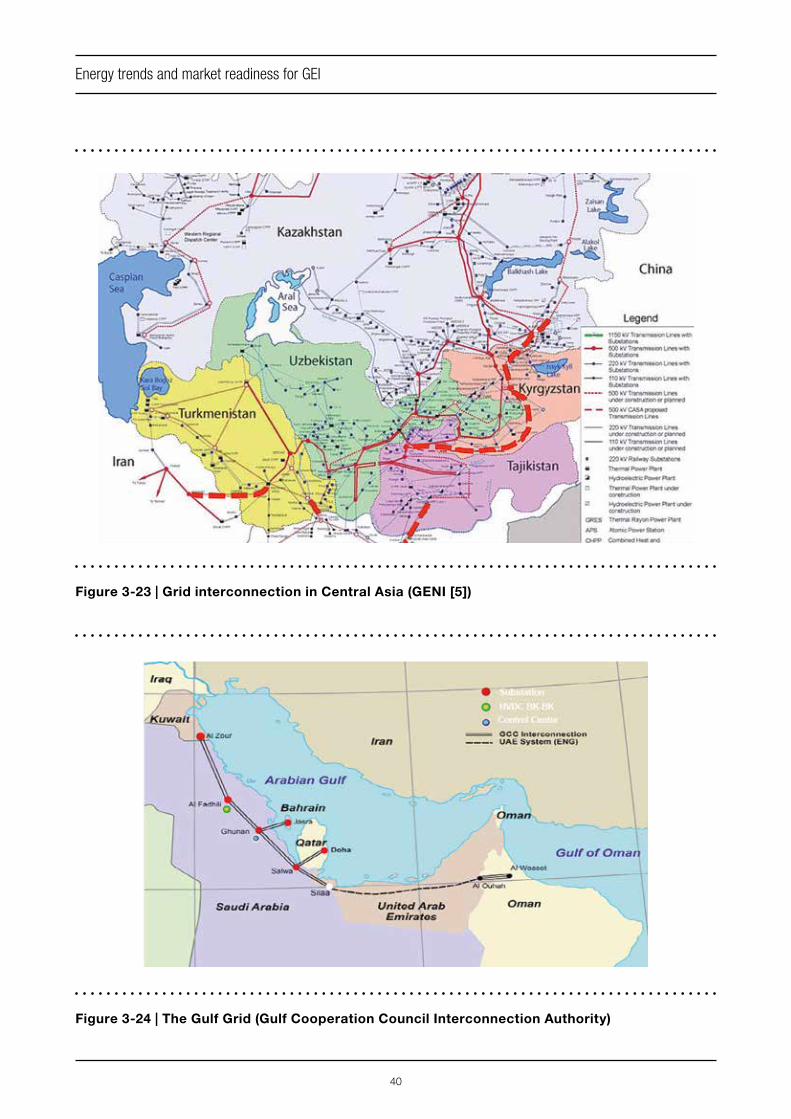
In Central Asia interconnections now exist between
Kazakhstan and Russia through three 500 kV AC
lines, one of them having been operated at the
ultra-high voltage of 1 150 kV. A 500 kV AC loop has
been formed between Kazakhstan, Kyrgyzstan,
Tajikistan and Uzbekistan. Turkmenistan is also
connected with Uzbekistan and Iran. A number of
39
Energy trends and market readiness for GEI
Figure 3-22 | Present and planned grid interconnection in Brazil (ONS [4])
500 kV links are under construction to enhance
grid interconnection among the five Central
Asian countries as well as Iran and Afghanistan.
Figure 3-23 shows the existing and planned
interconnection of Central Asian grids.
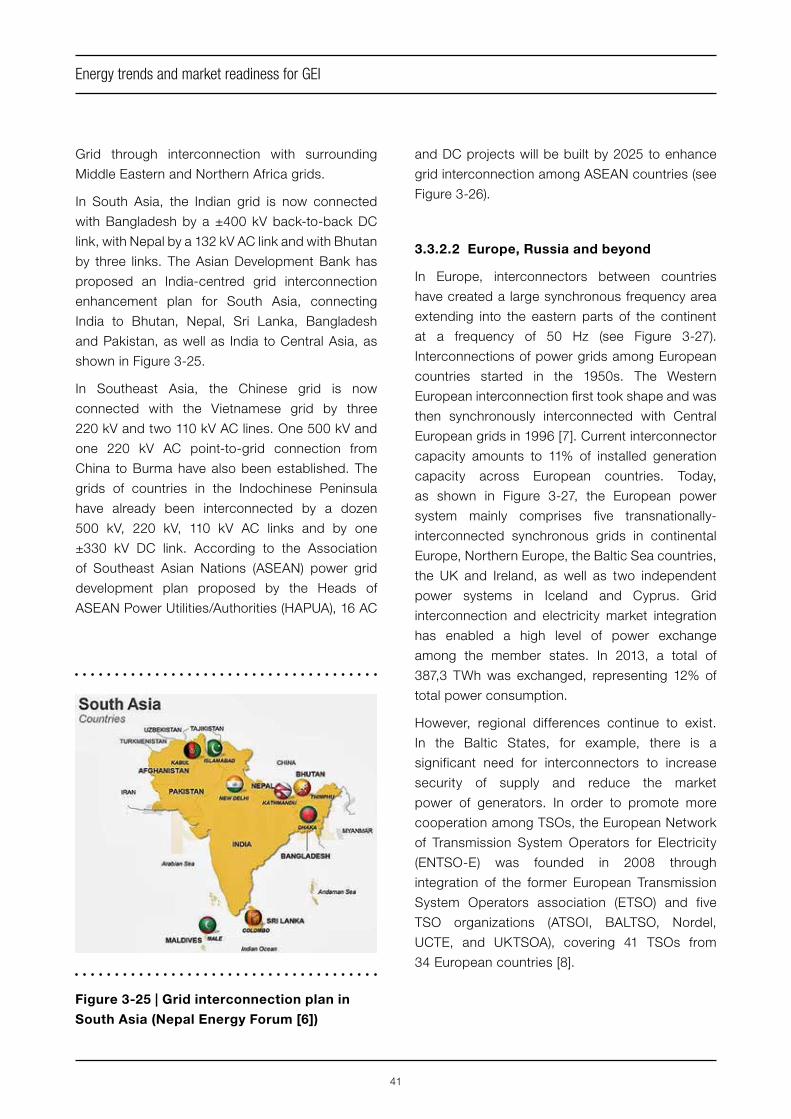
In West Asia, two synchronous grids have
been formed through transnational grid
interconnections. The first is the North Middle
East Peninsula and Iran grid, which consists of
the Iraq, Syria, Jordan, Lebanon and Iran grids,
connected by 400 kV and/or 220 kV AC lines. This
grid is also interconnected to the North with grids
of Turkey, Armenia and Azerbaijan, and to the
West with the grid of Egypt. The second is the Gulf
Grid, an interconnection between Saudi Arabia,
Kuwait, Bahrain, Qatar, the United Arab Emirates
and Oman (see Figure 3-24). In 2015, the Gulf
Cooperation Council proposed to enlarge the Gulf
40
Energy trends and market readiness for GEI
Figure 3-23 | Grid interconnection in Central Asia (GENI [5])
Figure 3-24 | The Gulf Grid (Gulf Cooperation Council Interconnection Authority)
41
Energy trends and market readiness for GEI
Grid through interconnection with surrounding
Middle Eastern and Northern Africa grids.
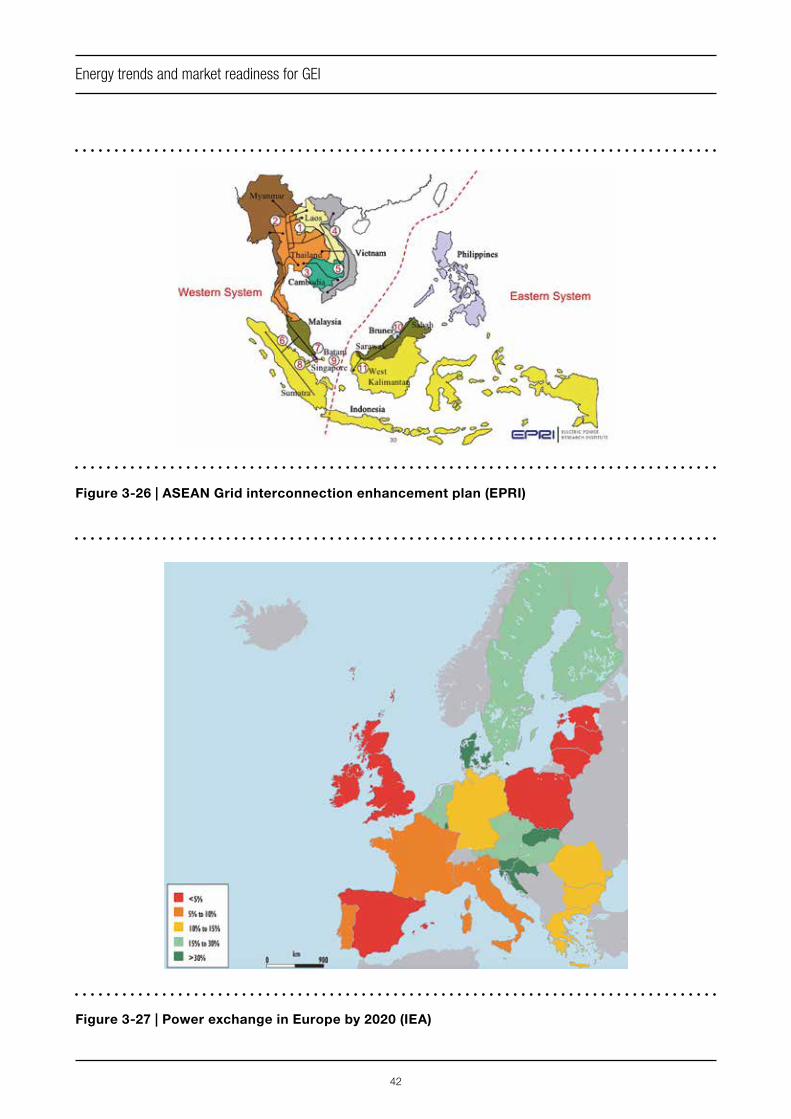
In South Asia, the Indian grid is now connected
with Bangladesh by a ±400 kV back-to-back DC
link, with Nepal by a 132 kV AC link and with Bhutan
by three links. The Asian Development Bank has
proposed an India-centred grid interconnection
enhancement plan for South Asia, connecting
India to Bhutan, Nepal, Sri Lanka, Bangladesh
and Pakistan, as well as India to Central Asia, as
shown in Figure 3-25.
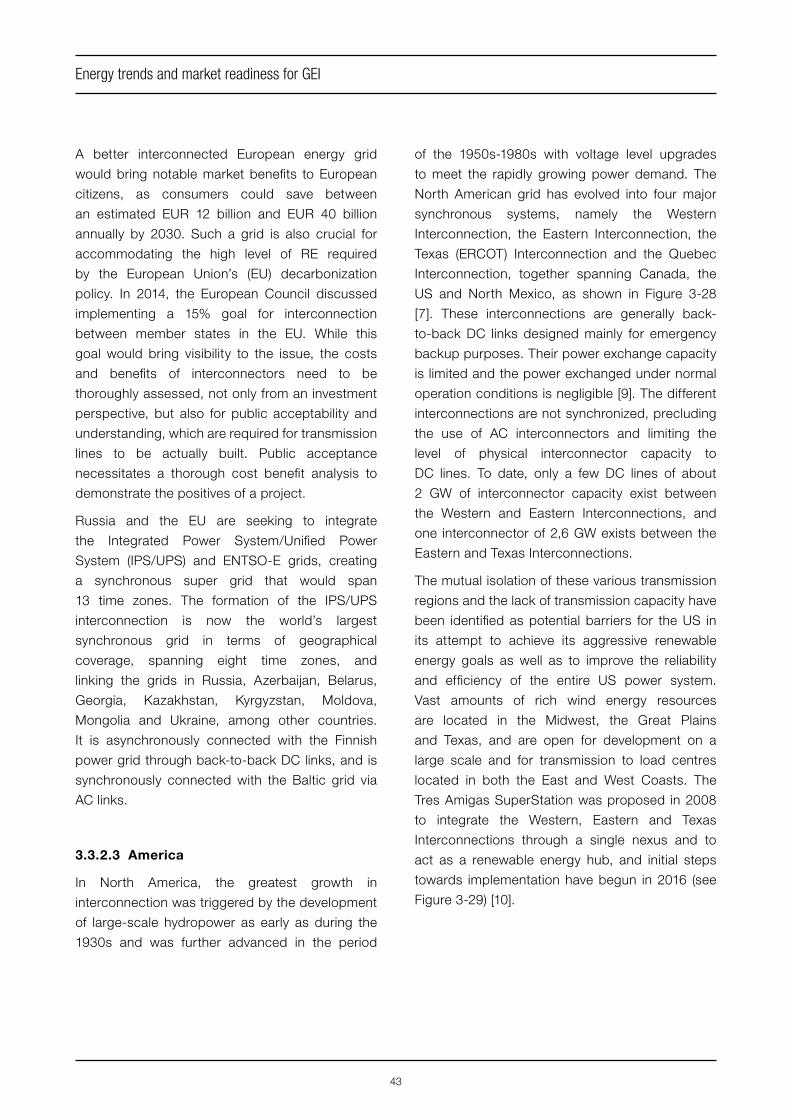
In Southeast Asia, the Chinese grid is now
connected with the Vietnamese grid by three
220 kV and two 110 kV AC lines. One 500 kV and
one 220 kV AC point-to-grid connection from
China to Burma have also been established. The
grids of countries in the Indochinese Peninsula
have already been interconnected by a dozen
500 kV, 220 kV, 110 kV AC links and by one
±330 kV DC link. According to the Association
of Southeast Asian Nations (ASEAN) power grid
development plan proposed by the Heads of
ASEAN Power Utilities/Authorities (HAPUA), 16 AC
and DC projects will be built by 2025 to enhance
grid interconnection among ASEAN countries (see
Figure 3-26).
3.3.2.2 Europe, Russia and beyond
In Europe, interconnectors between countries
have created a large synchronous frequency area
extending into the eastern parts of the continent
at a frequency of 50 Hz (see Figure 3-27).
Interconnections of power grids among European
countries started in the 1950s. The Western
European interconnection first took shape and was
then synchronously interconnected with Central
European grids in 1996 [7]. Current interconnector
capacity amounts to 11% of installed generation
capacity across European countries. Today,
as shown in Figure 3-27, the European power
system mainly comprises five transnationally-
interconnected synchronous grids in continental
Europe, Northern Europe, the Baltic Sea countries,
the UK and Ireland, as well as two independent
power systems in Iceland and Cyprus. Grid
interconnection and electricity market integration
has enabled a high level of power exchange
among the member states. In 2013, a total of
387,3 TWh was exchanged, representing 12% of
total power consumption.
However, regional differences continue to exist.
In the Baltic States, for example, there is a
significant need for interconnectors to increase
security of supply and reduce the market
power of generators. In order to promote more
cooperation among TSOs, the European Network
of Transmission System Operators for Electricity
(ENTSO-E) was founded in 2008 through
integration of the former European Transmission
System Operators association (ETSO) and five
TSO organizations (ATSOI, BALTSO, Nordel,
UCTE, and UKTSOA), covering 41 TSOs from
34 European countries [8].
Figure 3-25 | Grid interconnection plan in
South Asia (Nepal Energy Forum [6])
42
Energy trends and market readiness for GEI
Figure 3-26 | ASEAN Grid interconnection enhancement plan (EPRI)
Figure 3-27 | Power exchange in Europe by 2020 (IEA)
43
Energy trends and market readiness for GEI
A better interconnected European energy grid
would bring notable market benefits to European
citizens, as consumers could save between
an estimated EUR 12 billion and EUR 40 billion
annually by 2030. Such a grid is also crucial for
accommodating the high level of RE required
by the European Union’s (EU) decarbonization
policy. In 2014, the European Council discussed
implementing a 15% goal for interconnection
between member states in the EU. While this
goal would bring visibility to the issue, the costs
and benefits of interconnectors need to be
thoroughly assessed, not only from an investment
perspective, but also for public acceptability and
understanding, which are required for transmission
lines to be actually built. Public acceptance
necessitates a thorough cost benefit analysis to
demonstrate the positives of a project.
Russia and the EU are seeking to integrate
the Integrated Power System/Unified Power
System (IPS/UPS) and ENTSO-E grids, creating
a synchronous super grid that would span
13 time zones. The formation of the IPS/UPS
interconnection is now the world’s largest
synchronous grid in terms of geographical
coverage, spanning eight time zones, and
linking the grids in Russia, Azerbaijan, Belarus,
Georgia, Kazakhstan, Kyrgyzstan, Moldova,
Mongolia and Ukraine, among other countries.
It is asynchronously connected with the Finnish
power grid through back-to-back DC links, and is
synchronously connected with the Baltic grid via
AC links.
3.3.2.3 America
In North America, the greatest growth in
interconnection was triggered by the development
of large-scale hydropower as early as during the
1930s and was further advanced in the period
of the 1950s-1980s with voltage level upgrades
to meet the rapidly growing power demand. The
North American grid has evolved into four major
synchronous systems, namely the Western
Interconnection, the Eastern Interconnection, the
Texas (ERCOT) Interconnection and the Quebec
Interconnection, together spanning Canada, the
US and North Mexico, as shown in Figure 3-28
[7]. These interconnections are generally back-
to-back DC links designed mainly for emergency
backup purposes. Their power exchange capacity
is limited and the power exchanged under normal
operation conditions is negligible [9]. The different
interconnections are not synchronized, precluding
the use of AC interconnectors and limiting the
level of physical interconnector capacity to
DC lines. To date, only a few DC lines of about
2 GW of interconnector capacity exist between
the Western and Eastern Interconnections, and
one interconnector of 2,6 GW exists between the
Eastern and Texas Interconnections.
The mutual isolation of these various transmission
regions and the lack of transmission capacity have
been identified as potential barriers for the US in
its attempt to achieve its aggressive renewable
energy goals as well as to improve the reliability
and efficiency of the entire US power system.
Vast amounts of rich wind energy resources
are located in the Midwest, the Great Plains
and Texas, and are open for development on a
large scale and for transmission to load centres
located in both the East and West Coasts. The
Tres Amigas SuperStation was proposed in 2008
to integrate the Western, Eastern and Texas
Interconnections through a single nexus and to
act as a renewable energy hub, and initial steps
towards implementation have begun in 2016 (see
Figure 3-29) [10].
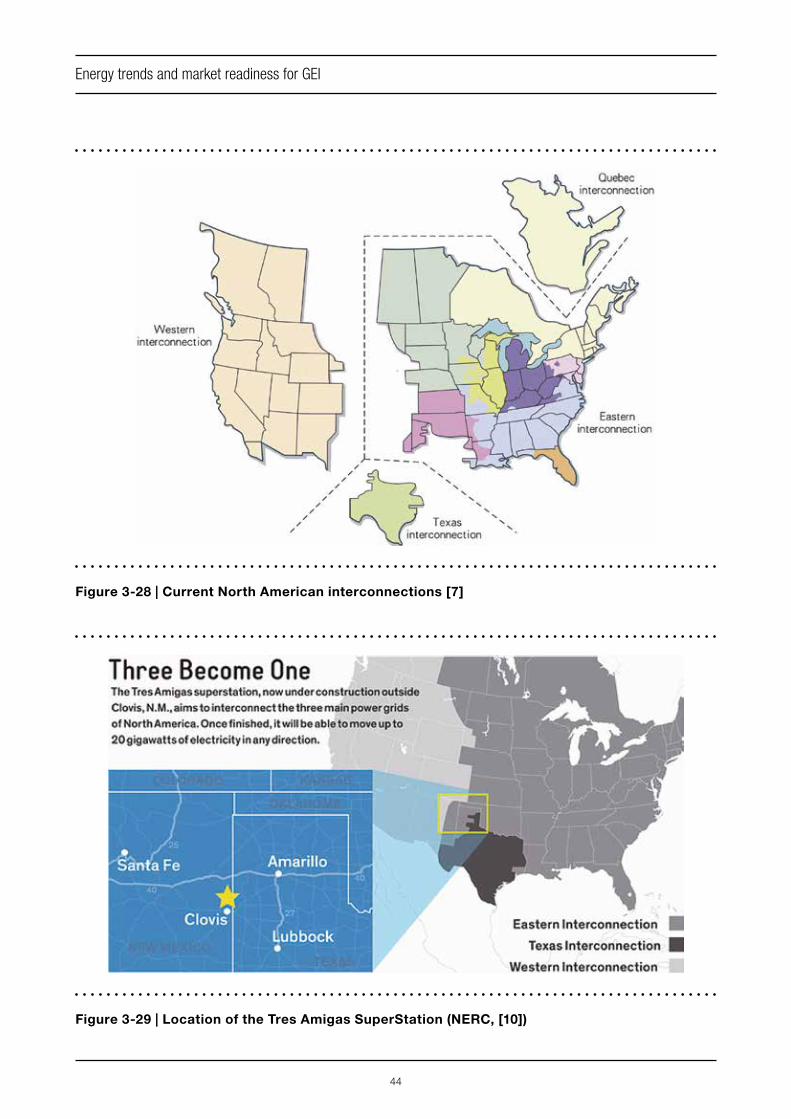
44
Energy trends and market readiness for GEI
Figure 3-28 | Current North American interconnections [7]
Figure 3-29 | Location of the Tres Amigas SuperStation (NERC, [10])
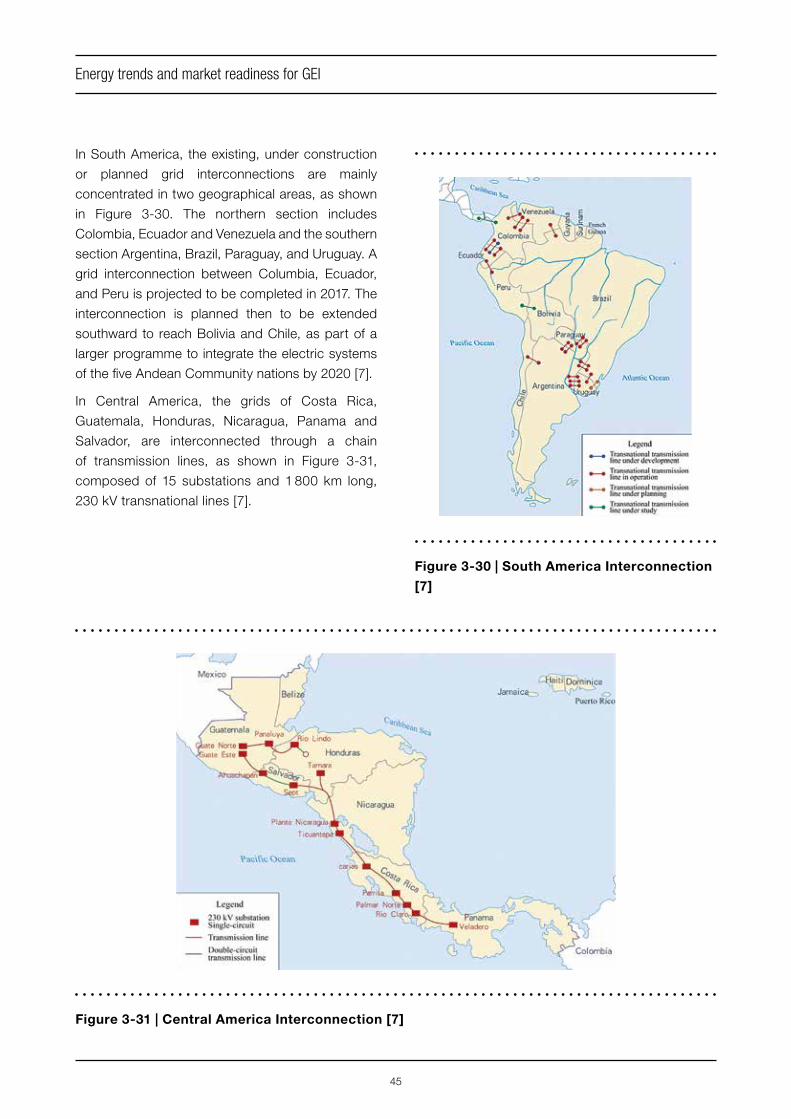
45
Energy trends and market readiness for GEI
In South America, the existing, under construction
or planned grid interconnections are mainly
concentrated in two geographical areas, as shown
in Figure 3-30. The northern section includes
Colombia, Ecuador and Venezuela and the southern
section Argentina, Brazil, Paraguay, and Uruguay. A
grid interconnection between Columbia, Ecuador,
and Peru is projected to be completed in 2017. The
interconnection is planned then to be extended
southward to reach Bolivia and Chile, as part of a
larger programme to integrate the electric systems
of the five Andean Community nations by 2020 [7].
In Central America, the grids of Costa Rica,
Guatemala, Honduras, Nicaragua, Panama and
Salvador, are interconnected through a chain
of transmission lines, as shown in Figure 3-31,
composed of 15 substations and 1 800 km long,
230 kV transnational lines [7].
Figure 3-30 | South America Interconnection
[7]
Figure 3-31 | Central America Interconnection [7]

46
Energy trends and market readiness for GEI
3.3.2.4 Africa
Since its inception in 1995, the Southern
African Power Pool (SAPP) has been actively
promoting transnational grid interconnections.
The alliance comprises 12 members, including
Angola, Botswana, the Democratic Republic of
Congo, Lesotho, Malawi, Mozambique, Namibia,
South Africa, Swaziland, Tanzania, Zambia, and
Zimbabwe. Nine of these countries, not including
Angola, Malawi and Tanzania, have developed
grid interconnections through 400 kV, 275 kV,
220 kV, and 132 kV AC links. Planned grid in-
terconnection projects in South Africa fall into
two main classes. One involves the interconnec-
tion among Angola, Malawi, Tanzania and oth-
er member countries. The other involves central
transmission channels, including a Zimbabwe–
Zambia–Botswana–Namibia interconnection, a
transmission corridor in central Zimbabwe, and
transmission projects in Zambia [7].
African countries are also planning to form a pan-
African power grid in 2020 by interconnecting the
Southern, Western, Central and Northern African
grids.
3.3.3 Transnational interconnection
initiatives
Adopting a longer-term perspective, transnational
power grid interconnection of larger areas has
been studied, with several initiatives created, pre-
feasibility studies carried out and specific plans
proposed. These include the European Super
Grid, the Desertec project, the Medgrid project,
and the Gobitec and Asian Super Grid projects.
Such projects would fall under the later stage of
the GEI concept.
3.3.3.1 The European Super Grid
A range of European super grids have been
assessed, generally including the interconnection
of European countries with neighbouring North
African and Middle Eastern countries and
eventually with Caspian countries through UHVDC
technology [11]. While a fully transparent cost-
benefit analysis showing the attractiveness of
such a grid relative to alternatives remains to be
carried out, it would allow at a high level for the
large-scale utilization of offshore wind power in
the coastal regions of Northern Europe and rich
amounts of solar resource in the South (where high
direct normal irradiance (DNI) could also allow for
the exploitation of CSP), as well as transmission
of power from these bases to load centres around
Europe using the rich hydro resources for system
balancing (see Figure 3-32).
3.3.3.2 The Desertec project
The focus of the Desertec project is on harnessing
solar power from the deserts of North Africa
and the Middle East to provide these regions
with both clean power and fresh water through
sea water desalination, and to eventually export
large volumes of electricity to Europe (see
Figure 3-33). While renewed interest in the project
has recently resurfaced, desert power remains in
its infancy.
3.3.3.3 The Medgrid project
The Medgrid project was launched in 2010
by a Consortium of more than 20 utilities,
manufacturers and investors, largely from
European and North African countries circling
the Mediterranean Sea. Medgrid’s objective is
the development of 20 GW of renewable energy,
largely from solar power, with 5 GW dedicated to
exporting power to Europe. Although the Medgrid
Consortium ceased operation in January 2016, a
number of grid interconnection planning studies
had been conducted, including the design of
three transmission corridors between North Africa
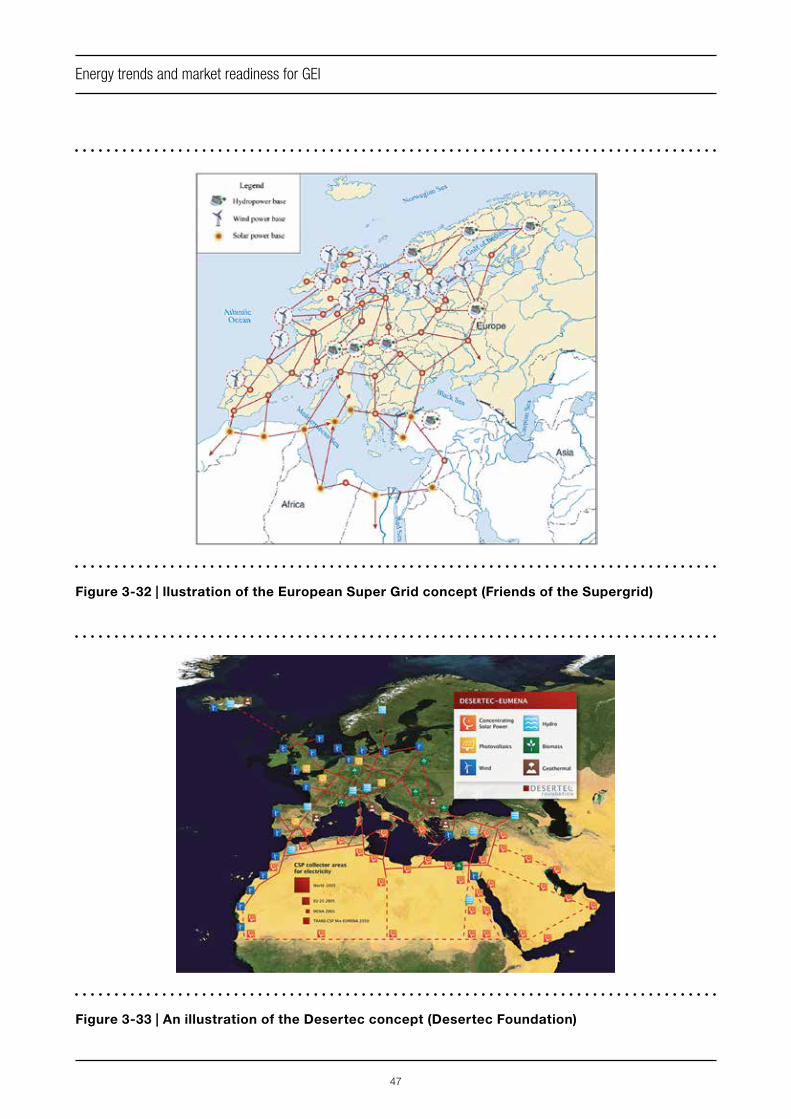
47
Energy trends and market readiness for GEI
Figure 3-32 | llustration of the European Super Grid concept (Friends of the Supergrid)
Figure 3-33 | An illustration of the Desertec concept (Desertec Foundation)
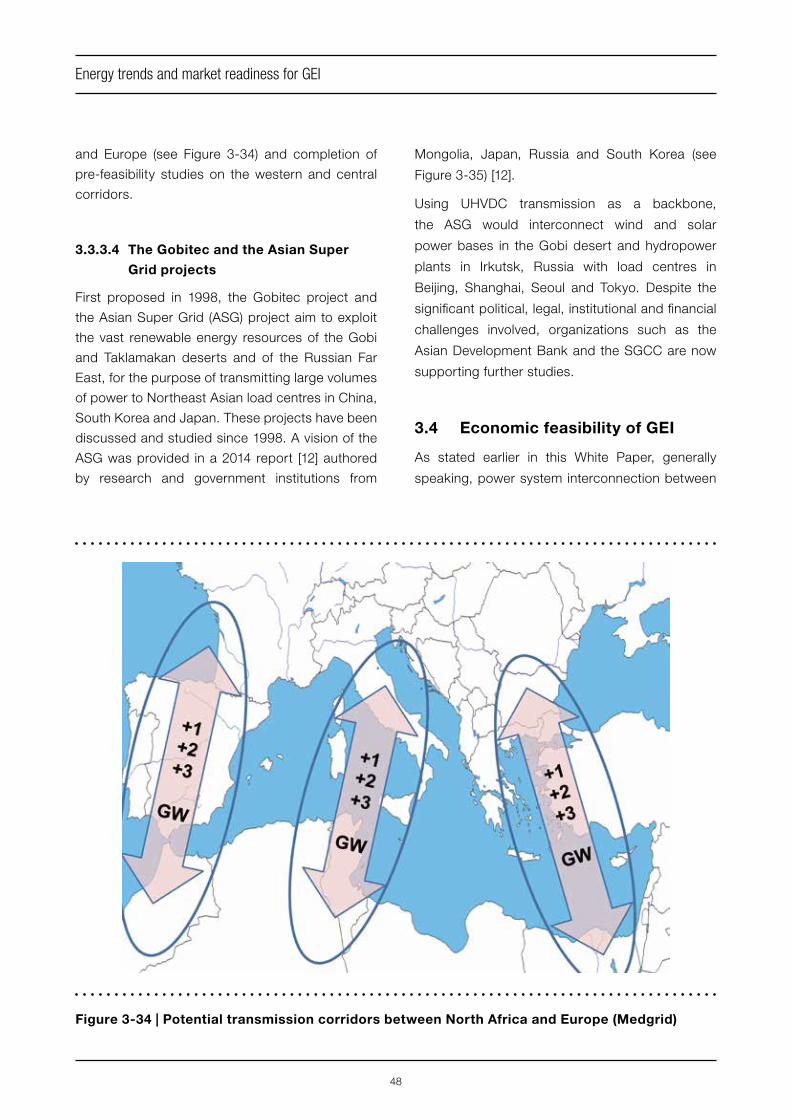
48
Energy trends and market readiness for GEI
and Europe (see Figure 3-34) and completion of
pre-feasibility studies on the western and central
corridors.
3.3.3.4 The Gobitec and the Asian Super
Grid projects
First proposed in 1998, the Gobitec project and
the Asian Super Grid (ASG) project aim to exploit
the vast renewable energy resources of the Gobi
and Taklamakan deserts and of the Russian Far
East, for the purpose of transmitting large volumes
of power to Northeast Asian load centres in China,
South Korea and Japan. These projects have been
discussed and studied since 1998. A vision of the
ASG was provided in a 2014 report [12] authored
by research and government institutions from
Figure 3-34 | Potential transmission corridors between North Africa and Europe (Medgrid)
Mongolia, Japan, Russia and South Korea (see
Figure 3-35) [12].
Using UHVDC transmission as a backbone,
the ASG would interconnect wind and solar
power bases in the Gobi desert and hydropower
plants in Irkutsk, Russia with load centres in
Beijing, Shanghai, Seoul and Tokyo. Despite the
significant political, legal, institutional and financial
challenges involved, organizations such as the
Asian Development Bank and the SGCC are now
supporting further studies.
3.4 Economic feasibility of GEI
As stated earlier in this White Paper, generally
speaking, power system interconnection between
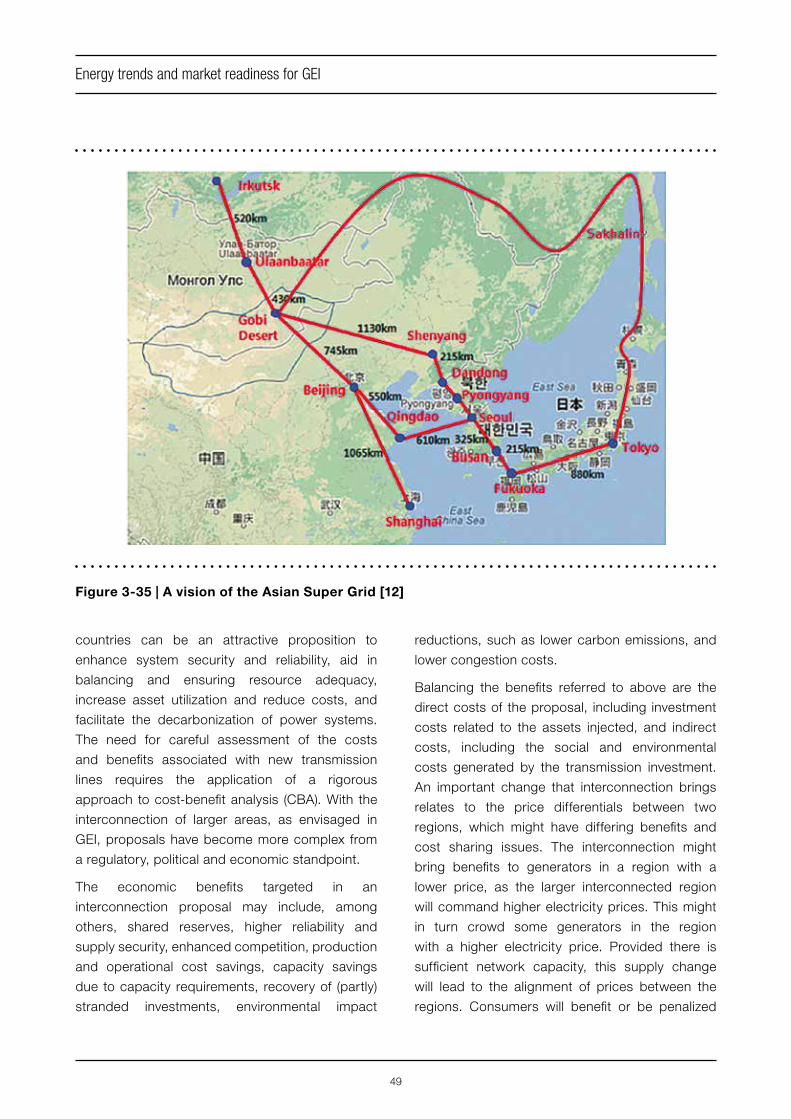
49
Energy trends and market readiness for GEI
countries can be an attractive proposition to
enhance system security and reliability, aid in
balancing and ensuring resource adequacy,
increase asset utilization and reduce costs, and
facilitate the decarbonization of power systems.
The need for careful assessment of the costs
and benefits associated with new transmission
lines requires the application of a rigorous
approach to cost-benefit analysis (CBA). With the
interconnection of larger areas, as envisaged in
GEI, proposals have become more complex from
a regulatory, political and economic standpoint.
The economic benefits targeted in an
interconnection proposal may include, among
others, shared reserves, higher reliability and
supply security, enhanced competition, production
and operational cost savings, capacity savings
due to capacity requirements, recovery of (partly)
stranded investments, environmental impact
Figure 3-35 | A vision of the Asian Super Grid [12]
reductions, such as lower carbon emissions, and
lower congestion costs.
Balancing the benefits referred to above are the
direct costs of the proposal, including investment
costs related to the assets injected, and indirect
costs, including the social and environmental
costs generated by the transmission investment.
An important change that interconnection brings
relates to the price differentials between two
regions, which might have differing benefits and
cost sharing issues. The interconnection might
bring benefits to generators in a region with a
lower price, as the larger interconnected region
will command higher electricity prices. This might
in turn crowd some generators in the region
with a higher electricity price. Provided there is
sufficient network capacity, this supply change
will lead to the alignment of prices between the
regions. Consumers will benefit or be penalized
50
Energy trends and market readiness for GEI
accordingly, in the opposite direction. Ultimately,
only when the benefits accrued by realizing
the interconnection outweigh the costs will the
undertaking be economically justified.
Two principles are fundamental for new network
investments:
§ Net benefit assessments, comprising both
benefits and costs, should generally recognize
full-scale market impacts of new investments
§ Ex ante investment cost allocation commen-
surate with identified beneficiaries can mitigate
financing uncertainties and enhance project
acceptance
The inclusion of CBA in the planning framework
can facilitate transparency and consultation
among all market players, which is likely to
result in mutually acceptable assumptions on
important factors that trigger future costs and
benefits. The coordinated development of such
assumptions on future conditions is essential,
as any investment planning can only be based
upon expected developments. Such assumptions
should also be accompanied by risk assessments,
as uncertainties in the assumptions can alter
benefits. Risks can generally be regarded as
price risks and/or quantity risks for all relevant
assumptions such as demand, fuel sources or
supply capacities. The projection of benefits into
the distant future increases the level of uncertainty,
as is the case with GEI. Applying such a long-term
planning time frame over such large areas will
inevitably increase planning uncertainties, creating
the risk of under- or overestimated benefits. The
inclusion of adequate measures to assess long-
term benefits and risks in economic planning
principles is necessary.
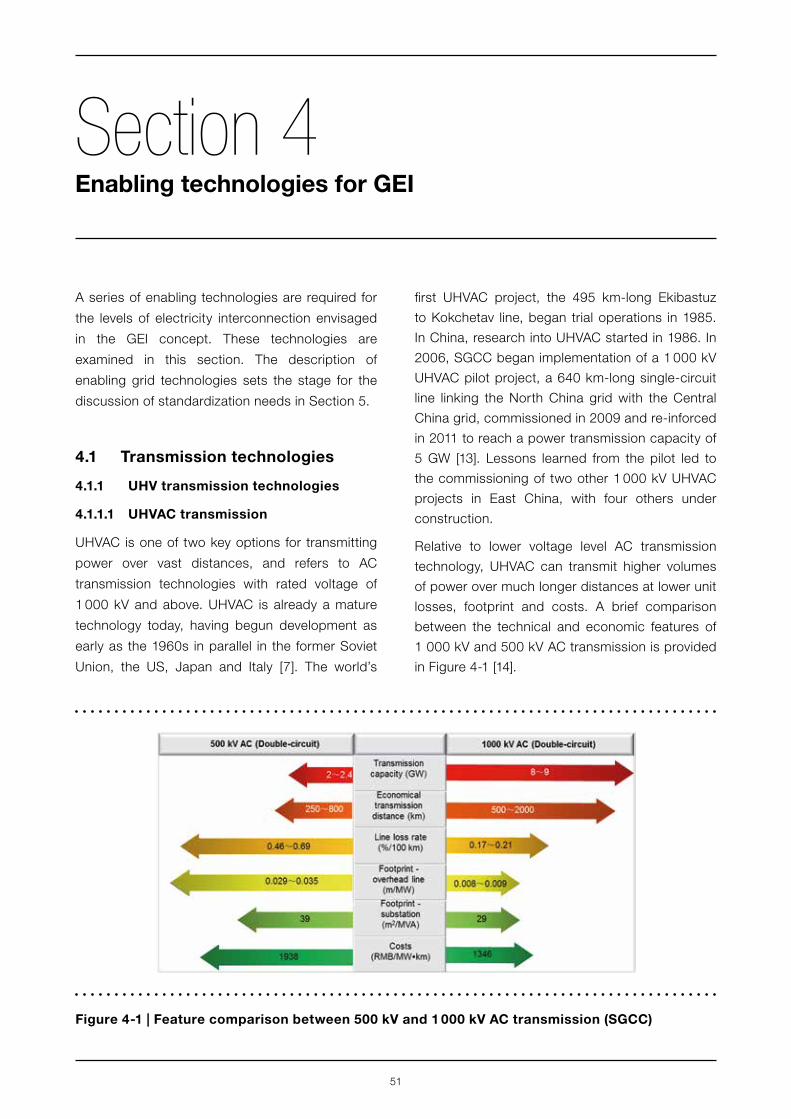
51
Section 4Enabling technologies for GEI
A series of enabling technologies are required for
the levels of electricity interconnection envisaged
in the GEI concept. These technologies are
examined in this section. The description of
enabling grid technologies sets the stage for the
discussion of standardization needs in Section 5.
4.1 Transmission technologies
4.1.1 UHV transmission technologies
4.1.1.1 UHVAC transmission
UHVAC is one of two key options for transmitting
power over vast distances, and refers to AC
transmission technologies with rated voltage of
1 000 kV and above. UHVAC is already a mature
technology today, having begun development as
early as the 1960s in parallel in the former Soviet
Union, the US, Japan and Italy [7]. The world’s
first UHVAC project, the 495 km-long Ekibastuz
to Kokchetav line, began trial operations in 1985.
In China, research into UHVAC started in 1986. In
2006, SGCC began implementation of a 1 000 kV
UHVAC pilot project, a 640 km-long single-circuit
line linking the North China grid with the Central
China grid, commissioned in 2009 and re-inforced
in 2011 to reach a power transmission capacity of
5 GW [13]. Lessons learned from the pilot led to
the commissioning of two other 1 000 kV UHVAC
projects in East China, with four others under
construction.
Relative to lower voltage level AC transmission
technology, UHVAC can transmit higher volumes
of power over much longer distances at lower unit
losses, footprint and costs. A brief comparison
between the technical and economic features of
1 000 kV and 500 kV AC transmission is provided
in Figure 4-1 [14].
Figure 4-1 | Feature comparison between 500 kV and 1 000 kV AC transmission (SGCC)
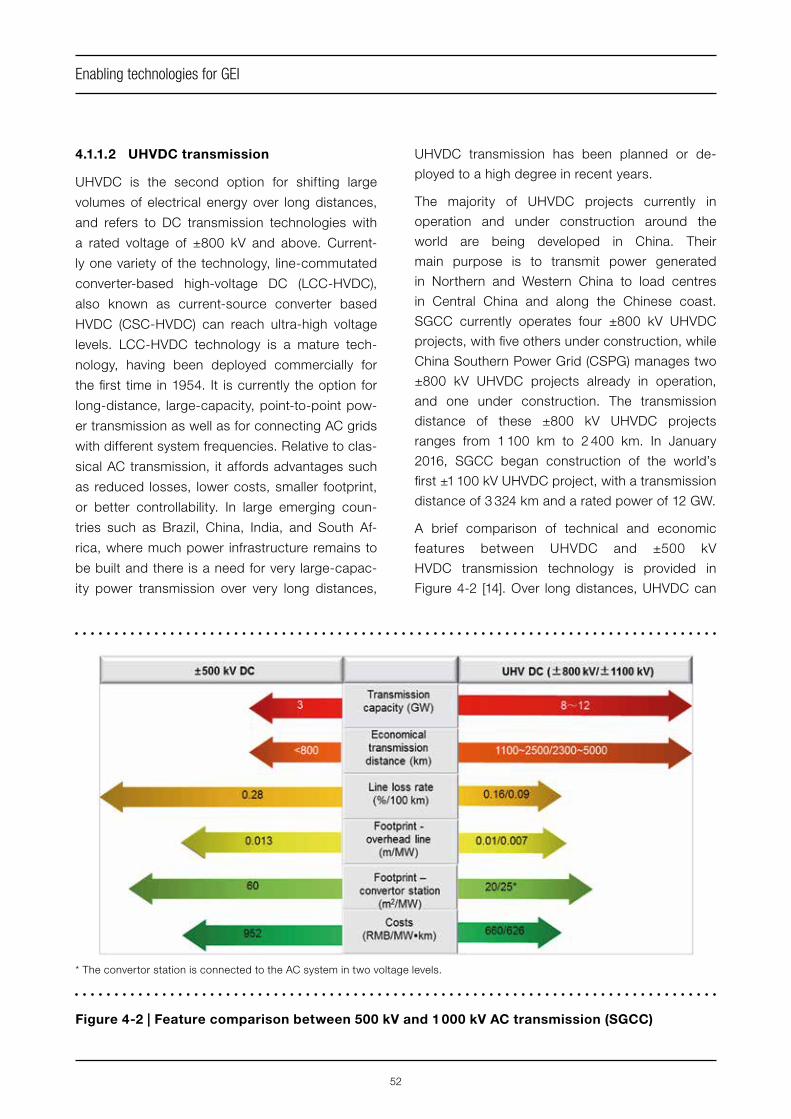
52
Enabling technologies for GEI
4.1.1.2 UHVDC transmission
UHVDC is the second option for shifting large
volumes of electrical energy over long distances,
and refers to DC transmission technologies with
a rated voltage of ±800 kV and above. Current-
ly one variety of the technology, line-commutated
converter-based high-voltage DC (LCC-HVDC),
also known as current-source converter based
HVDC (CSC-HVDC) can reach ultra-high voltage
levels. LCC-HVDC technology is a mature tech-
nology, having been deployed commercially for
the first time in 1954. It is currently the option for
long-distance, large-capacity, point-to-point pow-
er transmission as well as for connecting AC grids
with different system frequencies. Relative to clas-
sical AC transmission, it affords advantages such
as reduced losses, lower costs, smaller footprint,
or better controllability. In large emerging coun-
tries such as Brazil, China, India, and South Af-
rica, where much power infrastructure remains to
be built and there is a need for very large-capac-
ity power transmission over very long distances,
UHVDC transmission has been planned or de-
ployed to a high degree in recent years.
The majority of UHVDC projects currently in
operation and under construction around the
world are being developed in China. Their
main purpose is to transmit power generated
in Northern and Western China to load centres
in Central China and along the Chinese coast.
SGCC currently operates four ±800 kV UHVDC
projects, with five others under construction, while
China Southern Power Grid (CSPG) manages two
±800 kV UHVDC projects already in operation,
and one under construction. The transmission
distance of these ±800 kV UHVDC projects
ranges from 1 100 km to 2 400 km. In January
2016, SGCC began construction of the world’s
first ±1 100 kV UHVDC project, with a transmission
distance of 3 324 km and a rated power of 12 GW.
A brief comparison of technical and economic
features between UHVDC and ±500 kV
HVDC transmission technology is provided in
Figure 4-2 [14]. Over long distances, UHVDC can
Figure 4-2 | Feature comparison between 500 kV and 1 000 kV AC transmission (SGCC)
* The convertor station is connected to the AC system in two voltage levels.

53
Enabling technologies for GEI
transmit much larger amounts of power at lower
transmission losses, with reduced footprint and
costs, when compared to lower voltage HVDC.
Crucially, with current ±800 kV and ±1 100 kV
UHVDC technology, transmitting power can
become economical at distances of 2 500 km and
5 000 km respectively.
4.1.1.3 UHV transmission for GEI
Current UHV transmission technology can already
be deployed to build the backbone grids for large-
scale interconnected regional and transnational
power grids, and eventually for GEI. As portrayed
in Table 4-1 [7], distances between some major
global energy bases and load centres range from
2 000 km to ~5 000 km, within the transmission
distance that can be economically feasible
for UHV. UHVAC or UHVDC assets at different
voltages could be deployed for different purposes
and different transmission distances. For example,
UHVAC grids would preferably be used to collect
power on the supply side, or to deliver power on
the demand side, while UHVDC could be used
for point-to-point power transmission. Beyond
the 5 000 km mark, power could potentially be
transmitted using ±1 500 kV UHVDC technology,
currently in the demonstration phase.
4.1.2 Flexible AC/DC transmission
4.1.2.1 Flexible AC transmission
Based on advanced, large-capacity power elec-
tronics components and innovative control strat-
egies, various flexible AC transmission systems
(FACTSs) have been developed since the 1990s.
These have greatly improved the controllability,
flexibility, stability and capacity of AC transmis-
sion. FACTS are also helpful in variable RE integra-
tion for voltage and power flow control.
4.1.2.2 VSC HVDC and HVDC grids
Voltage-source converter-based HVDC (VSC-
HVDC) and HVDC grids are a fundamental com-
ponent of modern power system interconnections,
and would form a key pillar of future regional and
transnational grids. Unlike conventional LCC-
HVDC (CSC-HVDC), which uses semi-controlla-
ble valves, VSC-HVDC, a newer alternative first
commercialized in 1997 [15], uses fully controllable
valves. Compared to LCC-HVDC, these character-
istics offer the following advantages:
§ VSC-HVDC permits quick control of both
active and reactive power independently, and
even black starts. Therefore it does not rely on
From To Distance (km)
Arctic Kara Sea (wind power) North China 4 400
Bering Strait (wind power) N. China, Japan, S. Korea 5 000
Bering Strait (wind power) West US 4 000
Arctic Greenland (wind power) North UK 2 100
Arctic Greenland (wind power) Quebec Canada 2 000
North Africa (solar power) Europe <2 000
Middle East (solar power) West India 4 000
Table 4-1 | Distance from selected major renewable resource bases to load centres [7]
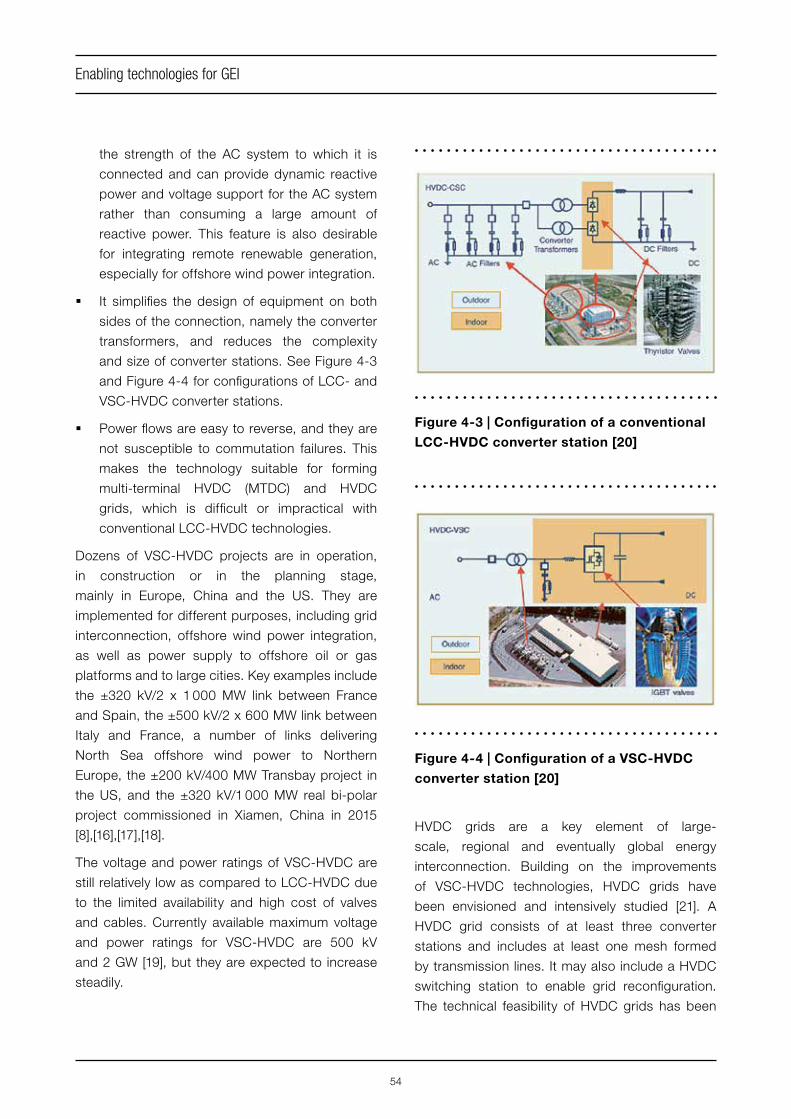
54
Enabling technologies for GEI
the strength of the AC system to which it is
connected and can provide dynamic reactive
power and voltage support for the AC system
rather than consuming a large amount of
reactive power. This feature is also desirable
for integrating remote renewable generation,
especially for offshore wind power integration.
§ It simplifies the design of equipment on both
sides of the connection, namely the converter
transformers, and reduces the complexity
and size of converter stations. See Figure 4-3
and Figure 4-4 for configurations of LCC- and
VSC-HVDC converter stations.
§ Power flows are easy to reverse, and they are
not susceptible to commutation failures. This
makes the technology suitable for forming
multi-terminal HVDC (MTDC) and HVDC
grids, which is difficult or impractical with
conventional LCC-HVDC technologies.
Dozens of VSC-HVDC projects are in operation,
in construction or in the planning stage,
mainly in Europe, China and the US. They are
implemented for different purposes, including grid
interconnection, offshore wind power integration,
as well as power supply to offshore oil or gas
platforms and to large cities. Key examples include
the ±320 kV/2 x 1 000 MW link between France
and Spain, the ±500 kV/2 x 600 MW link between
Italy and France, a number of links delivering
North Sea offshore wind power to Northern
Europe, the ±200 kV/400 MW Transbay project in
the US, and the ±320 kV/1 000 MW real bi-polar
project commissioned in Xiamen, China in 2015
[8],[16],[17],[18].
The voltage and power ratings of VSC-HVDC are
still relatively low as compared to LCC-HVDC due
to the limited availability and high cost of valves
and cables. Currently available maximum voltage
and power ratings for VSC-HVDC are 500 kV
and 2 GW [19], but they are expected to increase
steadily.
HVDC grids are a key element of large-
scale, regional and eventually global energy
interconnection. Building on the improvements
of VSC-HVDC technologies, HVDC grids have
been envisioned and intensively studied [21]. A
HVDC grid consists of at least three converter
stations and includes at least one mesh formed
by transmission lines. It may also include a HVDC
switching station to enable grid reconfiguration.
The technical feasibility of HVDC grids has been
Figure 4-3 | Configuration of a conventional
LCC-HVDC converter station [20]
Figure 4-4 | Configuration of a VSC-HVDC
converter station [20]

55
Enabling technologies for GEI
established, although challenges remain, including
adequate protection, control and grid simulation,
and may be in many cases more cost-effective
than point-to-point HVDC schemes for integrating
disperse variable RE sources. In practice, HVDC
grids can be formed by gradually expanding
MTDC schemes, i.e. HVDC schemes with more
than two converters connected together [17].
In Europe, the Super Grid, Desertec and Medgrid
concepts and initiatives proposed for integrating
North Sea offshore wind power and North African
and Mediterranean solar power into the European
grids, all rely on the implementation of HVDC
grids. In the US, a submarine interconnector
from New Jersey to Maryland and Delaware
connecting multiple offshore wind farms has also
been proposed [17]. Finally, in China the world’s
first and second VSC-MTDC projects have
been commissioned, namely the three-terminal
Nan’ao offshore wind power integration project
commissioned in 2013 in the Southern coastal
Guangdong Province [22], and the 5-terminal
Zhoushan Islands interconnection project (see
Figure 4-5) commissioned in 2014 in the Eastern
coastal Zhejiang Province [23]. HVDC grids for
Figure 4-5 | Configuration of the Zhoushan MTDC [23]
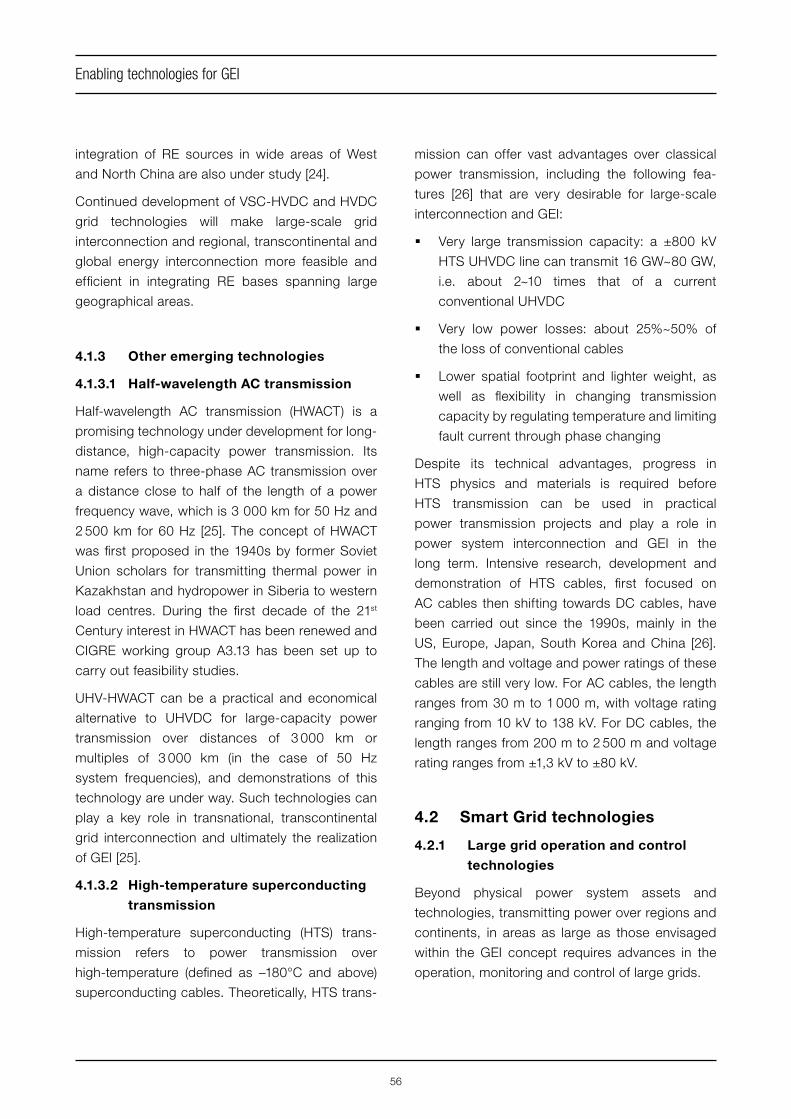
56
Enabling technologies for GEI
integration of RE sources in wide areas of West
and North China are also under study [24].
Continued development of VSC-HVDC and HVDC
grid technologies will make large-scale grid
interconnection and regional, transcontinental and
global energy interconnection more feasible and
efficient in integrating RE bases spanning large
geographical areas.
4.1.3 Other emerging technologies
4.1.3.1 Half-wavelength AC transmission
Half-wavelength AC transmission (HWACT) is a
promising technology under development for long-
distance, high-capacity power transmission. Its
name refers to three-phase AC transmission over
a distance close to half of the length of a power
frequency wave, which is 3 000 km for 50 Hz and
2 500 km for 60 Hz [25]. The concept of HWACT
was first proposed in the 1940s by former Soviet
Union scholars for transmitting thermal power in
Kazakhstan and hydropower in Siberia to western
load centres. During the first decade of the 21st
Century interest in HWACT has been renewed and
CIGRE working group A3.13 has been set up to
carry out feasibility studies.
UHV-HWACT can be a practical and economical
alternative to UHVDC for large-capacity power
transmission over distances of 3 000 km or
multiples of 3 000 km (in the case of 50 Hz
system frequencies), and demonstrations of this
technology are under way. Such technologies can
play a key role in transnational, transcontinental
grid interconnection and ultimately the realization
of GEI [25].
4.1.3.2 High-temperature superconducting
transmission
High-temperature superconducting (HTS) trans-
mission refers to power transmission over
high-temperature (defined as –180°C and above)
superconducting cables. Theoretically, HTS trans-
mission can offer vast advantages over classical
power transmission, including the following fea-
tures [26] that are very desirable for large-scale
interconnection and GEI:
§ Very large transmission capacity: a ±800 kV
HTS UHVDC line can transmit 16 GW~80 GW,
i.e. about 2~10 times that of a current
conventional UHVDC
§ Very low power losses: about 25%~50% of
the loss of conventional cables
§ Lower spatial footprint and lighter weight, as
well as flexibility in changing transmission
capacity by regulating temperature and limiting
fault current through phase changing
Despite its technical advantages, progress in
HTS physics and materials is required before
HTS transmission can be used in practical
power transmission projects and play a role in
power system interconnection and GEI in the
long term. Intensive research, development and
demonstration of HTS cables, first focused on
AC cables then shifting towards DC cables, have
been carried out since the 1990s, mainly in the
US, Europe, Japan, South Korea and China [26].
The length and voltage and power ratings of these
cables are still very low. For AC cables, the length
ranges from 30 m to 1 000 m, with voltage rating
ranging from 10 kV to 138 kV. For DC cables, the
length ranges from 200 m to 2 500 m and voltage
rating ranges from ±1,3 kV to ±80 kV.
4.2 Smart Grid technologies
4.2.1 Large grid operation and control
technologies
Beyond physical power system assets and
technologies, transmitting power over regions and
continents, in areas as large as those envisaged
within the GEI concept requires advances in the
operation, monitoring and control of large grids.

57
Enabling technologies for GEI
4.2.1.1 Control and protection of large-
scale grids
Traditionally, power system monitoring and control
has been mainly based on supervisory control
and data acquisition/energy management system
(SCADA/EMS) systems and protection has relied
on local measurements to detect faults and
abnormal states. SCADA/EMS systems allow
measurements of voltage, frequency, power and
status of circuit breakers/switches to be collected
by field terminal units (FTUs) and sent to control
centres, where the necessary technical properties
can be calculated through state estimation. A
major drawback of SCADA/EMS systems is that
the gathered data is not time-synchronized,
meaning that state estimations may differ between
measurements.
Supported by satellite navigation systems,
phasor measurement units (PMUs) can directly
record timely synchronized voltage magnitudes
and phase angle measurements of buses and
send them to control centres, which enables
the transition from “state estimation” to “state
measurements” [27]. Many applications have been
developed based on PMU networks, which are
called wide area monitoring systems (WAMSs)
[28], including wide-area visualization, oscillation
detection and damping control, generator model
and parameter validation, island detection, voltage
instability monitoring, post-event analysis, or
wide-area protection, among others applications,
which have significantly improved the control
and protection level of large grids. Future
PMU/WAMS application trends include developing
high-precision PMUs, switching from offline
to online and from monitoring to control, and
combining PMU/WAMS technology with big data
technology [29]. In the context of GEI, PMU/WAMS
technology is expected to play a fundamental role
(see Figure 4-6).
Based on technology innovations such as online
fault monitoring and diagnosis, new types of relay
protection and wide-area backup protection,
fault recovery strategy optimization and smart
reconfiguration, power grids of the future could
possess a strong security, stability and self-
recovery capability in the face of different operating
Figure 4-6 | Illustration of a PMU/WAMS system
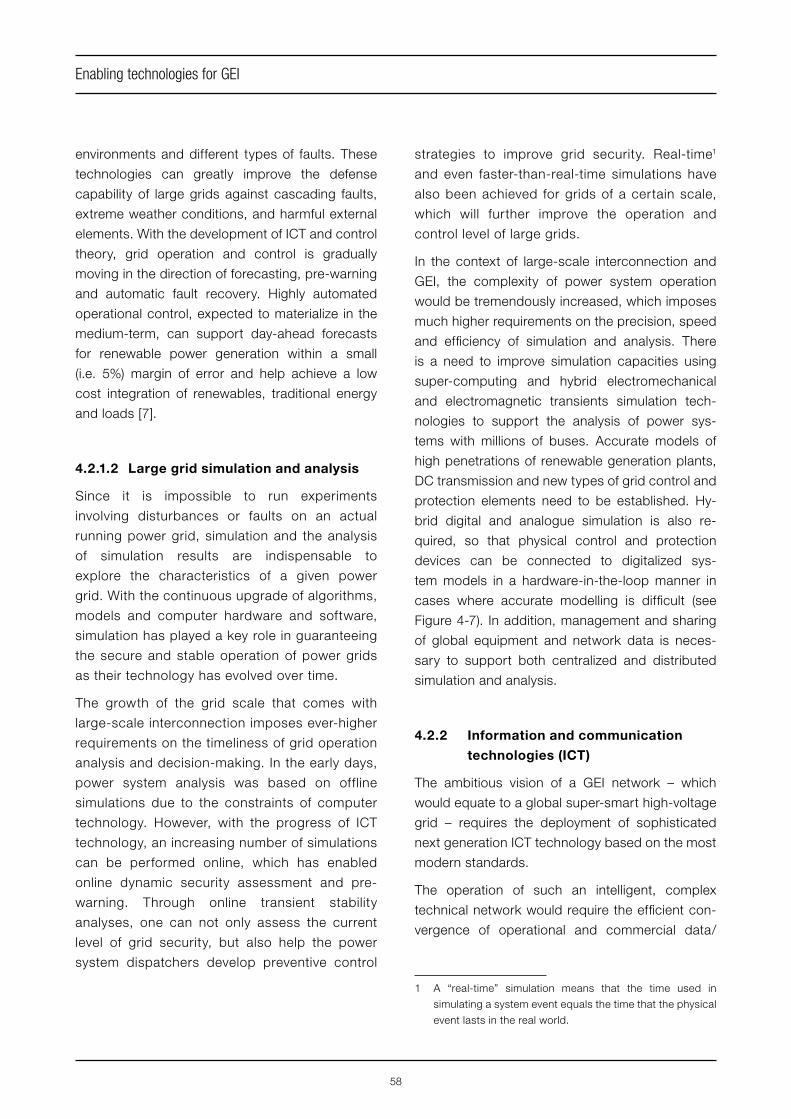
58
Enabling technologies for GEI
environments and different types of faults. These
technologies can greatly improve the defense
capability of large grids against cascading faults,
extreme weather conditions, and harmful external
elements. With the development of ICT and control
theory, grid operation and control is gradually
moving in the direction of forecasting, pre-warning
and automatic fault recovery. Highly automated
operational control, expected to materialize in the
medium-term, can support day-ahead forecasts
for renewable power generation within a small
(i.e. 5%) margin of error and help achieve a low
cost integration of renewables, traditional energy
and loads [7].
4.2.1.2 Large grid simulation and analysis
Since it is impossible to run experiments
involving disturbances or faults on an actual
running power grid, simulation and the analysis
of simulation results are indispensable to
explore the characteristics of a given power
grid. With the continuous upgrade of algorithms,
models and computer hardware and software,
simulation has played a key role in guaranteeing
the secure and stable operation of power grids
as their technology has evolved over time.
The growth of the grid scale that comes with
large-scale interconnection imposes ever-higher
requirements on the timeliness of grid operation
analysis and decision-making. In the early days,
power system analysis was based on offline
simulations due to the constraints of computer
technology. However, with the progress of ICT
technology, an increasing number of simulations
can be performed online, which has enabled
online dynamic security assessment and pre-
warning. Through online transient stability
analyses, one can not only assess the current
level of grid security, but also help the power
system dispatchers develop preventive control
strategies to improve grid security. Real-time1
and even faster-than-real-time simulations have
also been achieved for grids of a certain scale,
which will further improve the operation and
control level of large grids.
In the context of large-scale interconnection and
GEI, the complexity of power system operation
would be tremendously increased, which imposes
much higher requirements on the precision, speed
and efficiency of simulation and analysis. There
is a need to improve simulation capacities using
super-computing and hybrid electromechanical
and electromagnetic transients simulation tech-
nologies to support the analysis of power sys-
tems with millions of buses. Accurate models of
high penetrations of renewable generation plants,
DC transmission and new types of grid control and
protection elements need to be established. Hy-
brid digital and analogue simulation is also re-
quired, so that physical control and protection
devices can be connected to digitalized sys-
tem models in a hardware-in-the-loop manner in
cases where accurate modelling is difficult (see
Figure 4-7). In addition, management and sharing
of global equipment and network data is neces-
sary to support both centralized and distributed
simulation and analysis.
4.2.2 Information and communication
technologies (ICT)
The ambitious vision of a GEI network – which
would equate to a global super-smart high-voltage
grid – requires the deployment of sophisticated
next generation ICT technology based on the most
modern standards.
The operation of such an intelligent, complex
technical network would require the efficient con-
vergence of operational and commercial data/
1 A “real-time” simulation means that the time used in
simulating a system event equals the time that the physical
event lasts in the real world.
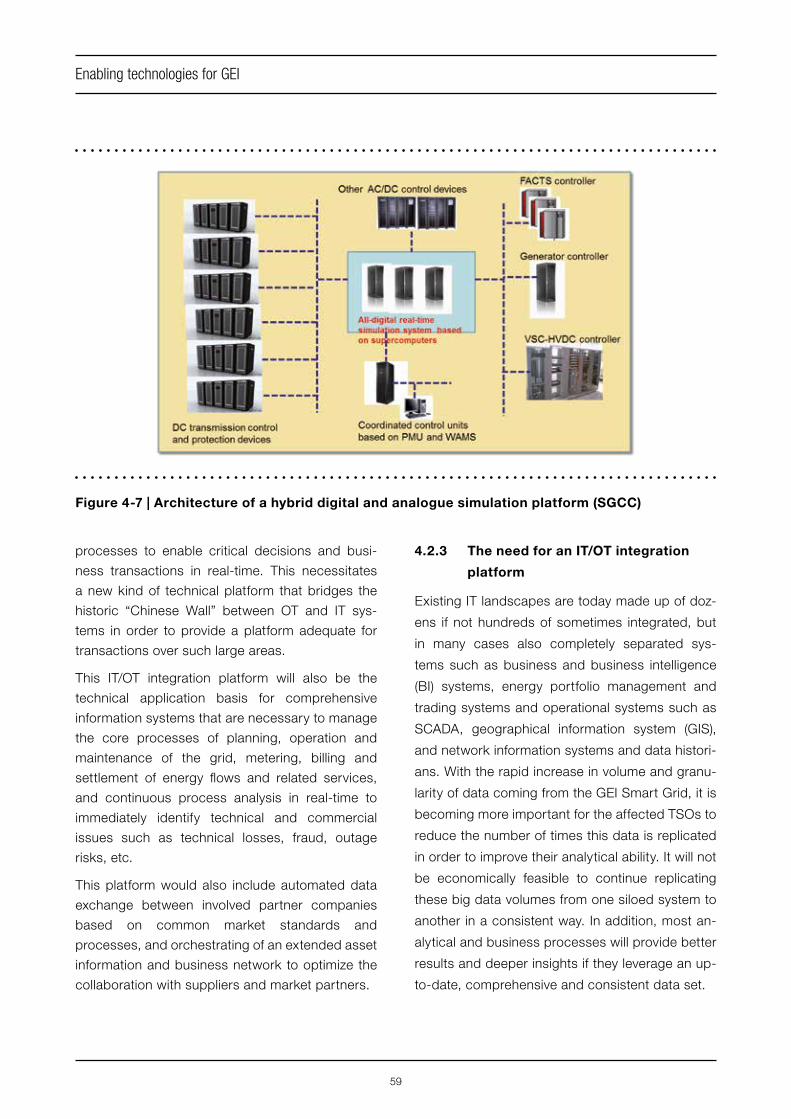
59
Enabling technologies for GEI
processes to enable critical decisions and busi-
ness transactions in real-time. This necessitates
a new kind of technical platform that bridges the
historic “Chinese Wall” between OT and IT sys-
tems in order to provide a platform adequate for
transactions over such large areas.
This IT/OT integration platform will also be the
technical application basis for comprehensive
information systems that are necessary to manage
the core processes of planning, operation and
maintenance of the grid, metering, billing and
settlement of energy flows and related services,
and continuous process analysis in real-time to
immediately identify technical and commercial
issues such as technical losses, fraud, outage
risks, etc.
This platform would also include automated data
exchange between involved partner companies
based on common market standards and
processes, and orchestrating of an extended asset
information and business network to optimize the
collaboration with suppliers and market partners.
Figure 4-7 | Architecture of a hybrid digital and analogue simulation platform (SGCC)
4.2.3 The need for an IT/OT integration
platform
Existing IT landscapes are today made up of doz-
ens if not hundreds of sometimes integrated, but
in many cases also completely separated sys-
tems such as business and business intelligence
(BI) systems, energy portfolio management and
trading systems and operational systems such as
SCADA, geographical information system (GIS),
and network information systems and data histori-
ans. With the rapid increase in volume and granu-
larity of data coming from the GEI Smart Grid, it is
becoming more important for the affected TSOs to
reduce the number of times this data is replicated
in order to improve their analytical ability. It will not
be economically feasible to continue replicating
these big data volumes from one siloed system to
another in a consistent way. In addition, most an-
alytical and business processes will provide better
results and deeper insights if they leverage an up-
to-date, comprehensive and consistent data set.
60
Enabling technologies for GEI
In addition to the rising data volume, the time span
between the moments when the data is measured
and when it has to be made available to support
business processes is growing shorter and
shorter, and in many cases (near) real-time data
will be required.
At a high level this leads to three important
functions a TSO platform has to perform in the
context of GEI:
§ Handle both a steeply increasing volume of
data and many different data types
§ Combine data from various different sources
and enable the integration of business and
operational systems (IT/OT integration)
§ Make the data available in (near) real-time
The following business processes represent
examples of required functions for a TSO platform
in the context of the GEI. These examples highlight
some of the key requirements involved but by
no means constitute an exhaustive list of all the
business processes that have to be supported
now.
§ Grid analytics support near real-time
analysis of the grid to improve grid stability
and effectiveness and prevent outages. This
requires correlation analysis, for example
to understand under what circumstances
specific equipment such as a transformer is
overloaded, and forecasting capabilities to
predict peak loads. The analytic results are
required to trigger manual interactions or the
intervention of other systems that actively
control the grid assets.
This process heavily relies on sensor and
event data from the grid, however meter data
is also required. The grid analytics solution
provides most benefit if the data and analysis
is available in near real-time, i.e. within a
couple of minutes or even seconds after
receiving the data, to enable rapid actions.
§ Predictive maintenance estimates when
a failure or decrease in efficiency of an asset
is to be expected and triggers maintenance
actions accordingly. This is based on meter
and sensor data as well as on historic values.
In general, predictive maintenance is of interest
for grids and power plants, but especially for
assets in remote locations such as offshore
wind power plants and secluded transmission
facilities.
Data requirements are similar to those of the
grid infrastructure analytics process, however
data would not be required in real-time but
rather on a daily basis. Unstructured data, for
example texts from work orders or customer
messages, can support this process as well.
§ Leakage management supports processes
such as fraud management and an early
detection of technical losses. It contributes to
determining where losses occur and whether
fraud could be the cause and acts as a
starting point for follow-up processes. It also
has a safety aspect.
In addition to meter, asset and GIS data,
forecasted consumption data, event data
and customer data from the customer
relationship management (CRM) and billing
system are required to support these
processes. Unstructured data, for example
from social media platforms, can also be
leveraged to detect possible fraud. While a
daily data upload would be sufficient for fraud
management, detection of technical losses
benefits from real-time data.
§ Energy settlement aggregates metered data
for a group of delivery points over a certain
time period as a basis for the commercial
settlement of transmission services. This
information can then be sent via market
messages to each of the participants in the
operational area for further processing.
61
Enabling technologies for GEI
The above-mentioned business processes and the
respective applications would benefit from a single
platform that provides a unified data repository as
well as generic tools and functions. The reason
behind this is that business processes would then
operate on comprehensive, consistent and actual
data, thus reducing the need for data replication.
Applications would benefit from generic functions
that do not have to be redeveloped repeatedly
in each siloed application. Moreover integration
between different applications would be simplified,
as less data exchange and fewer interfaces would
be required.
The overall total costs of such a platform, including
applications on top of it that reuse many generic
functions, is expected to be much lower than the
total costs of a system landscape involving several
different products, each with its own data tables,
tools and technology. Costs would be lower, for
example due to the reduced effort needed to
replicate data, cleanse it and keep data consistent.
To fulfil all these requirements, a TSO platform
would need to support the business processes
outlined above and to provide functions in support
of heterogeneous applications.
Such a platform therefore would need to be able
to:
§ rapidly upload different types of data in high
volumes;
§ process different kind of data from various
sources, including data from meters and
sensors, event data and geographical data, as
well as prices, weather data and more;
§ enable data uploads at different frequencies,
from monthly to sub-daily (down to real-time);
§ handle data that comes in any granularity
from monthly values down to minutes or even
seconds;
§ handle equidistant time intervals and non-
equidistant (discrete) values;
§ handle unstructured data.
Beyond uploading and storing the data, the
platform would also need to be able to:
§ validate, estimate and edit data;
§ store versions of the data if it is changed;
§ support auditability, for example when reports
have to be delivered due to regulatory rules;
§ store data for periods longer than one year
and support data aging.
In addition the platform would need to support
generic functions that can then be used by all
applications residing on the platform. These
include:
§ Calculation tools, for example to calculate
consumptions out of raw data, replacement
values, or energy consumption or generation
costs
§ An aggregation engine to aggregate data
from several points of the network, for
example all delivery points, that belong to
one holding company, or all meters linked to
one transformer. The data would be used for
analysis and pattern recognition in business
processes such as grid infrastructure analytics
or fraud management
§ Forecasting algorithms for maintenance and
replacement strategies for assets
§ Data mining tools to support data analysis, for
example in predictive maintenance
§ Complex event processing, as required
in many business processes, for example
outage management; the platform does not
need to support the entire business process,
but rather make analytic results available for
respective systems
§ Interfaces to external systems and data
gathering from external data suppliers or from
other GEI participants
To cope with those requirements, operators
of large-scale energy networks and GEI would
62
Enabling technologies for GEI
require an IT/OT integration platform, including
a portfolio of products tightly optimized to work
together to solve today’s data management
challenges. Such management elements include
data processing across massive volumes of data
storage, high velocity streaming data, automated
data movement, and data visualization and further
processing. These challenges include the ability to
handle master data, information governance and
information modelling. Today’s requirements also
involve supporting the vast variety of data types,
including structured data, semi-structured (or
text-based) data, as well as unstructured big-data
such as image, audio and video. The combination
of Hadoop® Distributed File System and Hadoop®
MapReduce framework is emerging as a standard
for very large unstructured data-pre-processing
and processing.
The IT/OT platform will need to address all these
data management challenges from the ground
up, with proven ability to scale. It has to include
capabilities that provide organizations with a
robust, yet flexible environment for managing
their data needs, including online transactional
processing, data processing and analysis, data
modelling and movement, information governance
as well as a unified administration and monitoring
tools. Among other elements, the portfolio or
products inside the IT/OT platform need to include:
§ An in-memory computing platform that
provides in-memory online transaction
processing (OLTP) and analytical capabilities
with the ability to embed code libraries and
advanced and statistical algorithms close to
the data
§ Classical database technology to augment
and complement in-memory requirements
for better economics and price/performance
requirements, especially critical as more
customers scale into Petabyte class data
volumes. It features a native MapReduce
framework and provides integration techniques
with Hadoop® for big-data analytics
§ Event streaming processing capabilities for
high speed streaming data analysis and
filtering for ultra-low latency applications
enabling continuous intelligence
§ Extended data security components with
most progressive security protocols and data
encryption capabilities to safeguard mission-
critical technical data and to avoid any
intrusion
In addition to that, the IT/OT integration platform
will need to provide tools for data modelling and
data movement and a development framework for
partners and customers who can build their own
applications on the same platform.
All components of the IT/OT integration platform
will have to be open for integration with third par-
ty tools, for example to support business intelli-
gence, information management, or infrastructure
management.
The realization of such a platform requires the
merging of commercial enterprise resource
planning (ERP) systems with technical applications
such as meter data management (MDM), SCADA
and document management system (DMS).
Figure 4-8 illustrates the conceptual architecture
of such an IT/OT platform as envisioned by SAP.
The data integration of SAP’s commercial MDM
application with the technical head-end system
(HES) from a partner on a common, cloud-ready
in-memory capable platform (the SAP HANA
Cloud Platform) connects business transactions
with technical mass data in real-time and enables
the introduction of fundamentally new processes,
such as real-time forecasting of transmission
loads, etc.
4.2.4 Advanced planning, operation and
maintenance of the grid with Asset
Intelligence Networks
The effective and secure management of technical
assets has been a core requirement of the energy
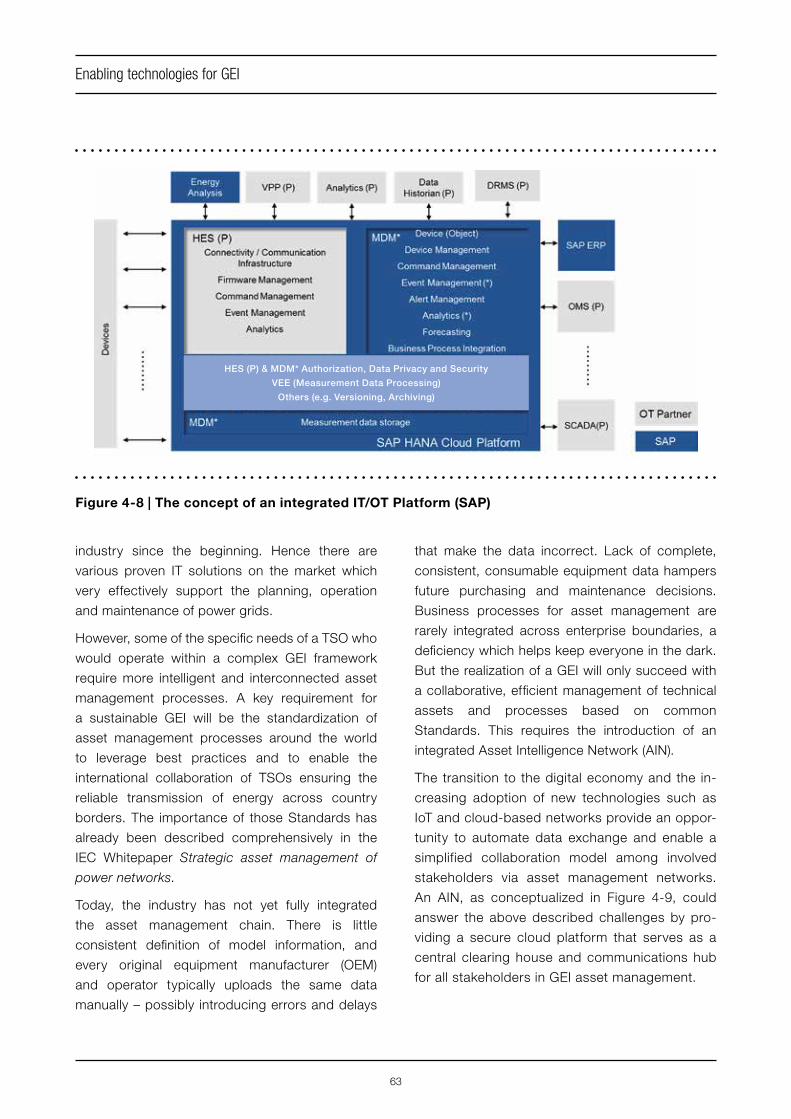
63
Enabling technologies for GEI
industry since the beginning. Hence there are
various proven IT solutions on the market which
very effectively support the planning, operation
and maintenance of power grids.
However, some of the specific needs of a TSO who
would operate within a complex GEI framework
require more intelligent and interconnected asset
management processes. A key requirement for
a sustainable GEI will be the standardization of
asset management processes around the world
to leverage best practices and to enable the
international collaboration of TSOs ensuring the
reliable transmission of energy across country
borders. The importance of those Standards has
already been described comprehensively in the
IEC Whitepaper Strategic asset management of
power networks.
Today, the industry has not yet fully integrated
the asset management chain. There is little
consistent definition of model information, and
every original equipment manufacturer (OEM)
and operator typically uploads the same data
manually – possibly introducing errors and delays
Figure 4-8 | The concept of an integrated IT/OT Platform (SAP)
that make the data incorrect. Lack of complete,
consistent, consumable equipment data hampers
future purchasing and maintenance decisions.
Business processes for asset management are
rarely integrated across enterprise boundaries, a
deficiency which helps keep everyone in the dark.
But the realization of a GEI will only succeed with
a collaborative, efficient management of technical
assets and processes based on common
Standards. This requires the introduction of an
integrated Asset Intelligence Network (AIN).
The transition to the digital economy and the in-
creasing adoption of new technologies such as
IoT and cloud-based networks provide an oppor-
tunity to automate data exchange and enable a
simplified collaboration model among involved
stakeholders via asset management networks.
An AIN, as conceptualized in Figure 4-9, could
answer the above described challenges by pro-
viding a secure cloud platform that serves as a
central clearing house and communications hub
for all stakeholders in GEI asset management.
HES (P) & MDM* Authorization, Data Privacy and Security
VEE (Measurement Data Processing)
Others (e.g. Versioning, Archiving)
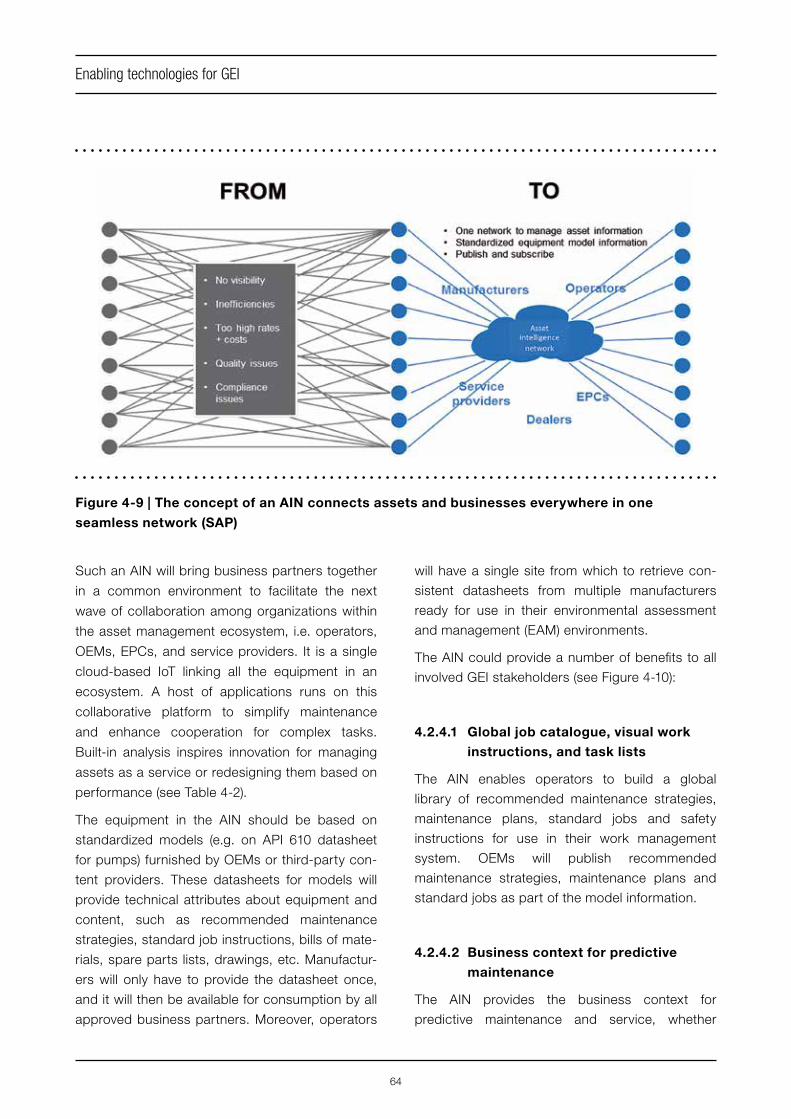
64
Enabling technologies for GEI
Such an AIN will bring business partners together
in a common environment to facilitate the next
wave of collaboration among organizations within
the asset management ecosystem, i.e. operators,
OEMs, EPCs, and service providers. It is a single
cloud-based IoT linking all the equipment in an
ecosystem. A host of applications runs on this
collaborative platform to simplify maintenance
and enhance cooperation for complex tasks.
Built-in analysis inspires innovation for managing
assets as a service or redesigning them based on
performance (see Table 4-2).
The equipment in the AIN should be based on
standardized models (e.g. on API 610 datasheet
for pumps) furnished by OEMs or third-party con-
tent providers. These datasheets for models will
provide technical attributes about equipment and
content, such as recommended maintenance
strategies, standard job instructions, bills of mate-
rials, spare parts lists, drawings, etc. Manufactur-
ers will only have to provide the datasheet once,
and it will then be available for consumption by all
approved business partners. Moreover, operators
Figure 4-9 | The concept of an AIN connects assets and businesses everywhere in one
seamless network (SAP)
will have a single site from which to retrieve con-
sistent datasheets from multiple manufacturers
ready for use in their environmental assessment
and management (EAM) environments.
The AIN could provide a number of benefits to all
involved GEI stakeholders (see Figure 4-10):
4.2.4.1 Global job catalogue, visual work instructions, and task lists
The AIN enables operators to build a global
library of recommended maintenance strategies,
maintenance plans, standard jobs and safety
instructions for use in their work management
system. OEMs will publish recommended
maintenance strategies, maintenance plans and
standard jobs as part of the model information.
4.2.4.2 Business context for predictive maintenance
The AIN provides the business context for
predictive maintenance and service, whether
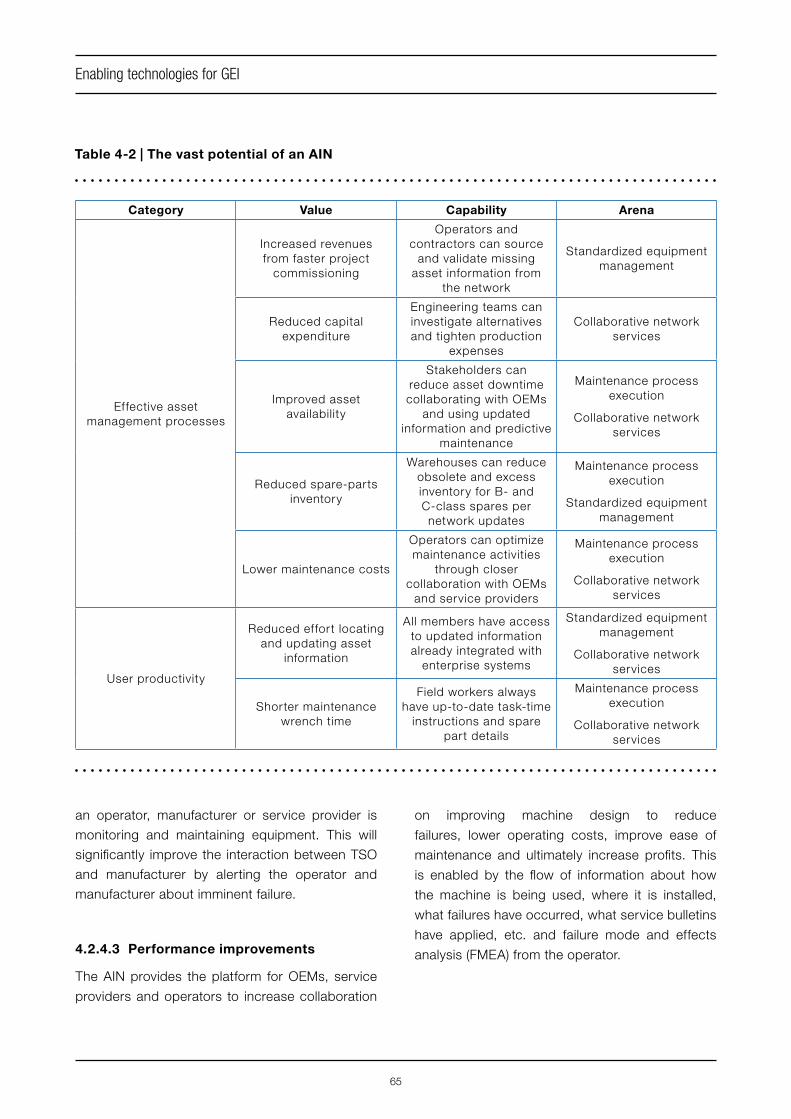
65
Enabling technologies for GEI
Category Value Capability Arena
Effective asset management processes
Increased revenues from faster project
commissioning
Operators and contractors can source
and validate missing asset information from
the network
Standardized equipment management
Reduced capital expenditure
Engineering teams can investigate alternatives and tighten production
expenses
Collaborative network services
Improved asset availability
Stakeholders can reduce asset downtime collaborating with OEMs
and using updated information and predictive
maintenance
Maintenance process execution
Collaborative network services
Reduced spare-parts inventory
Warehouses can reduce obsolete and excess inventory for B- and C-class spares per network updates
Maintenance process execution
Standardized equipment management
Lower maintenance costs
Operators can optimize maintenance activities
through closer collaboration with OEMs
and service providers
Maintenance process execution
Collaborative network services
User productivity
Reduced effort locating and updating asset
information
All members have access to updated information already integrated with
enterprise systems
Standardized equipment management
Collaborative network services
Shorter maintenance wrench time
Field workers always have up-to-date task-time
instructions and spare part details
Maintenance process execution
Collaborative network services
Table 4-2 | The vast potential of an AIN
an operator, manufacturer or service provider is
monitoring and maintaining equipment. This will
significantly improve the interaction between TSO
and manufacturer by alerting the operator and
manufacturer about imminent failure.
4.2.4.3 Performance improvements
The AIN provides the platform for OEMs, service
providers and operators to increase collaboration
on improving machine design to reduce
failures, lower operating costs, improve ease of
maintenance and ultimately increase profits. This
is enabled by the flow of information about how
the machine is being used, where it is installed,
what failures have occurred, what service bulletins
have applied, etc. and failure mode and effects
analysis (FMEA) from the operator.

66
Enabling technologies for GEI
Figure 4-10 | Benefits of an AIN (SAP)
4.2.4.4 Integrated work planning and
execution
The AIN facilitates collaborative maintenance
activity between operators and service providers.
Certain complex activities might need to be
broken down into sequential steps, of which some
are carried out by asset operators and more
specialized ones by the service provider.
4.2.4.5 Manage equipment as a service
Operators want to minimize their capital
expenditure and risks, whereas OEMs want to
bundle value-added services with products. This
convergence of requirements, along with new
technologies such as the IoT and collaborative
networks, is resulting in the new business model
of managing equipment as a service.
4.2.4.6 Analyze equipment performance
The AIN helps operators drive asset improvement
programmes by benchmarking reliability metrics
from different operator sites that can be analyzed to
identify best practice for operation and maintenance
around the world. Depending on the requirements
of the different parties supplying and consuming
information, the information could be anonymized.
4.2.4.7 Marketplace of intelligence
Companies are capturing more and more infor-
mation about their machines. And more advanced
algorithms are possible to analyze data and make
predictions and prognoses to improve machine
performance. Is it still feasible or desirable that
operators do all of this data processing them-
selves? Can manufacturers, service providers or
67
Enabling technologies for GEI
even individuals provide more of this “intelligence”
in a competitive marketplace where the best pro-
vider wins? An AIN could provide a marketplace
where business partners can connect with other
third parties to competitively source the best intel-
ligence for their machines. With a solid foundation
of asset information in the network, a new class
of potential enterprise scale solutions becomes
possible.
4.2.4.8 Quality, inspection, and calibration
results sharing
The AIN facilitates sharing of quality, inspection,
certification, and calibration results. Statutory
authorities and independent assurance compa-
nies, e.g. Lloyds Register, DNV GL, and TüV, will
have access (provided they are given the neces-
sary authorization) to view up-to-date information
on whether statutory inspections have been per-
formed on time with the relevant inspection re-
sults. Another example is obtaining the results and
reports of condition-based maintenance tasks,
such as oil analysis of engines, which are typically
sent to an external laboratory for analysis.
4.2.5 Metering, billing and settlement of
energy flows and related services
Like any other transmission grid, a GEI would
operate in a commercial framework that bills the
recipient and/or the remitter of the transmitted
energy for the transmission service. This
requires the availability of specific customer
information systems, which are able to manage
typical industry-specific processes, including
orchestration of meter data reading processes,
acquisition and management of large amounts of
meter reading data in time series (load profiles),
performant and reliable charging of transmission
services, etc.
There are several solutions on the market
which can satisfactorily fulfil those business
requirements. However, due to the increasing
importance of settlement rules based on most
granular data (e.g. prices based on minute
intervals) and the related data growth, the ideal
solution should be able to process information in
real-time. This requires the usage of modern, in-
memory-based applications, which allow much
faster processing times for complex calculations
with mass data. Such systems combine the
transactional and analytical data processing
in one database and eliminate typical time-
consuming batch processes. Moreover, they allow
sophisticated operation reporting activities in real-
time based on most recent data.
4.2.6 GEI market communication platform
The GEI will operate as a network with many
national TSOs. In order to ensure the reliable
and sustainable transmission process across
country or even continental borders, a highly
automated data exchange process based on
internationally agreed communication formats
is mandatory. Typical data exchange processes
include nomination of transmission capacities,
transmission forecasts and schedules, exchange
of technical data to support cross-border ancillary
services, exchange of asset and operational data
to optimize collaborative asset management
processes, measurements as input for settlement
of transmission services, or billing of transmission
charges.
Various market communication standards
are already available for TSOs that should be
considered as a basis for the extended GEI market
communication.
For example, the European Network of Transmis-
sion System Operators for Electricity (ENTSOE-E)
68
Enabling technologies for GEI
maintains an Electronic Data Interchange (EDI)
Library which contains all the documents and defi-
nitions approved by ENTSO-E for the harmoniza-
tion and implementation of standardized electron-
ic data interchanges.
In the context of a potential GEI market model, it
should be discussed whether a centrally operated
GEI market communication hub could help to
increase the efficiency of the GEI processes.
This could be a cloud-based service provided
by an “IEC-like” organization, which centrally
orchestrates the communication flows and the
intercompany data exchange between all GEI
participants. The necessary IT technologies
for such platform are available and are already
productive in various clearinghouse projects.
69
Section 5Standardization for GEI
Standardization is of central importance and,
at the same time, represents one of the biggest
challenges for the success of GEI, which demands
an unprecedented degree of system integration
across sovereign borders, technical domain
borders, hierarchical borders and equipment life
cycle phases. To achieve this success, consensus-
based Standards and Specifications will form an
indispensable basis upon which to build.
Existing but also future consensus-based
Standards will create a firm basis for technical
procurement, support communication through
standardized terminology and concepts, ensure
interoperability, certify fitness for use, and
determine market relevance. Drawing up GEI
concepts at an early stage by a consensus-
based standardization process and through
close cooperation between researchers, industry,
regulators and the standardization bodies is one of
the central requirements for success of the multi-
phased implementation of GEI.
To succeed, these principles should be consistent
with existing standards that support the core GEI
technologies, i.e. UHV, clean energy, and Smart
Grids. Not only will this facilitate subsequent
promotion and application of equipment, interfaces
and technology, but it will also create conditions
for building international-level interconnections
among energy grids and related equipment.
5.1 Present situation
Standards currently exist that cover the foundational
technical domains of GEI, representing UHV, clean
energy and Smart Grid. These Standards are
required for incorporating multiple technologies
into parts of a very complicated, large-scale power
and energy system that will interconnect not only
physical infrastructures across large areas but
also the supporting ICT systems. The Standards
involved are related to many technical committees
inside IEC and to other coordinating organizations
outside IEC. The following is a list of current IEC
technical committees (TCs) and subcommittees
(SCs) handling specific activities that support GEI:
5.1.1 Transmission
§ TC 7: Overhead electrical conductors
§ TC 14: Power transformers
§ SC 17A: Switching devices
§ TC 20: Electric cables
§ TC 28: Insulation co-ordination
§ TC 36: Insulators
§ TC 115: High Voltage Direct Current (HVDC)
transmission for DC voltages above 100 kV
§ TC 122: UHV AC transmission systems
§ ACTAD: Advisory Committee on Electricity
Transmission and Distribution
5.1.2 Clean energy – renewable generation
and energy storage
§ TC 4: Hydraulic turbines
§ SC 8A: Grid integration of Renewable Energy
generation
§ TC 21: Secondary cells and batteries
§ TC 82: Solar photovoltaic energy systems
70
Standardization for GEI
§ TC 88: Wind energy generation systems
§ TC 114: Marine energy – Wave, tidal and other
water current converters
§ TC 117: Solar thermal electric plants
§ TC 120: Electrical Energy Storage (EES) Sys-
tems
5.1.3 Smart Grids
§ TC 8: Systems aspects for electrical energy
supply
§ TC 13: Electrical energy measurement and
control
§ TC 22: Power electronic systems and equip-
ment
§ TC 57: Power systems management and asso-
ciated information exchange
§ TC 64: Electrical installations and protection
against electric shock
§ TC 77: Electromagnetic compatibility
§ PC 118: Smart Grid user interface
§ SyC Smart Energy
§ ISO/IEC JTC 1: Information technology
§ CISPR: International Special Committee on
Radio Interference
5.2 Future standardization needs
Development of global energy systems for GEI will
provide a worldwide platform that enables new
technologies to be used optimally for maximum
performance and reliability. For example, the
prospects for wind power are very positive: the
IEA forecasts that installed onshore and offshore
capacity will exceed 1 300 GW in 2040, with
onshore capacity making up 85% of the total,
against 98% in 2011. This expansion will require
additional International Standards to cover new
areas. The very nature of the RE technologies
means that standardization requires a dedicated
effort to keep pace with developments in the
various fields.
Also, Smart Grids and energy storage are more
than ever to be unified with electricity generation
and distribution systems, regional energy hubs
and long-range ultra-high voltage lines.
The biggest market trend for UHVAC is towards
long-distance bulk power transmission and
interconnection with existing power systems.
There is also a trend towards building strong power
reception grids to receive more large-scale power
feed-in. The grid changes are driven by rapidly
growing power consumption in load centres of
emerging countries and by structural changes
from coal, gas and nuclear power generation
towards full renewable power generation involving
wind, solar, large hydro and other energies at
distant generation locations. With increasing
renewable power generation, mainly from wind,
large hydro and solar, electrical energy will be
competitive with oil, gas and coal sources, but it
will need new AC transportation systems to cope
with projected needs.
With the growth of load demand and the
imbalance between energy demand and supply,
power plants are needed which will be located far
from load centres (e.g. large hydropower and pit-
mouth fossil-fired power stations), and clean and
renewable distributed generation (e.g. wind power
and solar power) will be introduced extensively.
The former are characterized by large capacity
and long distance and will enjoy remarkable
advantages when employing HVDC transmission
technology.
Construction of HVDC transmission systems in
severe environmental conditions, such as building
converter stations and DC transmission lines at a
very high altitude (3 000 m 5 300 m), are posing
higher requirements for the HVDC transmission
technology.
71
Standardization for GEI
Smart Grid implementation has already started
and will continue to be implemented in the form of
an “evolution” of successive projects over several
decades.
It is now necessary to manage the integration of
new equipment that has a lower life span than
traditional network assets: three to five years for
consumer electronics and telecommunications,
compared to 40 plus years for lines, cables, and
transformers.
The Smart Grid represents a technical challenge
that goes far beyond the simple addition of an
information technology infrastructure on top of an
electrotechnical infrastructure. Each device that is
connected to a Smart Grid is simultaneously an
electrotechnical device and an intelligent node.
Today’s “connection” standards need to address
both aspects concurrently.
Adopting advanced monitoring and control
technologies is a key objective for future Smart
Grids.
In order to support these future standardization
needs for GEI, some important general considera-
tions for standards are given below.
5.2.1 Systems standards
While smart energy activities will confront new
issues and questions for GEI, new tools between
standards developing organizations (SDOs)
and stakeholders, such as creating use case
repositories and system level standards, must be
launched to bridge gaps between organizations
working in totally different areas. Drafting of
systems level standards will require understanding
the interrelationship between other components
from a physical/electrical point of view, as well as
the flow of information with the grid network and
changes in system behaviour.
From a conformity assessment perspective,
understanding is also required of how the life
of a standard evolves as changes occur at the
component surroundings levels. Most importantly,
system level standardization thinking for GEI is
the understanding of the interrelation between
the many systems-of-systems and the growing
equipment assets that make up the GEI system.
In the IEC, a Systems Committee (SyC) Smart
Energy has been set up to provide systems level
standardization, coordination and guidance in the
areas of Smart Grid and Smart Energy, including
interactions with heat and gas. Key International
Standards such as IEC 61850 have been
introduced to ensure device and communication
compatibility in substations, while IEC 61970 has
been developed to define application programme
interfaces for energy management systems. SyC
Smart Energy has just begun its outreach to
various internal and external stakeholders, but
much work remains to be coordinated.
5.2.2 Management standards
Open data and data sharing facilitate data
analytics and simulation, which provide the basis
for planning, scheduling, operation and control.
The large efficiency gains from integration and
interoperability, however, are only realized if all
the stakeholders collaborate effectively and
agree to share data or information. Data aspects
shall become a key issue in GEI, including data
analytics, data utilization, data privacy and cyber
security. The lack of exchange of fundamental
data on customers, infrastructures and operations
is one of the most important barriers highlighted by
stakeholders. Specifications for data sharing and
standards on data format are both needed. On the
other hand, a series of management specifications
or guidelines are also needed to guarantee the
coordination in planning, trading and operation
among all the participants.
Although many regional and national organizations,
such as NERC, Nordel, UCTE, ENTSO-E and
NGET, have their own reliability criteria, it is
necessary to coordinate such criteria for the GEI.
72
Standardization for GEI
For example, specifications are necessary for
coordinating the control and protection strategy of
interconnecting links and grid connection codes.
5.2.3 Standards for information exchange
Control, protection and scheduling for GEI
depends upon effective information exchange
based on appropriate ICT architectures. Therefore
the Smart Grid core International Standards,
IEC 61850, IEC 61968 and IEC 61970, are also
very important but must be studied further to
see if they can accommodate GEI, or whether it
will be necessary to develop new Standards and
to revise current ones. Cyber security is another
major challenge for GEI, for which corresponding
standards are required, and many consortia as
well as ISO/IEC JTC 1 will need to re-evaluate this
aspect.
5.2.4 Standards for new materials and
equipment
As presented throughout this White Paper, for the
implementation of GEI, energy would be globally
interconnected via the Smart Grid, with UHV
networks constituting the backbone and clean
energy the main resource. Consideration should
be given to new areas of standardization based
on new material discoveries or environmental
challenges that will further enable a GEI network
to be installed.
For example, huge energy bases in the North Pole
region and the equatorial belt area will deliver
RE such as wind, solar and marine energy to
customers worldwide. Higher voltage level UHV
technologies will be a prerequisite for transmitting
this large capacity power across long distances
and to remote sites. Since the UHV transmission
systems must adapt to such extreme environmental
operating conditions, new energy conducting
materials may need to be engineered and new
reliability guidelines developed for this purpose.
Furthermore, with the rollout of the Smart Grid and
microgrids, a development which implies that elec-
trical storage will be installed at customer sites,
extra RE is expected to be transferred to gas or
stored in the form of hydrogen gas, thereby neces-
sitating standards for energy transfer and energy
storage technologies. The market for small and
dispersed EES is also expected to grow substan-
tially. EES will be used not only for single applica-
tions but for several objectives simultaneously by
integrating the multiple dispersed storage sites that
will be required by GEI.
In most cases, standardization plays a stabilizing
role by pursuing research activities on which real
market opportunities are built.
73
Section 6Conclusion and recommendations
The GEI is an ambitious concept, integrating a
large-scale deployment of clean energy led by
variable renewables: a Smart Grid with various
levels of interoperability and with IT and OT
integration capabilities currently not deployed on
an adequate scale, the large-scale deployment
of advanced technologies for transmitting power
over vast distances and forming high-capacity
and high-voltage networks, and electrification of
a large number of energy services involving new
equipment.
Many of the building blocks of large-scale energy
networks and an eventual GEI are available today.
Large-scale RE is a reality, and achievements in
UHV power transmission are redrawing the bound-
aries of how much power can be cost-effective-
ly transmitted and across what distances. Tech-
nologies on the horizon, described in Section 4,
will only expand this frontier further. Meanwhile,
the vast potential for ICT and smart technologies
in power systems has only begun to be tapped.
While the required technologies themselves are
largely available or are in the pipeline, the challenge
for large-scale, transcontinental or global energy
interconnection is one of implementation, in
which barriers and challenges will need to be
overcome as the process unfolds. As such, the
analysis in this White Paper provides a number
of key recommendations for both evaluating and
implementing large-scale interconnection and GEI.
6.1 Recommendations addressed to policy-makers and regulators
§ Policy-makers and regulators should
consider the need to develop tools and
methodologies to assess the costs and
benefits of large-scale, regional, trans-
continental and eventually global ener-
gy interconnections. Interconnections are
generally assessed on a case-by-case basis
by the countries involved. Even under the rela-
tively long planning time frames of TSOs, proj-
ects as ambitious as large-scale regional and
transcontinental networks might fall below the
planning horizon necessary to encourage as-
sessment of the full range of benefits. Section
3 has presented practical experiences of re-
gional energy interconnection, which provide
confidence concerning the benefits that can
be accrued when a longer-term system per-
spective is adopted between a large number
of actors.
§ While large-scale deployment of renew-
ables should continue to be encouraged,
emphasis needs to shift to the joint plan-
ning of transmission and generation as-
sets. Regulators and governments should
recognize the need to plan all power system
elements jointly. Assessments of this aspect
can reveal the advantages, for example of
building long links to distant resources, rein-
forcing grids to pave the way for an accelerat-
ed deployment of energy generation in a given
area or better designing incentives for deploy-
ment of new capacities.

74
Conclusion and recommendations
§ Policy-makers and regulators should es-
tablish fora for discussion of large-scale
grid interconnection initiatives. While a
large number of convening groups for indus-
try stakeholders, governments or regulators
already exist, organizations for discussing
large-scale planning of grids are highly region-
al. Local TSO organizations have progressively
coalesced into fora spanning larger geograph-
ical areas. A next natural step would be the
establishment of international fora to share in-
terconnection experiences around the world
and establish dialogue concerning new op-
portunities.
6.2 Recommendations addressed toward meeting industrial needs
§ Studies should be carried out concerning
the market readiness and economic fea-
sibility of establishing remote bases for
renewable energy, namely in far northern
latitudes, in the arctic or along the equa-
tor. While technologies have been deployed
in extreme conditions, the human and imple-
mentation challenges involved in deploying
generation and transmission assets on a large
scale in these intense climatic conditions re-
main to be determined.
§ Scaling of equipment will pose challeng-
es to industry so there will be a need for
prior coordination and joint participation
in demonstration efforts (e.g. develop-
ment of technology), in order to avoid the
first missteps on the Smart Grid. It is clear
that Smart Grid technology is a good invest-
ment but deploying the new technology is rel-
atively expensive. The lesson learned will be
to avoid the “big bang” approach in favour of
a pilot demonstration-based approach. This
suggests that full-scale deployment of GEI will
be phased and allow further occasions for in-
dustry to generate investment.
§ Joint planning by relevant agencies, re-
gional bodies and TSOs should be pro-
moted and encouraged. Taking advantage of
each country’s achievements in energy technol-
ogies, strategic planning, market establishment,
policy innovation and cooperative research,
and making good use of these best practices
throughout the world, could significantly en-
hance the “know-how” of all stakeholders.
§ A coordinated and collaborative ap-
proach to code drafting and code imple-
mentation is needed to ensure that the
activity of systems operators is compli-
ant with the network codes. In the context
of the GEI market model, it should be dis-
cussed whether a centrally operated GEI mar-
ket communication hub could help to increase
the efficiency of the GEI processes. This could
involve a cloud-based service provided by
an “IEC-like” organization, which centrally or-
chestrates the communication flows and in-
tercompany data exchange between all GEI
participants.
6.3 Recommendations addressed to the IEC and its committees
§ The IEC Market Strategy Board (MSB)
should consider new internal avenues
that will allow the IEC to provide faster
responses to industry. In light of the large
number of stakeholders who would have an
interest in GEI, the MSB should enhance its
outreach to industry through the activity of its
project teams. The latter should survey the
needs surrounding revolutionary GEI-related
technologies.
75
Conclusion and recommendations
§ It is recommended that the IEC Stan-
dardization Management Board (SMB)
form an Advisory Committee on GEI to
help prioritize needs in this area and to
coordinate development of standardiza-
tion efforts in response to these needs.
Specifically the AC should consider internal
coordination for development of an architec-
tural framework clarifying the GEI concept and
the rules of interoperability and integration.
This would involve identifying the gaps be-
tween the requirements for GEI and the exist-
ing interoperability Standards developed in the
affected technical committees.
§ The IEC should consider expanding op-
portunities to affiliate countries in the
equatorial regions for full participation
in the development of International Stan-
dards for GEI. As the equatorial regions of
the globe will generate and contribute signif-
icant amounts of solar and wind energy to
the GEI network, the IEC should encourage
IEC Affiliate National Electrotechnical Com-
mittees (NECs) with Affiliate Plus status to be
actively engaged in the Standards process for
solar and wind. It is recognized that the IEC
Affiliate Country Programme has been a pio-
neer in bringing the benefits and advantages
of involvement in the IEC to many countries
throughout the world, not only through the
benefits afforded by the Programme, but also
via measures such as opening participation
in its Conformity Assessment Systems to de-
veloping countries Such Affiliates will direct-
ly benefit from the investment necessary for
bringing large-scale renewables online, thus
helping to bring social benefits in the form of
energy access to clean power and opportu-
nities for local capacity building and employ-
ment.
77
Bibliography
[1] WISER, R., LANTZ, E., HAND, M., et al., IEA Wind Task 26: The Past and Future Cost of Wind Energy, IEA Wind, May, 2012.
[2] International Energy Agency, Medium-Term Renewable Energy Market Report 2015, [Online]. Available: www.iea.org/bookshop/708-Medium-Term_Renewable_Energy_Market_Report_2015. [Accessed 19 September 2016].
[3] Report of the enquiry committee on grid disturbance in Northern Region on 30th July 2012 and in Northern, Eastern and North-Eastern Region on 31th July 2012, [Online]. Available: powermin.nic.in/sites/default/files/uploads/GRID_ENQ_REP_16_8_12.pdf. [Accessed 19 September 2016].
[4] Operador nacional do Sistema Eléctrico (ONS), Mapas do SIN, [Online]. Available: www.ons.org.br/conheca_sistema/mapas_sin.aspx. [Accessed 19 September 2016].
[5] Global Energy Network Institute (GENI), The Water-Energy Nexus in the Amu Darya River Basin: The Need for Sustainable Solutions to a Regional Problem, [Online]. Available: www.geni.org/globalenergy/research/water-energy-nexus-amudarya-river/Water-Energy Nexus-AmuDarya-River-RD.pdf. [Accessed 19 September 2016].
[6] Nepal Energy Forum, Pros and cons of regional electricity grid, [Online]. Available: www.nepalenergyforum.com/pros-and-cons-of-regional-electricity-grid. [Accessed 19 September 2016].
[7] LIU, Z., Global Energy Interconnection, Elsevier, 2015.
[8] BONPARD, E., FULLI, G., ARDELEAN, M., MASERA, M., Evolution, Opportunities, and Critical Issues for Pan-European Transmission, IEEE Power and Energy Magazine, Vol. 12, no. 2, pp. 40-50, 2014.
[9] ZHANG, Yi, ZHANG, Yang, Overview of the Practice of Renewable Generation Integration and Transmission Planning in North America, Energy Technology and Economics, Vol. 23, no. 8, pp. 1-7, 23, 2011.
[10] KUMAGAI, J., The U.S. may finally get a unified power grid, IEEE Spectrum, Vol. 53, Issue 1, pp. 35-36, January 2016.
[11] ANDREWS, D., Why Do We Need The Supergrid, What Is Its Scope And What Will It Achieve?, A Claverton Energy Reseach Institute Presentation, 19 June 2009.
[12] MANO, S., OVGOR, B., SAMADOV, Z., et al., Gobitec and Asian Super Grid for Renewable Energies in Northeast Asia, Spotinov print Ltd., 2014.
[13] IEC, Grid integration of large-capacity Renewable Energy sources and use of large-capacity Electrical Energy Storage, White Paper, 2012.
[14] HUI, L., Research on the Economics of Ultra-High Voltage and Global Energy Interconnection, Presentation, Sino-Europe Workshop on Technology and Equipment of Global Energy Interconnection, Berlin, 10-11 December 2015.
[15] ADAPA, R., HVDC Technology: The State of the Art, IEEE Power and Energy Magazine, Vol. 10, no. 6, pp. 18-29, 2012.
78
Bibliography
[16] MAJUMDER R., BARTZSCH, C., KOHNSTAM, P., et al., High-voltage DC on the New Power Transmission Highway, IEEE Power and Energy Magazine, Vol. 10, no. 6, pp. 39-49, 2012.
[17] ANDERSEN, B. R., HVDC Grids – Overview of CIGRE Activities and Personal Views, CIGRE, 2014, [Online]. Available: www.e-cigre.org/.../ELT_275_2(2).pdf. [Accessed 19 September 2016].
[18] YUE, B., MEI, N., LIU, S.-Y., et al., Overview of HVDC Flexible, China Electric Power (Technology Edition), no. 5, pp. 43-47, 2014 [in Chinese].
[19] CHEN, G., HAO, M., XU Z., et al., Review of High Voltage Direct Current Cables, CSEE Journal of Power and Energy Systems, Vol. 1, no. 2, pp. 9-21, 2015.
[20] BAHRMAN, M. P., JOHNSON, B. K., The ABCs of HVDC Transmission Technologies, IEEE Power and Energy Magazine, Vol. 5, no. 2, pp. 32-44, 2007.
[21] LUNDBERG, P., CALLAVIK, M., BAHRMAN, M., SANDEBERG, P., High-Voltage DC Converters and Cable Technologies for Offshore Renewable Integration and DC Grid Expansion, IEEE Power and Energy Magazine, Vol. 10, no. 6, pp. 31-38, 2012.
[22] RAO, H., Architecture of Nan’ao Multi-terminal VSC-HVDC System and Its Multifunctional Control, CSEE Journal of Power and Energy Systems, Vol. 1, no. 1, pp. 9-18, 2015.
[23] TANG, G., HE, Z., HUI, P., et al., Basic Topology and Key Devices of the Five-Terminal DC Grid, CSEE Journal of Power and Energy Systems, Vol. 1, no. 2, pp. 22-35, 2015.
[24] YAO L., WU., J., WANG, Z., et al., Pattern Analysis of Future HVDC Grid Development, Proceedings of the CSEE, Vol. 34, no. 34, pp. 6007-6012, 2014.
[25] XUMING, L., Technology Research and Application Prospect of Half-wavelength Alternating Current Transmission, Smart Grid, Vol. 3, no. 12, pp. 1091-1096, 2015 [in Chinese].
[26] LIYE, X., LIANGZHEN, L., Status Quo and Trends of Superconducting Power Transmission Technology, Transactions Of China Electrotechnical Society, Vol. 30, no.7, pp. 1-9, 2015 [in Chinese].
[27] SOONEE, S. K., AGRAWAL, V. K., AGARWAL, P. K., et al., The view from the wide side: wide-area monitoring systems in India, IEEE Power and Energy Magazine, Vol. 13, no. 5, pp. 49-59, 2015.
[28] NUTHALAPATI, S., PHADKE, A. G., Managing the grid using synchrophasor technology, IEEE Power and Energy Magazine, Vol. 13, no. 5, pp. 10-12, 2015.
[29] LU, C., SHI, B., WU, X., SUN, H., Advancing China’s smart: phasor measurement units in wide-area management system, IEEE Power and Energy Magazine, Vol. 13, no. 5, pp. 60-71, 2015.
InternationalElectrotechnicalCommission ®
T +41 22 919 02 [email protected]
3 rue de VarembéPO Box 131CH-1211 Geneva 20Switzerland
® Registered trademark of the International Electrotechnical Commission. Copyright © IEC, Geneva, Switzerland 2016
ISBN 978-2-8322-3680-2
CHF 50.-
®
IEC
WP
GEI:2
016-
10(e
n)