Embed Size (px)
DESCRIPTION
Global Entrepreneurship Monitor 2010
Citation preview
GLOBAL ENTREPRENEURSHIP MONITOR
Russia 2010
National Report
GLOBAL ENTREPRENEURSHIP MONITOR Russia 2010
O. Verkhovskaya
M. Dorokhina
This work is based on data collected by the GEM consortium. Responsibility for analysis and interpretation of those data is the sole responsibility of the authors.
The Report is published under financial support of Citi Foundation
4
GLOBAL ENTREPRENEURSHIP MONITOR
“Global Entrepreneurship Monitor. Russia 2010” is the fifth Russian report for “Global Entrepreneurship Monitor” (GEM). The goal of this report is to acquaint Russian businessmen, experts in entrepreneurship, and other stakeholders with the outlines of the project and general results from research on 2010.
GEM is among the most important and influential research projects that analyze relations between entrepreneurship and economic growth.
PARTICIPANTS IN GEM RUSSIA
This project is supported by research groups from the Graduate School of Management at St. Petersburg State University and the National Research University Higher School of Economics (Moscow).
RESEARCH TEAM: GRADUATE SCHOOL OF MANAGEMENT SPBGU
Head of Saint Petersburg team: Olga VerkhovskayaResearchers: M. Dorokhina, G. Shirokova.
RESEARCH TEAM: NATIONAL RESEARCH UNIVERSITY, HIGHER SCHOOL OF ECONOMICS (MOSCOW)
Head of Moscow team: Aleksandr ChepurenkoResearchers: O. Obraztsova, T. Alimova, M. Gabelko
5
RUSSIA 2010
ÑÎNTENT
WHAT IS GEM?..........................................................................................................7
Project goals...........................................................................................................7
Data collection.........................................................................................................7
The GEM conceptual model............................................................................................8
Defining entrepreneurship.............................................................................................8
Types of entrepreneurs...............................................................................................10
ATTITUDES TO ENTREPRENEURSHIP IN THE SOCIETY................................................................11
Attitudes to Entrepreneurship.......................................................................................11
Entrepreneurs’ perceptions of the business environment...........................................................14
ENTREPRENEURIAL ACTIVITY IN GEM COUNTRIES...................................................................17
Entrepreneurial activity..............................................................................................17
Global Entrepreneurship and Economic Development Index, GEDI.................................................22
Motives for entrepreneurial activity.................................................................................25
Discontinuing business..............................................................................................27
Social and demographic characteristics of Russian entrepreneurs.................................................29
ENTREPRENEURIAL ASPIRATIONS....................................................................................35
Innovativeness.......................................................................................................35
Aspirations to growth................................................................................................38
Orientation to the global market.....................................................................................39
ANALYSIS OF FRAMEWORK CONDITIONS FOR THE ENTREPRENEURSHIP DEVELOPMENT
ON THE BASIS OF EXPERT INTERVIEWS (NES)........................................................................40
LITERATURE...........................................................................................................45
GEM TEAMS............................................................................................................46
AUTHORS..............................................................................................................50
6
GLOBAL ENTREPRENEURSHIP MONITOR
List of illustrations
Figure 1. The GEM conceptual model
Figure 2. The entrepreneurial process and operational definitions
Figure 3. Attitudes of Russian population and beginning entrepreneurs towards entrepreneurship, 2010, %
Figure 4. Tempo of growth of potential entrepreneurship in relation to economic type, %
Figure 5. Influence of the economic crisis on entrepreneurs’ evaluation of opportunities for starting business, relative to 2009, %
Figure 6. Influence of economic crisis on entrepreneurs’ evaluation of possibilities for business growth relative to 2009, %
Figure 7. The influence of economic crisis on entrepreneurs’ evaluations of business opportunities in relation to 2009, %
Figure 8. Index of entrepreneurial activity and GDP per capital, % Source: APS 2010
Figure 9. Established entrepreneurs relative to general entrepreneurship, %
Figure 10. State of 14 measures for Russia, %
Figure 11. Dynamics of the number of early-stage entrepreneurs “by necessity,” 2009—2010, % Source: APS 2009—2010
Figure 12. Distribution of improvement-driven opportunity entrepreneurs, %
Figure 13. Coefficient of entrepreneurship expansion (level of nascent entrepreneurship versus level of business closure)
in different types of economies, %
Figure 14. Reasons for market exit in Russia and in GEM countries
Figure 15. Dynamics of early-stage entrepreneurs by gender, 2006–2010
Picture 16. Dynamics of established entrepreneurs by gender, 2006–2010
Figure 17. Distribution of early-stage and established entrepreneurs by age, %
Figure 18. Activity of early-stage and established entrepreneurs by educational attainment, %
Figure 19 Activity of potential and early-stage entrepreneurs by type of employment, %
Figure 20. Activity of potential and nascent entrepreneurs by settlement type, %
Figure 21. Sectoral distribution of Russian entrepreneurs, %
Figure 22. Product/service novelty for early-stage and established entrepreneurs, %
Figure 23. Competitive environment for early-stage and established entrepreneurs, %
Figure 24. Use of technology by early-stage and established entrepreneurs, %
Figure 25. Index of novelty of product/intensity of competition for early-stage and established entrepreneurs for four countries
Figure 26. Activity of entrepreneurs in high-tech sector, %
Figure 27. Experts’ estimations of entrepreneurial framework conditions in Russia, average values
Figure 28. R&D transfer in GEM countries
Figure 29. Governmental programs for supporting entrepreneurship in GEM countries
Figure 30. Russian experts’ ratings of factors for entrepreneurial development
List of tables
Table 1. Types of economies
Table 2. Basic indicators of entrepreneurial activity for project GEM
Table 3. Entrepreneurial activity in GEM countries in 2009, by level of economic development
Table 4. Global Entrepreneurship and Economic Development Index
Table 5. Subindices
Table 6. Entrepreneurial Framework Conditions for entrepreneurship development
7
RUSSIA 2010
Project goalsGEM focuses on the following goals:
• to undertake cross-national comparisons of levels of entrepreneurial activity;
• to identify factors that stimulate or constrain the level of entrepreneurial activity;
Data collection • Adult Population Surveys (APS) are based
on a special questionnaire revealing respondents’ attitudes to conditions of entrepreneurial activity and their involvement in the entrepreneurial process. The minimal representative sample in each country is 2000 adults.1
• To measure framework conditions of entrepreneurship, the GEM project uses expert evaluation – National Expert Surveys (NES), a survey of entrepreneurs and experts in entrepreneurship,
the widest research initiatives on entrepreneurship.
Since 2006, Russian team in GEM consortium is represented by the Graduate School of Management, St. Petersburg State University and the National Research University—Higher School of Economics, Moscow.
Despite the widespread view of entrepreneurship as an engine of the economy, the mechanism of interaction between entrepreneurship and economic growth has not been fully investigated. One of the main factors preventing a deeper understanding of this interaction is the paucity of data. To fill this gap, the GEM project has developed an annually renewed database (unique for its scope) providing important information for comprehensive analyses of entrepreneurship at national and global levels.
• to identify differences in levels of entrepreneurial activity and relations to economic growth;
• to suggest measures for increasing entrepreneurial activity at the national level.
using special questionnaires and in-depth interviews. The questionnaire has 10 parts corresponding to GEM classifications of main framework conditions influencing entrepreneurial activity and economic growth. The selection of experts was conducted through a semi-standardized procedure. The expert sample should comprise at least 36 experts and include men and women from various areas of professional activity and different geographical regions.
• National economic and demographic data.
WHAT IS GEM?
Global Entrepreneurship Monitor (GEM) is a joint project of the world’s leading business schools that conducts a series of cross-national research projects on entrepreneurial development and that facilitates the exchange of information on entrepreneurial activity in different countries.
The GEM project was conceived in 1997 at the initiative of leading academics from Great Britain, the United States, Finland, and Ireland. Institutional support for the project has been provided by two key organizations in the field of entrepreneurial studies: Babson College (USA) and London Business School. The first annual report was delivered in 1999 and prepared by 10 countries. Since then, the number of participants has grown continuously: from 20 in 2000 to 55 (including Russia) in 2010. At present the GEM project is one of
1 In 2010 APS was conducted by a research team headed by Professor A. Chepurenko (HSE, Moscow).
8
GLOBAL ENTREPRENEURSHIP MONITOR
The GEM conceptual modelGEM research has found that the interaction
between entrepreneurial activity and economic growth varies depending on level of economic development. A U-shaped curve reveals this relation empirically, but this does not fully reveal cause-effect relations between entrepreneurship and growth. After the
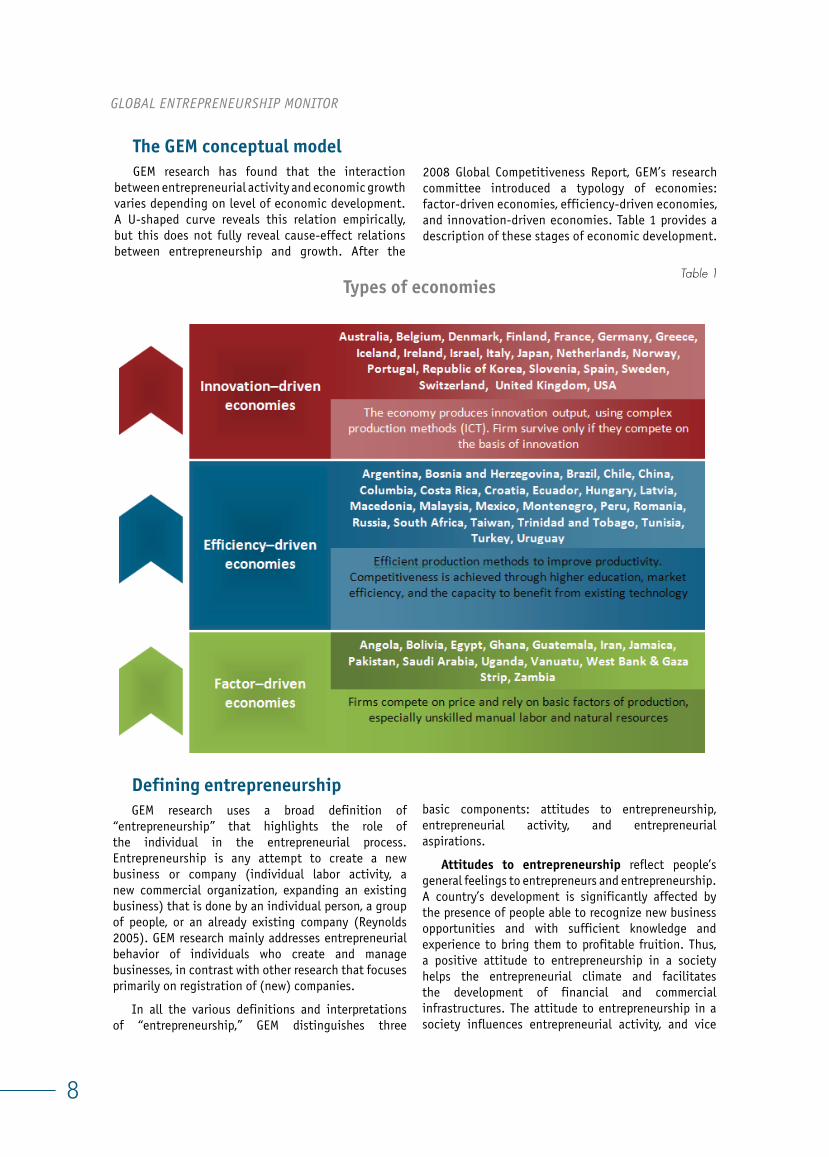
2008 Global Competitiveness Report, GEM’s research committee introduced a typology of economies: factor-driven economies, efficiency-driven economies, and innovation-driven economies. Table 1 provides a description of these stages of economic development.
Table 1Types of economies
Defining entrepreneurshipGEM research uses a broad definition of
“entrepreneurship” that highlights the role of the individual in the entrepreneurial process. Entrepreneurship is any attempt to create a new business or company (individual labor activity, a new commercial organization, expanding an existing business) that is done by an individual person, a group of people, or an already existing company (Reynolds 2005). GEM research mainly addresses entrepreneurial behavior of individuals who create and manage businesses, in contrast with other research that focuses primarily on registration of (new) companies.
In all the various definitions and interpretations of “entrepreneurship,” GEM distinguishes three
basic components: attitudes to entrepreneurship, entrepreneurial activity, and entrepreneurial aspirations.
Attitudes to entrepreneurship reflect people’s general feelings to entrepreneurs and entrepreneurship. A country’s development is significantly affected by the presence of people able to recognize new business opportunities and with sufficient knowledge and experience to bring them to profitable fruition. Thus, a positive attitude to entrepreneurship in a society helps the entrepreneurial climate and facilitates the development of financial and commercial infrastructures. The attitude to entrepreneurship in a society influences entrepreneurial activity, and vice
9
RUSSIA 2010
versa. For example, the acceptance of entrepreneurship in a society, reflected in the population’s positive attitudes to it, depends on whether people know someone who opened a business recently. This reflects both the level of entrepreneurial activity and the development of the business community.
Entrepreneurial activity is a complex phenomenon that describes the involvement of a population in the process of creating new companies, managing recently created and established companies, and closing unwanted or inefficient businesses.
Entrepreneurial activity is a dynamic process, and for this reason GEM analyzes different stages in the development of entrepreneurship: from conceiving a business, through nascent entrepreneurs, to early-stage and established entrepreneurs. The study of various components of entrepreneurial activity draws out important distinctions in the process of creating new companies at different stages of a country’s economic development. For example, statistical data show that the number of nascent entrepreneurs and owners of newly created businesses will be higher in factor-driven economies, in all likelihood because the majority of these initiatives are motivated by urgent economic needs. Also, more innovation-motivated entrepreneurs can be found in innovation-driven economies than in factor-driven and efficiency-driven economies.
Entrepreneurial aspirations give qualitative characteristics of entrepreneurial activity. The GEM project has developed a special system of indicators related to these aspirations: launching new products, implementing new production processes, expanding into foreign markets, and developing companies. If these aspirations are fulfilled, they significantly influence the economic impact of entrepreneurship. Therefore, product and process innovations, internalization, and expectation of company growth are crucial features of this high growth entrepreneurship.
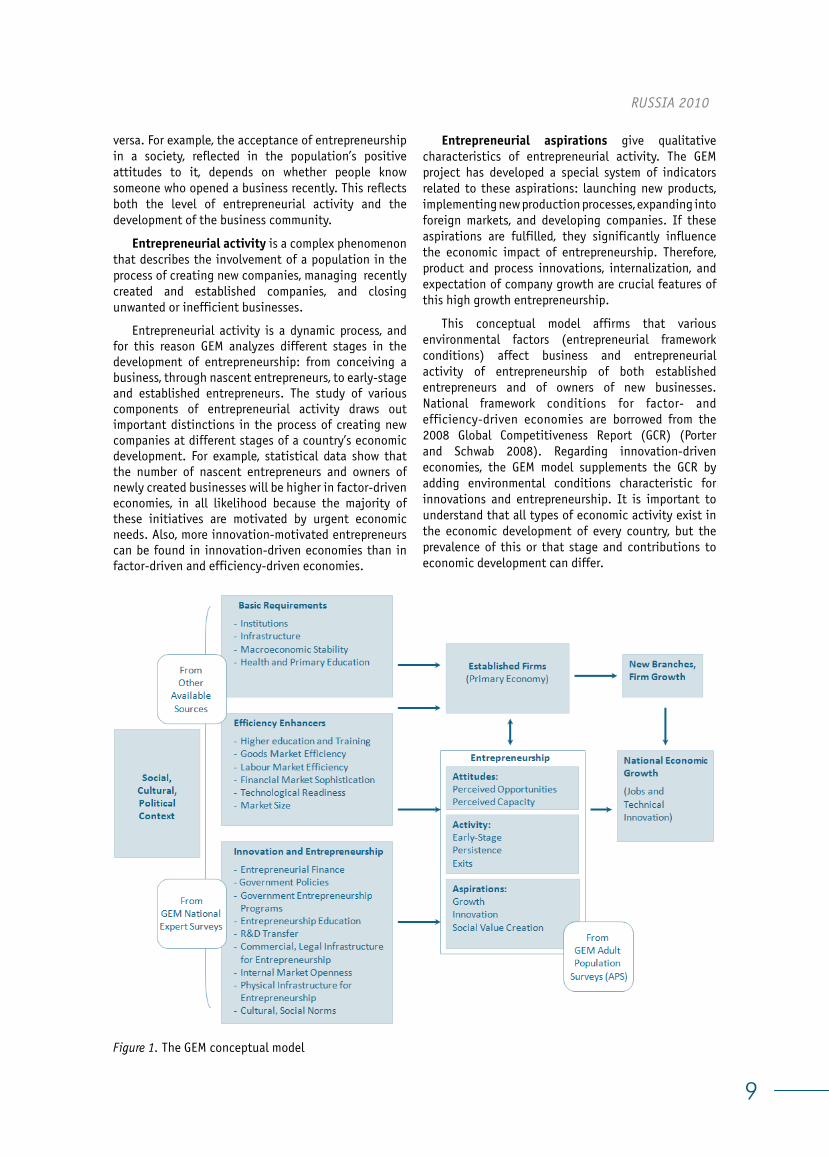
This conceptual model affirms that various environmental factors (entrepreneurial framework conditions) affect business and entrepreneurial activity of entrepreneurship of both established entrepreneurs and of owners of new businesses. National framework conditions for factor- and efficiency-driven economies are borrowed from the 2008 Global Competitiveness Report (GCR) (Porter and Schwab 2008). Regarding innovation-driven economies, the GEM model supplements the GCR by adding environmental conditions characteristic for innovations and entrepreneurship. It is important to understand that all types of economic activity exist in the economic development of every country, but the prevalence of this or that stage and contributions to economic development can differ.
Figure 1. The GEM conceptual model
10
GLOBAL ENTREPRENEURSHIP MONITOR
Types of entrepreneursGEM conducts systematic research into diverse
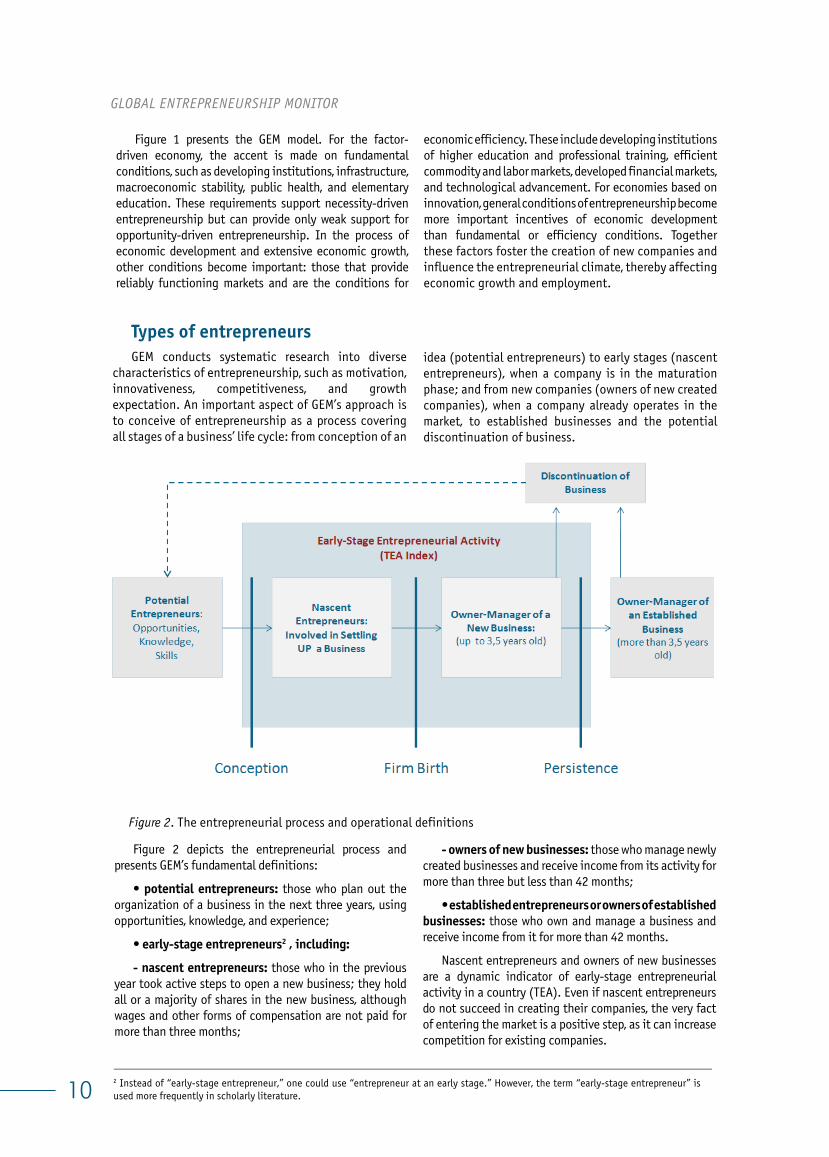
characteristics of entrepreneurship, such as motivation, innovativeness, competitiveness, and growth expectation. An important aspect of GEM’s approach is to conceive of entrepreneurship as a process covering all stages of a business’ life cycle: from conception of an
idea (potential entrepreneurs) to early stages (nascent entrepreneurs), when a company is in the maturation phase; and from new companies (owners of new created companies), when a company already operates in the market, to established businesses and the potential discontinuation of business.
Figure 2 depicts the entrepreneurial process and presents GEM’s fundamental definitions:
• potential entrepreneurs: those who plan out the organization of a business in the next three years, using opportunities, knowledge, and experience;
• early-stage entrepreneurs2 , including:
- nascent entrepreneurs: those who in the previous year took active steps to open a new business; they hold all or a majority of shares in the new business, although wages and other forms of compensation are not paid for more than three months;
Figure 2. The entrepreneurial process and operational definitions
- owners of new businesses: those who manage newly created businesses and receive income from its activity for more than three but less than 42 months;
• established entrepreneurs or owners of established businesses: those who own and manage a business and receive income from it for more than 42 months.
Nascent entrepreneurs and owners of new businesses are a dynamic indicator of early-stage entrepreneurial activity in a country (TEA). Even if nascent entrepreneurs do not succeed in creating their companies, the very fact of entering the market is a positive step, as it can increase competition for existing companies.
2 Instead of “early-stage entrepreneur,” one could use “entrepreneur at an early stage.” However, the term “early-stage entrepreneur” is used more frequently in scholarly literature.
Figure 1 presents the GEM model. For the factor-driven economy, the accent is made on fundamental conditions, such as developing institutions, infrastructure, macroeconomic stability, public health, and elementary education. These requirements support necessity-driven entrepreneurship but can provide only weak support for opportunity-driven entrepreneurship. In the process of economic development and extensive economic growth, other conditions become important: those that provide reliably functioning markets and are the conditions for
economic efficiency. These include developing institutions of higher education and professional training, efficient commodity and labor markets, developed financial markets, and technological advancement. For economies based on innovation, general conditions of entrepreneurship become more important incentives of economic development than fundamental or efficiency conditions. Together these factors foster the creation of new companies and influence the entrepreneurial climate, thereby affecting economic growth and employment.
11
RUSSIA 2010
Attitudes to entrepreneurship reflect a population’s general feelings to entrepreneurship as an overall phenomenon and to entrepreneurs as individuals, and this not only generates the socio-psychological climate for the development of entrepreneurship in a country, but also stimulates the attraction of financial resources and the development of infrastructure and a business community for entrepreneurs.
Factors significant for starting entrepreneurial activity include both individual-level traits and national features in the development of entrepreneurship. In GEM model, the following indicators are measured:
Individual-level traits:
• Assessment of how conducive the context is for opening businesses;
• The presence among citizens of entrepreneurial abilities that depend on education necessary for beginning entrepreneurial activity and sufficiently high self-evaluation;
• Assessment of the level of risk an individual might face when embarking on business.
National specifics:
• Existing system of social norms, including a positive perception of entrepreneurship as developing of one’s career, social prestige of entrepreneurship, and inclinations to high standards of living;
• Existence of a business community;
• Public opinion about entrepreneurship formed in part by the mass media to create a successful image or type of entrepreneur.
To assess the possibilities for developing entrepreneurship in a particular country, respondents were asked if they thought in their country/region would be favorable conditions for creating businesses in
the next six months. In general, a favorable assessment of the environment positively influences the level of entrepreneurial activity, although this is less about real conditions and more about how a population views prospects for creating businesses. Many factors influence perceptions of business opportunities, including general economic conditions in a country or region, the existence of advanced entrepreneurial culture, historical experience, and education.
Assessments of environmental favorability for creating businesses declines in proportion to economic development among participating GEM countries: in factor-driven countries the average value for this measure is 62%; in efficiency-driven countries this value is 43%; and in innovation-driven economies this measure is 33%. This trend might be caused by differences in stages of development, when people have different conceptions of the quality and complexity involved in creating businesses [Kelly Bosma, Amoros, 2011]. In Uganda and Ghana 80% and 75% of respondents assess prospects for business development as favorable, with a high level of necessity-driven entrepreneurship and a low level of innovativeness and aspirations to growth. Only 34% of Americans and 35% of Israelis—leaders in quality of entrepreneurship—consider their environments as suitable.
In Russia only 21,7% of respondents (fig. 3) considered conditions for business development as favorable in 2010, which is significantly lower than the average evaluation for efficiency-driven countries (42,9%). Examining dynamics of this measure, we see that prior to the 2008 economic crisis practically one third of the population considered conditions for business start-ups as favorable; 2009 witnessed a sharp drop in the percentage of those who evaluated conditions as positive (17%). Thus, even some increase in this measure can be considered to be a positive trend.
ATTITUDES TO ENTREPRENEURSHIP IN THE SOCIETY
Attitudes to Entrepreneurship
12
GLOBAL ENTREPRENEURSHIP MONITOR
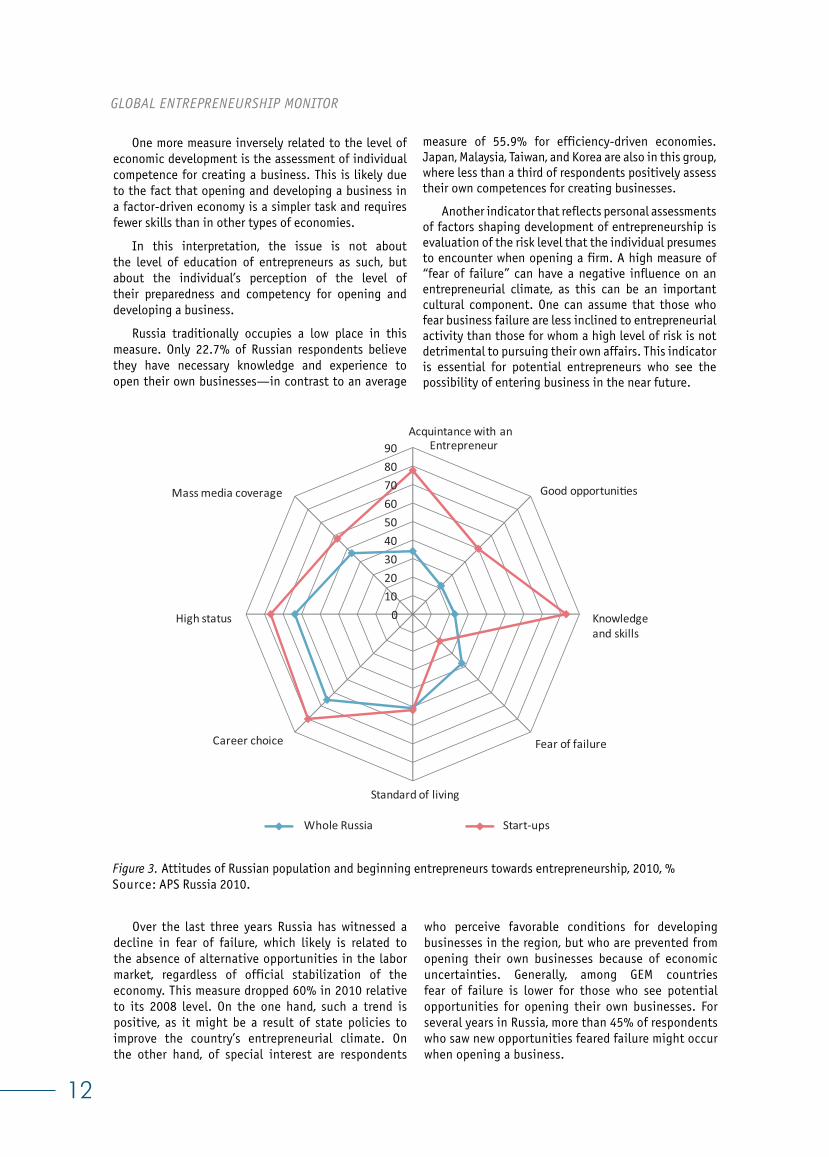
Figure 3. Attitudes of Russian population and beginning entrepreneurs towards entrepreneurship, 2010, %Source: APS Russia 2010.
Over the last three years Russia has witnessed a decline in fear of failure, which likely is related to the absence of alternative opportunities in the labor market, regardless of official stabilization of the economy. This measure dropped 60% in 2010 relative to its 2008 level. On the one hand, such a trend is positive, as it might be a result of state policies to improve the country’s entrepreneurial climate. On the other hand, of special interest are respondents
One more measure inversely related to the level of economic development is the assessment of individual competence for creating a business. This is likely due to the fact that opening and developing a business in a factor-driven economy is a simpler task and requires fewer skills than in other types of economies.
In this interpretation, the issue is not about the level of education of entrepreneurs as such, but about the individual’s perception of the level of their preparedness and competency for opening and developing a business.
Russia traditionally occupies a low place in this measure. Only 22.7% of Russian respondents believe they have necessary knowledge and experience to open their own businesses—in contrast to an average
measure of 55.9% for efficiency-driven economies. Japan, Malaysia, Taiwan, and Korea are also in this group, where less than a third of respondents positively assess their own competences for creating businesses.
Another indicator that reflects personal assessments of factors shaping development of entrepreneurship is evaluation of the risk level that the individual presumes to encounter when opening a firm. A high measure of “fear of failure” can have a negative influence on an entrepreneurial climate, as this can be an important cultural component. One can assume that those who fear business failure are less inclined to entrepreneurial activity than those for whom a high level of risk is not detrimental to pursuing their own affairs. This indicator is essential for potential entrepreneurs who see the possibility of entering business in the near future.
who perceive favorable conditions for developing businesses in the region, but who are prevented from opening their own businesses because of economic uncertainties. Generally, among GEM countries fear of failure is lower for those who see potential opportunities for opening their own businesses. For several years in Russia, more than 45% of respondents who saw new opportunities feared failure might occur when opening a business.
0102030405060708090
Acquintance with an Entrepreneur
Good opportuni�es
Knowledge and skills
Fear of failure
Standard of living
Career choice
High status
Mass media coverage
Whole Russia Start-ups
13
RUSSIA 2010
Significant differences in evaluating environmental potential, personal competence, and possibilities to accept entrepreneurial risk by the general population and among different types of entrepreneurs were observed. As is clear in figure 3, more than 80% of entrepreneurs who opened businesses in 2010 noted that they possess necessary knowledge and experience. Also, entrepreneurs see more favorable opportunities (82% versus 23% for the population at large) for opening businesses. Entrepreneurial risks do not stop the majority of beginning entrepreneurs from starting their own ventures.
Being acquainted with an entrepreneur is an important factor in making decision to open one’s own business. Practically 80% of new entrepreneurs noted personally knowing someone who had opened their own firm in recent years. Much research shows that an entrepreneur’s social capital—especially knowing an entrepreneur personally—can double a person’s chances of beginning their own ventures.
A significant factor behind the development of entrepreneurship is the existing value system. In the GEM project, these sociocultural expectations are reflected in such indicators as the value of entrepreneurship for career development, prestige of entrepreneurship in a society, and the image formation of the successful businessman in the mass media.
A basic tendency for GEM countries is a general decline in the importance of these indicators from factor-driven to efficiency-driven economies and from efficiency-driven to innovation-driven economies. For example, in Ghana more than 90% of the population see in entrepreneurship a desired career path and give high status to entrepreneurship. In Finland, only 46% of the population considers an entrepreneurial career as desirable. Most likely this is related to different economic structures and the absence or presence of large enterprises that provide mass employment.
In Russia 65% of respondents noted that entrepreneurship is a desirable career choice. This has been a general trend over the last several years. This measure is somewhat lower than the average for efficiency-driven economies (72.8%) and is average in relation to East European countries, where the highest measure is Montenegro (81%) and the lowest is Hungary (55%). Russians also consistently consider entrepreneurs to have high status: more than 60% of respondents claimed this for three years. These measures are significant among entrepreneurs themselves. For entrepreneurs beginning their businesses, values and social status are high (77%), as is the choice of this as a career (80%).
The role of the mass media in promoting stories of successful business ventures in Russia is not so highly
valued: only 46% of respondents noted that they see cases of entrepreneurs in the media. However, attention to and popularization of entrepreneurship in the mass media can facilitate the attractiveness of entrepreneurial careers and the status of businessmen in society.
It should be noted that even with sufficiently favorable societal attitudes to entrepreneurship, in many European societies only a limited number of people try to open their own businesses [Kelly, Bosma, Amoros, 2011]. This might be related to high costs and barriers to entry, along with welfare policies that reduce inclinations to take entrepreneurial risks.
Despite the fact that a sufficiently favorable climate of public opinion has been forming in Russia, the number of people attracted to entrepreneurial activity is not high. Of course, there is no objective measure of the level of attractiveness of entrepreneurship that is optimal for a country’s economic development. Further, the presence of people able to recognize business possibilities and possessing necessary competences for their realization provides a positive influence on public opinion about entrepreneurship and the development of infrastructure, and this also stimulates the inflow of new entrepreneurial forces.
To evaluate a country’s entrepreneurial potential, an important feature is entrepreneurial activity not only of those who pursue business ventures, but also of those who gravitate to opening businesses and scrutinize possibilities to open firms in the near future.
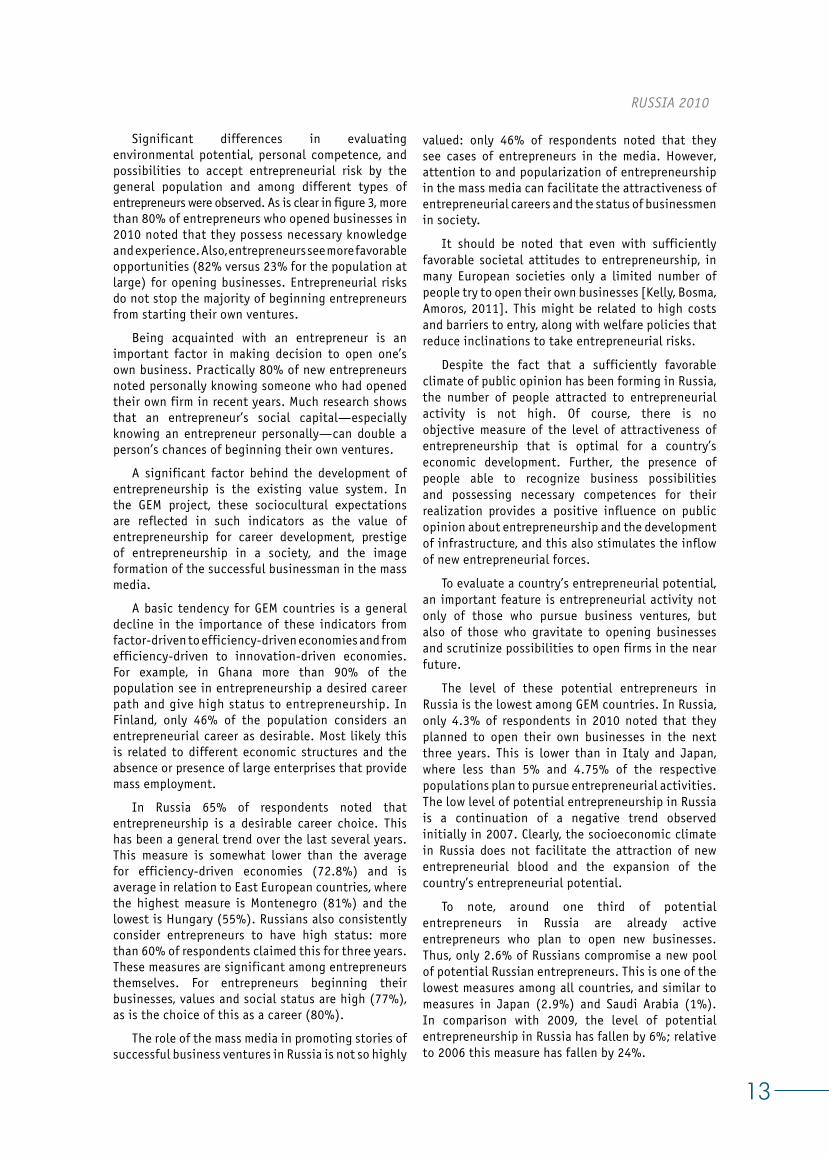
The level of these potential entrepreneurs in Russia is the lowest among GEM countries. In Russia, only 4.3% of respondents in 2010 noted that they planned to open their own businesses in the next three years. This is lower than in Italy and Japan, where less than 5% and 4.75% of the respective populations plan to pursue entrepreneurial activities. The low level of potential entrepreneurship in Russia is a continuation of a negative trend observed initially in 2007. Clearly, the socioeconomic climate in Russia does not facilitate the attraction of new entrepreneurial blood and the expansion of the country’s entrepreneurial potential.
To note, around one third of potential entrepreneurs in Russia are already active entrepreneurs who plan to open new businesses. Thus, only 2.6% of Russians compromise a new pool of potential Russian entrepreneurs. This is one of the lowest measures among all countries, and similar to measures in Japan (2.9%) and Saudi Arabia (1%). In comparison with 2009, the level of potential entrepreneurship in Russia has fallen by 6%; relative to 2006 this measure has fallen by 24%.
14
GLOBAL ENTREPRENEURSHIP MONITOR
Figure 4. Tempo of growth of potential entrepreneurship in relation to economic type, %Source: APS 2009–2010
Many innovation-driven countries in the GEM project (fig. 4) faced a reduction in that group of people who in the future could provide growth of entrepreneurial numbers. It is possible that one reason is economic stabilization and recovery from effects of the global economic crisis: how this group oscillates between opening and not opening their own businesses depends on the business environment. In conditions when large firms are healthy, the number of those willing to open their own businesses drops.
In Russia, interest in opening firms in the future exists primarily among those younger than 45 (more than 80%). The percentages of men and women willing to start a business in the near future are fairly close (53% for men and 47% for women). Up to 83% of potential
entrepreneurs have above-average levels of education. Among potential entrepreneurs, the most active are people who already have their own businesses. Among hired employees, only 3.8% are ready to pursue their own ventures. Despite the sufficiently high degree of unemployment among respondents in the sample, only 3.8% were ready to undertake some activity in creating business. Against this background, the most optimistic are students, 8.5% of whom expressed some willingness and readiness to become entrepreneurs in the next three years. Moreover, students’ entrepreneurial activity has remained fairly steady for several years. Further, only 2.5% of students are nascent entrepreneurs. Thus, the programs aimed at students could raise their involvement in actively creating businesses.
100
100
-
-
80
-60
-40
-20
0
20
40
60
80Sa
udi A
rabi
aTu
nisia
Colo
mbi
aSw
itzer
land
Gree
ceKo
rea
Slov
enia
Italy
Fran
ceNo
rway
Japa
nBo
snia
and
Her
zego
vina
Israe
lHu
ngar
yRu
ssia
Icel
and
Neth
erla
nds
Unite
d St
ates
Croa
�aCh
ileGe
rman
yUn
ited
King
dom
Rom
ania
Iran
Chin
aGu
atem
ala
Peru
Wes
t Ban
k &
Gaz
a St
ripFi
nlan
dJa
mai
caSp
ain
Braz
ilM
alay
siaBe
lgiu
mUg
anda
Urug
uay
Arge
n�na
Sout
h Af
rica
Ecua
dor
Latv
iaDe
nmar
k
Factor-driven economies Efficiency-Driven economies Innova�on-Driven economies
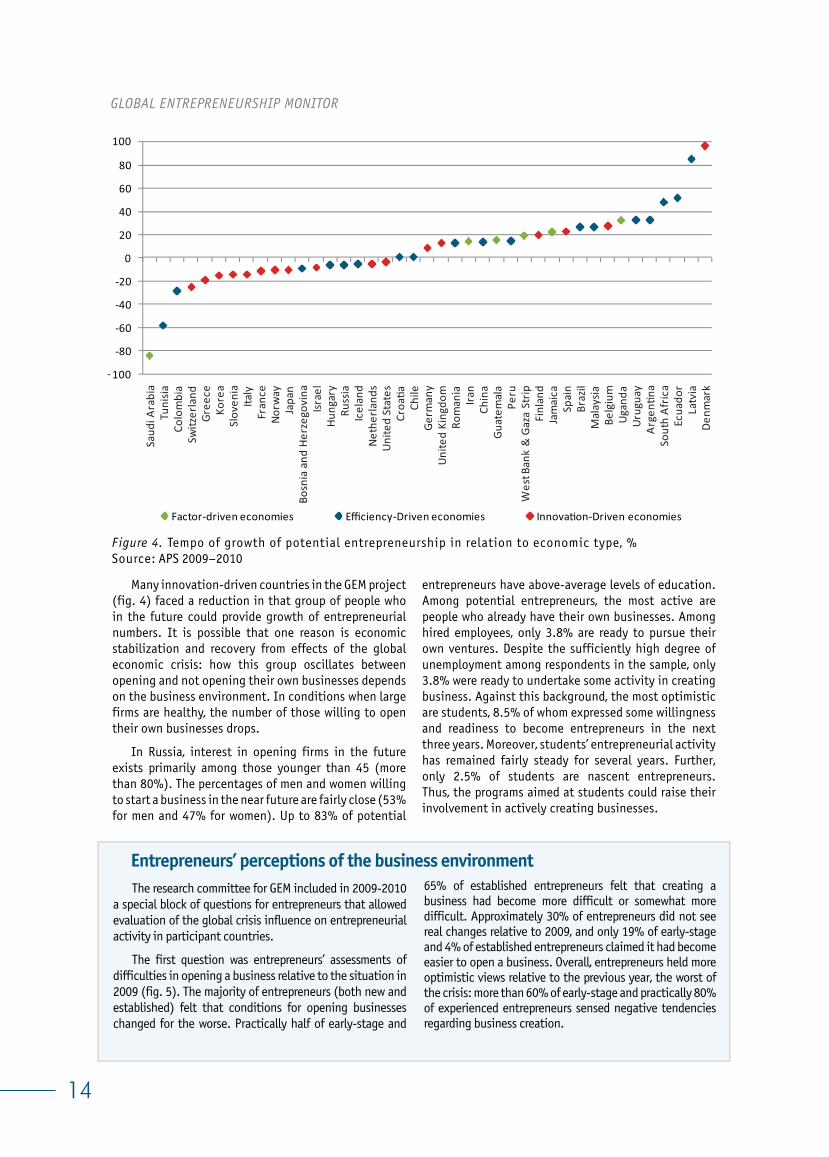
The research committee for GEM included in 2009-2010 a special block of questions for entrepreneurs that allowed evaluation of the global crisis influence on entrepreneurial activity in participant countries.
The first question was entrepreneurs’ assessments of difficulties in opening a business relative to the situation in 2009 (fig. 5). The majority of entrepreneurs (both new and established) felt that conditions for opening businesses changed for the worse. Practically half of early-stage and
65% of established entrepreneurs felt that creating a business had become more difficult or somewhat more difficult. Approximately 30% of entrepreneurs did not see real changes relative to 2009, and only 19% of early-stage and 4% of established entrepreneurs claimed it had become easier to open a business. Overall, entrepreneurs held more optimistic views relative to the previous year, the worst of the crisis: more than 60% of early-stage and practically 80% of experienced entrepreneurs sensed negative tendencies regarding business creation.
Entrepreneurs’ perceptions of the business environment
15
RUSSIA 2010
Figure 5. Influence of the economic crisis on entrepreneurs’ evaluation of opportunities for starting business, relative to 2009, %Source : APS Russia 2010
0 20 40 60 80 100
Early-Stage Entrepreneurs
Established Entrepreneurs
More Difficult Somewhat more difficult About the same
Somewhat less difficult Less difficult
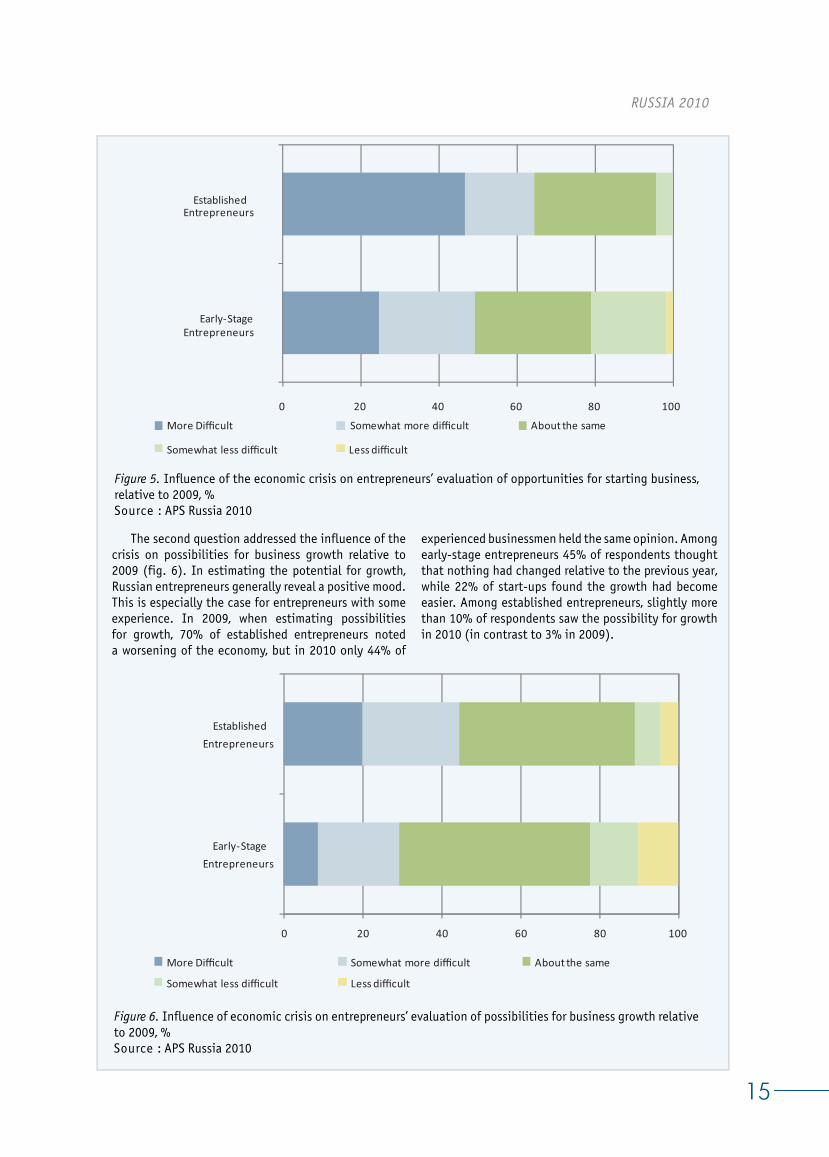
The second question addressed the influence of the crisis on possibilities for business growth relative to 2009 (fig. 6). In estimating the potential for growth, Russian entrepreneurs generally reveal a positive mood. This is especially the case for entrepreneurs with some experience. In 2009, when estimating possibilities for growth, 70% of established entrepreneurs noted a worsening of the economy, but in 2010 only 44% of
experienced businessmen held the same opinion. Among early-stage entrepreneurs 45% of respondents thought that nothing had changed relative to the previous year, while 22% of start-ups found the growth had become easier. Among established entrepreneurs, slightly more than 10% of respondents saw the possibility for growth in 2010 (in contrast to 3% in 2009).
Figure 6. Influence of economic crisis on entrepreneurs’ evaluation of possibilities for business growth relative to 2009, %Source : APS Russia 2010
0 20 40 60 80 100
Early-Stage Entrepreneurs
Established Entrepreneurs
More Difficult Somewhat more difficult About the same
Somewhat less difficult Less difficult
16
GLOBAL ENTREPRENEURSHIP MONITOR
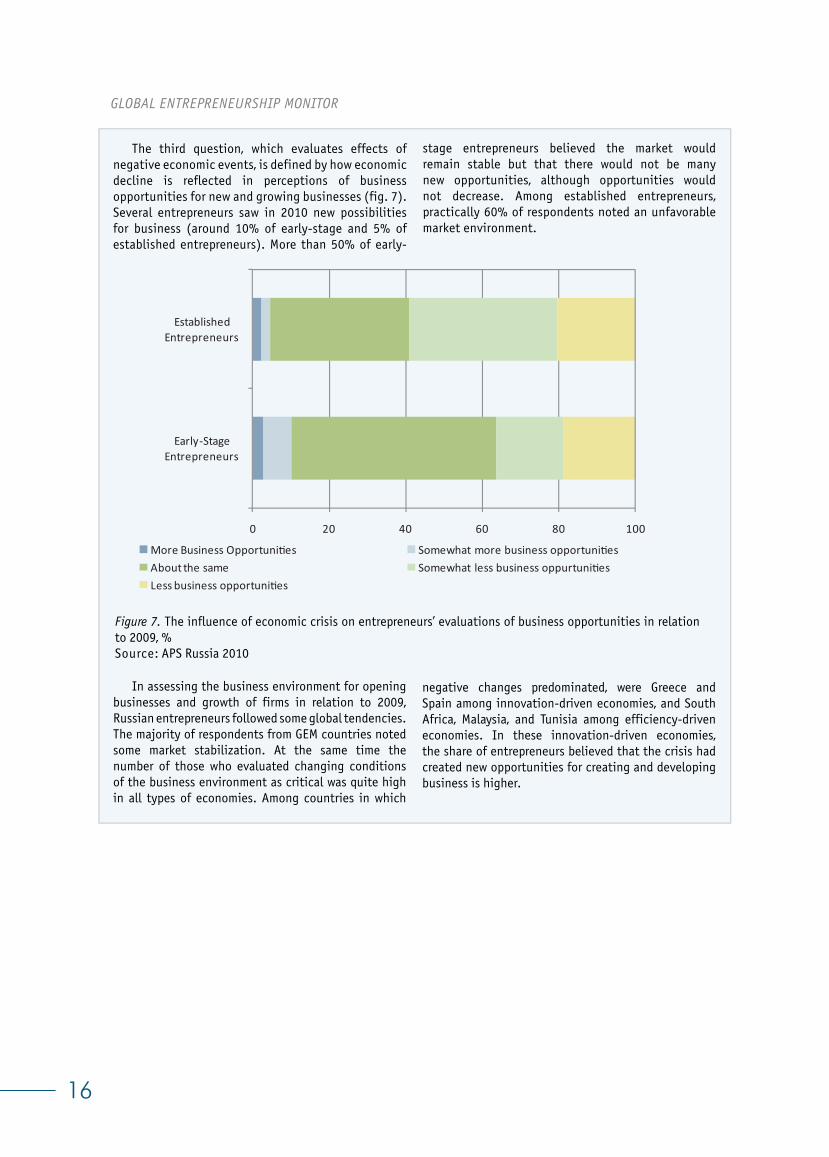
The third question, which evaluates effects of negative economic events, is defined by how economic decline is reflected in perceptions of business opportunities for new and growing businesses (fig. 7). Several entrepreneurs saw in 2010 new possibilities for business (around 10% of early-stage and 5% of established entrepreneurs). More than 50% of early-
stage entrepreneurs believed the market would remain stable but that there would not be many new opportunities, although opportunities would not decrease. Among established entrepreneurs, practically 60% of respondents noted an unfavorable market environment.
0 20 40 60 80 100
Early-Stage Entrepreneurs
Established Entrepreneurs
More Business Opportuni�es Somewhat more business opportuni�esAbout the same Somewhat less business oppurtuni�esLess business opportuni�es
Figure 7. The influence of economic crisis on entrepreneurs’ evaluations of business opportunities in relation to 2009, %Source: APS Russia 2010
In assessing the business environment for opening businesses and growth of firms in relation to 2009, Russian entrepreneurs followed some global tendencies. The majority of respondents from GEM countries noted some market stabilization. At the same time the number of those who evaluated changing conditions of the business environment as critical was quite high in all types of economies. Among countries in which
negative changes predominated, were Greece and Spain among innovation-driven economies, and South Africa, Malaysia, and Tunisia among efficiency-driven economies. In these innovation-driven economies, the share of entrepreneurs believed that the crisis had created new opportunities for creating and developing business is higher.
17
RUSSIA 2010
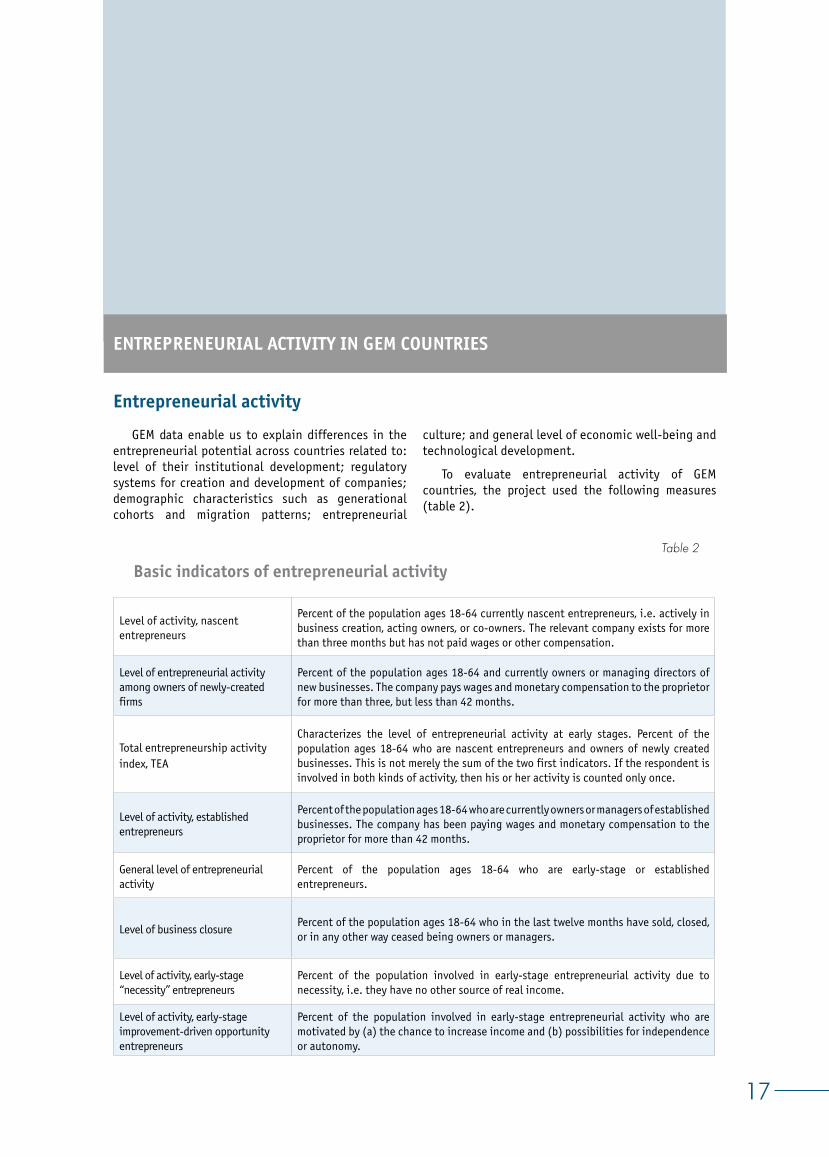
Level of activity, nascent entrepreneurs
Percent of the population ages 18-64 currently nascent entrepreneurs, i.e. actively in business creation, acting owners, or co-owners. The relevant company exists for more than three months but has not paid wages or other compensation.
Level of entrepreneurial activity among owners of newly-created firms
Percent of the population ages 18-64 and currently owners or managing directors of new businesses. The company pays wages and monetary compensation to the proprietor for more than three, but less than 42 months.
Total entrepreneurship activity index, TEA
Characterizes the level of entrepreneurial activity at early stages. Percent of the population ages 18-64 who are nascent entrepreneurs and owners of newly created businesses. This is not merely the sum of the two first indicators. If the respondent is involved in both kinds of activity, then his or her activity is counted only once.
Level of activity, established entrepreneurs
Percent of the population ages 18-64 who are currently owners or managers of established businesses. The company has been paying wages and monetary compensation to the proprietor for more than 42 months.
General level of entrepreneurial activity
Percent of the population ages 18-64 who are early-stage or established entrepreneurs.
Level of business closurePercent of the population ages 18-64 who in the last twelve months have sold, closed, or in any other way ceased being owners or managers.
Level of activity, early-stage “necessity” entrepreneurs
Percent of the population involved in early-stage entrepreneurial activity due to necessity, i.e. they have no other source of real income.
Level of activity, early-stage improvement-driven opportunity entrepreneurs
Percent of the population involved in early-stage entrepreneurial activity who are motivated by (a) the chance to increase income and (b) possibilities for independence or autonomy.
Entrepreneurial activity
GEM data enable us to explain differences in the entrepreneurial potential across countries related to: level of their institutional development; regulatory systems for creation and development of companies; demographic characteristics such as generational cohorts and migration patterns; entrepreneurial
culture; and general level of economic well-being and technological development.
To evaluate entrepreneurial activity of GEM countries, the project used the following measures (table 2).
Table 2
Basic indicators of entrepreneurial activity
ENTREPRENEURIAL ACTIVITY IN GEM COUNTRIES
18
GLOBAL ENTREPRENEURSHIP MONITOR
Co
un
try
Na
sce
nt
en
tre
pre
ne
urs
hip
ra
te
Ne
w b
usi
ne
ss
ow
ne
rsh
ip r
ate
Ea
rly
-sta
ge
en
tre
pre
ne
uri
al a
ctiv
ity
(TE
A)
Est
ab
lish
ed
bu
sin
ess
ow
ne
rsh
ip r
ate
Dis
con
tinu
atio
n o
f
bu
sin
ess
es
Ne
cess
ity-d
rive
n (
%
of TE
A)
Imp
rove
me
nt-
dri
ven
op
po
rtu
nity
(%
of TE
A)
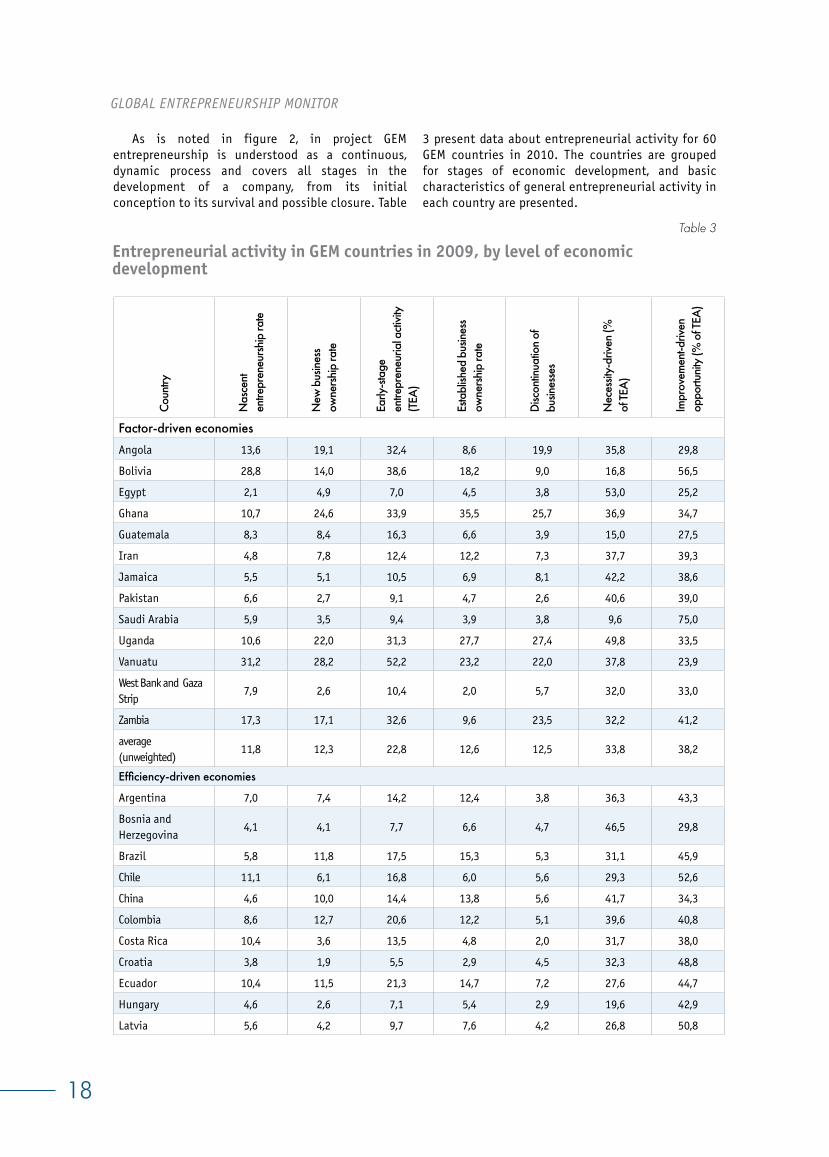
Factor-driven economies
Angola 13,6 19,1 32,4 8,6 19,9 35,8 29,8
Bolivia 28,8 14,0 38,6 18,2 9,0 16,8 56,5
Egypt 2,1 4,9 7,0 4,5 3,8 53,0 25,2
Ghana 10,7 24,6 33,9 35,5 25,7 36,9 34,7
Guatemala 8,3 8,4 16,3 6,6 3,9 15,0 27,5
Iran 4,8 7,8 12,4 12,2 7,3 37,7 39,3
Jamaica 5,5 5,1 10,5 6,9 8,1 42,2 38,6
Pakistan 6,6 2,7 9,1 4,7 2,6 40,6 39,0
Saudi Arabia 5,9 3,5 9,4 3,9 3,8 9,6 75,0
Uganda 10,6 22,0 31,3 27,7 27,4 49,8 33,5
Vanuatu 31,2 28,2 52,2 23,2 22,0 37,8 23,9
West Bank and Gaza Strip
7,9 2,6 10,4 2,0 5,7 32,0 33,0
Zambia 17,3 17,1 32,6 9,6 23,5 32,2 41,2
average (unweighted)
11,8 12,3 22,8 12,6 12,5 33,8 38,2
Effi ciency-driven economies
Argentina 7,0 7,4 14,2 12,4 3,8 36,3 43,3
Bosnia and Herzegovina
4,1 4,1 7,7 6,6 4,7 46,5 29,8
Brazil 5,8 11,8 17,5 15,3 5,3 31,1 45,9
Chile 11,1 6,1 16,8 6,0 5,6 29,3 52,6
China 4,6 10,0 14,4 13,8 5,6 41,7 34,3
Colombia 8,6 12,7 20,6 12,2 5,1 39,6 40,8
Costa Rica 10,4 3,6 13,5 4,8 2,0 31,7 38,0
Croatia 3,8 1,9 5,5 2,9 4,5 32,3 48,8
Ecuador 10,4 11,5 21,3 14,7 7,2 27,6 44,7
Hungary 4,6 2,6 7,1 5,4 2,9 19,6 42,9
Latvia 5,6 4,2 9,7 7,6 4,2 26,8 50,8
Table 3
Entrepreneurial activity in GEM countries in 2009, by level of economic development
As is noted in figure 2, in project GEM entrepreneurship is understood as a continuous, dynamic process and covers all stages in the development of a company, from its initial conception to its survival and possible closure. Table
3 present data about entrepreneurial activity for 60 GEM countries in 2010. The countries are grouped for stages of economic development, and basic characteristics of general entrepreneurial activity in each country are presented.
Èñòî÷íèê: APS 2010
Co
un
try
Na
sce
nt
en
tre
pre
ne
urs
hip
ra
te
Ne
w b
usi
ne
ss
ow
ne
rsh
ip r
ate
Ea
rly
-sta
ge
en
tre
pre
ne
uri
al a
ctiv
ity
(TE
A)
Est
ab
lish
ed
bu
sin
ess
ow
ne
rsh
ip r
ate
Dis
con
tinu
atio
n o
f
bu
sin
ess
es
Ne
cess
ity-d
rive
n (
%
of TE
A)
Imp
rove
me
nt-
dri
ven
op
po
rtu
nity
(%
of TE
A)
Macedonia 4,4 3,6 8,0 7,6 3,7 58,7 22,8
Malaysia 1,4 3,6 5,0 7,9 1,9 12,4 41,2
Mexico 8,6 2,0 10,5 0,4 5,9 19,0 41,5
Montenegro 12,0 3,1 14,9 7,8 7,3 37,1 38,2
Peru 22,1 6,0 27,2 7,2 9,2 21,3 47,4
Romania 3,3 1,1 4,3 2,1 2,6 31,1 47,2
Russia 2,1 1,9 3,9 2,8 0,8 32,0 30,3
South Africa 5,1 3,9 8,9 2,1 4,8 36,0 31,1
Taiwan 4,7 3,8 8,4 7,2 3,7 30,4 48,0
Trinidad and Tobago
8,9 6,4 15,1 8,5 2,9 14,3 47,3
Tunisia 1,7 4,4 6,1 9,0 4,1 23,7 48,0
Turkey 3,7 5,1 8,6 10,7 4,6 37,3 46,7
Uruguay 7,8 4,1 11,7 7,2 3,5 26,0 53,5
average (unweighted)
6,7 5,2 11,7 7,6 4,4 30,9 42,3
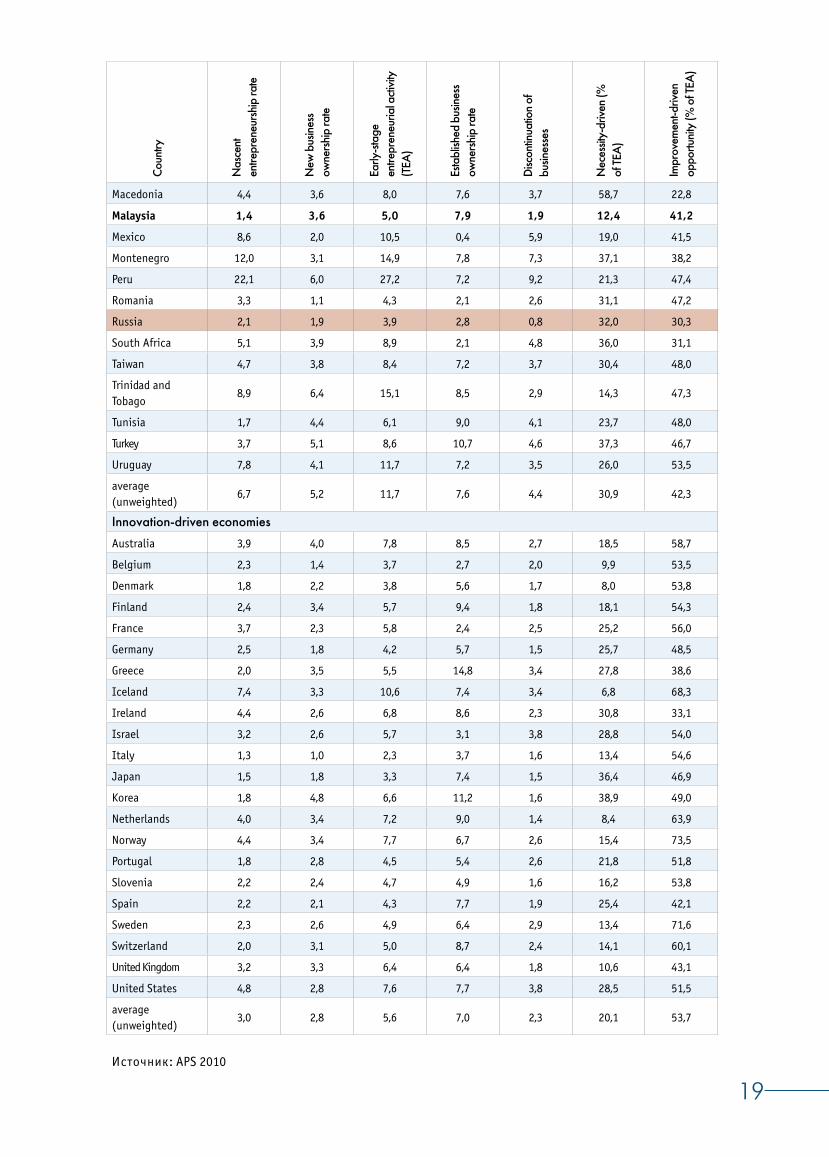
Innovation-driven economies
Australia 3,9 4,0 7,8 8,5 2,7 18,5 58,7
Belgium 2,3 1,4 3,7 2,7 2,0 9,9 53,5
Denmark 1,8 2,2 3,8 5,6 1,7 8,0 53,8
Finland 2,4 3,4 5,7 9,4 1,8 18,1 54,3
France 3,7 2,3 5,8 2,4 2,5 25,2 56,0
Germany 2,5 1,8 4,2 5,7 1,5 25,7 48,5
Greece 2,0 3,5 5,5 14,8 3,4 27,8 38,6
Iceland 7,4 3,3 10,6 7,4 3,4 6,8 68,3
Ireland 4,4 2,6 6,8 8,6 2,3 30,8 33,1
Israel 3,2 2,6 5,7 3,1 3,8 28,8 54,0
Italy 1,3 1,0 2,3 3,7 1,6 13,4 54,6
Japan 1,5 1,8 3,3 7,4 1,5 36,4 46,9
Korea 1,8 4,8 6,6 11,2 1,6 38,9 49,0
Netherlands 4,0 3,4 7,2 9,0 1,4 8,4 63,9
Norway 4,4 3,4 7,7 6,7 2,6 15,4 73,5
Portugal 1,8 2,8 4,5 5,4 2,6 21,8 51,8
Slovenia 2,2 2,4 4,7 4,9 1,6 16,2 53,8
Spain 2,2 2,1 4,3 7,7 1,9 25,4 42,1
Sweden 2,3 2,6 4,9 6,4 2,9 13,4 71,6
Switzerland 2,0 3,1 5,0 8,7 2,4 14,1 60,1
United Kingdom 3,2 3,3 6,4 6,4 1,8 10,6 43,1
United States 4,8 2,8 7,6 7,7 3,8 28,5 51,5
average (unweighted)
3,0 2,8 5,6 7,0 2,3 20,1 53,7
19
20
GLOBAL ENTREPRENEURSHIP MONITOR
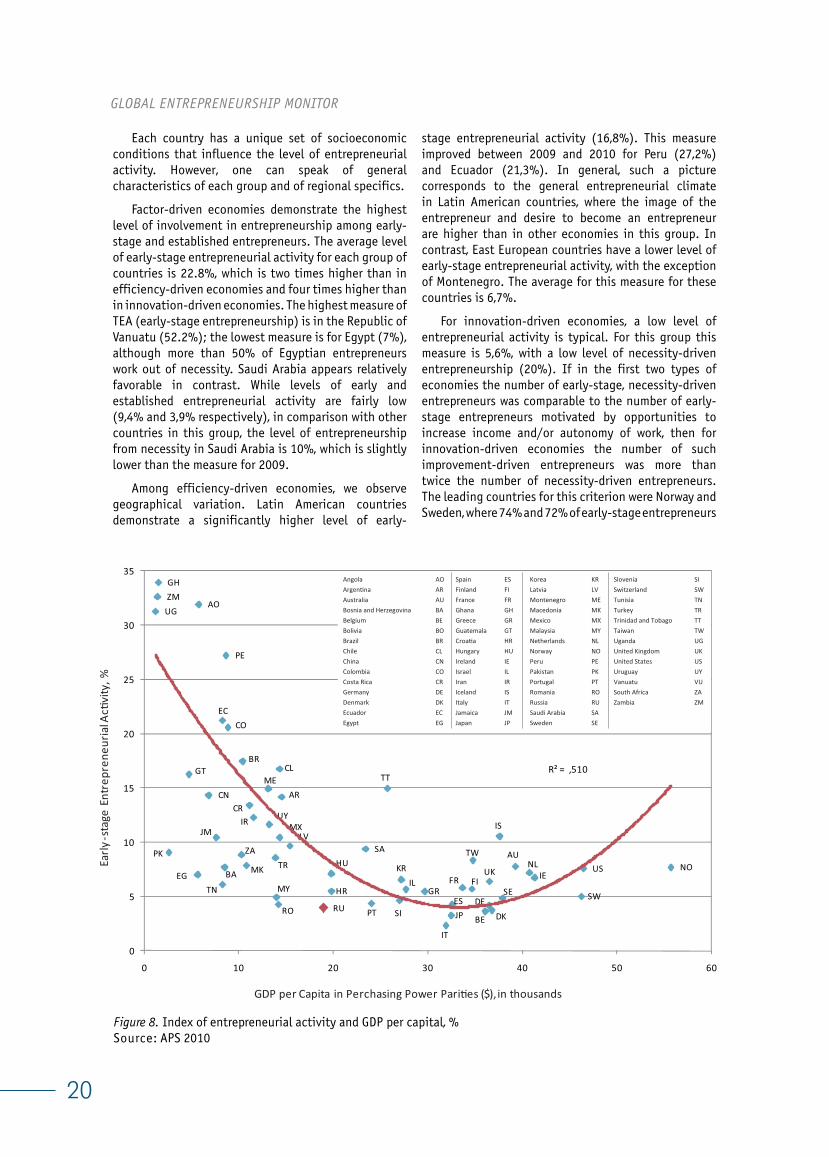
UGZMGH
PK
GT
EG
AO
CN
TW
JM
EC
TN
BA
PE
CO
ZA
BR
MK
CRIR
ME
UY
TR
MY
RO
CL
MX
AR
LV
RU
HU
HR
SA
PT
TT
SI
KRIL
GR
IT
JPES
FR FI
BE
DE
UK
DK
IS
SE
AUNL
IE
SW
US NO
R² = ,510
0
5
10
15
20
25
30
35
0 10 20 30 40 50 60
Early
-sta
ge E
ntre
pren
euria
l Ac�
vity
, %
GDP per Capita in Perchasing Power Pari�es ($), in thousands
AngolaArgen�naAustraliaBosnia and HerzegovinaBelgiumBoliviaBrazilChileChinaColombiaCosta RicaGermanyDenmarkEcuadorEgypt
SpainFinlandFranceGhanaGreeceGuatemalaCroa�aHungaryIrelandIsraelIranIcelandItalyJamaicaJapan
KoreaLatviaMontenegroMacedoniaMexicoMalaysiaNetherlandsNorwayPeruPakistanPortugalRomaniaRussiaSaudi ArabiaSweden
AOARAUBABEBOBRCLCNCOCRDEDKECEG
ESFIFRGHGRGTHRHUIEILIRISITJMJP
KRLVMEMKMXMYNLNOPEPKPTRORUSASE
SISWTNTRTTTWUGUKUSUYVUZAZM
SloveniaSwitzerlandTunisiaTurkeyTrinidad and TobagoTaiwanUgandaUnited KingdomUnited StatesUruguayVanuatuSouth AfricaZambia
Each country has a unique set of socioeconomic conditions that influence the level of entrepreneurial activity. However, one can speak of general characteristics of each group and of regional specifics.
Factor-driven economies demonstrate the highest level of involvement in entrepreneurship among early-stage and established entrepreneurs. The average level of early-stage entrepreneurial activity for each group of countries is 22.8%, which is two times higher than in efficiency-driven economies and four times higher than in innovation-driven economies. The highest measure of TEA (early-stage entrepreneurship) is in the Republic of Vanuatu (52.2%); the lowest measure is for Egypt (7%), although more than 50% of Egyptian entrepreneurs work out of necessity. Saudi Arabia appears relatively favorable in contrast. While levels of early and established entrepreneurial activity are fairly low (9,4% and 3,9% respectively), in comparison with other countries in this group, the level of entrepreneurship from necessity in Saudi Arabia is 10%, which is slightly lower than the measure for 2009.
Among efficiency-driven economies, we observe geographical variation. Latin American countries demonstrate a significantly higher level of early-
stage entrepreneurial activity (16,8%). This measure improved between 2009 and 2010 for Peru (27,2%) and Ecuador (21,3%). In general, such a picture corresponds to the general entrepreneurial climate in Latin American countries, where the image of the entrepreneur and desire to become an entrepreneur are higher than in other economies in this group. In contrast, East European countries have a lower level of early-stage entrepreneurial activity, with the exception of Montenegro. The average for this measure for these countries is 6,7%.
For innovation-driven economies, a low level of entrepreneurial activity is typical. For this group this measure is 5,6%, with a low level of necessity-driven entrepreneurship (20%). If in the first two types of economies the number of early-stage, necessity-driven entrepreneurs was comparable to the number of early-stage entrepreneurs motivated by opportunities to increase income and/or autonomy of work, then for innovation-driven economies the number of such improvement-driven entrepreneurs was more than twice the number of necessity-driven entrepreneurs. The leading countries for this criterion were Norway and Sweden, where 74% and 72% of early-stage entrepreneurs
Figure 8. Index of entrepreneurial activity and GDP per capital, %Source: APS 2010
21
RUSSIA 2010
0%
10%
20%
30%
40%
50%
60%
70%
80%
Gaza
Str
ipAn
gola
Zam
bia
Saud
i Ara
bia
Guat
emal
aVa
nuat
uPa
kist
anBo
livia
Egyp
tJa
mai
caUg
anda Ira
nGh
ana
Mex
ico
Sout
h Af
rica
Peru
Chile
Cost
a Ri
caRo
man
iaCr
oa�a
Mon
tene
gro
Trin
idad
and
Tob
ago
Colo
mbi
aUr
ugua
yEc
uado
rRu
ssia
Hung
ary
Latv
iaBo
snia
and
…Ta
iwan
Braz
ilAr
gen�
naCh
ina
Mac
edon
iaTu
rkey
Tuni
siaM
alay
siaFr
ance
Israe
lIc
elan
dBe
lgiu
mNo
rway
Unite
d St
ates
Unite
d Ki
ngdo
mSl
oven
iaAu
stra
liaPo
rtug
alNe
ther
land
sIre
land
Swed
enDe
nmar
kGe
rman
yIta
lyFi
nlan
dKo
rea
Azor
esSw
itzer
land
Spai
nJa
pan
Gree
ce
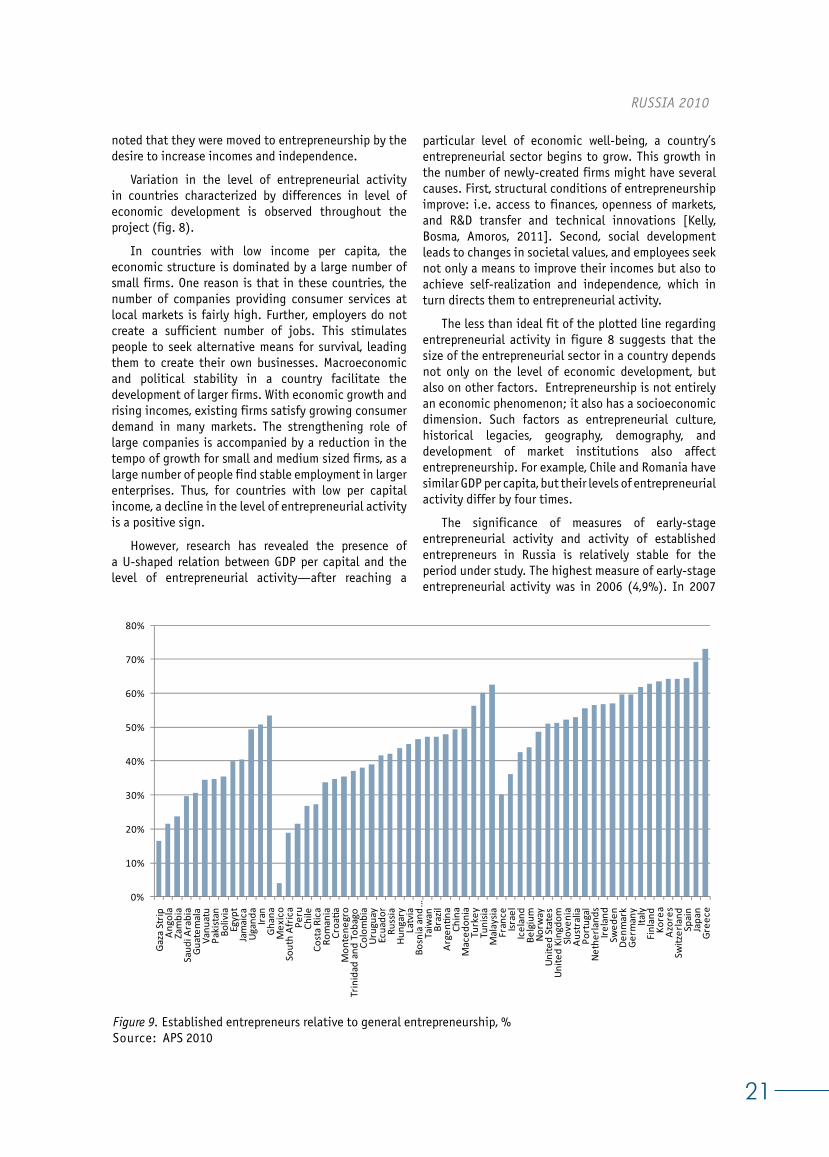
Figure 9. Established entrepreneurs relative to general entrepreneurship, %Source: APS 2010
noted that they were moved to entrepreneurship by the desire to increase incomes and independence.
Variation in the level of entrepreneurial activity in countries characterized by differences in level of economic development is observed throughout the project (fig. 8).
In countries with low income per capita, the economic structure is dominated by a large number of small firms. One reason is that in these countries, the number of companies providing consumer services at local markets is fairly high. Further, employers do not create a sufficient number of jobs. This stimulates people to seek alternative means for survival, leading them to create their own businesses. Macroeconomic and political stability in a country facilitate the development of larger firms. With economic growth and rising incomes, existing firms satisfy growing consumer demand in many markets. The strengthening role of large companies is accompanied by a reduction in the tempo of growth for small and medium sized firms, as a large number of people find stable employment in larger enterprises. Thus, for countries with low per capital income, a decline in the level of entrepreneurial activity is a positive sign.
However, research has revealed the presence of a U-shaped relation between GDP per capital and the level of entrepreneurial activity—after reaching a
particular level of economic well-being, a country’s entrepreneurial sector begins to grow. This growth in the number of newly-created firms might have several causes. First, structural conditions of entrepreneurship improve: i.e. access to finances, openness of markets, and R&D transfer and technical innovations [Kelly, Bosma, Amoros, 2011]. Second, social development leads to changes in societal values, and employees seek not only a means to improve their incomes but also to achieve self-realization and independence, which in turn directs them to entrepreneurial activity.
The less than ideal fit of the plotted line regarding entrepreneurial activity in figure 8 suggests that the size of the entrepreneurial sector in a country depends not only on the level of economic development, but also on other factors. Entrepreneurship is not entirely an economic phenomenon; it also has a socioeconomic dimension. Such factors as entrepreneurial culture, historical legacies, geography, demography, and development of market institutions also affect entrepreneurship. For example, Chile and Romania have similar GDP per capita, but their levels of entrepreneurial activity differ by four times.
The significance of measures of early-stage entrepreneurial activity and activity of established entrepreneurs in Russia is relatively stable for the period under study. The highest measure of early-stage entrepreneurial activity was in 2006 (4,9%). In 2007
22
GLOBAL ENTREPRENEURSHIP MONITOR
Global Entrepreneurship and Economic Development Index, GEDI
this measure dropped, which might have been due to the stable development of larger corporations that provided employment and reasonable wages. Clearly, the 2008 crisis led to reductions in employment, which might have forced many people to become entrepreneurs. This said, regardless of expectations of growth in entrepreneurial activity, the TEA index in Russia did not grow in 2009 or 2010, and remained at a level of 3,9%.
As was noted, the majority of new small firms are opened in developing countries with factor-driven economies and often enough in efficiency-driven economies. However, the survival rate of such businesses in these countries is significantly lower than in innovation-driven economies. Figure 9 presents the proportion of mature entrepreneurs relative to the total number of entrepreneurs (early-stage and established). We notice that in economically developed countries
Over the course of several years GEM has studied the U-shaped relationship between entrepreneurship and economic growth. However, recent research has revealed a number of limitations in measuring entrepreneurship by number of companies created. Such a method does not consider the contribution of different businesses to economic development. Thus, countries in which a large percentage of the population participates in opening new firms are considered more entrepreneurial. Yet it is problematic to claim that entrepreneurship in Ghana, Zambia, and Uganda—which have high early-stage entrepreneurial activity, according to GEM measures—is more successful than in the United States or Western Europe. If we use only the TEA index, it seems entrepreneurship declines with economic development—but this contradicts economic theory. Further, institutional variation has a significant effect on the quality of entrepreneurship. The Global Entrepreneurship and Economic Development Index
the number of companies in operation more than 3.5 years is significantly greater than the quantity of newly created companies. If on average the proportion of established businesses among all entrepreneurs in factor-driven economies is around 35%, in innovation-driven economies this figure is 56%. The leaders for this measure are Greece, Japan, Spain, Switzerland, and Finland, where more than 60% (and in Greece more than 70%) of entrepreneurs run companies in existence for more than 3.5 years. Efficiency-driven economies have a sufficiently low survival rate; on average 40% of all entrepreneurs are able to achieve some business stability.
In Russia, 6,63% of the population is either early or established entrepreneurs; the latter make up 42% of the total of the entrepreneurially active population.
(GEDI), developed by Zoltan Acs and Laszlo Szerb [Acs, Szerb, 2010], calls for removing this contradiction and proving that entrepreneurship is a catalyst for economic growth. However, this makes it necessary to take a new approach to measuring entrepreneurship.
In creating the GEDI index, Acs and Szerb
• consider the complexity of measures that cover the multidimensional nature of entrepreneurship;
• use measures that reflect the qualitative side of entrepreneurship along with quantitative measures;
• use individual and institutional measures.
Using data from GEM and the Global Economic Forum, UNESCO, and other organizations, the authors determine the position of a country in relation to the GEDI index.
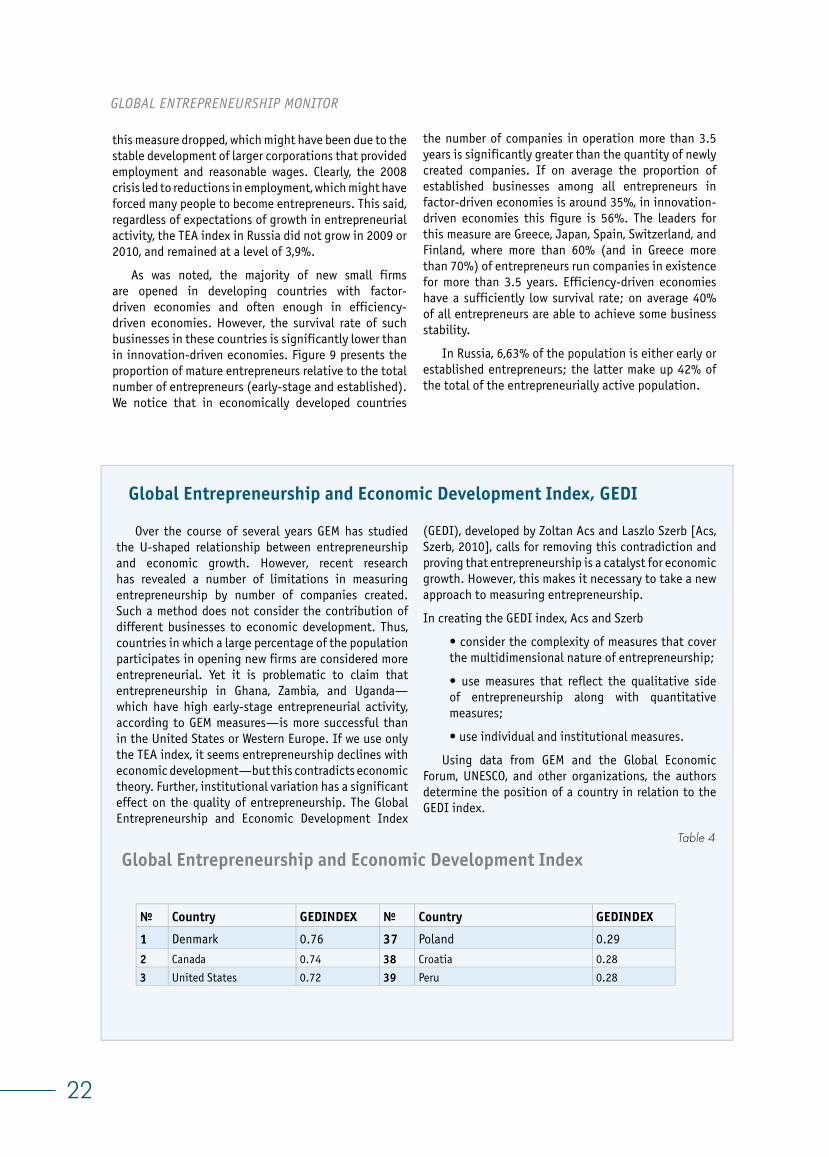
¹ Country GEDINDEX ¹ Country GEDINDEX
1 Denmark 0.76 37 Poland 0.29
2 Canada 0.74 38 Croatia 0.28
3 United States 0.72 39 Peru 0.28
Table 4
Global Entrepreneurship and Economic Development Index
23
RUSSIA 2010
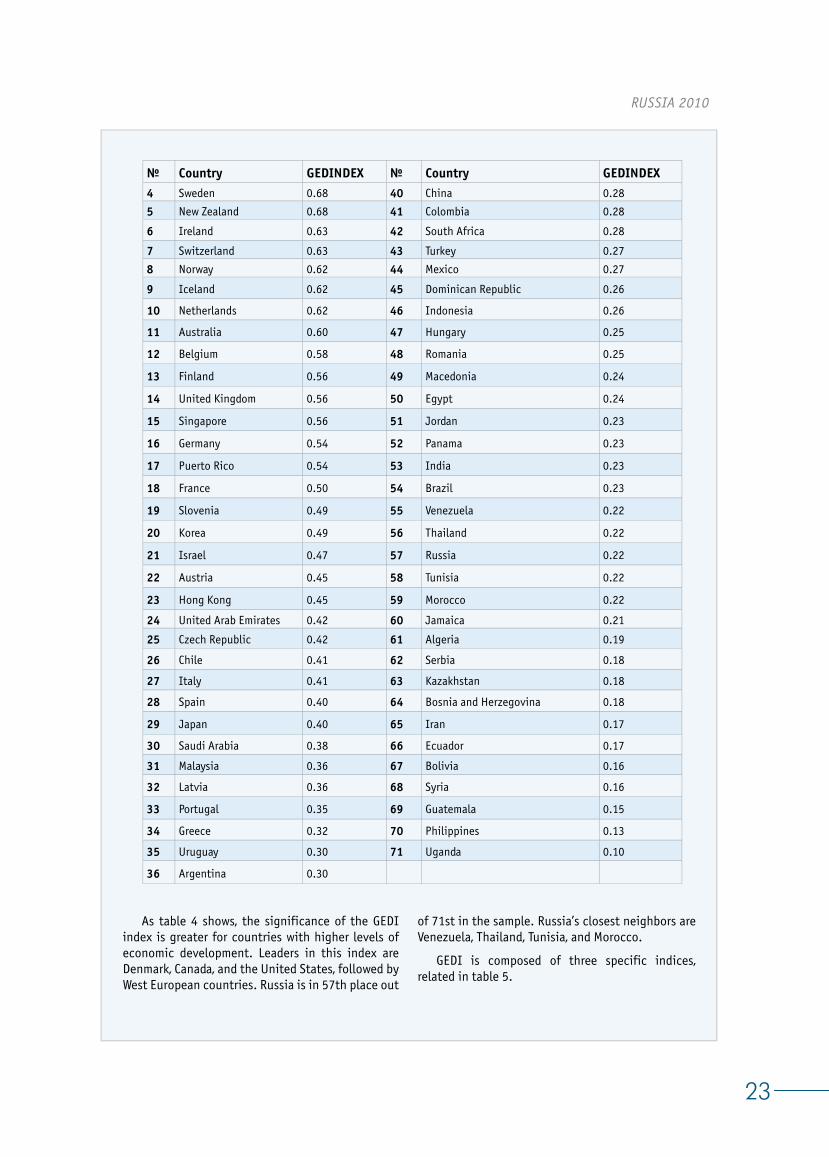
As table 4 shows, the significance of the GEDI index is greater for countries with higher levels of economic development. Leaders in this index are Denmark, Canada, and the United States, followed by West European countries. Russia is in 57th place out
of 71st in the sample. Russia’s closest neighbors are Venezuela, Thailand, Tunisia, and Morocco.
GEDI is composed of three specific indices, related in table 5.
¹ Country GEDINDEX ¹ Country GEDINDEX
4 Sweden 0.68 40 China 0.28
5 New Zealand 0.68 41 Colombia 0.28
6 Ireland 0.63 42 South Africa 0.28
7 Switzerland 0.63 43 Turkey 0.27
8 Norway 0.62 44 Mexico 0.27
9 Iceland 0.62 45 Dominican Republic 0.26
10 Netherlands 0.62 46 Indonesia 0.26
11 Australia 0.60 47 Hungary 0.25
12 Belgium 0.58 48 Romania 0.25
13 Finland 0.56 49 Macedonia 0.24
14 United Kingdom 0.56 50 Egypt 0.24
15 Singapore 0.56 51 Jordan 0.23
16 Germany 0.54 52 Panama 0.23
17 Puerto Rico 0.54 53 India 0.23
18 France 0.50 54 Brazil 0.23
19 Slovenia 0.49 55 Venezuela 0.22
20 Korea 0.49 56 Thailand 0.22
21 Israel 0.47 57 Russia 0.22
22 Austria 0.45 58 Tunisia 0.22
23 Hong Kong 0.45 59 Morocco 0.22
24 United Arab Emirates 0.42 60 Jamaica 0.21
25 Czech Republic 0.42 61 Algeria 0.19
26 Chile 0.41 62 Serbia 0.18
27 Italy 0.41 63 Kazakhstan 0.18
28 Spain 0.40 64 Bosnia and Herzegovina 0.18
29 Japan 0.40 65 Iran 0.17
30 Saudi Arabia 0.38 66 Ecuador 0.17
31 Malaysia 0.36 67 Bolivia 0.16
32 Latvia 0.36 68 Syria 0.16
33 Portugal 0.35 69 Guatemala 0.15
34 Greece 0.32 70 Philippines 0.13
35 Uruguay 0.30 71 Uganda 0.10
36 Argentina 0.30
24
GLOBAL ENTREPRENEURSHIP MONITOR
Figure 10. State of 14 measures for Russia, %
Subindex:Entrepreneurial Attitudes
Subindex: Entrepreneurial Aspirations
Subindex:Entrepreneurial Activity
Oppo
rtun
ity
perc
epti
on
Star
tups
ski
lls
Fear
of f
ailu
re
Net
wor
king
Cult
ural
sup
port
Oppo
rtun
ity
star
tups
Tech
nolo
gica
l sec
tor
Qual
ity
of h
uman
reso
urce
s
Com
peti
tion
New
pro
duct
New
tec
hnol
ogy
Hig
h gr
owth
Inte
rnat
iona
lizat
ion
Risk
cap
ital
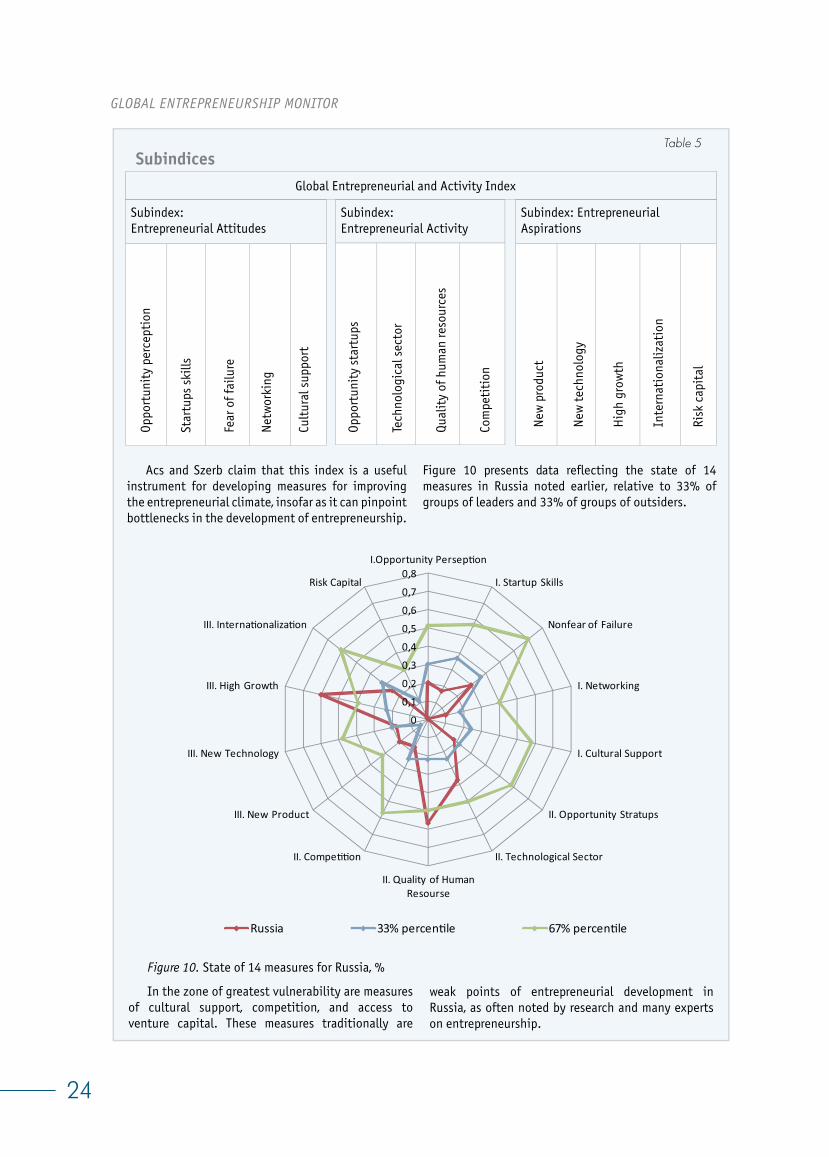
Acs and Szerb claim that this index is a useful instrument for developing measures for improving the entrepreneurial climate, insofar as it can pinpoint bottlenecks in the development of entrepreneurship.
0
0,1
0,2
0,3
0,4
0,5
0,6
0,7
0,8I.Opportunity Persep�on
I. Startup Skills
Nonfear of Failure
I. Networking
I. Cultural Support
II. Opportunity Stratups
II. Technological Sector
II. Quality of Human Resourse
II. Compe��on
III. New Product
III. New Technology
III. High Growth
III. Interna�onaliza�on
Risk Capital
Russia 33% percen�le 67% percen�le
In the zone of greatest vulnerability are measures of cultural support, competition, and access to venture capital. These measures traditionally are
Table 5Subindices
weak points of entrepreneurial development in Russia, as often noted by research and many experts on entrepreneurship.
Global Entrepreneurial and Activity Index
Figure 10 presents data reflecting the state of 14 measures in Russia noted earlier, relative to 33% of groups of leaders and 33% of groups of outsiders.
25
RUSSIA 2010
-110
-90
-70
-50
-30
-10
10
30
50
Switz
erla
ndFr
ance
Norw
aySp
ain
Jam
aica
Japa
nUS
ABo
snia
& H
erzo
govi
naUr
ugua
yCo
lum
bia
Tuni
siaCh
ileIsr
ael
Ugan
daRu
ssia
Denm
ark
Sout
h Af
rica
Iran
Belg
ium
Gree
ceFi
nlan
dIta
lyCh
ina
Rom
ania
Croa
yia
Kore
aW
est B
ank
& S
ecto
r Gaz
aEc
uado
rSa
udi A
rabi
aLa
tvia
Germ
any
Neth
erla
nds
Braz
ilHu
ngar
yAr
gen�
naPe
ruIsl
and UK
Guat
emal
aM
alay
sia
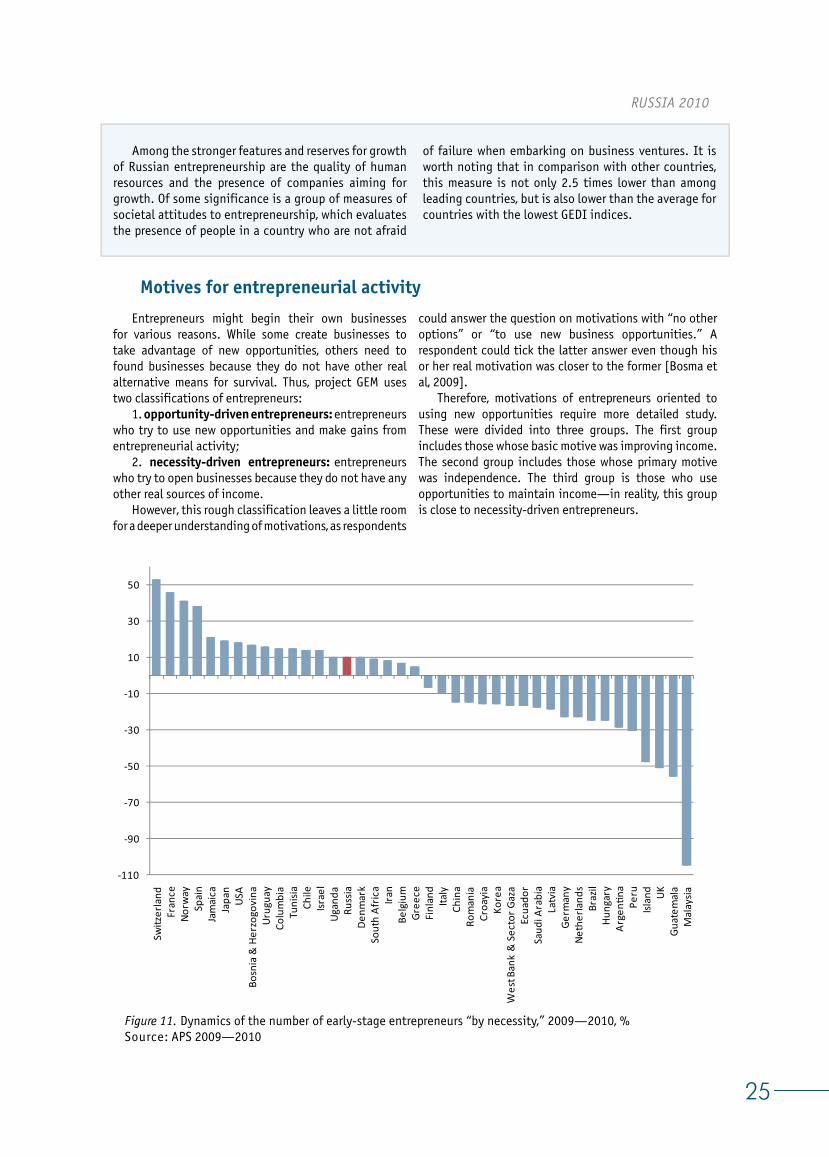
Figure 11. Dynamics of the number of early-stage entrepreneurs “by necessity,” 2009—2010, %Source: APS 2009—2010
Among the stronger features and reserves for growth of Russian entrepreneurship are the quality of human resources and the presence of companies aiming for growth. Of some significance is a group of measures of societal attitudes to entrepreneurship, which evaluates the presence of people in a country who are not afraid
Motives for entrepreneurial activity
Entrepreneurs might begin their own businesses for various reasons. While some create businesses to take advantage of new opportunities, others need to found businesses because they do not have other real alternative means for survival. Thus, project GEM uses two classifications of entrepreneurs:
1. opportunity-driven entrepreneurs: entrepreneurs who try to use new opportunities and make gains from entrepreneurial activity;
2. necessity-driven entrepreneurs: entrepreneurs who try to open businesses because they do not have any other real sources of income.
However, this rough classification leaves a little room for a deeper understanding of motivations, as respondents
could answer the question on motivations with “no other options” or “to use new business opportunities.” A respondent could tick the latter answer even though his or her real motivation was closer to the former [Bosma et al, 2009].
Therefore, motivations of entrepreneurs oriented to using new opportunities require more detailed study. These were divided into three groups. The first group includes those whose basic motive was improving income. The second group includes those whose primary motive was independence. The third group is those who use opportunities to maintain income—in reality, this group is close to necessity-driven entrepreneurs.
of failure when embarking on business ventures. It is worth noting that in comparison with other countries, this measure is not only 2.5 times lower than among leading countries, but is also lower than the average for countries with the lowest GEDI indices.
26
GLOBAL ENTREPRENEURSHIP MONITOR
Figure 12. Distribution of improvement-driven opportunity entrepreneurs, % Source: APS 2010
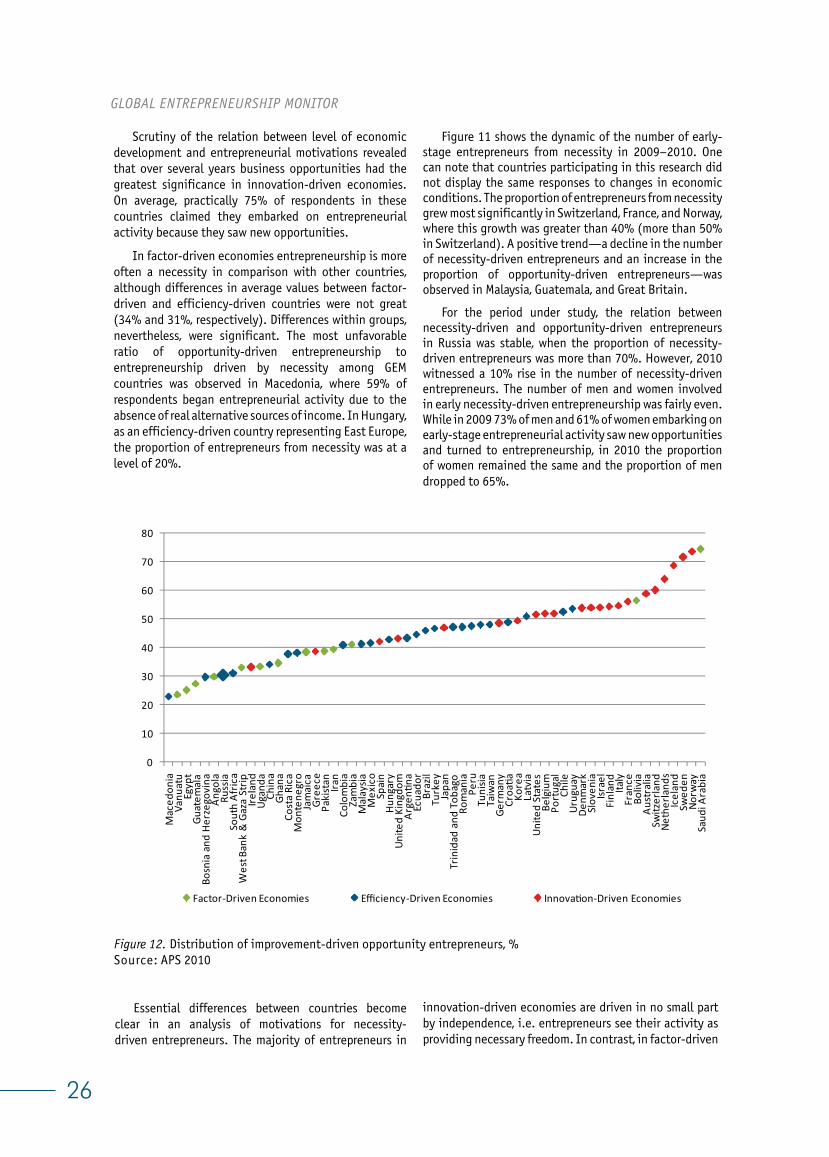
Scrutiny of the relation between level of economic development and entrepreneurial motivations revealed that over several years business opportunities had the greatest significance in innovation-driven economies. On average, practically 75% of respondents in these countries claimed they embarked on entrepreneurial activity because they saw new opportunities.
In factor-driven economies entrepreneurship is more often a necessity in comparison with other countries, although differences in average values between factor-driven and efficiency-driven countries were not great (34% and 31%, respectively). Differences within groups, nevertheless, were significant. The most unfavorable ratio of opportunity-driven entrepreneurship to entrepreneurship driven by necessity among GEM countries was observed in Macedonia, where 59% of respondents began entrepreneurial activity due to the absence of real alternative sources of income. In Hungary, as an efficiency-driven country representing East Europe, the proportion of entrepreneurs from necessity was at a level of 20%.
Figure 11 shows the dynamic of the number of early-stage entrepreneurs from necessity in 2009–2010. One can note that countries participating in this research did not display the same responses to changes in economic conditions. The proportion of entrepreneurs from necessity grew most significantly in Switzerland, France, and Norway, where this growth was greater than 40% (more than 50% in Switzerland). A positive trend—a decline in the number of necessity-driven entrepreneurs and an increase in the proportion of opportunity-driven entrepreneurs—was observed in Malaysia, Guatemala, and Great Britain.
For the period under study, the relation between necessity-driven and opportunity-driven entrepreneurs in Russia was stable, when the proportion of necessity-driven entrepreneurs was more than 70%. However, 2010 witnessed a 10% rise in the number of necessity-driven entrepreneurs. The number of men and women involved in early necessity-driven entrepreneurship was fairly even. While in 2009 73% of men and 61% of women embarking on early-stage entrepreneurial activity saw new opportunities and turned to entrepreneurship, in 2010 the proportion of women remained the same and the proportion of men dropped to 65%.
0
10
20
30
40
50
60
70
80
Mac
edon
iaVa
nuat
uEg
ypt
Guat
emal
aBo
snia
and
Her
zego
vina
Ango
laRu
ssia
Sout
h Af
rica
Wes
t Ban
k &
Gaz
a St
ripIre
land
Ugan
daCh
ina
Ghan
aCo
sta
Rica
Mon
tene
gro
Jam
aica
Gree
cePa
kist
an Iran
Colo
mbi
aZa
mbi
aM
alay
siaM
exic
oSp
ain
Hung
ary
Unite
d Ki
ngdo
mAr
gen�
naEc
uado
rBr
azil
Turk
eyJa
pan
Trin
idad
and
Tob
ago
Rom
ania
Peru
Tuni
siaTa
iwan
Germ
any
Croa
�aKo
rea
Latv
iaUn
ited
Stat
esBe
lgiu
mPo
rtug
alCh
ileUr
ugua
yDe
nmar
kSl
oven
iaIsr
ael
Finl
and
Italy
Fran
ceBo
livia
Aust
ralia
Switz
erla
ndNe
ther
land
sIc
elan
dSw
eden
Norw
aySa
udi A
rabi
a
Factor-Driven Economies Efficiency-Driven Economies Innova�on-Driven Economies
Essential differences between countries become clear in an analysis of motivations for necessity-driven entrepreneurs. The majority of entrepreneurs in
innovation-driven economies are driven in no small part by independence, i.e. entrepreneurs see their activity as providing necessary freedom. In contrast, in factor-driven
27
RUSSIA 2010
0
1
2
3
4
5
Ugan
daGh
ana
Tuni
siaEg
ypt
Gree
ceJa
mai
caPo
rtug
alZa
mbi
aIra
nM
alay
siaSw
eden
Turk
eyAn
gola
Italy
Bosn
ia a
nd H
erze
govi
naIsr
ael
Chin
aAz
ores
Switz
erla
ndJa
pan
Sout
h Af
rica
Denm
ark
Braz
ilKo
rea
Spai
nTa
iwan
Unite
d St
ates
Mac
edon
iaBe
lgiu
mFi
nlan
dRo
man
iaLa
tvia
Slov
enia
Wes
t Ban
k &
Gaz
a St
ripEc
uado
rVa
nuat
uAu
stra
liaFr
ance
Mex
ico
Germ
any
Saud
i Ara
bia
Mon
tene
gro
Hung
ary
Colo
mbi
aNo
rway
Unite
d Ki
ngdo
mAr
gen�
naIre
land
Croa
�aCh
ileGu
atem
ala
Icel
and
Urug
uay
Peru
Paki
stan
Neth
erla
nds
Russ
iaTr
inid
ad a
nd T
obag
oBo
livia
Cost
a Ri
ca
Factor-Driven Economies Efficiency-Driven Economies Innova�on-Driven Economies
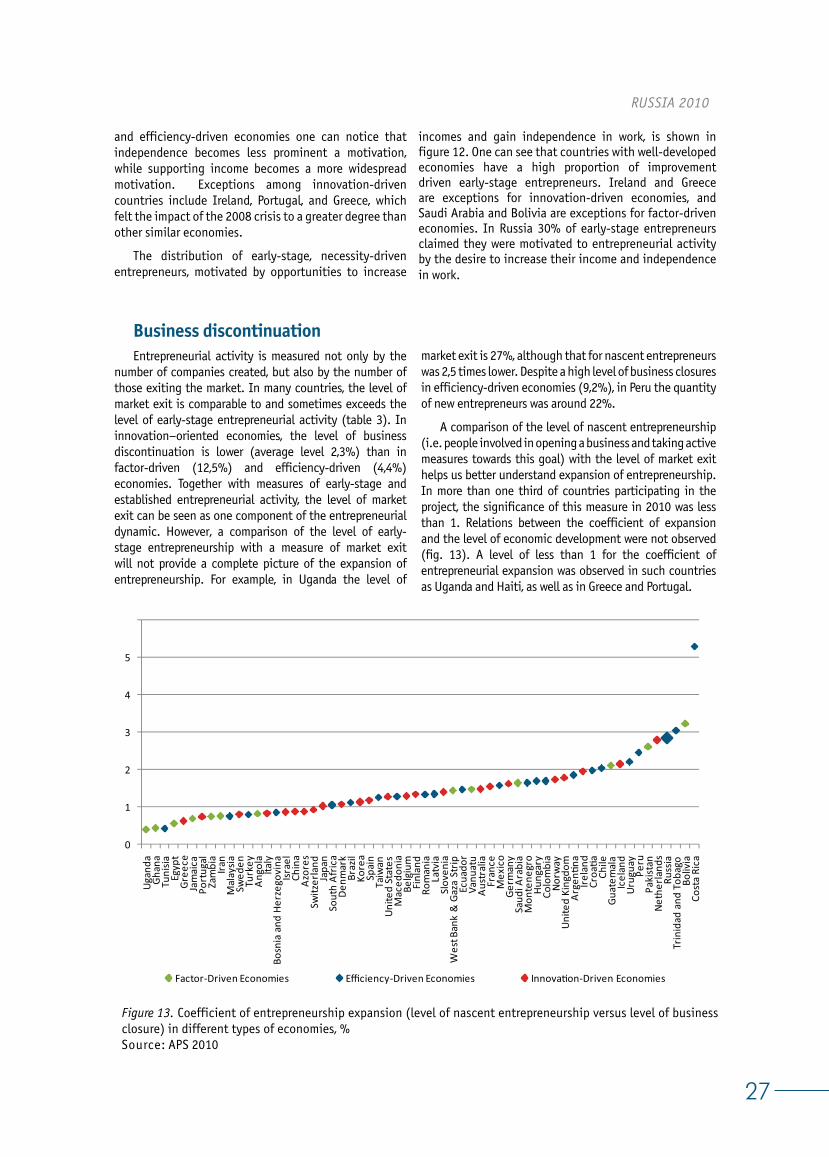
Figure 13. Coefficient of entrepreneurship expansion (level of nascent entrepreneurship versus level of business closure) in different types of economies, %Source: APS 2010
and efficiency-driven economies one can notice that independence becomes less prominent a motivation, while supporting income becomes a more widespread motivation. Exceptions among innovation-driven countries include Ireland, Portugal, and Greece, which felt the impact of the 2008 crisis to a greater degree than other similar economies.
The distribution of early-stage, necessity-driven entrepreneurs, motivated by opportunities to increase
Business discontinuationEntrepreneurial activity is measured not only by the
number of companies created, but also by the number of those exiting the market. In many countries, the level of market exit is comparable to and sometimes exceeds the level of early-stage entrepreneurial activity (table 3). In innovation–oriented economies, the level of business discontinuation is lower (average level 2,3%) than in factor-driven (12,5%) and efficiency-driven (4,4%) economies. Together with measures of early-stage and established entrepreneurial activity, the level of market exit can be seen as one component of the entrepreneurial dynamic. However, a comparison of the level of early-stage entrepreneurship with a measure of market exit will not provide a complete picture of the expansion of entrepreneurship. For example, in Uganda the level of
market exit is 27%, although that for nascent entrepreneurs was 2,5 times lower. Despite a high level of business closures in efficiency-driven economies (9,2%), in Peru the quantity of new entrepreneurs was around 22%.
A comparison of the level of nascent entrepreneurship (i.e. people involved in opening a business and taking active measures towards this goal) with the level of market exit helps us better understand expansion of entrepreneurship. In more than one third of countries participating in the project, the significance of this measure in 2010 was less than 1. Relations between the coefficient of expansion and the level of economic development were not observed (fig. 13). A level of less than 1 for the coefficient of entrepreneurial expansion was observed in such countries as Uganda and Haiti, as well as in Greece and Portugal.
incomes and gain independence in work, is shown in figure 12. One can see that countries with well-developed economies have a high proportion of improvement driven early-stage entrepreneurs. Ireland and Greece are exceptions for innovation-driven economies, and Saudi Arabia and Bolivia are exceptions for factor-driven economies. In Russia 30% of early-stage entrepreneurs claimed they were motivated to entrepreneurial activity by the desire to increase their income and independence in work.
28
GLOBAL ENTREPRENEURSHIP MONITOR
0% 10% 20% 30% 40% 50% 60% 70% 80% 90% 100%
Russia 2010
Factor-Driven Economies
Efficiency-Driven Economies
Innova�on-Driven Economies
Business not profitable Access to finance Opportunity to sell Other job opportunity
Exit was planned before Re�rement Personal reasons Incident
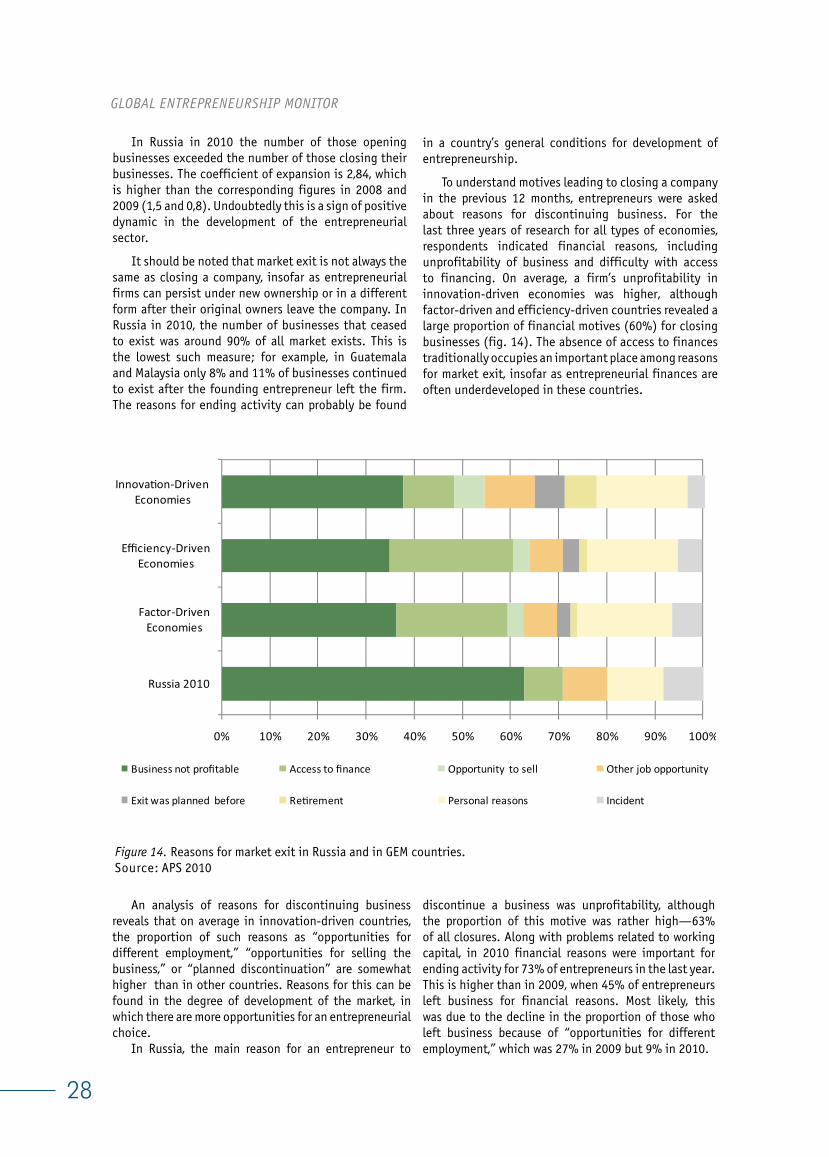
In Russia in 2010 the number of those opening businesses exceeded the number of those closing their businesses. The coefficient of expansion is 2,84, which is higher than the corresponding figures in 2008 and 2009 (1,5 and 0,8). Undoubtedly this is a sign of positive dynamic in the development of the entrepreneurial sector.
It should be noted that market exit is not always the same as closing a company, insofar as entrepreneurial firms can persist under new ownership or in a different form after their original owners leave the company. In Russia in 2010, the number of businesses that ceased to exist was around 90% of all market exists. This is the lowest such measure; for example, in Guatemala and Malaysia only 8% and 11% of businesses continued to exist after the founding entrepreneur left the firm. The reasons for ending activity can probably be found
Figure 14. Reasons for market exit in Russia and in GEM countries.Source: APS 2010
in a country’s general conditions for development of entrepreneurship.
To understand motives leading to closing a company in the previous 12 months, entrepreneurs were asked about reasons for discontinuing business. For the last three years of research for all types of economies, respondents indicated financial reasons, including unprofitability of business and difficulty with access to financing. On average, a firm’s unprofitability in innovation-driven economies was higher, although factor-driven and efficiency-driven countries revealed a large proportion of financial motives (60%) for closing businesses (fig. 14). The absence of access to finances traditionally occupies an important place among reasons for market exit, insofar as entrepreneurial finances are often underdeveloped in these countries.
An analysis of reasons for discontinuing business reveals that on average in innovation-driven countries, the proportion of such reasons as “opportunities for different employment,” “opportunities for selling the business,” or “planned discontinuation” are somewhat higher than in other countries. Reasons for this can be found in the degree of development of the market, in which there are more opportunities for an entrepreneurial choice.
In Russia, the main reason for an entrepreneur to
discontinue a business was unprofitability, although the proportion of this motive was rather high—63% of all closures. Along with problems related to working capital, in 2010 financial reasons were important for ending activity for 73% of entrepreneurs in the last year. This is higher than in 2009, when 45% of entrepreneurs left business for financial reasons. Most likely, this was due to the decline in the proportion of those who left business because of “opportunities for different employment,” which was 27% in 2009 but 9% in 2010.
29
RUSSIA 2010
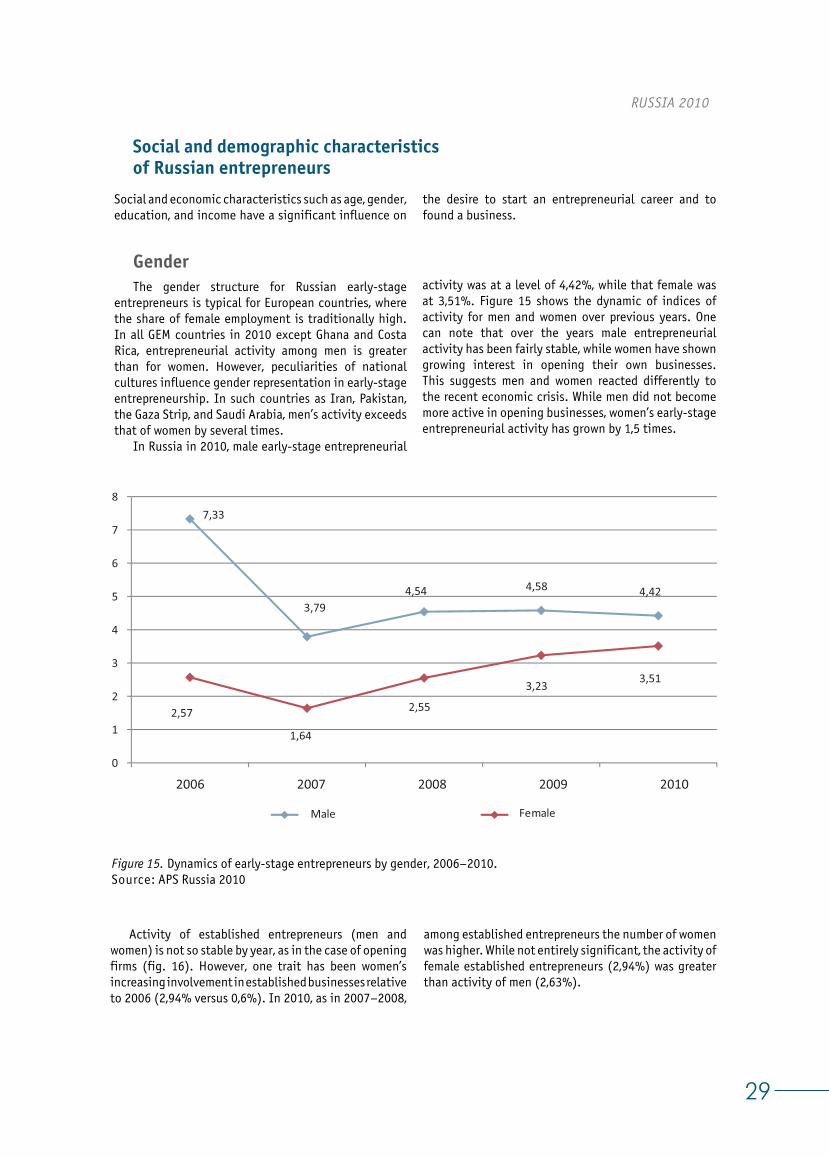
Figure 15. Dynamics of early-stage entrepreneurs by gender, 2006–2010.Source: APS Russia 2010
Social and demographic characteristics of Russian entrepreneurs
Social and economic characteristics such as age, gender, education, and income have a significant influence on
GenderThe gender structure for Russian early-stage
entrepreneurs is typical for European countries, where the share of female employment is traditionally high. In all GEM countries in 2010 except Ghana and Costa Rica, entrepreneurial activity among men is greater than for women. However, peculiarities of national cultures influence gender representation in early-stage entrepreneurship. In such countries as Iran, Pakistan, the Gaza Strip, and Saudi Arabia, men’s activity exceeds that of women by several times.
In Russia in 2010, male early-stage entrepreneurial
activity was at a level of 4,42%, while that female was at 3,51%. Figure 15 shows the dynamic of indices of activity for men and women over previous years. One can note that over the years male entrepreneurial activity has been fairly stable, while women have shown growing interest in opening their own businesses. This suggests men and women reacted differently to the recent economic crisis. While men did not become more active in opening businesses, women’s early-stage entrepreneurial activity has grown by 1,5 times.
Male Female
7,33
3,794,54 4,58 4,42
2,57
1,64
2,55
3,23 3,51
0
1
2
3
4
5
6
7
8
2006 2007 2008 2009 2010
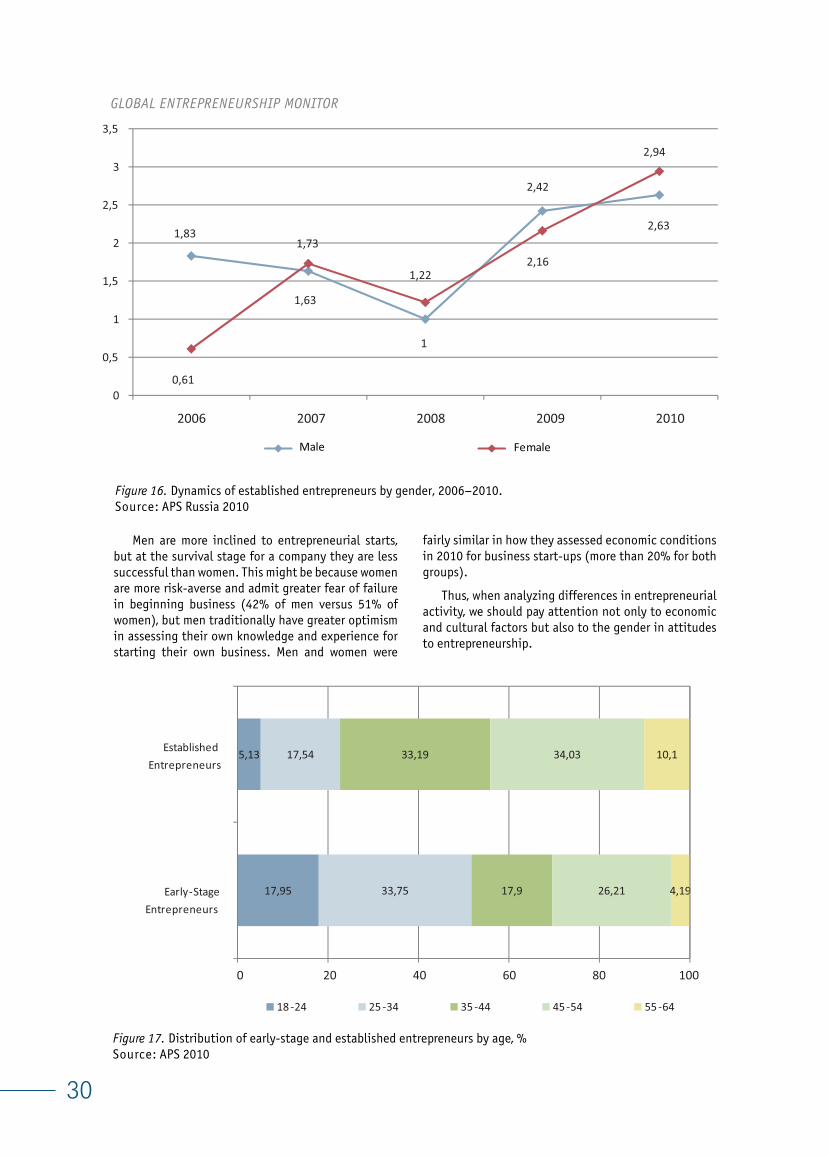
Activity of established entrepreneurs (men and women) is not so stable by year, as in the case of opening firms (fig. 16). However, one trait has been women’s increasing involvement in established businesses relative to 2006 (2,94% versus 0,6%). In 2010, as in 2007–2008,
among established entrepreneurs the number of women was higher. While not entirely significant, the activity of female established entrepreneurs (2,94%) was greater than activity of men (2,63%).
the desire to start an entrepreneurial career and to found a business.
30
GLOBAL ENTREPRENEURSHIP MONITOR
Figure 16. Dynamics of established entrepreneurs by gender, 2006–2010.Source: APS Russia 2010
Male Female
1,83
1,63
1
2,42
2,63
0,61
1,73
1,222,16
2,94
0
0,5
1
1,5
2
2,5
3
3,5
2006 2007 2008 2009 2010
Men are more inclined to entrepreneurial starts, but at the survival stage for a company they are less successful than women. This might be because women are more risk-averse and admit greater fear of failure in beginning business (42% of men versus 51% of women), but men traditionally have greater optimism in assessing their own knowledge and experience for starting their own business. Men and women were
fairly similar in how they assessed economic conditions in 2010 for business start-ups (more than 20% for both groups).
Thus, when analyzing differences in entrepreneurial activity, we should pay attention not only to economic and cultural factors but also to the gender in attitudes to entrepreneurship.
Figure 17. Distribution of early-stage and established entrepreneurs by age, %Source: APS 2010
17,95
5,13
33,75
17,54
17,9
33,19
26,21
34,03
4,19
10,1
0 20 40 60 80 100
18 -24 25 -34 35 -44 45 -54 55 -64
Early-Stage Entrepreneurs
Established Entrepreneurs
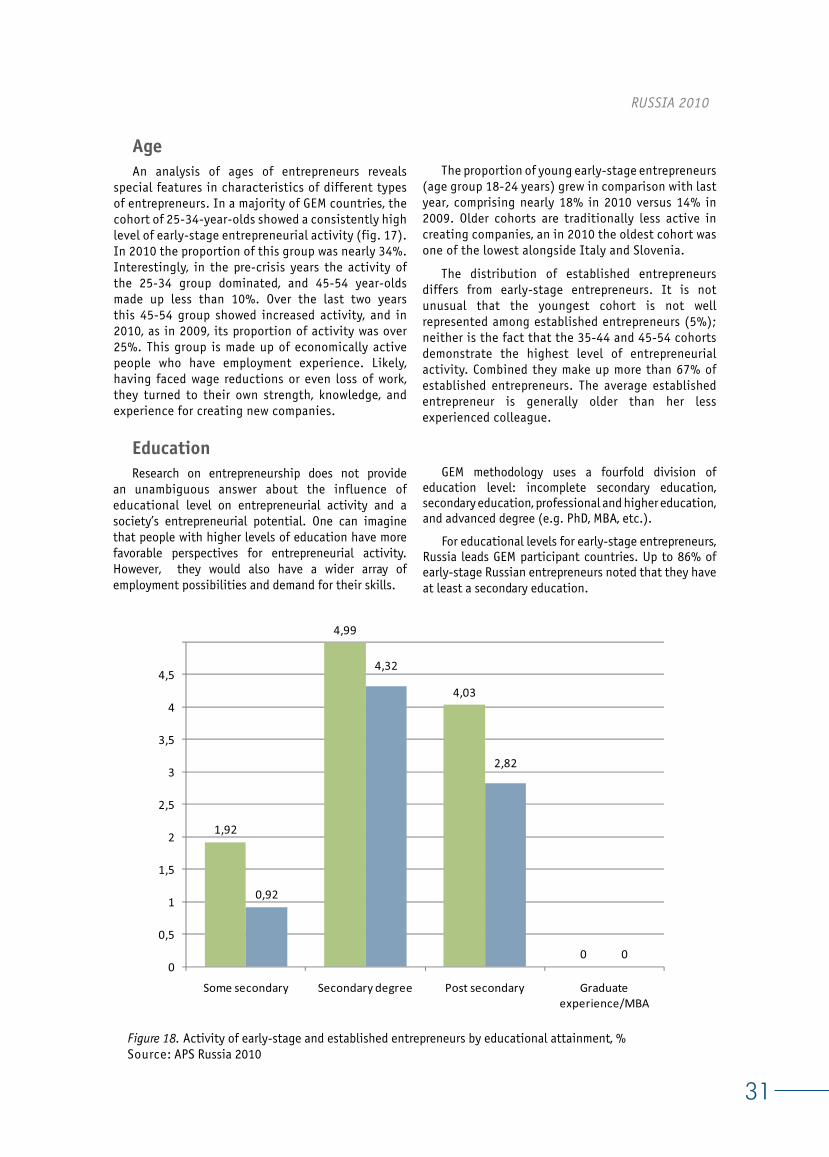
31
RUSSIA 2010
Age An analysis of ages of entrepreneurs reveals
special features in characteristics of different types of entrepreneurs. In a majority of GEM countries, the cohort of 25-34-year-olds showed a consistently high level of early-stage entrepreneurial activity (fig. 17). In 2010 the proportion of this group was nearly 34%. Interestingly, in the pre-crisis years the activity of the 25-34 group dominated, and 45-54 year-olds made up less than 10%. Over the last two years this 45-54 group showed increased activity, and in 2010, as in 2009, its proportion of activity was over 25%. This group is made up of economically active people who have employment experience. Likely, having faced wage reductions or even loss of work, they turned to their own strength, knowledge, and experience for creating new companies.
The proportion of young early-stage entrepreneurs (age group 18-24 years) grew in comparison with last year, comprising nearly 18% in 2010 versus 14% in 2009. Older cohorts are traditionally less active in creating companies, an in 2010 the oldest cohort was one of the lowest alongside Italy and Slovenia.
The distribution of established entrepreneurs differs from early-stage entrepreneurs. It is not unusual that the youngest cohort is not well represented among established entrepreneurs (5%); neither is the fact that the 35-44 and 45-54 cohorts demonstrate the highest level of entrepreneurial activity. Combined they make up more than 67% of established entrepreneurs. The average established entrepreneur is generally older than her less experienced colleague.
EducationResearch on entrepreneurship does not provide
an unambiguous answer about the influence of educational level on entrepreneurial activity and a society’s entrepreneurial potential. One can imagine that people with higher levels of education have more favorable perspectives for entrepreneurial activity. However, they would also have a wider array of employment possibilities and demand for their skills.
1,92
4,99
4,03
0
0,92
4,32
2,82
00
0,5
1
1,5
2
2,5
3
3,5
4
4,5
Some secondary Secondary degree Post secondary Graduate experience/MBA
GEM methodology uses a fourfold division of education level: incomplete secondary education, secondary education, professional and higher education, and advanced degree (e.g. PhD, MBA, etc.).
For educational levels for early-stage entrepreneurs, Russia leads GEM participant countries. Up to 86% of early-stage Russian entrepreneurs noted that they have at least a secondary education.
Figure 18. Activity of early-stage and established entrepreneurs by educational attainment, %Source: APS Russia 2010
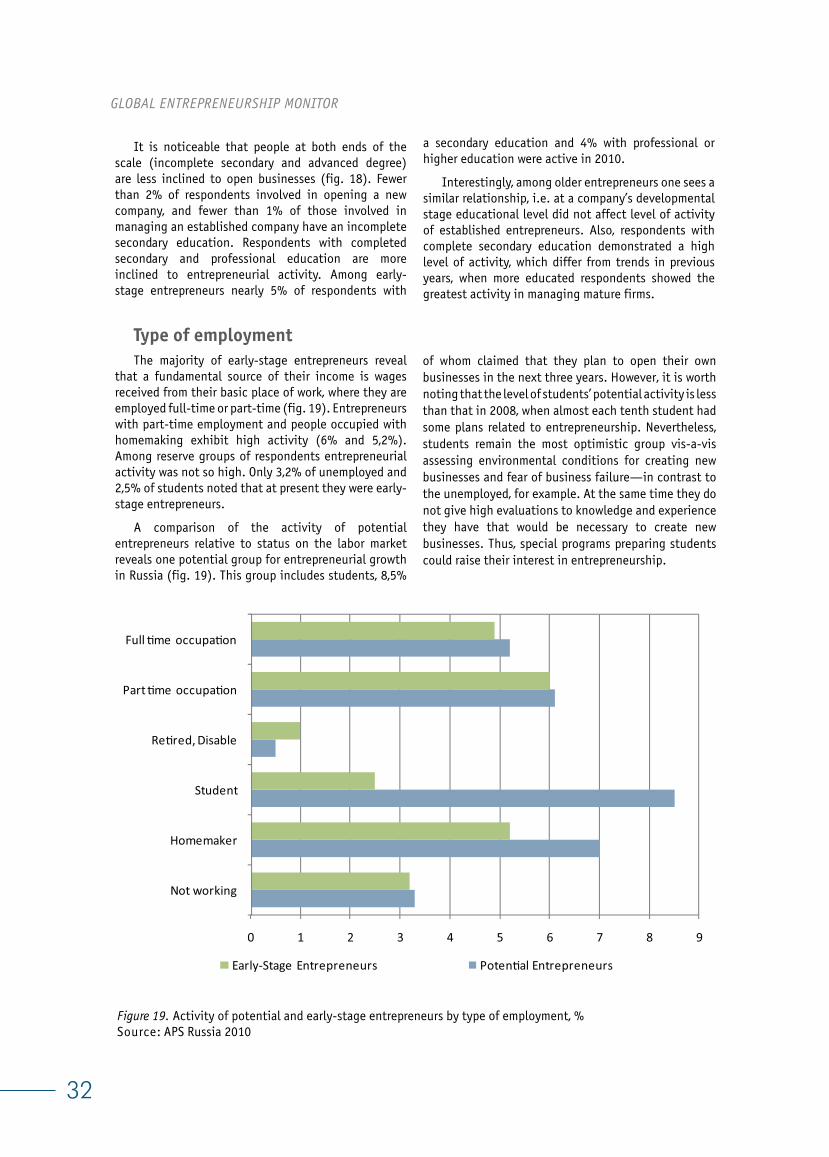
32
GLOBAL ENTREPRENEURSHIP MONITOR
It is noticeable that people at both ends of the scale (incomplete secondary and advanced degree) are less inclined to open businesses (fig. 18). Fewer than 2% of respondents involved in opening a new company, and fewer than 1% of those involved in managing an established company have an incomplete secondary education. Respondents with completed secondary and professional education are more inclined to entrepreneurial activity. Among early-stage entrepreneurs nearly 5% of respondents with
a secondary education and 4% with professional or higher education were active in 2010.
Interestingly, among older entrepreneurs one sees a similar relationship, i.e. at a company’s developmental stage educational level did not affect level of activity of established entrepreneurs. Also, respondents with complete secondary education demonstrated a high level of activity, which differ from trends in previous years, when more educated respondents showed the greatest activity in managing mature firms.
Type of employment The majority of early-stage entrepreneurs reveal
that a fundamental source of their income is wages received from their basic place of work, where they are employed full-time or part-time (fig. 19). Entrepreneurs with part-time employment and people occupied with homemaking exhibit high activity (6% and 5,2%). Among reserve groups of respondents entrepreneurial activity was not so high. Only 3,2% of unemployed and 2,5% of students noted that at present they were early-stage entrepreneurs.
A comparison of the activity of potential entrepreneurs relative to status on the labor market reveals one potential group for entrepreneurial growth in Russia (fig. 19). This group includes students, 8,5%
of whom claimed that they plan to open their own businesses in the next three years. However, it is worth noting that the level of students’ potential activity is less than that in 2008, when almost each tenth student had some plans related to entrepreneurship. Nevertheless, students remain the most optimistic group vis-à-vis assessing environmental conditions for creating new businesses and fear of business failure—in contrast to the unemployed, for example. At the same time they do not give high evaluations to knowledge and experience they have that would be necessary to create new businesses. Thus, special programs preparing students could raise their interest in entrepreneurship.
Figure 19. Activity of potential and early-stage entrepreneurs by type of employment, %Source: APS Russia 2010
0 1 2 3 4 5 6 7 8 9
Not working
Homemaker
Student
Re�red, Disable
Part �me occupa�on
Full �me occupa�on
Early-Stage Entrepreneurs Poten�al Entrepreneurs
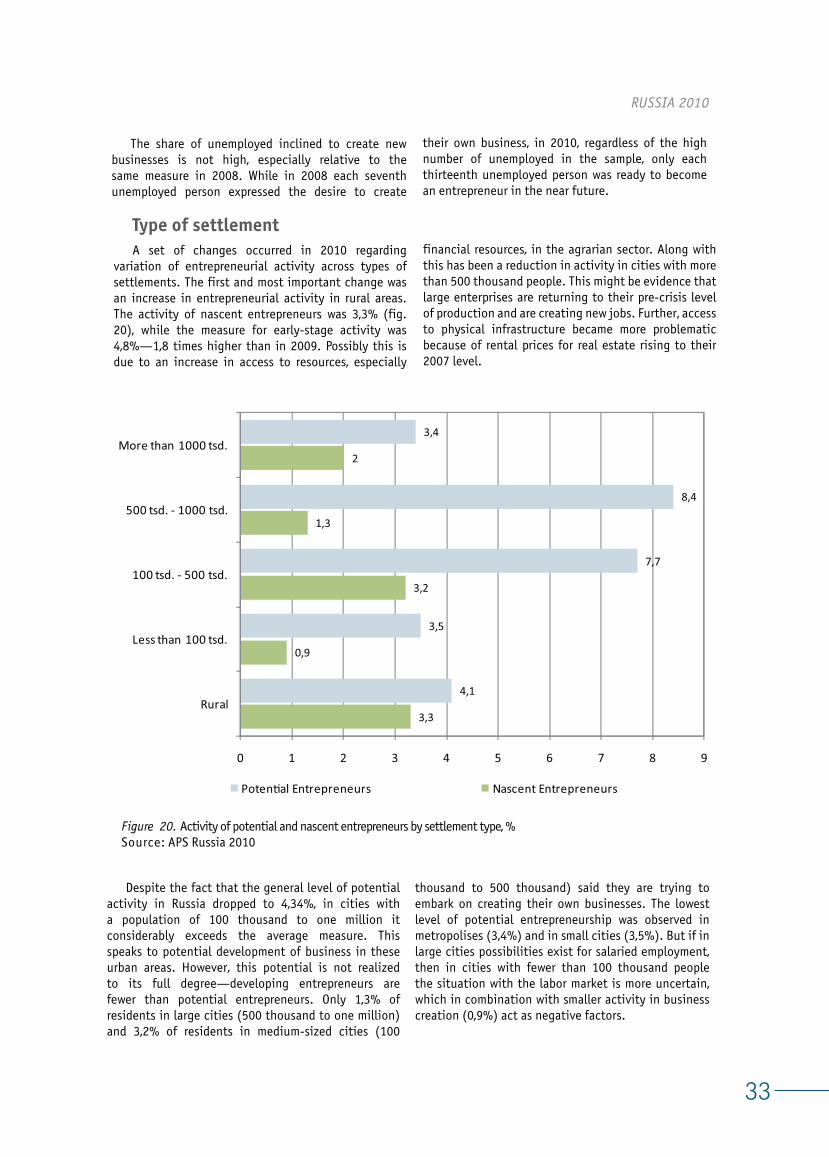
33
RUSSIA 2010
The share of unemployed inclined to create new businesses is not high, especially relative to the same measure in 2008. While in 2008 each seventh unemployed person expressed the desire to create
their own business, in 2010, regardless of the high number of unemployed in the sample, only each thirteenth unemployed person was ready to become an entrepreneur in the near future.
Type of settlement A set of changes occurred in 2010 regarding
variation of entrepreneurial activity across types of settlements. The first and most important change was an increase in entrepreneurial activity in rural areas. The activity of nascent entrepreneurs was 3,3% (fig. 20), while the measure for early-stage activity was 4,8%—1,8 times higher than in 2009. Possibly this is due to an increase in access to resources, especially
financial resources, in the agrarian sector. Along with this has been a reduction in activity in cities with more than 500 thousand people. This might be evidence that large enterprises are returning to their pre-crisis level of production and are creating new jobs. Further, access to physical infrastructure became more problematic because of rental prices for real estate rising to their 2007 level.
3,3
0,9
3,2
1,3
2
4,1
3,5
7,7
8,4
3,4
0 1 2 3 4 5 6 7 8 9
Rural
Less than 100 tsd.
100 tsd. - 500 tsd.
500 tsd. - 1000 tsd.
More than 1000 tsd.
Poten�al Entrepreneurs Nascent Entrepreneurs
Figure 20. Activity of potential and nascent entrepreneurs by settlement type, %Source: APS Russia 2010
Despite the fact that the general level of potential activity in Russia dropped to 4,34%, in cities with a population of 100 thousand to one million it considerably exceeds the average measure. This speaks to potential development of business in these urban areas. However, this potential is not realized to its full degree—developing entrepreneurs are fewer than potential entrepreneurs. Only 1,3% of residents in large cities (500 thousand to one million) and 3,2% of residents in medium-sized cities (100
thousand to 500 thousand) said they are trying to embark on creating their own businesses. The lowest level of potential entrepreneurship was observed in metropolises (3,4%) and in small cities (3,5%). But if in large cities possibilities exist for salaried employment, then in cities with fewer than 100 thousand people the situation with the labor market is more uncertain, which in combination with smaller activity in business creation (0,9%) act as negative factors.
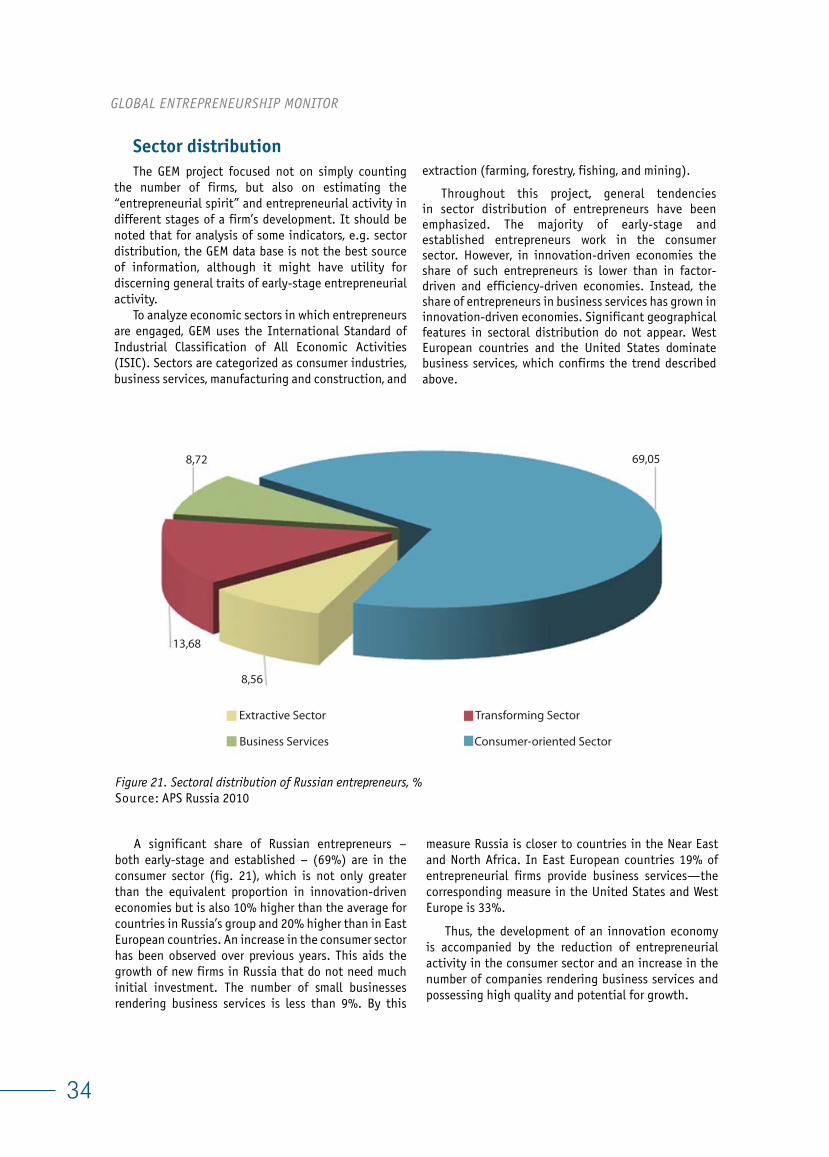
34
GLOBAL ENTREPRENEURSHIP MONITOR
Extractive Sector
8,56
13,68
69,058,72
Transforming Sector
Consumer-oriented SectorBusiness Services
Figure 21. Sectoral distribution of Russian entrepreneurs, %Source: APS Russia 2010
Sector distributionThe GEM project focused not on simply counting
the number of firms, but also on estimating the “entrepreneurial spirit” and entrepreneurial activity in different stages of a firm’s development. It should be noted that for analysis of some indicators, e.g. sector distribution, the GEM data base is not the best source of information, although it might have utility for discerning general traits of early-stage entrepreneurial activity.
To analyze economic sectors in which entrepreneurs are engaged, GEM uses the International Standard of Industrial Classification of All Economic Activities (ISIC). Sectors are categorized as consumer industries, business services, manufacturing and construction, and
extraction (farming, forestry, fishing, and mining).
Throughout this project, general tendencies in sector distribution of entrepreneurs have been emphasized. The majority of early-stage and established entrepreneurs work in the consumer sector. However, in innovation-driven economies the share of such entrepreneurs is lower than in factor-driven and efficiency-driven economies. Instead, the share of entrepreneurs in business services has grown in innovation-driven economies. Significant geographical features in sectoral distribution do not appear. West European countries and the United States dominate business services, which confirms the trend described above.
A significant share of Russian entrepreneurs – both early-stage and established – (69%) are in the consumer sector (fig. 21), which is not only greater than the equivalent proportion in innovation-driven economies but is also 10% higher than the average for countries in Russia’s group and 20% higher than in East European countries. An increase in the consumer sector has been observed over previous years. This aids the growth of new firms in Russia that do not need much initial investment. The number of small businesses rendering business services is less than 9%. By this
measure Russia is closer to countries in the Near East and North Africa. In East European countries 19% of entrepreneurial firms provide business services—the corresponding measure in the United States and West Europe is 33%.
Thus, the development of an innovation economy is accompanied by the reduction of entrepreneurial activity in the consumer sector and an increase in the number of companies rendering business services and possessing high quality and potential for growth.
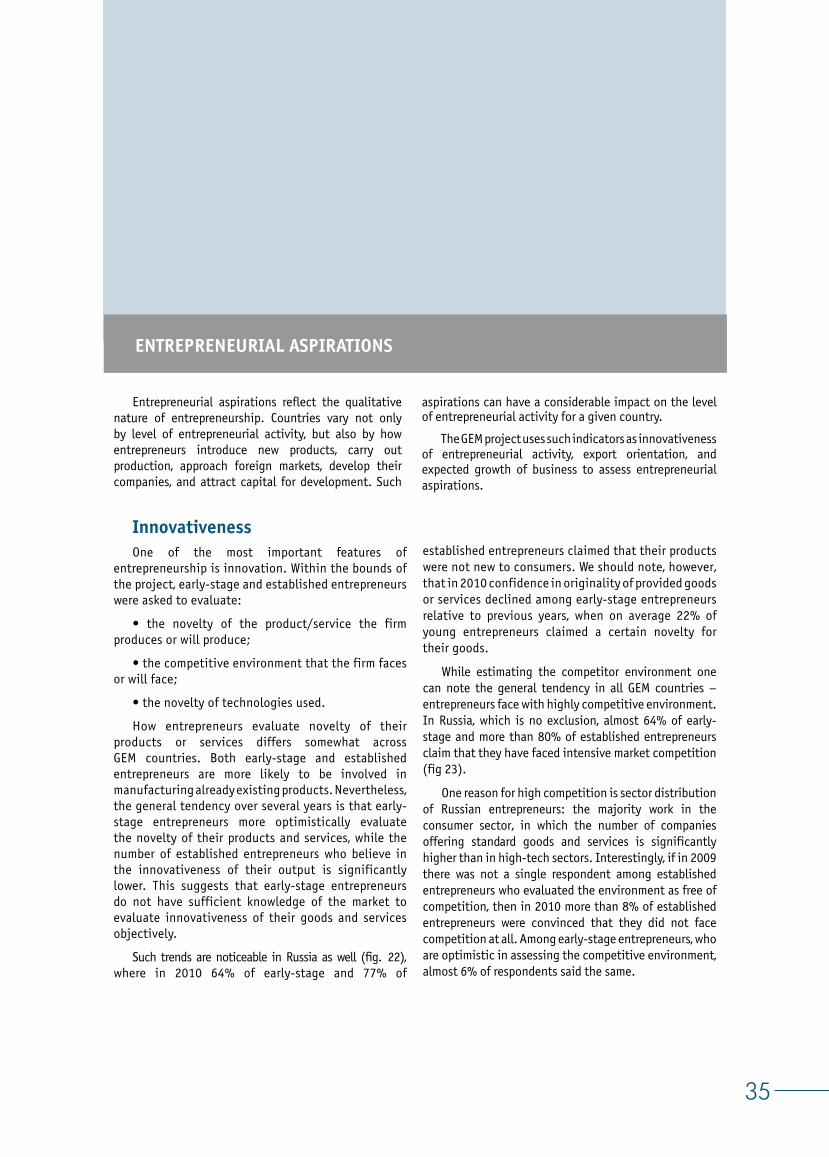
35
RUSSIA 2010
ENTREPRENEURIAL ASPIRATIONS
Entrepreneurial aspirations reflect the qualitative nature of entrepreneurship. Countries vary not only by level of entrepreneurial activity, but also by how entrepreneurs introduce new products, carry out production, approach foreign markets, develop their companies, and attract capital for development. Such
aspirations can have a considerable impact on the level of entrepreneurial activity for a given country.
The GEM project uses such indicators as innovativeness of entrepreneurial activity, export orientation, and expected growth of business to assess entrepreneurial aspirations.
Innovativeness One of the most important features of
entrepreneurship is innovation. Within the bounds of the project, early-stage and established entrepreneurs were asked to evaluate:
• the novelty of the product/service the firm produces or will produce;
• the competitive environment that the firm faces or will face;
• the novelty of technologies used.
How entrepreneurs evaluate novelty of their products or services differs somewhat across GEM countries. Both early-stage and established entrepreneurs are more likely to be involved in manufacturing already existing products. Nevertheless, the general tendency over several years is that early-stage entrepreneurs more optimistically evaluate the novelty of their products and services, while the number of established entrepreneurs who believe in the innovativeness of their output is significantly lower. This suggests that early-stage entrepreneurs do not have sufficient knowledge of the market to evaluate innovativeness of their goods and services objectively.
Such trends are noticeable in Russia as well (fig.422), where in 2010 64% of early-stage and 77% of
established entrepreneurs claimed that their products were not new to consumers. We should note, however, that in 2010 confidence in originality of provided goods or services declined among early-stage entrepreneurs relative to previous years, when on average 22% of young entrepreneurs claimed a certain novelty for their goods.
While estimating the competitor environment one can note the general tendency in all GEM countries – entrepreneurs face with highly competitive environment. In Russia, which is no exclusion, almost 64% of early-stage and more than 80% of established entrepreneurs claim that they have faced intensive market competition (fig 23).
One reason for high competition is sector distribution of Russian entrepreneurs: the majority work in the consumer sector, in which the number of companies offering standard goods and services is significantly higher than in high-tech sectors. Interestingly, if in 2009 there was not a single respondent among established entrepreneurs who evaluated the environment as free of competition, then in 2010 more than 8% of established entrepreneurs were convinced that they did not face competition at all. Among early-stage entrepreneurs, who are optimistic in assessing the competitive environment, almost 6% of respondents said the same.
36
GLOBAL ENTREPRENEURSHIP MONITOR
73,74
20,39
5,87
81,52
9,7 8,78
0
10
20
30
40
50
60
70
80
90
Many Few None
Early -stage Entrepreneurs Established Entrepreneurs
Figure 22. Product/service novelty for early-stage and established entrepreneurs, %Source: APS Russia 2010
Figure 23. Competitive environment for early-stage and established entrepreneurs, %Source: APS Russia 2010
15,91 20,09
64
12,64 9,78
77,58
0
10
20
30
40
50
60
70
80
90
To all customers To some customers To none customers
Early- stage Entrepreneurs Established Entrepreneurs
When entrepreneurs evaluated their own technologies, the outcome was similar to that for evaluating novelty of goods and services (fig. 24). A significant majority of entrepreneurs—73% of early-stage and 88% of established—claimed that they did not use the newest technology in their entrepreneurial activity. Among early-stage entrepreneurs 27% of respondents were convinced that they were using either the newest technology (up to one year old) or that which was quite new (one to five years old). Only around 10% of established entrepreneurs gave similar answers.
It is worth mentioning that it is not always the proportion of those who assess their technology as newest that characterizes innovativeness in the economy as a whole. The higher value for this measure in factor-driven and efficiency-driven countries, relative to innovation economies, is likely due to the fact that technology which seems new in the first two groups is not so new in developed economies. For example, the high value for technological novelty for Indian entrepreneurs might be explained by this, especially considering that only 3% of entrepreneurs are employed in the technology
37
RUSSIA 2010
16,29
10,54
73,17
4,83 6,42
88,75
0
10
20
30
40
50
60
70
80
90
100
The newest New Do not use
Early- stage Entrepreneurs Established Entrepreneurs
Figure 24. Use of technology by early-stage and established entrepreneurs, %Source: APS Russia 2010
sector. Furthermore, the use and development of new technologies in economically developed countries is often accomplished by large companies, while in less developed countries medium-sized and smaller businesses carry out technological development.
To measure a country’s innovation potential, an index that combines two measures of innovativeness described earlier—novelty of the product and intensity of competition—is used. This index reflects the quantity of entrepreneurs who believe that their good or service is new
27,85
13,9614,42 14,3213,86
7,15
10,29
3,34
0
5
10
15
20
25
30
Early -stage Entrepreneurs Established Entrepreneurs
USA China Russia Brazil
Figure 25. Index of novelty of product/intensity of competition for early-stage and established entrepreneurs for four countries Source: APS 2010
38
GLOBAL ENTREPRENEURSHIP MONITOR
0
5
10
15
20
25
Ghan
aGu
atem
ala
Egyp
tBo
livia
Ugan
daPa
kist
anJa
mai
caSa
udi A
rabi
aAn
gola
Zam
bia
Vanu
atu
Iran
Wes
t Ban
k &
Gaz
a St
ripM
exic
oCh
ina
Sout
h Af
rica
Cost
a Ri
caEc
uado
rM
onte
negr
oTu
rkey
Mal
aysia
Tuni
siaBo
snia
and
Her
zego
vina
Trin
idad
and
Tob
ago
Colo
mbi
aPe
ruRu
ssia
Mac
edon
iaLa
tvia
Braz
ilCh
ileTa
iwan
Urug
uay
Arge
n�na
Rom
ania
Hung
ary
Croa
�aNo
rway
Japa
nKo
rea
Israe
lPo
rtug
alGr
eece
Fran
ceFi
nlan
dDe
nmar
kSp
ain
Germ
any
Swed
enIta
lyIre
land
Icel
and
Unite
d Ki
ngdo
mSw
itzer
land
Belg
ium
Unite
d St
ates
Slov
enia
Neth
erla
nds
Aust
ralia
Factor-driven economies
Efficiency-driven economies Innova�on-driven economies
Early-stage entrepreneurs Established entrepreneurs
Figure 26. Activity of entrepreneurs in high-tech sector, %Source: APS 2010
evaluate their produce in this way is around 14%. This measure has been fairly stable for several years.
Experience in entrepreneurial activity forces entrepreneurs to evaluate their environment more critically, and so established entrepreneurs are twice as likely to have faced competition than entrepreneurs with less experience. China is the exception; here the value for this measure does not change relative to level of development of the entrepreneurial firm.One more measure characterizing entrepreneurs’ innovation potential is work in the high-tech sector. Figure 26
presents data on entrepreneurial involvement in technological sectors for GEM countries. One regularity is that involvement in high-tech sectors is considerably higher in innovation-driven countries, where on average more than 8% of early-stage entrepreneurs work in this sector. This is five times higher than in factor-driven countries (1,6%) and 2,5 times higher than in efficiency-driven economies (3,2%).
In Russia in 2010, around 5% of early-stage entrepreneurs claimed that their business was linked to high-tech. This measure had grown since 2009 (3%).
for all or for several consumers, and that at the same time have little or no competition.
Figure 25 presents the value of this index for four countries representing different types of economies and geographical zones. The choice of Brazil and China stems from the discussion about general development tendencies for these countries and for Russia. The United States is a country with a developed culture of entrepreneurship.
It is clear that these countries vary in degree of innovativeness. A higher value is observed in the United States, where every fourth early-stage entrepreneur characterizes her product as novel and without competitors. In China 14% early-stage entrepreneurs claim to produce a novel product and that they do not face competition. It is possible that this is due to China’s underdeveloped internal market. Among Russian early-stage entrepreneurs the proportion of those who
39
RUSSIA 2010
Aspirations to growth
Orientation to the global market
The third characteristic of entrepreneurial aspirations is orientation to the international market. The given indicator is based on a calculation of the number of consumers outside the country. This takes into consideration not only export orientation, but also foreign consumers buying goods through the internet or during travel abroad.
In general, entrepreneurial firms in factor-driven
economies have a lower level of internationalization. However, a country’s size rather than its level of development has greater influence on a global orientation. For example, Iran, India, Brazil, China, and Argentina have a low proportion of entrepreneurs with clients outside their countries. Thus, it is not surprising that in Russia a global orientation is insignificant for early-stage and established entrepreneurs.
When studying the relation between economic growth and entrepreneurship, it is best to note that the contribution of various firms is not equivalent. To estimate the growth of companies, GEM uses the creation of new workplaces as its main indicator. Firms are classified as rapidly growing if they plan to create 20 or more workplaces in the first five years of their existence; firms that plan to create 5 to 19 workplaces are classified as moderately growing. For already established firms, an additional criterion is used: more than 50% growth in the number of workplaces.
As GEM data show, factor-driven economies are characterized as having a lower proportion of entrepreneurs aiming for growth than in the other types of economies. However, both efficiency-driven
and innovation-driven economies demonstrate greater variation within their groups [Kelly, Bosma, Amoros, 2011].
Russia over the last two years has witnessed a reduction in the number of entrepreneurs oriented to significant growth. If Russia in 2006-2008 was a leader among GEM countries in the aim to create new jobs, then in recent years this tempo has dropped. In 2010 only 10% of early-stage entrepreneurs claimed that they expected to add more than 20 positions over five years. At the same time 15% of early-stage entrepreneurs claimed that they expect a 50% increase in the quantity of job openings in the labor market over that period. Among established entrepreneurs fewer than 8% of business made similar claims.
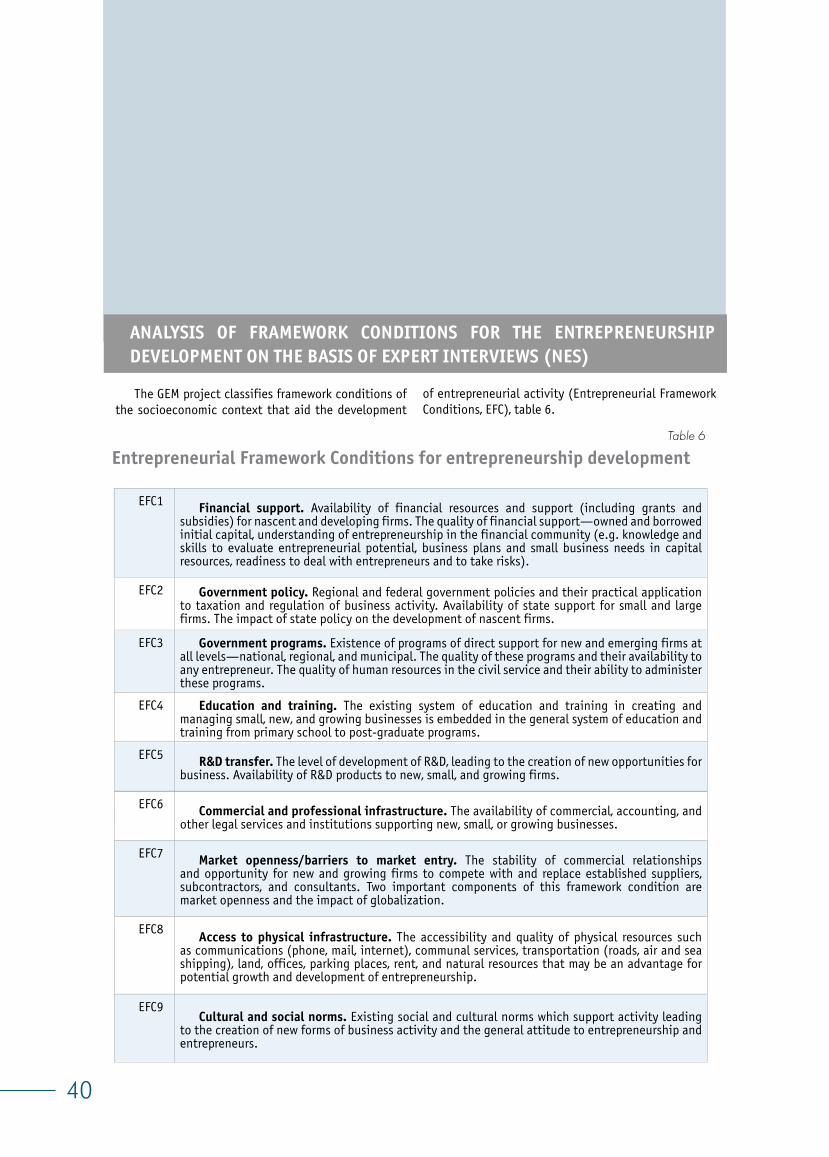
40
GLOBAL ENTREPRENEURSHIP MONITOR
The GEM project classifies framework conditions of the socioeconomic context that aid the development
Table 6
Entrepreneurial Framework Conditions for entrepreneurship development
ANALYSIS OF FRAMEWORK CONDITIONS FOR THE ENTREPRENEURSHIP DEVELOPMENT ON THE BASIS OF EXPERT INTERVIEWS (NES)
EFC6 Commercial and professional infrastructure. The availability of commercial, accounting, and other legal services and institutions supporting new, small, or growing businesses.
EFC7 Market openness/barriers to market entry. The stability of commercial relationships and opportunity for new and growing firms to compete with and replace established suppliers, subcontractors, and consultants. Two important components of this framework condition are market openness and the impact of globalization.
EFC8Access to physical infrastructure. The accessibility and quality of physical resources such
as communications (phone, mail, internet), communal services, transportation (roads, air and sea shipping), land, offices, parking places, rent, and natural resources that may be an advantage for potential growth and development of entrepreneurship.
EFC9Cultural and social norms. Existing social and cultural norms which support activity leading
to the creation of new forms of business activity and the general attitude to entrepreneurship and entrepreneurs.
EFC1 Financial support. Availability of financial resources and support (including grants and subsidies) for nascent and developing firms. The quality of financial support—owned and borrowed initial capital, understanding of entrepreneurship in the financial community (e.g. knowledge and skills to evaluate entrepreneurial potential, business plans and small business needs in capital resources, readiness to deal with entrepreneurs and to take risks).
EFC2 Government policy. Regional and federal government policies and their practical application to taxation and regulation of business activity. Availability of state support for small and large firms. The impact of state policy on the development of nascent firms.
EFC3 Government programs. Existence of programs of direct support for new and emerging firms at all levels—national, regional, and municipal. The quality of these programs and their availability to any entrepreneur. The quality of human resources in the civil service and their ability to administer these programs.
EFC4 Education and training. The existing system of education and training in creating and managing small, new, and growing businesses is embedded in the general system of education and training from primary school to post-graduate programs.
EFC5 R&D transfer. The level of development of R&D, leading to the creation of new opportunities for business. Availability of R&D products to new, small, and growing firms.
of entrepreneurial activity (Entrepreneurial Framework Conditions, EFC), table 6.
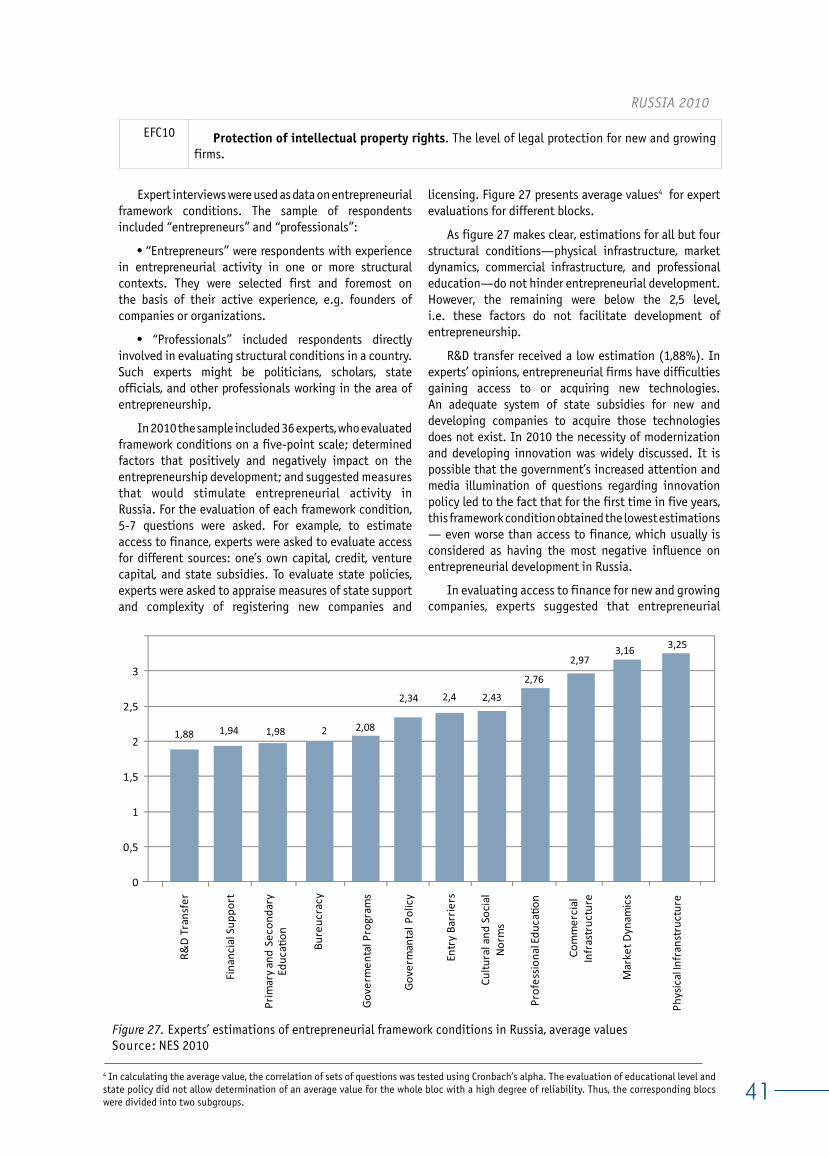
41
RUSSIA 2010
EFC10 Protection of intellectual property rights. The level of legal protection for new and growing firms.
Expert interviews were used as data on entrepreneurial framework conditions. The sample of respondents included “entrepreneurs” and “professionals”:
• “Entrepreneurs” were respondents with experience in entrepreneurial activity in one or more structural contexts. They were selected first and foremost on the basis of their active experience, e.g. founders of companies or organizations.
• “Professionals” included respondents directly involved in evaluating structural conditions in a country. Such experts might be politicians, scholars, state officials, and other professionals working in the area of entrepreneurship.
In 2010 the sample included 36 experts, who evaluated framework conditions on a five-point scale; determined factors that positively and negatively impact on the entrepreneurship development; and suggested measures that would stimulate entrepreneurial activity in Russia. For the evaluation of each framework condition, 5-7 questions were asked. For example, to estimate access to finance, experts were asked to evaluate access for different sources: one’s own capital, credit, venture capital, and state subsidies. To evaluate state policies, experts were asked to appraise measures of state support and complexity of registering new companies and
licensing. Figure 27 presents average values4 for expert evaluations for different blocks.
As figure 27 makes clear, estimations for all but four structural conditions—physical infrastructure, market dynamics, commercial infrastructure, and professional education—do not hinder entrepreneurial development. However, the remaining were below the 2,5 level, i.e. these factors do not facilitate development of entrepreneurship.
R&D transfer received a low estimation (1,88%). In experts’ opinions, entrepreneurial firms have difficulties gaining access to or acquiring new technologies. An adequate system of state subsidies for new and developing companies to acquire those technologies does not exist. In 2010 the necessity of modernization and developing innovation was widely discussed. It is possible that the government’s increased attention and media illumination of questions regarding innovation policy led to the fact that for the first time in five years, this framework condition obtained the lowest estimations — even worse than access to finance, which usually is considered as having the most negative influence on entrepreneurial development in Russia.
In evaluating access to finance for new and growing companies, experts suggested that entrepreneurial
1,88 1,94 1,98 2 2,08
2,34 2,4 2,43
2,76
2,973,16 3,25
0
0,5
1
1,5
2
2,5
3
R&D
Tran
sfer
Fina
ncia
l Sup
port
Prim
ary a
nd S
econ
dary
Ed
uca�
on
Bure
ucra
cy
Gove
rmen
tal P
rogr
ams
Gove
rman
tal P
olic
y
Entr
y Ba
rrie
rs
Cultu
ral a
nd S
ocia
l No
rms
Prof
essio
nal E
duca
�on
Com
mer
cial
In
fras
truc
ture
Mar
ket D
ynam
ics
Phys
ical
Infr
anst
ruct
ure
Figure 27. Experts’ estimations of entrepreneurial framework conditions in Russia, average valuesSource: NES 2010
4 In calculating the average value, the correlation of sets of questions was tested using Cronbach’s alpha. The evaluation of educational level and state policy did not allow determination of an average value for the whole bloc with a high degree of reliability. Thus, the corresponding blocs were divided into two subgroups.
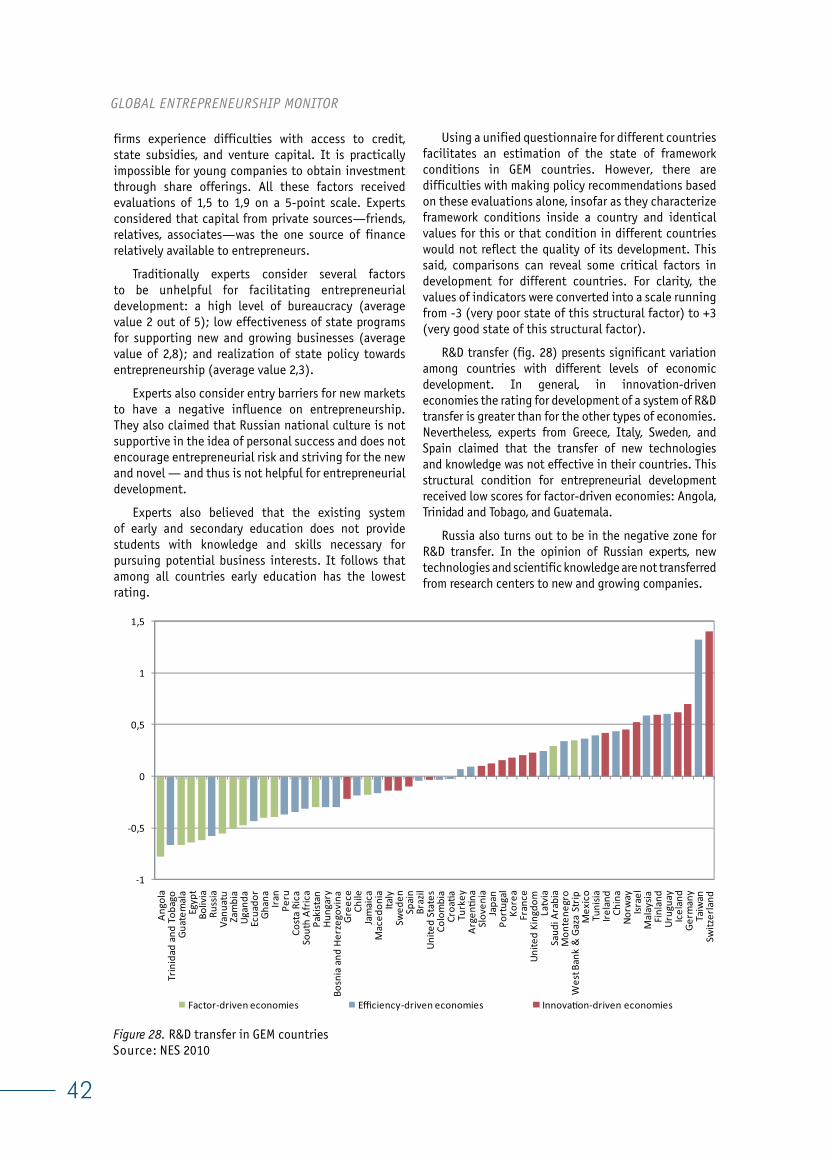
42
GLOBAL ENTREPRENEURSHIP MONITOR
firms experience difficulties with access to credit, state subsidies, and venture capital. It is practically impossible for young companies to obtain investment through share offerings. All these factors received evaluations of 1,5 to 1,9 on a 5-point scale. Experts considered that capital from private sources—friends, relatives, associates—was the one source of finance relatively available to entrepreneurs.
Traditionally experts consider several factors to be unhelpful for facilitating entrepreneurial development: a high level of bureaucracy (average value 2 out of 5); low effectiveness of state programs for supporting new and growing businesses (average value of 2,8); and realization of state policy towards entrepreneurship (average value 2,3).
Experts also consider entry barriers for new markets to have a negative influence on entrepreneurship. They also claimed that Russian national culture is not supportive in the idea of personal success and does not encourage entrepreneurial risk and striving for the new and novel — and thus is not helpful for entrepreneurial development.
Experts also believed that the existing system of early and secondary education does not provide students with knowledge and skills necessary for pursuing potential business interests. It follows that among all countries early education has the lowest rating.
Using a unified questionnaire for different countries facilitates an estimation of the state of framework conditions in GEM countries. However, there are difficulties with making policy recommendations based on these evaluations alone, insofar as they characterize framework conditions inside a country and identical values for this or that condition in different countries would not reflect the quality of its development. This said, comparisons can reveal some critical factors in development for different countries. For clarity, the values of indicators were converted into a scale running from -3 (very poor state of this structural factor) to +3 (very good state of this structural factor).
R&D transfer (fig. 28) presents significant variation among countries with different levels of economic development. In general, in innovation-driven economies the rating for development of a system of R&D transfer is greater than for the other types of economies. Nevertheless, experts from Greece, Italy, Sweden, and Spain claimed that the transfer of new technologies and knowledge was not effective in their countries. This structural condition for entrepreneurial development received low scores for factor-driven economies: Angola, Trinidad and Tobago, and Guatemala.
Russia also turns out to be in the negative zone for R&D transfer. In the opinion of Russian experts, new technologies and scientific knowledge are not transferred from research centers to new and growing companies.
-1
-0,5
0
0,5
1
1,5
Ango
laTr
inid
ad a
nd T
obag
oGu
atem
ala
Egyp
tBo
livia
Russ
iaVa
nuat
uZa
mbi
aUg
anda
Ecua
dor
Ghan
aIra
nPe
ruCo
sta
Rica
Sout
h Af
rica
Paki
stan
Hung
ary
Bosn
ia a
nd H
erze
govi
naGr
eece
Chile
Jam
aica
Mac
edon
iaIta
lySw
eden
Spai
nBr
azil
Unite
d St
ates
Colo
mbi
aCr
oa�a
Turk
eyAr
gen�
naSl
oven
iaJa
pan
Port
ugal
Kore
aFr
ance
Unite
d Ki
ngdo
mLa
tvia
Saud
i Ara
bia
Mon
tene
gro
Wes
t Ban
k &
Gaz
a St
ripM
exic
oTu
nisia
Irela
ndCh
ina
Norw
ayIsr
ael
Mal
aysia
Finl
and
Urug
uay
Icel
and
Germ
any
Taiw
anSw
itzer
land
Factor-driven economies Efficiency-driven economies Innova�on-driven economies
Figure 28. R&D transfer in GEM countriesSource: NES 2010
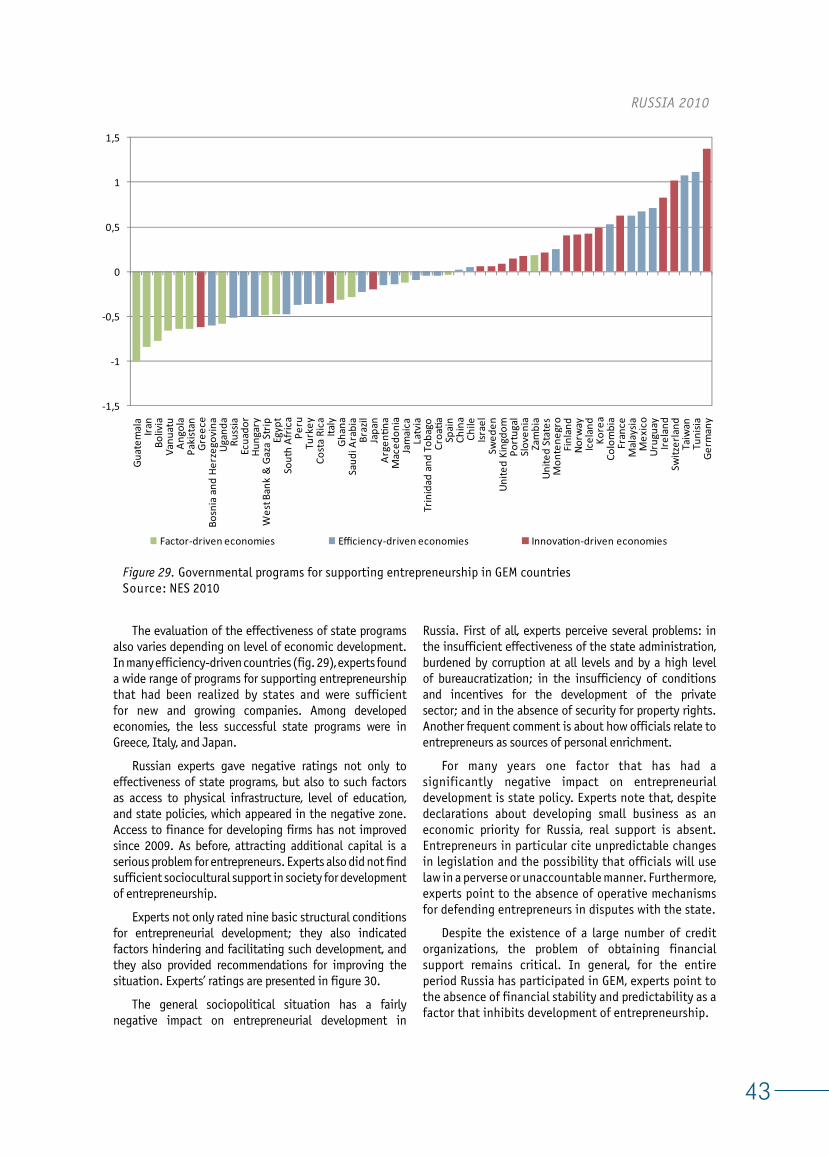
43
RUSSIA 2010
-1,5
-1
-0,5
0
0,5
1
1,5Gu
atem
ala
Iran
Boliv
iaVa
nuat
uAn
gola
Paki
stan
Gree
ceBo
snia
and
Her
zego
vina
Ugan
daRu
ssia
Ecua
dor
Hung
ary
Wes
t Ban
k &
Gaz
a St
ripEg
ypt
Sout
h Af
rica
Peru
Turk
eyCo
sta
Rica
Italy
Ghan
aSa
udi A
rabi
aBr
azil
Japa
nAr
gen�
naM
aced
onia
Jam
aica
Latv
iaTr
inid
ad a
nd T
obag
oCr
oa�a
Spai
nCh
ina
Chile
Israe
lSw
eden
Unite
d Ki
ngdo
mPo
rtug
alSl
oven
iaZa
mbi
aUn
ited
Stat
esM
onte
negr
oFi
nlan
dNo
rway
Icel
and
Kore
aCo
lom
bia
Fran
ceM
alay
siaM
exic
oUr
ugua
yIre
land
Switz
erla
ndTa
iwan
Tuni
siaGe
rman
y
Factor-driven economies Efficiency-driven economies Innova�on-driven economies
Figure 29. Governmental programs for supporting entrepreneurship in GEM countriesSource: NES 2010
The evaluation of the effectiveness of state programs also varies depending on level of economic development. In many efficiency-driven countries (fig. 29), experts found a wide range of programs for supporting entrepreneurship that had been realized by states and were sufficient for new and growing companies. Among developed economies, the less successful state programs were in Greece, Italy, and Japan.
Russian experts gave negative ratings not only to effectiveness of state programs, but also to such factors as access to physical infrastructure, level of education, and state policies, which appeared in the negative zone. Access to finance for developing firms has not improved since 2009. As before, attracting additional capital is a serious problem for entrepreneurs. Experts also did not find sufficient sociocultural support in society for development of entrepreneurship.
Experts not only rated nine basic structural conditions for entrepreneurial development; they also indicated factors hindering and facilitating such development, and they also provided recommendations for improving the situation. Experts’ ratings are presented in figure 30.
The general sociopolitical situation has a fairly negative impact on entrepreneurial development in
Russia. First of all, experts perceive several problems: in the insufficient effectiveness of the state administration, burdened by corruption at all levels and by a high level of bureaucratization; in the insufficiency of conditions and incentives for the development of the private sector; and in the absence of security for property rights. Another frequent comment is about how officials relate to entrepreneurs as sources of personal enrichment.
For many years one factor that has had a significantly negative impact on entrepreneurial development is state policy. Experts note that, despite declarations about developing small business as an economic priority for Russia, real support is absent. Entrepreneurs in particular cite unpredictable changes in legislation and the possibility that officials will use law in a perverse or unaccountable manner. Furthermore, experts point to the absence of operative mechanisms for defending entrepreneurs in disputes with the state.
Despite the existence of a large number of credit organizations, the problem of obtaining financial support remains critical. In general, for the entire period Russia has participated in GEM, experts point to the absence of financial stability and predictability as a factor that inhibits development of entrepreneurship.
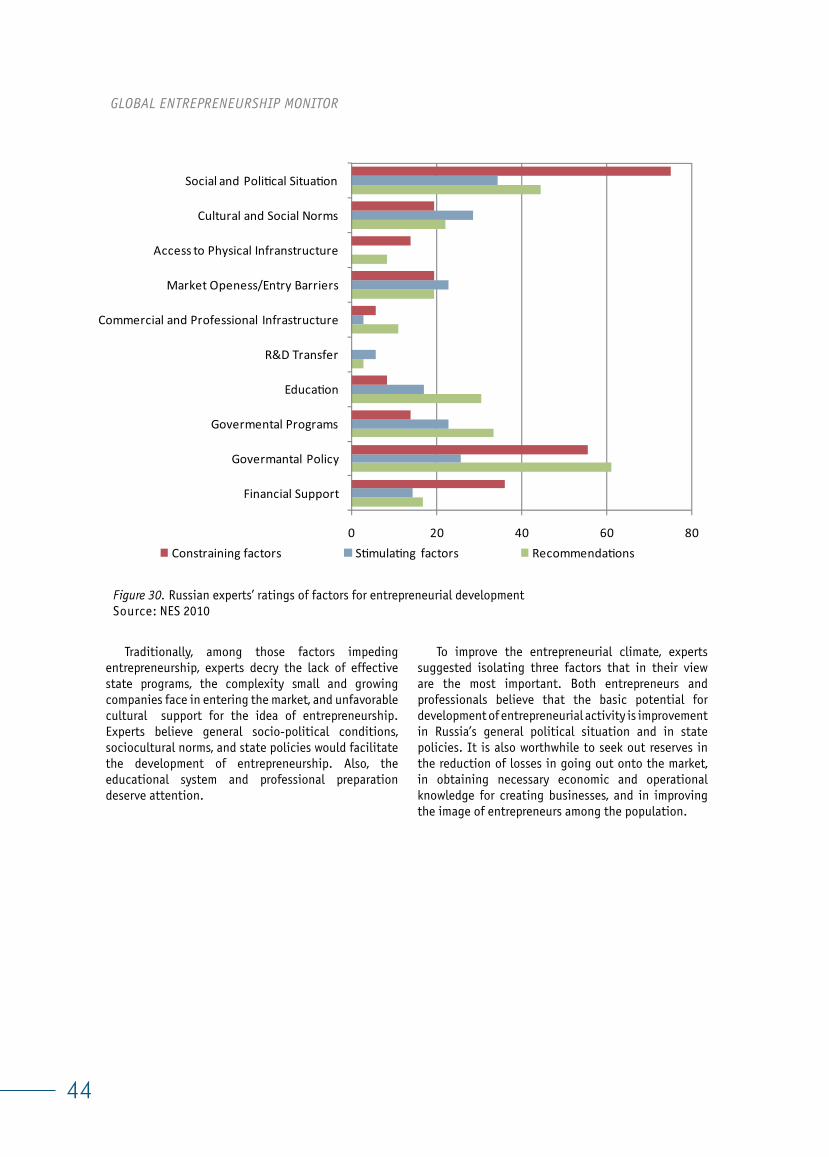
44
GLOBAL ENTREPRENEURSHIP MONITOR
0 20 40 60 80
Financial Support
Govermantal Policy
Govermental Programs
Educa�on
R&D Transfer
Commercial and Professional Infrastructure
Market Openess/Entry Barriers
Access to Physical Infranstructure
Cultural and Social Norms
Social and Poli�cal Situa�on
Constraining factors S�mula�ng factors Recommenda�ons
Figure 30. Russian experts’ ratings of factors for entrepreneurial development Source: NES 2010
Traditionally, among those factors impeding entrepreneurship, experts decry the lack of effective state programs, the complexity small and growing companies face in entering the market, and unfavorable cultural support for the idea of entrepreneurship. Experts believe general socio-political conditions, sociocultural norms, and state policies would facilitate the development of entrepreneurship. Also, the educational system and professional preparation deserve attention.
To improve the entrepreneurial climate, experts suggested isolating three factors that in their view are the most important. Both entrepreneurs and professionals believe that the basic potential for development of entrepreneurial activity is improvement in Russia’s general political situation and in state policies. It is also worthwhile to seek out reserves in the reduction of losses in going out onto the market, in obtaining necessary economic and operational knowledge for creating businesses, and in improving the image of entrepreneurs among the population.
45
RUSSIA 2010
REFERENCES
Ács Z. J., Szerb L. 2010. Global Entrepreneurship and Development Index 2011, Edward Elgar Publishing Ltd, 349 pages, pp-266-269;
Bosma N., Levie J. Global Entrepreneurship Monitor. 2009 Global Report. 2010;
Kelly D., Bosma N., Amoros J.E. 2011. Global Entrepreneurship Monitor. 2010 Global Report. GERA;
Chepurenko A. 2011. Entrepreneurship and SME Policies in the 21st Century – The Example of Russia // Handbook of Research on Entrepreneurship Policies in Central and Eastern Europe, ed. by David Smallbone, Friederike Welter. Cheltenham: Edward Elgar Publ., p. 190-209.
Chepurenko A. 2010. Small Entrepreneurship and the Role of Government in Post-Socialist Economies: Some Institutional Challenges, in: Historical Social Research, Vol. 35 (2), p.320-333.
Obraztsova O., Chepurenko A. Entrepreneurship and Socio-Economic Development in Cross-Countries Analysis, in: Strategic Entrepreneurship – The Promise for Future Entrepreneurship, Family Business and SME Research? Papers presented to the Rencontres de St-Gall 2008 (Beiträge zu den Rencontres de St-Gall 2010), U. Fueglistaller, T. Volery, W. Weber (Hrsg./Eds.). St. Gallen: KMU-Verlag HSG, 565 S.
Tsyganova T., Shirokova G. Gender Differences in Entrepreneurship: Evidence from GEM Data // Organizations and Markets in Emerging Economies, 2010. Vol. 1(1), pp. 120-141.
Àëèìîâà Ò.À., ×åíèíà À.Â., ×åïóðåíêî À.Þ. 2011. Ýêîíîìè÷åñêèé êðèçèñ è ïðåäïðèíèìàòåëüñêàÿ àêòèâ-íîñòü íàñåëåíèÿ Ðîññèè: îòêðûâàòü ñâîå äåëî èëè âû-õîäèòü èç áèçíåñà? // Ìèð Ðîññèè, ¹ 2, ñ. 142-160.
Âåðõîâñêàÿ Î.Ð., 2009. Ôàêòîðû ôîðìèðîâàíèÿ íà-ðîæäàþùåãîñÿ ïðåäïðèíèìàòåëüñòâà // ÑÏáÃÓ. Ñåðèÿ Ìåíåäæìåíò. Âûï. 2: 32–52.
Âåðõîâñêàÿ Î.Ð., Äåðìàíîâ Â.Ê., 2007. Ðîññèÿ â ãëîáàëüíîì ïðîåêòå èçó÷åíèÿ ïðåäïðèíèìàòåëüñòâà: èòîãè 2006 ã. // Âåñòíèê ÑÏáÃÓ. Ñåðèÿ Ìåíåäæìåíò. Âûï. 1: 185–191.
Âåðõîâñêàÿ Î.Ð., Äîðîõèíà Ì.Â. 2008. Ïðåäïðèíè-ìàòåëüñêàÿ àêòèâíîñòü â ñîâðåìåííîé Ðîññèè // Ðîñ-ñèéñêèé æóðíàë ìåíåäæìåíòà, 6(1): 25–52.
Porter, M. E., Schwab K. 2008. The Global Competitiveness Report 2008-2009. Geneva, Switzerland: World Economic Forum;
Reynolds P., Autio E. 2005. Global Entrepreneurship Monitor: Data collection, design and implementation 1998–2003. Small Business Economics 24 (3): 205–231.
Âåðõîâñêàÿ Î.Ð., Äîðîõèíà Ì.Â., 2008. Èññëåäîâà-íèÿ ïðåäïðèíèìàòåëüñòâà â Ðîññèè â ðàìêàõ ãëîáàëü-íîãî ìîíèòîðèíãà ïðåäïðèíèìàòåëüñòâà: îñíîâíûå ðåçóëüòàòû 2006 – 2007 ãã. // Âåñòíèê ÑÏáÃÓ. Ñåðèÿ Ìåíåäæìåíò. Âûï. 3: 33–60.
Âåðõîâñêàÿ Î.Ð., Äîðîõèíà Ì.Â., 2008. Ìåæäóíà-ðîäíûé ñåìèíàð «Ðîññèéñêîå ïðåäïðèíèìàòåëüñòâî: àêòóàëüíûå íàïðàâëåíèÿ èññëåäîâàíèé» // Ðîññèé-ñêèé æóðíàë ìåíåäæìåíòà. 6(4): 180–182.
Ãàáåëêî Ì. Â. 2009. Áûòü èëè íå áûòü … ïðåäïðè-íèìàòåëåì? Ñðàâíèòåëüíûé àíàëèç ìíåíèé íàñåëåíèÿ î ïåðñïåêòèâàõ ðàçâèòèÿ ïðåäïðèíèìàòåëüñòâà â ðå-ãèîíàõ Ðîññèè // Âîïðîñû ñòàòèñòèêè, ¹ 7.
Îáðàçöîâà Î.È., 2009. Âîçìîæíîñòè ñòàòèñòè÷å-ñêîãî èçó÷åíèÿ ðàííåãî ïðåäïðèíèìàòåëüñòâà â ÐÔ: óðîâåíü è êà÷åñòâî ïðåäïðèíèìàòåëüñêîãî ïîòåíöèàëà // Âîïðîñû ñòàòèñòèêè, ¹ 7.
Îáðàçöîâà Î.È., Ãóëååâà Þ.À., 2009. Íàðîæäàþùåå-ñÿ ïðåäïðèíèìàòåëüñòâî â ðàçëè÷íûõ òèïàõ ïîñåëåíèé: âûáîð íàñåëåíèåì ýêîíîìè÷åñêîãî ïîâåäåíèÿ â óñëîâè-ÿõ ãëîáàëüíîãî êðèçèñà // Âîïðîñû ñòàòèñòèêè, ¹ 11.
Òåîðèÿ ïðåäïðèíèìàòåëüñòâà â Ðîññèè: íîâûå ïîäõîäû è ðåçóëüòàòû: Ïî ìàòåðèàëàì «Ãëîáàëüíîãî ìîíèòîðèíãà ïðåäïðèíèìàòåëüñòâà»/ Ïîä ðåä. Àëèìî-âîé Ò.À., Îáðàçöîâîé Î.È., ×åïóðåíêî À.Þ. (îòâ. ðåä.) Âñòóïèò. ñòàòüÿ Å.Ã. ßñèíà. Ì.: ÃÓ-ÂØÝ, 2010;
×åïóðåíêî À.Þ. Ïðåäïðèíèìàòåëüñòâî â Ðîññèè: ïîëèòèêà è ðåàëüíîñòü. 1990–2000-å ãã. // Äâà êèòà èñ-ïàíñêîé ýêîíîìèêè. Îïûò ðàçâèòèÿ ìàëîãî è ñðåäíåãî áèçíåñà / Âåðíèêîâ Â. Ì.: Âåñü ìèð, 2010, ñ. 145-169.
Øèðîêîâà Ã.Â., Àðåïüåâà Ì.À., Ìîëîäöîâà Ì.Þ. 2009. Âëèÿíèå ñîöèàëüíûõ ñåòåé íà ðàçíûõ ýòàïàõ ðàçâèòèÿ ïðåäïðèíèìàòåëüñêîé ôèðìû: ðåçóëüòàòû àíàëèçà äàííûõ ãëîáàëüíîãî ìîíèòîðèíãà ïðåäïðèíè-ìàòåëüñòâà â Ðîññèè // Âåñòíèê ÑÏáÃÓ. Ñåðèÿ Ìåíåä-æìåíò. Âûï. 3: 3–31.
LITERATURE
46
GLOBAL ENTREPRENEURSHIP MONITOR
Team Institution Vendor
AngolaUniversidade Católica de Angola (UCAN) ; Sociedade Portuguesa de Inovação (SPI)
SINFIC – Sistemas de Informação Industriais, S.A.
ArgentinaCenter for Entrepreneurship,IAE Business School Universidad Austral
MORI Argentina
Australia Australian Centre for Entrepreneurship Research, Queensland University of Technology Q&A Market Research
Belgium Vlerick Leuven Gent Management School Dedicated Research
Bolivia Universidad Católica Boliviana/Maestrías para el Desarrollo CIES Internacional
Bosnia and Herzegovina
Entrepreneurship Development Centre Tuzla (in partnership with University of Tuzla) PULS d.o.o. Sarajevo
Brazil IBQP - Instituto Brasileiro da Qualidade e Produtividade Bonilha Comunicação e Marketing S/C Ltd.
Chile Universidad del Desarrollo andRegional Universities Opina S.A.
China Tsinghua University SEMSINOTRUST International Information & Consulting (Beijing) Co., Ltd.
Columbia
Universidad del Norte Pontifi cia Universidad Javeriana Cali Universidad de los AndesUniversidad Icesi
Centro Nacional deConsultoría
Costa-RicoAsociación Incubadora Parque Tec (PARQUE TEC)Universidad de Costa Rica (UCR)Cámara de Industrias de Costa Rica (CICR)
IPSOS Central America
Croatia J.J. Strossmayer University in Osijek Puls, d.o.o., Zagreb
Denmark University of Southern Denmark Catinet
Ecuador Escuela Superior Politécnica del Litoral (ESPOL)- ESPAE Graduate School of Management Survey Data
Egypt
The British University in Egypt (BUE)Egyptian Junior Business Association (EJB)Middle East Council for Small Businesses and Entrepreneurship, (MCSBE)
AC Nielsen
Finland Turku School of Economics, University of Turku Taloustutkimus Oy
France EMLYON Business School CSA
GermanyLeibniz University of Hannover and Federal Employment Agency (BA) – Institute for Employment Research (IAB)
Zentrum fuer Evaluation und Methoden (ZEM), Bonn
GhanaInstitute of Statistical, Social and Economic Research, University of Ghana
GreeceFoundation for Economic andIndustrial Research (IOBE)
Datapower SA
Guatemala Francisco Marroquín University Pablo Pastor
GEM TEAMS
47
RUSSIA 2010
Team Institution Vendor
Hungary
University of Pécs, Faculty ofBusiness and EconomicsGeorge Mason UniversityIndiana University
Szocio-Gráf Piac-és Közvélemény-kutató Intézet
Iceland Reykjavik University Capacent Gallup
Iran University of Tehran Dr. Mohammad Reza Zali
Ireland Dublin City University IFF
IsraelThe Ira Center for Business,Technology & Society, Ben Gurion University of the Negev
The BrandmanInstitute
Italy EntER - Bocconi University Target Research
Jamaica University of Technology, JamaicaKOCI Market Research and Data Mining Services
Japan Keio UniversitySocial SurveyResearch Information Co., Ltd (SSRI)
Korea Jinju National University Hankook Research Co.
LatviaThe TeliaSonera Institute at theStockholm School of Economics in Riga
SKDS
Macedonia
University “Ss. Cyril and Methodius” – Business Start-Up CentreMacedonian Enterprise Development Foundation (MEDF)
Brima Gallup
Malaysia University Tun Abdul Razak RehanstatMexico Tecnológico de Monterrey Alduncin y AsociadosMontenegro University of Montenegro Damar DOO PodgoricaNetherlands EIM Business and Policy Research StratusNorway Bodø Graduate School of Business TNS GallupPakistan Institute of Business Administration (IBA), Karachi Oasis International
Palestine The Palestine Economic Policy Research Institute -MASThe Palestine Central Bureau of Statistics (PCBS)
Peru Universidad ESAN Imasen
PortugalSPI VenturesUniversidade dos Açores (UAC)
GfKMetris (Metris – Métodos de Recolha e Investigação Social, S.A.)
RomaniaBabes-Bolyai University, Faculty of Economics and BusinessAdministration
Metro MediaTransilvania
Russia
Saint Petersburg TeamGraduate School of Management, Saint PetersburgMoscow TeamState University - Higher School of Economics, Moscow
Levada-Center
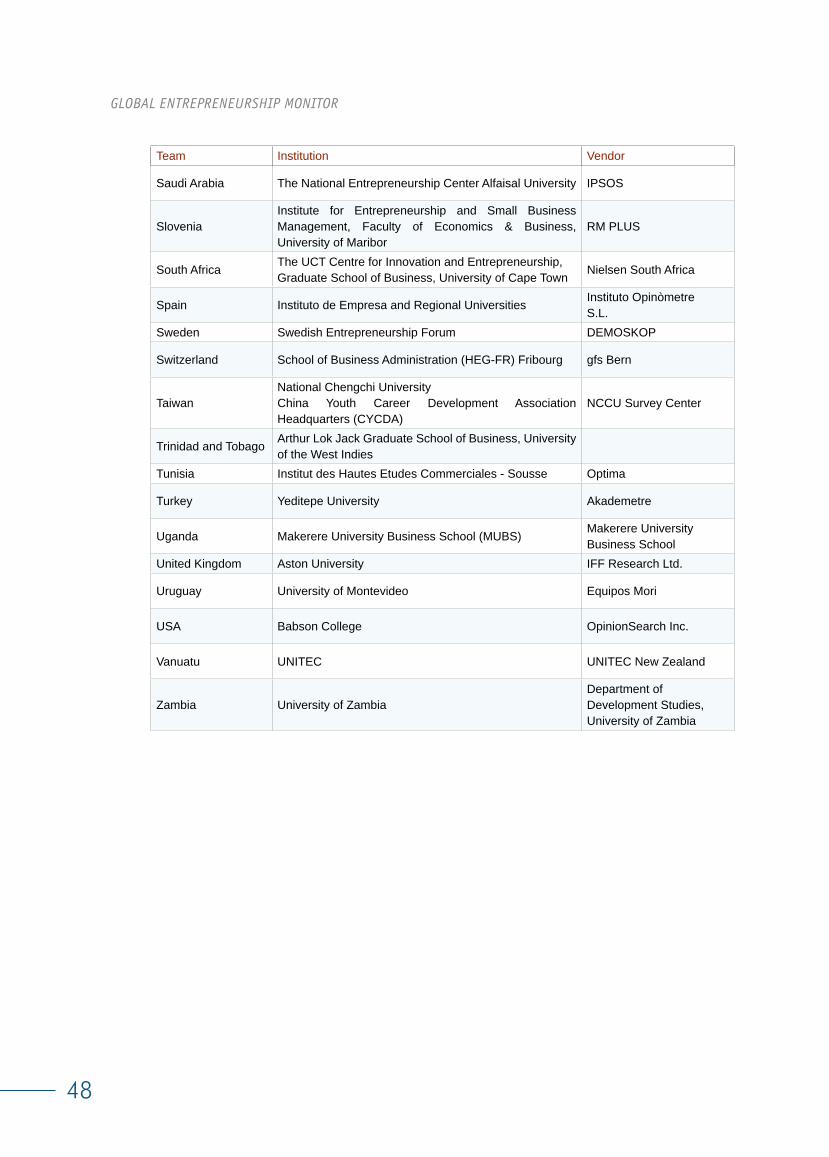
48
GLOBAL ENTREPRENEURSHIP MONITOR
Team Institution Vendor
Saudi Arabia The National Entrepreneurship Center Alfaisal University IPSOS
SloveniaInstitute for Entrepreneurship and Small Business Management, Faculty of Economics & Business, University of Maribor
RM PLUS
South AfricaThe UCT Centre for Innovation and Entrepreneurship,Graduate School of Business, University of Cape Town
Nielsen South Africa
Spain Instituto de Empresa and Regional UniversitiesInstituto OpinòmetreS.L.
Sweden Swedish Entrepreneurship Forum DEMOSKOP
Switzerland School of Business Administration (HEG-FR) Fribourg gfs Bern
TaiwanNational Chengchi UniversityChina Youth Career Development Association Headquarters (CYCDA)
NCCU Survey Center
Trinidad and Tobago Arthur Lok Jack Graduate School of Business, University of the West Indies
Tunisia Institut des Hautes Etudes Commerciales - Sousse Optima
Turkey Yeditepe University Akademetre
Uganda Makerere University Business School (MUBS)Makerere University Business School
United Kingdom Aston University IFF Research Ltd.
Uruguay University of Montevideo Equipos Mori
USA Babson College OpinionSearch Inc.
Vanuatu UNITEC UNITEC New Zealand
Zambia University of ZambiaDepartment of Development Studies, University of Zambia
National Reports
AUTHORS
Olga Verkhovskaya
The coordinator of GEM Russia
PhD (Economics), Associate Professor of Strategic and International Management Department
of Graduate School of Management, St. Petersburg State University.
Maria Dorokhina
PhD (Sociology), Researcher, Center for Entrepreneurship, Graduate School of Management,
St. Petersburg State University.

Graduate School of ManagementSt. Petersburg University
Volkhovsky Per. 3 St. Petersburg,
199004, Russia
Phone: +7 (812) 323 8456,
Fax: +7 (812) 329 3234
www.gsom.spbu.ru