Embed Size (px)
Citation preview
1
Global Entrepreneurship Monitor
Report on Social Entrepreneurship Executive Summary
Siri Terjesen, Jan Lepoutre, Rachida Justo, Niels Bosma
2
Global Entrepreneurship Monitor
Report on Social Entrepreneurship Executive Summary
Founding and Sponsoring Institutions:
Babson College, Babson Park, MA, United States Lead Sponsoring Institution and Founding Institution
Universidad del Desarrollo, Santiago, Chile Sponsoring Institution
Universiti Tun Abdul Razak, Kuala Lumpur, Malaysia
Sponsoring Institution
London Business School, London, United Kingdom Founding Institution
Although GEM data were used in the preparation of this report, their interpretation and use are the sole responsibility of the authors.
The authors would also like to express our gratitude to all participating GEM 2009 national teams.
© 2011 by Siri Terjesen, Jan Lepoutre, Rachida Justo, Niels Bosma and the Global
Entrepreneurship Research Association (GERA)
3
Global Entrepreneurship Monitor Report on Social Entrepreneurship Executive Summary
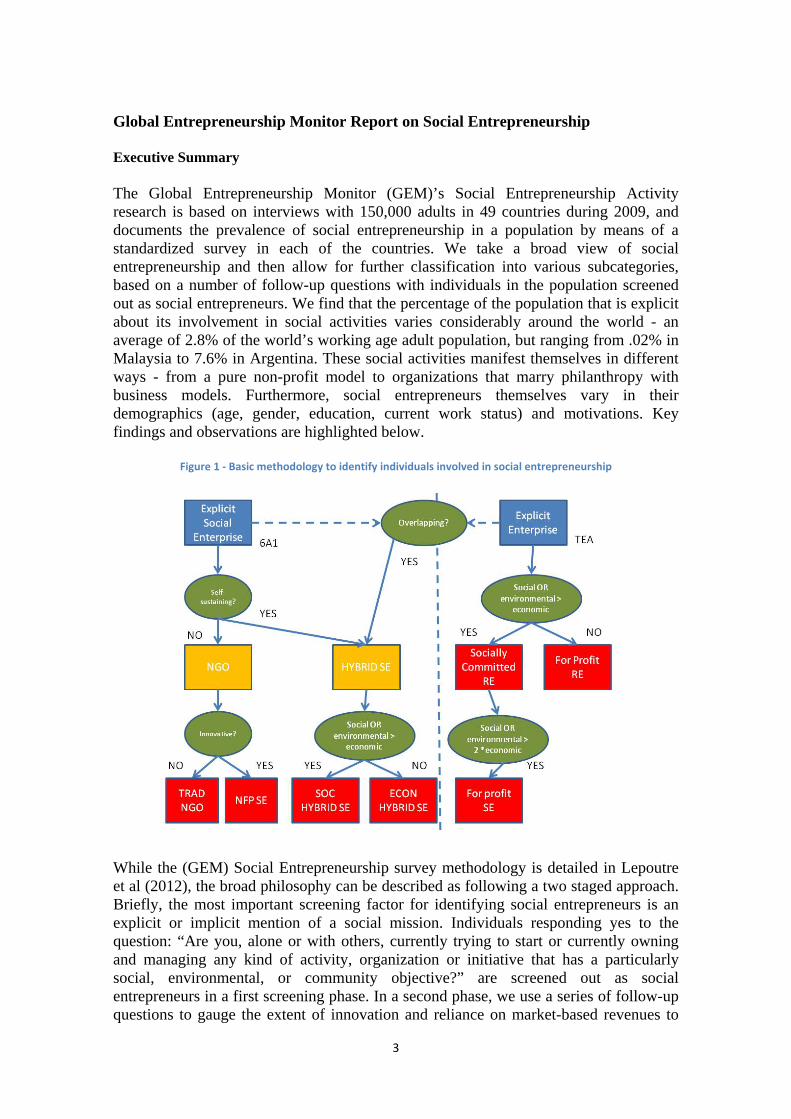
The Global Entrepreneurship Monitor (GEM)’s Social Entrepreneurship Activity research is based on interviews with 150,000 adults in 49 countries during 2009, and documents the prevalence of social entrepreneurship in a population by means of a standardized survey in each of the countries. We take a broad view of social entrepreneurship and then allow for further classification into various subcategories, based on a number of follow-up questions with individuals in the population screened out as social entrepreneurs. We find that the percentage of the population that is explicit about its involvement in social activities varies considerably around the world - an average of 2.8% of the world’s working age adult population, but ranging from .02% in Malaysia to 7.6% in Argentina. These social activities manifest themselves in different ways - from a pure non-profit model to organizations that marry philanthropy with business models. Furthermore, social entrepreneurs themselves vary in their demographics (age, gender, education, current work status) and motivations. Key findings and observations are highlighted below.
Figure 1 ‐ Basic methodology to identify individuals involved in social entrepreneurship
While the (GEM) Social Entrepreneurship survey methodology is detailed in Lepoutre et al (2012), the broad philosophy can be described as following a two staged approach. Briefly, the most important screening factor for identifying social entrepreneurs is an explicit or implicit mention of a social mission. Individuals responding yes to the question: “Are you, alone or with others, currently trying to start or currently owning and managing any kind of activity, organization or initiative that has a particularly social, environmental, or community objective?” are screened out as social entrepreneurs in a first screening phase. In a second phase, we use a series of follow-up questions to gauge the extent of innovation and reliance on market-based revenues to
4
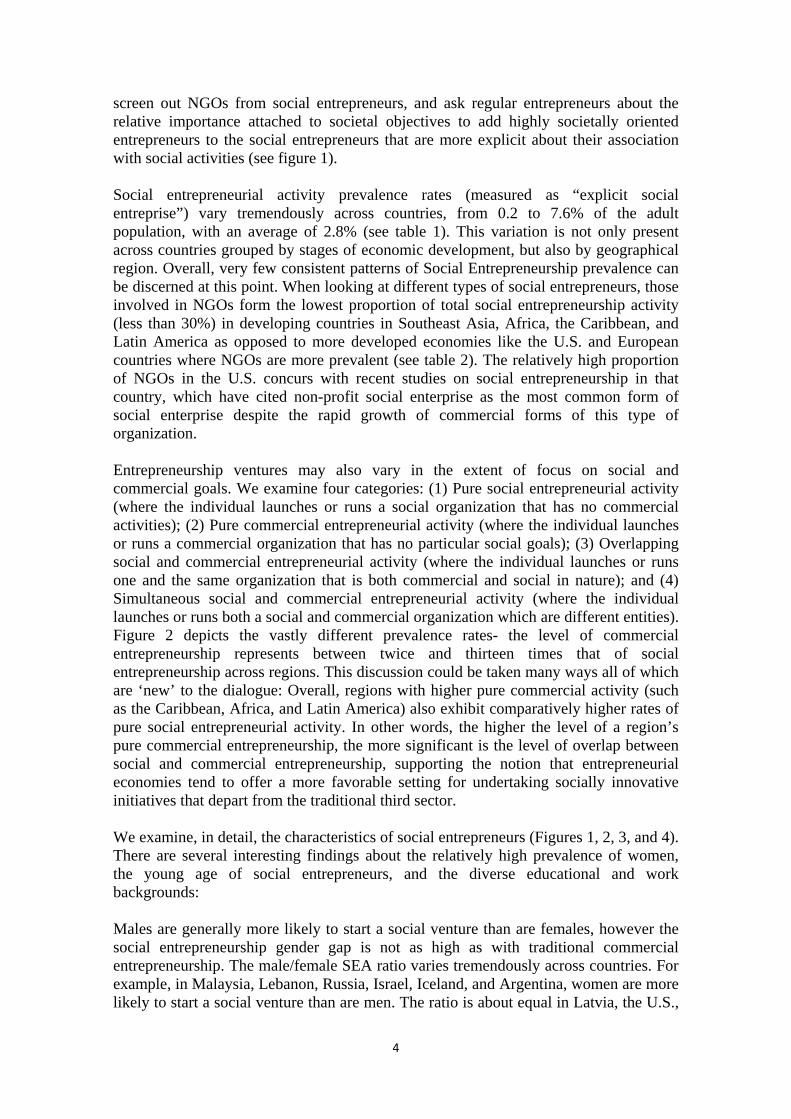
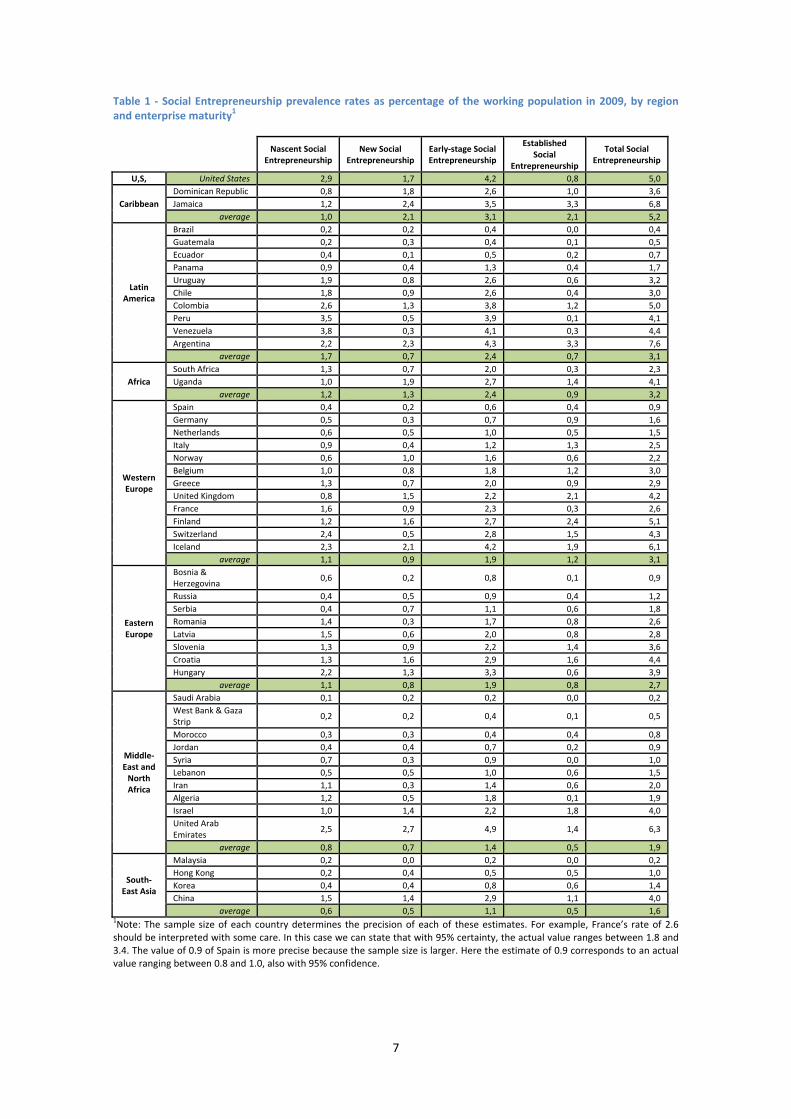
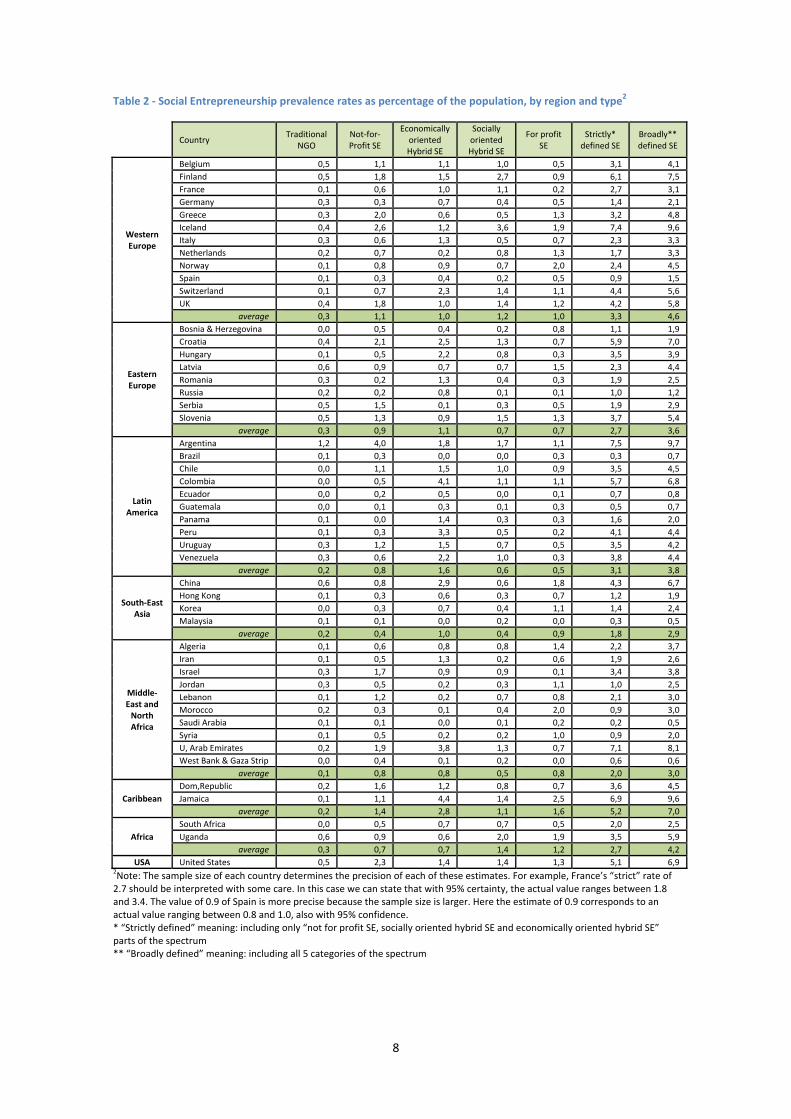
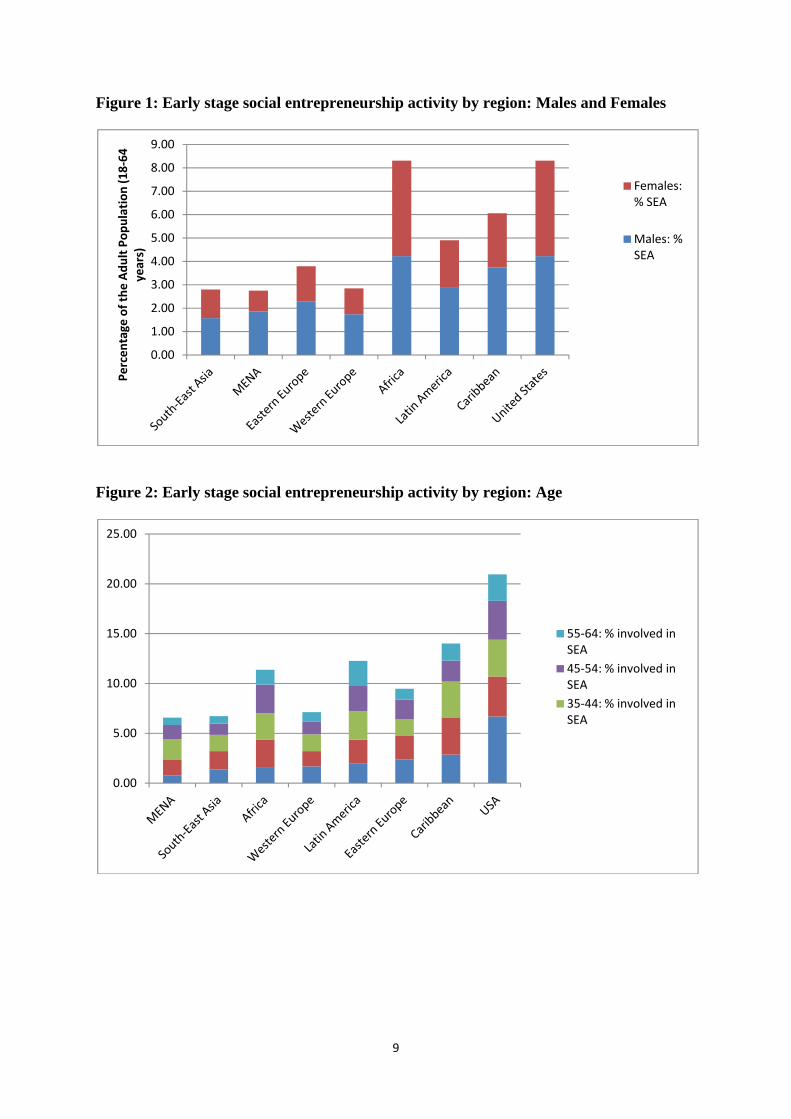
screen out NGOs from social entrepreneurs, and ask regular entrepreneurs about the relative importance attached to societal objectives to add highly societally oriented entrepreneurs to the social entrepreneurs that are more explicit about their association with social activities (see figure 1). Social entrepreneurial activity prevalence rates (measured as “explicit social entreprise”) vary tremendously across countries, from 0.2 to 7.6% of the adult population, with an average of 2.8% (see table 1). This variation is not only present across countries grouped by stages of economic development, but also by geographical region. Overall, very few consistent patterns of Social Entrepreneurship prevalence can be discerned at this point. When looking at different types of social entrepreneurs, those involved in NGOs form the lowest proportion of total social entrepreneurship activity (less than 30%) in developing countries in Southeast Asia, Africa, the Caribbean, and Latin America as opposed to more developed economies like the U.S. and European countries where NGOs are more prevalent (see table 2). The relatively high proportion of NGOs in the U.S. concurs with recent studies on social entrepreneurship in that country, which have cited non-profit social enterprise as the most common form of social enterprise despite the rapid growth of commercial forms of this type of organization. Entrepreneurship ventures may also vary in the extent of focus on social and commercial goals. We examine four categories: (1) Pure social entrepreneurial activity (where the individual launches or runs a social organization that has no commercial activities); (2) Pure commercial entrepreneurial activity (where the individual launches or runs a commercial organization that has no particular social goals); (3) Overlapping social and commercial entrepreneurial activity (where the individual launches or runs one and the same organization that is both commercial and social in nature); and (4) Simultaneous social and commercial entrepreneurial activity (where the individual launches or runs both a social and commercial organization which are different entities). Figure 2 depicts the vastly different prevalence rates- the level of commercial entrepreneurship represents between twice and thirteen times that of social entrepreneurship across regions. This discussion could be taken many ways all of which are ‘new’ to the dialogue: Overall, regions with higher pure commercial activity (such as the Caribbean, Africa, and Latin America) also exhibit comparatively higher rates of pure social entrepreneurial activity. In other words, the higher the level of a region’s pure commercial entrepreneurship, the more significant is the level of overlap between social and commercial entrepreneurship, supporting the notion that entrepreneurial economies tend to offer a more favorable setting for undertaking socially innovative initiatives that depart from the traditional third sector. We examine, in detail, the characteristics of social entrepreneurs (Figures 1, 2, 3, and 4). There are several interesting findings about the relatively high prevalence of women, the young age of social entrepreneurs, and the diverse educational and work backgrounds: Males are generally more likely to start a social venture than are females, however the social entrepreneurship gender gap is not as high as with traditional commercial entrepreneurship. The male/female SEA ratio varies tremendously across countries. For example, in Malaysia, Lebanon, Russia, Israel, Iceland, and Argentina, women are more likely to start a social venture than are men. The ratio is about equal in Latvia, the U.S.,
5
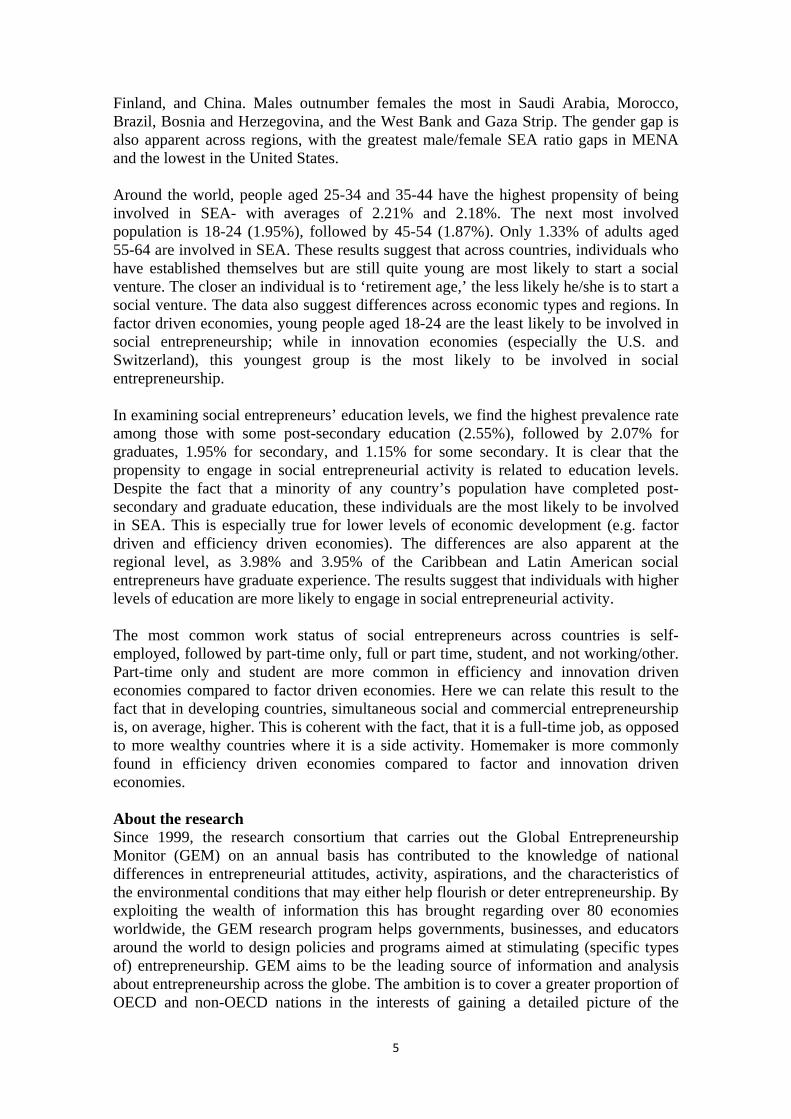
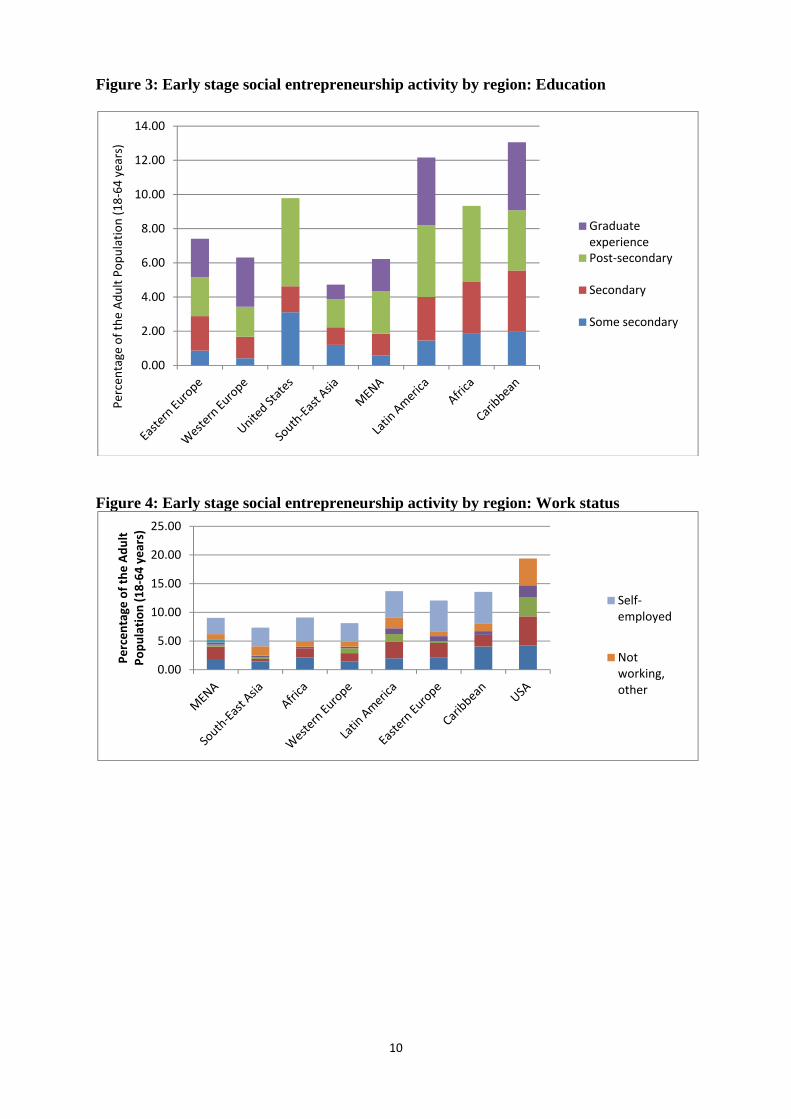
Finland, and China. Males outnumber females the most in Saudi Arabia, Morocco, Brazil, Bosnia and Herzegovina, and the West Bank and Gaza Strip. The gender gap is also apparent across regions, with the greatest male/female SEA ratio gaps in MENA and the lowest in the United States. Around the world, people aged 25-34 and 35-44 have the highest propensity of being involved in SEA- with averages of 2.21% and 2.18%. The next most involved population is 18-24 (1.95%), followed by 45-54 (1.87%). Only 1.33% of adults aged 55-64 are involved in SEA. These results suggest that across countries, individuals who have established themselves but are still quite young are most likely to start a social venture. The closer an individual is to ‘retirement age,’ the less likely he/she is to start a social venture. The data also suggest differences across economic types and regions. In factor driven economies, young people aged 18-24 are the least likely to be involved in social entrepreneurship; while in innovation economies (especially the U.S. and Switzerland), this youngest group is the most likely to be involved in social entrepreneurship. In examining social entrepreneurs’ education levels, we find the highest prevalence rate among those with some post-secondary education (2.55%), followed by 2.07% for graduates, 1.95% for secondary, and 1.15% for some secondary. It is clear that the propensity to engage in social entrepreneurial activity is related to education levels. Despite the fact that a minority of any country’s population have completed post-secondary and graduate education, these individuals are the most likely to be involved in SEA. This is especially true for lower levels of economic development (e.g. factor driven and efficiency driven economies). The differences are also apparent at the regional level, as 3.98% and 3.95% of the Caribbean and Latin American social entrepreneurs have graduate experience. The results suggest that individuals with higher levels of education are more likely to engage in social entrepreneurial activity. The most common work status of social entrepreneurs across countries is self-employed, followed by part-time only, full or part time, student, and not working/other. Part-time only and student are more common in efficiency and innovation driven economies compared to factor driven economies. Here we can relate this result to the fact that in developing countries, simultaneous social and commercial entrepreneurship is, on average, higher. This is coherent with the fact, that it is a full-time job, as opposed to more wealthy countries where it is a side activity. Homemaker is more commonly found in efficiency driven economies compared to factor and innovation driven economies. About the research Since 1999, the research consortium that carries out the Global Entrepreneurship Monitor (GEM) on an annual basis has contributed to the knowledge of national differences in entrepreneurial attitudes, activity, aspirations, and the characteristics of the environmental conditions that may either help flourish or deter entrepreneurship. By exploiting the wealth of information this has brought regarding over 80 economies worldwide, the GEM research program helps governments, businesses, and educators around the world to design policies and programs aimed at stimulating (specific types of) entrepreneurship. GEM aims to be the leading source of information and analysis about entrepreneurship across the globe. The ambition is to cover a greater proportion of OECD and non-OECD nations in the interests of gaining a detailed picture of the
6
world's entrepreneurs and their role in economic development. The study employs an original methodology that has been continually refined over ten years. Data collection follows strict quality control procedures. This strong methodology, among other distinct features, contributes to the project’s uniqueness and value for those seeking to benchmark and make comparisons about entrepreneurship among nations. Each economy participating in the GEM project has an academic team which selects a local survey vendor to conduct the Adult Population Survey and then monitors the process for quality control. The GEM central coordination team and its specialized staff ensure that each team follows strict GEM research standards. This ensures data quality and allows for the harmonization of data across all participating countries.
7
Table 1 ‐ Social Entrepreneurship prevalence rates as percentage of the working population in 2009, by region and enterprise maturity1
Nascent Social
Entrepreneurship New Social
Entrepreneurship Early‐stage Social Entrepreneurship
Established Social
Entrepreneurship
Total Social Entrepreneurship
U,S, United States 2,9 1,7 4,2 0,8 5,0
Caribbean
Dominican Republic 0,8 1,8 2,6 1,0 3,6
Jamaica 1,2 2,4 3,5 3,3 6,8
average 1,0 2,1 3,1 2,1 5,2
Latin America
Brazil 0,2 0,2 0,4 0,0 0,4
Guatemala 0,2 0,3 0,4 0,1 0,5
Ecuador 0,4 0,1 0,5 0,2 0,7
Panama 0,9 0,4 1,3 0,4 1,7
Uruguay 1,9 0,8 2,6 0,6 3,2
Chile 1,8 0,9 2,6 0,4 3,0
Colombia 2,6 1,3 3,8 1,2 5,0
Peru 3,5 0,5 3,9 0,1 4,1
Venezuela 3,8 0,3 4,1 0,3 4,4
Argentina 2,2 2,3 4,3 3,3 7,6
average 1,7 0,7 2,4 0,7 3,1
Africa
South Africa 1,3 0,7 2,0 0,3 2,3
Uganda 1,0 1,9 2,7 1,4 4,1
average 1,2 1,3 2,4 0,9 3,2
Western Europe
Spain 0,4 0,2 0,6 0,4 0,9
Germany 0,5 0,3 0,7 0,9 1,6
Netherlands 0,6 0,5 1,0 0,5 1,5
Italy 0,9 0,4 1,2 1,3 2,5
Norway 0,6 1,0 1,6 0,6 2,2
Belgium 1,0 0,8 1,8 1,2 3,0
Greece 1,3 0,7 2,0 0,9 2,9
United Kingdom 0,8 1,5 2,2 2,1 4,2
France 1,6 0,9 2,3 0,3 2,6
Finland 1,2 1,6 2,7 2,4 5,1
Switzerland 2,4 0,5 2,8 1,5 4,3
Iceland 2,3 2,1 4,2 1,9 6,1
average 1,1 0,9 1,9 1,2 3,1
Eastern Europe
Bosnia & Herzegovina
0,6 0,2 0,8 0,1 0,9
Russia 0,4 0,5 0,9 0,4 1,2
Serbia 0,4 0,7 1,1 0,6 1,8
Romania 1,4 0,3 1,7 0,8 2,6
Latvia 1,5 0,6 2,0 0,8 2,8
Slovenia 1,3 0,9 2,2 1,4 3,6
Croatia 1,3 1,6 2,9 1,6 4,4
Hungary 2,2 1,3 3,3 0,6 3,9
average 1,1 0,8 1,9 0,8 2,7
Middle‐East and North Africa
Saudi Arabia 0,1 0,2 0,2 0,0 0,2
West Bank & Gaza Strip
0,2 0,2 0,4 0,1 0,5
Morocco 0,3 0,3 0,4 0,4 0,8
Jordan 0,4 0,4 0,7 0,2 0,9
Syria 0,7 0,3 0,9 0,0 1,0
Lebanon 0,5 0,5 1,0 0,6 1,5
Iran 1,1 0,3 1,4 0,6 2,0
Algeria 1,2 0,5 1,8 0,1 1,9
Israel 1,0 1,4 2,2 1,8 4,0
United Arab Emirates
2,5 2,7 4,9 1,4 6,3
average 0,8 0,7 1,4 0,5 1,9
South‐East Asia
Malaysia 0,2 0,0 0,2 0,0 0,2
Hong Kong 0,2 0,4 0,5 0,5 1,0
Korea 0,4 0,4 0,8 0,6 1,4
China 1,5 1,4 2,9 1,1 4,0
average 0,6 0,5 1,1 0,5 1,6 1Note: The sample size of each country determines the precision of each of these estimates. For example, France’s rate of 2.6 should be interpreted with some care. In this case we can state that with 95% certainty, the actual value ranges between 1.8 and 3.4. The value of 0.9 of Spain is more precise because the sample size is larger. Here the estimate of 0.9 corresponds to an actual value ranging between 0.8 and 1.0, also with 95% confidence.
8
Table 2 ‐ Social Entrepreneurship prevalence rates as percentage of the population, by region and type2
Country
Traditional NGO
Not‐for‐Profit SE
Economically oriented Hybrid SE
Socially oriented Hybrid SE
For profit SE
Strictly* defined SE
Broadly** defined SE
Western Europe
Belgium 0,5 1,1 1,1 1,0 0,5 3,1 4,1
Finland 0,5 1,8 1,5 2,7 0,9 6,1 7,5
France 0,1 0,6 1,0 1,1 0,2 2,7 3,1
Germany 0,3 0,3 0,7 0,4 0,5 1,4 2,1
Greece 0,3 2,0 0,6 0,5 1,3 3,2 4,8
Iceland 0,4 2,6 1,2 3,6 1,9 7,4 9,6
Italy 0,3 0,6 1,3 0,5 0,7 2,3 3,3
Netherlands 0,2 0,7 0,2 0,8 1,3 1,7 3,3
Norway 0,1 0,8 0,9 0,7 2,0 2,4 4,5
Spain 0,1 0,3 0,4 0,2 0,5 0,9 1,5
Switzerland 0,1 0,7 2,3 1,4 1,1 4,4 5,6
UK 0,4 1,8 1,0 1,4 1,2 4,2 5,8
average 0,3 1,1 1,0 1,2 1,0 3,3 4,6
Eastern Europe
Bosnia & Herzegovina 0,0 0,5 0,4 0,2 0,8 1,1 1,9
Croatia 0,4 2,1 2,5 1,3 0,7 5,9 7,0
Hungary 0,1 0,5 2,2 0,8 0,3 3,5 3,9
Latvia 0,6 0,9 0,7 0,7 1,5 2,3 4,4
Romania 0,3 0,2 1,3 0,4 0,3 1,9 2,5
Russia 0,2 0,2 0,8 0,1 0,1 1,0 1,2
Serbia 0,5 1,5 0,1 0,3 0,5 1,9 2,9
Slovenia 0,5 1,3 0,9 1,5 1,3 3,7 5,4
average 0,3 0,9 1,1 0,7 0,7 2,7 3,6
Latin America
Argentina 1,2 4,0 1,8 1,7 1,1 7,5 9,7
Brazil 0,1 0,3 0,0 0,0 0,3 0,3 0,7
Chile 0,0 1,1 1,5 1,0 0,9 3,5 4,5
Colombia 0,0 0,5 4,1 1,1 1,1 5,7 6,8
Ecuador 0,0 0,2 0,5 0,0 0,1 0,7 0,8
Guatemala 0,0 0,1 0,3 0,1 0,3 0,5 0,7
Panama 0,1 0,0 1,4 0,3 0,3 1,6 2,0
Peru 0,1 0,3 3,3 0,5 0,2 4,1 4,4
Uruguay 0,3 1,2 1,5 0,7 0,5 3,5 4,2
Venezuela 0,3 0,6 2,2 1,0 0,3 3,8 4,4
average 0,2 0,8 1,6 0,6 0,5 3,1 3,8
South‐East Asia
China 0,6 0,8 2,9 0,6 1,8 4,3 6,7
Hong Kong 0,1 0,3 0,6 0,3 0,7 1,2 1,9
Korea 0,0 0,3 0,7 0,4 1,1 1,4 2,4
Malaysia 0,1 0,1 0,0 0,2 0,0 0,3 0,5
average 0,2 0,4 1,0 0,4 0,9 1,8 2,9
Middle‐East and North Africa
Algeria 0,1 0,6 0,8 0,8 1,4 2,2 3,7
Iran 0,1 0,5 1,3 0,2 0,6 1,9 2,6
Israel 0,3 1,7 0,9 0,9 0,1 3,4 3,8
Jordan 0,3 0,5 0,2 0,3 1,1 1,0 2,5
Lebanon 0,1 1,2 0,2 0,7 0,8 2,1 3,0
Morocco 0,2 0,3 0,1 0,4 2,0 0,9 3,0
Saudi Arabia 0,1 0,1 0,0 0,1 0,2 0,2 0,5
Syria 0,1 0,5 0,2 0,2 1,0 0,9 2,0
U, Arab Emirates 0,2 1,9 3,8 1,3 0,7 7,1 8,1
West Bank & Gaza Strip 0,0 0,4 0,1 0,2 0,0 0,6 0,6
average 0,1 0,8 0,8 0,5 0,8 2,0 3,0
Caribbean
Dom,Republic 0,2 1,6 1,2 0,8 0,7 3,6 4,5
Jamaica 0,1 1,1 4,4 1,4 2,5 6,9 9,6
average 0,2 1,4 2,8 1,1 1,6 5,2 7,0
Africa
South Africa 0,0 0,5 0,7 0,7 0,5 2,0 2,5
Uganda 0,6 0,9 0,6 2,0 1,9 3,5 5,9
average 0,3 0,7 0,7 1,4 1,2 2,7 4,2
USA United States 0,5 2,3 1,4 1,4 1,3 5,1 6,9 2Note: The sample size of each country determines the precision of each of these estimates. For example, France’s “strict” rate of 2.7 should be interpreted with some care. In this case we can state that with 95% certainty, the actual value ranges between 1.8 and 3.4. The value of 0.9 of Spain is more precise because the sample size is larger. Here the estimate of 0.9 corresponds to an actual value ranging between 0.8 and 1.0, also with 95% confidence. * “Strictly defined” meaning: including only “not for profit SE, socially oriented hybrid SE and economically oriented hybrid SE” parts of the spectrum ** “Broadly defined” meaning: including all 5 categories of the spectrum
9
Figure 1: Early stage social entrepreneurship activity by region: Males and Females
Figure 2: Early stage social entrepreneurship activity by region: Age
0.00
1.00
2.00
3.00
4.00
5.00
6.00
7.00
8.00
9.00
Percentage
of the Adult Population (18‐64
years)
Females: % SEA
Males: % SEA
0.00
5.00
10.00
15.00
20.00
25.00
55‐64: % involved in SEA
45‐54: % involved in SEA
35‐44: % involved in SEA
10
Figure 3: Early stage social entrepreneurship activity by region: Education
Figure 4: Early stage social entrepreneurship activity by region: Work status
0.00
2.00
4.00
6.00
8.00
10.00
12.00
14.00Percentage of the Adult Population (18‐64 years)
Graduate experiencePost‐secondary
Secondary
Some secondary
0.00
5.00
10.00
15.00
20.00
25.00
Percentage
of the Adult
Population (18‐64 years)
Self‐employed
Not working, other
11
GERA and GEM The Global Entrepreneurship Research Association (GERA) is, for formal constitutional and regulatory purposes, the umbrella organization that hosts the GEM project. GERA is an
association formed of Babson College, London Business School, and representatives of the Association of GEM national teams.
The GEM program is a major initiative aimed at describing and analyzing entrepreneurial processes within a wide range of countries. The program has three main objectives:
• To measure differences in the level of entrepreneurial activity between countries • To uncover factors leading to appropriate levels of entrepreneurship • To suggest policies that may enhance the national level of entrepreneurial activity.
New developments, and all global, national and special topic reports, can be found at www.gemconsortium.org.
BABSON COLLEGE Babson College in Wellesley, Massachusetts, USA, is recognized internationally as a leader in entrepreneurial management education. Babson College is the Leading Sponsoring Institution and a Founding Institutions. Babson grants BS degrees through its innovative undergraduate program, and grants MBA and custom MS and MBA degrees through the F.W. Olin Graduate School of Business at Babson College. Babson Executive Education offers executive development programs to experienced managers worldwide. For information, visit www.babson.edu
UNIVERSIDAD DEL DESARROLLO
Universidad Del Desarrollo, UDD, Educational project was driven by outstanding leaders of the Chilean public
and business scene and is today one of the top three prestigious private universities in Chile. Success came
quickly, after just twenty years, its rapid growth has become an expression of the University’s main facet:
Entrepreneurship. UDD MBA is rated one of the best in Latin America and also one of the best in
Entrepreneurship education, according to AméricaEconomîa magazine, and achievement that once again
represents the “entrepreneurial” seal that is embedded in the spirit of the University. For more information
visit www.udd.cl
UNIVERSITY TUN ABDUL RAZAK
Universiti Tun Abdul Razak (UNIRAZAK) was established in 1997, as one of the first private universities in
Malaysia. Named after Malaysia's second Prime Minister, the late YAB Tun Abdul Razak, its vision is to become
the leading institution in providing quality education and human capital in niche areas or body of knowledge
among emerging economies. UNIRAZAK also enhances its cooperation and collaborative networks through
strategic alliances with top‐ranking international universities, renowned in their respective fields. This in turn
supports its mission to become the Centre of Excellence in fostering Managerial Leadership and
Entrepreneurship. For more information, visit www.unirazak.edu.my

12
Contacts
For more information on this report, contact Siri Terjesen at [email protected] or Jan Lepoutre at
To download copies of the GEM Global Report(s), GEM National Team Reports, and to access select
data sets, please visit the GEM Web site at www.gemconsortium.org.
Nations not currently represented in the GEM Consortium may express interest in joining and request
additional information by e‐mailing the Executive Director, Mike Herrington: