Embed Size (px)
Citation preview

Global foreign direct investment: the case of Russia
Laza Kekic - Regional Director, Central and Eastern EuropeEconomist Intelligence Unit
Moscow, July 1st 2003
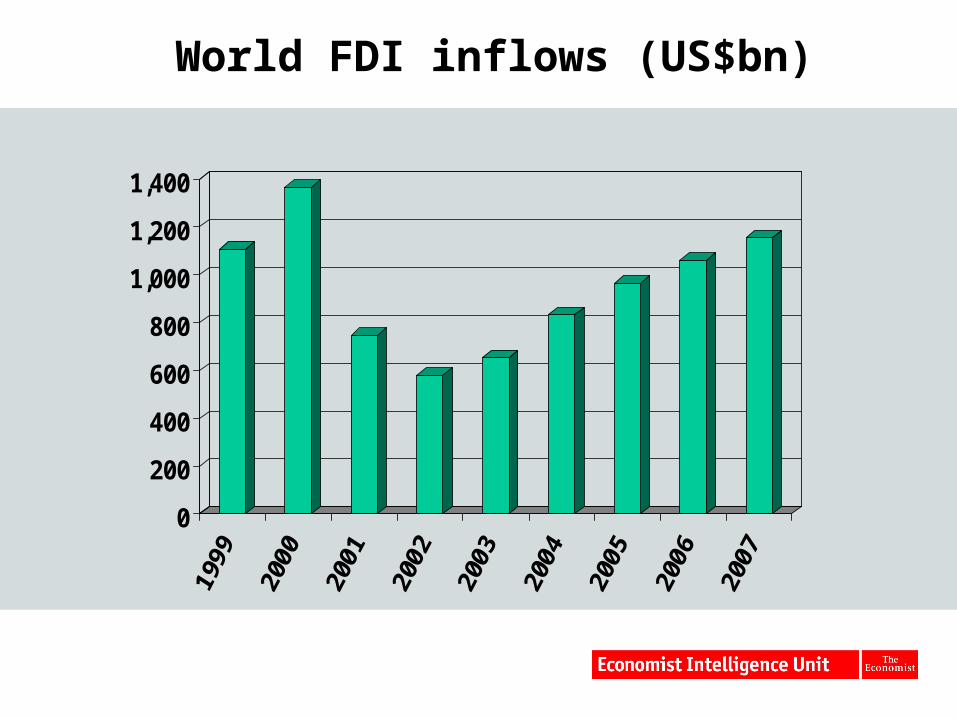
World FDI inflows (US$bn)
0
200
400
600
800
1,000
1,200
1,400

FDI in eastern Europe
FDI into the transition region bucked worldwide trend of stagnant or declining inflows in 2002
Record total of over US$32bn, despite weak OECD growth and difficult financing conditions.
Increased relative attractiveness of the region compared with most other emerging markets;
Further sales of state assets;
Cost-cutting pressures on Western companies
FDI key driver of investment growth, rapid structural change and competitiveness in central
and east European economies
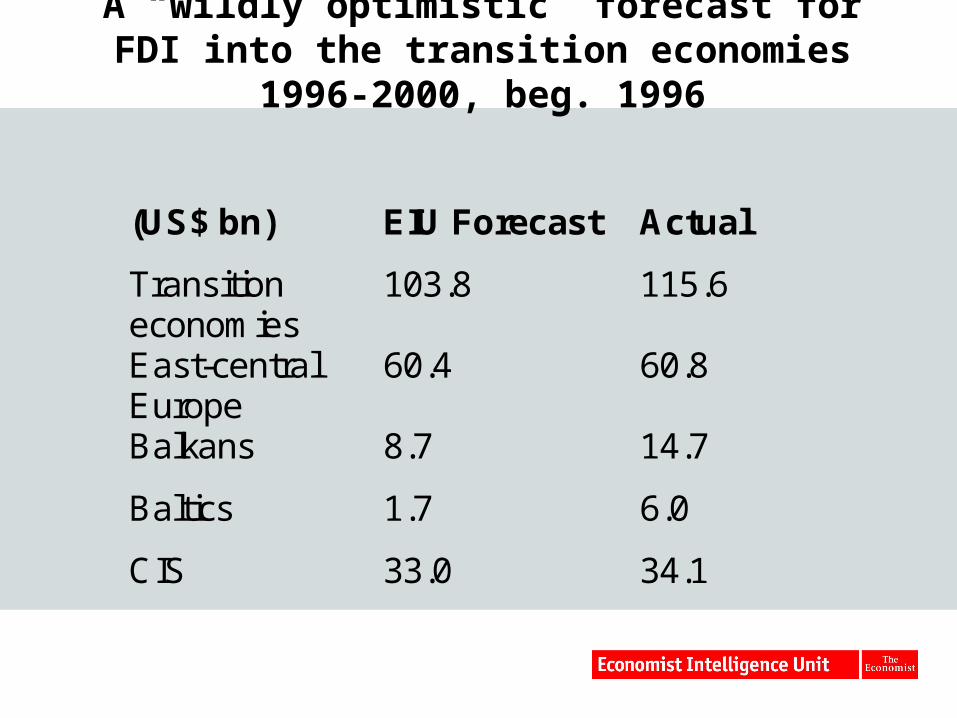
A “wildly optimistic” forecast for FDI into the transition economies 1996-2000, beg. 1996
(US$ bn) EIU Forecast Actual
Transitioneconomies
103.8 115.6
East-centralEurope
60.4 60.8
Balkans 8.7 14.7
Baltics 1.7 6.0
CIS 33.0 34.1

The medium-term future: more of the same
Continued steady increase in inflows Share of Poland, Hungary and Czech Republic in
regional total to decline (to 40% of total) FDI/GDP averages just over 3% of GDP Some CIS energy producers major attraction Catch-up in reforms, performance and FDI by some
previous laggards

FDI inflows into the transition economies (US $m)
0
5000
10000
15000
20000
25000
30000
35000
40000
45000
1999 2000 2001 2002 2003 2004 2005 2006 2007
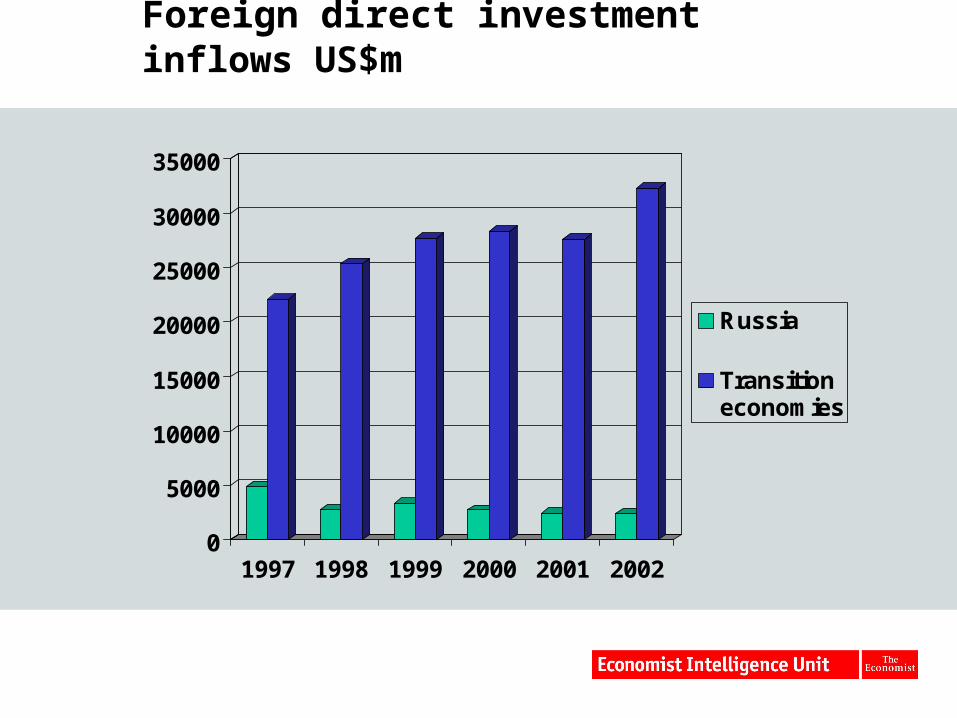
Foreign direct investment inflows US$m
0
5000
10000
15000
20000
25000
30000
35000
1997 1998 1999 2000 2001 2002
Russia
Transitioneconomies
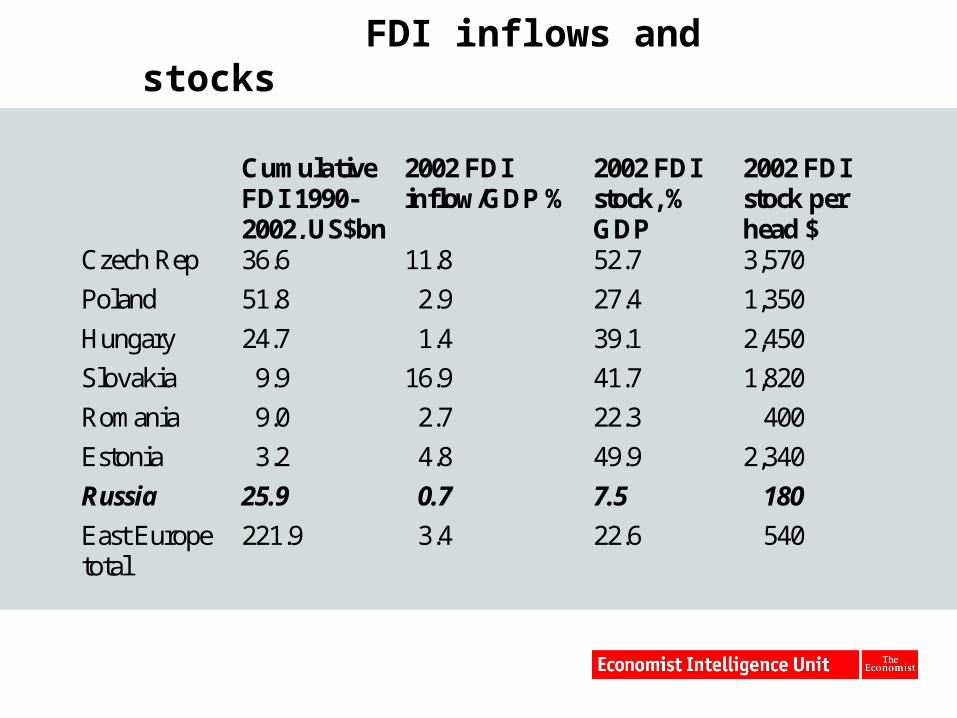
FDI inflows and stocks
CumulativeFDI 1990-2002, US$bn
2002 FDIinflow/GDP %
2002 FDIstock, %GDP
2002 FDIstock perhead $
Czech Rep 36.6 11.8 52.7 3,570
Poland 51.8 2.9 27.4 1,350
Hungary 24.7 1.4 39.1 2,450
Slovakia 9.9 16.9 41.7 1,820
Romania 9.0 2.7 22.3 400
Estonia 3.2 4.8 49.9 2,340
Russia 25.9 0.7 7.5 180
East Europetotal
221.9 3.4 22.6 540

The baseline outlook--getting by
Political stability Putin persists with reforms, although
implementation remains difficult Medium-term external environment is relatively
favourable Macrostability preserved No 2007-08 “succession crisis” Authoritarian trends held in check External debt managed successfully Oil prices remain near US$20 pb

Russia’s long-term growth prospects
Scope for catch-up (+)
Demographics (-)
Skills endowment (mixed)
Geography (-)
Infrastructure (-)
Institutions (-)
Regulation (?)
Macro policies (+)
Max 3.5% growth (if no “Dutch disease”)
0
20
40
60
80
100
120
1989
1991
1993
1995
1997
1999
2001
Real GDP (1989=100)
Russia
Transitionregion
Central Europe
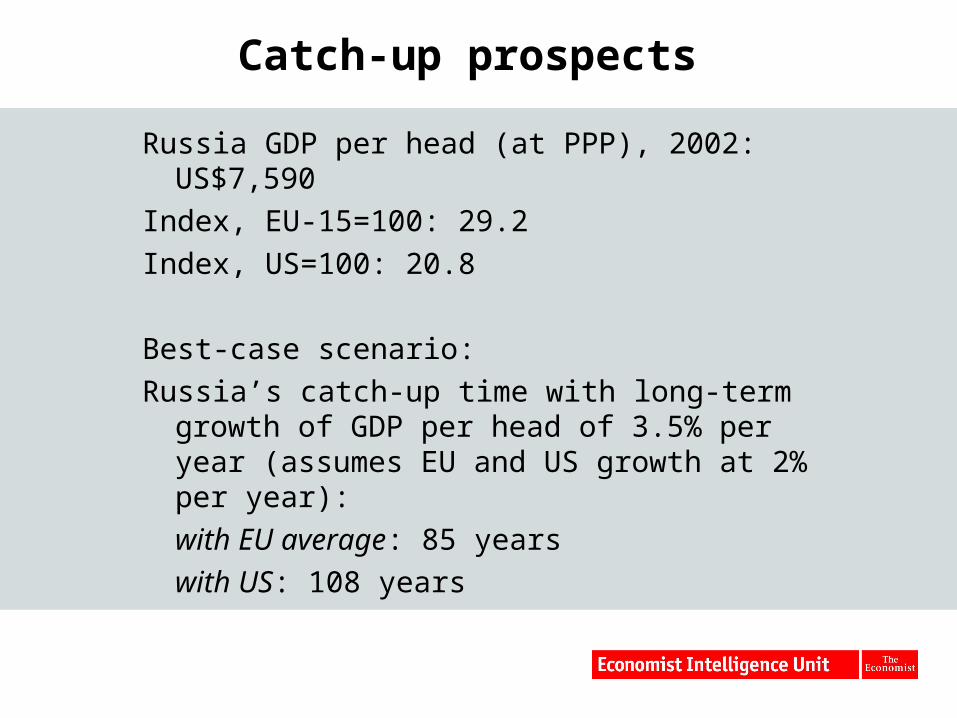
Catch-up prospects
Russia GDP per head (at PPP), 2002: US$7,590
Index, EU-15=100: 29.2
Index, US=100: 20.8
Best-case scenario:
Russia’s catch-up time with long-term growth of GDP per head of 3.5% per year (assumes EU and US growth at 2% per year):
with EU average: 85 years
with US: 108 years

The baseline outlook and growth
Not enough for sustained, very fast growth Long-term growth determinants--Russia has
too many minuses Domestic underpinnings for sustained fast
growth are weak
Hypothesis:
Russia needs massive infusion of foreign capital, technology and management practices to try to break long-term growth bind

Main determinants of FDI
Market size GDP Expected market growth Natural resources endowment Labour costs Distances/proximity to markets Agglomeration effects (FDI clusters) Overall business environment Policy towards FDI Exchange rate variability Regional integration
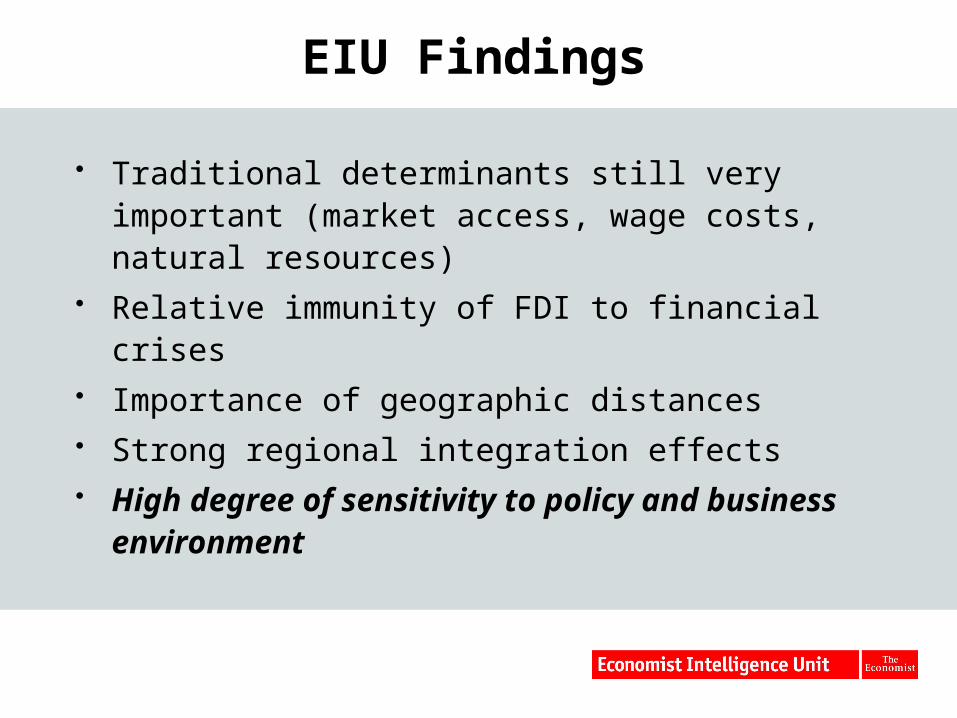
EIU Findings
Traditional determinants still very important (market access, wage costs, natural resources)
Relative immunity of FDI to financial crises Importance of geographic distances Strong regional integration effects High degree of sensitivity to policy and business
environment

EIU business environment rankings model
Model measures the quality or attractiveness of the business environment and its key components
Opportunities for and hindrances to business in 60 countries (over 95% of global FDI and GDP)
Ranking of a country’s overall position and ten categories The model uses quantitative data and forecasts, business
surveys and expert assessment Main criteria used by companies to formulate their global
business strategies and investment location decisions The overall scores (on a 1-10 scale) and rankings are based
on the scores for 70 indicators
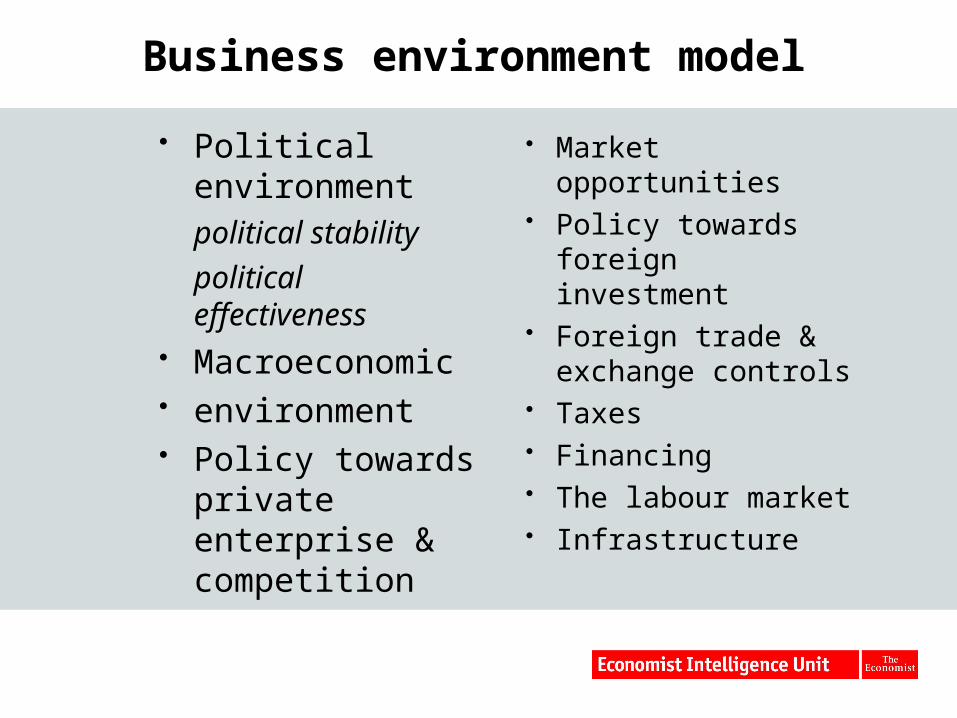
Business environment model
Political environmentpolitical stability
political effectiveness
Macroeconomic environment Policy towards
private enterprise & competition
Market opportunities
Policy towards foreign investment
Foreign trade & exchange controls
Taxes Financing The labour market Infrastructure
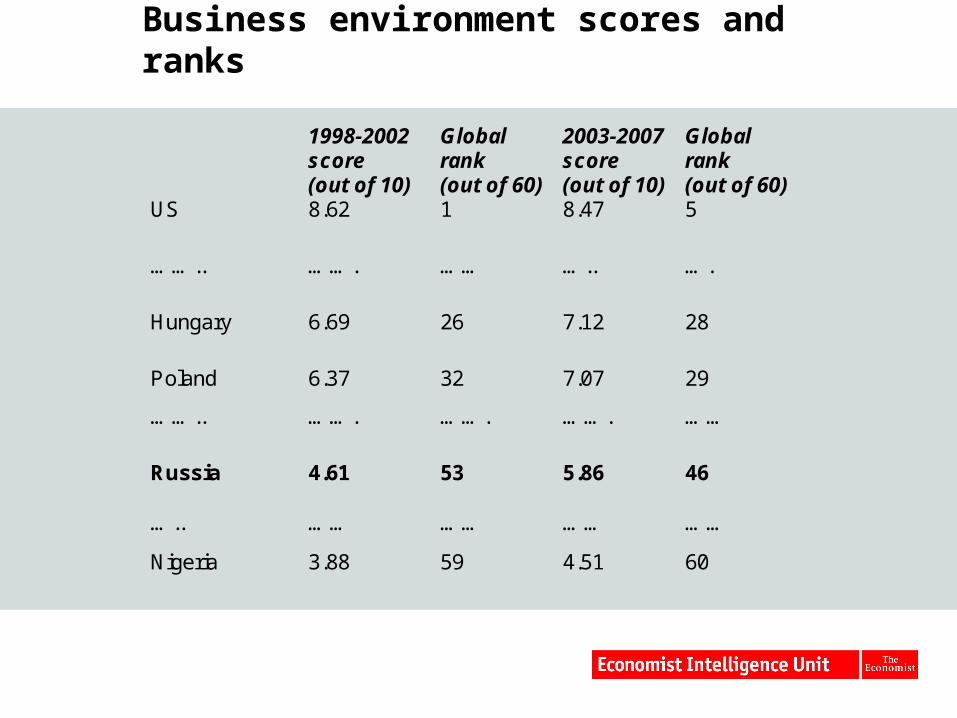
Business environment scores and ranks
1998-2002score(out of 10)
Globalrank(out of 60)
2003-2007score(out of 10)
Globalrank(out of 60)
US 8.62 1 8.47 5
…….. ……. …… ….. ….
Hungary 6.69 26 7.12 28
Poland 6.37 32 7.07 29
…….. ……. ……. ……. ……
Russia 4.61 53 5.86 46
….. …… …… …… ……
Nigeria 3.88 59 4.51 60

Russia’s business environment
1998-2002 2003-07 1998-2002 2003-07
Value of index(out of 10)
Value of index(out of 10)
Global rank(out of 60)
Global rank(out of 60)
Overall position 4.61 5.86 53 46
Political environment 3.0 4.3 58 50
Macroeconomicenvironment
4.8 7.3 57 45
Market opportunities 7.2 7.7 12 5
Policy towards privateenterprise
3.3 4.9 55 49
Policy towards FDI 3.3 4.4 59 58
Foreign trade regime 6.1 7.2 41 44
Taxes 4.0 5.5 55 46Financing 3.6 5.1 52 46
The labour market 6.6 7.2 17 12Infrastructure 4.2 5.1 41 40

Russia’s business environment
Comparative strengths Labour market Market opportunities
Comparative weaknesses Institutional ineffectiveness
(bureaucracy, corruption, rule of law) Infrastructure Overall policy towards private enterprise Financial sector
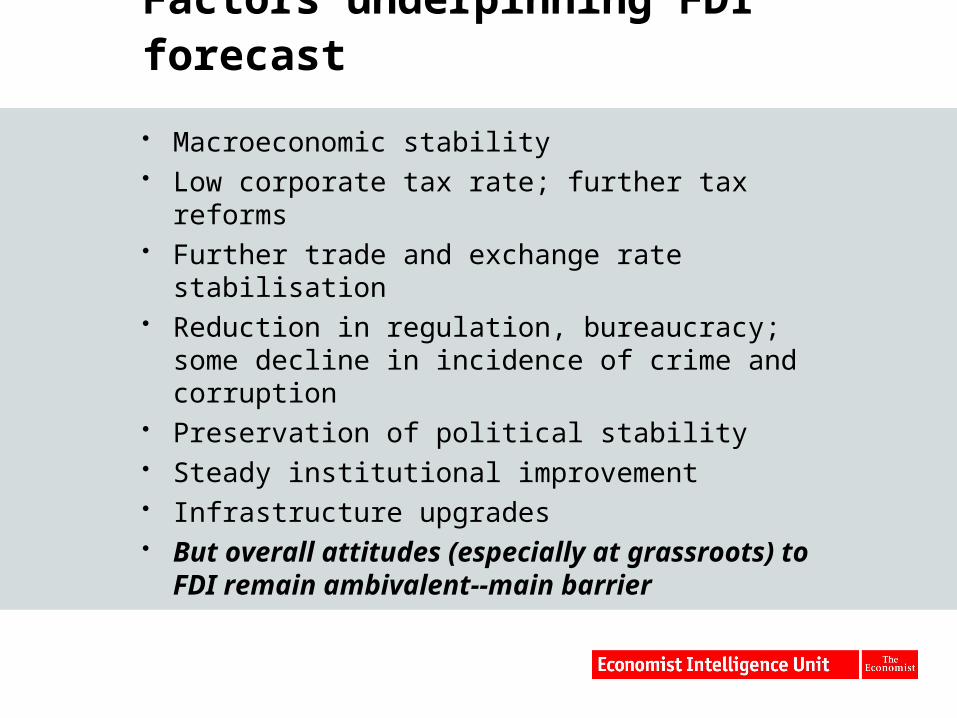
Factors underpinning FDI forecast
Macroeconomic stability Low corporate tax rate; further tax reforms Further trade and exchange rate stabilisation Reduction in regulation, bureaucracy; some
decline in incidence of crime and corruption Preservation of political stability Steady institutional improvement Infrastructure upgrades But overall attitudes (especially at
grassroots) to FDI remain ambivalent--main barrier

Medium-term FDI projection
Expected improvement in overall business environment
with:
Improvement in most areas of the business environment
Maintenance of competitive labour costs
Consistent with average FDI inflow of up to US$10bn per year in 2003-07; about 2% of GDP--but still well below potential and requirements

Some issues for discussion
Could future FDI into Russia be even stronger?
How sensitive to Russo-Western political relations?
FDI and EU membership - how high are the costs of exclusion?
How much does eastern Europe feature in MNE global strategies?
Choosing a regional destination - safe versus risky strategies


![Reforms and growth in transition [EBRD - Working papers] · 2011. 2. 16. · Libor Krkoska and Utku Teksoz, and to Laza Kekic, Colin Lawson, Martin Raiser, Karsten Staehr, Haifeng](https://img.pdfslide.net/doc/110x75/5fe3ecca2c3af44122244b04/reforms-and-growth-in-transition-ebrd-working-papers-2011-2-16-libor-krkoska.jpg)