Embed Size (px)
Citation preview
Global Index Briefing:MSCI STRG, STEG, & LTEG
Yardeni Research, Inc.
May 18, 2019
Dr. Ed Yardeni516-972-7683
Joe Abbott732-497-5306
Mali Quintana480-664-1333
Please visit our sites atwww.yardeni.comblog.yardeni.com
thinking outside the box
Table Of Contents Table Of ContentsTable Of Contents
May 18, 2019 / Global Index Briefing: MSCI STRG, STEG, & LTEG www.yardeni.com
Yardeni Research, Inc.
All Country World 3US & EAFE 4Europe 5Emerging Markets 6-7Countries A-Z 8-29

2006 2007 2008 2009 2010 2011 2012 2013 2014 2015 2016 2017 2018 2019 2020-5
0
5
10
15
20
25
30
35
40
-5
0
5
10
15
20
25
30
35
40
5/9
yardeni.com
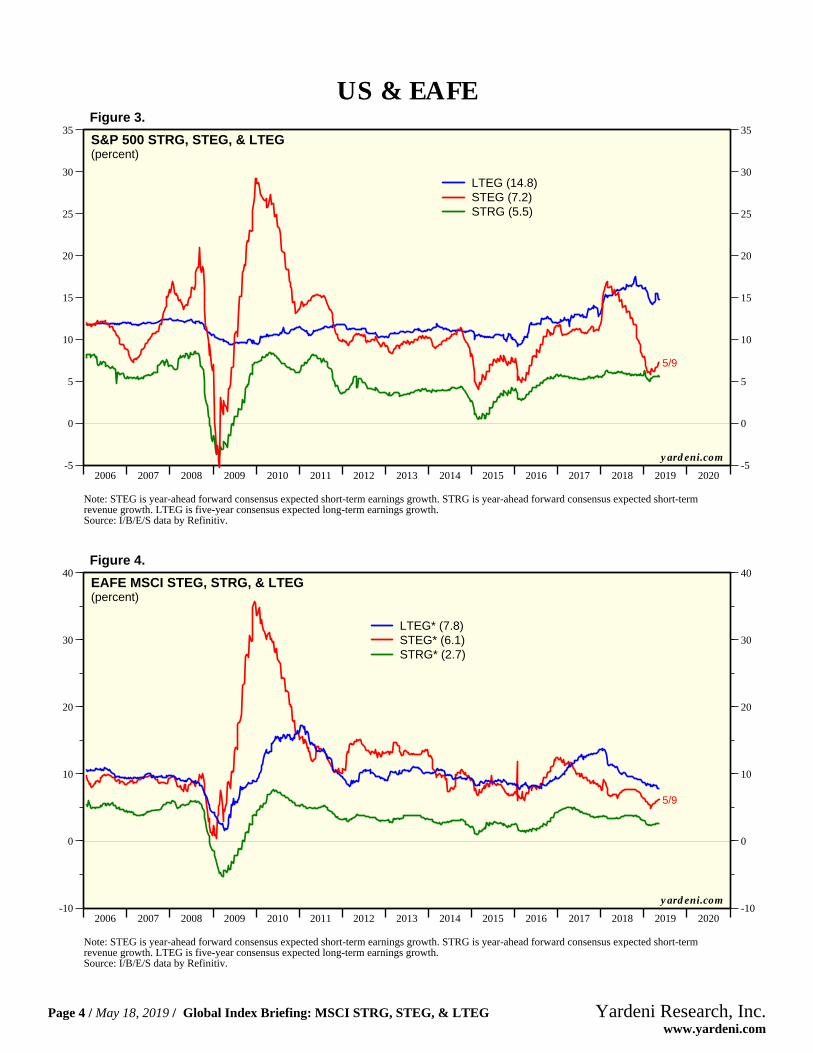
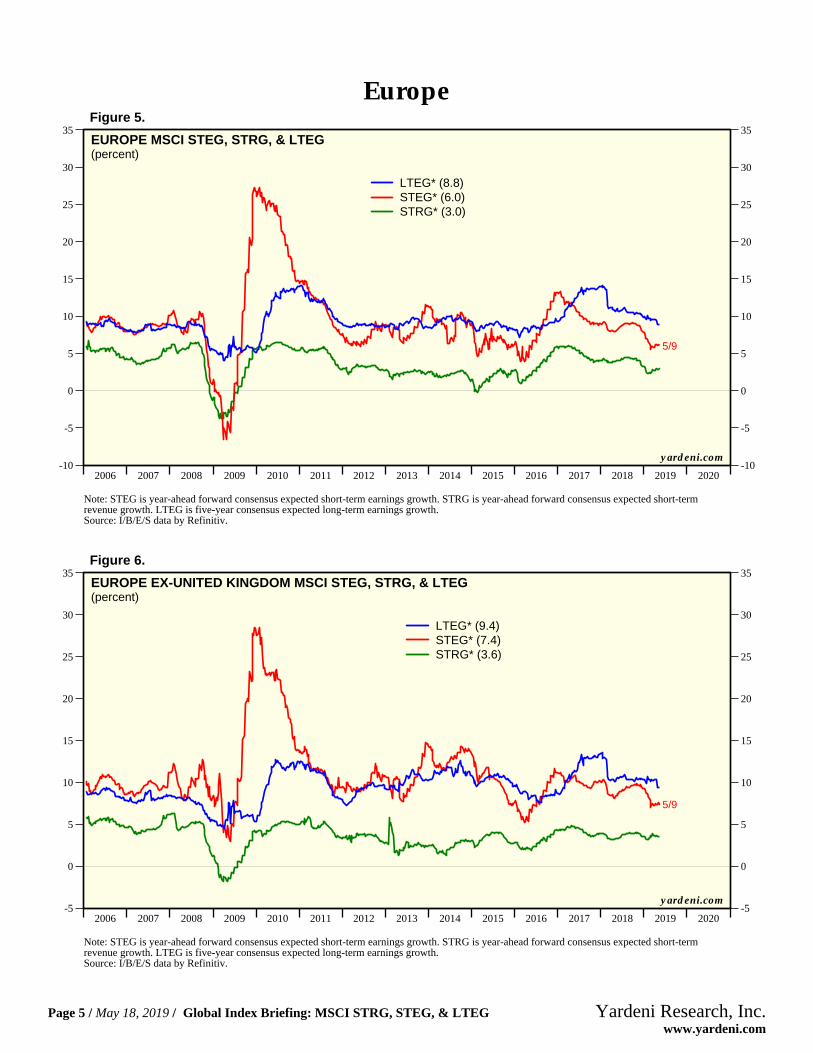
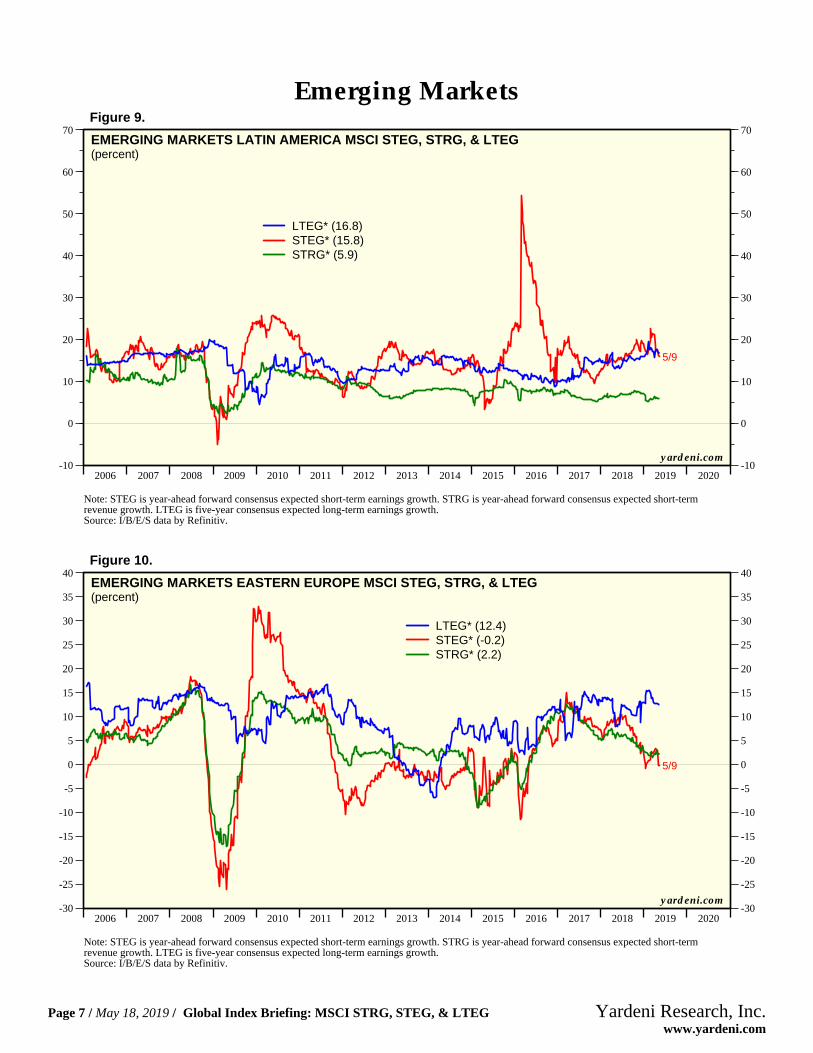
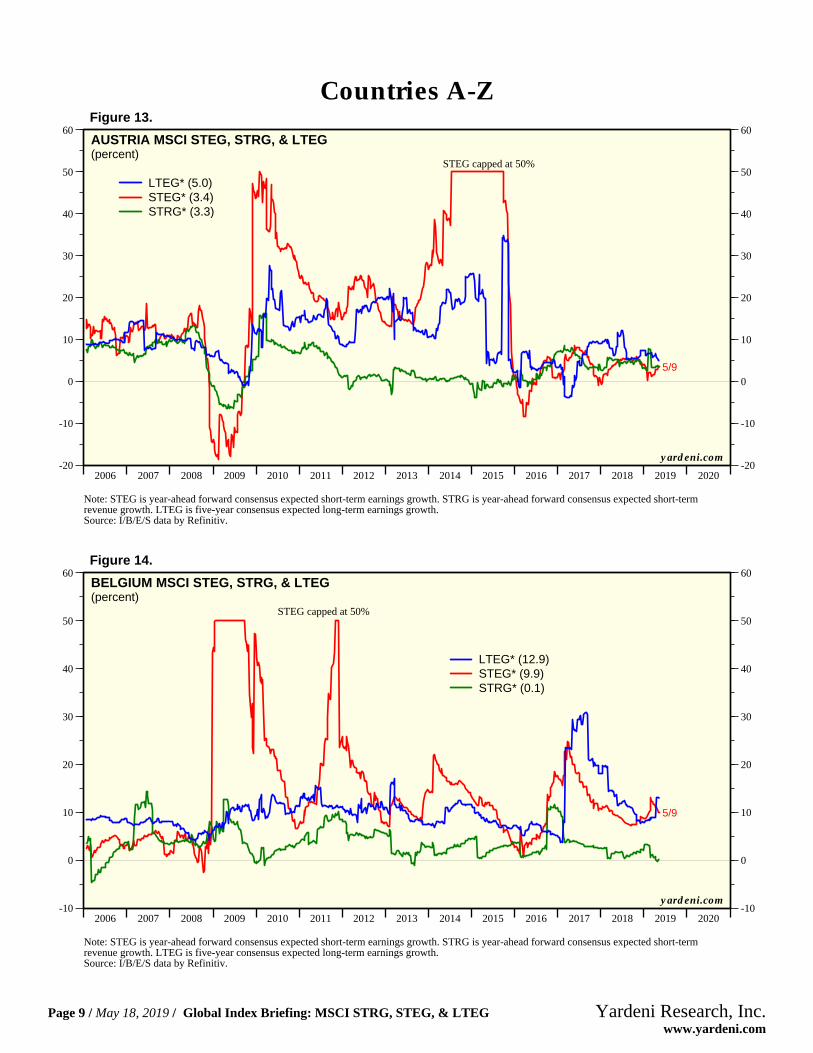
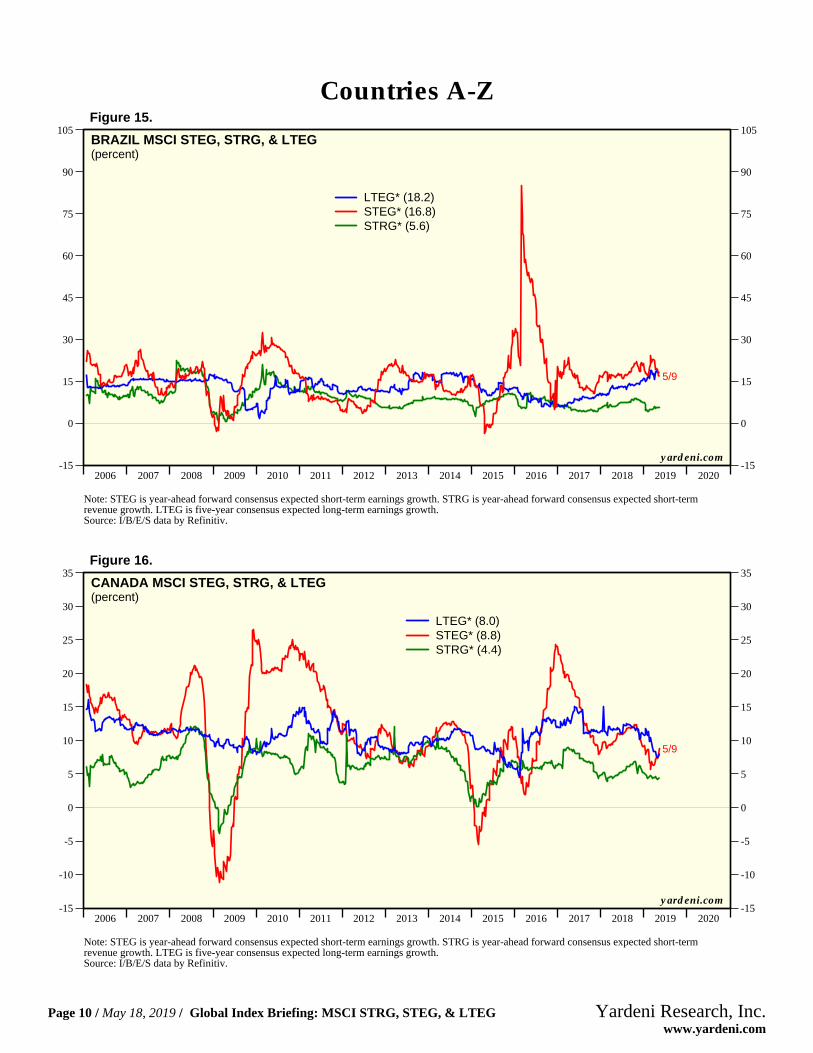
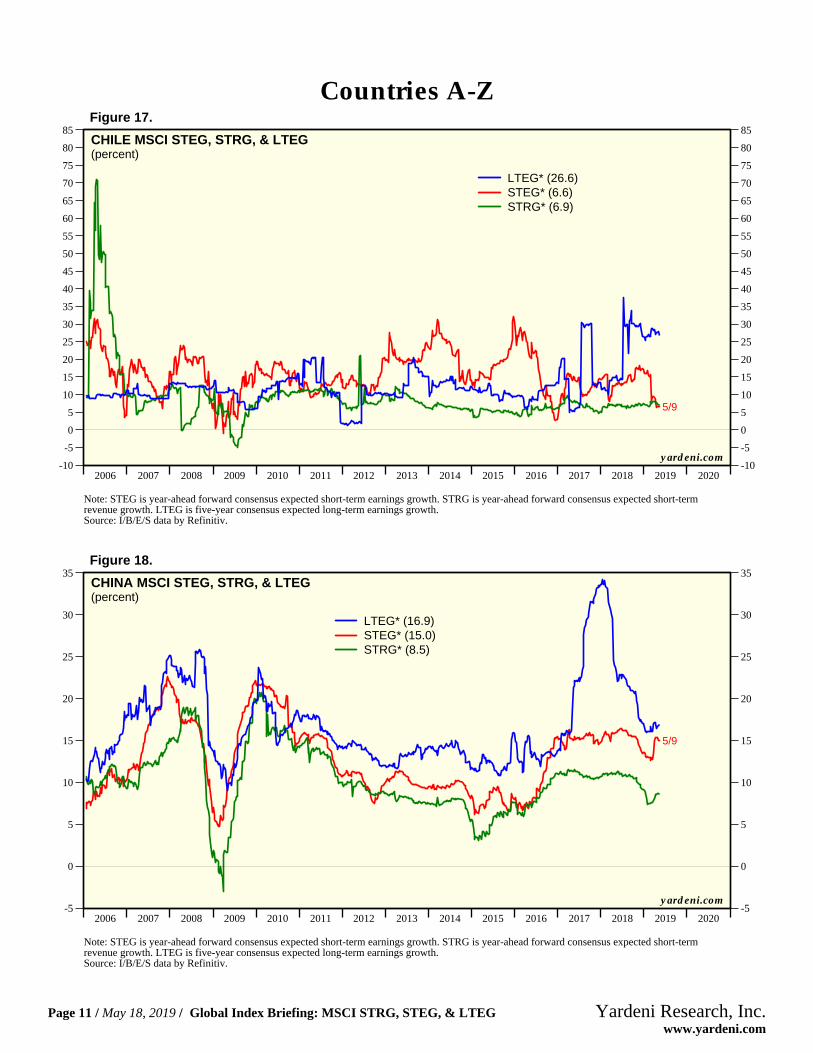
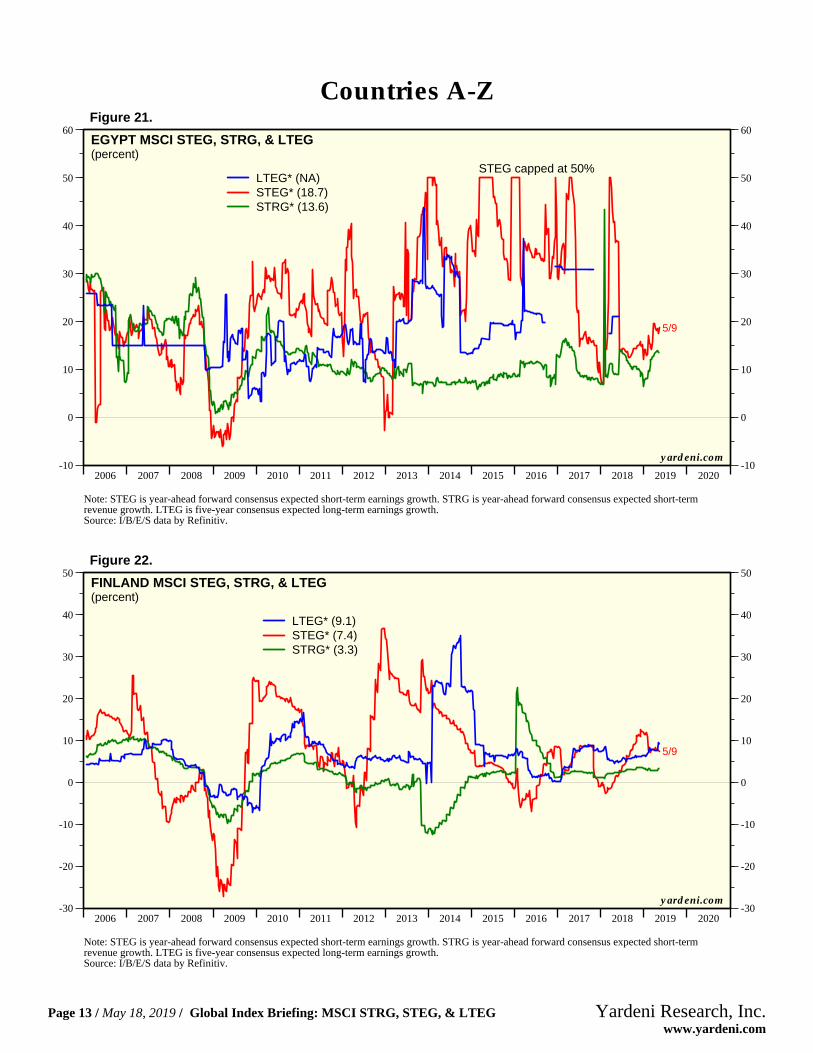
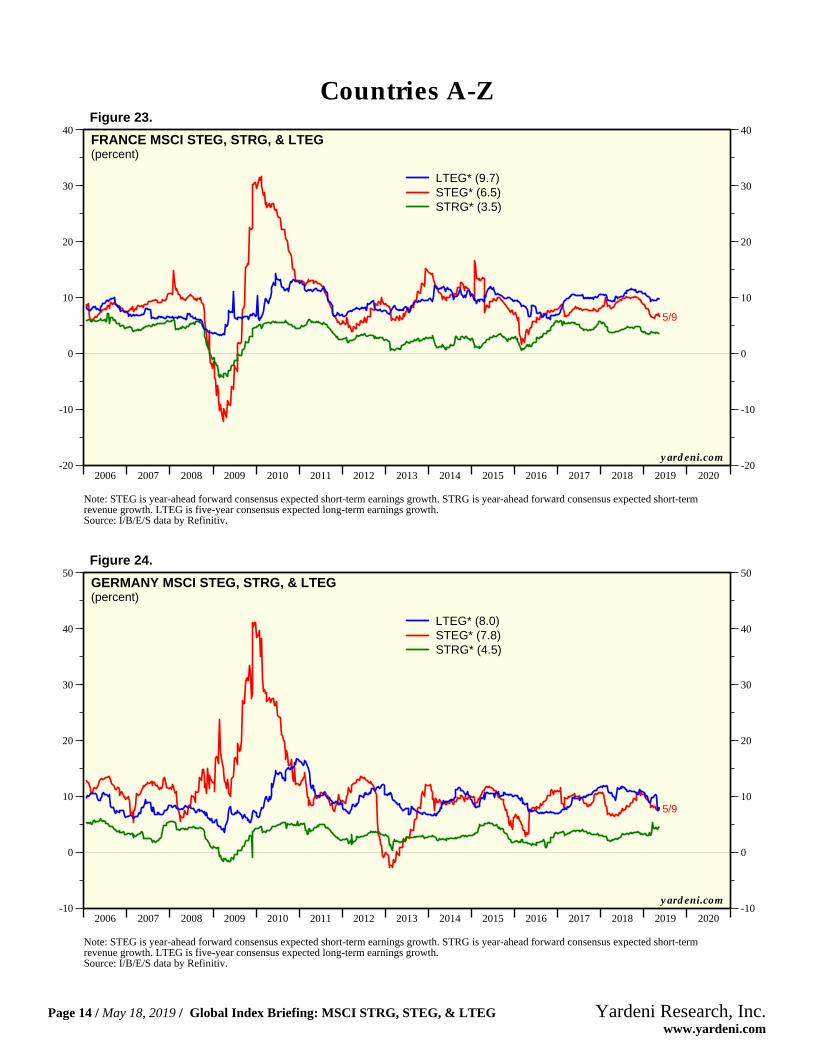
Note: STEG is year-ahead forward consensus expected short-term earnings growth. STRG is year-ahead forward consensus expected short-termrevenue growth. LTEG is five-year consensus expected long-term earnings growth.Source: I/B/E/S data by Refinitiv.
ALL COUNTRY WORLD MSCI STEG, STRG, & LTEG(percent)
LTEG* (12.5)STEG* (7.2)STRG* (4.6)
Figure 1.
2006 2007 2008 2009 2010 2011 2012 2013 2014 2015 2016 2017 2018 2019 2020-5
0
5
10
15
20
25
30
35
40
-5
0
5
10
15
20
25
30
35
40
5/9
yardeni.com
Note: STEG is year-ahead forward consensus expected short-term earnings growth. STRG is year-ahead forward consensus expected short-termrevenue growth. LTEG is five-year consensus expected long-term earnings growth.Source: I/B/E/S data by Refinitiv.
ALL COUNTRY WORLD EX-US MSCI STEG, STRG, and LTEG(percent)
LTEG* (9.3)STEG* (7.0)STRG* (4.0)
Figure 2.
All Country World
Page 3 / May 18, 2019 / Global Index Briefing: MSCI STRG, STEG, & LTEG www.yardeni.com
Yardeni Research, Inc.
2006 2007 2008 2009 2010 2011 2012 2013 2014 2015 2016 2017 2018 2019 2020-5
0
5
10
15
20
25
30
35
-5
0
5
10
15
20
25
30
35
5/9
yardeni.com
Note: STEG is year-ahead forward consensus expected short-term earnings growth. STRG is year-ahead forward consensus expected short-termrevenue growth. LTEG is five-year consensus expected long-term earnings growth.Source: I/B/E/S data by Refinitiv.
S&P 500 STRG, STEG, & LTEG(percent)
LTEG (14.8)STEG (7.2)STRG (5.5)
Figure 3.
2006 2007 2008 2009 2010 2011 2012 2013 2014 2015 2016 2017 2018 2019 2020-10
0
10
20
30
40
-10
0
10
20
30
40
5/9
yardeni.com
Note: STEG is year-ahead forward consensus expected short-term earnings growth. STRG is year-ahead forward consensus expected short-termrevenue growth. LTEG is five-year consensus expected long-term earnings growth.Source: I/B/E/S data by Refinitiv.
EAFE MSCI STEG, STRG, & LTEG(percent)
LTEG* (7.8)STEG* (6.1)STRG* (2.7)
Figure 4.
US & EAFE
Page 4 / May 18, 2019 / Global Index Briefing: MSCI STRG, STEG, & LTEG www.yardeni.com
Yardeni Research, Inc.
2006 2007 2008 2009 2010 2011 2012 2013 2014 2015 2016 2017 2018 2019 2020-10
-5
0
5
10
15
20
25
30
35
-10
-5
0
5
10
15
20
25
30
35
5/9
yardeni.com
Note: STEG is year-ahead forward consensus expected short-term earnings growth. STRG is year-ahead forward consensus expected short-termrevenue growth. LTEG is five-year consensus expected long-term earnings growth.Source: I/B/E/S data by Refinitiv.
EUROPE MSCI STEG, STRG, & LTEG(percent)
LTEG* (8.8)STEG* (6.0)STRG* (3.0)
Figure 5.
2006 2007 2008 2009 2010 2011 2012 2013 2014 2015 2016 2017 2018 2019 2020-5
0
5
10
15
20
25
30
35
-5
0
5
10
15
20
25
30
35
5/9
yardeni.com
Note: STEG is year-ahead forward consensus expected short-term earnings growth. STRG is year-ahead forward consensus expected short-termrevenue growth. LTEG is five-year consensus expected long-term earnings growth.Source: I/B/E/S data by Refinitiv.
EUROPE EX-UNITED KINGDOM MSCI STEG, STRG, & LTEG(percent)
LTEG* (9.4)STEG* (7.4)STRG* (3.6)
Figure 6.
Europe
Page 5 / May 18, 2019 / Global Index Briefing: MSCI STRG, STEG, & LTEG www.yardeni.com
Yardeni Research, Inc.

2006 2007 2008 2009 2010 2011 2012 2013 2014 2015 2016 2017 2018 2019 2020-15
-10
-5
0
5
10
15
20
25
30
35
40
-15
-10
-5
0
5
10
15
20
25
30
35
40
5/9
yardeni.com
Note: STEG is year-ahead forward consensus expected short-term earnings growth. STRG is year-ahead forward consensus expected short-termrevenue growth. LTEG is five-year consensus expected long-term earnings growth.Source: I/B/E/S data by Refinitiv.
EMERGING MARKETS MSCI STEG, STRG, & LTEG(percent)
LTEG* (14.1)STEG* (8.6)STRG* (6.5)
Figure 7.
2006 2007 2008 2009 2010 2011 2012 2013 2014 2015 2016 2017 2018 2019 2020-40
-35
-30
-25
-20
-15
-10
-5
0
5
10
15
20
25
30
35
40
-40
-35
-30
-25
-20
-15
-10
-5
0
5
10
15
20
25
30
35
40
5/9
yardeni.com
Note: STEG is year-ahead forward consensus expected short-term earnings growth. STRG is year-ahead forward consensus expected short-termrevenue growth. LTEG is five-year consensus expected long-term earnings growth.Source: I/B/E/S data by Refinitiv.
EMERGING MARKETS ASIA MSCI STEG, STRG, and LTEG(percent)
LTEG* (13.7)STEG* (8.2)STRG* (6.7)
Figure 8.
Emerging Markets
Page 6 / May 18, 2019 / Global Index Briefing: MSCI STRG, STEG, & LTEG www.yardeni.com
Yardeni Research, Inc.
2006 2007 2008 2009 2010 2011 2012 2013 2014 2015 2016 2017 2018 2019 2020-10
0
10
20
30
40
50
60
70
-10
0
10
20
30
40
50
60
70
5/9
yardeni.com
Note: STEG is year-ahead forward consensus expected short-term earnings growth. STRG is year-ahead forward consensus expected short-termrevenue growth. LTEG is five-year consensus expected long-term earnings growth.Source: I/B/E/S data by Refinitiv.
EMERGING MARKETS LATIN AMERICA MSCI STEG, STRG, & LTEG(percent)
LTEG* (16.8)STEG* (15.8)STRG* (5.9)
Figure 9.
2006 2007 2008 2009 2010 2011 2012 2013 2014 2015 2016 2017 2018 2019 2020-30
-25
-20
-15
-10
-5
0
5
10
15
20
25
30
35
40
-30
-25
-20
-15
-10
-5
0
5
10
15
20
25
30
35
40
5/9
yardeni.com
Note: STEG is year-ahead forward consensus expected short-term earnings growth. STRG is year-ahead forward consensus expected short-termrevenue growth. LTEG is five-year consensus expected long-term earnings growth.Source: I/B/E/S data by Refinitiv.
EMERGING MARKETS EASTERN EUROPE MSCI STEG, STRG, & LTEG(percent)
LTEG* (12.4)STEG* (-0.2)STRG* (2.2)
Figure 10.
Emerging Markets
Page 7 / May 18, 2019 / Global Index Briefing: MSCI STRG, STEG, & LTEG www.yardeni.com
Yardeni Research, Inc.

2006 2007 2008 2009 2010 2011 2012 2013 2014 2015 2016 2017 2018 2019 2020-80
-60
-40
-20
0
20
40
60
80
100
120
-80
-60
-40
-20
0
20
40
60
80
100
120
5/9
yardeni.com
Note: STEG is year-ahead forward consensus expected short-term earnings growth. STRG is year-ahead forward consensus expected short-termrevenue growth. LTEG is five-year consensus expected long-term earnings growth.Source: I/B/E/S data by Refinitiv.
ARGENTINA MSCI STEG, STRG, & LTEG(percent)
LTEG* (-5.1)STEG* (-11.7)STRG* (-2.2)
STEG capped at -80% and 80%
Figure 11.
2006 2007 2008 2009 2010 2011 2012 2013 2014 2015 2016 2017 2018 2019 2020-10
-5
0
5
10
15
20
25
30
-10
-5
0
5
10
15
20
25
30
5/9
yardeni.com
Note: STEG is year-ahead forward consensus expected short-term earnings growth. STRG is year-ahead forward consensus expected short-termrevenue growth. LTEG is five-year consensus expected long-term earnings growth.Source: I/B/E/S data by Refinitiv.
AUSTRALIA MSCI STEG, STRG, & LTEG(percent)
LTEG* (5.3)STEG* (4.6)STRG* (2.1)
Figure 12.
Countries A-Z
Page 8 / May 18, 2019 / Global Index Briefing: MSCI STRG, STEG, & LTEG www.yardeni.com
Yardeni Research, Inc.
2006 2007 2008 2009 2010 2011 2012 2013 2014 2015 2016 2017 2018 2019 2020-20
-10
0
10
20
30
40
50
60
-20
-10
0
10
20
30
40
50
60
5/9
yardeni.com
Note: STEG is year-ahead forward consensus expected short-term earnings growth. STRG is year-ahead forward consensus expected short-termrevenue growth. LTEG is five-year consensus expected long-term earnings growth.Source: I/B/E/S data by Refinitiv.
AUSTRIA MSCI STEG, STRG, & LTEG(percent)
LTEG* (5.0)STEG* (3.4)STRG* (3.3)
STEG capped at 50%
Figure 13.
2006 2007 2008 2009 2010 2011 2012 2013 2014 2015 2016 2017 2018 2019 2020-10
0
10
20
30
40
50
60
-10
0
10
20
30
40
50
60
5/9
yardeni.com
Note: STEG is year-ahead forward consensus expected short-term earnings growth. STRG is year-ahead forward consensus expected short-termrevenue growth. LTEG is five-year consensus expected long-term earnings growth.Source: I/B/E/S data by Refinitiv.
BELGIUM MSCI STEG, STRG, & LTEG(percent)
LTEG* (12.9)STEG* (9.9)STRG* (0.1)
STEG capped at 50%
Figure 14.
Countries A-Z
Page 9 / May 18, 2019 / Global Index Briefing: MSCI STRG, STEG, & LTEG www.yardeni.com
Yardeni Research, Inc.
2006 2007 2008 2009 2010 2011 2012 2013 2014 2015 2016 2017 2018 2019 2020-15
0
15
30
45
60
75
90
105
-15
0
15
30
45
60
75
90
105
5/9
yardeni.com
Note: STEG is year-ahead forward consensus expected short-term earnings growth. STRG is year-ahead forward consensus expected short-termrevenue growth. LTEG is five-year consensus expected long-term earnings growth.Source: I/B/E/S data by Refinitiv.
BRAZIL MSCI STEG, STRG, & LTEG(percent)
LTEG* (18.2)STEG* (16.8)STRG* (5.6)
Figure 15.
2006 2007 2008 2009 2010 2011 2012 2013 2014 2015 2016 2017 2018 2019 2020-15
-10
-5
0
5
10
15
20
25
30
35
-15
-10
-5
0
5
10
15
20
25
30
35
5/9
yardeni.com
Note: STEG is year-ahead forward consensus expected short-term earnings growth. STRG is year-ahead forward consensus expected short-termrevenue growth. LTEG is five-year consensus expected long-term earnings growth.Source: I/B/E/S data by Refinitiv.
CANADA MSCI STEG, STRG, & LTEG(percent)
LTEG* (8.0)STEG* (8.8)STRG* (4.4)
Figure 16.
Countries A-Z
Page 10 / May 18, 2019 / Global Index Briefing: MSCI STRG, STEG, & LTEG www.yardeni.com
Yardeni Research, Inc.
2006 2007 2008 2009 2010 2011 2012 2013 2014 2015 2016 2017 2018 2019 2020-10
-5
0
5
10
15
20
25
30
35
40
45
50
55
60
65
70
75
80
85
-10
-5
0
5
10
15
20
25
30
35
40
45
50
55
60
65
70
75
80
85
5/9
yardeni.com
Note: STEG is year-ahead forward consensus expected short-term earnings growth. STRG is year-ahead forward consensus expected short-termrevenue growth. LTEG is five-year consensus expected long-term earnings growth.Source: I/B/E/S data by Refinitiv.
CHILE MSCI STEG, STRG, & LTEG(percent)
LTEG* (26.6)STEG* (6.6)STRG* (6.9)
Figure 17.
2006 2007 2008 2009 2010 2011 2012 2013 2014 2015 2016 2017 2018 2019 2020-5
0
5
10
15
20
25
30
35
-5
0
5
10
15
20
25
30
35
5/9
yardeni.com
Note: STEG is year-ahead forward consensus expected short-term earnings growth. STRG is year-ahead forward consensus expected short-termrevenue growth. LTEG is five-year consensus expected long-term earnings growth.Source: I/B/E/S data by Refinitiv.
CHINA MSCI STEG, STRG, & LTEG(percent)
LTEG* (16.9)STEG* (15.0)STRG* (8.5)
Figure 18.
Countries A-Z
Page 11 / May 18, 2019 / Global Index Briefing: MSCI STRG, STEG, & LTEG www.yardeni.com
Yardeni Research, Inc.

2006 2007 2008 2009 2010 2011 2012 2013 2014 2015 2016 2017 2018 2019 2020-20
-15
-10
-5
0
5
10
15
20
25
30
35
40
-20
-15
-10
-5
0
5
10
15
20
25
30
35
40
5/9
yardeni.com
Note: STEG is year-ahead forward consensus expected short-term earnings growth. STRG is year-ahead forward consensus expected short-termrevenue growth. LTEG is five-year consensus expected long-term earnings growth.Source: I/B/E/S data by Refinitiv.
CZECH REPUBLIC MSCI STEG, STRG, & LTEG(percent)
LTEG* (9.1)STEG* (9.9)STRG* (9.7)
Figure 19.
2006 2007 2008 2009 2010 2011 2012 2013 2014 2015 2016 2017 2018 2019 2020-15
-10
-5
0
5
10
15
20
25
30
35
40
45
50
55
60
-15
-10
-5
0
5
10
15
20
25
30
35
40
45
50
55
60
5/9
yardeni.com
Note: STEG is year-ahead forward consensus expected short-term earnings growth. STRG is year-ahead forward consensus expected short-termrevenue growth. LTEG is five-year consensus expected long-term earnings growth.Source: I/B/E/S data by Refinitiv.
DENMARK MSCI STEG, STRG, & LTEG(percent)
LTEG* (10.3)STEG* (7.1)STRG* (5.7)
Figure 20.
Countries A-Z
Page 12 / May 18, 2019 / Global Index Briefing: MSCI STRG, STEG, & LTEG www.yardeni.com
Yardeni Research, Inc.
2006 2007 2008 2009 2010 2011 2012 2013 2014 2015 2016 2017 2018 2019 2020-10
0
10
20
30
40
50
60
-10
0
10
20
30
40
50
60
5/9
yardeni.com
Note: STEG is year-ahead forward consensus expected short-term earnings growth. STRG is year-ahead forward consensus expected short-termrevenue growth. LTEG is five-year consensus expected long-term earnings growth.Source: I/B/E/S data by Refinitiv.
EGYPT MSCI STEG, STRG, & LTEG(percent)
LTEG* (NA)STEG* (18.7)STRG* (13.6)
STEG capped at 50%
Figure 21.
2006 2007 2008 2009 2010 2011 2012 2013 2014 2015 2016 2017 2018 2019 2020-30
-20
-10
0
10
20
30
40
50
-30
-20
-10
0
10
20
30
40
50
5/9
yardeni.com
Note: STEG is year-ahead forward consensus expected short-term earnings growth. STRG is year-ahead forward consensus expected short-termrevenue growth. LTEG is five-year consensus expected long-term earnings growth.Source: I/B/E/S data by Refinitiv.
FINLAND MSCI STEG, STRG, & LTEG(percent)
LTEG* (9.1)STEG* (7.4)STRG* (3.3)
Figure 22.
Countries A-Z
Page 13 / May 18, 2019 / Global Index Briefing: MSCI STRG, STEG, & LTEG www.yardeni.com
Yardeni Research, Inc.
2006 2007 2008 2009 2010 2011 2012 2013 2014 2015 2016 2017 2018 2019 2020-20
-10
0
10
20
30
40
-20
-10
0
10
20
30
40
5/9
yardeni.com
Note: STEG is year-ahead forward consensus expected short-term earnings growth. STRG is year-ahead forward consensus expected short-termrevenue growth. LTEG is five-year consensus expected long-term earnings growth.Source: I/B/E/S data by Refinitiv.
FRANCE MSCI STEG, STRG, & LTEG(percent)
LTEG* (9.7)STEG* (6.5)STRG* (3.5)
Figure 23.
2006 2007 2008 2009 2010 2011 2012 2013 2014 2015 2016 2017 2018 2019 2020-10
0
10
20
30
40
50
-10
0
10
20
30
40
50
5/9
yardeni.com
Note: STEG is year-ahead forward consensus expected short-term earnings growth. STRG is year-ahead forward consensus expected short-termrevenue growth. LTEG is five-year consensus expected long-term earnings growth.Source: I/B/E/S data by Refinitiv.
GERMANY MSCI STEG, STRG, & LTEG(percent)
LTEG* (8.0)STEG* (7.8)STRG* (4.5)
Figure 24.
Countries A-Z
Page 14 / May 18, 2019 / Global Index Briefing: MSCI STRG, STEG, & LTEG www.yardeni.com
Yardeni Research, Inc.
2006 2007 2008 2009 2010 2011 2012 2013 2014 2015 2016 2017 2018 2019 2020-80
-60
-40
-20
0
20
40
60
-80
-60
-40
-20
0
20
40
60
5/9
yardeni.com
Note: STEG is year-ahead forward consensus expected short-term earnings growth. STRG is year-ahead forward consensus expected short-termrevenue growth. LTEG is five-year consensus expected long-term earnings growth.Source: I/B/E/S data by Refinitiv.
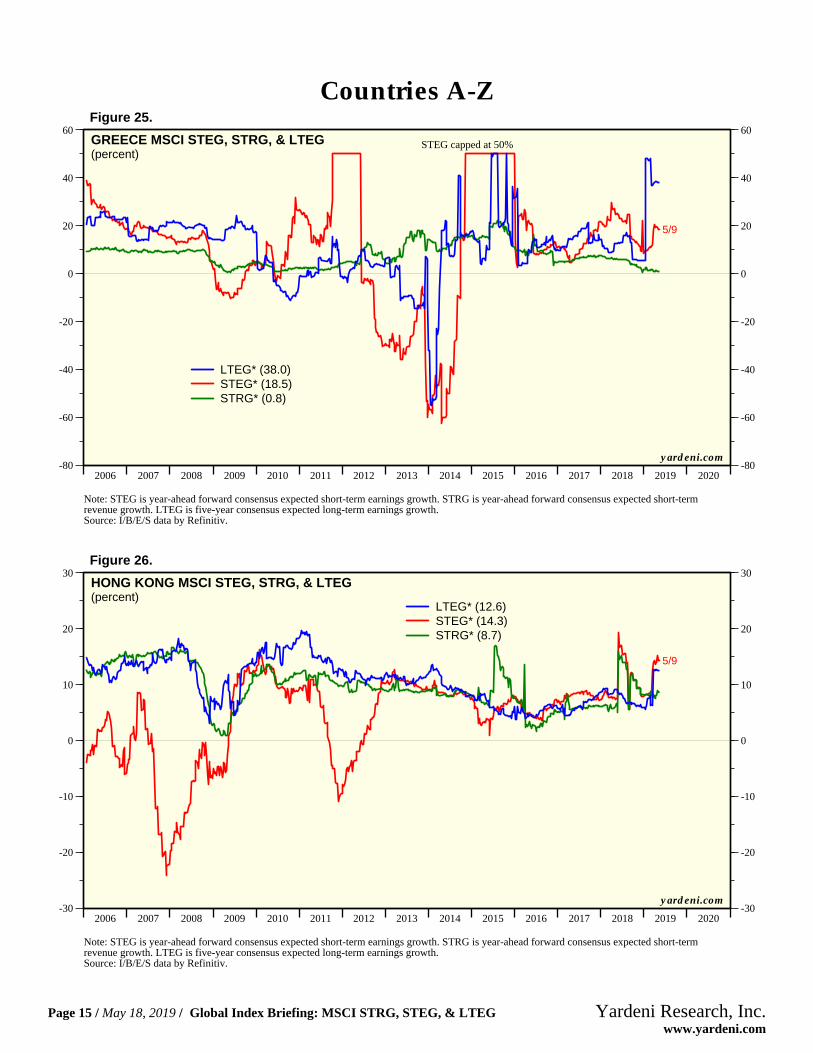
GREECE MSCI STEG, STRG, & LTEG(percent)
LTEG* (38.0)STEG* (18.5)STRG* (0.8)
STEG capped at 50%
Figure 25.
2006 2007 2008 2009 2010 2011 2012 2013 2014 2015 2016 2017 2018 2019 2020-30
-20
-10
0
10
20
30
-30
-20
-10
0
10
20
30
5/9
yardeni.com
Note: STEG is year-ahead forward consensus expected short-term earnings growth. STRG is year-ahead forward consensus expected short-termrevenue growth. LTEG is five-year consensus expected long-term earnings growth.Source: I/B/E/S data by Refinitiv.
HONG KONG MSCI STEG, STRG, & LTEG(percent)
LTEG* (12.6)STEG* (14.3)STRG* (8.7)
Figure 26.
Countries A-Z
Page 15 / May 18, 2019 / Global Index Briefing: MSCI STRG, STEG, & LTEG www.yardeni.com
Yardeni Research, Inc.
2006 2007 2008 2009 2010 2011 2012 2013 2014 2015 2016 2017 2018 2019 2020-40
-20
0
20
40
60
80
-40
-20
0
20
40
60
80
5/9
yardeni.com
Note: STEG is year-ahead forward consensus expected short-term earnings growth. STRG is year-ahead forward consensus expected short-termrevenue growth. LTEG is five-year consensus expected long-term earnings growth.Source: I/B/E/S data by Refinitiv.
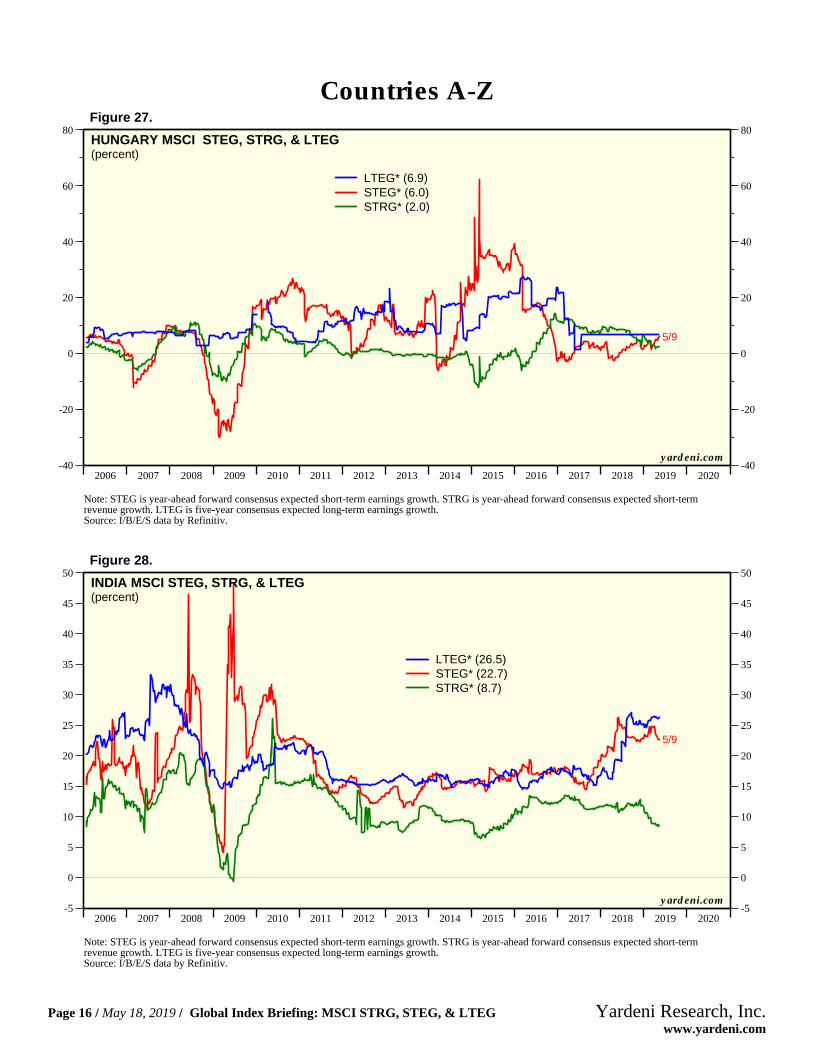
HUNGARY MSCI STEG, STRG, & LTEG(percent)
LTEG* (6.9)STEG* (6.0)STRG* (2.0)
Figure 27.
2006 2007 2008 2009 2010 2011 2012 2013 2014 2015 2016 2017 2018 2019 2020-5
0
5
10
15
20
25
30
35
40
45
50
-5
0
5
10
15
20
25
30
35
40
45
50
5/9
yardeni.com
Note: STEG is year-ahead forward consensus expected short-term earnings growth. STRG is year-ahead forward consensus expected short-termrevenue growth. LTEG is five-year consensus expected long-term earnings growth.Source: I/B/E/S data by Refinitiv.
INDIA MSCI STEG, STRG, & LTEG(percent)
LTEG* (26.5)STEG* (22.7)STRG* (8.7)
Figure 28.
Countries A-Z
Page 16 / May 18, 2019 / Global Index Briefing: MSCI STRG, STEG, & LTEG www.yardeni.com
Yardeni Research, Inc.
2006 2007 2008 2009 2010 2011 2012 2013 2014 2015 2016 2017 2018 2019 2020-10
-5
0
5
10
15
20
25
30
35
40
45
-10
-5
0
5
10
15
20
25
30
35
40
45
5/9
yardeni.com
Note: STEG is year-ahead forward consensus expected short-term earnings growth. STRG is year-ahead forward consensus expected short-termrevenue growth. LTEG is five-year consensus expected long-term earnings growth.Source: I/B/E/S data by Refinitiv.
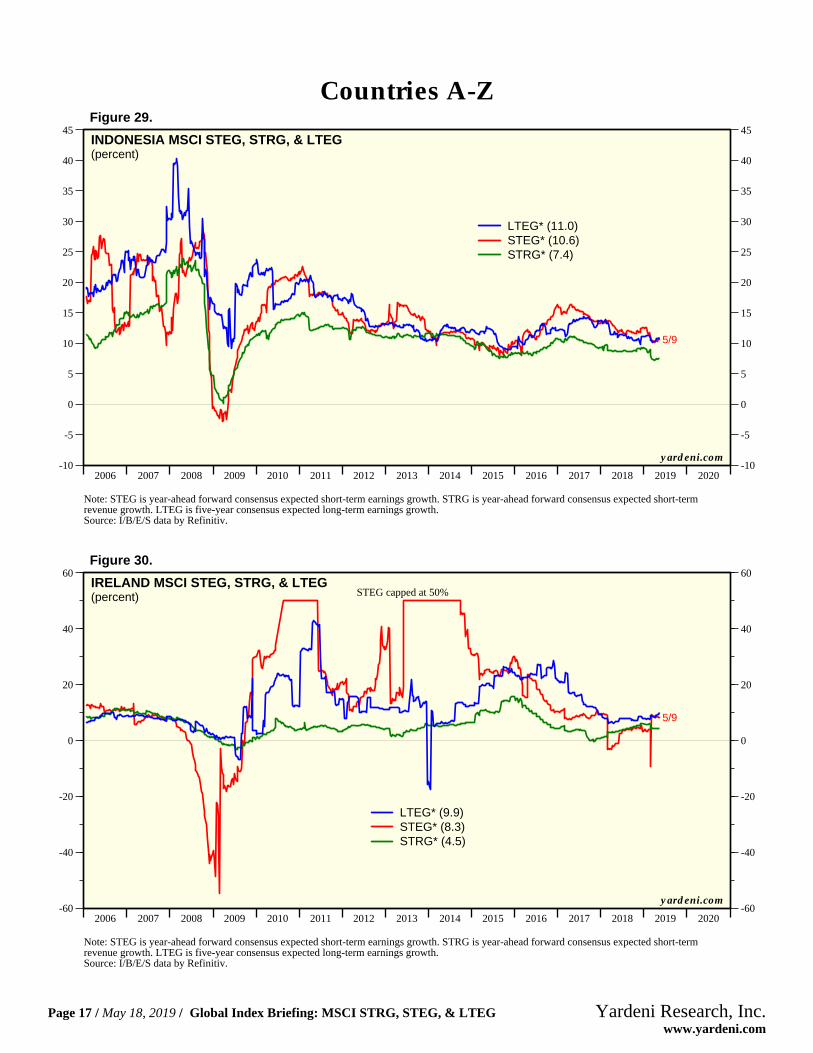
INDONESIA MSCI STEG, STRG, & LTEG(percent)
LTEG* (11.0)STEG* (10.6)STRG* (7.4)
Figure 29.
2006 2007 2008 2009 2010 2011 2012 2013 2014 2015 2016 2017 2018 2019 2020-60
-40
-20
0
20
40
60
-60
-40
-20
0
20
40
60
5/9
yardeni.com
Note: STEG is year-ahead forward consensus expected short-term earnings growth. STRG is year-ahead forward consensus expected short-termrevenue growth. LTEG is five-year consensus expected long-term earnings growth.Source: I/B/E/S data by Refinitiv.
IRELAND MSCI STEG, STRG, & LTEG(percent)
LTEG* (9.9)STEG* (8.3)STRG* (4.5)
STEG capped at 50%
Figure 30.
Countries A-Z
Page 17 / May 18, 2019 / Global Index Briefing: MSCI STRG, STEG, & LTEG www.yardeni.com
Yardeni Research, Inc.
2006 2007 2008 2009 2010 2011 2012 2013 2014 2015 2016 2017 2018 2019 2020-20
-10
0
10
20
30
40
-20
-10
0
10
20
30
40
5/9
yardeni.com
Note: STEG is year-ahead forward consensus expected short-term earnings growth. STRG is year-ahead forward consensus expected short-termrevenue growth. LTEG is five-year consensus expected long-term earnings growth.Source: I/B/E/S data by Refinitiv.
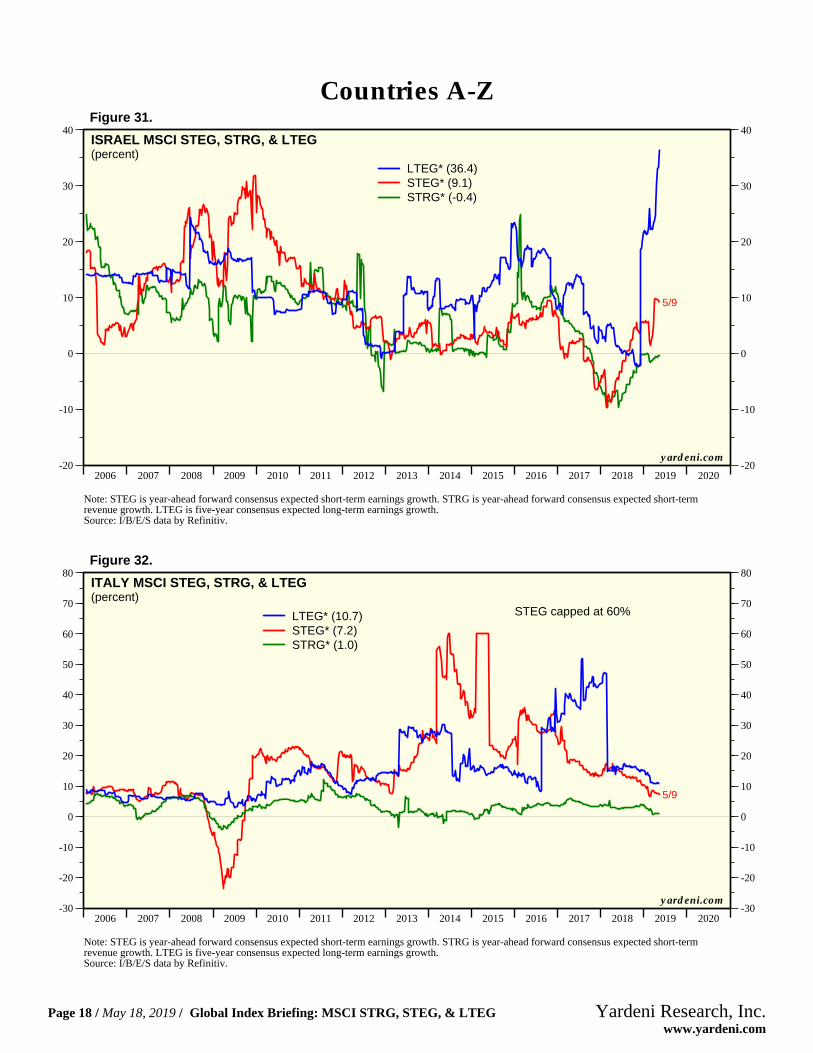
ISRAEL MSCI STEG, STRG, & LTEG(percent)
LTEG* (36.4)STEG* (9.1)STRG* (-0.4)
Figure 31.
2006 2007 2008 2009 2010 2011 2012 2013 2014 2015 2016 2017 2018 2019 2020-30
-20
-10
0
10
20
30
40
50
60
70
80
-30
-20
-10
0
10
20
30
40
50
60
70
80
5/9
yardeni.com
Note: STEG is year-ahead forward consensus expected short-term earnings growth. STRG is year-ahead forward consensus expected short-termrevenue growth. LTEG is five-year consensus expected long-term earnings growth.Source: I/B/E/S data by Refinitiv.
ITALY MSCI STEG, STRG, & LTEG(percent)
LTEG* (10.7)STEG* (7.2)STRG* (1.0)
STEG capped at 60%
Figure 32.
Countries A-Z
Page 18 / May 18, 2019 / Global Index Briefing: MSCI STRG, STEG, & LTEG www.yardeni.com
Yardeni Research, Inc.
2006 2007 2008 2009 2010 2011 2012 2013 2014 2015 2016 2017 2018 2019 2020-20
-10
0
10
20
30
40
50
60
70
-20
-10
0
10
20
30
40
50
60
70
5/9
yardeni.com
Note: STEG is year-ahead forward consensus expected short-term earnings growth. STRG is year-ahead forward consensus expected short-termrevenue growth. LTEG is five-year consensus expected long-term earnings growth.Source: I/B/E/S data by Refinitiv.
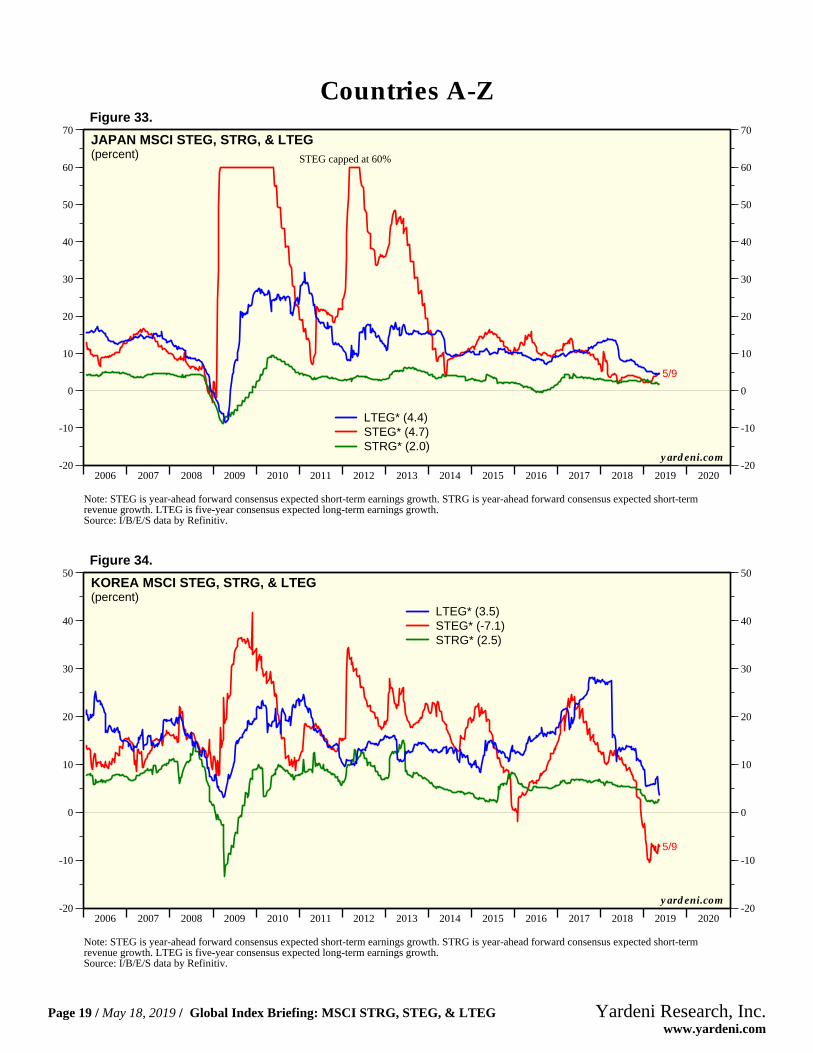
JAPAN MSCI STEG, STRG, & LTEG(percent)
LTEG* (4.4)STEG* (4.7)STRG* (2.0)
STEG capped at 60%
Figure 33.
2006 2007 2008 2009 2010 2011 2012 2013 2014 2015 2016 2017 2018 2019 2020-20
-10
0
10
20
30
40
50
-20
-10
0
10
20
30
40
50
5/9
yardeni.com
Note: STEG is year-ahead forward consensus expected short-term earnings growth. STRG is year-ahead forward consensus expected short-termrevenue growth. LTEG is five-year consensus expected long-term earnings growth.Source: I/B/E/S data by Refinitiv.
KOREA MSCI STEG, STRG, & LTEG(percent)
LTEG* (3.5)STEG* (-7.1)STRG* (2.5)
Figure 34.
Countries A-Z
Page 19 / May 18, 2019 / Global Index Briefing: MSCI STRG, STEG, & LTEG www.yardeni.com
Yardeni Research, Inc.

2006 2007 2008 2009 2010 2011 2012 2013 2014 2015 2016 2017 2018 2019 2020-10
-5
0
5
10
15
20
25
-10
-5
0
5
10
15
20
25
5/9
yardeni.com
Note: STEG is year-ahead forward consensus expected short-term earnings growth. STRG is year-ahead forward consensus expected short-termrevenue growth. LTEG is five-year consensus expected long-term earnings growth.Source: I/B/E/S data by Refinitiv.
MALAYSIA MSCI STEG, STRG, & LTEG(percent)
LTEG* (7.7)STEG* (3.3)STRG* (5.0)
Figure 35.
2006 2007 2008 2009 2010 2011 2012 2013 2014 2015 2016 2017 2018 2019 2020-15
-10
-5
0
5
10
15
20
25
30
35
40
45
-15
-10
-5
0
5
10
15
20
25
30
35
40
45
5/9
yardeni.com
Note: STEG is year-ahead forward consensus expected short-term earnings growth. STRG is year-ahead forward consensus expected short-termrevenue growth. LTEG is five-year consensus expected long-term earnings growth.Source: I/B/E/S data by Refinitiv.
MEXICO MSCI STEG, STRG, & LTEG(percent)
LTEG* (13.0)STEG* (15.1)STRG* (5.9)
Figure 36.
Countries A-Z
Page 20 / May 18, 2019 / Global Index Briefing: MSCI STRG, STEG, & LTEG www.yardeni.com
Yardeni Research, Inc.

2006 2007 2008 2009 2010 2011 2012 2013 2014 2015 2016 2017 2018 2019 2020-10
0
10
20
30
40
50
60
-10
0
10
20
30
40
50
60
5/9
yardeni.com
Note: STEG is year-ahead forward consensus expected short-term earnings growth. STRG is year-ahead forward consensus expected short-termrevenue growth. LTEG is five-year consensus expected long-term earnings growth.Source: I/B/E/S data by Refinitiv.
NETHERLANDS MSCI STEG, STRG, & LTEG(percent)
LTEG* (10.9)STEG* (6.4)STRG* (4.0)
STEG capped at 50%
Figure 37.
2006 2007 2008 2009 2010 2011 2012 2013 2014 2015 2016 2017 2018 2019 2020-20
-10
0
10
20
30
40
50
-20
-10
0
10
20
30
40
50
5/9
yardeni.com
Note: STEG is year-ahead forward consensus expected short-term earnings growth. STRG is year-ahead forward consensus expected short-termrevenue growth. LTEG is five-year consensus expected long-term earnings growth.Source: I/B/E/S data by Refinitiv.
NEW ZEALAND MSCI STEG, STRG, & LTEG(percent)
LTEG* (18.1)STEG* (10.0)STRG* (-4.0)
STEG capped at 40%
Figure 38.
Countries A-Z
Page 21 / May 18, 2019 / Global Index Briefing: MSCI STRG, STEG, & LTEG www.yardeni.com
Yardeni Research, Inc.

2006 2007 2008 2009 2010 2011 2012 2013 2014 2015 2016 2017 2018 2019 2020-30
-20
-10
0
10
20
30
40
-30
-20
-10
0
10
20
30
40
5/9
yardeni.com
Note: STEG is year-ahead forward consensus expected short-term earnings growth. STRG is year-ahead forward consensus expected short-termrevenue growth. LTEG is five-year consensus expected long-term earnings growth.Source: I/B/E/S data by Refinitiv.
NORWAY MSCI STEG, STRG, & LTEG(percent)
LTEG* (11.4)STEG* (8.4)STRG* (2.5)
Figure 39.
2006 2007 2008 2009 2010 2011 2012 2013 2014 2015 2016 2017 2018 2019 2020-10
-5
0
5
10
15
20
25
30
35
40
-10
-5
0
5
10
15
20
25
30
35
40
5/9
yardeni.com
Note: STEG is year-ahead forward consensus expected short-term earnings growth. STRG is year-ahead forward consensus expected short-termrevenue growth. LTEG is five-year consensus expected long-term earnings growth.Source: I/B/E/S data by Refinitiv.
PAKISTAN MSCI STEG, STRG, & LTEG(percent)
LTEG* (6.4)STEG* (25.6)STRG* (15.1)
Figure 40.
Countries A-Z
Page 22 / May 18, 2019 / Global Index Briefing: MSCI STRG, STEG, & LTEG www.yardeni.com
Yardeni Research, Inc.

2006 2007 2008 2009 2010 2011 2012 2013 2014 2015 2016 2017 2018 2019 2020-40
-20
0
20
40
60
80
100
-40
-20
0
20
40
60
80
100
5/9
yardeni.com
Note: STEG is year-ahead forward consensus expected short-term earnings growth. STRG is year-ahead forward consensus expected short-termrevenue growth. LTEG is five-year consensus expected long-term earnings growth.Source: I/B/E/S data by Refinitiv.
PERU MSCI STEG, STRG, & LTEG(percent)
LTEG* (13.4)STEG* (17.9)STRG* (8.7)
STEG capped at 80%
Figure 41.
2006 2007 2008 2009 2010 2011 2012 2013 2014 2015 2016 2017 2018 2019 2020-5
0
5
10
15
20
25
30
-5
0
5
10
15
20
25
30
5/9
yardeni.com
Note: STEG is year-ahead forward consensus expected short-term earnings growth. STRG is year-ahead forward consensus expected short-termrevenue growth. LTEG is five-year consensus expected long-term earnings growth.Source: I/B/E/S data by Refinitiv.
PHILIPPINES MSCI STEG, STRG, & LTEG(percent)
LTEG* (12.6)STEG* (12.8)STRG* (9.2)
Figure 42.
Countries A-Z
Page 23 / May 18, 2019 / Global Index Briefing: MSCI STRG, STEG, & LTEG www.yardeni.com
Yardeni Research, Inc.
2006 2007 2008 2009 2010 2011 2012 2013 2014 2015 2016 2017 2018 2019 2020-20
-15
-10
-5
0
5
10
15
20
25
30
35
-20
-15
-10
-5
0
5
10
15
20
25
30
35
5/9
yardeni.com
Note: STEG is year-ahead forward consensus expected short-term earnings growth. STRG is year-ahead forward consensus expected short-termrevenue growth. LTEG is five-year consensus expected long-term earnings growth.Source: I/B/E/S data by Refinitiv.
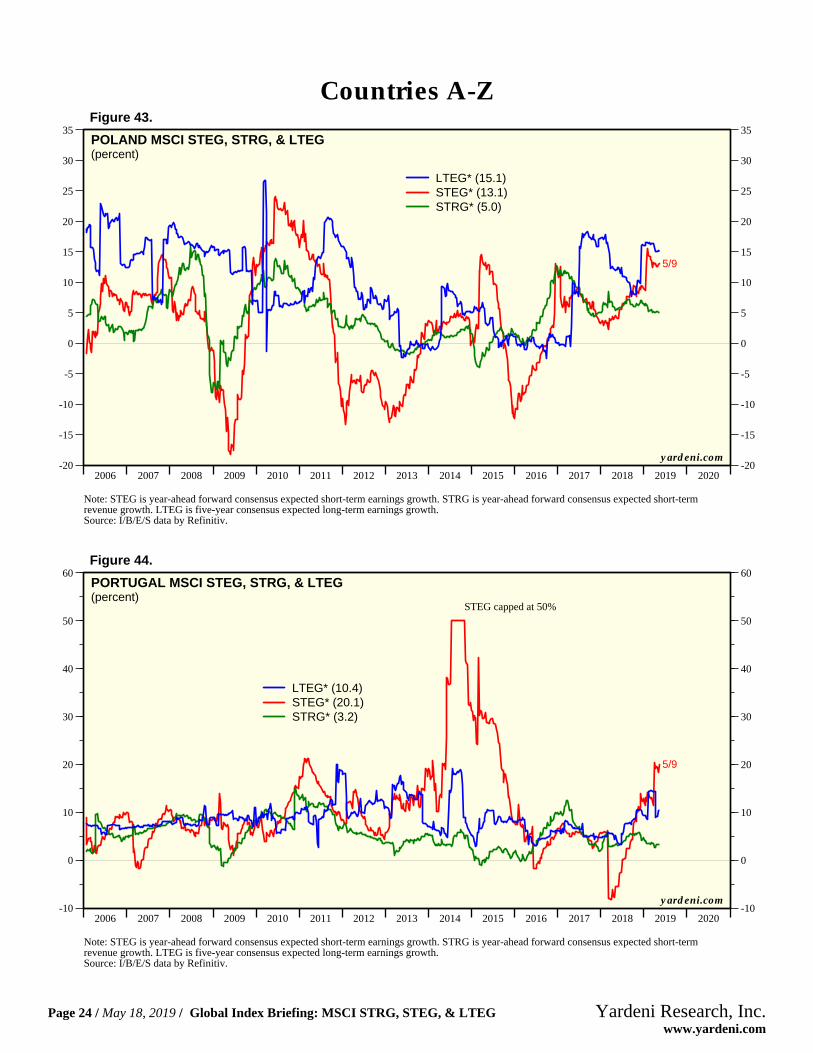
POLAND MSCI STEG, STRG, & LTEG(percent)
LTEG* (15.1)STEG* (13.1)STRG* (5.0)
Figure 43.
2006 2007 2008 2009 2010 2011 2012 2013 2014 2015 2016 2017 2018 2019 2020-10
0
10
20
30
40
50
60
-10
0
10
20
30
40
50
60
5/9
yardeni.com
Note: STEG is year-ahead forward consensus expected short-term earnings growth. STRG is year-ahead forward consensus expected short-termrevenue growth. LTEG is five-year consensus expected long-term earnings growth.Source: I/B/E/S data by Refinitiv.
PORTUGAL MSCI STEG, STRG, & LTEG(percent)
LTEG* (10.4)STEG* (20.1)STRG* (3.2)
STEG capped at 50%
Figure 44.
Countries A-Z
Page 24 / May 18, 2019 / Global Index Briefing: MSCI STRG, STEG, & LTEG www.yardeni.com
Yardeni Research, Inc.

2006 2007 2008 2009 2010 2011 2012 2013 2014 2015 2016 2017 2018 2019 2020-40
-30
-20
-10
0
10
20
30
40
50
-40
-30
-20
-10
0
10
20
30
40
50
5/9
yardeni.com
Note: STEG is year-ahead forward consensus expected short-term earnings growth. STRG is year-ahead forward consensus expected short-termrevenue growth. LTEG is five-year consensus expected long-term earnings growth.Source: I/B/E/S data by Refinitiv.
RUSSIA MSCI STEG, STRG, & LTEG(percent)
LTEG* (11.1)STEG* (-2.8)STRG* (1.4)
Figure 45.
2006 2007 2008 2009 2010 2011 2012 2013 2014 2015 2016 2017 2018 2019 2020-20
-15
-10
-5
0
5
10
15
20
25
-20
-15
-10
-5
0
5
10
15
20
25
5/9
yardeni.com
Note: STEG is year-ahead forward consensus expected short-term earnings growth. STRG is year-ahead forward consensus expected short-termrevenue growth. LTEG is five-year consensus expected long-term earnings growth.Source: I/B/E/S data by Refinitiv.
SINGAPORE (FREE) MSCI STEG, STRG, & LTEG(percent)
LTEG* (5.9)STEG* (6.8)STRG* (4.9)
Figure 46.
Countries A-Z
Page 25 / May 18, 2019 / Global Index Briefing: MSCI STRG, STEG, & LTEG www.yardeni.com
Yardeni Research, Inc.
2006 2007 2008 2009 2010 2011 2012 2013 2014 2015 2016 2017 2018 2019 20200
5
10
15
20
25
30
35
40
45
50
0
5
10
15
20
25
30
35
40
45
50
5/9
yardeni.com
Note: STEG is year-ahead forward consensus expected short-term earnings growth. STRG is year-ahead forward consensus expected short-termrevenue growth. LTEG is five-year consensus expected long-term earnings growth.Source: I/B/E/S data by Refinitiv.
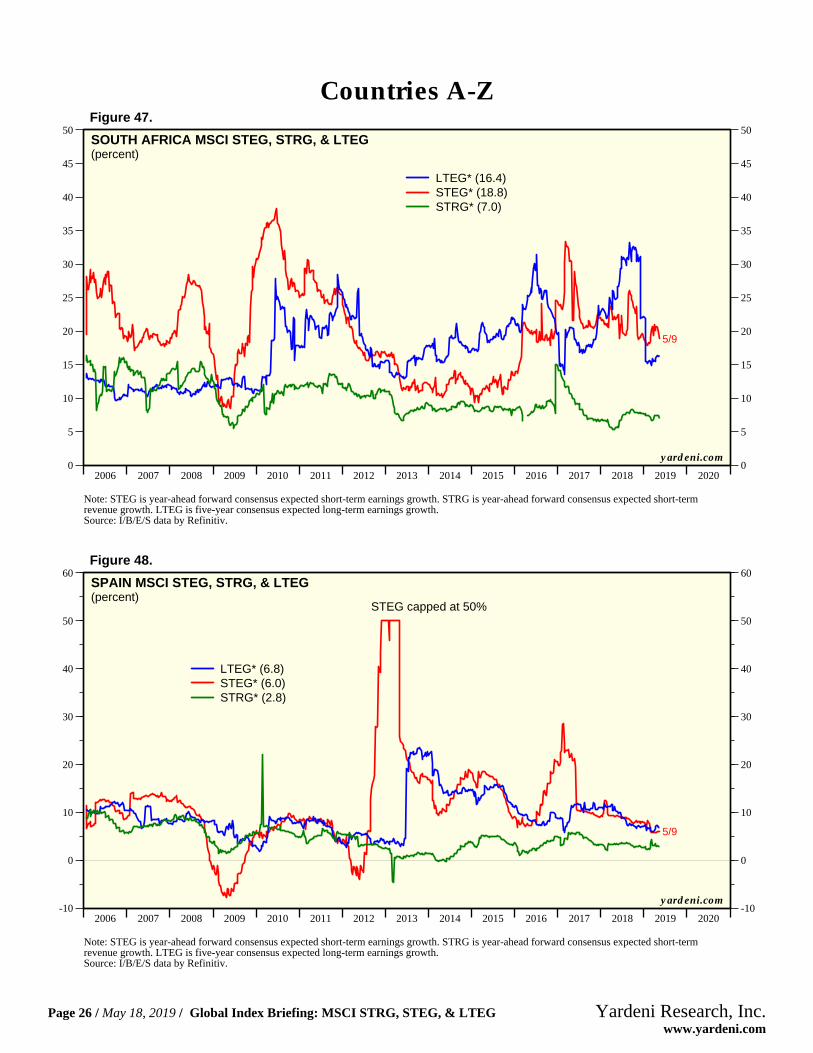
SOUTH AFRICA MSCI STEG, STRG, & LTEG(percent)
LTEG* (16.4)STEG* (18.8)STRG* (7.0)
Figure 47.
2006 2007 2008 2009 2010 2011 2012 2013 2014 2015 2016 2017 2018 2019 2020-10
0
10
20
30
40
50
60
-10
0
10
20
30
40
50
60
5/9
yardeni.com
Note: STEG is year-ahead forward consensus expected short-term earnings growth. STRG is year-ahead forward consensus expected short-termrevenue growth. LTEG is five-year consensus expected long-term earnings growth.Source: I/B/E/S data by Refinitiv.
SPAIN MSCI STEG, STRG, & LTEG(percent)
LTEG* (6.8)STEG* (6.0)STRG* (2.8)
STEG capped at 50%
Figure 48.
Countries A-Z
Page 26 / May 18, 2019 / Global Index Briefing: MSCI STRG, STEG, & LTEG www.yardeni.com
Yardeni Research, Inc.
2006 2007 2008 2009 2010 2011 2012 2013 2014 2015 2016 2017 2018 2019 2020-30
-20
-10
0
10
20
30
40
50
-30
-20
-10
0
10
20
30
40
50
5/9
yardeni.com
Note: STEG is year-ahead forward consensus expected short-term earnings growth. STRG is year-ahead forward consensus expected short-termrevenue growth. LTEG is five-year consensus expected long-term earnings growth.Source: I/B/E/S data by Refinitiv.
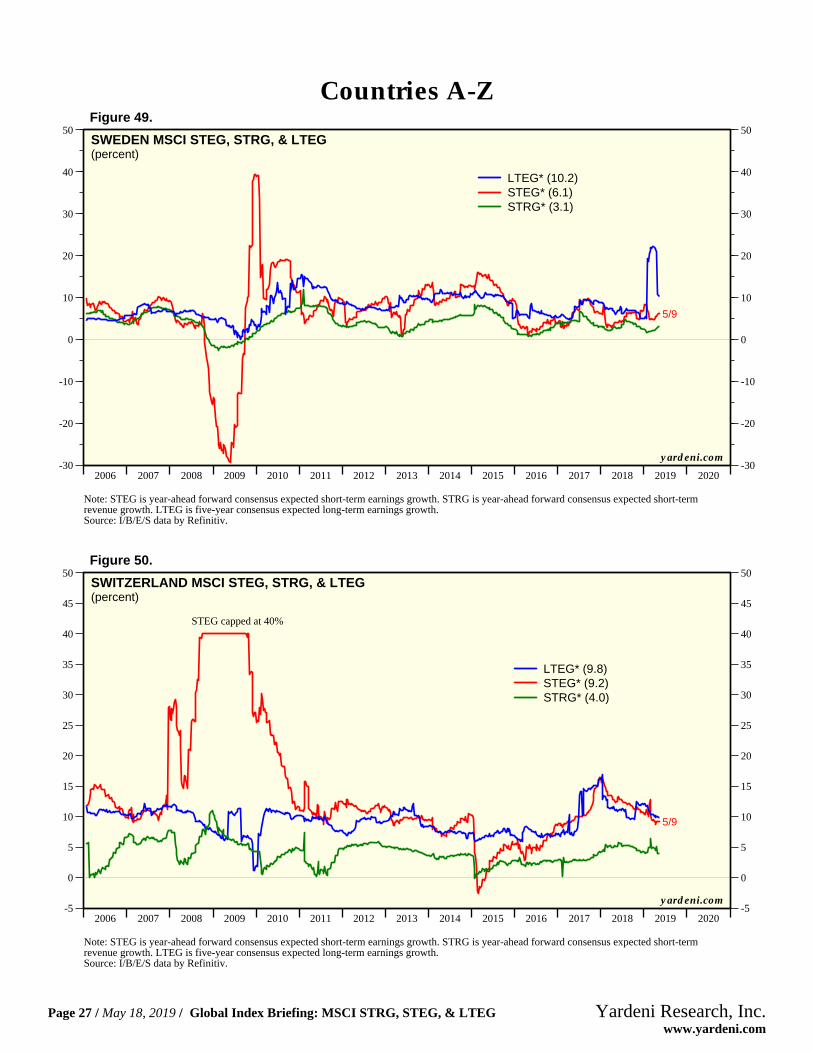
SWEDEN MSCI STEG, STRG, & LTEG(percent)
LTEG* (10.2)STEG* (6.1)STRG* (3.1)
Figure 49.
2006 2007 2008 2009 2010 2011 2012 2013 2014 2015 2016 2017 2018 2019 2020-5
0
5
10
15
20
25
30
35
40
45
50
-5
0
5
10
15
20
25
30
35
40
45
50
5/9
yardeni.com
Note: STEG is year-ahead forward consensus expected short-term earnings growth. STRG is year-ahead forward consensus expected short-termrevenue growth. LTEG is five-year consensus expected long-term earnings growth.Source: I/B/E/S data by Refinitiv.
SWITZERLAND MSCI STEG, STRG, & LTEG(percent)
LTEG* (9.8)STEG* (9.2)STRG* (4.0)
STEG capped at 40%
Figure 50.
Countries A-Z
Page 27 / May 18, 2019 / Global Index Briefing: MSCI STRG, STEG, & LTEG www.yardeni.com
Yardeni Research, Inc.
2006 2007 2008 2009 2010 2011 2012 2013 2014 2015 2016 2017 2018 2019 2020-50
-40
-30
-20
-10
0
10
20
30
40
50
60
70
-50
-40
-30
-20
-10
0
10
20
30
40
50
60
70
5/9
yardeni.com
Note: STEG is year-ahead forward consensus expected short-term earnings growth. STRG is year-ahead forward consensus expected short-termrevenue growth. LTEG is five-year consensus expected long-term earnings growth.Source: I/B/E/S data by Refinitiv.
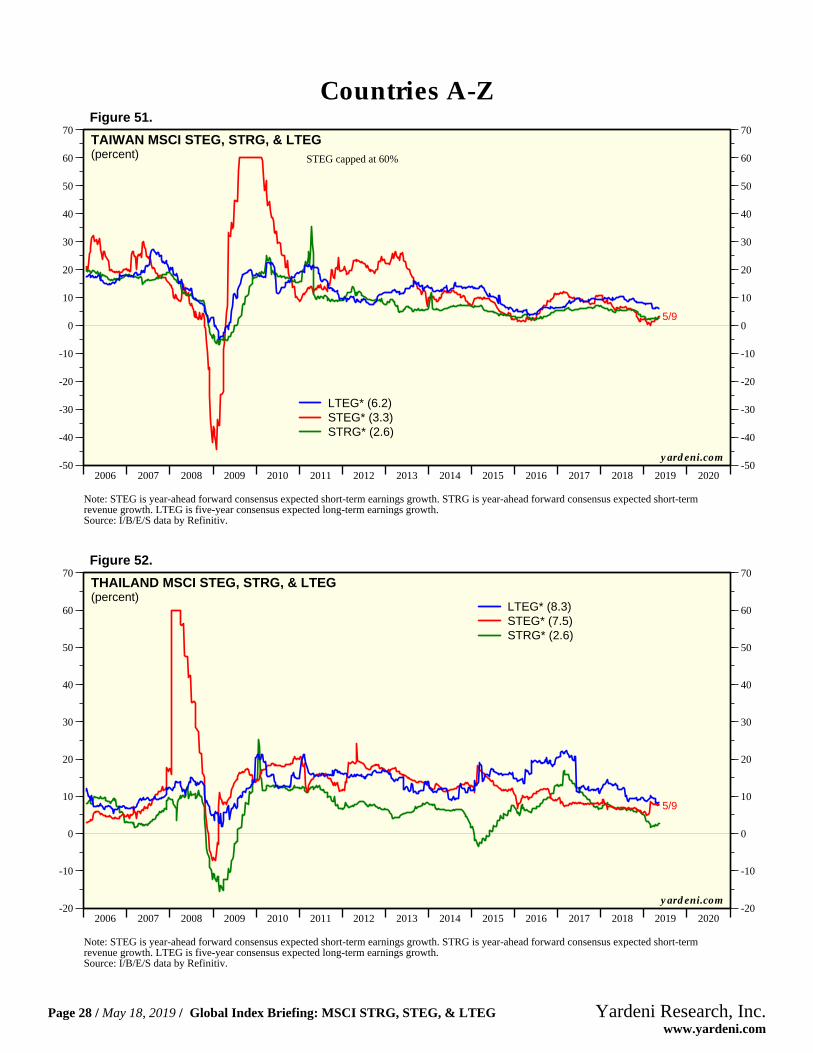
TAIWAN MSCI STEG, STRG, & LTEG(percent)
LTEG* (6.2)STEG* (3.3)STRG* (2.6)
STEG capped at 60%
Figure 51.
2006 2007 2008 2009 2010 2011 2012 2013 2014 2015 2016 2017 2018 2019 2020-20
-10
0
10
20
30
40
50
60
70
-20
-10
0
10
20
30
40
50
60
70
5/9
yardeni.com
Note: STEG is year-ahead forward consensus expected short-term earnings growth. STRG is year-ahead forward consensus expected short-termrevenue growth. LTEG is five-year consensus expected long-term earnings growth.Source: I/B/E/S data by Refinitiv.
THAILAND MSCI STEG, STRG, & LTEG(percent)
LTEG* (8.3)STEG* (7.5)STRG* (2.6)
Figure 52.
Countries A-Z
Page 28 / May 18, 2019 / Global Index Briefing: MSCI STRG, STEG, & LTEG www.yardeni.com
Yardeni Research, Inc.

2006 2007 2008 2009 2010 2011 2012 2013 2014 2015 2016 2017 2018 2019 2020-20
0
20
40
60
80
100
-20
0
20
40
60
80
100
5/9
yardeni.com
Note: STEG is year-ahead forward consensus expected short-term earnings growth. STRG is year-ahead forward consensus expected short-termrevenue growth. LTEG is five-year consensus expected long-term earnings growth.Source: I/B/E/S data by Refinitiv.
TURKEY MSCI STEG, STRG, & LTEG(percent)
LTEG* (26.4)STEG* (10.6)STRG* (15.4)
Figure 53.
2006 2007 2008 2009 2010 2011 2012 2013 2014 2015 2016 2017 2018 2019 2020-30
-20
-10
0
10
20
30
40
-30
-20
-10
0
10
20
30
40
5/9
yardeni.com
Note: STEG is year-ahead forward consensus expected short-term earnings growth. STRG is year-ahead forward consensus expected short-termrevenue growth. LTEG is five-year consensus expected long-term earnings growth.Source: I/B/E/S data by Refinitiv.
UNITED KINGDOM MSCI STEG, STRG, & LTEG(percent)
LTEG* (7.0)STEG* (4.3)STRG* (1.4)
Figure 54.
Countries A-Z
Page 29 / May 18, 2019 / Global Index Briefing: MSCI STRG, STEG, & LTEG www.yardeni.com
Yardeni Research, Inc.

http://blog.yardeni.com
http://blog.yardeni.com
Copyright (c) Yardeni Research, Inc. 2019. All rights reserved. The informationcontained herein has been obtained from sources believed to be reliable, but is notnecessarily complete and its accuracy cannot be guaranteed. No representation orwarranty, express or implied, is made as to the fairness, accuracy, completeness, orcorrectness of the information and opinions contained herein. The views and the otherinformation provided are subject to change without notice. All reports and podcasts posted onwww.yardeni.com, blog.yardeni.com, and YRI’s Apps are issuedwithout regard to the specific investment objectives, financial situation, or particular needsof any specific recipient and are not to be construed as a solicitation or an offer to buy or sellany securities or related financial instruments. Past performance is not necessarily a guideto future results. Company fundamentals and earnings may be mentioned occasionally, butshould not be construed as a recommendation to buy, sell, or hold the company’s stock.Predictions, forecasts, and estimates for any and all markets should not be construed asrecommendations to buy, sell, or hold any security--including mutual funds, futurescontracts, and exchange traded funds, or any similar instruments.
The text, images, and other materials contained or displayed on any Yardeni Research, Inc.product, service, report, email or website are proprietary to Yardeni Research, Inc. andconstitute valuable intellectual property. No material from any part of www.yardeni.com, blog.yardeni.com, and YRI’s Apps may be downloaded, transmitted,broadcast, transferred, assigned, reproduced or in any other way used or otherwisedisseminated in any form to any person or entity, without the explicit written consent ofYardeni Research, Inc. All unauthorized reproduction or other use of material from YardeniResearch, Inc. shall be deemed willful infringement(s) of this copyright and other proprietaryand intellectual property rights, including but not limited to, rights of privacy. YardeniResearch, Inc. expressly reserves all rights in connection with its intellectual property,including without limitation the right to block the transfer of its products and services and/orto track usage thereof, through electronic tracking technology, and all other lawful means,now known or hereafter devised. Yardeni Research, Inc. reserves the right, without furthernotice, to pursue to the fullest extent allowed by the law any and all criminal and civilremedies for the violation of its rights.
The recipient should check any email and any attachments for the presence of viruses.Yardeni Research, Inc. accepts no liability for any damage caused by any virus transmittedby this company’s emails, website, blog and Apps. Additional information available onrequest.