Embed Size (px)
Citation preview

03.12.2015
1
Global industry trends - penetrating future growth markets and entering new segments
Dr Peter Hackel, CFO
Not allowed for further usewithout permission
2
Agenda
Synergy potential and Neodent’s environment
Current industry trends
Our responses to these market trends
Financial performance & Outlook 2015
Questions & answers
Intro Deck

03.12.2015
2
Synergy potential and Neodent’senvironment
4
Who makes where?
Andover (USA):Implant productionPREMIUM
Arlington (USA)CADCAM millingPREMIUM & VALUE
Curitiba (BR)Neodent implant productionVALUECADCAM millingPREMIUM & VALUE
Malmö (S)Regenerative productsPREMIUM
Markkleeberg (D)Etkon CADCAM millingPREMIUM & VALUEVilleret (CH)
Implant productionPREMIUM
Tokyo (JP)[under construction]Etkon CADCAM millingPREMIUM & VALUE
03.12.2015
3
5
Neodent is a top-5 global implant company in volume terms selling ~1.2 million implants p.a. (compared to 1.8 million Straumann implants)
A comparable implant fixture manufactured in Curitiba (BR) by Neodent is roughly 2x cheaper than the respective product manufactured in Villeret (CH) or Andover (US)
Fully-loaded personnel costs per employee in Curitiba are 4-5 times lower than in our Swiss production
Cost-effective manufacturing in Curitiba
6
Labour costs is the main difference
Where do the reasons for the considerable differences between
Straumann and Neodent lie?
4%
12%
14%
22%
47%
Raw Material / Sterilization
Packaging
Processes
General cost level (Insurance,energy, rent...)
Personnel

03.12.2015
4
7
Continuous productivity improvements in our premium implant production
80
100
120
140
2011 2012 2013 2014 2015
Ind
exed
to
100
in
201
1
Volume and gross margin development in the premium implant production
Sales Volume COGSVilleret +Andover
8
Devaluation of the BRL lowers Neodent’s contribution – natural hedge mitigates the situation
0.1
0.2
0.3
0.4
0.5
0.6
0.7
2010 2011 2012 2013 2014 2015BRLCHF USDCHF
-52%
0.266
0.57310.2%
89.8%
Revenue
9.8%
90.2%
OPEX & COGS
BRL other Group currencies
2015: Complete takeover
2012: 49% stake
03.12.2015
5
9
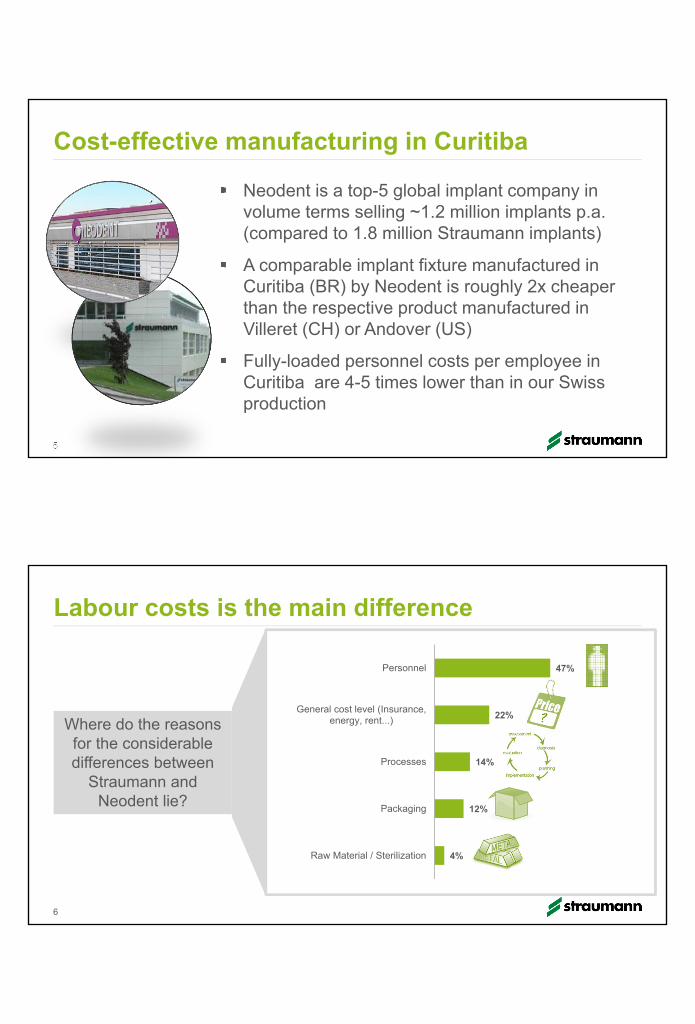
Price index and labor inflation are in the raise
Labor cost will surge due to state imposed increase in social charges (‘dissidios’)
Despite the harsh consumer environment we have increased our average prices in Brazil effective 1st
of December – but only by 5%
Prices increased to mitigate inflation
Source: Thomson Reuters
10
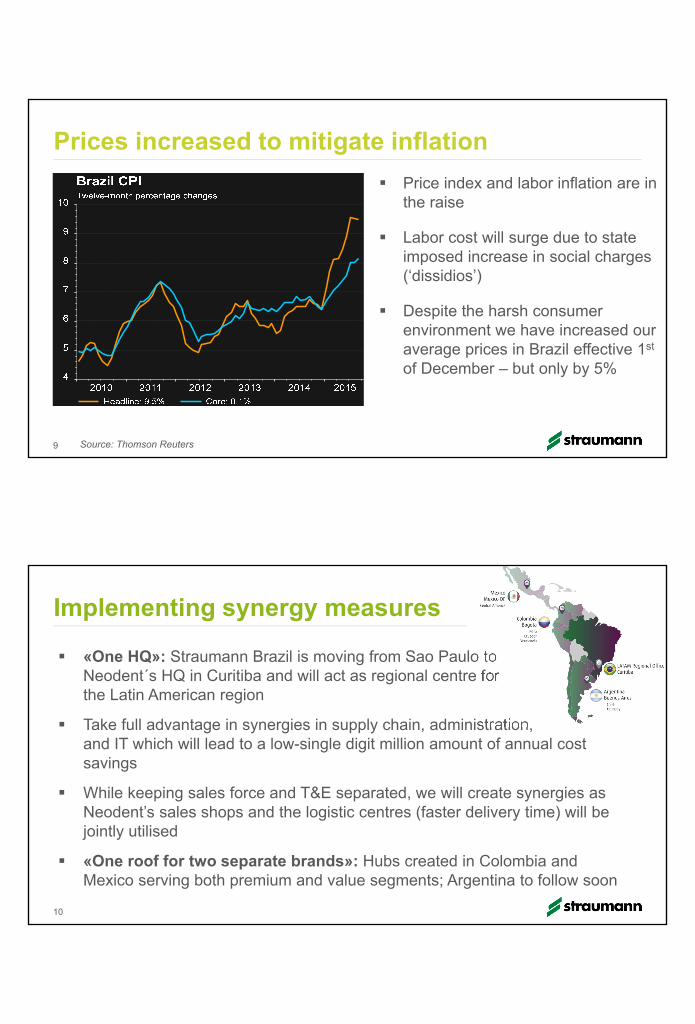
«One HQ»: Straumann Brazil is moving from Sao Paulo to Neodent´s HQ in Curitiba and will act as regional centre for the Latin American region
Take full advantage in synergies in supply chain, administration, and IT which will lead to a low-single digit million amount of annual cost savings
While keeping sales force and T&E separated, we will create synergies as Neodent’s sales shops and the logistic centres (faster delivery time) will be jointly utilised
«One roof for two separate brands»: Hubs created in Colombia and Mexico serving both premium and value segments; Argentina to follow soon
Implementing synergy measures
03.12.2015
6
11
Neodent has strong reputation for customer focus and service; perceived as a ‘high quality company’ by Brazilian dentists
Strong on education; associated with ILAPEO, one of the world´s largest implant training centers
Strong home market and platform for expansion into other LATAM markets
Cost-efficient, modern production in Curitiba
Platform to drive value strategy internationally
Complementary product portfolio
Straumann & Neodent – from strength to strength
Current industry trends

03.12.2015
7
Current dental implant market trends
Industry consolidation
Value products getting more accepted
Future growth markets are outside the traditional implant markets
Digitalisation of treatment workflows andtraditional manufacturing processes
Patients’ expectations have increased and customer base is more heterogenous
1
2
3
4
513
Pure playersPremium Value/Local
Medical device companies
Dental product manufacturers
Dental Wholesaler
14
2010: A fragmented tooth replacement market
>300 smaller/local players
1

03.12.2015
8
1
24%
20%
10%
13%
7%
26%
17
Competitive landscape has changed
Others
Global dental implant & abutment market worth~CHF 3.5bn (2014 pro-forma)
Based on iData, MRG and Straumann estimates. Zimmer-Biomet 3i acquisition pending antitrust clearance.
1

03.12.2015
9
40%
2014
The value segement has gained importance
1 Please note that market size has been influenced by high volatility in exchange rates2 Based on Straumann bottom-up estimation.. 18
2003 2008
Premium segment (incl. Straumann)
Value- und Discount segment (incl. Neodent)
~ 25% ~ 30%
~ 75%~ 70% ~60%
Market shares development per segment (in value terms)1,2
Market size est. CHF 1.3-1.6bn
Market size est. CHF 3.5bn
Market size est. CHF 3.3-3.6bn
2
Market structure and dynamics in high-growth markets vary considerably from traditional markets
19
3
0%
100%
Europe Asia Pacific North America Latin America
Discount Value Premium
Source: Straumann estimates

03.12.2015
10
Large potential to unlock in underpenetrated markets
Source: Straumann estimates
20
3
Implant market size in 2014 (volume)
Switzerland
Austria
Sweden
Netherlands
Canada
Australia
India
Colombia
Mexico
Japan
Spain
China
France
Russia
Israel
Turkey
Argentina
United Kingdom
<250k implants 250-1000k implants >1000k implants
United States
Brazil
South Korea
Germany
Italy
20
2 examples how digitalisation has transformedindustries
21
Photography
Media
4

03.12.2015
11
Dentistry is in a period of technologicalupheaval
22
Impression
Manufacturing
Casting and polishing Milling centre Laser sintering
Polyethylene Impression Intra-oral scanner Local scan and milling in the dental practice
4
24
Many of our new product solutions are driven by end-customer needs 5

03.12.2015
12
25
Patients’ expectations have changed...
Today Trend
Data based on Straumann poll conducted by GfK Healthcare
5
max
min
Buying groups (GPO)
Dental service organisations
(DSO)
... and the customer face has become multidimensional
Dental Laboratory
Surgeon
General practices
Patient
All-in-one multi-
disciplinary practices
Solo-practitioners
Dental chains
Solo-practitioners
5
26
03.12.2015
13
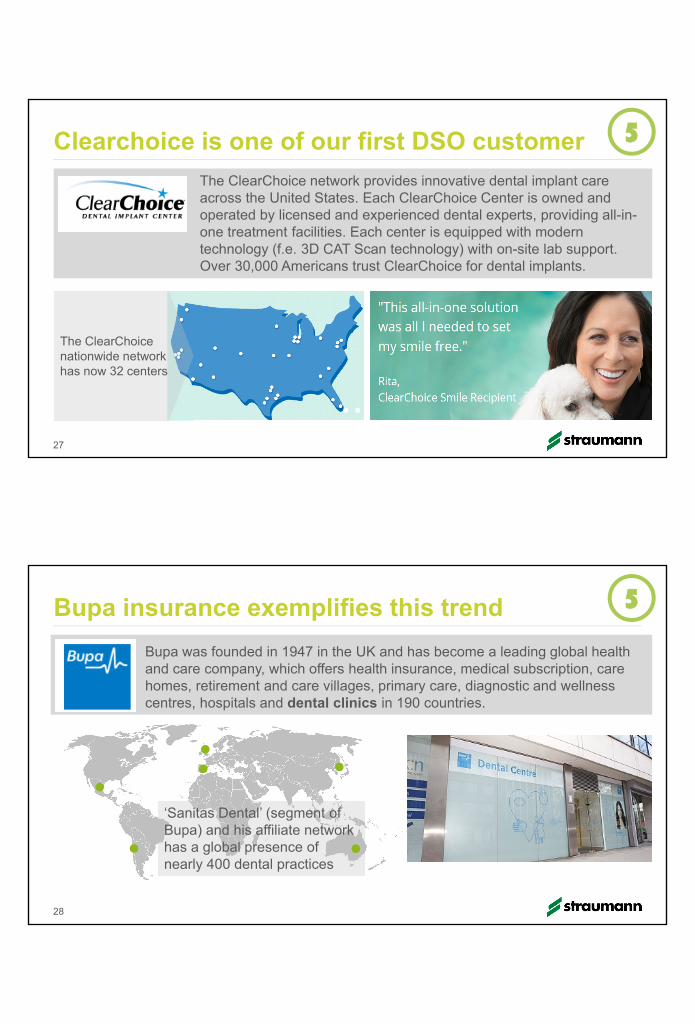
Clearchoice is one of our first DSO customer
The ClearChoice network provides innovative dental implant care across the United States. Each ClearChoice Center is owned and operated by licensed and experienced dental experts, providing all-in-one treatment facilities. Each center is equipped with modern technology (f.e. 3D CAT Scan technology) with on-site lab support. Over 30,000 Americans trust ClearChoice for dental implants.
5
The ClearChoice nationwide network has now 32 centers
27
Bupa insurance exemplifies this trend
Bupa was founded in 1947 in the UK and has become a leading global health and care company, which offers health insurance, medical subscription, care homes, retirement and care villages, primary care, diagnostic and wellness centres, hospitals and dental clinics in 190 countries.
‘Sanitas Dental’ (segment of Bupa) and his affiliate network has a global presence of nearly 400 dental practices
5
28

03.12.2015
14
Our responses to these market trends
Straumann’s growth strategy
Adr
essa
ble
mar
ket
Accelerate and expand in
underpenetrated markets
Total solution provider
Fortify innovation and technology leadership
Offer state-of-the-art digital and milling
solutions
Expand geographicalreach
Less-invasive, fast-healing, to metal-free ceramic
implant solutions
Access untapped segments & indications
Offer root-to-tooth solution for all
indications both for the premium and value
segment
30

03.12.2015
15
Addressing the value segment with various pricepoints
Introduction of Neodent brand in the US and selective markets in Europe
Implant price range in Europe1
€400
€100
€200 SLA
Roxolid
SLActive
PURE
Roxolid
SLATitanium
Acqua
Smart
CM
Neoporos
NeoporosCM
1 Example applying German reference prices: Please note that prices may vary from country to country31
32
Competing with attractively-priced Straumann solutions
Example applying German reference prices 1 Calculation does not consider dentist service fees and dental technician
labour share
Proven Titantium SLA implant € 179
Economically pricedVariobase product
family € 69+ +CADCAM bridge or single full-contoured crown for € 59 per
unit
Artifical tooth forslightly more than € 3001

03.12.2015
16
In the US example, implant list prices from Premium companies range between USD 250-450, Value from 100-250, while discount generally below the 100-dollar mark. These price bands vary by country depending on the overall PPP level and dental fee structure.
Addressing the value segment with other brands
33
Develop a regional/global value segment while at the same time minimizing the cannibalization risk
Offer different price points to decision makers
Enlarge distribution network and fasten market entry into fast growing markets
Greater flexibility when dealing with servicing organisationsor tenders
Combining scale, local and global expertise
Leverage cost-efficient manufacturing footprint
Drivers for multi-brands in the sector
34
03.12.2015
17
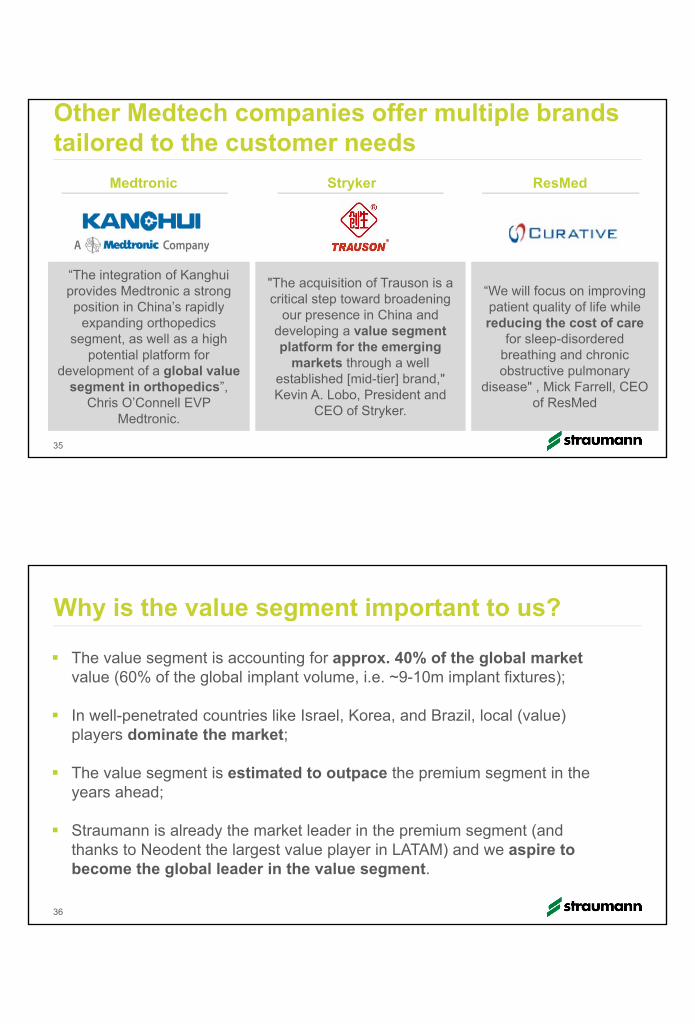
Other Medtech companies offer multiple brandstailored to the customer needs
Medtronic Stryker
35
"The acquisition of Trauson is a critical step toward broadening
our presence in China and developing a value segment platform for the emerging
markets through a well established [mid-tier] brand," Kevin A. Lobo, President and
CEO of Stryker.
“The integration of Kanghuiprovides Medtronic a strong position in China’s rapidly
expanding orthopedics segment, as well as a high
potential platform for development of a global value
segment in orthopedics”, Chris O’Connell EVP
Medtronic.
ResMed
“We will focus on improving patient quality of life while reducing the cost of care
for sleep-disordered breathing and chronic obstructive pulmonary
disease" , Mick Farrell, CEO of ResMed
Why is the value segment important to us?
The value segment is accounting for approx. 40% of the global market value (60% of the global implant volume, i.e. ~9-10m implant fixtures);
In well-penetrated countries like Israel, Korea, and Brazil, local (value) players dominate the market;
The value segment is estimated to outpace the premium segment in the years ahead;
Straumann is already the market leader in the premium segment (and thanks to Neodent the largest value player in LATAM) and we aspire to become the global leader in the value segment.
36

03.12.2015
18
37
Instradent expands its global presence
Availablity of Neodent products through:
Own subsidiaries, Instradent and 3rd party distributors
Future roll-outs
Neodent’s comprehensive implant portfoliocomplements well...
Drive Alvim Titamax Titamax Ex WS FacilityZygo-matico
NeoPoros Acqua NeoPoros Acqua NeoPoros Acqua NeoPoros Acqua NeoPoros NeoPoros Acqua NeoPoros
Main product for the international market
(60% volume)
Main products for the domestic
market (2/3 share)
38

03.12.2015
19
...with the Straumann implant lines
39
Tissue Level 4mm short implant Bone Level Bone Level TaperedPURE
Monotype
SLA SLActive SLActive SLA SLActive SLA SLActive ZLA
Titanium
Roxolid
Ceramic
‘Workhorse’ implant
Minimal invasive
Ideal for the aesthetic zone
More primary stability
Metal-free & improved aesthetics
ILAP
EO
Joined forces to exploit the full potential
Conservative, well-documented treatments
Progressive, immediate function protocols
BLT
Pro- Arch
Occupied by peers
ITI
ProArch
BLTPremium
Value
TissueLevel
BoneLevel
Drive Acqua
To4Zygoma
Alvim
Titamax
40
03.12.2015
20
1'060
0 500 1000 1500 2000
Fully tapered
Apically tapered
Parallel walled
Fully tapered
Apically tapered
Parallel walled
Tissue Level
Bone Level
STMN share Potential to grow Lower priced tapered implants
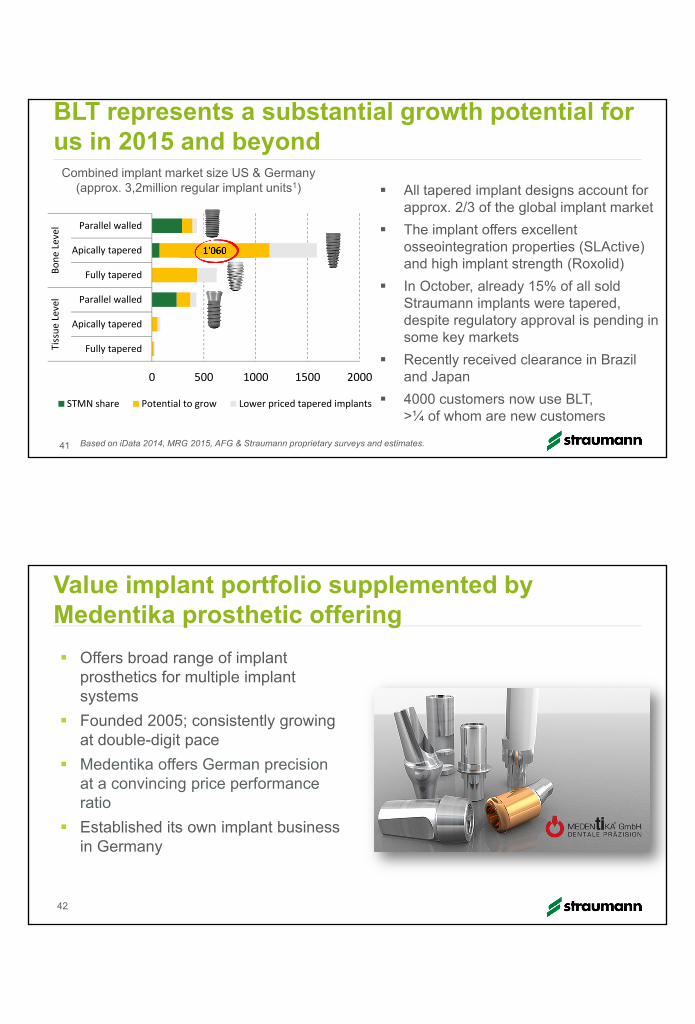
All tapered implant designs account for approx. 2/3 of the global implant market
The implant offers excellent osseointegration properties (SLActive) and high implant strength (Roxolid)
In October, already 15% of all sold Straumann implants were tapered, despite regulatory approval is pending in some key markets
Recently received clearance in Brazil and Japan
4000 customers now use BLT, >¼ of whom are new customers
BLT represents a substantial growth potential for us in 2015 and beyond
Combined implant market size US & Germany (approx. 3,2million regular implant units1)
Based on iData 2014, MRG 2015, AFG & Straumann proprietary surveys and estimates. 41
42
Value implant portfolio supplemented by Medentika prosthetic offering
Offers broad range of implant prosthetics for multiple implant systems
Founded 2005; consistently growing at double-digit pace
Medentika offers German precisionat a convincing price performanceratio
Established its own implant business in Germany

03.12.2015
21
43
Potential identified to expand our position across indications and segments
Stock abutments
Customized abutments
CA
DC
AM
m
illin
g sy
stem
s
Dental implants
DV
T /
3D
ra
dio
logy
Sur
gica
l pla
nnin
g &
dril
l gu
ides
Global market size ~CHF 7bnShare of the Straumann Group
Bon
e &
tiss
ue
rege
nera
tion
CADCAM manu--factured prosthetics
Sca
nner
s
Conventionally manufactured prosthetics on
implants (crowns, bridges, bars)
1 CARES Scan&Shape as an additional Service for GP and DL, mainly for non digitally equipped customers
Our current digital offering...
44
GPDental lab
3rd party intra-oral scanners
1Desktop Scan
Centralized milling
Equipment business supplemented by various consumables ranging from ceramic materials through to implant bars & bridges
Scan&ShapeService1

03.12.2015
22
1 CARES Scan&Shape as an additional Service for GP and DL, mainly for non digitally equipped customers
...and what we are aiming for
45
GPDental lab
3rd party intra-oral scanners
Intra-oral scanning
1Desktop Scan
Centralized millingIn-lab milling Chairside solution
Equipment business supplemented by various consumables ranging from ceramic materials through to implant bars & bridges
Scan&ShapeService1
1 CARES Scan&Shape as an additional Service for GP and DL, mainly for non digitally equipped customers* LMR = limited market release in EU. Further rollout pending regulatory approval in the respective markets
With the following timelines
46
3rd party intra-oral scanners
Intra-oral scanning
1Desktop Scan
Centralized millingIn-lab milling Chairside solution
Equipment business supplemented by various consumables ranging from ceramic materials through to implant bars & bridges
Scan&ShapeService1
GPDental lab

03.12.2015
23
Financial performance & Outlook 2015
48 Organic growth – i.e. excluding the effects of acquisitions, divestitures and currency exchange rates . Main competitors incl. Nobel Biocare, Zimmer Dental, Biomet 3i, Dentsply Implants based on company and SEC reports, as well as management comments
Revitalized topline and raise in profitability
22.3%
17.3%14.9%
18.2%20.9%
24.0%
0%
10%
20%
30%
0
100
200
2010 2011 2012 2013 2014 H1 2015
Operating profits
Operating income Exceptionals Underlying EBIT margin
in CHF million 2010 2011 2012 2013 2014 9M 2015 5y CAGR
Revenue in CHF 737.6 693.6 686.4 679.9 710.3 585.3 ‐1%
growth in %
Organic revenue growth 2.5 4.1 ‐1.0 1.2 6.4 8.6 3.6
Acquisiton / Divesture 2.1 0.0 ‐0.6 ‐0.8 0.0 9.5 1.7
Total l.c. growth 4.6 4.1 ‐1.6 0.4 6.4 18.1 5.3
FX effect ‐4.4 ‐10.1 0.5 ‐1.3 ‐1.9 ‐6.3 ‐3.9
Total revenue growth (in CHF) 0.2 ‐6.0 ‐1.1 ‐0.9 4.5 11.8 1.4
4.0%3.2%
‐1.0%
1.2%
6.4%
8.6%
0.2%
2.5%
‐0.9%0.1%
2.4%
4.6%
2010 2011 2012 2013 2014 9M 2015
Organic growth vs. main peers
Organic revenue growth Organic growth main competitors
03.12.2015
24
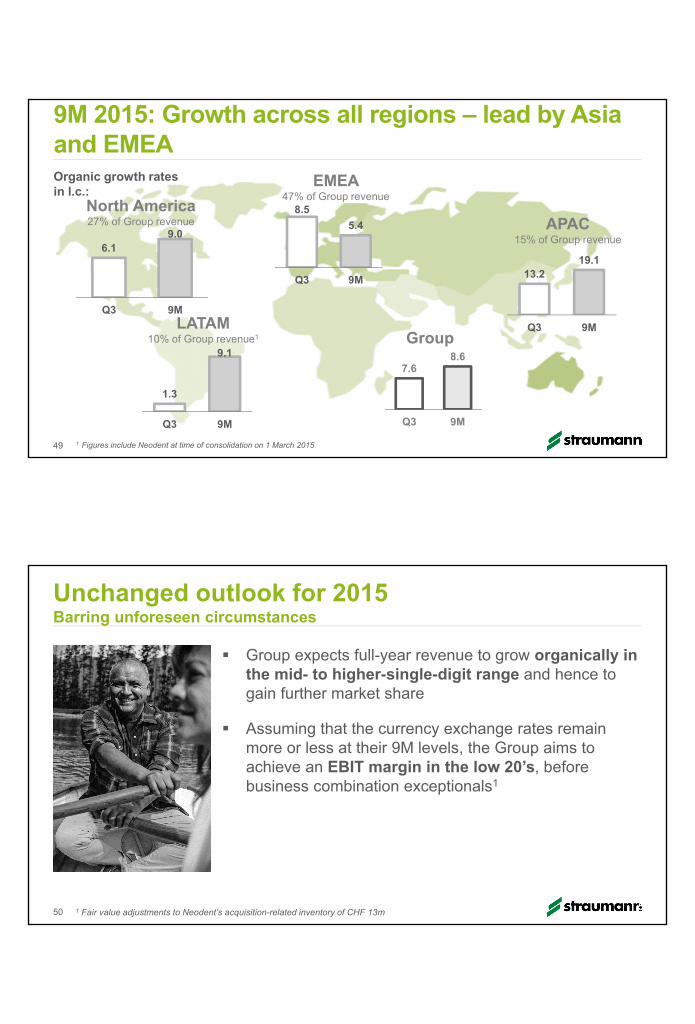
North America27% of Group revenue
49
Organic growth rates in l.c.:
9M 2015: Growth across all regions – lead by Asia and EMEA
6.19.0
Q3 9M
1.3
9.1
Q3 9M
LATAM 10% of Group revenue1
8.5
5.4
Q3 9M
EMEA 47% of Group revenue
13.219.1
Q3 9M
APAC15% of Group revenue
7.68.6
Q3 9M
Group
1 Figures include Neodent at time of consolidation on 1 March 2015
50
Group expects full-year revenue to grow organically in the mid- to higher-single-digit range and hence to gain further market share
Assuming that the currency exchange rates remain more or less at their 9M levels, the Group aims to achieve an EBIT margin in the low 20’s, before business combination exceptionals1
Unchanged outlook for 2015Barring unforeseen circumstances
501 Fair value adjustments to Neodent’s acquisition-related inventory of CHF 13m

03.12.2015
25
Questions & answers