Embed Size (px)
Citation preview

INVESTIGATION
Global Linkage Map Connects Meiotic CentromereFunction to Chromosome Size in Budding YeastAnastasia Baryshnikova,*,†,1 Benjamin VanderSluis,‡ Michael Costanzo,* Chad L. Myers,‡ Rita S. Cha,§,2
Brenda Andrews,*,†,2 and Charles Boone*,†,2
*Banting and Best Department of Medical Research, The Donnelly Center for Cellular and Biomolecular Research,University of Toronto, Toronto, Ontario M5S 3E1, Canada, †Department of Molecular Genetics, University of Toronto,Toronto, Ontario M5S 3E1, Canada, ‡Department of Computer Science and Engineering, University of Minnesota,Minneapolis, Minnesota 55455, and §Department of Life Sciences, Genome Damage and Stability Centre, University ofSussex, Falmer, BN1 9RQ, UK
ABSTRACT Synthetic genetic array (SGA) analysis automates yeast genetics, enabling high-throughputconstruction of ordered arrays of double mutants. Quantitative colony sizes derived from SGA analysis canbe used to measure cellular fitness and score for genetic interactions, such as synthetic lethality. Here weshow that SGA colony sizes also can be used to obtain global maps of meiotic recombination becauserecombination frequency affects double-mutant formation for gene pairs located on the same chromosomeand therefore influences the size of the resultant double-mutant colony. We obtained quantitative colonysize data for ~1.2 million double mutants located on the same chromosome and constructed a genome-scale genetic linkage map at ~5 kb resolution. We found that our linkage map is reproducible andconsistent with previous global studies of meiotic recombination. In particular, we confirmed that the totalnumber of crossovers per chromosome tends to follow a simple linear model that depends on chromosomesize. In addition, we observed a previously unappreciated relationship between the size of linkage regionssurrounding each centromere and chromosome size, suggesting that crossovers tend to occur farther awayfrom the centromere on larger chromosomes. The pericentric regions of larger chromosomes also appearedto load larger clusters of meiotic cohesin Rec8, and acquire fewer Spo11-catalyzed DNA double-strandbreaks. Given that crossovers too near or too far from centromeres are detrimental to homolog disjunctionand increase the incidence of aneuploidy, our data suggest that chromosome size may have a direct role inregulating the fidelity of chromosome segregation during meiosis.
KEYWORDS
synthetic geneticarray (SGA)
genomicsmeiosisrecombinationcentromeregenetic linkagechromosome sizedouble strandbreaks
Rec8Spo11yeastSaccharomycescerevisiae
Synthetic genetic array (SGA) analysis provides an automated methodfor constructing yeast double mutants and mapping genetic interactionnetworks (Costanzo et al. 2010). In a typical SGA experiment, a querystrain, carrying a mutation in a gene of interest, is crossed to an inputarray of viable deletion mutants or conditional alleles of essentialgenes. Sporulation and a series of selection steps produce a corre-sponding output array of double mutants, which can be scored forvarious phenotypes, including fitness, by the use of quantitative col-ony size measurements.
Single- and double-mutant fitness estimates can be used to identifypositive and negative genetic interactions, in which the double mutantgrows better or worse than expected from the combined effect of thetwo single mutations, respectively (Baryshnikova et al. 2010a). How-ever, in addition to fitness, SGA-based colony size also reflects theefficiency at which double mutants are formed. For example, forgenetically linked gene pairs, SGA analysis produces fewer double
Copyright © 2013 Baryshnikova et al.doi: 10.1534/g3.113.007377Manuscript received June 23, 2013; accepted for publication August 2, 2013This is an open-access article distributed under the terms of the CreativeCommons Attribution Unported License (http://creativecommons.org/licenses/by/3.0/), which permits unrestricted use, distribution, and reproduction in anymedium, provided the original work is properly cited.Supporting information is available online at http://www.g3journal.org/lookup/suppl/doi:10.1534/g3.113.007377/-/DC11Current address: Lewis-Sigler Institute for Integrative Genomics, PrincetonUniversity, Princeton, NJ 08544.
2Corresponding authors: University of Toronto, Donnelly Centre, 160 College St,Room 1306, Toronto, ON, M5S 3E1. E-mail: [email protected];Department of Life Sciences, Genome Damage and Stability Centre, University ofSussex, Falmer, BN1 9RQ, UK. E-mail: [email protected]; and Banting and BestDepartment of Medical Research, The Donnelly Center for Cellular andBiomolecular Research, University of Toronto, Toronto, Ontario M5S 3E1, Canada,and Department of Molecular Genetics, University of Toronto, Toronto, OntarioM5S 3E1, Canada. E-mail: [email protected]
Volume 3 | October 2013 | 1741

mutant cells than for gene pairs that segregate independently (Figure1A). Consequently, double mutants involving linked gene pairs tendto form smaller colonies (Figure 1, A and B), which must be removedfrom genetic network analysis to prevent their misinterpretation asnegative genetic interactions (Collins et al. 2006; Costanzo et al. 2010).
Here, we show that colony size data associated with linked genepairs can be used to construct accurate maps of meiotic recombinationthroughout the yeast genome. Our analysis uncovered a previouslyunappreciated connection between chromosome size and centromerefunction during meiosis, revealing that crossovers (COs) tend to occur
farther away from the centromere on larger chromosomes, which mayinfluence chromosome segregation and aneuploidy events.
MATERIALS AND METHODS
SGA dataSGA experiments were conducted as described in Baryshnikova et al.(2010a). Quantitative colony size measurements were acquired andprocessed using the computational pipeline described in Baryshnikovaet al. (2010b). The Supporting Information, File S1, containing the
Figure 1 Construction of ge-netic linkage map based onSGA analysis. (A) In an SGAexperiment, a “query” strainmutated in a gene of interest(aD) is crossed to an array of~5000 viable deletion mutants,including those located on thesame chromosome as the query(bD). Both query and arraymutations (empty blue and redsquares, respectively) are linkedto drug-resistance cassettes,which enable selection of thedouble-mutant meiotic prog-eny, after mating and sporula-tion, and act as markers ofmeiotic recombination. Physicaldistance between the loci andlocal frequency of CO events(dotted crosses) determine theefficiency of double mutantproduction, which, togetherwith double mutant fitness,defines the size of the doublemutant colony formed at the fi-nal stage of SGA selection (e.g.,Figure 1B). Because geneticinteractions are rare and arenot expected to be influencedby physical distance betweenloci, quantitative double-mutantcolony sizes can be used to es-timate local recombination fre-quency. (B) Visual illustration ofthe relationship between physi-cal distance and double-mutantcolony size, which reflects re-combination frequency. Imagesof double-mutant colonies cor-responding to linked genepairs were obtained from theSGA experiment involving theyhr030cD query strain andarranged based on their physi-cal position on the chromo-
some (yhr015wD–yhr047cD). Double-mutant colonies of unlinked gene pairs, derived from a control experiment, are indicated for comparison.Estimated fraction of recombinant progeny (Rec. fraction; Materials and Methods) and SGA-GD (Materials and Methods) are reported for eachlinked double mutant. (C) A typical genetic linkage profile. Black bars correspond to the estimated frequency of recombinant progeny (Materialsand Methods) involving the query mutation (yhr030cD) and an array mutation located on the same chromosome at the position indicated on thex-axis. The red line represents the smoothed SGA-GD between the query and the array loci (Materials and Methods). (D) Relationship betweenphysical distance and recombination frequency estimates, as measured by the fraction of recombinant progeny (black line) or SGA-based geneticdistance (red line). The dotted line indicates the 50 SGA-GD threshold, which corresponds to the shortest genetic distance between two unlinkedloci and, on average, is equivalent to a physical distance of ~35 kb (Materials and Methods).
1742 | A. Baryshnikova et al.

SGA-based genetic distances (SGA-GD), is available at http://boonelab.ccbr.utoronto.ca/data/baryshnikova_2013/. A set of 16 files, one for eachchromosome, contains the SGA-GD between the indicated loci. Rowsand columns correspond to query and array mutants, respectively.Multiple experiments, involving the same query locus, appear as dupli-cated rows in each file.
Calculating genetic distancesThe recombination rate between two loci often is expressed in termsof their genetic distance, which is measured in centimorgans (cM) andrefers to the average number of CO events occurring between the lociin a single meiosis (Sturtevant 1913; Griffiths et al. 2000). Given apopulation of cells undergoing meiotic division, the genetic distancebetween two loci can be computed by using the frequency of recombi-nant progeny relative to the total number of meiotic products (Griffithset al. 2000). Assuming complete CO interference, a genetic distance of50 cM would correspond to a 50% frequency of recombinants and thuswould be indicative of genomic loci that segregate independently. Itmust be noted that the observed fraction of recombinants may differfrom the actual fraction of recombinants because multiple COs occur-ring between two markers often remain undetected. This issue is par-tially addressed by the Haldane mapping function (see herein).
Using SGA data, we estimated the relative fraction of recombinantprogeny for each double mutant as:
R ¼ 12
fijfi fj
(1)
where fi, fj, and fij are the normalized colony sizes of the two singleand of the double mutant, respectively, calculated as described pre-viously (Baryshnikova et al. 2010b). We assume that double-mutantcolony size can be used as an approximation for the number ofdouble mutants produced by the original meiotic event and hypoth-esize that, in the absence of genetic linkage, just like in the absence ofgenetic interactions, the colony size of a double mutant, relative towild type, should be equal to the product of the two single mutantcolony sizes (fij = fi · fj). Any difference between the observed (fij)and the expected (fi · fj) double mutant colony size must be due toeither genetic interactions or genetic linkage. Because genetic inter-actions are rare and do not normally depend on physical distancebetween loci, the average colony size of double mutants involvinggenes located in close proximity to one another should only reflectgenetic linkage, whereas the contribution of genetic interactions canbe considered negligible (Figure 1C). A similar reasoning pertainsto potential differences in sporulation efficiency, which might alsoaffect double-mutant colony size. In addition to being rare and in-dependent from physical positioning, sporulation defects are un-likely to be manifested in heterozygous diploids from which doublemutants are produced in SGA. The ratio of observed and expecteddouble-mutant fitness is multiplied by a factor of 0.5, such that R = 0.5for genetically independent loci (fij = fi · fj).
Recombinant fraction R counts the number of recombinant sporesrelative to all spores generated by meiosis and can be used as a mea-sure of recombination among genomic loci. However, R often un-derestimates the true recombination rate because it does not accountfor recombination events that do not produce double mutants. Forexample, multiple CO events produce a parental arrangement ofalleles and the resulting meiotic products do not contribute torecombinant frequency.
Several normalization methods have been proposed to correct forthis inaccuracy (Morton 2004). One of the simplest methods, known
as Haldane’s mapping function (Hartl and Jones 2009), is based on theassumption that recombination events are distributed randomlywithin a given region and, thus, the probability of observing i recom-bination events follows the Poisson distribution:
f ðiÞ ¼ e2mmi
i!(2)
where m is the mean number of recombination events in the regionper meiosis. Haldane’s mapping function assumes that multiple COevents occur independently from each other and do not experienceinterference (Hartl and Jones 2009). Although this is a fairly strongassumption, CO interference is unlikely to have a strong impact onour estimates of recombination frequency based on colony sizes. Asa result, we believe that the adoption of the Haldane’s mappingfunction is justified.
Recombinants comprise 50% of the spores derived from meiosesin which at least one recombination event occurred in the region.Thus, recombinant fraction R can be expressed as:
R ¼ 12ð12e2mÞ (3)
where e–m is the number of meioses with zero recombination events:
f ð0Þ ¼ e2mm0
0!¼ e2m (4)
From Equation 4, we can derive m, which would equal to the prob-ability of observing a recombination event in a given region:
m ¼2 lnð12 2RÞ (5)
Recombination rate between loci is often expressed in terms of theirgenetic distance, measured in Morgans, such that 1 Morgan equals 1recombinant product per meiosis. Because each recombination eventproduces two recombinant products, genetic distance M is derivedfrom Equation 5 as:
M ¼ 12m ¼2
12lnð12 2RÞ (6)
1 centimorgan (cM) equals 0.01 Morgans.Compared with classical genetic studies based on small scale tetrad
analyses (Cherry et al. 2012), genetic distances derived from SGAdouble-mutant colony sizes seem to systematically overestimate re-combination rates. To emphasize this quantitative difference and pre-vent confusion, we avoid the term “centimorgan” and describe ourdata in terms of SGA-GD. A unit of SGA-GD is equivalent to a cen-timorgan in the context of SGA data and a genetic distance of 50SGA-GD corresponds to a recombinant frequency of 50% and thus isindicative of genomic loci that segregate independently (Griffiths et al.2000) (Figure 1, C and D).
Constructing genetic linkage mapsFor each SGA experiment, we calculated the genetic distances betweenthe query locus and all array loci located on the same chromosome.Because even inviable double mutants or double mutant failing togerminate form small residual colonies, raw genetic distances werenormalized such that the genetic distance between the gene and itselfis zero.
Each chromosome was split into a set of consecutive nonoverlap-ping bins of 5 kb each. Query and array genes were assigned to bins
Volume 3 October 2013 | Pericentric Recombination and Chromosome Size in Yeast | 1743

based on their chromosomal position, as reported by the SaccharomycesGenome Database (SGD, www.yeastgenome.org; accessed in February2011). A genetic linkage map G for chromosome C was generated asa n · n matrix, where n is the total number of bins in C, and thevalue Gij corresponds to the average of SGA-based genetic distancesfor query-array gene pairs where queries belong to bin i and arraysbelong to bin j. The consolidated genetic linkage map G9 (Figure S1)was calculated by averaging query-array and array-query genetic link-age maps for the same positions:
G9 ¼ Gþ GT
2(7)
Averaging of query and array genetic linkage maps was applied to allchromosomes, with the exception of chromosome III, because of itspeculiar role in the SGA selection process (Figure S3). In addition,the left arms of chromosomes V and XIV, harbor two of the markersused during the SGA double mutant selection: YEL063C (CAN1)and YNL268W (LYP1). As a result, all SGA screens show linkagein the corresponding areas of chromosomes V and XIV and gene-specific linkages cannot be reported (gray areas in Figure S1, panelsV and XIV).
Hotspot analysisWe estimated the recombination frequency at each position x alongthe chromosome by computing the average SGA-based genetic dis-tance within the interval [x – 2, x + 2], corresponding to a 25-kb in-terval centered on position x (5 bins · 5 kb/bin). The resulting profileof recombination frequency was smoothed using a moving averagefilter over five consecutive positions.
We identified 347 putative recombination hotspots defined aslocal maxima of recombination frequency, measured in SGA-GDper kilobase, that were greater than the average genome recom-bination frequency. The distribution of these peaks coincided wellwith known genomic loci associated with high levels of meioticrecombination (Lichten and Goldman 1995). For example, we iden-tified 8 of 9 most well-characterized recombination hotspots (HIS2,HIS4, ARG4, CYS3, DED81, ARE1-IMG1, CDC19, and THR4; datanot shown).
Meiotic recombination in yeast has been investigated on a genome-wide scale with the use of a variety of experimental approaches(Baudat and Nicolas 1997; Borde et al. 2004; Blitzblau et al. 2007;Buhler et al. 2007; Mancera et al. 2008; Pan et al. 2011). Thesestudies focused primarily on mapping the initial phases of recombi-nation, including Spo11 DNA binding (Gerton et al. 2000; Pan et al.2011) and DSB formation (Baudat and Nicolas 1997), as well as earlyrecombination intermediates, such as single-stranded DNA pro-duced by resection (Blitzblau et al. 2007; Buhler et al. 2007). Inaddition, CO and non-CO recombination outcomes have been iden-tified by genotyping single-nucleotide polymorphisms in parentsand progeny of sampled meioses (Mancera et al. 2008).
We compared the recombination profiles obtained from thesepublished studies of meiotic recombination to those derived from ourSGA-based genetic linkage analysis. The physical locations of re-combination hotspots were downloaded from the supplementarymaterial of each publication, as described in Table S1.
Our data showed good precision and sensitivity in detecting re-combination hotspots reported in other studies (Figure S4). For ex-ample, 65% and 77% of hotspots reported by Pan et al. (2011) andMancera et al. (2008), respectively, are located within 10 kb froma hotspot identified by our SGA-based dataset (Figure S4).
Relationship between chromosome size andcentromere linkage
SGA data:All gene pairs located on the same chromosome weredivided into cis-pairs (located on the same side of the centromere) andtrans-pairs (located on opposite sides on the centromere). Gene pairs ineach group were then distributed into discrete 5-kb bins according totheir physical distance. Within each bin, genetic distances were averaged.The extent of centromere linkage was computed as the physical distanceof smallest (closest to the centromere) bin of trans-pairs where the geneticdistance between loci was on average equal or greater than 50 SGA-GD.
Other studies of meiotic recombination: Data relative to the locationof recombination hotspots were downloaded from the supplementarywebsites of the respective publications, as indicated in Table S1. Linkagearound the centromere was defined as the shortest physical distancebetween two hotspots located on opposite sides of the centromere. Asa control for centromere-unrelated linkage, we calculated the averagephysical distance between any pair of consecutive hotspots.
In addition, a genetic map was downloaded from the SaccharomycesGenome Database (http://downloads.yeastgenome.org/chromosomal_feature/genetic_map.tab). Linkage around the centromere was definedas the shortest physical distance between two genetically independentloci (50 cM) located on opposite sides of the centromere. As a controlfor centromere-unrelated linkage, we calculated the expected physicaldistance between two unlinked loci by using the average number ofcentimorgans per kilobase reported for each chromosome at http://www.yeastgenome.org/pgMaps/pgMap.shtml.
We computed Pearson correlation coefficients and the associatedsignificance p-values between chromosome size and the estimated ex-tent of centromere-related and centromere-unrelated linkage (Figure S5).Given that a number of published studies reported an overall increase inmeiotic recombination rates for the four smallest chromosomes (Kabacket al. 1992; Gerton et al. 2000; Blitzblau et al. 2007; Cherry et al. 2012),we also computed correlations between chromosome size and linkageextent following the removal of chromosomes I, III, VI, and IX. Wefound that any correlation observed between chromosome size andcentromere-unrelated linkage, was completely abolished when the 4smallest chromosomes were excluded from the analysis (Figure S5). Incontrast, centromere-related linkage was generally unaffected (Figure S5).
Measuring centromere-bound cohesin clustersWe obtained quantitative profiles of meiotic cohesin binding from tworecent genome-wide studies (Glynn et al. 2004; Kiburz et al. 2005), aswell as a third study in which the authors measured cohesin bindingalong four chromosomes at different time points (Kugou et al. 2009)(Table S1). Profiles were smoothed using a moving average filterapplied across 25 consecutive positions. The extent of centromere-bound cohesin clustering was measured as the width of the centromere-centered peak of cohesin binding. Peak width was defined as thedistance between the two farthest chromosomal positions, on eitherside of the centromere, where cohesin binding was greater than globalgenomic average (a simple b . GGA cutoff was applied, where b iscohesin binding and GGA is global genomic average).
RESULTS
Construction of genetic linkage map based onSGA analysisIn SGA analysis, double-mutant colony size reflects both the efficiencyof double mutant formation (i.e., the fraction of double mutants
1744 | A. Baryshnikova et al.

among the meiotic progeny of a heterozygous diploid) and double-mutant fitness (i.e., growth rate). While double-mutant fitness defectsgenerally are rare and independent from chromosomal position(Costanzo et al. 2010), a reduced efficiency of double mutant forma-tion is often observed for gene pairs located closely on the samechromosome (Figure 1, A and B). For linked gene pairs, formationof double mutants depends on meiotic recombination, whose fre-quency increases with physical distance at a rate that is specific to agiven genomic region. Taking advantage of our growing genome-wideSGA dataset, we examined the potential to estimate region-specificrecombination rates from the colony sizes of the double mutantscarrying genes located close to one another on the same chromosome(Figure 1 and the section Materials and Methods).
From a collective set of ~3800 genome-wide SGA experiments, weobtained quantitative double mutant colony sizes for ~1.2 milliongene pairs co-localized on the same chromosome (File S1). Colonysizes were measured in pixel units from digital images of double-mutant plates (Figure 1B) and normalized for experimental systematiceffects with the use of a computational protocol developed for geneticinteraction analysis (Baryshnikova et al. 2010b). For each gene pair,we used single and double mutant2normalized colony sizes to esti-mate the relative frequency of recombination progeny for each doublemutant (Figure 1C and the sectionMaterials and Methods). Using thisfrequency, we calculated the genetic distance between the correspond-ing loci, which is referred to as SGA-based genetic distance, orSGA-GD. A unit of SGA-GD is comparable with a centimorgan, awidely used measure of genetic linkage and recombination frequency.A genetic distance of 50 SGA-GD corresponds to a recombinant fre-quency of 50% and thus is indicative of genomic loci that segregateindependently (Griffiths et al. 2000) (Figure 1C and the sectionMaterials and Methods).
We found that SGA-based genetic distance correlated linearly withphysical distance, a trend that is expected if double-mutant colony sizetruly reflects recombination frequency (Figure 1D). On average, geneslocated more than 35 kb apart tended to segregate independently,as their genetic distance was 50 SGA-GD or greater (Figure 1D). Incontrast, early genetic tests, based on classical tetrad analysis, esti-mated that unlinked loci are normally positioned at ~139 kb (Cherryet al. 2012), a distance ~4-fold greater than our estimate of 35 kb. Thisdifference suggests that SGA data overestimate the frequency of mei-otic recombination. One potential explanation for this result is that, inSGA, double-mutant colony sizes are quantified 30240 generationsafter the original meiotic event. At that stage, many colonies havereached saturation and small growth disadvantages, experienced byweakly linked gene pairs, might be diminished, thus causing an over-estimation of local recombination rates. Despite this limitation, everychromosomal region in our dataset should be equally affected by thisphenomenon, which therefore is expected to have a minor impact onthe results of our comparative analyses.
We used the set of SGA-based genetic distances between all testedgene pairs to construct a genome-wide, ~5 kb-resolution, geneticlinkage map (Materials and Methods). This map revealed large blocksof linkage, where recombination is rare and neighboring loci areinherited jointly (Figure 2A; Figure S1). Linkage blocks were separatedby relatively shorter stretches of loci that appeared to be geneticallyunlinked and thus likely to harbor recombination hotspots (Figure 2A;Figure S1; and Materials and Methods). Our genetic linkage data werereproducible (Figure S2 and Figure S3) and consistent with previousstudies of meiotic recombination (Figure S4; and the sectionMaterialsand Methods). In particular, we confirmed the relationship, previouslyobserved in yeast and in other organisms, between recombination
events and chromosome size whereby the total number of COs perchromosome follows a simple linear model aL + b, where L is chro-mosome size, while a and b are constants (Figure 2B) (Riles et al.1993; Kaback 1996; Stahl et al. 2004; Mancera et al. 2008; Fledel-Alonet al. 2009).
Positive correlation between chromosome size and thesize of pericentric linkage regionsIn our genetic linkage map, the centromeres of all chromosomes wereassociated with extensive regions of genetic linkage (Figure 2A; FigureS1), consistent with centromeric suppression of meiotic recombina-tion (Brar and Amon 2008; Chen et al. 2008; Mancera et al. 2008; Panet al. 2011). We examined pericentric linkage for each chromosome bymeasuring the shortest physical distance between two unlinked locipositioned on the same side (cis) or on opposite sides (trans) of thecentromere (Figure 3, A2C, and the section Materials and Methods).The shortest distance between cis-pairs of unlinked loci generally wasconstant for all chromosomes and matched the global genomic aver-age of 35 kb, with the exception of the four smallest chromosomes(I, III, VI, and IX), whose average recombination rate is greater, asdocumented previously (Kaback et al. 1992, 1999; Pan et al. 2011; Cherryet al. 2012) and consistently with the aL + b model. In contrast, theshortest distance between trans-centromeric pairs of unlinked lociwas notably greater than 35 kb for every chromosome (Figure 3, Band C), consistent with pericentric suppression of meiotic recombi-nation (Brar and Amon 2008; Chen et al. 2008; Mancera et al. 2008;Pan et al. 2011). Furthermore, the shortest distance between trans-centromeric pairs varied from chromosome to chromosome and cor-related significantly with chromosome size (R = 0.77, p, 0.01; Figure3C). This correlation indicates that, on larger chromosomes, COs tendto occur farther away from the centromere, resulting in the formationof larger linkage regions. We confirmed the relationship betweenchromosome size and pericentric linkage using several publisheddatasets (Figure S5), including large-scale mapping of individual COevents (Mancera et al. 2008) and the classical yeast genetic map com-piled from traditional tetrad analysis (Cherry et al. 2012) (Figure 3D).
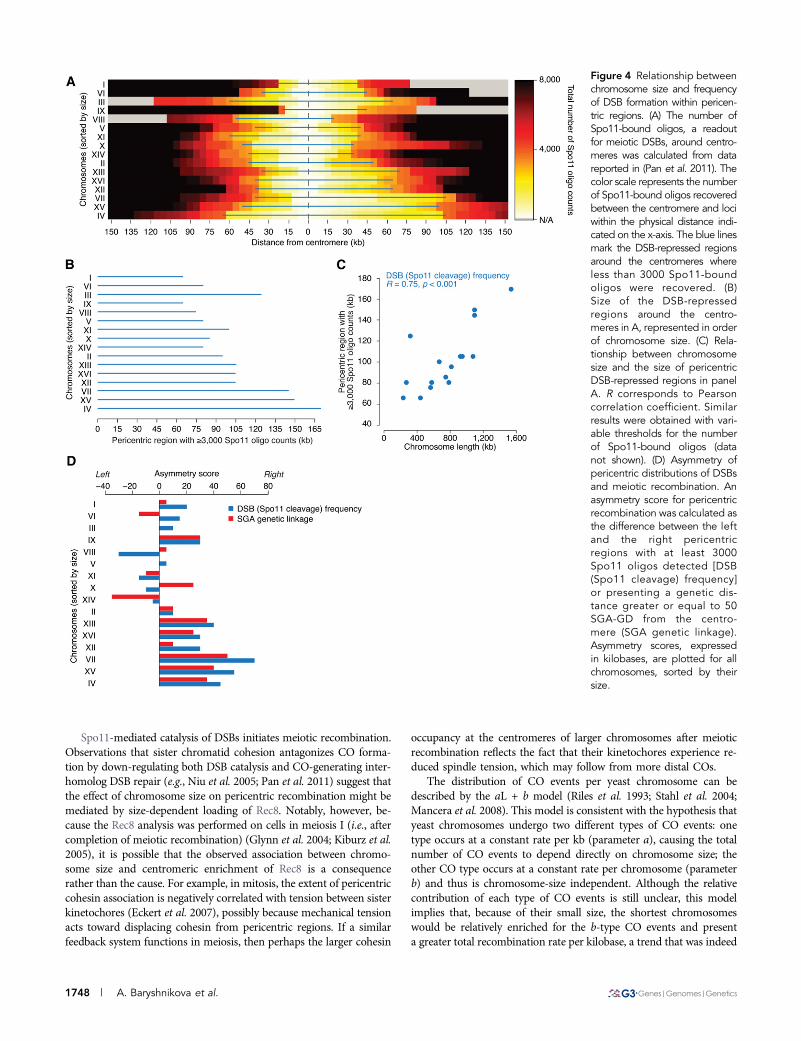
Negative correlation between chromosome size andlevels of pericentric DSBsMeiotic recombination begins with programmed catalysis of DNAdouble-strand breaks (DSBs) by Spo11, an evolutionarily conservedtype II topoisomerase-like endonuclease (Bergerat et al. 1997; Keeneyet al. 1997). Genome-wide distributions of DSBs and COs exhibita strong correlation (Figure S4) (Chen et al. 2008; Mancera et al.2008; Pan et al. 2011). Moreover, similarly to COs, DSBs are repressednear centromeres (Gerton et al. 2000; Buhler et al. 2007; Pan et al.2011). To test whether the DSB repression might also be related tochromosome size, we examined the genome-wide DSB map based onhigh-throughput sequencing of short Spo11-bound oligonucleotides(Spo11-oligos), a byproduct of an early step in meiotic DSB repair andan established readout for the occurrence of a DSB (Pan et al. 2011).We found that, similarly to the suppression of recombination fre-quency, the extent of DSB suppression around centromeres appearsto be directly proportional to chromosome size (Figure 4). For in-stance, in order to observe the same number of Spo11-oligos betweentwo trans-loci spanning the centromere, their physical distance mustbe greater on larger chromosomes compared to smaller ones (R =0.75; p , 0.001; Figure 4, B and C).
The aforementioned analyses suggest that chromosome sizemay regulate both frequencies of meiotic DSBs and COs around
Volume 3 October 2013 | Pericentric Recombination and Chromosome Size in Yeast | 1745

centromeres. Nevertheless, we observed some exceptional caseswhere a previously mapped DSB hotspot occurred within a pericentriclinkage region (Figure S1), consistent with the fact that not all meioticDSBs are repaired via the CO-generating inter-homolog repair path-way (Schwacha and Kleckner 1994). We also found that pericentriclinkage regions were often asymmetrical with respect to DSB fre-quency, as well as linkage intensity (Figure 2A; Figure S1; Figure4D), suggesting that chromosome size and distance from the centro-mere are not the only factors determining the frequency of meioticDSB catalysis and/or the manner in which these breaks are repaired.
Positive correlation between chromosome size andpericentric association of meiotic cohesin subunit Rec8Chromatin structure regulates both the formation and repair ofmeiotic DSBs. Of particular interest in the current context is the statusof sister chromatid cohesion, which impacts both processes. Specif-ically, occurrence of meiotic DSBs is confined within the regions thatare devoid of cohesin molecules, referred to as chromatin loops (Blatand Kleckner 1999). Sister chromatid cohesion also antagonizes COs,generating interhomolog DSB repair by favoring an alternativeintersister repair pathway (e.g., Niu et al. 2005). Combining theseconsiderations with the fact that cohesin molecules are enrichedat centromeres (Glynn et al. 2004; Kiburz et al. 2005) raised the
possibility that the effect of chromosome size might be linked tocohesin association at centromeres. To explore this possibility, weexamined the relationship between chromosome size and the extentof centromere-associated clustering of Rec8, an evolutionary con-served meiotic subunit of the multiprotein cohesin complex. Wefound that the width of Rec8 centromere-binding peak, measuredfrom two different genome-wide surveys of Rec8 distribution duringmeiotic metaphase/anaphase (Glynn et al. 2004; Kiburz et al. 2005),correlates with chromosome size (R = 0.75 and R = 0.67, respec-tively, Figure 5, A and B and the section Materials and Methods). Incontrast, for mitotic cohesion, the centromere association of Mcd1/Scc1 does not show size dependent variation (Figure 5C), suggestingthat the size dependence might be specific to meiotic centromerefunction.
DISCUSSIONMeiosis is a specialized cell division program, during which a singleround of genome replication is followed by two successive rounds ofgenome segregation. During the first meiotic division (meiosis I) sisterchromatids remain associated with one another, whereas homologssegregate to opposite poles. The accuracy of this process depends onthe persistent centromeric cohesion and the formation of interhomo-log COs, which facilitate homolog alignment, orientation and bipolar
Figure 2 Pericentric linkageand chromosome size depen-dent recombination rates inlinkage map based on SGAanalysis. (A) The genetic link-age map of chromosome VIand part of chromosome XV.The horizontal and the verticalaxes represent chromosomalcoordinates; a third dimen-sion indicating the SGA-GDbetween the correspondingchromosomal regions is rep-resented by the intensity ofcolor of each point in theimage (Materials and Meth-ods). The two chromosomesare drawn to scale. The greendot labeled as “Recombina-tion hotpot” indicates the po-sition of the most active DSBhotspot on chromosome VI,as reported previously (Panet al. 2011). (B) Relationshipbetween total physical andtotal genetic length of yeastchromosomes. Each data pointcorresponds to a chromosome.The total estimated geneticlength of a chromosome (SGA-GD) was calculated from thephysical length (kilobases) andthe average SGA-GD/kb ratio ofeach chromosome. The defini-tion of SGA-GD is described inthe section Materials and Meth-ods. The red line and the associ-ated equation correspond toa linear fit to the data.
1746 | A. Baryshnikova et al.

attachment to the meiotic spindle (Bishop and Zickler 2004; Pinskyand Biggins 2005).
Frequency and positioning of COs impact chromosome segrega-tion because COs that are too distal from centromeres are not aseffective in facilitating bipolar attachment (Koehler et al. 1996; Rosset al. 1996; Lacefield and Murray 2007), whereas COs that are tooclose to centromeres can lead to precocious separation of sister chro-matids (Rockmill et al. 2006). Indeed, centromere proximal CO for-mation is reduced in many organisms (Brar and Amon 2008) andmay represent a general mode of regulating the fidelity of meioticchromosome segregation (Rockmill et al. 2006; Chen et al. 2008). Inhumans, failure to form COs or their abnormal distribution causeaneuploidies and severe congenital conditions such as Down syn-drome (Hassold et al. 2007).
Here, we show that colony size data associated with linked genepairs can be used to build accurate maps of meiotic recombinationthroughout the yeast genome. Our study differs from previous genomicanalysis of meiotic recombination in that we obtained our data from anisogenic strain, rather than a hybrid carrying alleles of two divergentgenetic backgrounds (Chen et al. 2008; Mancera et al. 2008). Our resultsconfirm previous findings that: (1) the total number of CO events perchromosome increases with chromosome size, (2) the number of COsper unit length is greater in shorter chromosomes than longer ones, and(3) meiotic recombination occurs at lower frequencies in the vicinity ofcentromeres. We also present a previously unappreciated relationshipbetween chromosome size and meiotic recombination, where chromo-some size shows a negative correlation with pericentric CO density andDSB frequency, but a positive correlation with Rec8 association.
Figure 3 Relationship betweenchromosome size and meioticrecombination around centro-meres. (A–B) Distribution of es-timated genetic distances forgene pairs located at a rangeof physical distances. Genepairs located on the same chro-mosome (ordered by chromo-some size and listed on they-axis) were grouped accordingto their physical distance(x-axis). Within each group, ge-netic distances were averagedand visualized as a heatmap,where brighter colors corre-spond to shorter genetic distan-ces and stronger linkage. Genepairs located on the same sideof the centromere (cis; A) or onopposite sides of the centro-mere (trans; B) were analyzedseparately. Data for gene pairsspanning the centromere onchromosome V were not avail-able due to the experimentalconstraints of the SGA method(Materials and Methods). Thedotted line indicates the aver-age genetic distance (35 kb) ofunlinked loci (50 SGA-GD)(Figure 1D and the sectionMaterials and Methods). (C) Re-lationship between chromo-some size and the shortestphysical distance between twounlinked loci, positioned onthe same (cis) or on oppositesides (trans) of the centromere.Each data point corresponds toa chromosome. Data for trans-centromere gene pairs on chro-mosome V were not availabledue to the experimental con-straints of the SGA method(Materials and Methods). R cor-
responds to Pearson correlation coefficient. (D) The shortest physical distance between two unlinked loci, positioned on opposite sides of thecentromere, was calculated for each chromosome using the genetic map downloaded from the Saccharomyces Genome Database (Cherry et al.2012), and plotted against chromosome length. R corresponds to Pearson correlation coefficient.
Volume 3 October 2013 | Pericentric Recombination and Chromosome Size in Yeast | 1747
Spo11-mediated catalysis of DSBs initiates meiotic recombination.Observations that sister chromatid cohesion antagonizes CO forma-tion by down-regulating both DSB catalysis and CO-generating inter-homolog DSB repair (e.g., Niu et al. 2005; Pan et al. 2011) suggest thatthe effect of chromosome size on pericentric recombination might bemediated by size-dependent loading of Rec8. Notably, however, be-cause the Rec8 analysis was performed on cells in meiosis I (i.e., aftercompletion of meiotic recombination) (Glynn et al. 2004; Kiburz et al.2005), it is possible that the observed association between chromo-some size and centromeric enrichment of Rec8 is a consequencerather than the cause. For example, in mitosis, the extent of pericentriccohesin association is negatively correlated with tension between sisterkinetochores (Eckert et al. 2007), possibly because mechanical tensionacts toward displacing cohesin from pericentric regions. If a similarfeedback system functions in meiosis, then perhaps the larger cohesin
occupancy at the centromeres of larger chromosomes after meioticrecombination reflects the fact that their kinetochores experience re-duced spindle tension, which may follow from more distal COs.
The distribution of CO events per yeast chromosome can bedescribed by the aL + b model (Riles et al. 1993; Stahl et al. 2004;Mancera et al. 2008). This model is consistent with the hypothesis thatyeast chromosomes undergo two different types of CO events: onetype occurs at a constant rate per kb (parameter a), causing the totalnumber of CO events to depend directly on chromosome size; theother CO type occurs at a constant rate per chromosome (parameterb) and thus is chromosome-size independent. Although the relativecontribution of each type of CO events is still unclear, this modelimplies that, because of their small size, the shortest chromosomeswould be relatively enriched for the b-type CO events and presenta greater total recombination rate per kilobase, a trend that was indeed
Figure 4 Relationship betweenchromosome size and frequencyof DSB formation within pericen-tric regions. (A) The number ofSpo11-bound oligos, a readoutfor meiotic DSBs, around centro-meres was calculated from datareported in (Pan et al. 2011). Thecolor scale represents the numberof Spo11-bound oligos recoveredbetween the centromere and lociwithin the physical distance indi-cated on the x-axis. The blue linesmark the DSB-repressed regionsaround the centromeres whereless than 3000 Spo11-boundoligos were recovered. (B)Size of the DSB-repressedregions around the centro-meres in A, represented in orderof chromosome size. (C) Rela-tionship between chromosomesize and the size of pericentricDSB-repressed regions in panelA. R corresponds to Pearsoncorrelation coefficient. Similarresults were obtained with vari-able thresholds for the numberof Spo11-bound oligos (datanot shown). (D) Asymmetry ofpericentric distributions of DSBsand meiotic recombination. Anasymmetry score for pericentricrecombination was calculated asthe difference between the leftand the right pericentricregions with at least 3000Spo11 oligos detected [DSB(Spo11 cleavage) frequency]or presenting a genetic dis-tance greater or equal to 50SGA-GD from the centro-mere (SGA genetic linkage).Asymmetry scores, expressedin kilobases, are plotted for allchromosomes, sorted by theirsize.
1748 | A. Baryshnikova et al.

observed by earlier studies (Kaback et al. 1992; Riles et al. 1993;Kaback et al. 1999; Stahl et al. 2004; Mancera et al. 2008; Pan et al.2011; Cherry et al. 2012). It would be reasonable to speculate that thechromosome size-independent b-type CO may correspond to the so-called “obligate” CO (Jones 1987), which ensures that even the smallestpossible chromosome, which would consist of just a centromere and twotelomeres, undergoes at least one physical exchange with its homolog.This obligate physical exchange would be required to tether homologstogether and facilitate their bi-orientation with respect to the spindle,thus ensuring proper chromosome alignment and segregation (Bishopand Zickler 2004; Pinsky and Biggins 2005). Because segregation isimpaired when COs occur too close or too far from the centromere(Koehler et al. 1996; Ross et al. 1996; Rockmill et al. 2006; Lacefield andMurray 2007), the centromere may play a role in determining thepositioning of the obligate CO. This centromere function may be par-ticularly relevant in humans where unregulated recombination near cen-tromeres leads to aneuploidy and severe developmental abnormalities,including Down syndrome (Hassold et al. 2007). Importantly, a recentanalysis of the human genome-wide recombination map showed that,similarly to yeast, the total number of CO events per chromosomefollows the aL + b model, where b � 1 (Fledel-Alon et al. 2009).
The relationship between chromosome size and the extent ofpericentric linkage and Rec8 enrichment is likely to be linked to anessential requirement that centromeric cohesion remains intact duringthe first meiosis (Brar and Amon 2008). Indeed, budding yeast zip1mutants that are impaired in centromeric cohesin loading displaypromiscuous recombination in the vicinity of their centromeres (Chenet al. 2008; Bardhan et al. 2010), suggesting a mechanistic link be-tween meiotic centromere function and suppression of pericentricrecombination. Here, we provide further evidence for such a link.In addition, we show that chromosome size itself might regulate bothpericentric recombination and meiotic centromere function.
Interestingly, in yeast Saccharomyces cerevisiae the inactivation ofthe spindle checkpoint causes larger chromosomes to missegregatemore often than smaller chromosomes (Shonn et al. 2000; Lacefieldand Murray 2007). Because an essential function of the spindle check-point is to monitor bipolar attachment of chromosomes (Pinsky andBiggins 2005), this finding suggests that chromosome size may impactthe efficacy of homolog biorientation. For example, COs may tend tooccur further away from the centromere of larger chromosomes lead-ing to a defect in spindle attachment (Shonn et al. 2000; Lacefield andMurray 2007). This observation is particularly intriguing because all
Figure 5 Relationship betweenchromosome size and the ex-tent of the centromere-associatedclustering of Rec8 and Mcd1/Scc1. (A, B) Positive correlationbetween chromosome size andthe meiotic cohesin componentRec8. Quantitative profiles ofRec8 binding at 4 hr (A) and5 hr (B) after the initiation ofmeiosis, corresponding to mei-otic metaphase/anaphase, wereobtained from Glynn et al.(2004) and Kiburz et al. (2005),respectively (Materials andMethods). Each data point cor-responds to a chromosome.R corresponds to Pearson corre-lation coefficient. The correla-tion is apparent in the twoindependent studies despitethe noticeable differences inthe sizes of the centromereclusters of Rec8, likely reflectingdifferences in data collectionand/or analyses. (C) Relation-ship between chromosome sizeand the extent of centromere-associated clustering of the mi-totic cohesin component Mcd1/Scc1 in metaphase arrested cells(Glynn et al. 2004).
Volume 3 October 2013 | Pericentric Recombination and Chromosome Size in Yeast | 1749

budding yeast centromeres appear to have the same point structure(Brar and Amon 2008).
There is a precedent for size-dependent loading of chromosomal-bound proteins: the extent of Smc5/Smc6 loading during mitotic S-phase is chromosome size dependent, and is proposed to be controlledby a chromosome structure-based mechanism (Kegel et al. 2011). It ispossible that the structural properties of larger chromosomes maydiffer from those of smaller chromosomes and may control Rec8loading at centromeres. Indeed, analysis of early Rec8 loading at theonset of meiotic S-phase suggests a positive correlation between chro-mosome size and the initial pericentric clustering of Rec8 (Figure S6).Regardless of the mechanism, our data points to the evolution ofa balanced system, where the need to exclude COs from centromeresto ensure sister centromere cohesion and homolog centromere pairingcreates a tendency for incorrect kinetochore-spindle attachment that issubsequently corrected by the spindle checkpoint (Shonn et al. 2000;Lacefield and Murray 2007).
ACKNOWLEDGMENTSWe thank Eric Foss for providing comments on the manuscript. Thiswork was supported by National Institutes of Health grants1R01HG005853-01 and 1R01HG005084-01A1 to C.B., B.A., andC.L.M, Canadian Institutes of Health Research grants MOP-102629,MOP-97939 and MOP-57830 to C.B., an Ontario Research Fundgrant GL2-01-22 to C.B. The funders had no role in study design,data collection and analysis, decision to publish, or preparation ofthe manuscript.
LITERATURE CITEDBardhan, A., H. Chuong, and D. S. Dawson, 2010 Meiotic cohesin pro-
motes pairing of nonhomologous centromeres in early meiotic prophase.Mol. Biol. Cell 21: 1799–1809.
Baryshnikova, A., M. Costanzo, S. Dixon, F. J. Vizeacoumar, C. L. Myerset al., 2010a Synthetic genetic array (SGA) analysis in Saccharomycescerevisiae and Schizosaccharomyces pombe. Methods Enzymol. 470:145–179.
Baryshnikova, A., M. Costanzo, Y. Kim, H. Ding, J. Koh et al.,2010b Quantitative analysis of fitness and genetic interactions inyeast on a genome scale. Nat. Methods 7: 1017–1024.
Baudat, F., and A. Nicolas, 1997 Clustering of meiotic double-strand breakson yeast chromosome III. Proc. Natl. Acad. Sci. USA 94: 5213–5218.
Bergerat, A., B. De Massy, D. Gadelle, P. C. Varoutas, A. Nicolas et al.,1997 An atypical topoisomerase II from Archaea with implications formeiotic recombination. Nature 386: 414–417.
Bishop, D. K., and D. Zickler, 2004 Early decision; meiotic crossover in-terference prior to stable strand exchange and synapsis. Cell 117: 9–15.
Blat, Y., and N. Kleckner, 1999 Cohesins bind to preferential sites alongyeast chromosome III, with differential regulation along arms vs. thecentric region. Cell 98: 249–259.
Blitzblau, H. G., G. W. Bell, J. Rodriguez, S. P. Bell, and A. Hochwagen,2007 Mapping of meiotic single-stranded DNA reveals double-stranded-break hotspots near centromeres and telomeres. Curr. Biol. 17:2003–2012.
Borde, V., W. Lin, E. Novikov, J. H. Petrini, M. Lichten et al.,2004 Association of Mre11p with double-strand break sites during yeastmeiosis. Mol. Cell 13: 389–401.
Brar, G. A., and A. Amon, 2008 Emerging roles for centromeres in meiosis Ichromosome segregation. Nat. Rev. Genet. 9: 899–910.
Buhler, C., V. Borde, and M. Lichten, 2007 Mapping meiotic single-strandDNA reveals a new landscape of DNA double-strand breaks in Saccharomycescerevisiae. PLoS Biol. 5: e324.
Chen, S. Y., T. Tsubouchi, B. Rockmill, J. S. Sandler, D. R. Richards et al.,2008 Global analysis of the meiotic crossover landscape. Dev. Cell 15:401–415.
Cherry, J. M., E. L. Hong, C. Amundsen, R. Balakrishnan, G. Binkley et al.,2012 Saccharomyces Genome Database: the genomics resource ofbudding yeast. Nucleic Acids Res. 40: D700–D705.
Collins, S. R., M. Schuldiner, N. J. Krogan, and J. S. Weissman, 2006 Astrategy for extracting and analyzing large-scale quantitative epistaticinteraction data. Genome Biol. 7: R63.
Costanzo, M., A. Baryshnikova, J. Bellay, Y. Kim, E. D. Spear et al.,2010 The genetic landscape of a cell. Science 327: 425–431.
Eckert, C. A., D. J. Gravdahl, and P. C. Megee, 2007 The enhancement ofpericentromeric cohesin association by conserved kinetochore compo-nents promotes high-fidelity chromosome segregation and is sensitiveto microtubule-based tension. Genes Dev. 21: 278–291.
Fledel-Alon, A., D. J. Wilson, K. Broman, X. Wen, C. Ober et al.,2009 Broad-scale recombination patterns underlying proper disjunctionin humans. PLoS Genet. 5: e1000658.
Gerton, J. L., J. Derisi, R. Shroff, M. Lichten, P. O. Brown et al., 2000 Globalmapping of meiotic recombination hotspots and coldspots in the yeastSaccharomyces cerevisiae. Proc. Natl. Acad. Sci. USA 97: 11383–11390.
Glynn, E. F., P. C. Megee, H. G. Yu, C. Mistrot, E. Unal et al., 2004 Genome-wide mapping of the cohesin complex in the yeast Saccharomyces cerevisiae.PLoS Biol. 2: E259.
Griffiths, A. J. F., J. H. Miller, D. T. Suzuki, R. C. Lewontin, and W. M.Gelbart, 2000 Accurate calculation of large map distances, An Intro-duction to Genetic Analysis, Ed. 7. W. H. Freeman, New York.
Hartl, D. L., and E. W. Jones, 2009 Genetics. Analysis of Genes andGenomes, Ed. VII. Jones and Bartlett Publishers, Sudbury, MA.
Hassold, T., H. Hall, and P. Hunt, 2007 The origin of human aneuploidy:where we have been, where we are going. Human Mol. Genet. 16(SpecNo. 2): R203–208.
Jones, G. H., 1987 Chiasmata, pp. 213–244 in Meiosis, edited by P. B.Moens. Academic Press, Orlando, FL.
Kaback, D. B., 1996 Chromosome-size dependent control of meiotic re-combination in humans. Nat. Genet. 13: 20–21.
Kaback, D. B., V. Guacci, D. Barber, and J. W. Mahon, 1992 Chromosomesize-dependent control of meiotic recombination. Science 256: 228–232.
Kaback, D. B., D. Barber, J. Mahon, J. Lamb, and J. You, 1999 Chromosomesize-dependent control of meiotic reciprocal recombination inSaccharomyces cerevisiae: the role of crossover interference. Genetics 152:1475–1486.
Keeney, S., C. N. Giroux, and N. Kleckner, 1997 Meiosis-specific DNAdouble-strand breaks are catalyzed by Spo11, a member of a widelyconserved protein family. Cell 88: 375–384.
Kegel, A., H. Betts-Lindroos, T. Kanno, K. Jeppsson, L. Strom et al.,2011 Chromosome length influences replication-induced topologicalstress. Nature 471: 392–396.
Kiburz, B. M., D. B. Reynolds, P. C. Megee, A. L. Marston, B. H. Lee et al.,2005 The core centromere and Sgo1 establish a 50-kb cohesin-protecteddomain around centromeres during meiosis I. Genes Dev. 19: 3017–3030.
Koehler, K. E., C. L. Boulton, H. E. Collins, R. L. French, K. C. Herman et al.,1996 Spontaneous X chromosome MI and MII nondisjunction eventsin Drosophila melanogaster oocytes have different recombinational his-tories. Nat. Genet. 14: 406–414.
Kugou, K., T. Fukuda, S. Yamada, M. Ito, H. Sasanuma et al., 2009 Rec8guides canonical Spo11 distribution along yeast meiotic chromosomes.Mol. Biol. Cell 20: 3064–3076.
Lacefield, S., and A. W. Murray, 2007 The spindle checkpoint rescues themeiotic segregation of chromosomes whose crossovers are far from thecentromere. Nat. Genet. 39: 1273–1277.
Lichten, M., and A. S. Goldman, 1995 Meiotic recombination hotspots.Annu. Rev. Genet. 29: 423–444.
Mancera, E., R. Bourgon, A. Brozzi, W. Huber, and L. M. Steinmetz,2008 High-resolution mapping of meiotic crossovers and non-crossoversin yeast. Nature 454: 479–485.
Morton, N. E., 2004 History of genetic mapping, pp. X-X, in Encyclopediaof Genetics, Genomics, Proteomics and Bioinformatics. John Wiley & Sons,New York.
1750 | A. Baryshnikova et al.

Niu, H., L. Wan, B. Baumgartner, D. Schaefer, J. Loidl et al., 2005 Partnerchoice during meiosis is regulated by Hop1-promoted dimerization ofMek1. Mol. Biol. Cell 16: 5804–5818.
Pan, J., M. Sasaki, R. Kniewel, H. Murakami, H. G. Blitzblau et al., 2011 Ahierarchical combination of factors shapes the genome-wide topographyof yeast meiotic recombination initiation. Cell 144: 719–731.
Pinsky, B. A., and S. Biggins, 2005 The spindle checkpoint: tension vs.attachment. Trends Cell Biol. 15: 486–493.
Riles, L., J. E. Dutchik, A. Baktha, B. K. Mccauley, E. C. Thayer et al.,1993 Physical maps of the six smallest chromosomes of Saccharomycescerevisiae at a resolution of 2.6 kilobase pairs. Genetics 134:81–150.
Rockmill, B., K. Voelkel-Meiman, and G. S. Roeder, 2006 Centromere-proximal crossovers are associated with precocious separation of sisterchromatids during meiosis in Saccharomyces cerevisiae. Genetics 174:1745–1754.
Ross, L. O., R. Maxfield, and D. Dawson, 1996 Exchanges are not equallyable to enhance meiotic chromosome segregation in yeast. Proc. Natl.Acad. Sci. USA 93: 4979–4983.
Schwacha, A., and N. Kleckner, 1994 Identification of joint molecules thatform frequently between homologs but rarely between sister chromatidsduring yeast meiosis. Cell 76: 51–63.
Shonn, M. A., R. Mccarroll, and A. W. Murray, 2000 Requirement of thespindle checkpoint for proper chromosome segregation in budding yeastmeiosis. Science 289: 300–303.
Stahl, F. W., H. M. Foss, L. S. Young, R. H. Borts, M. F. Abdullah et al.,2004 Does crossover interference count in Saccharomyces cerevisiae?Genetics 168: 35–48.
Sturtevant, A. H., 1913 A linear arrangement of six sex-linked factors inDrosophila, as shown by their mode of association. J. Exp. Zool. 14: 43–59.
Communicating editor: N. Hunter
Volume 3 October 2013 | Pericentric Recombination and Chromosome Size in Yeast | 1751