Embed Size (px)
Citation preview
GLOBALER MILITARISIERUNGSINDEX 2017
MAX M. MUTSCHLER \ BICC
GLOBAL
MILITARISATION INDEX 2019
Max M. Mutschler, Marius Bales \ BICC
GLOBAL MILITARISATION INDEX 2019 \ MAX M. MUTSCHLER, MARIUS BALES
BICC \ 2 \
SUMMARY
Every year, BICC’s Global Militarisation Index (gmi) presents the relative weight and importance of a country’s military apparatus in relation to its soci-ety as a whole. The GMI 2019 covers 154 states and is based on the latest available figures (in most cases data for 2018). The index project is financially supported by Germany’s Federal Ministry for Economic Cooperation and Development.
In this year’s GMI ranking, the ten countries that provided the military with markedly large amounts of resources in relation to other areas of society are Israel, Singapore, Armenia, Cyprus, South Korea, Russia, Greece, Jordan, Belarus and Azerbaijan.
The authors Max Mutschler and Marius Bales put the regional focus of the GMI 2019 on Europe (eastern Europe / NATO and EU countries), the Middle East and Asia. Russia (position 6) continues to sustain one of the largest military forces in the world. The European NATO countries, especially Baltic and eastern European states, are again continuing to arm themselves pointing to ongoing tensions with Russia. The unresolved secessionist conflict between Armenia (position 3) and Azerbaijan (position 10) over the Nagorno-Karabakh region cont-inues to keep militarisation in the South Caucasus at a very high level. The coun-tries in the Middle East are all highly militarised by global standards. In view of the tense security situation, Israel (position 1) is again at the top of the global ranking in 2019. The list of highly militarised countries in Asia is headed, as in previous years, by Singapore (position 2). In absolute figures, China (position 94) invests most in its armed forces in a regional comparison. Other countries in the region are also increasingly investing in their armed forces, citing the various conflicts with China.
Finally, this year’s GMI looks at the link between militarisation and fragility. A comparison of the GMI with the typology of fragility constellations drawn up by the Constellations of State Fragility Project of the German Development Institute (gdi) points, for example, to a connection between the very low level of milita-risation of a country and its limited ability to provide pivotal state-run services for its citizens. Conversely, however, this does not mean that the highest possible level of militarisation is desirable. For example, among the very highly militarised countries, there are a strikingly high number of countries that score poorly on the fragility dimension of legitimacy.
BICC \ 3 \
GLOBAL MILITARISATION INDEX 2019 \ MAX M. MUTSCHLER, MARIUS BALES
CONTENTS
Summary 2The methodology of the Global Militarisation Index (gmi) 4
BICC GMI 2019 5The Top 10 5
Focus on regional militarisation 6Eastern Europe 6NATO and EU-countries 6Middle East 7Asia 8
Militarisation and state fragility 10
GMI World Map 12Militarisation Index Ranking 14Imprint 15
THE METHODOLOGY OF THE GLOBAL MILITARISATION INDEX (GMI)
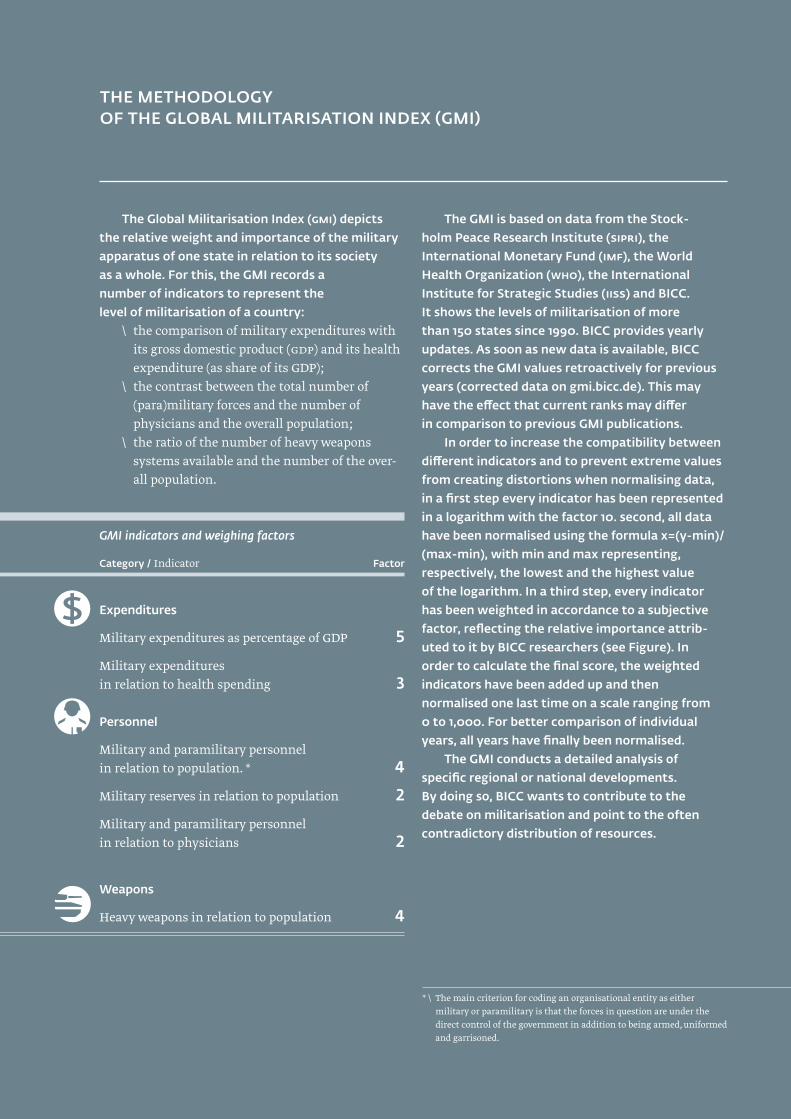
The Global Militarisation Index (gmi) depicts the relative weight and importance of the military apparatus of one state in relation to its society as a whole. For this, the GMI records a number of indicators to represent the level of militarisation of a country:
\ the comparison of military expenditures with its gross domestic product (GDP) and its health expenditure (as share of its GDP);
\ the contrast between the total number of (para)military forces and the number of physicians and the overall population;
\ the ratio of the number of heavy weapons systems available and the number of the over-all population.
The GMI is based on data from the Stock-holm Peace Research Institute (sipri), the International Monetary Fund (imf), the World Health Organization (who), the International Institute for Strategic Studies (iiss) and BICC. It shows the levels of militarisation of more than 150 states since 1990. BICC provides yearly updates. As soon as new data is available, BICC corrects the GMI values retroactively for previous years (corrected data on gmi.bicc.de). This may have the effect that current ranks may differ in comparison to previous GMI publications.
In order to increase the compatibility between different indicators and to prevent extreme values from creating distortions when normalising data, in a first step every indicator has been represented in a logarithm with the factor 10. second, all data have been normalised using the formula x=(y-min)/ (max-min), with min and max representing, respectively, the lowest and the highest value of the logarithm. In a third step, every indicator has been weighted in accordance to a subjective factor, reflecting the relative importance attrib-uted to it by BICC researchers (see Figure). In order to calculate the final score, the weighted indicators have been added up and then normalised one last time on a scale ranging from 0 to 1,000. For better comparison of individual years, all years have finally been normalised.
The GMI conducts a detailed analysis of specific regional or national developments. By doing so, BICC wants to contribute to the debate on militarisation and point to the often contradictory distribution of resources.
* \ The main criterion for coding an organisational entity as either military or paramilitary is that the forces in question are under the direct control of the government in addition to being armed, uniformed and garrisoned.
GMI indicators and weighing factors
Category / Indicator Factor
Expenditures
Military expenditures as percentage of GDP 5
Military expenditures in relation to health spending 3
Personnel
Military and paramilitary personnelin relation to population. * 4
Military reserves in relation to population 2
Military and paramilitary personnelin relation to physicians 2
Weapons
Heavy weapons in relation to population 4
BICC \ 5 \
GLOBAL MILITARISATION INDEX 2019 \ MAX M. MUTSCHLER, MARIUS BALES
BICC GMI 2019
Regional and internal conflicts drive global mil-itarisation. But the resources available to the entire society and the different perceptions of threats also play a role when countries are making decisions on how much to invest in their national military. The Global Militarisation Index (GMI) illustrates the results of these complex processes by determining the relative weight of the military apparatus of a country’s military in relation to its society as a whole. At the same time, the GMI deliberately distances itself from the normative assumption that a high allocation of resources for the benefit of the military is always an overemphasis on the military—with negative conse-quences for the overall development of society in the countries affected, and for international security.
Nevertheless, based on the findings of the GMI, certain normative statements on militarisation can be made. This also applies to the connection between militarisation and fragility, at which this year’s GMI takes a closer look (\ > page 10). A comparison of the GMI with the typology of fragility constellations drawn up for the Constellations of State Fragility Project of the German Development Institute (GDI) points to a correlation between a particularly low level of militarisation of a state and a poor ability to provide central state services for its citizens. Con-versely, this does not mean that the highest possible level of militarisation is desirable: It is first and fore-most among the very highly militarised countries that we find many which perform badly with regard to the fragility dimension of legitimacy.
In the following text, the GMI 2019 presents and analyses selected trends in militarisation. Most of the data analysed relates to the year 2018.
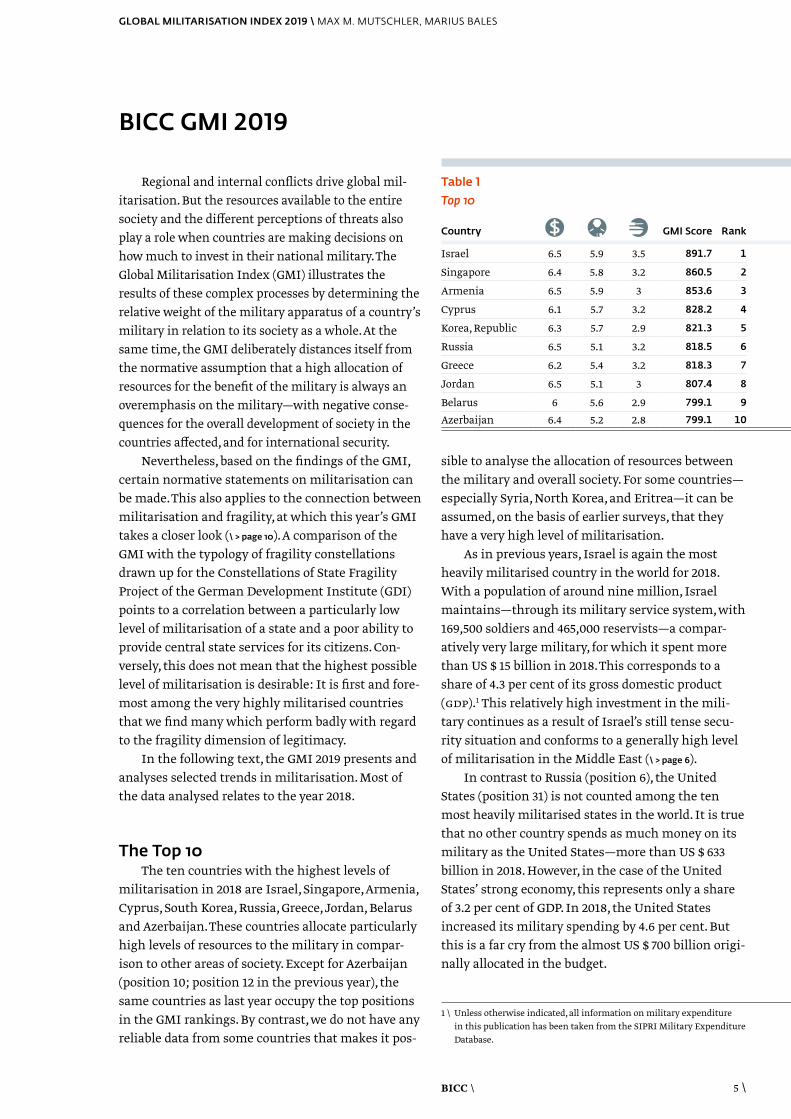
The Top 10The ten countries with the highest levels of
militarisation in 2018 are Israel, Singapore, Armenia, Cyprus, South Korea, Russia, Greece, Jordan, Belarus and Azerbaijan. These countries allocate particularly high levels of resources to the military in compar-ison to other areas of society. Except for Azerbaijan (position 10; position 12 in the previous year), the same countries as last year occupy the top positions in the GMI rankings. By contrast, we do not have any reliable data from some countries that makes it pos-
sible to analyse the allocation of resources between the military and overall society. For some countries—especially Syria, North Korea, and Eritrea—it can be assumed, on the basis of earlier surveys, that they have a very high level of militarisation.
As in previous years, Israel is again the most heavily militarised country in the world for 2018. With a population of around nine million, Israel maintains—through its military service system, with 169,500 soldiers and 465,000 reservists—a compar-atively very large military, for which it spent more than US $ 15 billion in 2018. This corresponds to a share of 4.3 per cent of its gross domestic product (gdp).1 This relatively high investment in the mili-tary continues as a result of Israel’s still tense secu-rity situation and conforms to a generally high level of militarisation in the Middle East (\ > page 6).
In contrast to Russia (position 6), the United States (position 31) is not counted among the ten most heavily militarised states in the world. It is true that no other country spends as much money on its military as the United States—more than US $ 633 billion in 2018. However, in the case of the United States’ strong economy, this represents only a share of 3.2 per cent of GDP. In 2018, the United States increased its military spending by 4.6 per cent. But this is a far cry from the almost US $ 700 billion origi-nally allocated in the budget.
1 \ Unless otherwise indicated, all information on military expenditure in this publication has been taken from the SIPRI Military Expenditure Database.
Table 1Top 10
Country Ausgaben Personal Waffen GMI Score Rank
Israel 6.5 5.9 3.5 891.7 1
Singapore 6.4 5.8 3.2 860.5 2
Armenia 6.5 5.9 3 853.6 3
Cyprus 6.1 5.7 3.2 828.2 4
Korea, Republic 6.3 5.7 2.9 821.3 5
Russia 6.5 5.1 3.2 818.5 6
Greece 6.2 5.4 3.2 818.3 7
Jordan 6.5 5.1 3 807.4 8
Belarus 6 5.6 2.9 799.1 9
Azerbaijan 6.4 5.2 2.8 799.1 10
GLOBAL MILITARISATION INDEX 2019 \ MAX M. MUTSCHLER, MARIUS BALES
BICC \ 6 \
and air force weapons systems, for which they have awarded various large-scale contracts to Russian weapons manufacturers. The result is rising military spending on both sides.
NATO and EU-countries
The NATO countries are again continuing their arms buildup, pointing to ongoing tensions with Russia. This is, in particular, the case in the Baltic and eastern European countries, which put consid-erable armaments programmes in place in 2018 and 2019. Poland (position 62) bought two Patriot missile defence systems and 20 mobile rocket launchers of the “HIMARS” type from the United States. It also plans to purchase 32 F 35-A multi-role combat aircraft as part of the ongoing “Harpia” procurement pro-gramme. Slovakia (position 92) ordered new F-16 jets. To modernise its army, Hungary (position 55) ordered, among other things, 44 new Leopard 2 tanks, 24 mod-ern self-propelled howitzers, 36 combat helicopters from Airbus as well as a new Samoc air defence system. Lithuania’s military spending (position 26; GMI 2018: position 32) and that of Latvia (position 44; GMI 2018: position 73) each increased from 1.7 (2018) to 2.0 per cent of its GDP. These countries also increased the number of military personnel signifi-cantly. Bulgaria and Romania are also modernising the equipment of their armies at the moment, which contributed to a considerable increase in their mili-
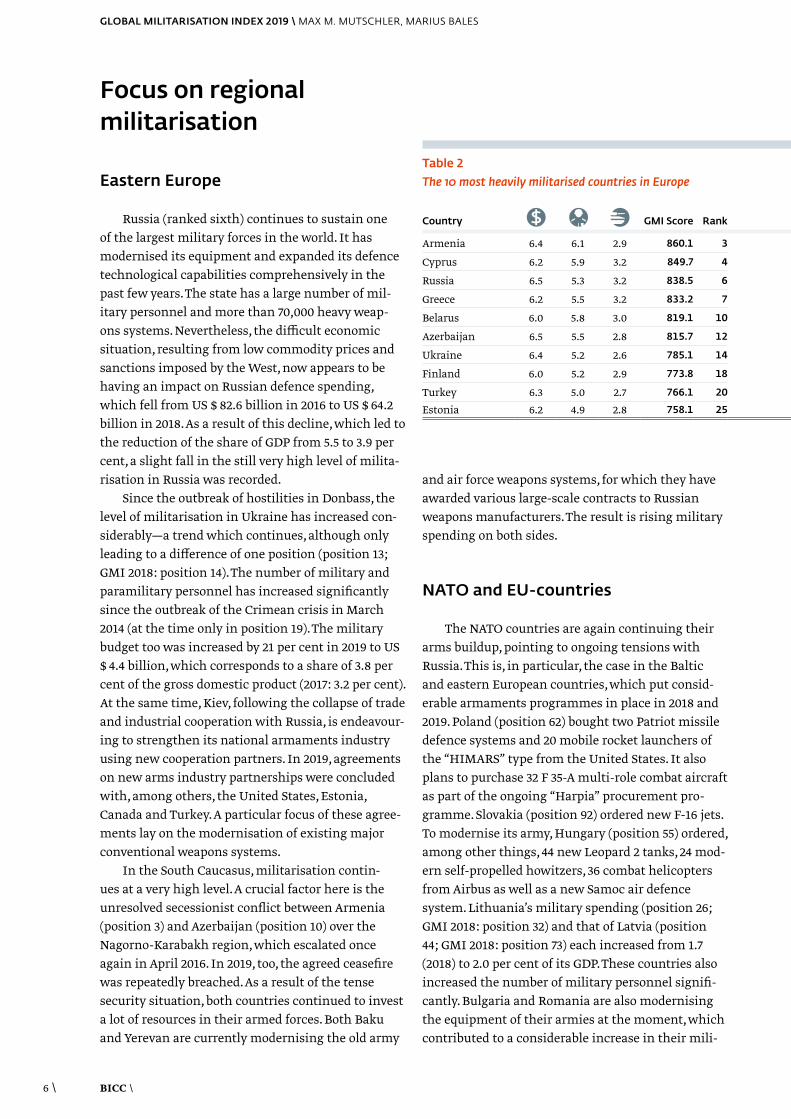
Table 2The 10 most heavily militarised countries in Europe
Country Ausgaben Personal Waffen GMI Score Rank
Armenia 6.4 6.1 2.9 860.1 3
Cyprus 6.2 5.9 3.2 849.7 4
Russia 6.5 5.3 3.2 838.5 6
Greece 6.2 5.5 3.2 833.2 7
Belarus 6.0 5.8 3.0 819.1 10
Azerbaijan 6.5 5.5 2.8 815.7 12
Ukraine 6.4 5.2 2.6 785.1 14
Finland 6.0 5.2 2.9 773.8 18
Turkey 6.3 5.0 2.7 766.1 20
Estonia 6.2 4.9 2.8 758.1 25
Focus on regional militarisation
Eastern Europe
Russia (ranked sixth) continues to sustain one of the largest military forces in the world. It has modernised its equipment and expanded its defence technological capabilities comprehensively in the past few years. The state has a large number of mil-itary personnel and more than 70,000 heavy weap-ons systems. Nevertheless, the difficult economic situation, resulting from low commodity prices and sanctions imposed by the West, now appears to be having an impact on Russian defence spending, which fell from US $ 82.6 billion in 2016 to US $ 64.2 billion in 2018. As a result of this decline, which led to the reduction of the share of GDP from 5.5 to 3.9 per cent, a slight fall in the still very high level of milita-risation in Russia was recorded.
Since the outbreak of hostilities in Donbass, the level of militarisation in Ukraine has increased con-siderably—a trend which continues, although only leading to a difference of one position (position 13; GMI 2018: position 14). The number of military and paramilitary personnel has increased significantly since the outbreak of the Crimean crisis in March 2014 (at the time only in position 19). The military budget too was increased by 21 per cent in 2019 to US $ 4.4 billion, which corresponds to a share of 3.8 per cent of the gross domestic product (2017: 3.2 per cent). At the same time, Kiev, following the collapse of trade and industrial cooperation with Russia, is endeavour-ing to strengthen its national armaments industry using new cooperation partners. In 2019, agreements on new arms industry partnerships were concluded with, among others, the United States, Estonia, Canada and Turkey. A particular focus of these agree-ments lay on the modernisation of existing major conventional weapons systems.
In the South Caucasus, militarisation contin-ues at a very high level. A crucial factor here is the unresolved secessionist conflict between Armenia (position 3) and Azerbaijan (position 10) over the Nagorno-Karabakh region, which escalated once again in April 2016. In 2019, too, the agreed ceasefire was repeatedly breached. As a result of the tense security situation, both countries continued to invest a lot of resources in their armed forces. Both Baku and Yerevan are currently modernising the old army
BICC \ 7 \
GLOBAL MILITARISATION INDEX 2019 \ MAX M. MUTSCHLER, MARIUS BALES
Middle East
The countries in the Middle East are highly mil-itarised by global standards. Except for Iraq (position 46), all countries in the region are among the 30 most heavily militarised countries in the world. But as a result of poor data, it is not possible to assign a GMI value to some countries in the region. Reliable data is missing—in some cases for years—on the military in Qatar, Syria, Yemen and the United Arab Emirates. We may assume, however, that the civil-war country of Syria, in particular, is heavily militarised. In the years before the start of the civil war in 2011, Syria was already one of the most heavily militarised countries in the world, ranking third in the global GMI.
The United Arab Emirates (UAE) have also invested a lot in their military apparatus in the past few years. 2 Between 2009 and 2014, the share of mili-tary spending as a percentage of GDP was invariably above five per cent. In absolute terms, this meant more than US $ 24 billion in 2014. The UAE invested a sizeable portion of this money in the purchase of the most modern weapons systems, the greater part of which are from the United States, but with some also coming from EU states like France. In total, the UAE ranked at seventh place among global arms importers between 2014 and 2018.3 Most recently, these weapons (in particular for the air force) were deployed as part of the military intervention in Yemen spearheaded by Saudi Arabia and the UAE.
Saudi Arabia has also been among the largest arms importers in the world over the years; in the period from 2014 to 2018, it even took first place among global weapons importers.4 According to the GMI (position 28), the country counts as one of the most highly militarised countries. The Kingdom did in fact slightly reduce its military expenditure in subsequent years due to falling oil prices, after hav-ing reached its zenith in 2015 at more than US $ 88 billion. But in 2018, Saudi Arabia invested more than US $ 65 billion, around 8.8 per cent of its GDP, in the
tarisation. Romania’s (position 29) military spending increased to 1.9 per cent of GDP (2018: 1.7 per cent), and Bulgaria (position 61; GMI 2018: 67), at 1.7 per cent, invested significantly more resources in its mil-itary in 2018 than the year before (1.4 per cent).
The rise that can be observed in the entire region is partly attributable to the increased pressure that US President Donald Trump is placing on the NATO partners regarding the sharing of costs within the alliance (two per cent target by 2024). Even in north-ern and western European countries, there has been an increase in militarisation, albeit somewhat weaker. Norway (position 32; GMI 2018: position 36) and Finland (position 17; GMI 2018: position 18) increased the number of their main battle tanks. Spain (position 82; GMI 2018: position 86) increased its arsenal of armoured personnel carriers by around 300. In France (position 53; GMI 2018: position 57), the number of army personnel increased by 2,000 soldiers, and in the reserve by an additional 4,000 reservists.
Germany moved to position 97 in the GMI 2019 and so retains a position in the midfield: It is true that at US $ 49.5 billion—in 2017 it was only US $ 45.3 billion—Germany does take eighth place globally for military spending. However, in light of the economic strength of the country, the share of GDP is a mod-erate 1.2 per cent, whereas the share of spending on health is 11.5 per cent of GDP. But in Germany too, a further increase in spending on arms is to be expected in the future. In the 2020 budget, more money is allocated for military operations abroad of the German Armed Forces (Bundeswehr), and for obligations as part of NATO. In 2019, the Bundeswehr received, among other things, a new F125 frigate, 45 infantry fighting vehicles, four Eurofighters and six A400M transport aircraft. About US $10 billion are intended to be invested in modernisation and new purchases in 2020. Among other things, acquisitions of a new transport helicopter and a new assault rifle are planned.
Country Ausgaben Personal Waffen GMI Score Rank
Armenia 6.4 6.1 2.9 860.1 3
Cyprus 6.2 5.9 3.2 849.7 4
Russia 6.5 5.3 3.2 838.5 6
Greece 6.2 5.5 3.2 833.2 7
Belarus 6.0 5.8 3.0 819.1 10
Azerbaijan 6.5 5.5 2.8 815.7 12
Ukraine 6.4 5.2 2.6 785.1 14
Finland 6.0 5.2 2.9 773.8 18
Turkey 6.3 5.0 2.7 766.1 20
Estonia 6.2 4.9 2.8 758.1 25
2 \ The last GMI-value for UAE was calculated for 2017 (position 28).3 \ SIPRI Arms Transfer Database, status: March 2019.4 \ SIPRI Arms Transfer Database, status: March 2019.
GLOBAL MILITARISATION INDEX 2019 \ MAX M. MUTSCHLER, MARIUS BALES
BICC \ 8 \
Asia
The list of the most highly militarised countries in Asia is still led, as in previous years, by Singapore (position 2). With more than 70,000 active soldiers and more than 300,000 reservists, the country main-tains a very large military measured in terms of its overall population of less than six million, includ-ing a relatively large number of modern heavy weapons systems. South Korea (position 5) lies in second place and has one of the most well-equipped military forces in the region. For its very large military with more than 600,000 soldiers and more than three million reservists, the country spent more than US $ 43 billion, which is 2.6 per cent of its GDP. The heavy militarisation of South Korea is primarily a consequence of the conflict with North Korea, which continues despite efforts to defuse it, and is still driving the arms buildup on the Korean peninsula. We may assume that North Korea is also very highly militarised. However, mainly as a result of the North Korean government’s lack of transpar-ency in particular, the data is poor. This makes it impossible to ascertain a GMI value for the country. According to a report from the US State Department of December 2019, North Korea allegedly spent 23.3 per cent of its GDP on the military in the period from 2007 and 2017; no other state reaches a sim-
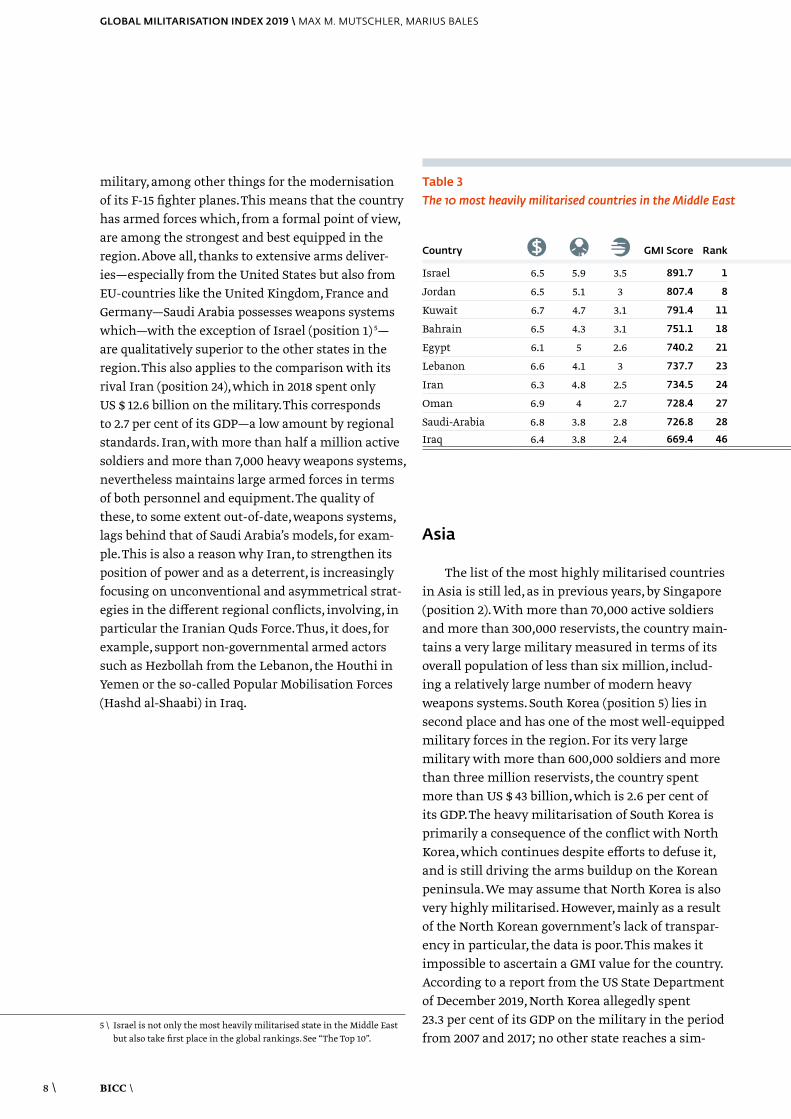
military, among other things for the modernisation of its F-15 fighter planes. This means that the country has armed forces which, from a formal point of view, are among the strongest and best equipped in the region. Above all, thanks to extensive arms deliver-ies—especially from the United States but also from EU-countries like the United Kingdom, France and Germany—Saudi Arabia possesses weapons systems which—with the exception of Israel (position 1) 5— are qualitatively superior to the other states in the region. This also applies to the comparison with its rival Iran (position 24), which in 2018 spent only US $ 12.6 billion on the military. This corresponds to 2.7 per cent of its GDP—a low amount by regional standards. Iran, with more than half a million active soldiers and more than 7,000 heavy weapons systems, nevertheless maintains large armed forces in terms of both personnel and equipment. The quality of these, to some extent out-of-date, weapons systems, lags behind that of Saudi Arabia’s models, for exam-ple. This is also a reason why Iran, to strengthen its position of power and as a deterrent, is increasingly focusing on unconventional and asymmetrical strat-egies in the different regional conflicts, involving, in particular the Iranian Quds Force. Thus, it does, for example, support non-governmental armed actors such as Hezbollah from the Lebanon, the Houthi in Yemen or the so-called Popular Mobilisation Forces (Hashd al-Shaabi) in Iraq.
Table 3The 10 most heavily militarised countries in the Middle East
Country Ausgaben Personal Waffen GMI Score Rank
Israel 6.5 5.9 3.5 891.7 1
Jordan 6.5 5.1 3 807.4 8
Kuwait 6.7 4.7 3.1 791.4 11
Bahrain 6.5 4.3 3.1 751.1 18
Egypt 6.1 5 2.6 740.2 21
Lebanon 6.6 4.1 3 737.7 23
Iran 6.3 4.8 2.5 734.5 24
Oman 6.9 4 2.7 728.4 27
Saudi-Arabia 6.8 3.8 2.8 726.8 28
Iraq 6.4 3.8 2.4 669.4 46
5 \ Israel is not only the most heavily militarised state in the Middle East but also take first place in the global rankings. See “The Top 10”.
BICC \ 9 \
GLOBAL MILITARISATION INDEX 2019 \ MAX M. MUTSCHLER, MARIUS BALES
change shortly however; similar to some European NATO member states, Japan considers itself under pressure from the United States to increase its defence spending. A defence policy White Paper pub-lished by the Japanese Ministry of Defence in August 2018, calls for a significant strengthening of mili-tary capabilities in the coming years, in particular to meet the security policy challenges presented by North Korea and an increasingly powerful China.
ilarly high value.6 According to the same source, during this period (2007–2017), North Korea had an absolute number of 1.16 million soldiers (as an annual average) out of an estimated population of only 25.55 million people in 2018 7, placing it among the top places globally, ahead of China (2.03 mil- lion), India (1.41 million) and the United States (1.37 million).
Looked at in absolute terms, China (position 94) invested the most in its armed forces in comparison to the rest of the region. With more than two million active soldiers, numerically it has the largest military in the world and in 2018 spent almost US $ 240 billion on its military, which also possesses a very large number of heavy weapons systems. But these values are put into perspective if you view them in the context of society as a whole. The People’s Republic, with almost 1.4 billion inhabitants—the most-pop-ulated country in the world—invested a mere 1.9 per cent of its GDP in the military in 2018, as in previous years. It is, therefore, no wonder that China is only in the mid-field of the GMI rankings. And although the 2018 defence budget increased by about eight per cent, economic growth of 6.5 per cent in 2018 all but “neutralised” the increase in militarisation. In abso-lute terms, Chinese military spending has, however, been rising for years. China invests continuously in the expansion of its military-industrial capabilities and the modernisation of its weapons systems. The military reform initiated by President Xi Jinping in 2015, is intended to bring the People’s Liberation Army up to “world-class” level by 2050. So far, this restructuring has manifested itself particularly in the centralisation of the command structure and an increase in maritime combat strength. Among other things, a second aircraft carrier—for the first time manufactured entirely in China—was put into operation in 2019.
Other states in the region are also arming them-selves, not least as a result of the various conflicts with the expanding strength of China. Thus, for example, India (position 88) increased its military spending in 2018 by US $ 66.5 billion, an increase of almost 30 per cent compared to 2009.8 In Japan on the other hand, military spending has stagnated since 2015 at just over US $ 45 billion, which cor-responds to about 0.9 per cent of GDP. This could
Country Ausgaben Personal Waffen GMI Score Rank
Israel 6.5 5.9 3.5 891.7 1
Jordan 6.5 5.1 3 807.4 8
Kuwait 6.7 4.7 3.1 791.4 11
Bahrain 6.5 4.3 3.1 751.1 18
Egypt 6.1 5 2.6 740.2 21
Lebanon 6.6 4.1 3 737.7 23
Iran 6.3 4.8 2.5 734.5 24
Oman 6.9 4 2.7 728.4 27
Saudi-Arabia 6.8 3.8 2.8 726.8 28
Iraq 6.4 3.8 2.4 669.4 46
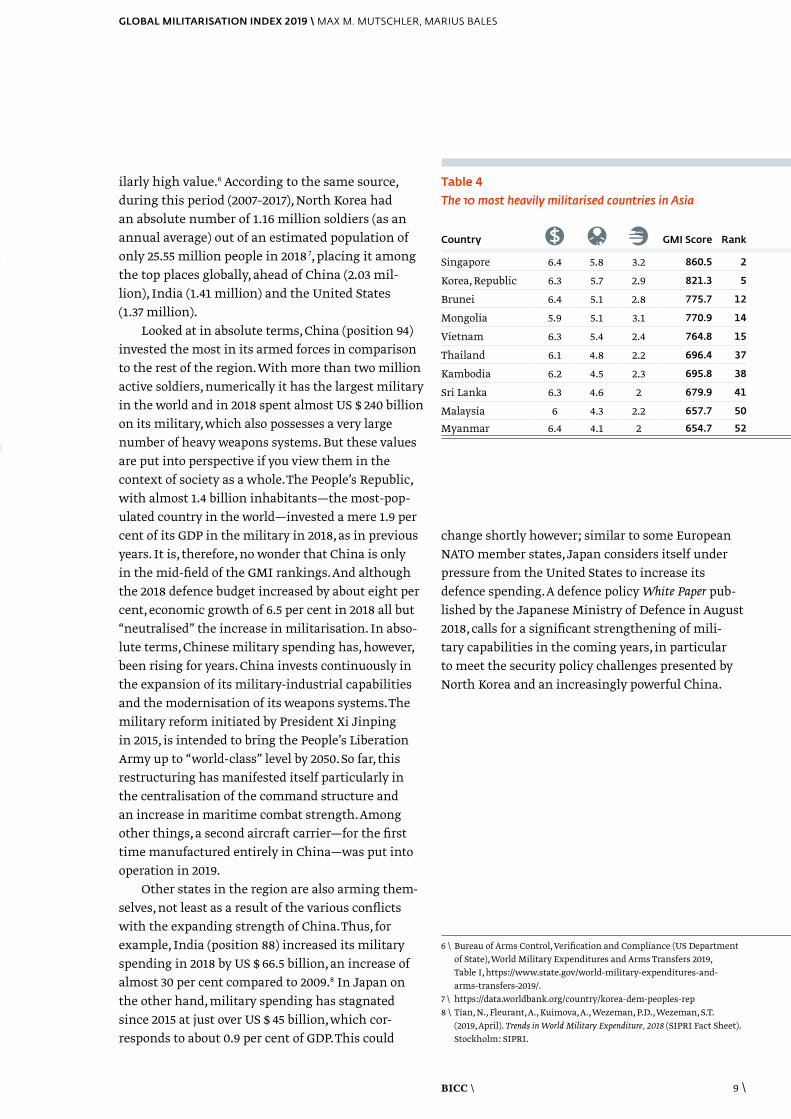
Table 4The 10 most heavily militarised countries in Asia
Country Ausgaben Personal Waffen GMI Score Rank
Singapore 6.4 5.8 3.2 860.5 2
Korea, Republic 6.3 5.7 2.9 821.3 5
Brunei 6.4 5.1 2.8 775.7 12
Mongolia 5.9 5.1 3.1 770.9 14
Vietnam 6.3 5.4 2.4 764.8 15
Thailand 6.1 4.8 2.2 696.4 37
Kambodia 6.2 4.5 2.3 695.8 38
Sri Lanka 6.3 4.6 2 679.9 41
Malaysia 6 4.3 2.2 657.7 50
Myanmar 6.4 4.1 2 654.7 52
6 \ Bureau of Arms Control, Verification and Compliance (US Department of State), World Military Expenditures and Arms Transfers 2019, Table I, https://www.state.gov/world-military-expenditures-and- arms-transfers-2019/.
7 \ https://data.worldbank.org/country/korea-dem-peoples-rep8 \ Tian, N., Fleurant, A., Kuimova, A., Wezeman, P.D., Wezeman, S.T.
(2019, April). Trends in World Military Expenditure, 2018 (SIPRI Fact Sheet). Stockholm: SIPRI.
GLOBAL MILITARISATION INDEX 2019 \ MAX M. MUTSCHLER, MARIUS BALES
BICC \ 10 \
Militarisation and state fragility
In 2018, the Constellations of State Fragility Project of the German Development Institute (GDI), published a typology of states from the perspective of state fragility. 9 According to this typology, fragility arises from deficiencies in one or more of three core functions of the state: authority, capacity and legiti-macy. State authority here means the ability of a state to control the uses of physical violence within its borders. It is measured on the basis of, among other things, the number of deaths by means of violent conflict and homicide. State capacity, in turn, refers to the provision of basic public services, for example in the area of health. It is measured, for instance on the child mortality rate and access to clean water. State legitimacy is ultimately understood as the level of con-sent to state rule from the public. To measure this, the project relies on different indicators relating to the human rights situation and freedom of the press, as well as the number of authorised applications for asylum by citizens of the country in question.10
Based on a combination of these three dimen-sions, the project creates a typology of six fragility constellations:
\ A) Dysfunctional states are states which score badly in all three dimensions.
\ B) Low-authority states have only very limited control over physical violence, but are able to provide basic public services and have an aver-age legitimacy value.
\ C) Low-capacity states can only provide limited public services but have a moderate value in terms of authority and legitimacy.
\ D) Low-legitimacy states have an average score in the two dimensions of authority and capacity, but only have low values in the area of legiti-macy.
\ E) Semi-functional states are states in which all three areas have an average score.
\ F) Well-functioning states achieve very good scores in all three dimensions.
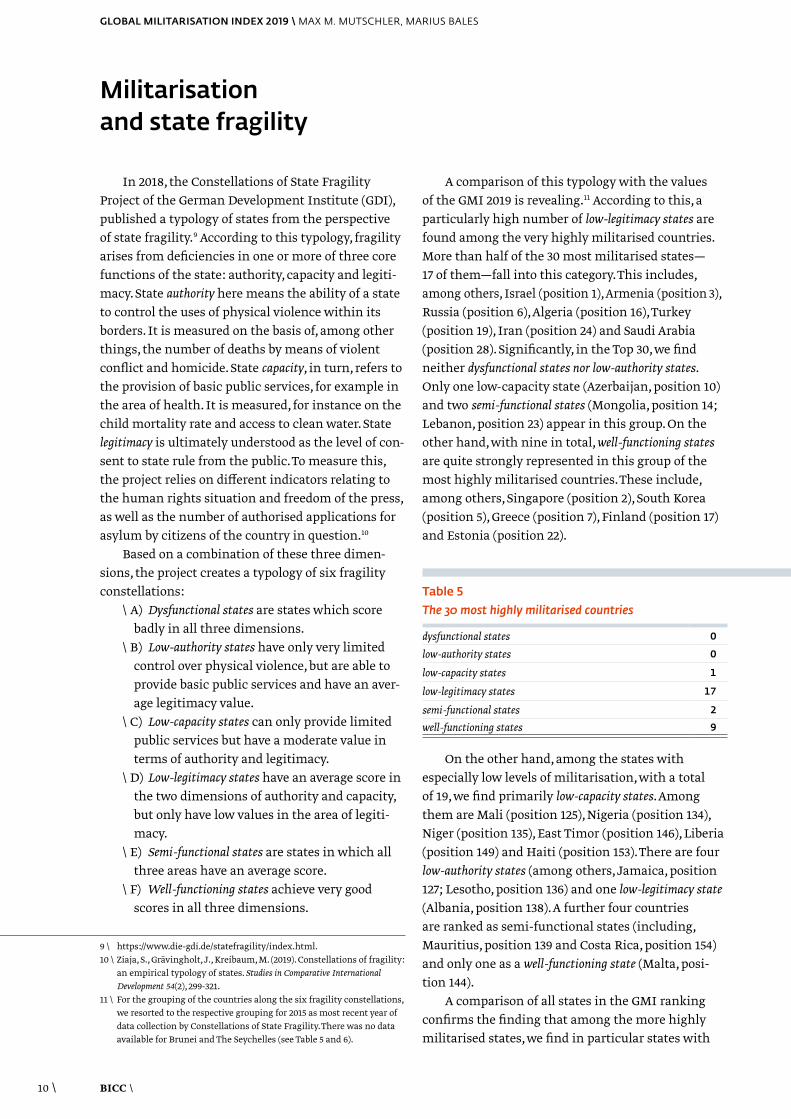
A comparison of this typology with the values of the GMI 2019 is revealing.11 According to this, a particularly high number of low-legitimacy states are found among the very highly militarised countries. More than half of the 30 most militarised states— 17 of them—fall into this category. This includes, among others, Israel (position 1), Armenia (position 3), Russia (position 6), Algeria (position 16), Turkey (position 19), Iran (position 24) and Saudi Arabia (position 28). Significantly, in the Top 30, we find neither dysfunctional states nor low-authority states. Only one low-capacity state (Azerbaijan, position 10) and two semi-functional states (Mongolia, position 14; Lebanon, position 23) appear in this group. On the other hand, with nine in total, well-functioning states are quite strongly represented in this group of the most highly militarised countries. These include, among others, Singapore (position 2), South Korea (position 5), Greece (position 7), Finland (position 17) and Estonia (position 22).
On the other hand, among the states with especially low levels of militarisation, with a total of 19, we find primarily low-capacity states. Among them are Mali (position 125), Nigeria (position 134), Niger (position 135), East Timor (position 146), Liberia (position 149) and Haiti (position 153). There are four low-authority states (among others, Jamaica, position 127; Lesotho, position 136) and one low-legitimacy state (Albania, position 138). A further four countries are ranked as semi-functional states (including, Mauritius, position 139 and Costa Rica, position 154) and only one as a well-functioning state (Malta, posi-tion 144).
A comparison of all states in the GMI ranking confirms the finding that among the more highly militarised states, we find in particular states with
9 \ https://www.die-gdi.de/statefragility/index.html.10 \ Ziaja, S., Grävingholt, J., Kreibaum, M. (2019). Constellations of fragility:
an empirical typology of states. Studies in Comparative International Development 54(2), 299-321.
11 \ For the grouping of the countries along the six fragility constellations, we resorted to the respective grouping for 2015 as most recent year of data collection by Constellations of State Fragility. There was no data available for Brunei and The Seychelles (see Table 5 and 6).
Table 5The 30 most highly militarised countries
dysfunctional states 0
low-authority states 0
low-capacity states 1
low-legitimacy states 17
semi-functional states 2
well-functioning states 9
BICC \ 11 \
GLOBAL MILITARISATION INDEX 2019 \ MAX M. MUTSCHLER, MARIUS BALES
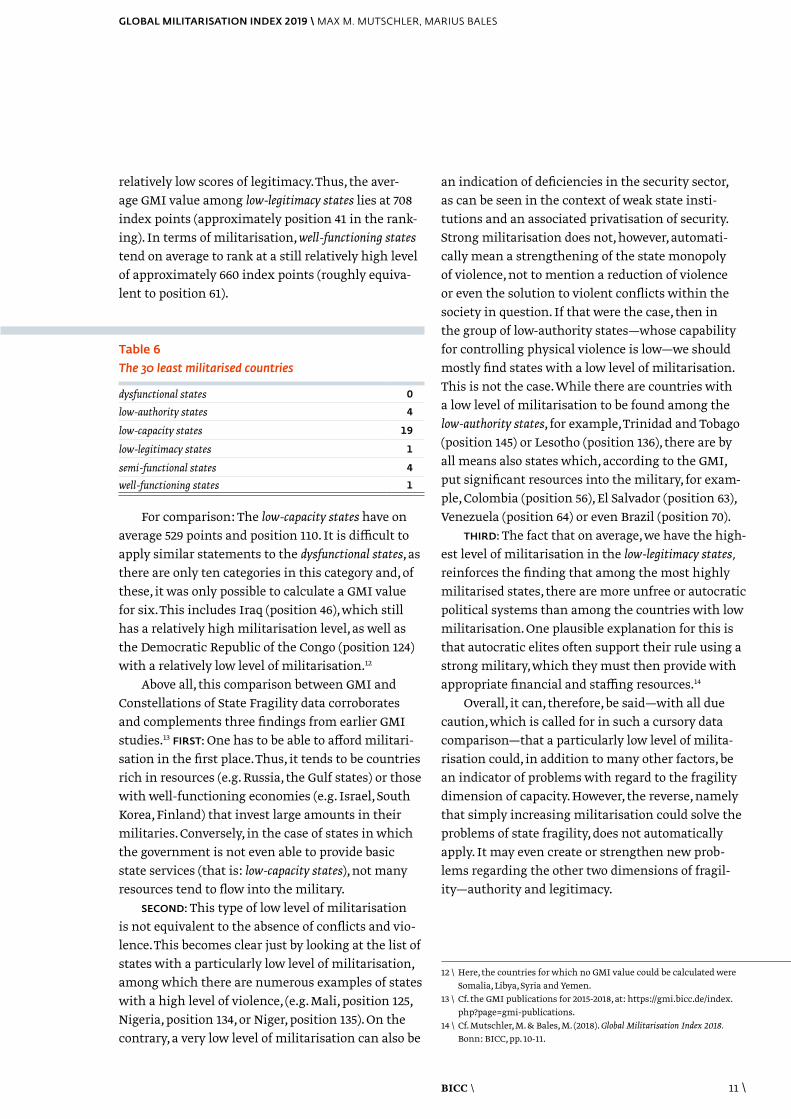
relatively low scores of legitimacy. Thus, the aver-age GMI value among low-legitimacy states lies at 708 index points (approximately position 41 in the rank-ing). In terms of militarisation, well-functioning states tend on average to rank at a still relatively high level of approximately 660 index points (roughly equiva-lent to position 61).
For comparison: The low-capacity states have on average 529 points and position 110. It is difficult to apply similar statements to the dysfunctional states, as there are only ten categories in this category and, of these, it was only possible to calculate a GMI value for six. This includes Iraq (position 46), which still has a relatively high militarisation level, as well as the Democratic Republic of the Congo (position 124) with a relatively low level of militarisation.12
Above all, this comparison between GMI and Constellations of State Fragility data corroborates and complements three findings from earlier GMI studies.13 FIRST: One has to be able to afford militari-sation in the first place. Thus, it tends to be countries rich in resources (e.g. Russia, the Gulf states) or those with well-functioning economies (e.g. Israel, South Korea, Finland) that invest large amounts in their militaries. Conversely, in the case of states in which the government is not even able to provide basic state services (that is: low-capacity states), not many resources tend to flow into the military.
SECOND: This type of low level of militarisation is not equivalent to the absence of conflicts and vio-lence. This becomes clear just by looking at the list of states with a particularly low level of militarisation, among which there are numerous examples of states with a high level of violence, (e.g. Mali, position 125, Nigeria, position 134, or Niger, position 135). On the contrary, a very low level of militarisation can also be
an indication of deficiencies in the security sector, as can be seen in the context of weak state insti-tutions and an associated privatisation of security. Strong militarisation does not, however, automati-cally mean a strengthening of the state monopoly of violence, not to mention a reduction of violence or even the solution to violent conflicts within the society in question. If that were the case, then in the group of low-authority states—whose capability for controlling physical violence is low—we should mostly find states with a low level of militarisation. This is not the case. While there are countries with a low level of militarisation to be found among the low-authority states, for example, Trinidad and Tobago (position 145) or Lesotho (position 136), there are by all means also states which, according to the GMI, put significant resources into the military, for exam-ple, Colombia (position 56), El Salvador (position 63), Venezuela (position 64) or even Brazil (position 70).
THIRD: The fact that on average, we have the high-est level of militarisation in the low-legitimacy states, reinforces the finding that among the most highly militarised states, there are more unfree or autocratic political systems than among the countries with low militarisation. One plausible explanation for this is that autocratic elites often support their rule using a strong military, which they must then provide with appropriate financial and staffing resources.14
Overall, it can, therefore, be said—with all due caution, which is called for in such a cursory data comparison—that a particularly low level of milita-risation could, in addition to many other factors, be an indicator of problems with regard to the fragility dimension of capacity. However, the reverse, namely that simply increasing militarisation could solve the problems of state fragility, does not automatically apply. It may even create or strengthen new prob-lems regarding the other two dimensions of fragil-ity—authority and legitimacy.
12 \ Here, the countries for which no GMI value could be calculated were Somalia, Libya, Syria and Yemen.
13 \ Cf. the GMI publications for 2015-2018, at: https://gmi.bicc.de/index.php?page=gmi-publications.
14 \ Cf. Mutschler, M. & Bales, M. (2018). Global Militarisation Index 2018. Bonn: BICC, pp. 10-11.
Table 6The 30 least militarised countries
dysfunctional states 0
low-authority states 4
low-capacity states 19
low-legitimacy states 1
semi-functional states 4
well-functioning states 1
GLOBAL MILITARISATION INDEX 2019 \ MAX M. MUTSCHLER, MARIUS BALES
BICC \ 12 \
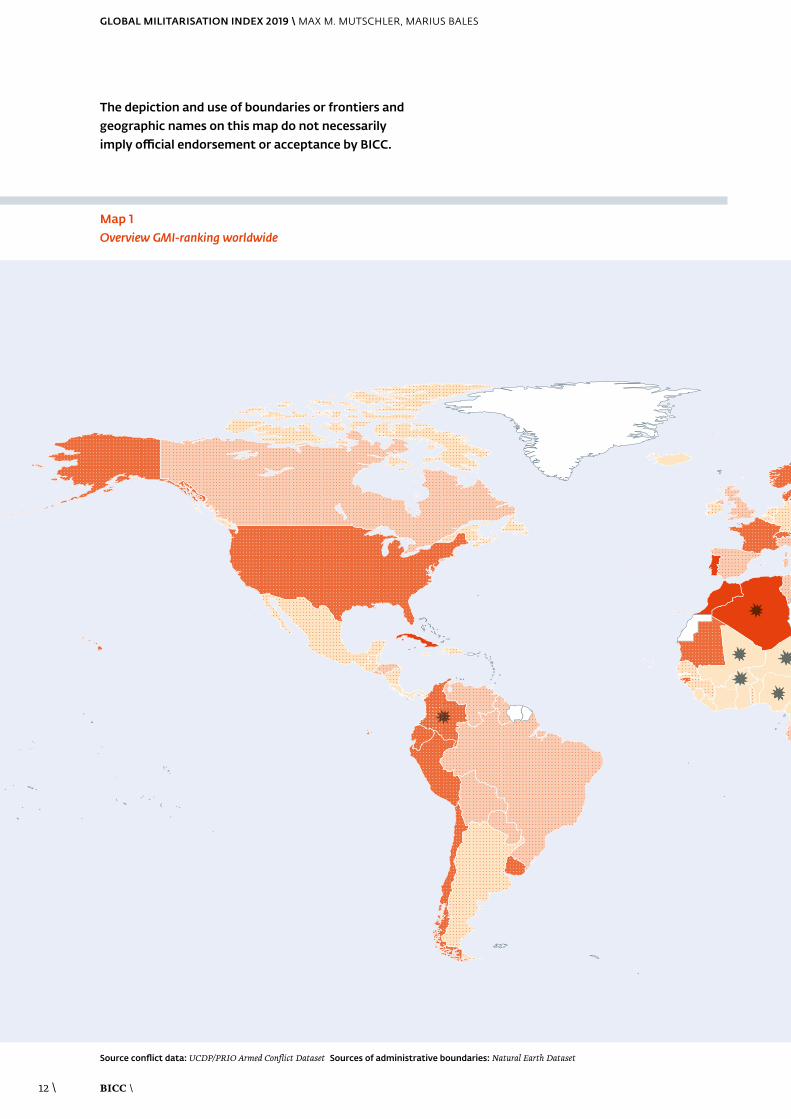
The depiction and use of boundaries or frontiers and geographic names on this map do not necessarily imply official endorsement or acceptance by BICC.
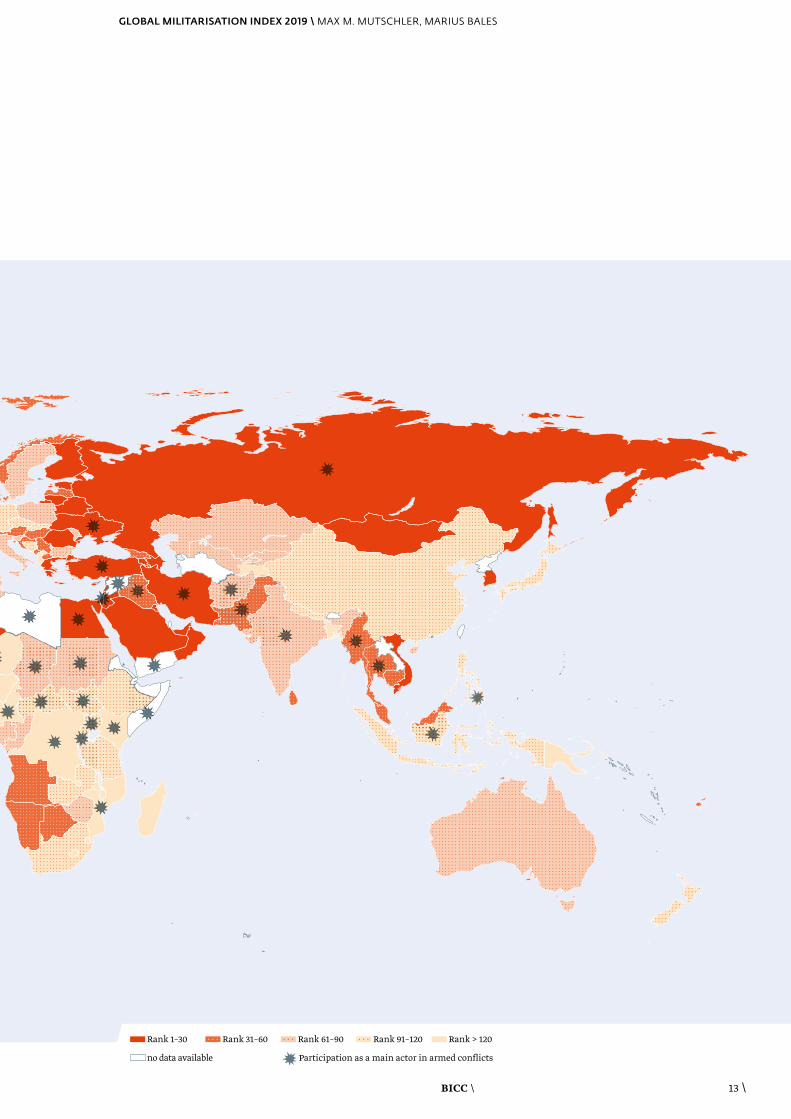
Map 1Overview GMI-ranking worldwide
GMI Weltkarte
Source conflict data: UCDP/PRIO Armed Conflict Dataset Sources of administrative boundaries: Natural Earth Dataset
BICC \ 13 \
GLOBAL MILITARISATION INDEX 2019 \ MAX M. MUTSCHLER, MARIUS BALES
Rank 1–30 Rank 31–60 Rank 61–90 Rank 91–120 Rank > 120
no data available Participation as a main actor in armed conflicts
GLOBAL MILITARISATION INDEX 2019 \ MAX M. MUTSCHLER, MARIUS BALES
BICC \ 14 \
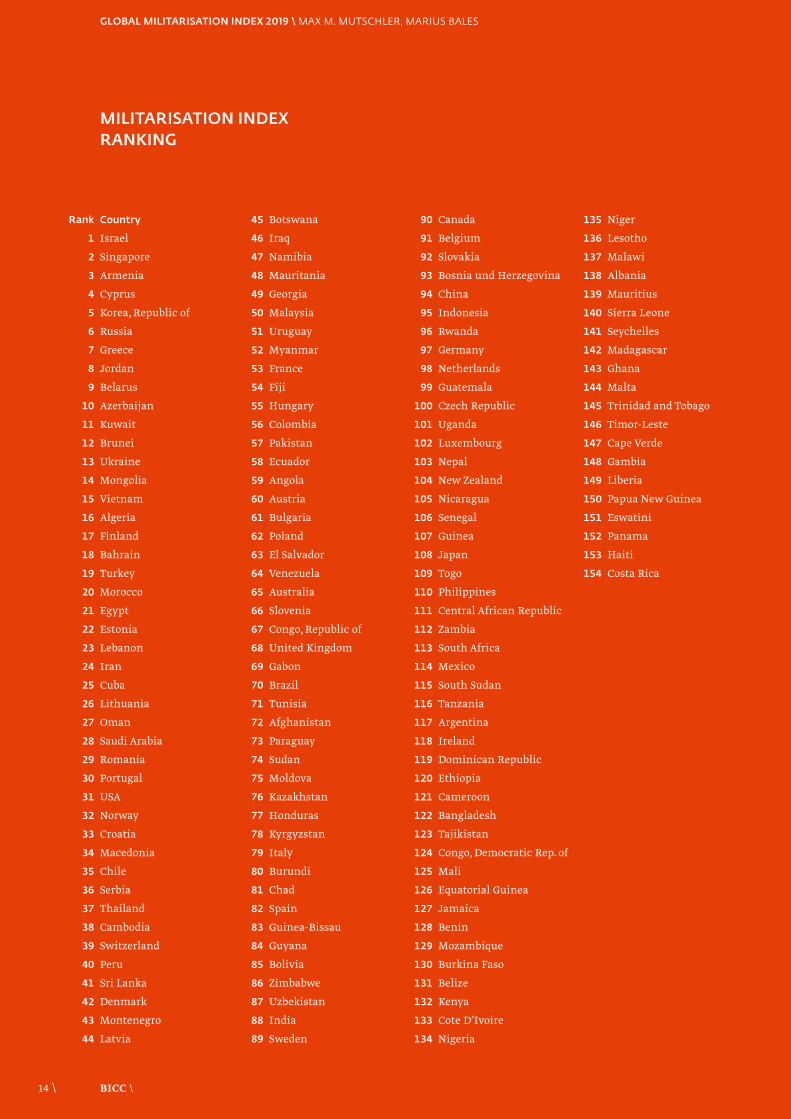
MILITARISATION INDEX RANKING
Rank Country
1 Israel
2 Singapore
3 Armenia
4 Cyprus
5 Korea, Republic of
6 Russia
7 Greece
8 Jordan
9 Belarus
10 Azerbaijan
11 Kuwait
12 Brunei
13 Ukraine
14 Mongolia
15 Vietnam
16 Algeria
17 Finland
18 Bahrain
19 Turkey
20 Morocco
21 Egypt
22 Estonia
23 Lebanon
24 Iran
25 Cuba
26 Lithuania
27 Oman
28 Saudi Arabia
29 Romania
30 Portugal
31 USA
32 Norway
33 Croatia
34 Macedonia
35 Chile
36 Serbia
37 Thailand
38 Cambodia
39 Switzerland
40 Peru
41 Sri Lanka
42 Denmark
43 Montenegro
44 Latvia
45 Botswana
46 Iraq
47 Namibia
48 Mauritania
49 Georgia
50 Malaysia
51 Uruguay
52 Myanmar
53 France
54 Fiji
55 Hungary
56 Colombia
57 Pakistan
58 Ecuador
59 Angola
60 Austria
61 Bulgaria
62 Poland
63 El Salvador
64 Venezuela
65 Australia
66 Slovenia
67 Congo, Republic of
68 United Kingdom
69 Gabon
70 Brazil
71 Tunisia
72 Afghanistan
73 Paraguay
74 Sudan
75 Moldova
76 Kazakhstan
77 Honduras
78 Kyrgyzstan
79 Italy
80 Burundi
81 Chad
82 Spain
83 Guinea-Bissau
84 Guyana
85 Bolivia
86 Zimbabwe
87 Uzbekistan
88 India
89 Sweden
90 Canada
91 Belgium
92 Slovakia
93 Bosnia und Herzegovina
94 China
95 Indonesia
96 Rwanda
97 Germany
98 Netherlands
99 Guatemala
100 Czech Republic
101 Uganda
102 Luxembourg
103 Nepal
104 New Zealand
105 Nicaragua
106 Senegal
107 Guinea
108 Japan
109 Togo
110 Philippines
111 Central African Republic
112 Zambia
113 South Africa
114 Mexico
115 South Sudan
116 Tanzania
117 Argentina
118 Ireland
119 Dominican Republic
120 Ethiopia
121 Cameroon
122 Bangladesh
123 Tajikistan
124 Congo, Democratic Rep. of
125 Mali
126 Equatorial Guinea
127 Jamaica
128 Benin
129 Mozambique
130 Burkina Faso
131 Belize
132 Kenya
133 Cote D’Ivoire
134 Nigeria
135 Niger
136 Lesotho
137 Malawi
138 Albania
139 Mauritius
140 Sierra Leone
141 Seychelles
142 Madagascar
143 Ghana
144 Malta
145 Trinidad and Tobago
146 Timor-Leste
147 Cape Verde
148 Gambia
149 Liberia
150 Papua New Guinea
151 Eswatini
152 Panama
153 Haiti
154 Costa Rica
BICC \ 15 \
GLOBAL MILITARISATION INDEX 2019 \ MAX M. MUTSCHLER, MARIUS BALES
bicc \Internationales Konversionszentrum Bonn Bonn International Center for Conversion GmbH
Pfarrer-Byns-Straße 1, 53121 Bonn, Germany +49 (0)228 911 96-0, Fax -22, [email protected]
www.bicc.de www.facebook.com/bicc.de twitter.com/BICC_Bonn
Director for ResearchProfessor Dr Conrad Schetter
Director for AdministrationMichael Dedek
AUTORSDr Max M. MutschlerSenior Researcher at BICCMarius BalesBICC
EDITORSusanne Heinke
TRANSLATIONJean Maples
SUPPORTRolf Alberth, Heike Webb
LAYOUTkippconcept gmbh, Bonn
EDITORIAL DESIGNDiesseits – Kommunikationsdesign, Düsseldorf
ISSN (Print) 2522-2015ISSN (Online) 2521-7844
IMPRINT
This work is licensed under a Creative Commons Attribution-NonCommercial-NoDerivs 3.0 Unported License; cf.creativecommons.org/licenses/by-nc-nd/3.0/
Member ofJohannes-Rau-Forschungsgemeinschaft
GLOBAL
MILITARISATION INDEX 2019
Max M. Mutschler, Marius Bales \ BICC