Embed Size (px)
Citation preview
GNAM INVESTMENT
THESIS
2016
IIM BANGALORE Pulkit Aggarwal
Divya Ganapati
Jayesh Bhansali
Madhav Marda
Mohan Raj
Udit Jalan
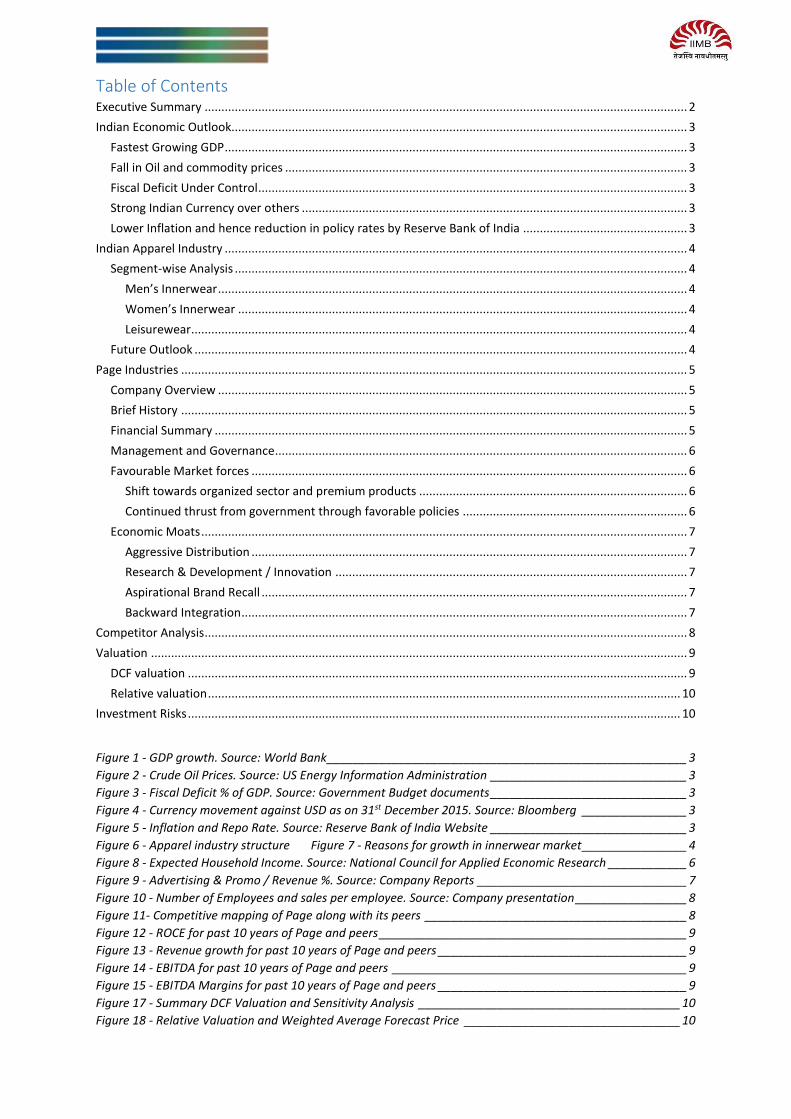
Table of Contents Executive Summary ................................................................................................................................................ 2
Indian Economic Outlook........................................................................................................................................ 3
Fastest Growing GDP .......................................................................................................................................... 3
Fall in Oil and commodity prices ........................................................................................................................ 3
Fiscal Deficit Under Control ................................................................................................................................ 3
Strong Indian Currency over others ................................................................................................................... 3
Lower Inflation and hence reduction in policy rates by Reserve Bank of India ................................................. 3
Indian Apparel Industry .......................................................................................................................................... 4
Segment-wise Analysis ....................................................................................................................................... 4
Men’s Innerwear ............................................................................................................................................ 4
Women’s Innerwear ...................................................................................................................................... 4
Leisurewear.................................................................................................................................................... 4
Future Outlook ................................................................................................................................................... 4
Page Industries ....................................................................................................................................................... 5
Company Overview ............................................................................................................................................ 5
Brief History ....................................................................................................................................................... 5
Financial Summary ............................................................................................................................................. 5
Management and Governance ........................................................................................................................... 6
Favourable Market forces .................................................................................................................................. 6
Shift towards organized sector and premium products ................................................................................ 6
Continued thrust from government through favorable policies ................................................................... 6
Economic Moats ................................................................................................................................................. 7
Aggressive Distribution .................................................................................................................................. 7
Research & Development / Innovation ......................................................................................................... 7
Aspirational Brand Recall ............................................................................................................................... 7
Backward Integration ..................................................................................................................................... 7
Competitor Analysis ................................................................................................................................................ 8
Valuation ................................................................................................................................................................ 9
DCF valuation ..................................................................................................................................................... 9
Relative valuation ............................................................................................................................................. 10
Investment Risks ................................................................................................................................................... 10
Figure 1 - GDP growth. Source: World Bank _______________________________________________________ 3 Figure 2 - Crude Oil Prices. Source: US Energy Information Administration ______________________________ 3 Figure 3 - Fiscal Deficit % of GDP. Source: Government Budget documents ______________________________ 3 Figure 4 - Currency movement against USD as on 31st December 2015. Source: Bloomberg ________________ 3 Figure 5 - Inflation and Repo Rate. Source: Reserve Bank of India Website ______________________________ 3 Figure 6 - Apparel industry structure Figure 7 - Reasons for growth in innerwear market ________________ 4 Figure 8 - Expected Household Income. Source: National Council for Applied Economic Research ____________ 6 Figure 9 - Advertising & Promo / Revenue %. Source: Company Reports ________________________________ 7 Figure 10 - Number of Employees and sales per employee. Source: Company presentation _________________ 8 Figure 11- Competitive mapping of Page along with its peers ________________________________________ 8 Figure 12 - ROCE for past 10 years of Page and peers _______________________________________________ 9 Figure 13 - Revenue growth for past 10 years of Page and peers ______________________________________ 9 Figure 14 - EBITDA for past 10 years of Page and peers _____________________________________________ 9 Figure 15 - EBITDA Margins for past 10 years of Page and peers ______________________________________ 9 Figure 17 - Summary DCF Valuation and Sensitivity Analysis ________________________________________ 10 Figure 18 - Relative Valuation and Weighted Average Forecast Price _________________________________ 10
Executive Summary Page Industries have leveraged Jockey’s 120 years’ experience in textile space and has developed
economic moats around the following:
a. Strong Distribution channel with access to more than 44,000 outlets spread across geography
b. Backward integrated providing good quality raw material and bringing cost advantages
c. Labour training centres and efficient labour management leading to very low labour turnover
d. Launching innovative products frequently with high quality product at comparable price
e. Strategically Brand positioned as an aspirational brand and developed the mid-premium
segment in innerwear segment.
Hence, new entrants and existing competitors find it challenging to break Jockey’s customer loyalty.
Based on above and our valuation analysis, we recommend a BUY rating on Page Industries with
target price of INR 17,446 (upside potential of 10%) in next 12 months.
In addition to the above key success factors of the company, there are various other factors which
supports our proposition such as,
a. Favourable macro-economic factors like inflation, interest rates, fiscal deficit, foreign
investments, currency movements etc. all highlight the improving economic conditions of India.
b. High growth expected in Innerwear segment (CAGR 13% over 2015-23) valuing the industry at
INR 600bn in FY 2023.
c. Favourable market forces like rise in household disposable income, increase in organised player
market share, favourable youth demographics, increase in online channels, increase in working
women, growth in branded apparel segment etc.
d. Good corporate governance and strong management, which professionally focuses only on this
business has won various accolades for exemplar performance in this space.
On performing Du-Pont analysis on Page and its peers, we see that Page has historically performed
better than its peers on all ratios like highest pat margin, highest asset turnover, decently leveraged
and highest ROE. Due to the above competencies and high growth displayed in past years, Page
commands P/E of 78.52, while its peers trade at average P/E of ~30.
We have valued the company based on the DCF valuation method. We applied three stage FCFF
model as the company is currently in high growth phase. We also applied relative valuation methods
of P/E, P/Bv and EV/EBITDA multiple to value the company. We applied weights to each method and
arrived at the weighted average target price of 17,446 (upside of 10%).
There are few investment risks like impact of GST, new entrants in market, increase in raw material
cost, slowdown in the consumer spending etc. which can affect our fair value estimate of the
company.
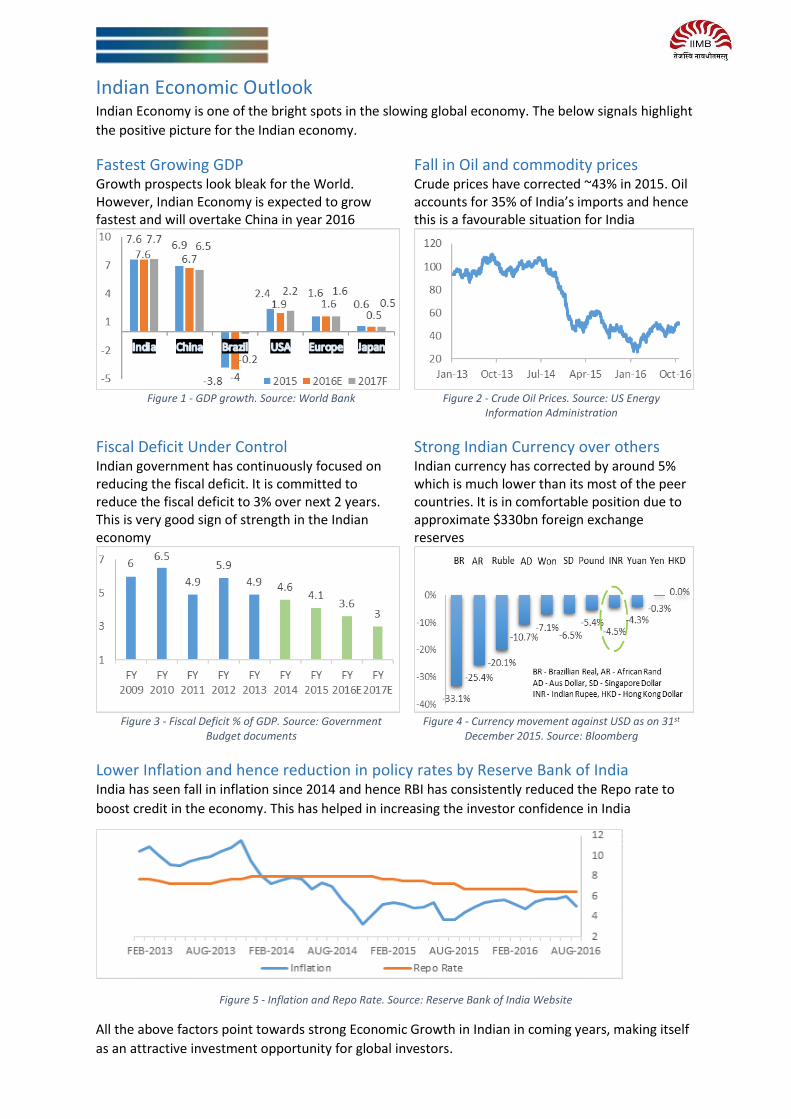
Indian Economic Outlook Indian Economy is one of the bright spots in the slowing global economy. The below signals highlight
the positive picture for the Indian economy.
Fastest Growing GDP Fall in Oil and commodity prices Growth prospects look bleak for the World. However, Indian Economy is expected to grow fastest and will overtake China in year 2016
Crude prices have corrected ~43% in 2015. Oil accounts for 35% of India’s imports and hence this is a favourable situation for India
Figure 1 - GDP growth. Source: World Bank Figure 2 - Crude Oil Prices. Source: US Energy
Information Administration
Fiscal Deficit Under Control Strong Indian Currency over others Indian government has continuously focused on reducing the fiscal deficit. It is committed to reduce the fiscal deficit to 3% over next 2 years. This is very good sign of strength in the Indian economy
Indian currency has corrected by around 5% which is much lower than its most of the peer countries. It is in comfortable position due to approximate $330bn foreign exchange reserves
Figure 3 - Fiscal Deficit % of GDP. Source: Government
Budget documents Figure 4 - Currency movement against USD as on 31st
December 2015. Source: Bloomberg
Lower Inflation and hence reduction in policy rates by Reserve Bank of India India has seen fall in inflation since 2014 and hence RBI has consistently reduced the Repo rate to
boost credit in the economy. This has helped in increasing the investor confidence in India
Figure 5 - Inflation and Repo Rate. Source: Reserve Bank of India Website
All the above factors point towards strong Economic Growth in Indian in coming years, making itself
as an attractive investment opportunity for global investors.
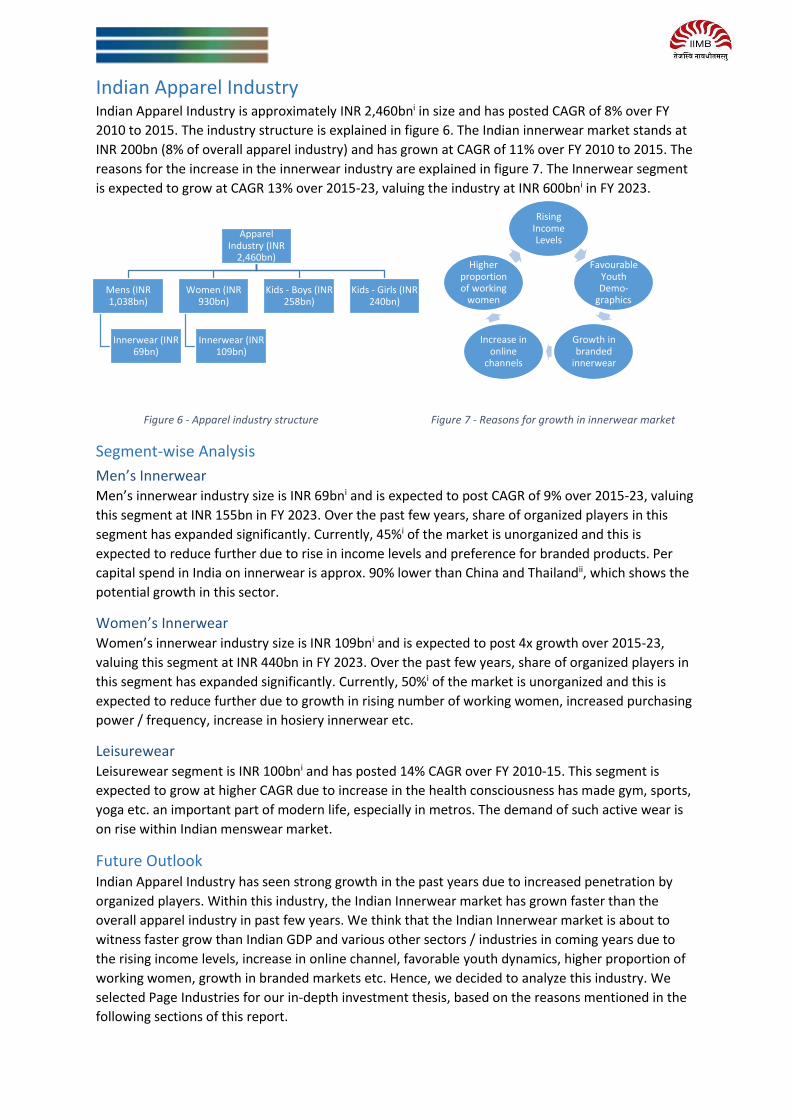
Indian Apparel Industry Indian Apparel Industry is approximately INR 2,460bni in size and has posted CAGR of 8% over FY
2010 to 2015. The industry structure is explained in figure 6. The Indian innerwear market stands at
INR 200bn (8% of overall apparel industry) and has grown at CAGR of 11% over FY 2010 to 2015. The
reasons for the increase in the innerwear industry are explained in figure 7. The Innerwear segment
is expected to grow at CAGR 13% over 2015-23, valuing the industry at INR 600bni in FY 2023.
Figure 6 - Apparel industry structure Figure 7 - Reasons for growth in innerwear market
Segment-wise Analysis
Men’s Innerwear Men’s innerwear industry size is INR 69bni and is expected to post CAGR of 9% over 2015-23, valuing
this segment at INR 155bn in FY 2023. Over the past few years, share of organized players in this
segment has expanded significantly. Currently, 45%i of the market is unorganized and this is
expected to reduce further due to rise in income levels and preference for branded products. Per
capital spend in India on innerwear is approx. 90% lower than China and Thailandii, which shows the
potential growth in this sector.
Women’s Innerwear Women’s innerwear industry size is INR 109bni and is expected to post 4x growth over 2015-23,
valuing this segment at INR 440bn in FY 2023. Over the past few years, share of organized players in
this segment has expanded significantly. Currently, 50%i of the market is unorganized and this is
expected to reduce further due to growth in rising number of working women, increased purchasing
power / frequency, increase in hosiery innerwear etc.
Leisurewear Leisurewear segment is INR 100bni and has posted 14% CAGR over FY 2010-15. This segment is
expected to grow at higher CAGR due to increase in the health consciousness has made gym, sports,
yoga etc. an important part of modern life, especially in metros. The demand of such active wear is
on rise within Indian menswear market.
Future Outlook Indian Apparel Industry has seen strong growth in the past years due to increased penetration by
organized players. Within this industry, the Indian Innerwear market has grown faster than the
overall apparel industry in past few years. We think that the Indian Innerwear market is about to
witness faster grow than Indian GDP and various other sectors / industries in coming years due to
the rising income levels, increase in online channel, favorable youth dynamics, higher proportion of
working women, growth in branded markets etc. Hence, we decided to analyze this industry. We
selected Page Industries for our in-depth investment thesis, based on the reasons mentioned in the
following sections of this report.
Rising Income Levels
Favourable Youth Demo-
graphics
Growth in branded
innerwear
Increase in online
channels
Higher proportion of working
women
Apparel Industry (INR
2,460bn)
Mens (INR 1,038bn)
Innerwear (INR 69bn)
Women (INR 930bn)
Innerwear (INR 109bn)
Kids - Boys (INR 258bn)
Kids - Girls (INR 240bn)
Page Industries
Company Overview Page Industries is a leading player in the inner wear market in India. The company holds an exclusive
license to manufacture, market and sell inner wear under the “Jockey” brand in India, Sri Lanka,
Bangladesh, Nepal and the UAE. Jockey International is one of the oldest and well known U.S.
innerwear manufacturer and has leading presence in 120 countries. Page is also exclusive licensee of
Speedo International for the “Speedo” brand which includes swimwear, water shorts, apparel,
equipment and footwear.
Page’s manufacturing prowess encompasses a 19,000 workforce with manufacturing spread across
12 cities in India. It is headquartered in Bangalore. On the distribution front, it has a Pan-India
presence with 44,000+ retail outlets in 1,400 cities and towns across the country. It was publicly
listed in March 2007 and quotes at both the Bombay Stock Exchange (BSE) and National Stock
Exchange (NSE) in India. Page has had an incredible growth story with a 35% Sales CAGR over the
past 5 years. The bottom line grew at a 38% CAGR over the same time and the ROCE averaged at
60%.
Brief History Jockey entered in India by licensing its brand to the Genomal family, a long-time partner of Jockey in
Philippines. And thus Page Industries was set up in 1994.
Page industries wanted to be the brand of choice and hence focused on the mid to premium
innerwear segment. Unlike competitors like Liberty, Rupa etc. which had set up wholesale-driven
distribution networks, Page expanded solely through individual distributors. It wanted consumers to
interact with the product directly rather than being showcased the products by the retailer. With
that in mind, it introduced a new method of in-store marketing of innerwear products. Other areas
where Page heavily focused on were quality and advertising. Traditionally, the innerwear segment
was a low profile one and associated with mediocre quality. Page challenged both – they established
strong relationships with high quality raw material suppliers to ensure superior quality which would
be leveraged to command premium pricing.
The biggest testimony of the strength of relationships between Jockey USA and Page is the fact that
in 2010 Jockey extended its licensing agreement with Page for a 20-year period instead of the
standard practice of 5 years. Moreover, in the new agreement, the UAE was added as a new
territory of exclusive license.
Page has been extremely successful in executing its strategy and is a leader today in the mid to
premium segment of the innerwear market in India. As we will describe in the following sections, it
has been able to develop deep economic moats which put it in a very strong position for the future.
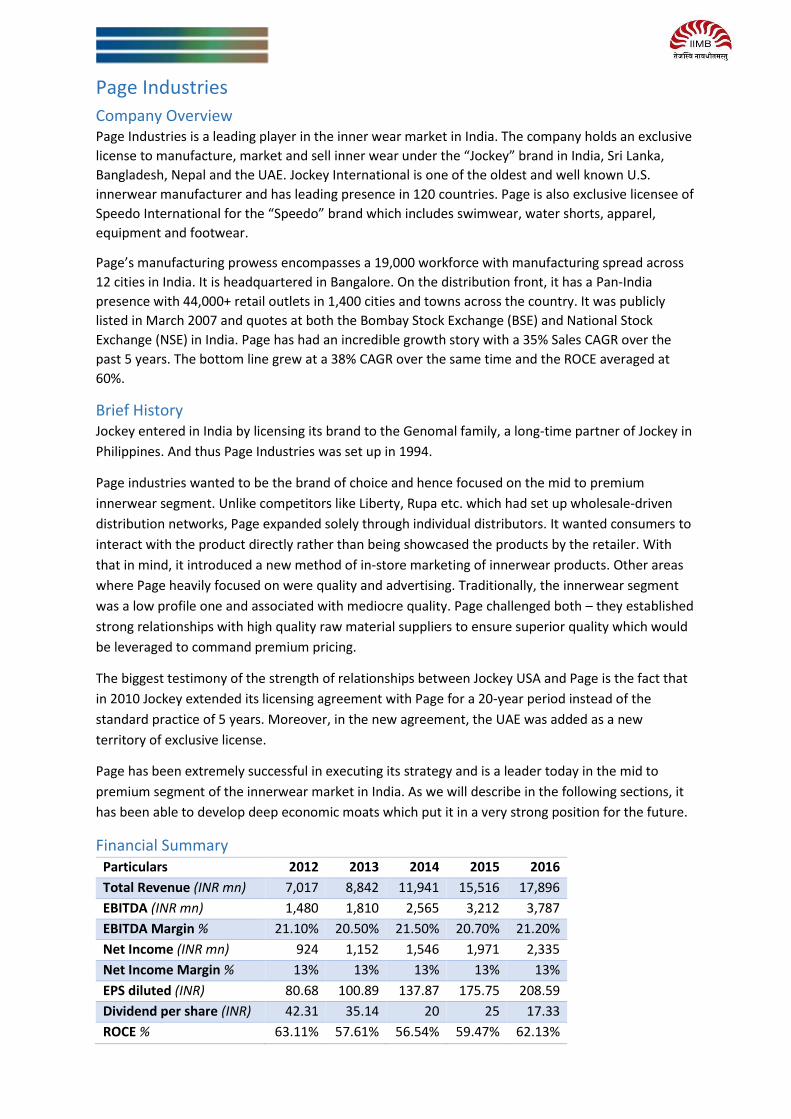
Financial Summary Particulars 2012 2013 2014 2015 2016
Total Revenue (INR mn) 7,017 8,842 11,941 15,516 17,896
EBITDA (INR mn) 1,480 1,810 2,565 3,212 3,787
EBITDA Margin % 21.10% 20.50% 21.50% 20.70% 21.20%
Net Income (INR mn) 924 1,152 1,546 1,971 2,335
Net Income Margin % 13% 13% 13% 13% 13%
EPS diluted (INR) 80.68 100.89 137.87 175.75 208.59
Dividend per share (INR) 42.31 35.14 20 25 17.33
ROCE % 63.11% 57.61% 56.54% 59.47% 62.13%
Management and Governance Mr. Sunder Genomal is the promoter and Managing Director of the company and his son, Mr. Shamir
Genomal is Executive Director and Chief Strategy Officer. Mr. Sunder has won Best CEO Textiles
award 2015 and has over 30 years of work experience in textiles space. However, the decision-
making at a senior management level is carried out in an independent and professional manner.
The professional backgrounds of individuals at a senior management level either include home-
grown outperformers or external hires with relevant high-quality work experience. For instance,
their COO, Vedji Ticku, joined Page in 1997 as a Regional Sales Manager for the South Zone and has
growth within the firm rapidly. Page’s head of product development, Shelagh Margaret, recently
joined in March 2014 with 20 years’ experience in designing and development of intimate apparel
across different countries like Mexico, Sri Lanka, and Bangladesh. Thus a blend of internally groomed
talent and laterally hired star performers make up Page’s senior management team.
Most importantly, the incentive structure of Page’s senior management team is strongly aligned with
the interests of the company’s shareholders. Bonuses for the year are determined by earnings
growth achieved during the year. Pay-out of majority of the bonuses are deferred for 3-4 years and it
compounds at the rate of Page’s overall earnings growth of the corresponding years. Consequently,
a well-incentivized professionally-run management team delivers proactive and dynamic changes to
the structure of distribution model, raw material procurement model, R&D initiatives and branding
initiatives. These proactive changes are needed for all parts of the business to ‘manage growth’ in
revenues and earnings for the company consistently over a period of time.
Favourable Market forces
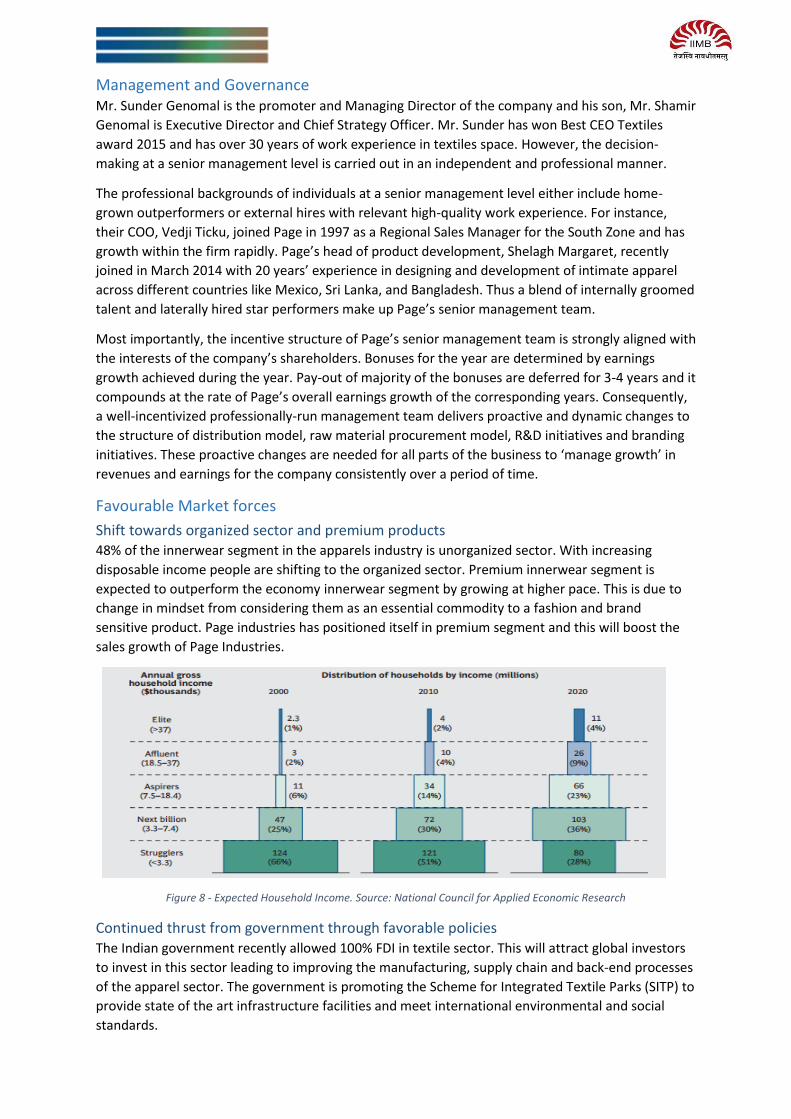
Shift towards organized sector and premium products 48% of the innerwear segment in the apparels industry is unorganized sector. With increasing
disposable income people are shifting to the organized sector. Premium innerwear segment is
expected to outperform the economy innerwear segment by growing at higher pace. This is due to
change in mindset from considering them as an essential commodity to a fashion and brand
sensitive product. Page industries has positioned itself in premium segment and this will boost the
sales growth of Page Industries.
Figure 8 - Expected Household Income. Source: National Council for Applied Economic Research
Continued thrust from government through favorable policies The Indian government recently allowed 100% FDI in textile sector. This will attract global investors
to invest in this sector leading to improving the manufacturing, supply chain and back-end processes
of the apparel sector. The government is promoting the Scheme for Integrated Textile Parks (SITP) to
provide state of the art infrastructure facilities and meet international environmental and social
standards.
The Union Ministry of Textiles plans to enter into bilateral agreements with Africa and Australia for
exports. Moreover, the government is also considering a trade agreement with EU which will allow a
duty free access of Indian garments in EU, which is the second largest destination for readymade
garments in the world. This will lead to higher exports and page industries due to its competitive
advantages is in better position to leverage the same. Further, this will also lead to improving the
EBITDA margins due to better infrastructure.
Economic Moats
Aggressive Distribution Page has more than 450 distributors across India which are segmented geographically and on
product range. They cater to more than 44,000 retail outlets. Page has more than 139 exclusive
brand outlets (EBO). Page also has Multi-brand outlets (MBO), large format stores and hosiery
stores. The EBOs help push new SKUs onto the MBO channel and all new products are first
introduced in EBOs which may be purchased by MBOs after initial success. Sophistication of
distribution channel and frequent product launches gives Page a big advantage.
Research & Development / Innovation Page has always been one step ahead from competitors in terms of innovation. Page, Jockey’s USA
team and other licensees meet twice a year to discuss about new innovations related to product
development. They have recently launched 3-D innovation collection, based on 8-way stretch
technology. Further it has 20-member R&D team which focuses on local preferences and keeps on
introducing new styles.
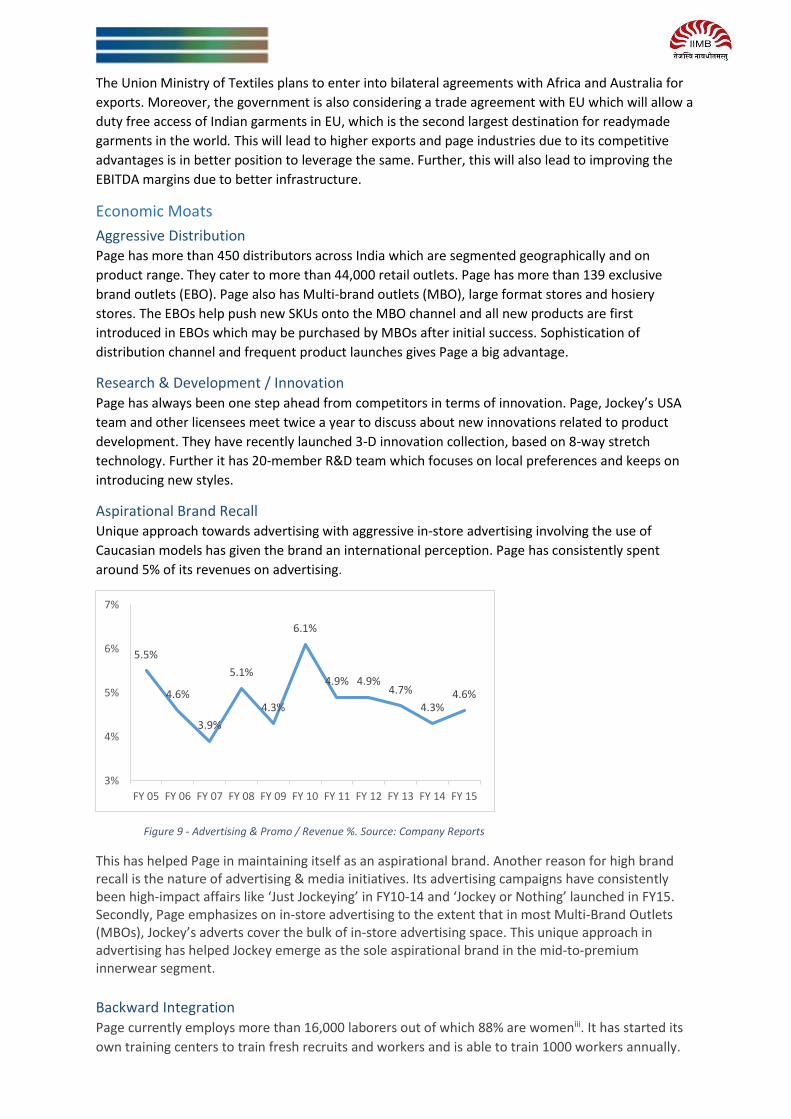
Aspirational Brand Recall Unique approach towards advertising with aggressive in-store advertising involving the use of
Caucasian models has given the brand an international perception. Page has consistently spent
around 5% of its revenues on advertising.
Figure 9 - Advertising & Promo / Revenue %. Source: Company Reports
This has helped Page in maintaining itself as an aspirational brand. Another reason for high brand recall is the nature of advertising & media initiatives. Its advertising campaigns have consistently been high-impact affairs like ‘Just Jockeying’ in FY10-14 and ‘Jockey or Nothing’ launched in FY15. Secondly, Page emphasizes on in-store advertising to the extent that in most Multi-Brand Outlets (MBOs), Jockey’s adverts cover the bulk of in-store advertising space. This unique approach in advertising has helped Jockey emerge as the sole aspirational brand in the mid-to-premium innerwear segment.
Backward Integration Page currently employs more than 16,000 laborers out of which 88% are womeniii. It has started its
own training centers to train fresh recruits and workers and is able to train 1000 workers annually.
5.5%
4.6%
3.9%
5.1%
4.3%
6.1%
4.9% 4.9%4.7%
4.3%4.6%
3%
4%
5%
6%
7%
FY 05 FY 06 FY 07 FY 08 FY 09 FY 10 FY 11 FY 12 FY 13 FY 14 FY 15
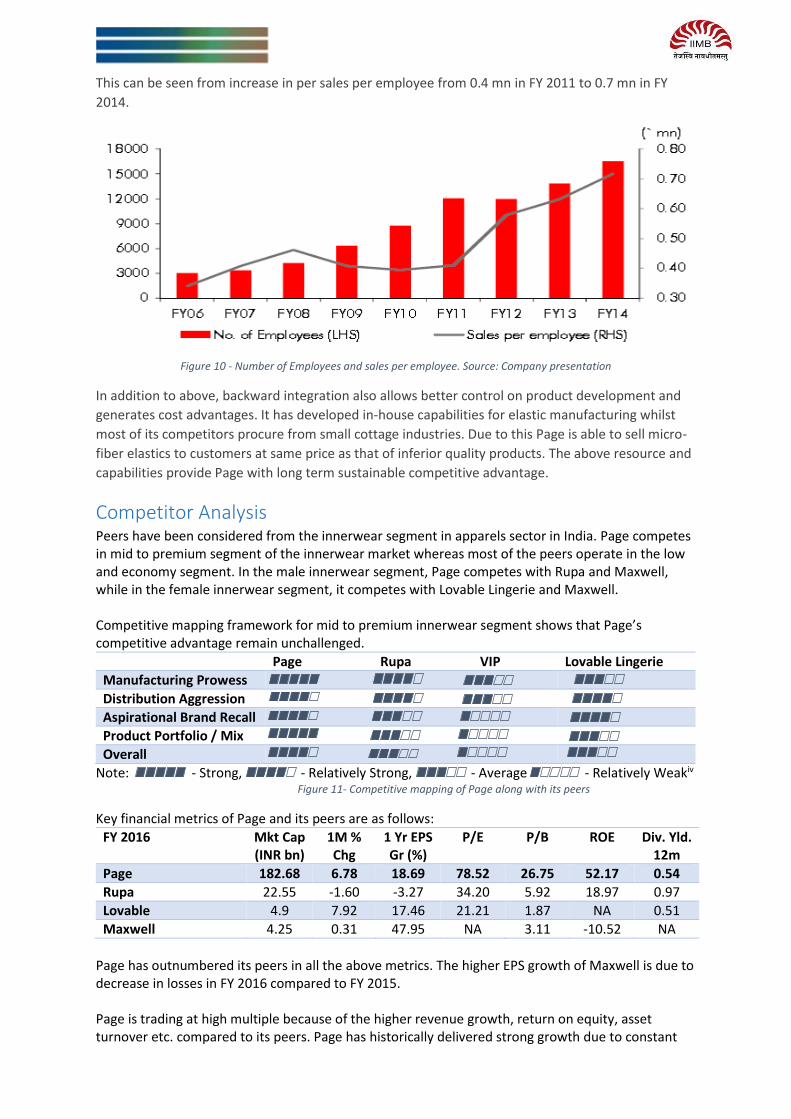
This can be seen from increase in per sales per employee from 0.4 mn in FY 2011 to 0.7 mn in FY
2014.
Figure 10 - Number of Employees and sales per employee. Source: Company presentation
In addition to above, backward integration also allows better control on product development and
generates cost advantages. It has developed in-house capabilities for elastic manufacturing whilst
most of its competitors procure from small cottage industries. Due to this Page is able to sell micro-
fiber elastics to customers at same price as that of inferior quality products. The above resource and
capabilities provide Page with long term sustainable competitive advantage.
Competitor Analysis Peers have been considered from the innerwear segment in apparels sector in India. Page competes in mid to premium segment of the innerwear market whereas most of the peers operate in the low and economy segment. In the male innerwear segment, Page competes with Rupa and Maxwell, while in the female innerwear segment, it competes with Lovable Lingerie and Maxwell. Competitive mapping framework for mid to premium innerwear segment shows that Page’s competitive advantage remain unchallenged.
Page Rupa VIP Lovable Lingerie
Manufacturing Prowess
Distribution Aggression
Aspirational Brand Recall
Product Portfolio / Mix
Overall
Note: - Strong, - Relatively Strong, - Average - Relatively Weakiv Figure 11- Competitive mapping of Page along with its peers
Key financial metrics of Page and its peers are as follows:
FY 2016 Mkt Cap (INR bn)
1M % Chg
1 Yr EPS Gr (%)
P/E P/B ROE Div. Yld. 12m
Page 182.68 6.78 18.69 78.52 26.75 52.17 0.54
Rupa 22.55 -1.60 -3.27 34.20 5.92 18.97 0.97
Lovable 4.9 7.92 17.46 21.21 1.87 NA 0.51
Maxwell 4.25 0.31 47.95 NA 3.11 -10.52 NA
Page has outnumbered its peers in all the above metrics. The higher EPS growth of Maxwell is due to decrease in losses in FY 2016 compared to FY 2015. Page is trading at high multiple because of the higher revenue growth, return on equity, asset turnover etc. compared to its peers. Page has historically delivered strong growth due to constant
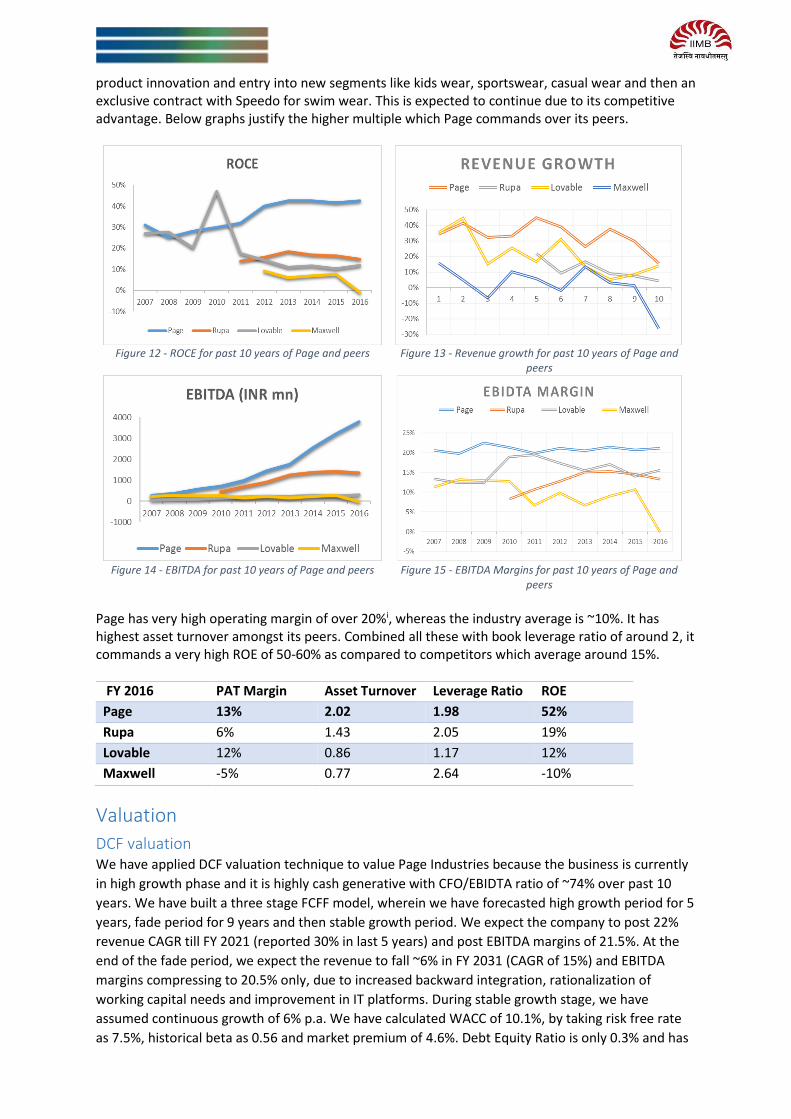
product innovation and entry into new segments like kids wear, sportswear, casual wear and then an exclusive contract with Speedo for swim wear. This is expected to continue due to its competitive advantage. Below graphs justify the higher multiple which Page commands over its peers.
Figure 12 - ROCE for past 10 years of Page and peers Figure 13 - Revenue growth for past 10 years of Page and
peers
Figure 14 - EBITDA for past 10 years of Page and peers Figure 15 - EBITDA Margins for past 10 years of Page and
peers Page has very high operating margin of over 20%i, whereas the industry average is ~10%. It has highest asset turnover amongst its peers. Combined all these with book leverage ratio of around 2, it commands a very high ROE of 50-60% as compared to competitors which average around 15%.
FY 2016 PAT Margin Asset Turnover Leverage Ratio ROE
Page 13% 2.02 1.98 52%
Rupa 6% 1.43 2.05 19%
Lovable 12% 0.86 1.17 12%
Maxwell -5% 0.77 2.64 -10%
Valuation
DCF valuation We have applied DCF valuation technique to value Page Industries because the business is currently
in high growth phase and it is highly cash generative with CFO/EBIDTA ratio of ~74% over past 10
years. We have built a three stage FCFF model, wherein we have forecasted high growth period for 5
years, fade period for 9 years and then stable growth period. We expect the company to post 22%
revenue CAGR till FY 2021 (reported 30% in last 5 years) and post EBITDA margins of 21.5%. At the
end of the fade period, we expect the revenue to fall ~6% in FY 2031 (CAGR of 15%) and EBITDA
margins compressing to 20.5% only, due to increased backward integration, rationalization of
working capital needs and improvement in IT platforms. During stable growth stage, we have
assumed continuous growth of 6% p.a. We have calculated WACC of 10.1%, by taking risk free rate
as 7.5%, historical beta as 0.56 and market premium of 4.6%. Debt Equity Ratio is only 0.3% and has
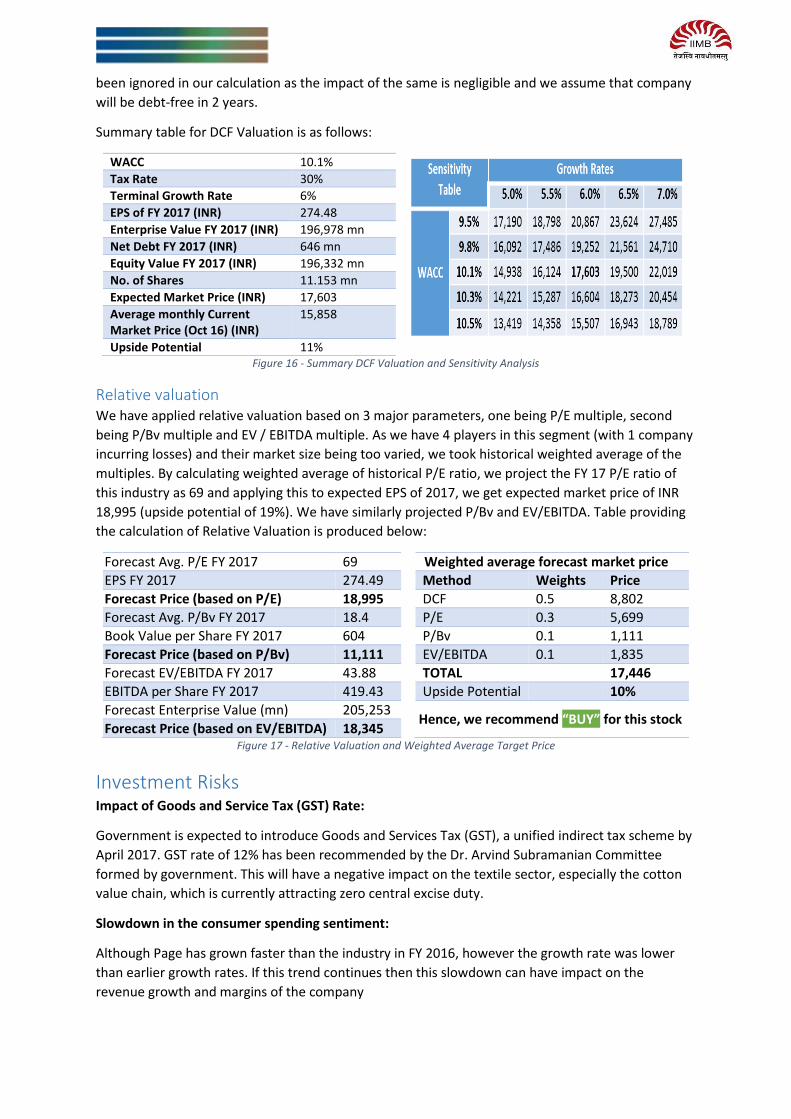
been ignored in our calculation as the impact of the same is negligible and we assume that company
will be debt-free in 2 years.
Summary table for DCF Valuation is as follows:
WACC 10.1%
Tax Rate 30%
Terminal Growth Rate 6%
EPS of FY 2017 (INR) 274.48
Enterprise Value FY 2017 (INR) 196,978 mn
Net Debt FY 2017 (INR) 646 mn
Equity Value FY 2017 (INR) 196,332 mn
No. of Shares 11.153 mn
Expected Market Price (INR) 17,603
Average monthly Current Market Price (Oct 16) (INR)
15,858
Upside Potential 11%
Figure 16 - Summary DCF Valuation and Sensitivity Analysis
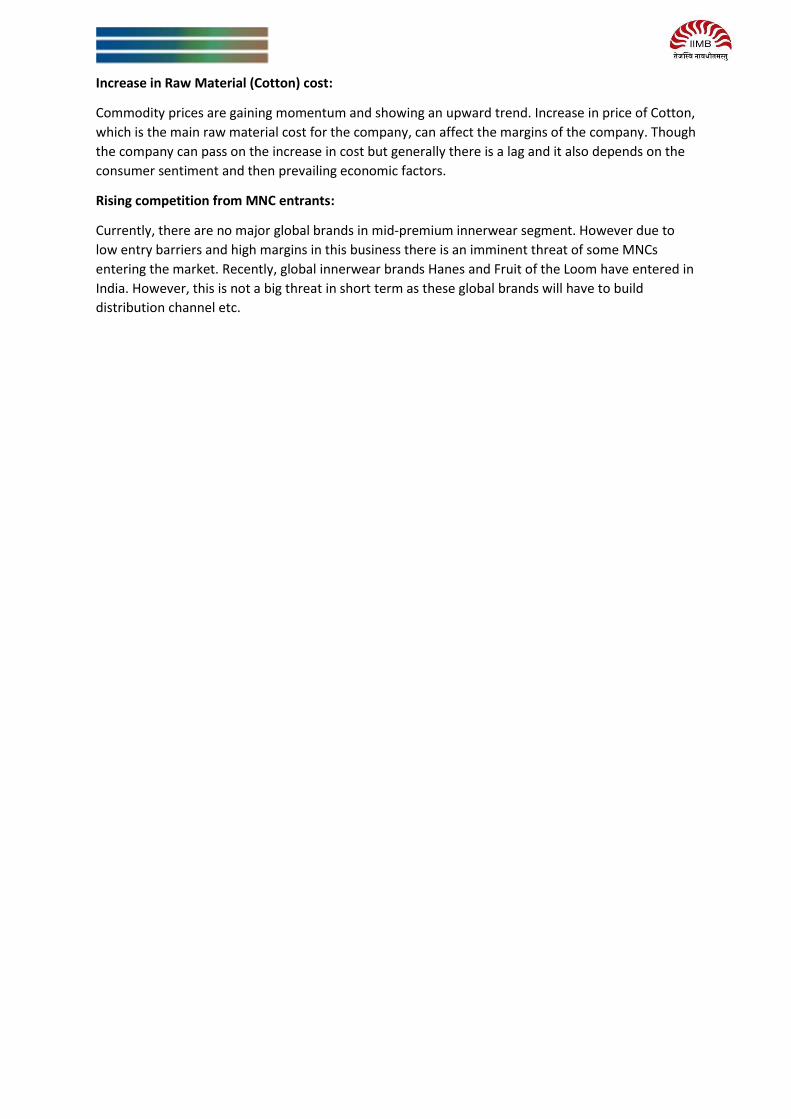
Relative valuation We have applied relative valuation based on 3 major parameters, one being P/E multiple, second
being P/Bv multiple and EV / EBITDA multiple. As we have 4 players in this segment (with 1 company
incurring losses) and their market size being too varied, we took historical weighted average of the
multiples. By calculating weighted average of historical P/E ratio, we project the FY 17 P/E ratio of
this industry as 69 and applying this to expected EPS of 2017, we get expected market price of INR
18,995 (upside potential of 19%). We have similarly projected P/Bv and EV/EBITDA. Table providing
the calculation of Relative Valuation is produced below:
Forecast Avg. P/E FY 2017 69
EPS FY 2017 274.49
Forecast Price (based on P/E) 18,995
Forecast Avg. P/Bv FY 2017 18.4
Book Value per Share FY 2017 604
Forecast Price (based on P/Bv) 11,111
Forecast EV/EBITDA FY 2017 43.88
EBITDA per Share FY 2017 419.43
Forecast Enterprise Value (mn) 205,253
Forecast Price (based on EV/EBITDA) 18,345
Weighted average forecast market price
Method Weights Price
DCF 0.5 8,802
P/E 0.3 5,699
P/Bv 0.1 1,111
EV/EBITDA 0.1 1,835
TOTAL 17,446
Upside Potential 10%
Hence, we recommend “BUY” for this stock
Figure 17 - Relative Valuation and Weighted Average Target Price
Investment Risks Impact of Goods and Service Tax (GST) Rate:
Government is expected to introduce Goods and Services Tax (GST), a unified indirect tax scheme by
April 2017. GST rate of 12% has been recommended by the Dr. Arvind Subramanian Committee
formed by government. This will have a negative impact on the textile sector, especially the cotton
value chain, which is currently attracting zero central excise duty.
Slowdown in the consumer spending sentiment:
Although Page has grown faster than the industry in FY 2016, however the growth rate was lower
than earlier growth rates. If this trend continues then this slowdown can have impact on the
revenue growth and margins of the company
Increase in Raw Material (Cotton) cost:
Commodity prices are gaining momentum and showing an upward trend. Increase in price of Cotton,
which is the main raw material cost for the company, can affect the margins of the company. Though
the company can pass on the increase in cost but generally there is a lag and it also depends on the
consumer sentiment and then prevailing economic factors.
Rising competition from MNC entrants:
Currently, there are no major global brands in mid-premium innerwear segment. However due to
low entry barriers and high margins in this business there is an imminent threat of some MNCs
entering the market. Recently, global innerwear brands Hanes and Fruit of the Loom have entered in
India. However, this is not a big threat in short term as these global brands will have to build
distribution channel etc.
4 PERFORMANCE STOCKS
Company Name: India Cements NSE Symbol: INDIACEM Industry: Cement Current Market Price: INR 157.05 Market Capitalization: INR 48.24 billion 52wk Low/High (INR): 63.90/ 164.20 Recommendation: BUY
About the Company:
- India Cements is the largest cement player in South India, with an installed capacity of 13.1
MTPA.
- In FY16, the company reported a top-line of ~INR 42bn, and a bottom-line of ~INR 1.4bn, an
increase from ~INR 0.3bn in FY15.
Investment Thesis:
- Growth in infrastructure projects due to government initiatives, increased demand from
builders, Tamil Nadu housing scheme for poor and increased infra spend in Telangana and
AP are expected to boost volumes at a CAGR of 5.4% in FY16-18E.
- Management is targeting to improve operational efficiency by reducing power and fuel cost
and increasing capex to induce efficiency.
- It is expected that the EBITDA gap with other players will be bridged substantially (by nearly
40‐50%) in FY17.
Valuation:
- The current EV/ton is 63x. Factoring in for growth and positive future trends, the stock has
been valued at an EV/ton of 58x in FY18.
Risks to recommendation:
- There may be a lag in the government policies to promote infrastructure; this could lead to
substantial dip in top-line growth.
- Cement prices have been at a premium in South India, but have been softening since 2015.
Continuation of this trend would mean reduced realizations.
- A significant portion of the plants can be accorded a vintage status. This could be a
bottleneck due to which the EBITDA gap may not be bridged as targeted.
Company Name: Ashok Leyland NSE Symbol: ASHOKLEY Industry: Automobile Current Market Price: INR 90.25 Market Capitalization: INR 256.84 billion 52wk Low/High (INR): 75.05/ 112.90 Recommendation: BUY
About the Company:
- Ashok Leyland is a major commercial vehicle manufacturer in India. It is the second largest
player across segments with a market share of ~33% in the M&HCV segment.
- In FY16, the company reported a top-line of ~INR 135.6bn, and a bottom-line of ~INR 2.6bn,
an increase from ~INR 1.9bn in FY15.
Investment Thesis:
- Government initiatives towards increasing infrastructure spending, policy actions like
reversal of mining bans, resumption of stalled projects, and increase in medium duty
vehicles due to trickle-down effect are expected to boost volumes.
- Ashok Leyland utilized the recent downturn to revamp its product portfolio; this has enabled
it to outpace the industry and gain market share.
- The debt to equity ratio is at a comfortable level of 0.24x.
- EBITDA margins are expected to improve as a result of increased utilization levels and cost
rationalization measures taken by the management.
Valuation:
- The current EV/EBITDA multiple is 26.9x. Factoring in future growth prospects, the
EV/EBITDA multiple, going forward is expected to be 19x in FY17.
Risks to recommendation:
- Pricing is expected to remain aggressive as recovery is fragile. However, the company is
likely to pass on commodity related and regulatory costs to consumers and maintain
margins.
- Delays in the implementation of government initiatives would affect the top-line.
- Lack of sufficient monsoons will affect tractor sales in particular.
Company Name: Arvind Limited NSE Symbol: ARVND Industry: Textiles Current Market Price: 415.05 Market Capitalization: INR 107.23 Billion 52wk Low/High: 235/420 Recommendation: BUY
About the Company:
Arvind limited is the flagship company of the Lalbhai group. The revenue contribution by segments is
Textiles (63%), Brands and Retail (30%), Real Estate and Others (7%).
The company had exhibited revenue growth CAGR of 12% in FY12-16 and EBITDA and PAT margin
stands at 16.91% and 5.89% in FY16. RoE and RoCE stands at 11.6% and 7.11% respectively.
Investment Thesis:
Portfolio of strong brands: Brands straddled across various prices include Matured brands like
Tommy Hilfiger, Arrow, Flying Machine to growth brands like Calvin Klein, GAP, Nautica,
Aeropostale.
Integrated manufacturing facility: Has Vertically integrated manufacturing facilities producing
cotton yarn to branded output and has partnered with global brands as a manufacturer.
Strong Distribution network: Has 936 Exclusive Brand Outlets and 989 Multi Brand Outlets and
Large format stores including 140 Megamart stores and E-commerce channel.
Favorable social demographics: Evolving customer buying behavior such as purchasing western
brands which reduces the cost of acquisition and further influenced by consumption of western
media content.
Valuation:
Rolling over the EV/EBITDA of 3.5x for its standalone business and EV/Sales of 2.5x for its Brands and
retail business, we arrive at a target price of 500/share.
Risks to recommendation:
1. Forex risks as Arvind derives 30% of its revenues through exports.
2. Growth triggers in Brands and retails business not panning out.
3. Increasing leverage on the back of heavy capital expenditure.
Company Name: Lupin Limited NSE Symbol: LUPIN Industry: Pharmaceuticals Current Market Price: 1490.30 Market Capitalization: INR 672.48 Billion 52wk Low/High: 1280/1948 Recommendation: BUY
About the Company:
Lupin is the 9th largest Pharmaceuticals company in the world. It is engaged in development and
marketing of generic and branded formulations and APIs in anti-TB and Cephalosporin segment.
The revenue decomposition by segments in FY16 is API (9%), Domestic Formulations (25%),
Emerging market Formulations (20%) and Advanced Market Formulations (46%). The company had
grown at a CAGR of 19% in Net Sales, 27% in EBITDA, 21% in Net Profits in FY11-16.
Investment Thesis:
Focus on chronic care in domestic market: From being a anti-TB player, Lupin is focusing on lifestyle
and chronic therapy segments.
Strong growth in the US market: Sales from US market to grow due to more launches from Gavis
and in Derma segment.
EBITDA margin expansion: EBITDA margin is expected to improve by 200 basis points on the back of
strong US sales growth.
Large product and R&D pipeline: Lupin has a total of 149 filings and 256 projects under
development with market size USD 70-80 Billion.
Gavis acquisition to fructify: Gavis sales to grow at 49.8% in FY16-18.
Valuation:
At a forward PE of 23x on the projected FY17 earnings, we have a target of INR 1800.
Risks to recommendation:
1. Competitive price pressure in the US market.
2. Annual Price cuts by MHLW in Japan.
3. Slower than expected growth in India.
4. Longer than expected delays in new products in US.
i Company, Analysts Industry Reports ii Company Management Report iii Company Investor Presentation iv Company Reports and Analysis