Embed Size (px)
Citation preview

DOE/EM-0541
Global PositioningRadiometric Scanner
System
Deactivation and Decommissioning Focus Area
Prepared forU.S. Department of Energy
Office of Environmental ManagementOffice of Science and Technology
March 2001

Global PositioningRadiometric Scanner
System
OST/TMS ID 2954
Deactivation and Decommissioning Focus Area
Demonstrated atIdaho National Engineering and Environmental Laboratory
Large-Scale Demonstration and Deployment ProjectIdaho Falls, Idaho

Purpose of this document
Innovative Technology Summary Reports are designed to provide potential users with theinformation they need to quickly determine whether a technology would apply to a particularenvironmental management problem. They are also designed for readers who may recommendthat a technology be considered by prospective users.
Each report describes a technology, system, or process that has been developed and testedwith funding from DOE’s Office of Science and Technology (OST). A report presents the fullrange of problems that a technology, system, or process will address and its advantages to theDOE cleanup in terms of system performance, cost, and cleanup effectiveness. Most reportsinclude comparisons to baseline technologies as well as other competing technologies.Information about commercial availability and technology readiness for implementation is alsoincluded. Innovative Technology Summary Reports are intended to provide summaryinformation. References for more detailed information are provided in an appendix.
Efforts have been made to provide key data describing the performance, cost, and regulatoryacceptance of the technology. If this information was not available at the time of publication, theomission is noted.
All published Innovative Technology Summary Reports are available on the OST Web site athttp://ost.em.doe.gov under “Publications.”

TABLE OF CONTENTS
1. SUMMARY page 1
2. TECHNOLOGY DESCRIPTION page 6
3. PERFORMANCE page 10
4. TECHNOLOGY APPLICABILITY AND ALTERNATIVES page 14
5. COST page 15
6. REGULATORY AND POLICY ISSUES page 20
7. LESSONS LEARNED page 21
APPENDICES
A. REFERENCES page A-1
B. COST COMPARISON DETAILS page B-1
C. ADDITIONAL GPRS RESULTS page C-1
D. ACRONYMS AND ABBREVIATIONS page D-1

1
SECTION 1SUMMARY
Technology Summary
The United States DOE continually seeks safer and more cost-effective technologies for use indecontamination and decommissioning (D&D) of nuclear facilities. To this end, the Deactivation andDecommissioning Focus Area (DDFA) of the DOE OST sponsors the Large Scale Demonstration andDeployment Projects (LSDDP). At these LSDDPs, developers and vendors of improved or innovativetechnologies showcase products that are potentially beneficial to the DOE projects and to others in the D&Dcommunity. Benefits sought include decreased health and safety risks to personnel and the environment,increased productivity, and decreased costs of operation.
The Idaho National Engineering and Environmental Laboratory (INEEL) LSDDP generated a list ofstatements defining specific needs or problems where improved technology could be incorporated intoongoing D&D tasks. One of the stated needs was for developing technologies that would reduce costs andshorten D&D schedules by providing radiological characterizations to meet the free-release criteria.The Global Positioning Radiometric Scanner (GPRS system shown in Figure 1) utilizes a detection system;a portable computer, a differential global positioning system (d-gps), and a four wheel drive vehicle. Once thesurvey data has been collected, a software program called GeoSoft generates a graphical representationof the radiological contamination extent. Baseline technology involves gridding the area and hand surveyingeach grid.
Figure 1. The Global Positioning Radiometric Scanner System used at the INEEL.

2
This demonstration investigated the associated costs and the required time to evaluate the radiologicalcharacterization data from the GPRS with respect to the baseline technology. The GPRS system performsin-situ, real-time analyses to identify the extent of radiological contamination. Benefits expected from usingthe new innovative technology (GPRS) include:
• Reduced labor hours associated with performing the survey
• Increased number of survey data points
• Reduced exposure to radiation
• Shortened D&D schedules
• Reduced operating costs
• Real time, in-situ radiological measurements
– Visual representation of the extent of radiological contamination
– More accurate and reproducible survey results.
Technology Summary
Baseline Technology
Historically at the INEEL, large area surveys have been conducted using hand-held monitors (see Figure 2).For meeting the free release criteria, the Radiological Control Technician (RCT) uses a portable sodium-iodide (NaI) detector to gather radiological information about this area. If the RCT detected any elevatedreadings during the survey, a Bicron µR meter was used to determine the exact radiological activity andcompared to the release limits. During this survey, the RCT records all information into a field logbook anddocuments any elevated areas. This information is later transcribed onto a map and reported to the D&DFacility Manager.
Figure 2. Baseline Technology uses to characterize a survey grid. Innovative Technology
At the INEEL, the GPRS system is operated by the Environmental Surveillance Program (ESP) forconducting routine large area surface radiation surveys. These surveys are part of a routine surveillanceprogram and are conducted outside the facility fence lines and within known contaminated soil areas toensure no migration of the contaminates has occurred.

3
The GPRS system (as shown in Figure 3) utilizes a detection system, differential global positioning system(d-gps), a portable computer, and a four-wheel drive vehicle. The detection system consists of two 4 in. x 26in. x1.5 in. plastic scintillators housed in an 8 in. x 8 in. x 72 in. white enamel steel box. Each scintillatoruses an independent amplifier channel on a single channel analyzer board and shares a common highvoltage power source; however, the same lower limit of detection and upper limit of detection controls controlboth of the single channel analyzer channels. In addition, each detector is shielded with a 1/8 in. of lead on
the top, sides, and ends to allow the system to collect measurements directly below the unit.
Figure 3. The GPRS surveying an area.
Demonstration Summary
The GPRS was demonstrated in September 1999 at one of the INEEL facilities as part of the INEELLSDDP. This demonstration occurred at the INEEL Initial Engine Test (IET) facility on the IET stack trench,an area approximately 80 ft by 100 ft. The IET stack was dropped into a trench as part of the D&D efforts.The trench was then covered with soil to provide a radiological barrier. This terrain was mostly flat andcovered with crested wheatgrass, making for an ideal survey area. No obstacles, with the exception of thetrench monument, were noted inside the demonstration area. This demonstration started in the morning andwas completed before noon. The GPRS identified the extent of contamination, as well as one small area ofsubsidence with radiation readings above background at the Initial Engine Test (IET) facility (shown in Figure4). Background radiation reading for IET was defined as 13 µR/hr and was determined by the RadiologicalControl Technician (RCT).

4
Figure 4. Graphical display of the GPRS survey result from IET stack trench.
Key Points
The key points of this demonstration are summarized below. Detailed descriptions and explanations ofthese results are found in Section 3 of this report:
• 76% reduction in survey labor hours
• Increased number of survey data points
1. 591 data points by the GPRS
2. Range of 12 to 20 µR/hr with baseline
3. A direct comparison of the number of data points can not be made between these two technologies.The GPRS records information every two seconds while hand surveys will only indicates a range ofthe activity observed during the survey.
• More accurate and reproducible survey results
1. GPS accuracy – less than 20 centimeters (cm)
2. Baseline accuracy – varies upon the survey pattern (maximum value would be 91 cm)
• Real time, in-situ radiological measurements
• Visual representation of the extent of radiological contamination.
Contacts

5
Technical
Technical Information on the Global Positioning Radiometric Scanner System Charlie Schnurr, TSA Systems, Longmont, CO (303) 651-6147 [email protected] Technology Demonstration Harold Thorne, D&D Project Manager, Idaho National Engineering and Environmental Laboratory, (208) 526-8078, [email protected] Kelly C. Wright, Test Engineer, Idaho National Engineering and Environmental Laboratory, (208) 526-2299, [email protected] Management
Steve Bossart, Project Manager, U.S. Department of Energy, National Energy and TechnologyLaboratory,(304) 285-4643, [email protected] Chelsea Hubbard, U.S. Department of Energy, Idaho Operations Office, (208) 526-0645, [email protected] Dick Meservey, INEEL Large Scale Demonstration and Deployment Project, Project Manager, IdahoNational Engineering and Environmental Laboratory, (208) 526-1834, [email protected] Cost Analysis
Wendell Greenwald, U.S. Army Corps of Engineers, (509) 527-7587, [email protected] Tim Jamison, Project Time & Cost Inc. Falls Church, VA, (703) 241-7900, [email protected] Web Site
The INEEL LSDDP Internet web site address is http://id.inel.gov/lsddp Licensing
No license was required. The GPRS system was purchased from TSA Systems. Permitting
No permitting activities were required. Other
All published Innovative Technology Summary Reports are available on the OST Web site athttp://ost.em.doe.gov under “Publications.” The Technology Management System, also available through theOST Web site, provides information about OST programs, technologies, and problems. The OST referencenumber for the Global Positioning Radiometric Scanner System is #2954.

6
SECTION 2 TECHNOLOGY DESCRIPTION
Overall Process Definition
Demonstration Goals and Objectives
The overall purpose of this demonstration was to assess the benefits that may be derived from using theGPRS system for meeting free-release criteria. The GPRS was compared with the baseline technology,which is dividing the area into smaller grids and hand surveying each one. The primary goal of thedemonstration was to collect valid characterization data to make a legitimate comparison between theGPRS system and the baseline technology in the following areas: • Cost
• Productivity rates
• Ease of use
• Limitations and benefits.
Description of the Technology
The GPRS system is a technology used at the INEEL in contaminated soil areas to conduct routine largearea gamma radiation surveys (shown in Figure 3). The GPRS (shown in Figure 5) utilizes a detectionsystem; a portable computer, d-gps, and a four wheel drive vehicle. The detection system consists of two 4in. x 26 in. x 1.5 in. plastic scintillators housed in an 8 in. x 8 in. x 72 in. white enamel steel box. Eachscintillator uses an independent amplifier channel on a single channel analyzer board and shares a commonhigh voltage power source; however, the same lower limit of detection and upper limit of detection controlscontrol both of the single channel analyzer channels. In addition, each detector is shielded with anapproximately 1/8-in. lead on the top and sides to allow the system to collect measurements directly belowthe unit.
The GPRS system operated at a speed of approximately 5 miles per hour (mph) to collect the mostaccurate gamma radiometric data. The detectors are mounted on the front of the four-wheel drive vehicle ata height of 3 ft. The detector system weighs approximately 250 pounds.
During operation, the detector interfaces with the computer and displays the following information:radiometric data (in counts per second for each of the individual detectors), geographical data (both latitudeand longitude coordinates), altitude, time, and date. The system records the gamma radiometric data alongwith the associated geographical coordinates in memory on the onboard computer. This information isupdated approximately every two seconds with the new data.

7
Figure 5. The framework of the GPRS system used at the INEEL.
Specific advantages of the GPRS included the following:
• Versatility of the four wheel drive
• Reducing the time in contaminated soil areas (reduces exposures)
• Using differential-gps data rather than post-processing the geographic coordinates
• Reporting software designed to handle vast amounts of environmental data.
System Operation
Table 1 summarizes the operational parameters and conditions of the GPRS demonstration.

8
Table 1: Operational parameters and conditions of the GPRS demonstration.
Working Conditions Work area location • Initial Engine Test facility (IET) Work area access Access controlled by D&D project through use of fencing and posting Work area description • In order to gain access to IET, the D&D Facility Manager was notified
and the arrangements to use his key to unlock the gate. No D&Dactivities were scheduled.
• Upon arrival, the access gate was open and we notified the FacilityManager about it, after we had gone down to the area and foundnobody around.
• IET is fenced and posted as a controlled area and has a sign stating,“Safety Shoes Required for Entry” due to the D&D activities in thearea.
• The survey area is located inside the IET facility fence line and IET isconsidered to be part of Test Area North complex.
• The trench (survey area) was marked with a monument identifyingwhere the stack was buried underneath the ground.
• The ground surface was smooth and free of any stored items. Thevegetation was mostly crested wheatgrass.
• Photographic services recorded this demonstration. Work area hazards • Tripping
• Heavy equipment operations• Temperature extremes• Driving
Equipment configuration The HUMMER was driven up to IET. The GPRS instrumentation ismounted to front of this vehicle. The vehicle, driven to the work site bythe field operator, transported the test engineer and the Radiation Controltechnician. The HUMMER (GPRS) is generally located at CFA-615 andcontrolled by the Environmental Surveillance Program. Personnel mustbe as a trained source handler to perform the daily response check onthe equipment.
Labor, Support Personnel, Specialized Skills, Training Work Crew Minimum work crew:
• 1 Field Operator• 1 RCT
Additional support personnel • 1 Data collector• 1 Test Engineer• 1 Health and Safety Observer (periodic)
Specialized skills/training • TSA Systems had provided training on the operation of the GPRS tothe field operators (i.e., Environmental Surveillance Programpersonnel).
• OSHA• Source handler training is required to check out the radiological
source used to response check the equipment Waste Management Primary waste generated No primary wastes were generated. Secondary waste generated No secondary wastes were generated. Waste containment anddisposal
No wastes were generated so no containment was necessary.
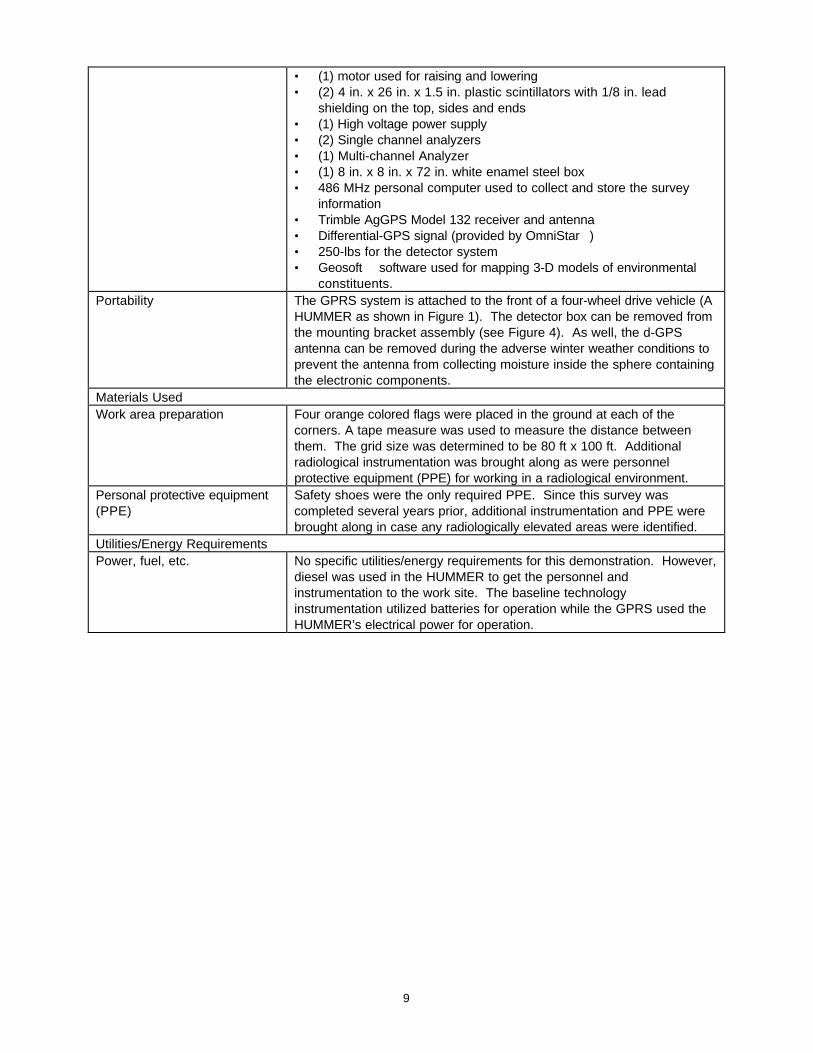
Equipment Specifications and Operational Parameters Technology design purpose To identify surface gamma radionuclide contamination in large area
surveys. Specifications • Four wheel drive vehicle (HUMMER license #E71420)
• Mounting Bracket• (2) Thompson Rods used as guides for raising and lowering the
detector system
9
• (1) motor used for raising and lowering• (2) 4 in. x 26 in. x 1.5 in. plastic scintillators with 1/8 in. lead
shielding on the top, sides and ends• (1) High voltage power supply• (2) Single channel analyzers• (1) Multi-channel Analyzer• (1) 8 in. x 8 in. x 72 in. white enamel steel box• 486 MHz personal computer used to collect and store the survey
information• Trimble AgGPS Model 132 receiver and antenna• Differential-GPS signal (provided by OmniStar)• 250-lbs for the detector system• Geosoft software used for mapping 3-D models of environmental
constituents. Portability The GPRS system is attached to the front of a four-wheel drive vehicle (A
HUMMER as shown in Figure 1). The detector box can be removed fromthe mounting bracket assembly (see Figure 4). As well, the d-GPSantenna can be removed during the adverse winter weather conditions toprevent the antenna from collecting moisture inside the sphere containingthe electronic components.
Materials Used Work area preparation Four orange colored flags were placed in the ground at each of the
corners. A tape measure was used to measure the distance betweenthem. The grid size was determined to be 80 ft x 100 ft. Additionalradiological instrumentation was brought along as were personnelprotective equipment (PPE) for working in a radiological environment.
Personal protective equipment(PPE)
Safety shoes were the only required PPE. Since this survey wascompleted several years prior, additional instrumentation and PPE werebrought along in case any radiologically elevated areas were identified.
Utilities/Energy Requirements Power, fuel, etc. No specific utilities/energy requirements for this demonstration. However,
diesel was used in the HUMMER to get the personnel andinstrumentation to the work site. The baseline technologyinstrumentation utilized batteries for operation while the GPRS used theHUMMER’s electrical power for operation.
10
SECTION 3 PERFORMANCE
Demonstration Plan
Problem Addressed
As with other DOE facilities, the INEEL is in the process of decontaminating facilities, buildings, and areasthat have been or have had the potential for radiological contamination. A characterization tool enhancingthe data generated by the surveys needed to be developed. As part of the data process, it should providemore accurate and reproducible survey information to eliminate transcription errors in locatingcontamination. In addition, visually displaying the extent of gamma contamination is highly desirable. Thiswould allow the D&D Facility Manager the ability to show regulators how their clean-up criteria weredesigned. The purpose of this demonstration is to compare the performance of the innovative technology (GPRS) to thebaseline technology (hand surveying). This demonstration will be conducted at the INEEL IET. The surveyarea has been identified as the trench from the old IET stack and has been designed to be 80 ft by 100 ft insize. In addition to the comparability of these two technologies, the D&D Facility Manager will also use thisinformation to document the decision for this area to be considered clean and meets the criteria establishedfor free release. Demonstration Site Description
The INEEL site occupies 569,135 acres (approximately 890 square miles) in Southeast Idaho. The siteconsists of several primary facility areas situated on an expanse of otherwise undeveloped, high-desertecosystem. Structures at the INEEL are clustered within the primary facility areas, typically less than a fewsquare miles in size and separated from each other by miles of undeveloped terrain. The test area for this demonstration was the IET area, located at the north end of the INEEL’s Test AreaNorth. This area includes buildings and structures that were constructed in the early 1950s for the AircraftNuclear Propulsion Program. After that program ended in 1961, the area was used for the Space NuclearAuxiliary Power Transient Program through 1967 and then for the Hallam Decontamination andDecommissioning Project for two years in the 1970s. Currently, the facility is being demolished. IET isrelatively small in size and the D&D Program feels that part of their responsibility is to cover everythinginside the facility fence line based on the experiments conducted there, as well as the vast amount ofstructural components dispersed across this facility. Major Objectives of the Demonstration
The major objectives of this demonstration were to evaluate the GPRS against the baseline hand surveyingin the following areas: • Cost effectiveness (based on the size of area covered by the GPRS and the detailed survey reports
• Safety
• Ease of Use
• Limitations.
Major Elements of the Demonstration
The intent of this demonstration was to gather information helpful in deciding which technology (i.e., GPRSor baseline hand surveying) would improve or enhance the D&D activities. This demonstration only includedone demonstration area; however, additional survey information has been included from previous surveysconducted at the INEEL. The major elements for this demonstration were as follows:

11
• Surveying Time
• Documentation
• Number of Workers Required
• Safety
• Cost
• Feedback
• Advantages/Disadvantages.
Results
Both technologies were demonstrated during September 1999 on the area identified at IET. Thisdemonstration utilized a baseline hand surveying technique compared to the GPRS. Every attempt wasmade to ensure that the surveys were conducted on the same grid under normal work operations. Allpersonnel involved with this demonstration were requested to conduct their survey under normal operationswith no special emphasis on the survey. Before the demonstration started, the boundaries of the grid were identified and marked by ESP personnel(as shown in Figure 6). The demonstration started with the RCT conducting the baseline hand surveyingtechnique. The RCT traversed the grid back and forth making 28 passes with a portable NaI detector tocomplete. It took the RCT a total of 65 minutes.
Figure 6. Marking the Grid at IET. Next, the GPRS surveyed this same area. One of the features of this new technology is the ability to trackonscreen where the survey has been (shown in Figure 7). The first step of the GPRS survey was toestablish a boundary on-screen so the operator would be able to adequately cover the entire area withoutmissing any locations inside the grid.

12
Figure 7. On-screen Tracking Capabilities of the GPRS.
During this demonstration, video footage was collected from both the baseline hand surveying and theGPRS. The performance of the two technologies is compared in Table 2. Additional large area surfaceradiation surveys results have been included in Appendix C to provide the potential end users will theapplicability of this technology.
Table 2: Performance comparison between the GPRS and the baseline hand surveying technology.
Performance Factor Baseline Hand SurveyingTechnology
GPRS Technology
Personnel/Equipment/Time Required toSurvey
Personnel:• 1 RCT
Equipment:• 1 Bicron µR Meter• 1 Portable NaI Detector• 1 Field logbook
Time:• 65 minutes
Personnel:• 1 Sample Technician (Operator)
Equipment:• 1 GPRS• 1 Zip disk• 1 Field Logbook
Time:• 15 minutes
Time Required to FlagGrid
Personnel:• 2 Sample Technicians Equipment:• 4 Colored Flags• 1 Tape Measure
Time:• 15 minutes
Personnel:• 0
Equipment:• GPRS
Time:• None, all information is recorded
electronically during the survey Time Required toGenerate Report
Personnel:• 1 RCT
Equipment:• 1 Personnel Computer• 1 Field Logbook
Time:• 30 minutes
Personnel:• 1 Engineer
Equipment:• 1 Personnel Computer• 1 Zip disk with data• 1 Field Logbook• 1 Geosoft Software
Time:• 10 minutes
Total Time per • 110 minutes • 25 minutes

13
Technology PPE Requirements • Safety shoes
• Clothing Adequate for surveying• No specific PPE
Superior Capabilities • By walking the entire area, the RCTcould cover larger adverse terrainsbut not safely
• GPRS was considered much easierto operate
• This innovative technology has alarger “widow of view”
• It is much faster and more efficientin collecting data
• It can provide more real-time data• The final report includes a visual
display of the extent ofcontamination found from the surveyresults

14
SECTION 4 TECHNOLOGY APPLICABILITY AND ALTERNATIVES
Competing Technologies
Baseline Technology
The baseline technology for this demonstration is dividing the area into individual grids and hand surveyingusing a portable NaI detector and verifying with a Bicron µR meter if any elevated radiation readings wereidentified. There are various manufacturers that produce variations of the baseline technology. Other Competing Technologies
A broad range of survey technologies is available, such as plastic sctinillation or NaI detectors. However,the GPRS technology combines the geographic coordinates with the radiological information and providesan update approximately every two seconds. Once the data has been recorded on-board the computer, thefile can be downloaded and interpreted through Geosoft software to visually display the extent ofcontamination.
Technology Applicability
The innovative technology is fully developed and commercially available. Its superior performance over thebaseline technology makes it a prime candidate for deployment throughout the commercial sites. Many ofthe similar systems are being used across the DOE complex; however, the GPRS system does providesome added features to enhance the documentation process. The INEEL has deployed this technology ona variety of projects where surface contamination is of concern.
Patents/Commercialization/Sponsor
The GPRS system is commercially available from:TSA Systems Inc.1830 Boston Ave.Longmont, CO 80501Phone: (303) 651-6147 or (303) 651-6149Fax: (303) 651-6823
Charlie Schnurr, Vice [email protected] Frymire, [email protected]

15
SECTION 5COST
Introduction
This section compares the radiological survey cost for the innovative and the baseline technologies. Thecost to use the innovative technology is approximately 76% of the baseline technology cost. The type ofsurveys typically used to monitor existing burial grounds is used as the basis of the cost comparison(periodic radiological surveys of the burial ground surface to detect any contaminant migration).
Methodology
This analysis is based on Government ownership of the equipment and use of on-site labor to perform thework. The costs for the innovative and baseline technologies are derived from observed duration or observedproduction rates for each of the work activities that comprise the work. The observed activities includeresponse checks of the survey instruments, pre-job safety meetings, travel, marking the grid (for thebaseline only), surveying the surface of the burial ground, and data reporting. The demonstration utilized twofield samplers and a radiation control technician to perform much of the work. But, work crews used in theestimate are based on typical work situations at INEEL. A crew consisting of one radiation ControlTechnician is assumed for the baseline technology and a crew of one field sampler is assumed for theinnovative technology. The labor rates for the crew are based on standard rates for the INEEL site. Thesurvey equipment rates are based on the amortized purchase price. This cost analysis omits some non-productive costs. The demonstration began at 7:30 am and was completed by 11:50 am (required 4-hoursand 20-minutes). But, the activities and duration included in this cost analysis account for only 2-hours and40-minutes. Some of the activities omitted from this cost analysis related only to the demonstration (suchas waiting on the photographer). Miscellaneous delays were also omitted if they did not relate directly tothe work activity (such as the delay between the completion of the response check and the start of the pre-job briefing). Additional details of the basis of the cost analysis are described in Appendix B.
Cost Analysis
Costs to Purchase the Technology
The innovative technology is available from the vendor with optional components. The purchase price andinstallation for the global positioning system and the radiological survey instruments can vary from $35,000for a bare bones model to $60,000 for systems similar to the one used in the demonstration. The costs ofthe equipment used in this demonstration are shown in Table 3.
Table 3. Improved technology acquisition costs
Acquisition Option Item Description CostPurchase HUMMER 63,604Purchase & Installation GPS and Detector System 57,800
In addition to the purchase costs, there are costs for annual calibration/maintenance (INEEL anticipatesapproximately $1,500 per year) and a cost for a differential correction signal subscription (approximately$900 per year).
Unit Costs
Figures 8 and 9 shows the unit costs ($/sf of surface surveyed) for the innovative and baseline technologies.The unit costs are based on the costs summarized in Appendix B, Table B-1 and B-2. The figures also showa relative percentage for each of the work activities observed during the demonstration. This percentagerepresents the activity’s cost relative to the total unit cost of the job. Additionally, the site-specific conditions

16
that can significantly affect the cost of the activity are identified on the figure under the title Site SpecificConditions and this provides information about the conditions encountered for this demonstration. Thepercentage information and the condition information provide some indication of the potential variation in unitcost that may occur at other sites. The activities that are 1% to 5% of the total cost have little affect on thetotal cost, even if these activities have the potential for large variation. For example, if the survey area wereuneven and slowed down the survey rate of the GPRS by 20%, there would be more time required. But thisadditional time would have little impact to the total cost and the unit cost. But, a moderate variation in costof those activities that are 15% or more of the total unit cost will have a significant impact on the total. Forexample, if the baseline surveys were performed using 50% coverage rather than the 100% coverage used inthe demonstration, then the unit cost for that situation would be significantly less than the unit costcomputed for this demonstration. The size of the job affects the unit costs for both the innovative and thebaseline. If the job size is 16,000 sf (rather than the 8,000 sf demonstration size) then the unit costs areapproximately 60% of the unit costs shown below.
Figure 8. Breakdown of innovative technology unit cost.
0% 2 0 % 4 0 % 6 0 % 8 0 % 1 0 0 %
Percent of Total Cost
Travel to Survey Area
Return Travel
Pre-Job Safety Meeting
Response Check
Survey Area
Generate Report
Ac
tiv
itie
s
Site Specific Conditions
30 minutes to work site
Approximately 1cf of PPE from work in Rad
15 minutes
8,000 sf area no delineation of hot spots
15 minute safety meeting
Unit Cost = $0.016 / sf
30 minutes to work site

17
Figure 9. Breakdown of baseline technology unit cost.
Payback Period
For this demonstration, the innovative technology saves approximately $0.005/sf over the baseline. At thisrate of savings, the purchase price of $121,404 (including HUMMER and instrumentation) would berecovered by using the innovative technology to survey approximately 24280800 sf (558 acres).
Observed Costs for Demonstration
Figure 10 summarizes the costs observed for the innovative and baseline technology for surveying 26locations. The details of these costs are shown in Appendix B and includes Tables B-1 and B-2 which canbe used to compute site specific costs by adjusting for different labor rates, crew makeup, etc.,
0% 20% 40% 60% 80% 1 0 0 %
P e r c e n t o f T o t a l C o s t
Survey Area
Pre-Job Safety Meeting
Travel to Survey Area
Return Travel
Grid Survey Area
Generate Report
Response Check
Record Survey Data
Ac
tiv
itie
sSite Specific Conditions
NaI detector full coverage no hot spot
delineation
30 minutes to work site
15 minutes
No areas above background recorded
30 minutes to work site
Unit Cost = $0.021 / sf
15 minutes for safety meeting
30 minutes
Gid each direction on 3-ft centers

18
$72
$27 $29
$0
$128
$22
$169
$55
$92
$0$0
$20
$40
$60
$80
$100
$120
$140
$160
$180
Mobilize Characterization Demobilize Disposal Total Cost
Innovative
Baseline
Figure 10. Summary of technology costs.
Cost Conclusions
The innovative technology is approximately 76% of the cost of the baseline technology for thisdemonstration. The innovative technology has a production rate that is four times greater than the baseline'sproduction for radiological surveys. The production rates for the innovative and the baseline technologies aresummarized below in Table 4:
Table 4. Summary of sampling production rates
Production RateType of WorkInnovative Technology Baseline Technology
Mark Grid Not needed 16,000 sf/hrSurvey Area 32,000 sf/hr 7,407 sf/hr
The production rate for the baseline reflects using the NaI detector. If "hot spots" were identified thendelineation of the "hot spot" would be normal practice. No "hot spots" were delineated during thisdemonstration. The number of "hot spots" and size of the "hot spots" can have a significant impact on theoverall production rate and cost. For example, delineating 10-sf would have added approximately 20minutes to the overall survey time. The additional 20 minutes reduces the baseline's production rate by 25%and increases the total cost by approximately 10%. In addition to the "hot spot" delineation, the baselineproduction rate is greatly affected by the coverage requirements. In this demonstration, 100% of the surfacewas surveyed. Other situations may allow less complete coverage and would directly affect the cost.Obstacles and uneven surfaces affect the production rate for the GPRS. The production rate observed inthis demonstration is for near optimum driving conditions. Although adverse driving conditions will affect theproduction rate for GPRS, the overall affect on cost is anticipated to be small.

19
This cost analysis is based on a one-person crew for both innovative and baseline technology costs. Insome situations, safety requirements may make a "buddy" necessary. The additional crewmember wouldincrease costs by approximately 60%.
The GPRS costs are based on the most expensive configuration of the equipment (upper limit costs fordetection equipment plus HUMMER cost). A less expensive configuration (bottom limit cost for detectionequipment and less expensive four-wheel-drive vehicle) could reduce equipment rates by 25% and overallcosts by 12%.

20
SECTION 6 REGULATORY AND POLICY ISSUES
Regulatory Considerations
The GPRS meets the requirements for 10 CFR, Chapter III, Department of Energy, Part 835, and“Occupational Radiation Protection.” It also meets the requirements specified in DOE-STD-1098-99,“Radiological Control,” dated July 1999. In order to properly perform the daily response check, theoperators must be trained as a source user and check the gamma source (Source # H-007) out from theCentral Facility Area RCTs. For this demonstration, a test plan and the technical procedure requirement(TPR-EM-ESP-5.4, “Surface Radiation Surveys Using the GPRS”) covered the use of the GPRS under theINEEL LSDDP.
Safety, Risks, Benefits, and Community Reaction
The safety issue associated with the use of the GPRS is primarily driving hazards. These risks are easilymitigated through the use of two different people (i.e., one driver and one passenger) during surveys. Thepassenger is responsible for watching for potential hazards on the right side of the vehicle, as well asensuring the information is being properly acquired. The risks associated with the use of the GPRS areroutinely acceptable to the public.

21
SECTION 7 LESSONS LEARNED
Implementation Considerations
The GPRS is a mature technology that performed well during the INEEL demonstration. Operating thesurvey unit required no special skills to use; however, the Geosoft software required the user to be trainedto understand how to operate. According to the operators, this technology was much easier and faster tocomplete a large surface survey. Once the personnel had been trained with this specific software, thesystem was user-friendly and able to generate a higher quality of detail for documenting the extent ofradiological contamination. Items that should be considered before implementing the GPRS include thefollowing: • Daily response check on the detectors should be conducted prior to conducting the survey to ensure
the plastic scintillators are properly responding.
• Annual preventative maintenance needs to be performed on the survey unit.
• Measurements are collected at a height of 3 ft and an optimal speed of 5 mph.
• During adverse weather conditions (i.e., winter months) the detector unit should be removed from thevehicle and stored inside doors to protect the integrity of the detectors.
• Historical information regarding the survey area needs to include possible radiological constituents.This technology is only applicable to gamma-emitting radionuclides.
• Weather and soil conditions could affect the measurements and the decontamination requirements.
• Background and trigger limits for the radiation measurements need to be determined prior to enteringthe survey area. Generally, background measurements are collected from the adjacent area that isconsidered clean or with similar soil chemistry.
Technology Limitations and Needs for Future Development
As mentioned above, this demonstration went rather well. It was able to identify a subsidence area that wasoverlooked by the baseline technology. However, the GPRS technology can only detect gamma-emittingradionuclides. If this technology is needed to survey in a contaminated area containing alpha or beta-emitting radionuclides, it could detect them. This system operates at a level of 3 ft above the surface. Theuser to calculate these other radiological constituents, if the relationships between the various radionuclideshave been pre-determined could apply scaling factors. Normally, this relationship is from analytical results.Depending upon the amount of moisture in the soil of the survey area, this could affect the measurements.The detector assembly is fairly heavy (approximately 250 pounds); so, at least two people are required toremove it. Ideally, this unit can be removed by an engine hoist, which imposes additional trainingrequirements. A need for future development would be to retrofit this technology with a real-time capability for identifyingthe gamma-emitting radionuclides. Perhaps simply implementing a sodium iodide detector using thequadratic compression capability would allow this system to accomplish this task. This would enhance thecapability of this technology and assist with the characterization process for unknown contaminated areas.However, it should be used with a suite of additional tools (i.e., In-Situ Gamma Spectroscopy) to quantifyand identify the gamma constituents of this survey area. Another enhancement might be to place a soil moisture probe on the system so that frequencymeasurements can be made to determine if the moisture content is affecting the measurements. Inaddition, if the system had the ability to automatically mark locations of interests (i.e., above trigger limits),this would expedite the clean-up process for D&D.

22
Technology Selection Considerations
Based on the INEEL demonstration and the information provided in Appendix C, GPRS technology is abetter methodology for conducting large area survey measurements rather than using the baselinetechnology. GPRS can provide a better coverage of the survey area and provide known coordinates forfurther actions, once identified. A visual representation of the extent of contamination can be generated andassist with verifying or validating the decision making process. The initial capital invested into this technology could be paid off in a relatively short time depending upon theamount of large area surveys needing to be characterized. As shown with this demonstration, a 77% laborsavings was calculated. However, if the end user has limited use for this technology, it may be too costly.

A-1
APPENDIX A REFERENCES
Lockheed Martin Idaho Technologies Company, 1999, Idaho National Engineering and Environmental
Laboratory Document TPR-EM-ESP-2.1, “Surface Radiation Surveys Using the GPRS”, Rev.1.
B-1
APPENDIX BCOST COMPARISON DETAILS
Basis of Estimated Cost
The estimates for the innovative and baseline technologies are based on activities that were observed duringthe demonstration or are based on experience with similar types of work at INEEL. The estimate isstructured so that the activities are grouped under higher-level work titles per the work breakdown structureshown in the Hazardous, Toxic, Radioactive Waste Remedial Action Work Breakdown Structure andData Dictionary (HTRW RA WBS) (USACE 1996). The HTRW RA WBS, developed by an interagencygroup, is used in this analysis to provide consistency with the established national standards.
The following assumptions were used in computing the hourly rates for work crews and equipment:
• The innovative and the baseline equipment are assumed to be owned by the Government.
• The equipment rates for Government ownership are computed by amortizing the purchase price of theequipment, plus a procurement cost of 5.2% of the purchase price.
• The equipment hourly rates assume a service life of 10 years for the GPS and detection instrumentsand 15 years for the HUMMER. An annual usage of 960 hours per year is assumed for the innovativeand baseline equipment based on past usage at INEEL.
• The equipment hourly rates for the Government’s ownership are based on general guidance contained inOffice of Management and Budget (OMB) Circular No. A-94, Cost Effectiveness Analysis.
• The crews are based on similar work at INEEL.
• The standard labor rates established by the INEEL are used in this estimate and include salary, fringe,departmental overhead, material handling markups, and facility service center markups.
• The equipment rates and the labor rates do not include the Lockheed Martin general and administrative(G&A) markups. The G&A are omitted from this analysis to facilitate understanding and comparisonwith costs for the individual site. The G&A rates for each DOE site varies in magnitude and in the waythey are applied. Decision-makers seeking site-specific costs can apply their site’s rates to thisanalysis without having to first back out the rates used at the INEEL.
The analysis does not include costs for oversight engineering, quality assurance, administrative costs for thedemonstration, or work plan preparation costs. This cost analysis omits some non-productive costs. Thedemonstration began at 7:30 am and was completed by 11:50 am (required 4-hours and 20-minutes). But,the activities and duration included in this cost analysis account for only 2-hours and 40-minutes. Some ofthe activities omitted from this cost analysis related only to the demonstration (such as waiting on thephotographer). Miscellaneous delays were also omitted if they did not relate directly to the work activity(such as the delay between the completion of the response check and the start of the pre-job briefing).
Activity Descriptions
The scope, computation of production rates, and assumptions (if any) for each work activity is described inthis section.
Mobilization (WBS 331.01)
Response Check: Perform daily response checks on the radiological instrumentation. It usually involveschecking the battery to make sure it is properly working and instrumentation responds to a knownradiological source. A radiation control technician performs response check.
Pre-Job Safety Meeting: The duration for the pre-job safety meeting is based upon the observed time for thedemonstration. The labor costs for this activity are based upon an assumed crew (rather than the actual

B-2
demonstration participants, and all subsequent activities are based on the assumed crews). The baselineassumes one radiation control technician and the innovative assumes one field-sampling technician.
Travel to Survey Area: Crew's travel time to work area. The duration is based on the observed time for thedemonstration.
Characterization (WBS 331.17)
Grid Survey Area: The size of the area was 80 ft by 100 ft. The grid lines were 3 ft on center in bothdirections to allow 100% coverage by the baseline technology. Observed production rate for establishing thegrid was 16,000 sf/hr (this is adjusted from 32,000 sf/hr for two grid markers to a production rate of 16,000sf/hr for a crew of one).
Survey Area: The surveyed area for the demonstration was 8,000 sf. The observed production rate was7,407 sf/hr for the baseline based on using the NaI detector and 32,000 sf/hr for the innovative. Thesurveying with the NaI detector covered 100% of the area.
Delineate Hot Spots: This activity would have included a cost for the baseline technology for delineating any"hot spots" identified by the NaI detector. No "hot spots" were identified during this demonstration and nocosts for this are included in this estimate.
Record Survey Data: The RCT documents the field survey information. This information includes any areasidentified as radiologically elevated. The estimate is based on the observed time from the demonstration.
Generate Report: The estimate for GPRS is based on the observed time from the demonstration. Theestimate of the baseline cost is based on similar work at INEEL.
Demobilization (WBS 331.21)
Return Travel: The estimate is based on the observed time from the demonstration.
Disposal (WBS 331.18)
No waste disposal was required for this demonstration.
Cost Estimate Details
The cost analysis details are summarized in Tables B-1 and B-2. The tables breaks out each member of thecrew, each labor rate, each piece of equipment used, each equipment rate, each activity duration, and allproduction rates so that site specific differences in these items can be identified and a site specific costestimate may be developed.

B-3
Table B-1. Innovative Technology Cost Summary
Notes:1. Unit cost = (labor + equipment rate) X duration + other costs, or = (labor + equipment rate)/production rate + other costs2. Abbreviations for units: ls = lump sum; ea = each; and, loc = location; ft3 = cubic feet.3. Other abbreviations: PPE = personal protective equipment.
Pro-duction
RateDuration
(hr)Labor Item $/hr $/hr
Other $
ea 1 14.71$ 0.25 RCT 39.45 19.38ea 1 27.52$ 0.25 FS+JS 90.68 19.38ea 1 29.27$ 0.50 FS 39.15 19.38
sf 0 -$ sf 8,000 14.63$ 32000 FS 39.15 19.38sfeaea 1 12.56$ 0.17 EN 55.95 19.38
ea 1 29.27$ 0.500 FS 39.15 19.38
Rate $/hr
Abbreviation
Rate $/hr
Abbrev- iation
Rate $/hr
Abbrev- iation
19.38 GPRS
Not needed for GPRS27.19$
127.94$
27.5214.71
GPRS on standbyGPRS on standby
Mobilization (WBS 331.01)
Comments
71.49$
29.27$
32000sf/hr production rate
10 minutesNot needed for GPRS
GPRS
-$
Labor and Equipment Rates used to Compute Unit Cost
39.15
Equipment Item
51.53
RCTFS
Crew Item Equipment Item
12.56
Field SamplerEngineerJob Supervisor
ENJS
Radiation Control Tech 39.45
55.95
29.27Disposal (WBS 331.18)
Demobilization (WBS 331.21)Return Travel
Rate $/hr
Crew ItemAbbrev- iation
Facility Deactivation, Decommissioning, & Dismantlement
Work Breakdown Structure
Pre-Job Safety MeetingResponse Check
GPRS
Travel to Survey Area GPRS on standby
Grid Survey Area 0.00
Unit Cost $/unit
Unit
Generate ReportRecord Survey DataDelineate Hot SpotsSurvey Area 0.00
Computation of Unit Cost
Equipment Items
Characterization (WBS 331.17)29.27
Total CostQuan-
tity
Subtotal =
Subtotal =
Subtotal =GPRS on standby
GPRS on standby
TOTAL COST FOR DEMONSTRATION =
Subtotal =

B-4
Table B-2. Baseline Technology Cost Summary
Notes:1. Unit cost = (labor + equipment rate) X duration + other costs, or = (labor + equipment rate)/production rate + other costs2. Abbreviations for units: ls = lump sum; ea = each; and, loc = location; ft3 = cubic feet.3. Other abbreviations: PPE = personal protective equipment.
Pro-duction Rate
Duration (hr)
Labor Item $/hr $/hrOther
$
ea 1 10.47$ 0.25 RCT 39.45 2.41ea 1 23.35$ 0.25 JS+RCT 90.98 2.41ea 1 21.74$ 0.50 RCT 39.45 4.03
sf 8,000 21.74$ 16000 RCT 39.45 4.03sf 8,000 46.96$ 7407 RCT 39.45 4.03sfea 1 3.62$ 0.08 RCT 39.45 4.03ea 1 19.73$ 0.50 RCT 39.45
ea 1 21.74$ 0.500 RCT 39.45 4.03
Rate $/hr
Abbreviation
Rate $/hr
Abbrev- iation
Rate $/hr
Abbrev- iation
2.41 NaI1.62 VH
TOTAL COST FOR DEMONSTRATION =
Subtotal =
Subtotal =
Subtotal =
Subtotal =NaI & VH
NaI & VH standby
Computation of Unit Cost
Equipment Items
Characterization (WBS 331.17)21.74
Total CostQuan-
tityUnit Cost
$/unitUnit
Generate ReportRecord Survey DataDelineate Hot SpotsSurvey Area 0.01
3.62
NaI & VH
Travel to Survey Area NaI & VH
Grid Survey Area 0.00 NaI & VH standby
Facility Deactivation, Decommissioning, & Dismantlement
Work Breakdown Structure
Pre-Job Safety MeetingResponse Check
Rate $/hr
Crew ItemAbbrev- iation
21.74Disposal (WBS 331.18)
Demobilization (WBS 331.21)Return Travel
19.73
Field SamplerEngineerJob Supervisor
ENJS
Radiation Control Tech 39.45
55.95
RCTFS
Crew Item Equipment Item
Labor and Equipment Rates used to Compute Unit Cost
39.15
Equipment Item
51.53
NaI and Bicron2x4 vehicle
-$
30 minutes5 minutesNo hot spots detected
Comments
55.55$
21.74$
7407sf/hr production rate16000sf/hr production rate
92.05$
169.34$
23.3510.47
NaI on standbyNaI on standby
Mobilization (WBS 331.01)

C-1
APPENDIX C ADDITIONAL GPRS RESULTS
INEEL GPRS SURVEY RESULTS
Historically, the GPRS technology at the INEEL has been as part of the routine Environmental SurveillanceProgram (ESP). Recent modifications have made this technology more valuable in large area surveystechnology. Figures C-1 and C-2 show the results from semi-annual large area surveys conducted at theRadioactive Waste Management Complex (RWMC) Subsurface Disposal Area (SDA). This information hasbeen used to evaluate the waste confinement and trend the radiological values at the SDA. The SDA isapproximately 100 acres in size and usually requires one week to survey all the accessible areas within theSDA. In addition, the graphical representation can be compared to each other to assist operations inlocating any areas of concern.
Figure C-1. Example of the Spring RWMC Survey Results
Figure C-2. Example of the Fall RWMC Survey Results

C-2
Figure C-3 shows the survey results from the Organic Moderated Reactor Facility (OMRE). This area atOMRE is less than two acres in size and usually required about 4 hours to complete. This area is surveyedannually by ESP and used for trending purposes.
Figure C-3. Example of the OMRE Survey Results In Figures C-4 and C-5 show the results over a two year period from a soil contamination area locatedoutside the fence line of the Idaho Nuclear Technology and Environmental Complex (INTEC) in the northeastcorner. These surveys are conducted annually to assist various programs at the INEEL in making decisionsabout the contamination.
Figure C-4. Example of the 1998 INTEC Survey Results

C-3
Figure C-5. Example of the 1999 INTEC Survey Results.

D-1
APPENDIX DACRONYMS AND ABBREVIATIONS
$/sf Dollar per square footCFA Central Facility AreaCFR Code of Federal RegulationD&D Decontamination and DecommissioningDDFA Deactivation and Decommissioning Focus Aread-gps Differential global positioning systemDOE Department of EnergyESP Environmental Surveillance ProgramG&A General and AdministrativeGPRS Global Positioning Radiometric ScannerHTRW RA WBS Hazardous, Toxic Radioactive Waste Remedial Action Work Breakdown
Structure and Data DictionaryIET Initial Engine TestINEEL Idaho National Engineering and Environmental LaboratoryLSDDP Large Scale Demonstration and Deployment Projectmph Miles per hourNaI Sodium iodideNETC National Energy and Technology CenterOMB Office of Management and Budget (OMB)OMRE Organic Moderated Reactor ExperimentOST Office of Science and TechnologyPPE Personal Protective EquipmentRCT Radiological Control TechnicianRWMC Radioactive Waste Management ComplexSDA Subsurface Disposal Area