Embed Size (px)
Citation preview

Global Project Management Survey: Cultural, Individual and Organizational Competence in Project Management
ReportOn behalf of GPM
October 2010

1
Management Summary
The report at hand provides findings from a survey with 449 respondents from 49 countries across a range of industries and project types.
A high importance of projects is stated across all regions.
General attitudes of respondents towards working and working in projects vary across regional clusters:
The importance of trust, senior management support and standardization varies strongly across regions.
Japan and China display the highest hierarchy preferences and lowest senior management support.
Transformational leadership is the prevalent leadership behavior in successful projects across all regions.
Respondents assessing their projects as more successful than others concurrently state a higher degree of transformational leadership displayed by their supervisors.
A gap between the assessed importance of projects and project management is evident in nearly all regional clusters.

2
1 Objectives and Procedures of the Survey
Data Set and Environmental/Cultural Characteristics
3 Individual Competences
Organizational Competences45 Success Outcomes
6 Context Factors
7 Conclusion
8 Comparative Analysis of the Regional Cluster “Germanic”
2

3
Growing importance of working in and with projects in many companies and industry sectors raises interest in the success of this kind of organizational work.
Projectification of organizational work implies certain characteristics a company has to meet in order to successful integrate temporary work in permanent organizational processes.
Contrariwise, working in projects requires different modes of operation of employees in contrast to long-established processes.
These modes of operation serve as indicators for the level of maturity of a company's project management.
Initial situation/ Motivation of the survey

4
Aims of the study
To investigate the requirements of project management („objectives“) and its status quo („practices“).
To analyze personal competences of project workers and managers and organizational competences, fostering employees’ potentials.
To identify how personal and organizational competences impact project management outcomes.
To consider cultural particularities in project management.

5
Conception of survey (1/3)
Rationale of survey concept: The success of a company‘s project management is based on several factors and dimensions.
Project management success constituted of hard (“iron triangle”) as well as soft(stakeholder satisfaction) elements:
Survey on present status quo of project management in organizations has to cover PM-influencing factors on several levels and dimensions.
Measurement of project management success has to be carried out multi-dimensionally in order to commensurably grasp project management success.
The inclusion of respondent’s national and cultural background allows us to:
Compare project management competence of firms on an international level, thereby showing possible differences in project management success caused by society/national-based culture.
Indicate where country-specific characteristics in the project management context apply – and thus how to cope with them.

6
Conception of survey (2/3)
PM-influencing factors measured on several levels and dimensions, i.e. national, organizational and individual level.
Organizational capabilities measured according to factors which can be clustered in hard and soft factors.
Regional Culture is herewith regarded as the crucial element, since it is assumed to influence the potential of project participants and must therefore be especially regarded.
The inclusion of contextual factors such as country, industry, organizational characteristics allows the measurement of their respective impact on project management success factors. In particular, country-specific characteristics of variables are of interest.
The reasons stated motivate the following items included in the survey:

7
Conception of survey (3/3)
Overview of research model:
Project Success
Individual Competences
OrganizationalCompetences
Context factors: Culture | Industry & Project Type | Work conditions
4
5
2/6
= project related capabilities= contextual factors= respective section of
presentation= influence
X
3

8
1 Objectives and Procedures of the Survey
2 Data Set and Environmental/Cultural Characteristics
3 Individual Competences
Organizational Competences45 Success Outcomes
6 Context Factors
7 Conclusion
8 Comparative Analysis of the Regional Cluster “Germanic”

9
Data set and sample composition
Size of company Role of the respondent in project
Sample Members of the IPMA and clients of PA (worldwide)
Instrument of data collection Standardized questionnaire with free text field questions
Method of data collection Online-survey with open access
Survey period January 22nd until June 30th 2010
Number of responses 449
57,8
16,1
11,3
11,0
3,1
0,7No answer
Project office staff/ Member project office
Leader/Manager of project office (PMO)
Member of project team/project staff
Program manager/ Coordinator
Project manager/ Project leader3,8
9,6
5,0
10,1
3,8
21,1
12,0
14,9
4,8No answer
> 100
50 - 100
21 - 50
11 - 20
5 - 10
< 5
Num
ber o
f em
ploy
ees
N = 449; frequencies (%)

10
A wide range of industries and project types are represented
Industry Type of projects
17,0
11,8
10,6
10,3
9,6
6,7
5,8
5,0
4,1
3,4
3,4
2,6
2,2
1,9
1,9
1,9
1,7
0,2ChemicalsPharmaceuticals
Service industryMechanical / plant engineering
AerospaceElectronics
UtilitiesTransportation
Telecommunication
Manufacturing industryConstruction
Public sectorFinancial Industry
AutomotiveConsulting
OtherInformation systems
No answer
2,41,2Other
0,74,6Organizational project
6,17,8R&D project (e.g. technical or product development)
14,38,7Investment project
16,314,6IT projects
6,616,7Organizational development project
External Project
Internal ProjectType of Project
N = 449; frequencies (%)
11
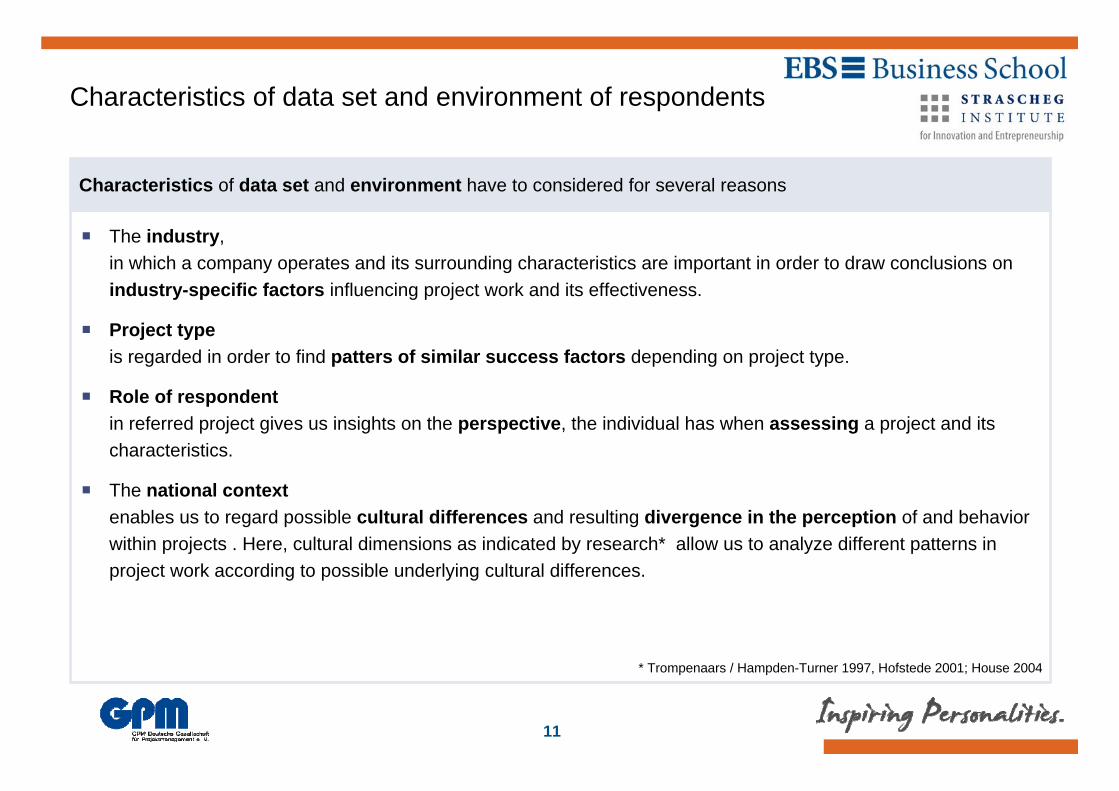
Characteristics of data set and environment of respondents
The industry, in which a company operates and its surrounding characteristics are important in order to draw conclusions on industry-specific factors influencing project work and its effectiveness.
Project typeis regarded in order to find patters of similar success factors depending on project type.
Role of respondentin referred project gives us insights on the perspective, the individual has when assessing a project and its characteristics.
The national contextenables us to regard possible cultural differences and resulting divergence in the perception of and behavior within projects . Here, cultural dimensions as indicated by research* allow us to analyze different patterns in project work according to possible underlying cultural differences.
Characteristics of data set and environment have to considered for several reasons
* Trompenaars / Hampden-Turner 1997, Hofstede 2001; House 2004

12
Afghanistan
Finland
Lesotho
Slovenia
Australia
Germany
Luxembourg
South Africa
Austria
Greece
Mexico
Spain
Belgium
Hungary
Nepal
Sudan
Botswana
India Netherlands
Sweden
Brazil
Indonesia Norway
Switzerland
Canada
Iran
Poland
Turkey
China
Italy
Romania
United Arab Emirates
Denmark
Japan
Russia
United Kingdom
Egypt
Latvia
Saudi Arabia
United States
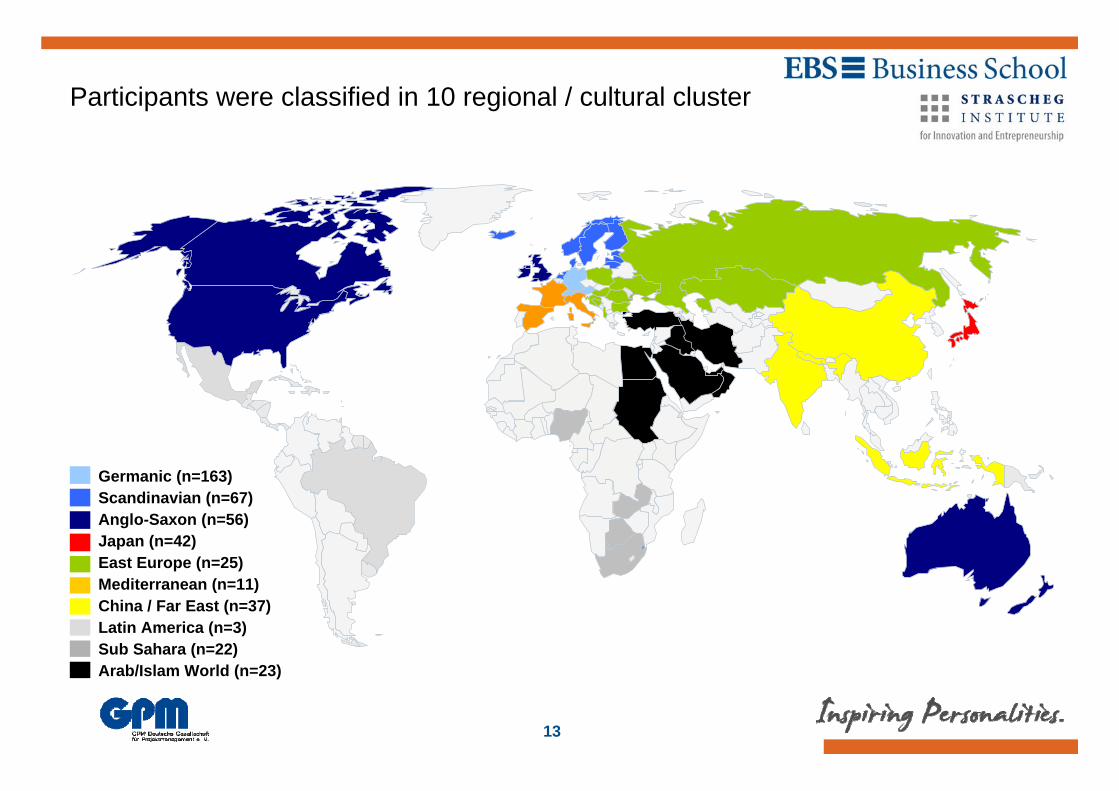
Surveys from 49 countries were received
Iceland
Estonia
Croatia
Bulgaria
Albania
Singapore
Zimbabwe
Zambia
Oman
13
Participants were classified in 10 regional / cultural cluster
Germanic (n=163)Scandinavian (n=67)Anglo-Saxon (n=56)Japan (n=42)East Europe (n=25)Mediterranean (n=11)China / Far East (n=37)Latin America (n=3)Sub Sahara (n=22)Arab/Islam World (n=23)
14
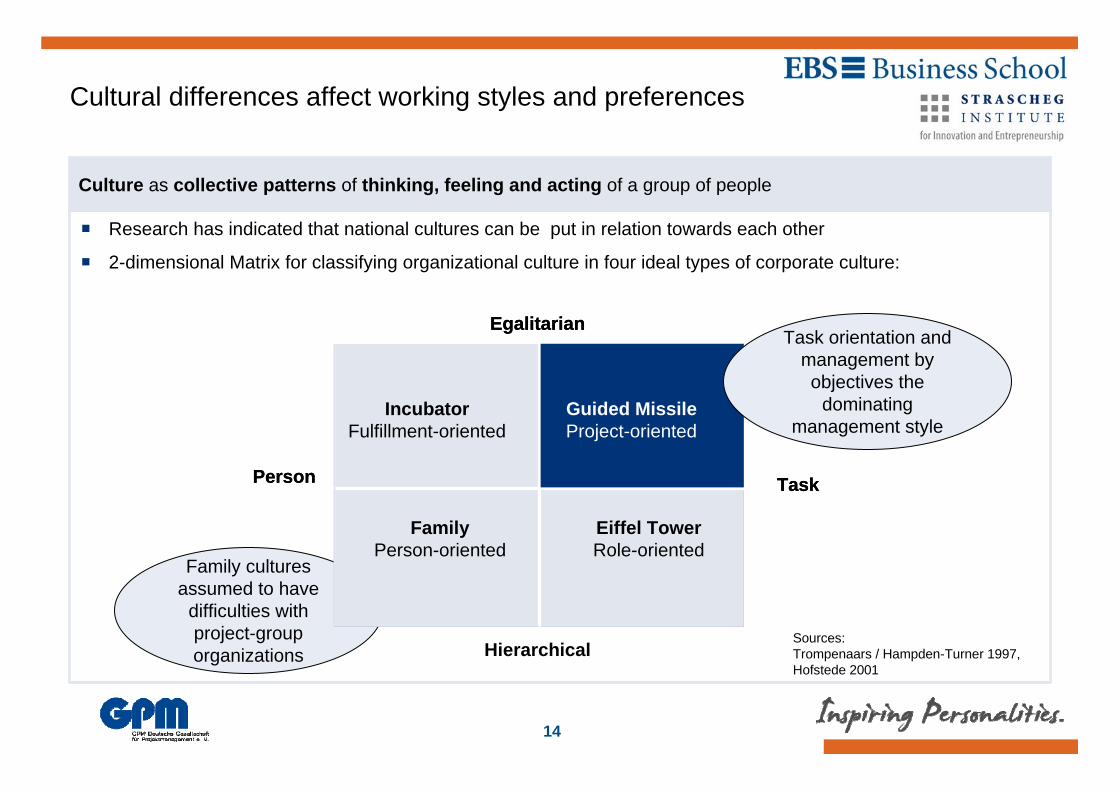
Family cultures assumed to have
difficulties with project-group organizations
Research has indicated that national cultures can be put in relation towards each other
2-dimensional Matrix for classifying organizational culture in four ideal types of corporate culture:
Cultural differences affect working styles and preferences
Incubator
Family
Guided Missile
Eiffel Tower
Egalitarian
Person Task
IncubatorFulfillment-oriented
FamilyPerson-oriented
Eiffel TowerRole-oriented
Egalitarian
Person Task
Hierarchical
Guided MissileProject-oriented
Sources:Trompenaars / Hampden-Turner 1997,Hofstede 2001
Culture as collective patterns of thinking, feeling and acting of a group of people
Task orientation and management by objectives the
dominating management style
15
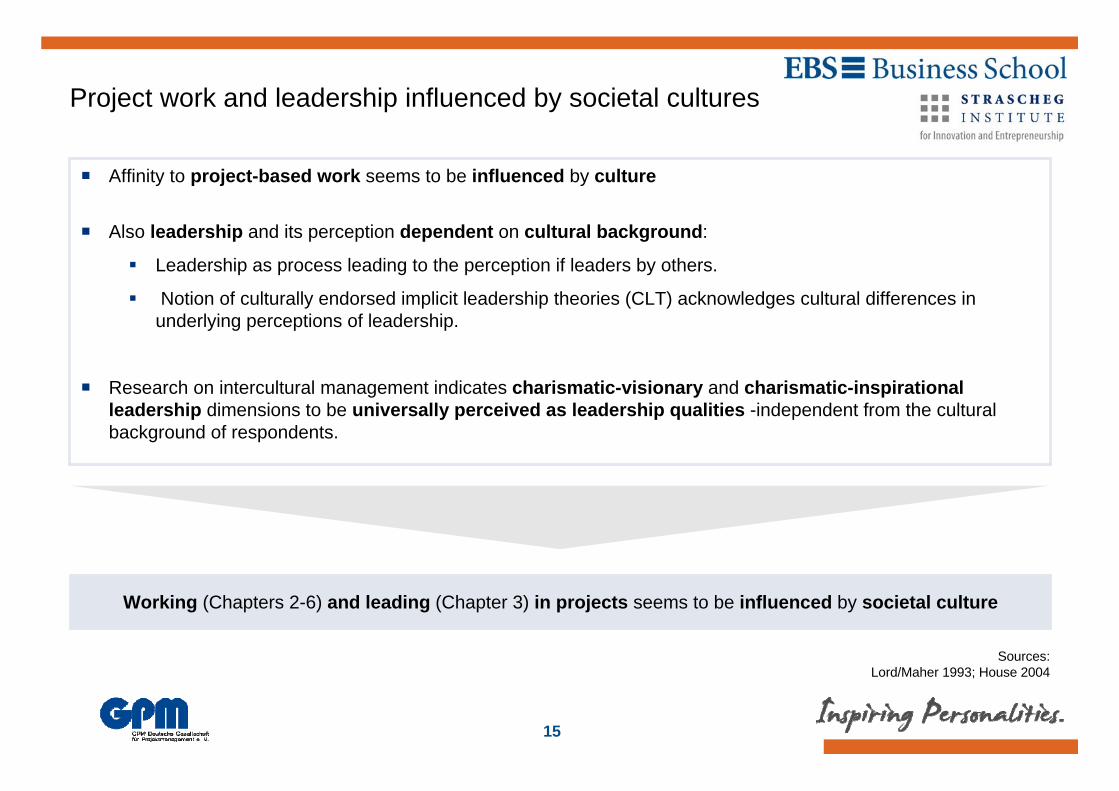
Project work and leadership influenced by societal cultures
Sources:Lord/Maher 1993; House 2004
Affinity to project-based work seems to be influenced by culture
Also leadership and its perception dependent on cultural background:
Leadership as process leading to the perception if leaders by others.
Notion of culturally endorsed implicit leadership theories (CLT) acknowledges cultural differences in underlying perceptions of leadership.
Research on intercultural management indicates charismatic-visionary and charismatic-inspirational leadership dimensions to be universally perceived as leadership qualities -independent from the cultural background of respondents.
Working (Chapters 2-6) and leading (Chapter 3) in projects seems to be influenced by societal culture

16
Answers from Japan tend to be comparably on the left side, except for the importance of standards. This indicates a comparatively higher perceived importance of equality, encouragement and trust in project work in other Country Clusters.
Selected statements concerning preferences of project work characteristics
Regional comparison of general attitudes on a continuum
High importance of trust as element of project work
High importance of standardization
Senior managementsupport
No blame culture
GermanicScandinavianAnglo-SaxonJapanOther
Low importance of trust
Low importance of standardization
Low senior management support
Low tolerance for mistakes
Centralism/Hierarchy
Gender equality
Decentralism
Gender inequality
N = 449

17
Respondents from Sub Sahara and Arabian World Cluster emphasize the importance of a no blame culture and top management support to the greatest extent, while centralism is distinct for the Cluster China.
Selected statements concerning preferences of project work characteristics
Regional comparison of general attitudes: Regions “Other”
High importance of trust
High importance of standardization
Senior managementsupport
No blame culture
Low importance of trust
Low importance of standardization
Low senior management support
Low tolerance for mistakes
Centralism/Hierarchy
Gender equality Gender inequality
DecentralismEast EuropeMediterraneanChina / Far EastLatin AmericaSub SaharaArab/Islamic WorldN = 121

18
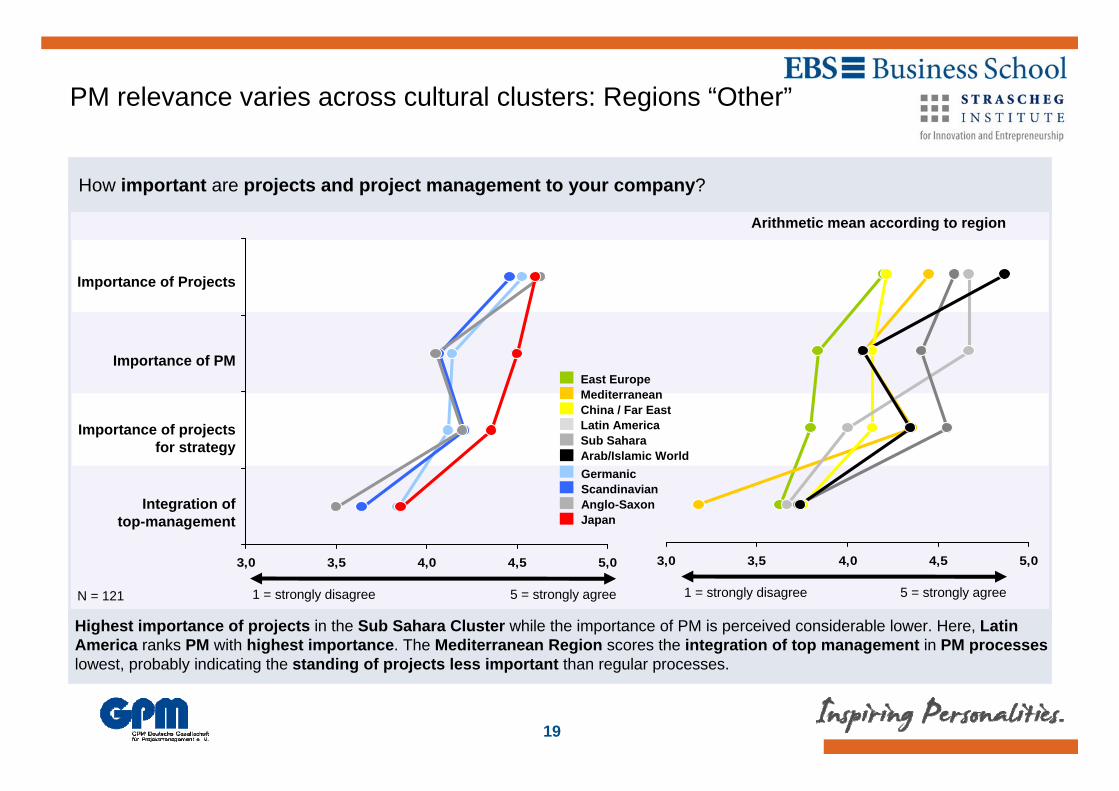
Japanese respondents ranked the relevance of project management consistently higher except the perceived overall relevance of projects to their company. This could be an indicator for a higher appraisal of PM as necessary procedure for the overall firm.
How important are projects and project management to your company?
Perceived PM relevance varies across cultural clusters
1 = strongly disagree 5 = strongly agree left diagram: Nbr. of measurements, answers for scale 1&2 and 4&5 were summed up, scale point=3 was neglected
3,0 3,5 4,0 4,5 5,0
disagree agree
3
7
5
17
92
80
80
65
N = 449
Arithmetic mean according to project success
Integration of top-management
Importance of projects for strategy
Importance of PM
Importance of Projects
highmediumlow
0,15
0,55
0,30
0,29
Spread between high and low project success
19
Highest importance of projects in the Sub Sahara Cluster while the importance of PM is perceived considerable lower. Here, Latin America ranks PM with highest importance. The Mediterranean Region scores the integration of top management in PM processeslowest, probably indicating the standing of projects less important than regular processes.
How important are projects and project management to your company?
PM relevance varies across cultural clusters: Regions “Other”
Integration of top-management
Importance of projects for strategy
Importance of PM
Importance of Projects
1 = strongly disagree 5 = strongly agree
3,0 3,5 4,0 4,5 5,0
East EuropeMediterraneanChina / Far EastLatin AmericaSub SaharaArab/Islamic World
N = 121
Arithmetic mean according to region
1 = strongly disagree 5 = strongly agree
3,0 3,5 4,0 4,5 5,0
GermanicScandinavianAnglo-SaxonJapan

20
Summary on project work - context of different cultures (1/2)
Cultural background of given working environments differs from region to region.
Special cultural-dependent characteristics exist, which could partly facilitate working in project contexts.
Preferences in the settings of project-based work could also be based on a regional context, encompassing hard (i.e. standardization) as well as soft factors like trust, communication etc.
Differences exists in preferences of hard and soft-factors relevant to working in projects.
Results for Japan differ from other regions as it has lowest scores on the preferences of soft-attributed factors, and highest scores on the importance of standardization as a hard factor.
Working and leading in projects seems to be influenced by societal culture
21
Summary on project work - context of different cultures (2/2)
Centralism as indicator of the adherence to written rules and formality of an Organization is in particular distinct in China, thus shaping the climate of project work.
Respondents from the Arab/Islam World state a high importance of projects for their companies while the relevance of project management practices is evaluated comparatively lower. This indicates a possible lack of understanding the potential benefit of project management methods and processes.
The gap between the estimated importance of project and project management for the companies and their institutional integration of senior management in project management processes is evident in all country clusters.
Still, the Mediterranean Country Cluster is about average in assessing project and project management importance, while its institutional integration of senior management in project management processes is also compared to the other Country Clusters low.
In general, Country Clusters of East Europe and China give the lowest average scores in assessing the importance of projects.
Working and leading in projects seems to be influenced by societal culture
22
1 Objectives and Procedures of the Survey
2 Data Set and Environmental/Cultural Characteristics
3 Individual Competences
Organizational Competences45 Project Success / Outcomes
6 Context Factors
7 Conclusion
8 Comparative Analysis of the Regional Cluster “Germanic”
23
Project Success
OrganizationalCompetences
5
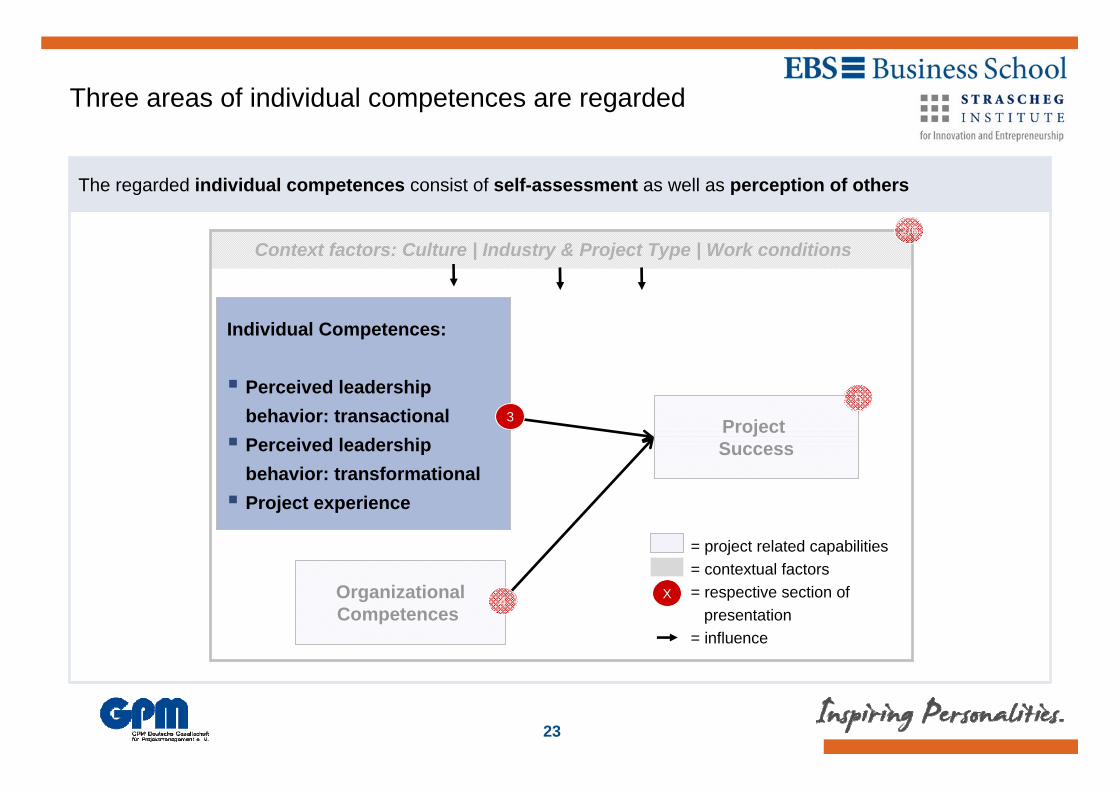
Three areas of individual competences are regarded
The regarded individual competences consist of self-assessment as well as perception of others
Context factors: Culture | Industry & Project Type | Work conditions
= project related capabilities= contextual factors= respective section of
presentation= influence
X
2/6
Individual Competences:
Perceived leadershipbehavior: transactionalPerceived leadershipbehavior: transformationalProject experience
3
4

24
Individual competences as influencing PM
Experience in project work and perceived leadership behavior represent individual competences
Time spent in projects as source of project experience
Certifications in PM as specific source of PM competence
Research indicates leadership to be one of the central factors influencing project work and its outcome.
The characteristics of perceived leadership are particularly considered in terms of charismatic behavior, since results of research indicate this manner as universally applicable.
Also task-oriented leadership is taken into account, representing the “guided missile culture” which is characterized by task-orientation as stated by the matrix on p.15.
Respondents characteristics
Leader characteristics Sources:
Keagan/DenHartog 2001; Trompenaars and Hampden-Turner 2001; House 2004

25
Indicators for charismatic/task-oriented leadership
Transformational and transactional leadership as two leadership dimensions
Transformational Leadership
Transformational leader “transforms” values and motives of his followers to a higher level and expected direction.
Sphere of action starts where awarding, punishment and other instrumental effects stop to work
A project leader should be capable of sharing a vision in order to commit project members to project and project goals
Transactional Leadership
Tasks stand in the limelight
Transactional leadership means compliance is exchanged for reward
Leader enters into a transaction relation with subordinates where)
Instrumental effects like awarding and punishing are used
Both leadership dimensions seem to be important in projects, question is, which leads to success under which settings
26
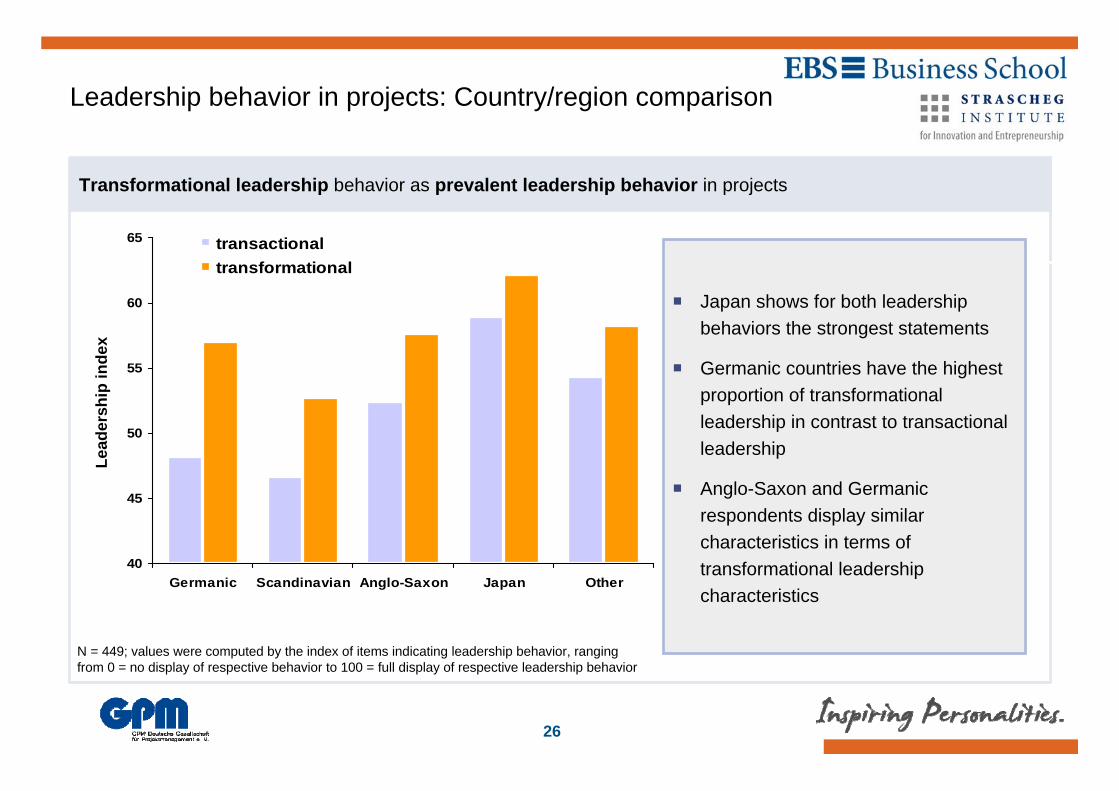
Leadership behavior in projects: Country/region comparison
Transformational leadership behavior as prevalent leadership behavior in projects
Japan shows for both leadership behaviors the strongest statements
Germanic countries have the highest proportion of transformational leadership in contrast to transactional leadership
Anglo-Saxon and Germanic respondents display similar characteristics in terms of transformational leadership characteristics
40
45
50
55
60
65
Germanic Scandinavian Anglo-Saxon Japan Other
transactionaltransformational
N = 449; values were computed by the index of items indicating leadership behavior, ranging from 0 = no display of respective behavior to 100 = full display of respective leadership behavior
Lead
ersh
ip in
dex

27
Leadership behavior in projects: Regions “Other”
Transformational leadership behavior as prevalent leadership behavior in the referred project environments
Latin America scores highest in transformational leadership behavior
Africa with second highest transformational leadership score displays the highest value in terms of transactional leadership
Mediterranean region and East Europe have the smallest values on both leadership styles
40
45
50
55
60
65
70
75
East Europe Mediterranean China / Far East Latin America Africa (SubSahara)
Arab/Islamic World
transactionaltransformational
N = 121; values were computed by the index of items indicating leadership behavior, ranging from 0 = no display of respective behavior to 100 = full display of respective leadership behavior
Lead
ersh
ip in
dex
28
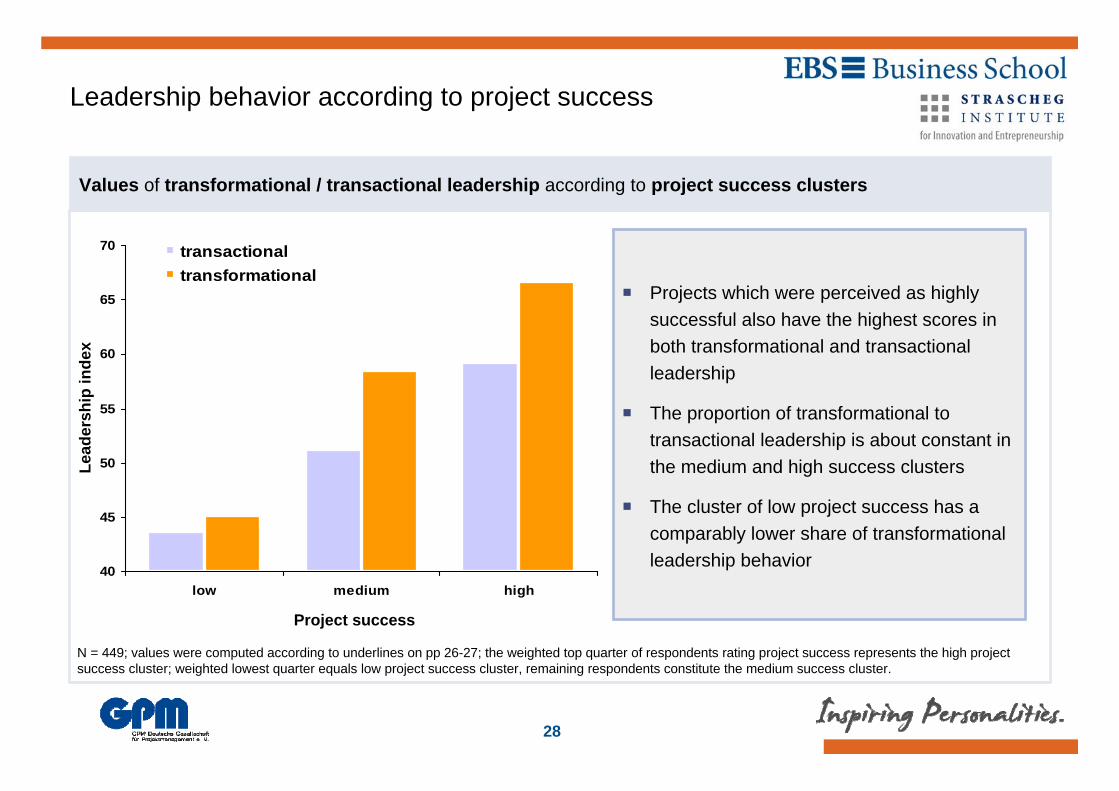
Leadership behavior according to project success
Values of transformational / transactional leadership according to project success clusters
Projects which were perceived as highly successful also have the highest scores in both transformational and transactional leadership
The proportion of transformational to transactional leadership is about constant in the medium and high success clusters
The cluster of low project success has a comparably lower share of transformational leadership behavior
40
45
50
55
60
65
70
low medium high
transactionaltransformational
Project success
N = 449; values were computed according to underlines on pp 26-27; the weighted top quarter of respondents rating project success represents the high project success cluster; weighted lowest quarter equals low project success cluster, remaining respondents constitute the medium success cluster.
Lead
ersh
ip in
dex

29
Index of individual competence in project management
Perceived Leadership behavior:Transactional
Perceived Leadership behavior:Transformational
Project experience
58,658,860,6
70,5
61,7
GermanicScandinavianAnglo-SaxonJapanOther
All-country average: 62,0
Transformational leadership behavior as dominant leadership behavior in projects
Responses from Japan represent highest value for the Individual Competence Index
Remaining countries display approximately same values, with Scandinavian and Germanic countries being slightly under average
Indi
vidu
al C
ompe
tenc
e in
Pr
ojec
t M
anag
emen
t
N = 449; leadership values were computed according to underlines on pp 26-27; project experience value was computed converting the relative project experience (in yrs) to a scale from 0-100. All tree items were equally weighted in final index.

30
Comparison of index individual competence: Regions “Other”
58,956,3
61,9
68,368,6
61,2
East EuropeMediterraneanChina / Far EastLatin AmericaAfrica (SubSahara)
Arab/IslamicWorld
All-Country Average: 62,0
Africa Sub Sahara and Latin America score highest among the regions contained in “Other”
Mediterranean countries score the lowest on individual competence index compared to all regions
58,658,860,6
70,5
61,760,7
GermanicScandinavianAnglo-SaxonJapanOtherTotal
N = 121; Index computed according to underline on p 29.
31
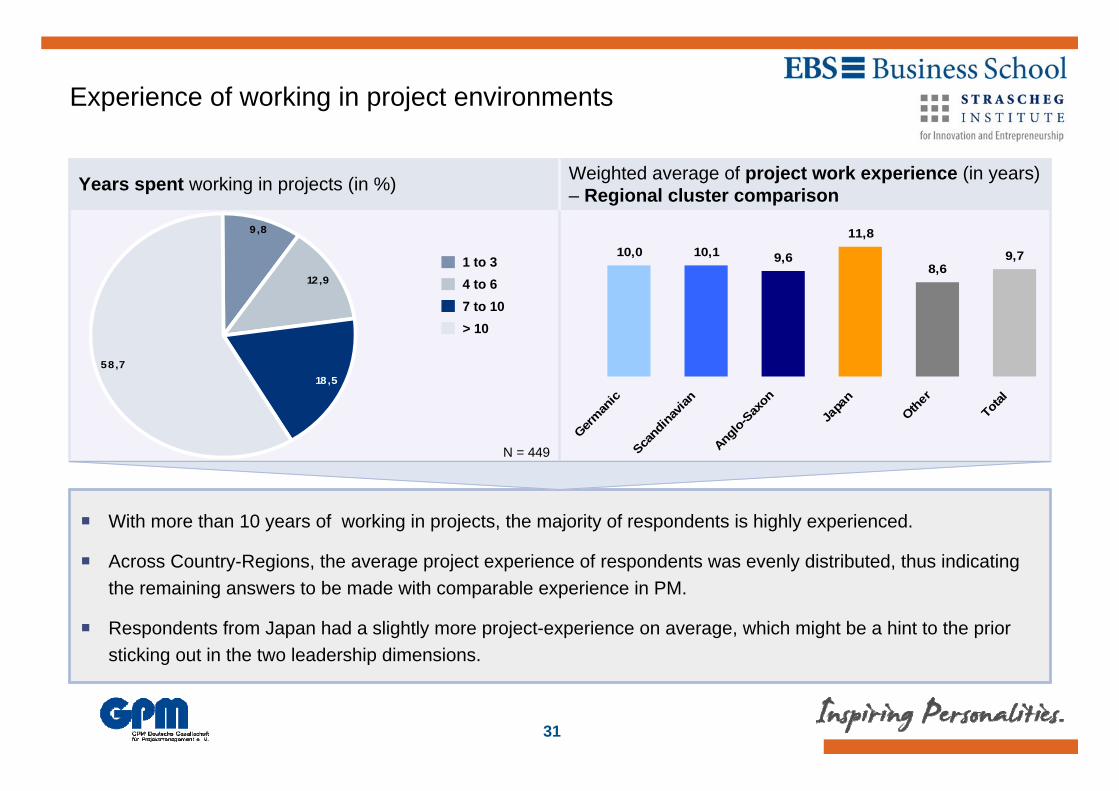
Years spent working in projects (in %)
Experience of working in project environments
Weighted average of project work experience (in years) – Regional cluster comparison
With more than 10 years of working in projects, the majority of respondents is highly experienced.
Across Country-Regions, the average project experience of respondents was evenly distributed, thus indicating the remaining answers to be made with comparable experience in PM.
Respondents from Japan had a slightly more project-experience on average, which might be a hint to the prior sticking out in the two leadership dimensions.
10,0 10,1 9,6
11,8
8,69,7
German
ic
Scand
inavia
n
Anglo-S
axon
Japa
n
Other
Total
9 ,8
12,9
18,558,7
> 107 to 104 to 61 to 3
N = 449
32
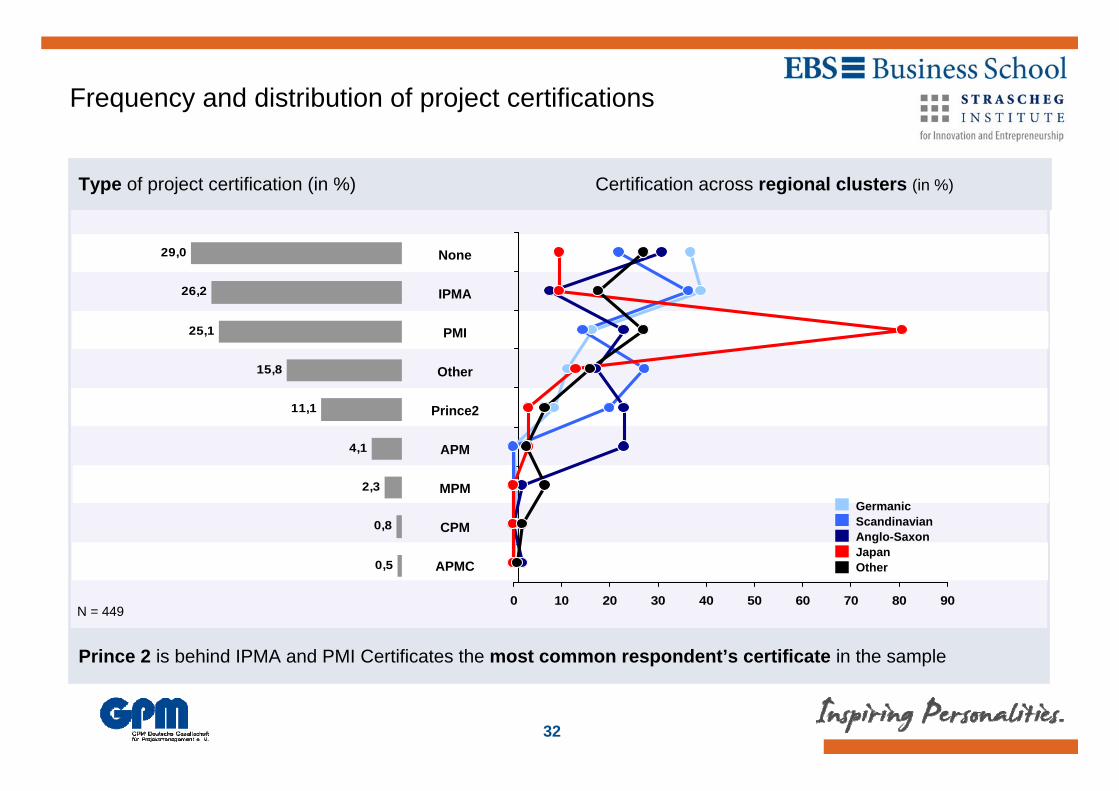
Type of project certification (in %)
Frequency and distribution of project certifications
Certification across regional clusters (in %)
29,0
26,2
25,1
15,8
11,1
4,1
2,3
0,8
0,5 APMC
CPM
MPM
APM
Prince2
Other
PMI
IPMA
None
Prince 2 is behind IPMA and PMI Certificates the most common respondent’s certificate in the sample
0 10 20 30 40 50 60 70 80 90
GermanicScandinavianAnglo-SaxonJapanOther
N = 449

33
Summary of findings on individual competences
Results indicate a prevalence of transformational leadership across all countries.
This is in line with findings of research indicating charismatic leadership as an universally accepted leadership characteristic.
Task orientation in terms of transactional leadership behavior is found to be of importance. Given the project environment, this is in line with the propositions shown by the matrix introduced on p.15.
Project experience of respondents is evenly distributed with an average of nearly 10 years of project experience, with the region Japan having the slightly greater overall project experience
Japan shows the highest score for both leadership behavior assessments
About a third of respondents across all regional clusters stated to have no PM-related certification, which shows the potential for project management as professional skill
Germanic Cluster with the greatest percentage of respondents without PM-related certification
Types of certifications vary across regional clusters, with a strong emphasis on PMI-related certificates in Japan which could be biased due to respondents sample
Sources:Trompenaars / Hampden-Turner 1997
Hofstede 2001House et al 2004

34
8 Comparative Analysis of the Regional Cluster “Germanic”
1 Objectives and Procedures of the Survey
2 Data Set and Environmental/Cultural Characteristics
3 Individual Competences
Organizational Competences45 Project Success / Outcomes
6 Context Factors
7 Conclusion

35
Project Success
5
Three areas of organizational competences are regarded
The regarded organizational competences consist of six categories representing hard and soft factors
Individual Competences
3
XContext factors: Culture | Industry & Project Type | Work conditions
= project related capabilities= contextual factors= respective section of
presentation= influence
X
Organizational Competences:Organizational CommitmentSenior management support Working atmosphere (trust)ResourcesOrganizational Support (PMO)Standardization
2/6
4

36
Organizational
Competence Index*
*Consisting of six equally weighted
components with each component being
converted to a scale from 0 = strongly disagree to 100 =
strongly agree
Hard factors
Organizational competence comprises 6 categories (1/2)
Soft factors are represented by organizational commitment, senior management support and trust:
Organizational commitment represents the employee’s psychological attachment to the organization which indicates positive organizational characteristics.
Research indicates that senior management support as „leadership on the high level” has a significant positive influence on project success. (Source)
A trustful working atmosphere is vital for coping with uncertainty which is prevalent in project environments.

37
Organizational competence comprises 6 categories (2/2)
Organizational
Competence Index*
*Consisting of six equally weighted
components with each component being
converted to a scale from 0 = strongly disagree to 100 =
strongly agree
Hard factors are represented by organizational resources, organizational support and standardization:
Organizational resources indicate the overall organizations ability to support projects with sufficient financial resources and in terms of human resources and special skilled workers.
PMOs as permanent organizational entity support the project throughout the project’s life cycle, thus serving as binding element between permanent and temporary organization with the potential to transmit project knowledge to the organizational knowledge base.
Successful implemented standardization allows a consistent high qualityduring project realization.
Soft factors

38
58,358,1
60,660,8
58,8
57,7
GermanicScandinavianAnglo-SaxonJapanOtherTotal
Index of organizational competence
Senior Management Support
Resources
Standardization
Organizational Commitment
Working Atmosphere
Organizational Support
Japan as individual country shows the greatest value in terms of the overall organizational competence index, while the regions “Other” exceed also Japan in overall organizational competence.
Inde
x of
Org
aniz
atio
nal
Com
pete
nce
in P
roje
ct
Man
agem
ent
All-Country Average: 58,8
N = 449; index computed according to description on pp 36/37

39
57,157,961,1
56,1
70,7
60,3
East EuropeMediterraneanChina / Far EastLatin AmericaAfrica (SubSahara)
Arab/IslamicWorld
Index of organizational competence: Regions “Other”
All-Country Average: 58,8
Africa Sub Sahara scores highest among this group, while Latin America countries have lowest score on the organizational competence index among the regions “Other”
Regions Africa, China and Japan score above average concerning overall organizational competence
58,358,1
60,660,8
58,8
57,7
GermanicScandinavianAnglo-SaxonJapanOtherTotal
N = 121; index computed according to description on pp 36/37

40
Working atmosphere as strongest soft factor across all regions
Regional Comparison of Soft Factors
N = 449; 100 = highest possible value
Percentage quotation according to region
Working atmosphere scores highest across all
regions.
Working atmosphere is equally distributed in the
Germanic, Scandinavian regions and Japan, while
Anglo-Saxon and “Other” regions are scoring slightly
lower.
In contrast to the remaining factors and regions,
Japan scores comparably low in terms of
organizational commitment.
40
50
60
70
80Germanic
Scandinavian
Anglo-SaxonJapan
Other
Organizational Commitment Senior Management Support Working Atmosphere
41
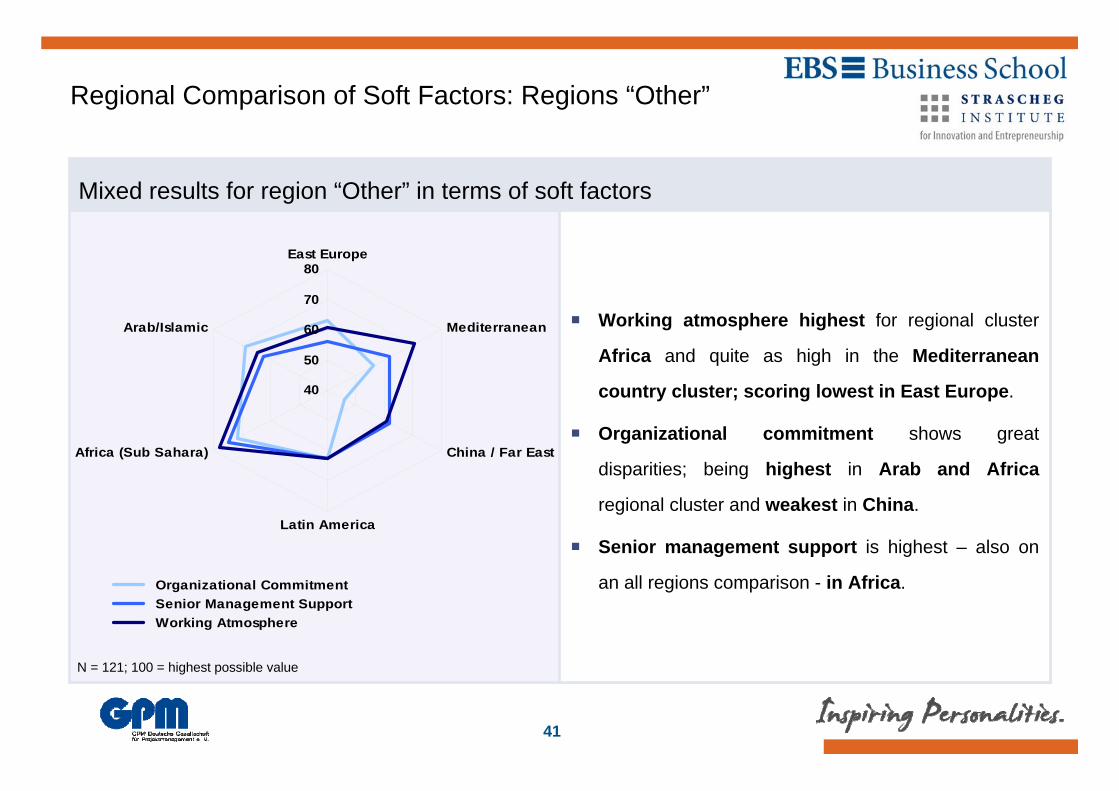
Mixed results for region “Other” in terms of soft factors
Regional Comparison of Soft Factors: Regions “Other”
N = 121; 100 = highest possible value
Percentage quotation according to region
Working atmosphere highest for regional cluster
Africa and quite as high in the Mediterranean
country cluster; scoring lowest in East Europe.
Organizational commitment shows great
disparities; being highest in Arab and Africa
regional cluster and weakest in China.
Senior management support is highest – also on
an all regions comparison - in Africa.
40
50
60
70
80East Europe
Mediterranean
China / Far East
Latin America
Africa (Sub Sahara)
Arab/Islamic
Organizational Commitment Senior Management Support Working Atmosphere

42
Standardization as similar assessed hard factor across all regions
Regional Comparison of Hard Factors
N = 449; 100 = highest possible value
Percentage quotation according to region
Standardization is approximately on the same level
across all countries.
Sufficient resources score lower but are about as
evenly distributed across the regions except the
Germanic Region
Across all countries only most respondents per country
cluster state to have a PMO in their company except
respondents from Japan. Respondents from Germanic
countries state slightly more often to have a PMO
compared to Scandinavian and Anglo-Saxon cluster.
40
50
60
70Germanic
Scandinavian
Anglo-SaxonJapan
Other
Ressources Organizational Support Standardization

43
Standardization as similar assessed hard factor across all regions
Regional Comparison of Hard Factors: Regions “Other”
Percentage quotation according to region
Standardization is highest in Region Africa while
being approximately on the same lower level in Arab /
Latin America and China clusters and slightly lower in
East Europe and Mediterranean cluster.
Sufficient resources vary widely across regions
“Other” with highest score in China and lowest in
Latin America / Mediterranean clusters.
Respondents in the country cluster Africa state most
often to have a PMO in their company while Latin
America scores lowest in this respect.
30
40
50
60
70
80East Europe
Mediterranean
China/Far East
Latin America
Africa
Arab/Islamic
Ressources Organizational Support Standardization
N = 121; 100 = highest possible value
44
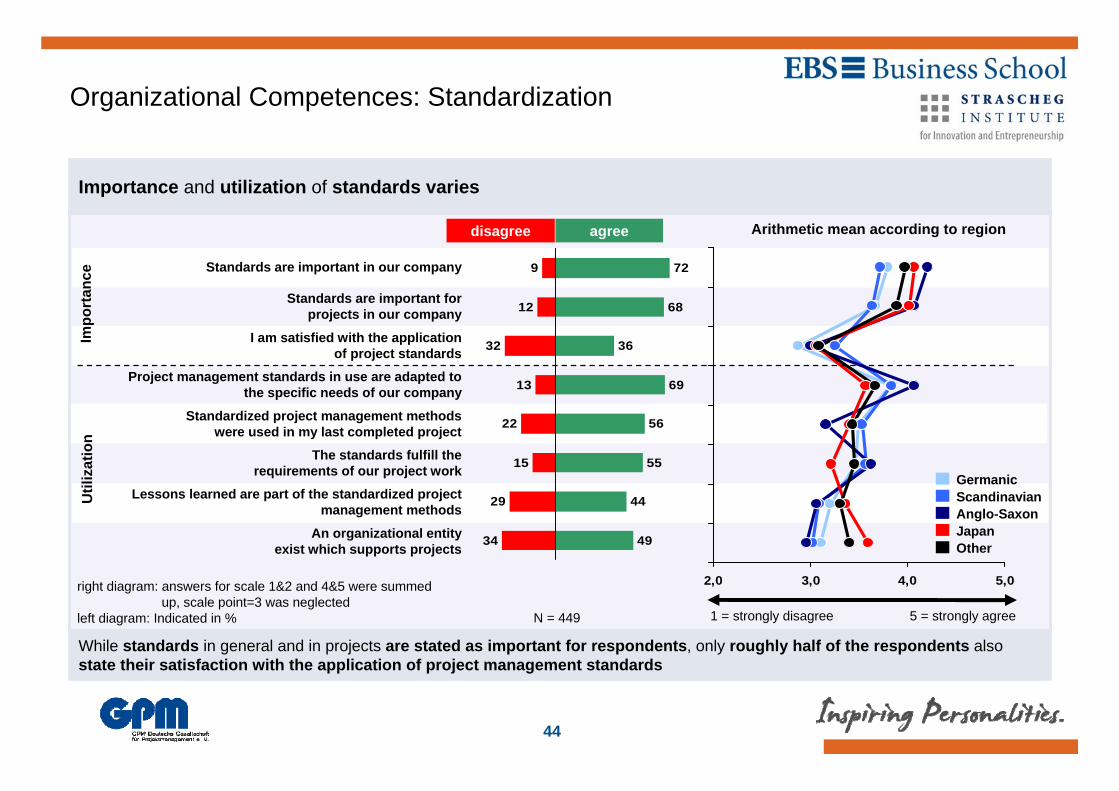
While standards in general and in projects are stated as important for respondents, only roughly half of the respondents also state their satisfaction with the application of project management standards
Importance and utilization of standards varies
Organizational Competences: Standardization
2,0 3,0 4,0 5,0
disagree agree
1 = strongly disagree 5 = strongly agree
9
12
32
13
22
15
29
34
72
68
36
69
56
55
44
49
Impo
rtan
ceU
tiliz
atio
n
GermanicScandinavianAnglo-SaxonJapanOther
An organizational entity exist which supports projects
Lessons learned are part of the standardized project management methods
The standards fulfill the requirements of our project work
Standardized project management methods were used in my last completed project
Project management standards in use are adapted to the specific needs of our company
I am satisfied with the application of project standards
Standards are important for projects in our company
Standards are important in our company
right diagram: answers for scale 1&2 and 4&5 were summed up, scale point=3 was neglected
left diagram: Indicated in % N = 449
Arithmetic mean according to region
45
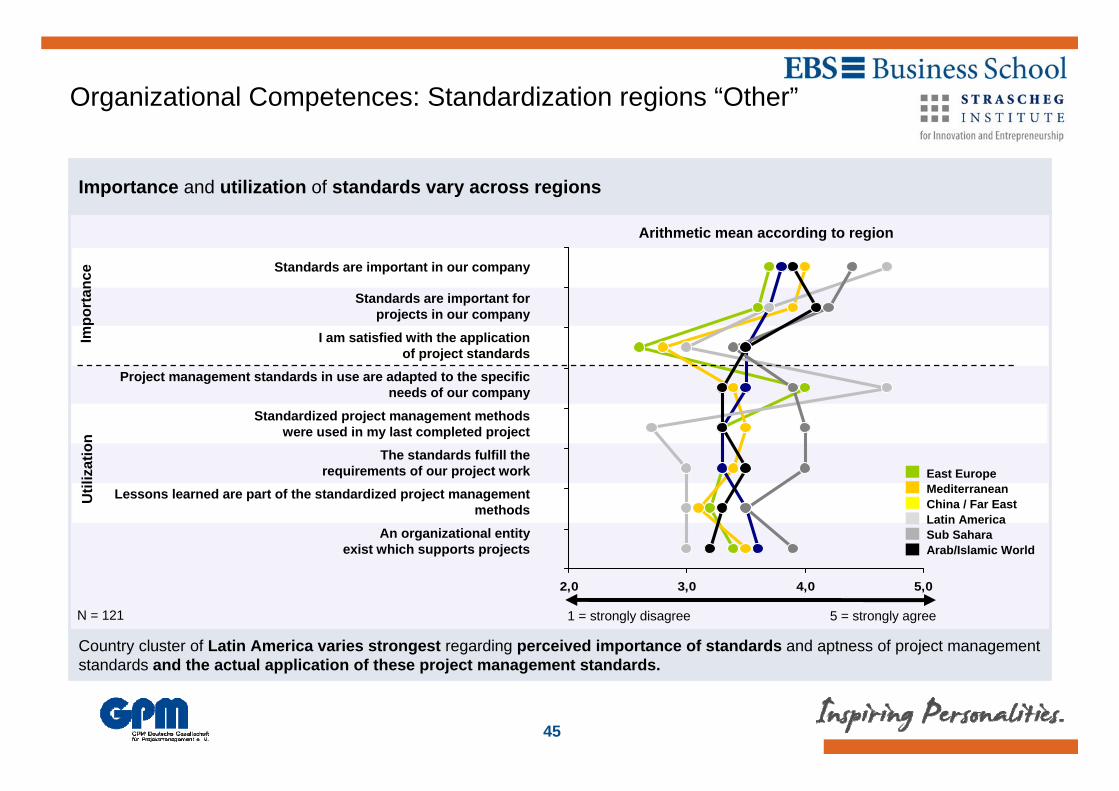
Country cluster of Latin America varies strongest regarding perceived importance of standards and aptness of project management standards and the actual application of these project management standards.
Importance and utilization of standards vary across regions
Organizational Competences: Standardization regions “Other”
2,0 3,0 4,0 5,0
1 = strongly disagree 5 = strongly agree
Impo
rtan
ceU
tiliz
atio
n
An organizational entity exist which supports projects
Lessons learned are part of the standardized project management methods
The standards fulfill the requirements of our project work
Standardized project management methods were used in my last completed project
Project management standards in use are adapted to the specific needs of our company
I am satisfied with the application of project standards
Standards are important for projects in our company
Standards are important in our company
N = 121
East EuropeMediterraneanChina / Far EastLatin AmericaSub SaharaArab/Islamic World
Arithmetic mean according to region
46
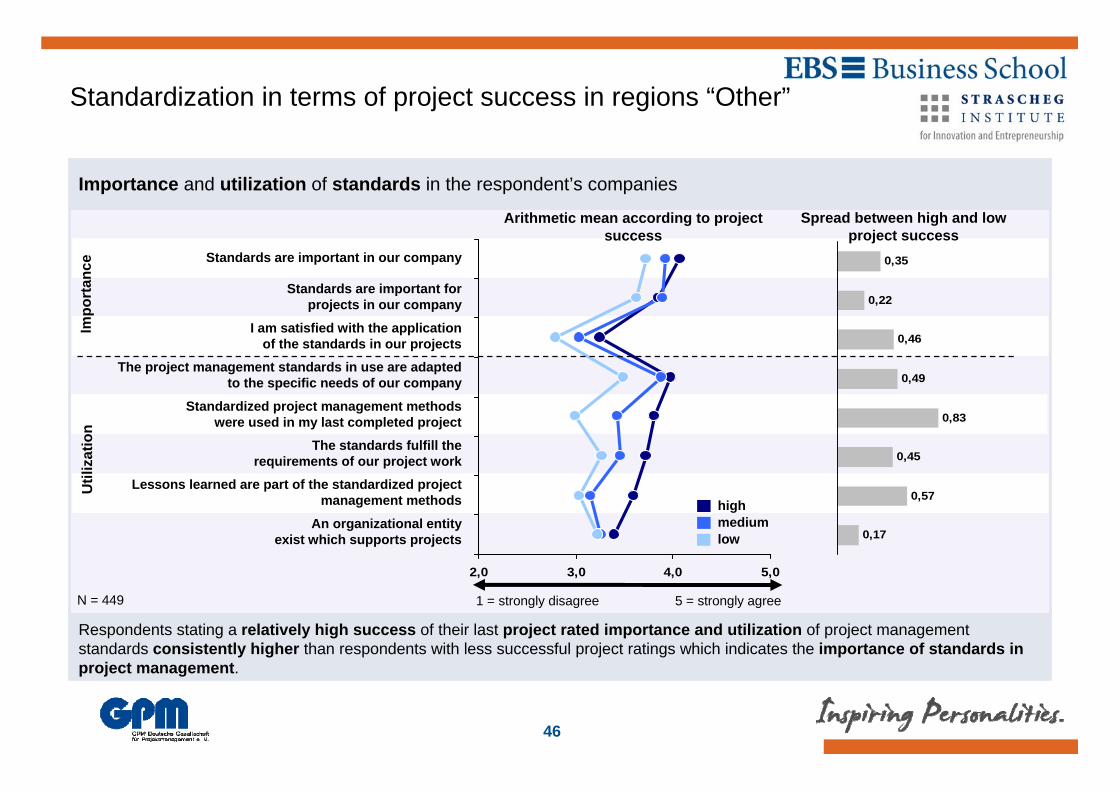
Respondents stating a relatively high success of their last project rated importance and utilization of project management standards consistently higher than respondents with less successful project ratings which indicates the importance of standards in project management.
Importance and utilization of standards in the respondent’s companies
Standardization in terms of project success in regions “Other”
2,0 3,0 4,0 5,0
1 = strongly disagree 5 = strongly agree
Impo
rtan
ceU
tiliz
atio
n
N = 449
An organizational entity exist which supports projects
Lessons learned are part of the standardized project management methods
The standards fulfill the requirements of our project work
Standardized project management methods were used in my last completed project
The project management standards in use are adapted to the specific needs of our company
I am satisfied with the application of the standards in our projects
Standards are important for projects in our company
Standards are important in our company
Arithmetic mean according to project success
highmediumlow
0,35
0,22
0,46
0,49
0,83
0,45
0,57
0,17
Spread between high and low project success

47
A range of project management standards exist; while various PM-Standards are subsumed by “Other”, many can be expected to be congruent to a great part with the established standards of PMBOK, ICB, and Prince 2; several differences in the degree of utilization exist on regional comparison.
A range of project management standards is used in respondent’s companies
PMBOK as most used project management standard
Other
Prince 2
ICB 3.0
PMBOK
N = 449
43,0
10,9
14,0
39,0
• Company-Own• None• Software-based• ISO-Standards• Other Standards:
• APMBOK, CMMI,IPMA, ICB 2.0
0,0 20,0 40,0 60,0 80,0 100,0
Percentage quotation according to region
0,0 20,0 40,0 60,0 80,0 100,0
GermanicScandinavianAnglo-SaxonJapan
East EuropeMediterraneanChina / Far EastLatin AmericaSub SaharaArab/Islamic World
48
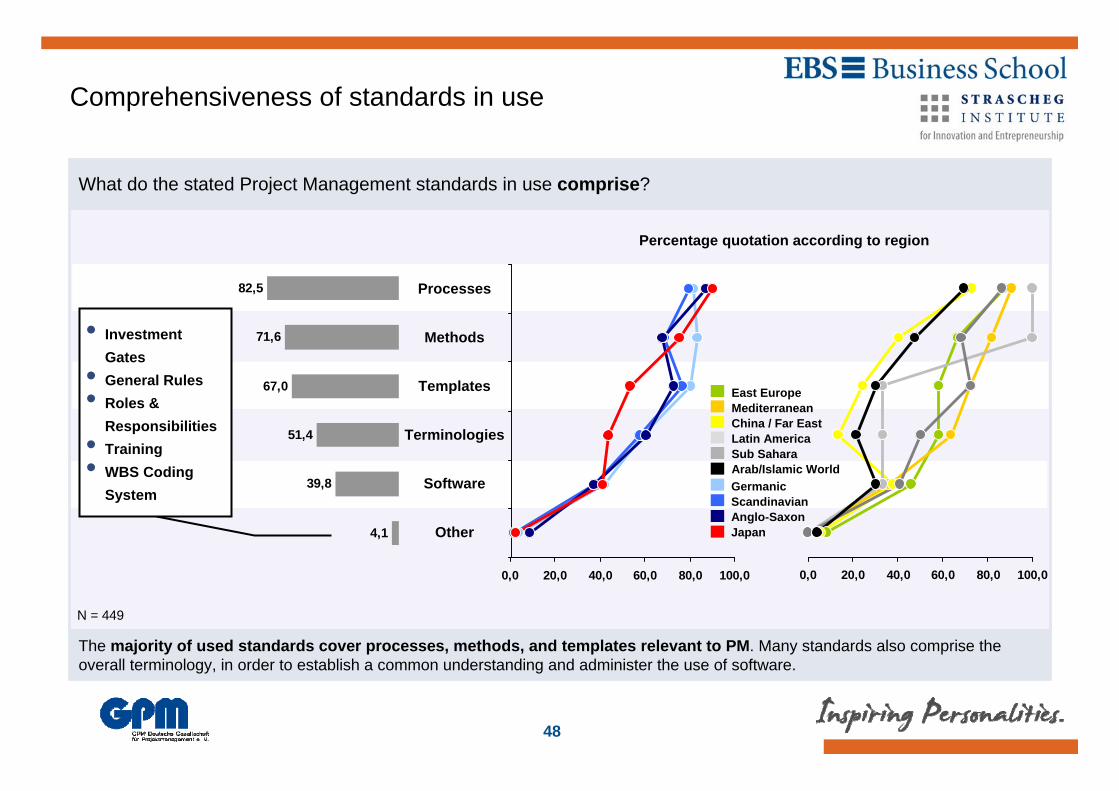
The majority of used standards cover processes, methods, and templates relevant to PM. Many standards also comprise the overall terminology, in order to establish a common understanding and administer the use of software.
What do the stated Project Management standards in use comprise?
Comprehensiveness of standards in use
82,5
71,6
67,0
51,4
39,8
4,1
0,0 20,0 40,0 60,0 80,0 100,0
GermanicScandinavianAnglo-SaxonJapanOther
Software
Terminologies
Templates
Methods
Processes
N = 449
• Investment Gates
• General Rules• Roles &
Responsibilities• Training• WBS Coding
System
Percentage quotation according to region
0,0 20,0 40,0 60,0 80,0 100,0
East EuropeMediterraneanChina / Far EastLatin AmericaSub SaharaArab/Islamic World

49
Hard and soft-factors concerning organizational competences were widely ranging in extent across regional clusters.
Africa (Sub Sahara) shows highest overall scores in the overall organizational competence index.
Japan with second greatest value in terms of the overall organizational competence index.
Working atmosphere as strongest scoring soft factor across all regions.
Sufficient resources scores weakest in the Germanic region.
Standardization seems to be equally developed, albeit different standards are preferred on a regional comparison.
Many companies already use company own standards (subsumed in “other”), which are adapted from the common standards of PMI/IPMA
Satisfaction with application of standards in projects is significantly below perceived importance, thus showing further potential for improvement.
Summary of findings on organizational competences

50
8 Comparative Analysis of the Regional Cluster “Germanic”
1 Objectives and Procedures of the Survey
2 Data Set and Environmental Characteristics
3 Individual Competences
Organizational Competences45 Project Success / Outcomes
6 Context Factors
7 Conclusion
51
OrganizationalCompetences
4
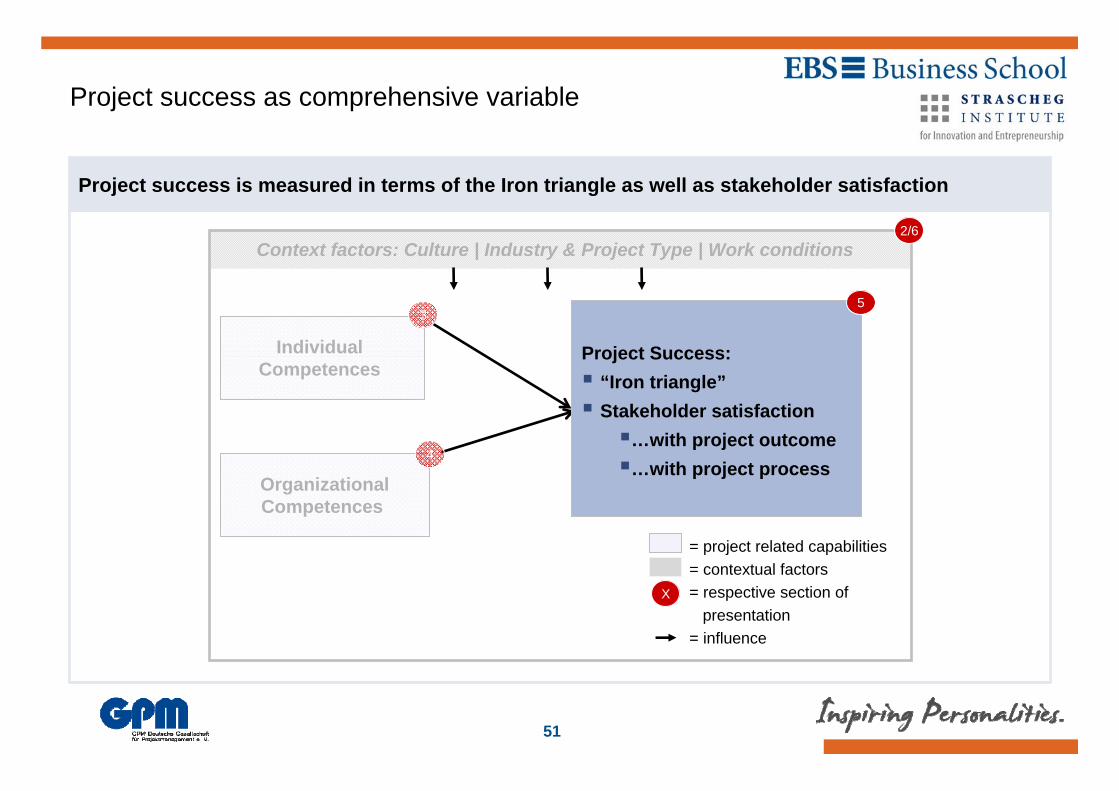
Project success as comprehensive variable
Project success is measured in terms of the Iron triangle as well as stakeholder satisfaction
Individual Competences
3
Project Success:“Iron triangle”Stakeholder satisfaction
…with project outcome…with project process
5
Context factors: Culture | Industry & Project Type | Work conditions
= project related capabilities= contextual factors= respective section of
presentation= influence
X
2/6
52
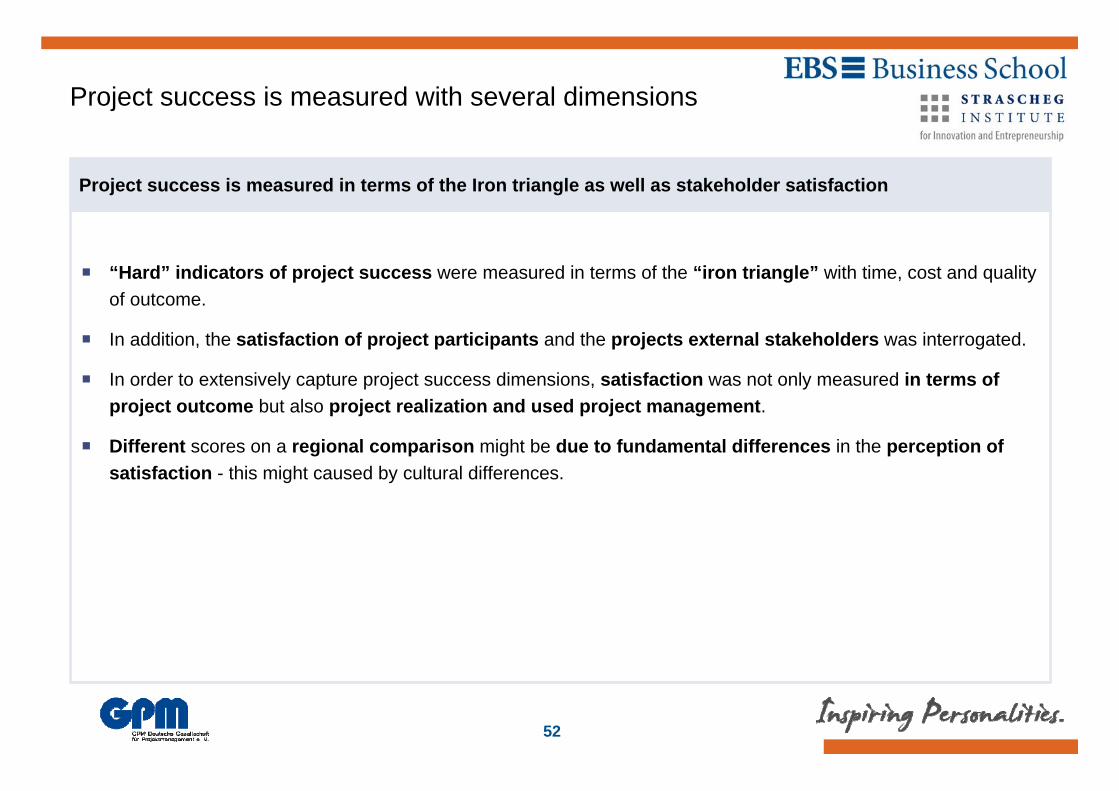
Project success is measured with several dimensions
Project success is measured in terms of the Iron triangle as well as stakeholder satisfaction
“Hard” indicators of project success were measured in terms of the “iron triangle” with time, cost and quality of outcome.
In addition, the satisfaction of project participants and the projects external stakeholders was interrogated.
In order to extensively capture project success dimensions, satisfaction was not only measured in terms of project outcome but also project realization and used project management.
Different scores on a regional comparison might be due to fundamental differences in the perception of satisfaction - this might caused by cultural differences.
53
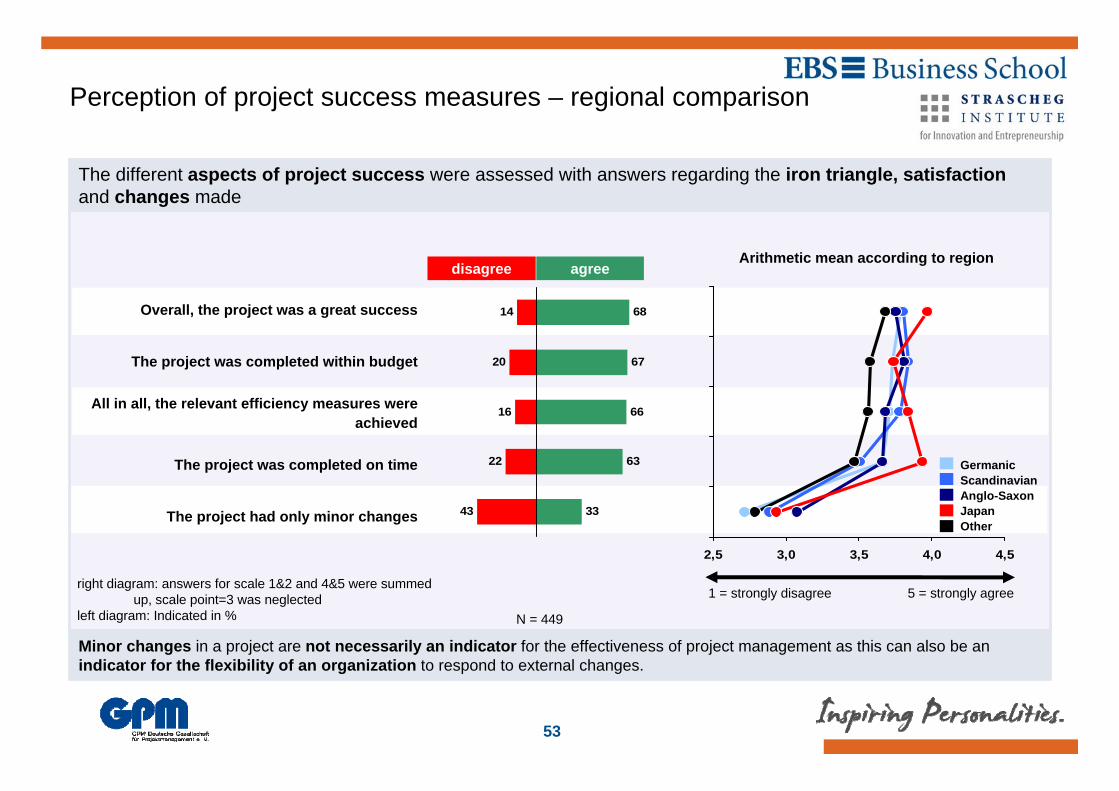
Minor changes in a project are not necessarily an indicator for the effectiveness of project management as this can also be an indicator for the flexibility of an organization to respond to external changes.
The different aspects of project success were assessed with answers regarding the iron triangle, satisfaction and changes made
disagree agree
1 = strongly disagree 5 = strongly agree
14
20
16
22
43
68
67
66
63
33
Perception of project success measures – regional comparison
GermanicScandinavianAnglo-SaxonJapanOther
The project had only minor changes
The project was completed on time
All in all, the relevant efficiency measures were achieved
The project was completed within budget
Overall, the project was a great success
2,5 3,0 3,5 4,0 4,5
right diagram: answers for scale 1&2 and 4&5 were summed up, scale point=3 was neglected
left diagram: Indicated in % N = 449
Arithmetic mean according to region

54
Differences in the perceived satisfaction with project results and process were starkest in terms of clients, while the least differenceswere stated in terms of project manager and project’s subcontractors.
Respondents perception of stakeholder satisfaction with project results and overall project process
unsatisfied satisfied
8
9
9
9
8
75
71
71
71
50
Project success dimensions according to project stakeholders
How do you rate the satisfaction of …
13
13
16
15
14
63
55
50
55
40
unsatisfied satisfied
Satisfaction withproject results
Satisfaction withproject process
Difference of results and process
0,27
0,33
0,38
0,34
0,22Subcontractors (e.g. supplier)
Project members
Clients
Sponsors
Project manager
N = 449; answers for scale 1&2 and 4&5 were summed up, scale point=3 was neglected

55
Project success measures varied starkest across regions in the case of Japan and “Other”.
Respondents from Japan display highest scores on general project success and in-time completion of projects, while budget compliance and minor changes were below average.
In general, project participants found to be less satisfied with the project process than with the overall outcome. This difference is the greatest in the case of clients.
Subcontractors are the least satisfied with both project process and outcome according to respondents’perception.
Summary of main findings on project success

56
1 Objectives and Procedures of the Survey
2 Data Set and Environmental Characteristics
3 Individual Competences
Organizational Competences45 Project Success / Outcomes
6 Context Factors
7 Conclusion
8 Comparative Analysis of the Regional Cluster “Germanic”

57
Project Success
Individual Competences
OrganizationalCompetences
4
Context Factors
Context factors in this chapter are regarded in terms of several aspects of work conditions
XX
= project related capabilities= contextual factors= respective section of
presentation= influence
X
Context factors: Culture | Industry & Project Type | Work conditions 2/6
3

58
Context Factors draw upon several characteristics
Personal characteristics enclose respondent’s gender and years spent in the respective organization. Respondent’s implicit cultural understanding were subject to chapter 2.
Project embeddedness was interrogated in order to show possible differences on an international level.
Overall organizational structure was asked in order to check if the referenced project was in line with the usual organizing of projects.
Environmental characteristics were asked to see if regional differences in the perception of environmental conditions exist.
Information on context factors is raised for several reasons
59
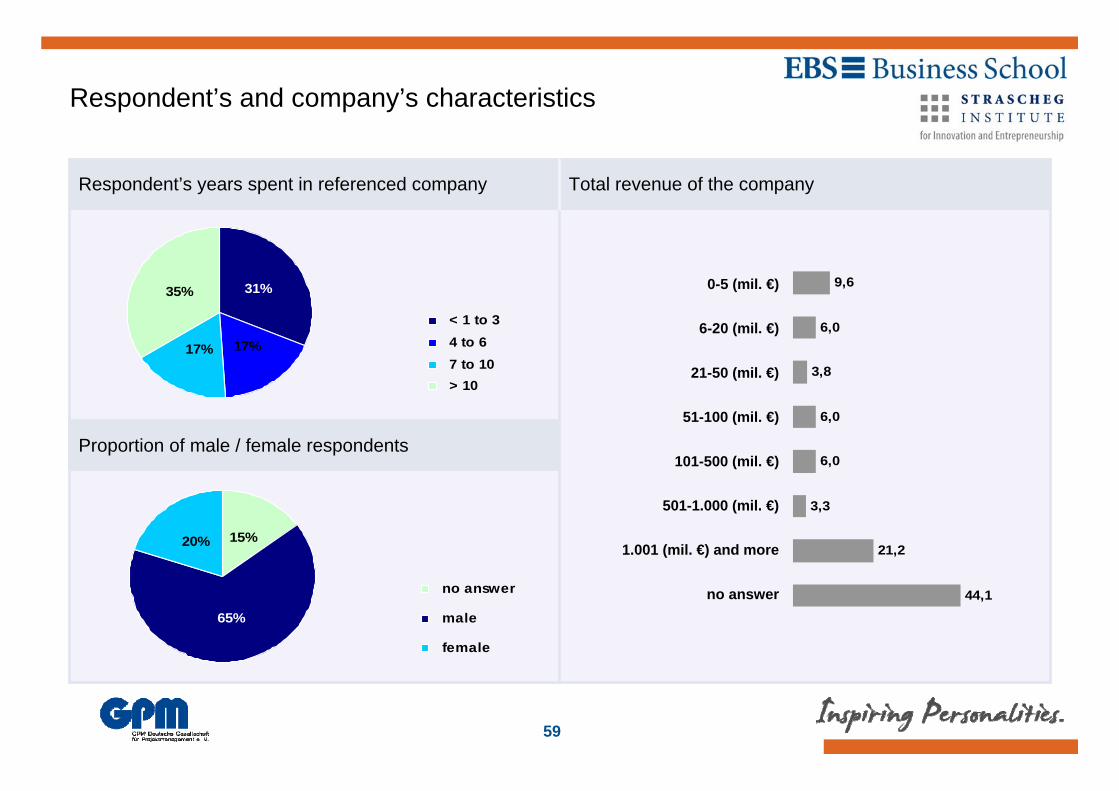
Respondent’s years spent in referenced company
Respondent’s and company’s characteristics
Proportion of male / female respondents
Total revenue of the company
17%17%
35% 31%
< 1 to 3 4 to 6 7 to 10 > 10
20%
65%
15%
no answer
male
female
9,6
6,0
3,8
6,0
6,0
3,3
21,2
44,1no answer
1.001 (mil. €) and more
501-1.000 (mil. €)
101-500 (mil. €)
51-100 (mil. €)
21-50 (mil. €)
6-20 (mil. €)
0-5 (mil. €)

60
Projects in respondents’ organizations are mainly embedded as mixed organization, whereas other forms of organizing vary across countries.
General embeddedness of projects in organization
Organizational embeddedness of projects (1/2)
Mixed organization
Staff organization (outside the line
organization)
Pure matrix organization
Pure project organization
GermanicScandinavianAnglo-SaxonJapanOther
N = 449, indicated in %
Percentage quotation according to region
0,0 20,0 40,0 60,0 80,0
East EuropeMediterraneanChina / Far EastLatin AmericaSub SaharaArab/Islamic World
14,1
6,3
27,3
52,2
0,0 20,0 40,0 60,0 80,0

61
Projects which had to be evaluated were similarly embedded as all projects in the organization, with a slightly higher distribution among project and mixed organizations.
Embeddedness of the described project in organization
Organizational embeddedness of projects (2/2)
Mixed organization
Staff organization (outside the line
organization)
Pure matrix organization
Pure project organization20,9
8,8
32,7
37,6
GermanicScandinavianAnglo-SaxonJapanOther
0,0 20,0 40,0 60,0 80,0N = 449, indicated in %
Percentage quotation according to region
0,0 20,0 40,0 60,0 80,0
East EuropeMediterraneanChina / Far EastLatin AmericaSub SaharaArab/Islamic World

62
In General, projects assessed as having low success show slightly higher time pressure and complexity than more successful projects. Only the perceived risk and uncertainty is generally stronger in less successful projects. The same applies for spatial distances which seemed to be greater in less successful projects.
Working conditions in projects according to project success show no clear pattern
Conditions of working with regard to perceived project success
11
11
16
16
25
33
45
69
67
57
53
53
37
46
disagree agree
right diagram: answers for scale 1&2 and 4&5 were summed up, scale point=3 was neglected
left diagram: Indicated in % N = 449
2,0 3,0 4,0 5,0
Arithmetic meanaccording to project success
highmediumlow
-0,14
0,01
-0,12
0,17
-0,38
0,38
-0,21
Spread between high and low project success
1 = strongly disagree 5 = strongly agree
The project was conducted by an international project team
Short spatial distances existed between project members
High risk and uncertainty
High degree of task novelty
High degree of complexity concerning interdisciplinary participants
High degree of complexity concerning content
High time pressure

63
In general, the working conditions seem to be strongest in the Latin America region . Greater differences in regard to variations of aspects exist especially in regions contained in region cluster “Other”.
Working conditions in projects according to region
Differences in working conditions in projects according to region
N = 449
The project was conducted by an international project team
Short spatial distances existed between project members
High risk and uncertainty
High degree of task novelty
High degree of complexity concerning interdisciplinary participants
High degree of complexity concerning content
High time pressure
2,0 3,0 4,0 5,0
1 = strongly disagree 5 = strongly agree
2,0 3,0 4,0 5,0
1 = strongly disagree 5 = strongly agree
GermanicScandinavianAnglo-SaxonJapanOther
East EuropeMediterraneanChina / Far EastLatin AmericaSub SaharaArab/Islamic World
Arithmetic mean according to region

64
Respondents’ assessment of firm environment is similar across regions in terms of its dynamic and available resources, while greater differences exist in the perception of a negative connotation of this environment.
Characterization of company’s environment on a regional comparison
1 = strongly disagree 5 = strongly agree
Com
pany
en
viro
nmen
tEnvironmental and organizational conditions of project work
Com
pany
and
en
viro
nmen
t cha
nges
1 2 3 4 5
Acquisitions
Divestments
Personnel
Customer or clients
Market segments
Organizational structure
very stressful, exacting, hostile, hard to keep afloat
very risky, one false step can mean the firm's undoing
very dynamic, changing rapidly
N = 449
Arithmetic mean according to region
1 2 3 4 5
1 = strongly disagree 5 = strongly agree
East EuropeMediterraneanChina / Far EastLatin AmericaSub SaharaArab/Islamic WorldGermanicScandinavianAnglo-SaxonJapanOther

65
Summary of main findings on context factors
Mixed organizations are prevalent forms of organizing in the sample.
Male respondents represented the majority across all regions.
Internal working conditions in projects such as time pressure, complexity and novelty do not seem to have a great impact on project success.
Risk and uncertainty built an exception to these findings as they seem slightly correlating with project success.
Across all regions, the company’s environment was perceived as highly dynamic.
The negative perception of the company’s environment in terms of risk varies across regions, whereby regional clusters of Scandinavia and Anglo-Saxon have the lowest negative perception.

66
Results of correlation analysis of competence factors across regions
Germanic Scandi-navian
Anglo-Saxon Japan East
EuropeMedi-
terranean China Africa Arab
Project Experience
Transactional Leadership
Transformational Leadership
Organizational Commitment
Working Atmosphere
Ressources
Senior Management Support
Organizational Support
Standard Standardization
indi
vidu
al
Com
pete
nce
Org
anis
atio
nal
Com
pete
nce
N = 449; Correlation analysis of single constructs with project success:correlation <0,2= ○;0,2 – 0,29=●; 0,3 – 0,49=●●; >0,5=●●●
67
1 Objectives and Procedures of the Survey
2 Data Set and Environmental Characteristics
3 Individual Competences
Organizational Competences45 Project Success / Outcomes
6 Context Factors
7 Conclusion
8 Comparative Analysis of the Regional Cluster “Germanic”
68
The importance of projects was acknowledged by all respondents from a range of industries and countries .
Preferences of working conditions such as trustful environment and standardization vary strongly across country regions.
Transformational leadership as people-oriented leadership style is the prevalent leadership behavior in project settings across all countries.
The majority of respondents holds a certification in project management.
The importance of standardization is stated across all countries.
A gap exists between the satisfaction with standards in PM and the actual application of these standards in projects.
Japan scored most indicators of project success higher on the overall country region comparison.
External project environment was most positively assessed by Anglo-Saxon and Scandinavian respondents; the remaining factors were assessed with no clear patterns to be apparent.
General findings of the survey
Regional differences exist in PM while the importance of projects is acknowledged everywhere. Potential for improvements have in particular found in the application of PM standards.

69
In line with the findings of the study, the following recommendations can be made:
Companies must become aware of the importance of project management.
A standardized project management method should be established.
Standardized project management must be adapted to the specific needs of the company.
Lessons learned should be part of this standardized project management.
Project managers should in particular be trained in leadership skills.
General recommendations can be deducted from the survey
Companies doing projects successfully are aware of the importance of project management.
70
1 Objectives and Procedures of the Survey
2 Data Set and Environmental Characteristics
3 Individual Competences
Organizational Competences45 Project Success / Outcomes
6 Context Factors
7 Conclusion
8 Comparative Analysis of the Regional Cluster “Germanic”
71
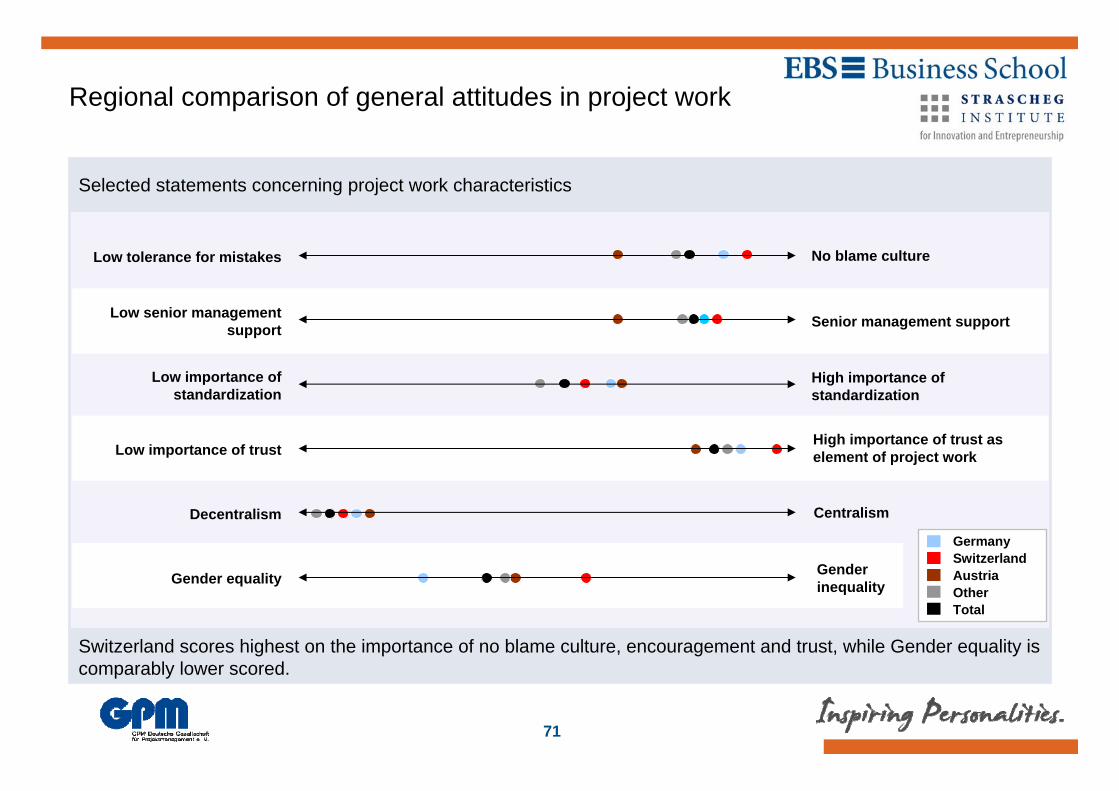
Switzerland scores highest on the importance of no blame culture, encouragement and trust, while Gender equality is comparably lower scored.
Selected statements concerning project work characteristics
Regional comparison of general attitudes in project work
Centralism
Low importance of trust
Low importance of standardization
Low senior management support
Low tolerance for mistakes
Decentralism
Gender equality
High importance of trust as element of project work
High importance of standardization
Senior management support
No blame culture
Centralism
Gender inequality
GermanySwitzerlandAustriaOtherTotal

72
Leadership behavior in projects – Germanic region comparison
Transformational leadership behavior as prevalent leadership behavior in the referred project environments
In line with all other regions, transformational leadership is also on this level of comparison the more prevalent form of leading in contrast to transactional leadership.
Austria shows highest scores in terms of transformational leadership.
The amount of transactional leadership traits in Switzerland is relatively small.
40
45
50
55
60
65
70
Germany Austria Switzerland Other Total
transactionaltransformational
N = 124 N = 19 N = 19 N = 449N = 297

73
Index Individual Competence in Project Management
Perceived Leadership Behavior:Transactional
Perceived Leadership Behavior:Transformational
Project Experience
Transformational leadership behavior as dominant leadership behavior in the referred project environments
Responses from Austria represent highest value for the Individual Competence Index
Germany and Switzerland are both below the average score regarding the overall index of individual competences in project management
69,4
61,5 60,758,756,8
Germany Austria Switzerland Other Total
Indi
vidu
al C
ompe
tenc
e in
Pro
ject
M
anag
emen
t
All-Country Average: 60,7

74
Years spent working in projects
Experience of working in project environments - Germanic regions
Weighted average of project work experience (in years) -Region comparison
19%58%
13%
10% < 1 to 3
4 to 6 7 to 10 > 10
With more than 10 years of working in projects, the majority of respondents is highly experienced.
Across the regions compared, the average project experience of respondents was evenly distributed, thus indicating the remaining answers to be made with comparable experience in PM.
Respondents from Switzerland and Austria had slightly more project-experience on average, which might be a hint to the prior sticking out in the two leadership dimensions.
9,5
11,5 11,9
9,5 9,7
Germany Austria Switzerland Other Total

75
Index of Organizational Competence for Germanic regions
Senior Management Support
Resources
Standardization
Organizational Commitment
Working Atmosphere
Organizational Support
Austria as individual country shows the greatest value in terms of the overall organizational competence index of the Germanic regions, while Germany and Switzerland are well below average scores.
60,359,5
58,857,757,3
Germany Austria Switzerland Other Total
Org
aniz
atio
nal C
ompe
tenc
e in
Pr
ojec
t M
anag
emen
t
All-Country Average: 58,8
76
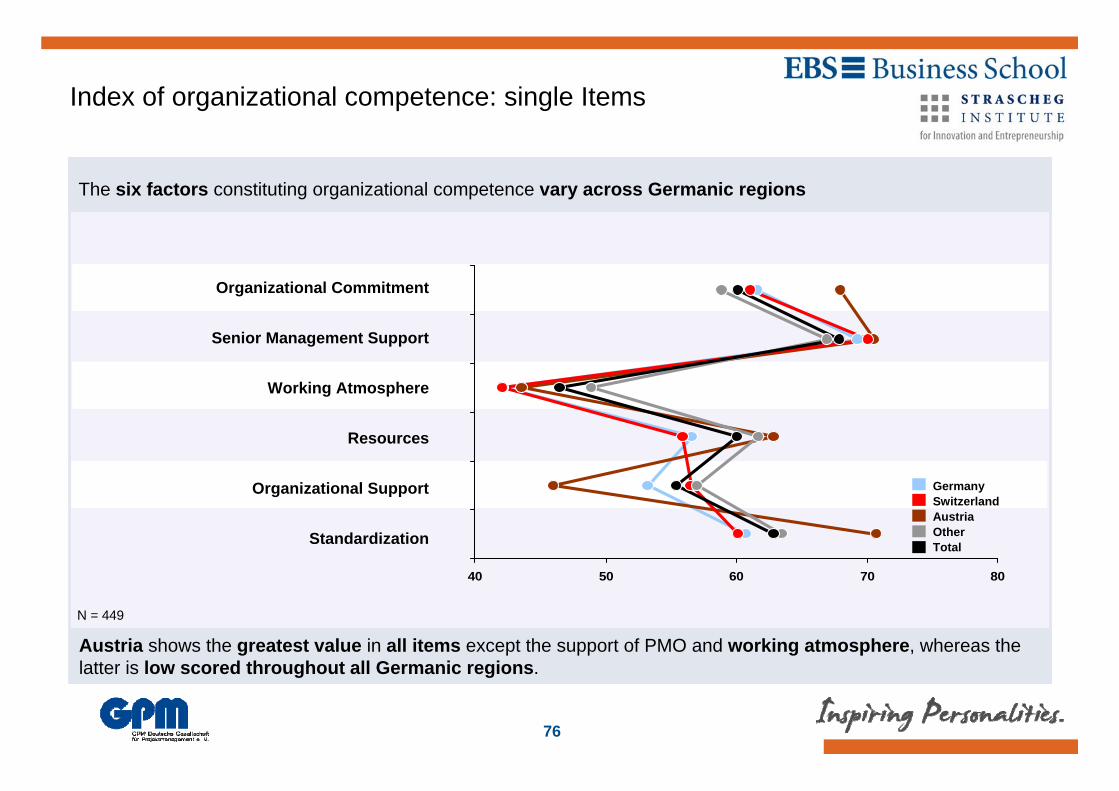
Index of organizational competence: single Items
Austria shows the greatest value in all items except the support of PMO and working atmosphere, whereas the latter is low scored throughout all Germanic regions.
Senior Management Support
Resources
Standardization
Organizational Commitment
Working Atmosphere
Organizational Support
40 50 60 70 80
The six factors constituting organizational competence vary across Germanic regions
GermanySwitzerlandAustriaOtherTotal
N = 449

77
Working atmosphere as strongest soft factor across all regions
Comparison of soft factors across Germanic regions
N = 449
Percentage quotation according to region
Working atmosphere scores highest across all
regions
It is equally distributed in the Germanic regions,
exceeding the average scores on an all region
comparison.
In contrast to the remaining factors and regions,
Austria scores comparably high in terms of
organizational commitment.
40
50
60
70
80Germany
Austria
SwitzerlandOther
Total
Organizational Commitment Senior Management Support Working Atmosphere

78
Austria as strongest deviator in Germanic region results
Comparison of hard factors across Germanic regions
N = 449
Percentage quotation according to regionStandardization was scored highest from
respondents from Austria.
In contrast, organizational support scored lowest on a
Germanic region comparison.
All Germanic regions state lower resources
compared to the remaining regions.
Participants from all countries of the Germanic region
state to a relatively higher amount to have a PMO in their
company compared to all regions regarded.
40
50
60
70
Germany
Austria
SwitzerlandOther
Total
Ressources Organizational Support Standardization

79
Respondents from Germany assess their satisfaction with the application of standards in projects the lowest, while respondents from Austria rank this point highest.
Austria scores consistently higher in terms of utilization of PM standards and methods
Organizational Competences: Standardization
2,0 3,0 4,0 5,0
disagree agree
1 = strongly disagree 5 = strongly agree
12
15
37
12
21
12
16
32
69
64
32
70
59
70
56
48
Impo
rtan
ceU
tiliz
atio
n
N = 162
An organizational entity exist which supports projects
Accomplishment of lessons learned are part of standardized project management methods
The standards fulfill the requirements of our project work
Standardized project management methods were used in my last completed project
The project management standards in use are adapted to the specific needs of our company
I am satisfied with the application of the standards in our projects
Standards are important for projects in our company
Standards are important in our company
GermanySwitzerlandAustriaOtherTotal
right diagram: answers for scale 1&2 and 4&5 were summed up,scale point=3 was neglectedleft diagram: Indicated in %
Arithmetic mean according to region
80
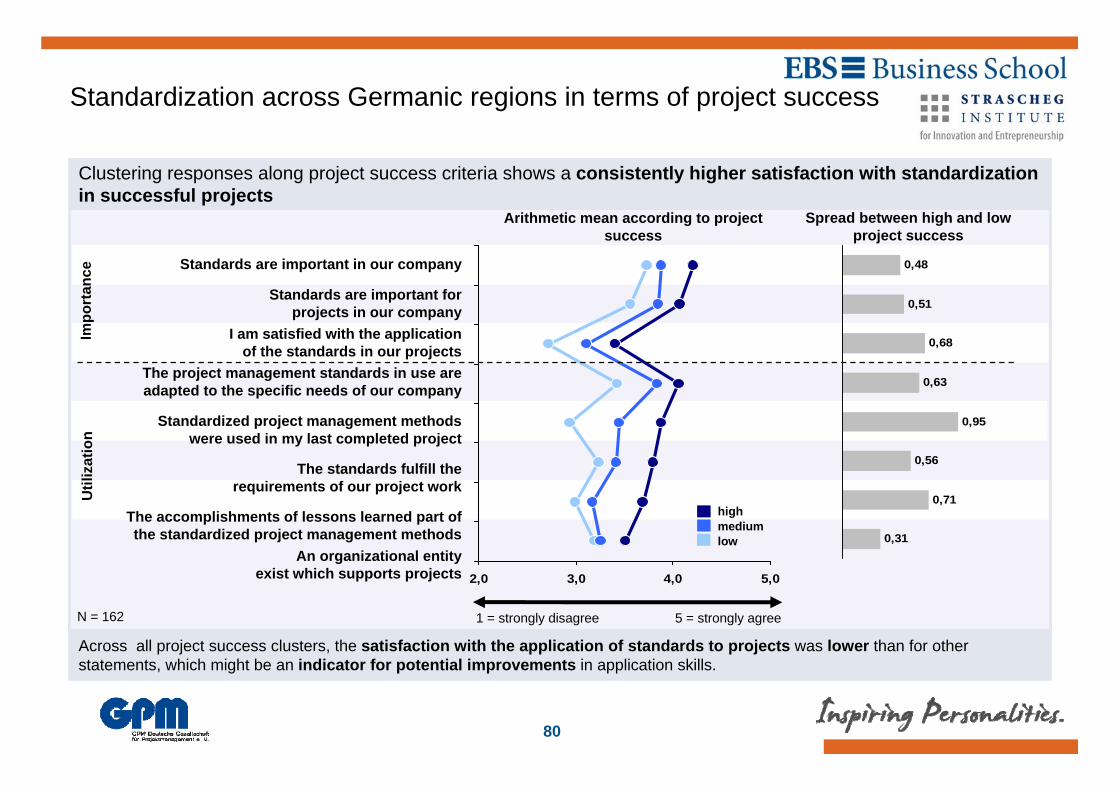
Across all project success clusters, the satisfaction with the application of standards to projects was lower than for other statements, which might be an indicator for potential improvements in application skills.
Clustering responses along project success criteria shows a consistently higher satisfaction with standardization in successful projects
Standardization across Germanic regions in terms of project success
2,0 3,0 4,0 5,0
1 = strongly disagree 5 = strongly agree
Impo
rtan
ceU
tiliz
atio
n
N = 162
An organizational entity exist which supports projects
The accomplishments of lessons learned part of the standardized project management methods
The standards fulfill the requirements of our project work
Standardized project management methods were used in my last completed project
The project management standards in use are adapted to the specific needs of our company
I am satisfied with the application of the standards in our projects
Standards are important for projects in our company
Standards are important in our company
Arithmetic mean according to project success
highmediumlow
0,48
0,51
0,68
0,63
0,95
0,56
0,71
0,31
Spread between high and low project success

81
Austria indicates a high amount of users of Prince 2 while Switzerland is along with the majority of the rest of the regions using the PMBOK. Respondents from Germany show no clear preference with only PMBOK standing out.
PMBOK is the overall most used PM-Guide
PMBOK as most used PM standard across Germanic regions
Other
Prince 2
ICB 3.0
PMBOK
N = 162
43,0
10,9
14,0
39,0
• Company-Own• None• Software-based• ISO-Standards• Other Standards:• APMBOK, CMMI,IPMA, ICB 2.0
0,0 20,0 40,0 60,0 80,0
Percentage quotation according to region
GermanySwitzerlandAustriaOther

82
The majority of used standards cover processes, methods, and templates relevant to PM, while few encompass software. Austria has a slightly higher focus on Methods, especially in contrast to Switzerland.
What do the stated Project Management standards in use comprise?
Comprehensiveness of standards in use
80,8
70,2
65,7
50,3
39,0
4,0
0,0 20,0 40,0 60,0 80,0 100,0
Other
Software
Terminologies
Templates
Methods
Processes
N = 162; Indicated in %
• Investment Gates• General Rules• Roles & Responsibilities• Training• WBS Coding System
Percentage quotation according to region
GermanySwitzerlandAustriaOther

83
Switzerland as highest scoring except for the overall perception of success, which is highest ranked by respondents from Austria.
Switzerland is overall leading while Germany lays slightly beneath the overall regions in terms of success indicators.
disagree agree
1 = strongly disagree 5 = strongly agree
21
19
46
15
14
62
66
29
66
70
Perception of different project success measures
The project had only minor changes
The project was completed on time
All in all, the relevant efficiency measures were achieved
The project was completed within budget
Overall, the project was a great success
2,5 3,0 3,5 4,0 4,5
Percentage quotation according to region
N = 162, left diagram: Indicated in %
GermanySwitzerlandAustriaOther

84
Partner of the survey
85
Contact
Prof. Dr. Ronald Gleich I Christoph Schneider I Ana Müller
Strascheg Institute for Innovation and Entrepreneurship
at the
EBS Universität für Wirtschaft und Recht i.Gr.EBS Business School
65375 Oestrich-Winkel
Email: [email protected]
Phone: + 49 6723 8888-300
Fax: + 49 6723 8888-301
Reinhard WagnerChair of PM research
GPM Deutsche Gesellschaft für Projektmanagement e.V.
Frankenstraße 152
90461 Nürnberg
Email: [email protected]
Phone: +49 911 433369-0
Fax: +49 911 433369-99

86
Hofstede, G. Culture's Consequences, Comparing Values, Behaviors, Institutions, and Organizations Across Nations. Thousand Oaks CA: Sage Publications, 2001
House, R. J. (ed) Culture, leadership, and organizations : the GLOBE study of 62 societies.Thousand Oaks, California: Sage, 2004
Lord, R.G. & Maher, K.J. Leadership and Information Processing Linking Perceptions and Performance. Routledge,1993
Trompenaars, F. & Hampden-Turner, C. Riding the Waves of Culture: Understanding Cultural Diversity in Business (Second Edition) London: Nicholas Brealey, 1997
References: