Embed Size (px)
Citation preview

Global to Regional Agricultural Monitoring using Satellite Data
NASA/GSFC – USDA/FAS Partnership
Assaf AnyambaGEST/UMBC
@GSFC – Biospheric Science Branch
NASA/USDA Interagency Workshop Denver, Co. March 4-5, 2003
Weather and Agricultural Competitiveness Focus Area Session

USDA/NASA Context • Global agricultural production effects US Agricultural competitiveness• Information required for both “domestic” production and “global” production
from “competitor” countries in order to enhance the competitiveness of the US farmer in the global agriculture market place
• Requirement for timely global assessment of vegetation state/crop condition in support of:
– FAS• NASA/FAS LACIE>AGRISTARS>2000 MOU • Major Agricultural Regions during the growing season • Data combined with other information sources (weather, attaché, field reports, wire
reports)• Estimates of Crop Production at the end if the growing season
– USAID Famine Early Warning System (FEWS)• NASA/USAID and UN/FAO GIEWS Collaboration started in mid 80’s • Monitoring Drought susceptible areas, growing season• Drought indices developed based on multiple data sources – weather, satellite rainfall,
water satisfaction, field and nutrition reports
• Current Approach – Multi-year time series analysis using VI’s to determine deviations from ‘normal’
conditions (AVHRR, SPOT VEGETATION) – High resolution satellite data acquired “interest” with extreme anomalies (Landsat,
Spot HRV, Ikonos)– High degree of analyst interpretation

Satellite Assets for Global Regional Agricultural Monitoring
• Currently Used – Moderate Resolution
• AVHRR, SPOT Vegetation (8km>1km) • MODIS AM/PM (Terra and Aqua) ( 1km>250m)
– High Resolution• Landsat (30m >15m)
– Hyperspatial Resolution • Ikonos (3m- - 1m)
• Areas for Future Satellite Research– Hyperspectral Imaging for crop discrimination – Thermal imaging for crop stress monitoring

Technology / Science Transition Process
(Research to Operations)
Science Research and Development
Operational Research and Development
Operations Use(Enhancements) USDA/USAID/FEWS etc
Time Transfer of technology in stages as the Research Develops – Ongoing Process

Issues Requiring Consideration
• Time series analysis requires good inter calibration between instruments and sensors (NOAA-7 > NOAA14): leverage off NASA research on long term data sets for GCR
• Timeliness of data delivery critical, redundancy in data provision desirable i.e. multiple data sources, AVHRR, SPOT Veg. etc
• Relationship between products from different sources needs establishing
• Just because new and better data exists doesn’t mean it is necessarily used - care is needed with technology insertion into the operational chain – e.g. period of overlap desirable, non-intrusive training process needed
• Operators require high order products rather than raw data • Emphasis given to operational systems and data provision

HERITAGE AVHRR BASED SYSTEM

Provide Vegetation Index time series products from NOAA-AVHRR (8km) over FAS global agricultural regions thus release FAS from data production efforts to focus primarily on agricultural monitoring work. Provide RD (new products, methods) for satellite vegetation products of that may be used by FAS Serve as “backup” depository for FAS NOAA-AVHRR long-time series data sets. Acquire from SPOT Image and archive on behalf of FAS, SPOT Vegetation 1-km NDVI and associated channel data, unpack, post-process, subset for use by FAS Provide “on-demand” vegetation index products to FAS in case of emergencies (f.e. during Afghanistan crisis) Provide satellite altimeter data for monitoring levels of large water bodies (lakes, reservoirs) important in irrigated agriculture especially in Middle East and Africa
FAS Agricultural Regions
HERITAGE SYSTEM GSFC/GIMMS:

NOAA/AVHRR 8km ProductsAll AVHRR products provided by continent
Long-term Mean NDVI surfaces (historical average)
15 day NDVI composites
Monthly NDVI composites
Longterm Means (15-day &Monthly)
Longterm Maximum (15-day &Monthly)
Longterm Minimum (15-day &Monthly)
NDVI anomalies (15-day &Monthly)
Quality Flags ( Clouds & bad data: 15-day &Monthly)
JPG graphics of all products (Read for use)

NOAA/AVHRR 8km Products: Examples
Australia: Long-term Mean (1982-1999)
NASA/GSFC-GIMMS Group

Examples NOAA/AVHRR 8km NDVI Products: Long-term Minimum: February
Long-term Mean: February
Long-term Maximum: February
NASA/GSFC-GIMMS Group

NOAA/AVHRR 8km NDVI Products: Examples Cloud Frequency: February
Monthly NDVI: February 1998
NDVI Anomaly : February 1998
The products provide “base line” metrics for agricultural monitoring
NASA/GSFC-GIMMS Group
Weather Data
Crop Models
Vegetation Indices– GAC (8-km) and LAC
(1-km) from AVHRR-NOAA
– SPOT-VEG (1-km)
Crop Explorer = Automated Weather, Crop Models, & Vegetation Analysis Over Major Crop Regions

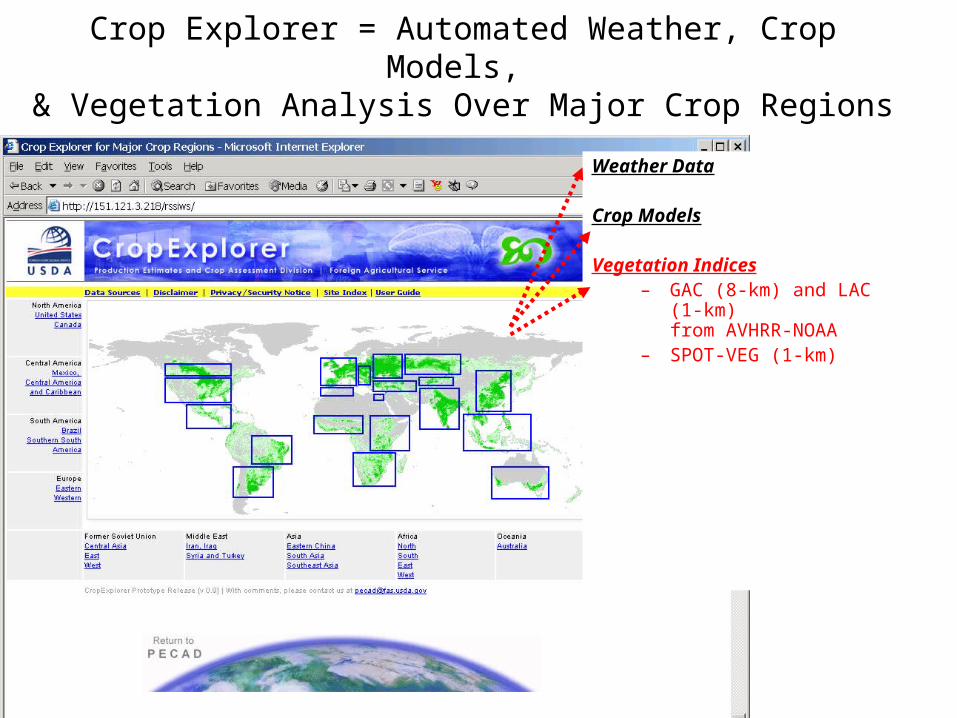
Crop Explorer (NDVI Monitors Vegetation Condition)
Crop Explorer (NDVI Monitors Vegetation Condition)
A NEW NASA/USDA-FAS Global Agricultural Monitoring Activity


Data Flow for Current Project
Crop Explorer http://151.121.3.218/
(Maps & time-series graphs over major crop regions)
AVHRR/NOAA
TERRA/AQUAMODIS SPOT-VEG
ARCVIEW/CADRE
(Multi-year comparisons)
AUTOMATED
Data Processed by NASA/GIMMS
ArcGIS(Images, shape files, & graphs)
PCIWORKS(Image analysis)
CADRE DBMS
GAC (8-km)
GAC images (8-km)
CADRE Grid Cells (40-km)
(1-km) (250-m)
INTERACTIVE 40-km
grid cells
Interactivedata extraction
Automated products on web
RASTERDBMS Required
Images & time-series graphs generated at 8-km, 1-km, & 250-m resolutions

ACTIVITY: The Application of NASA EOS MODIS Data to Agricultural Assessment and Forecasting by the USDA Foreign Agricultural Service
Delivery and integration of Rapid Response data into the FAS monitoring system to facilitate improved monitoring of climate hazards, such as drought, large scale flooding, and snow storms, on agricultural production.
Development and testing of new MODIS RR products including new band combination products, a snow cover product, a MODIS continuity vegetation index and an enhanced vegetation index (EVI).
Establishing the relationship between MODIS VI data and the long-term archives from the AVHRR and SPOT-VEGETATION currently being used by PECAD.
Development of a distributed data and information system utilizing Internet GIS technology. RR products will be hosted by University of Maryland and made available to FAS personnel and eventually for public use. The interfaces will provide mosaicking, reprojection capabilities and common access to the deep archive of MODIS data prepared for the FAS at University of Maryland.
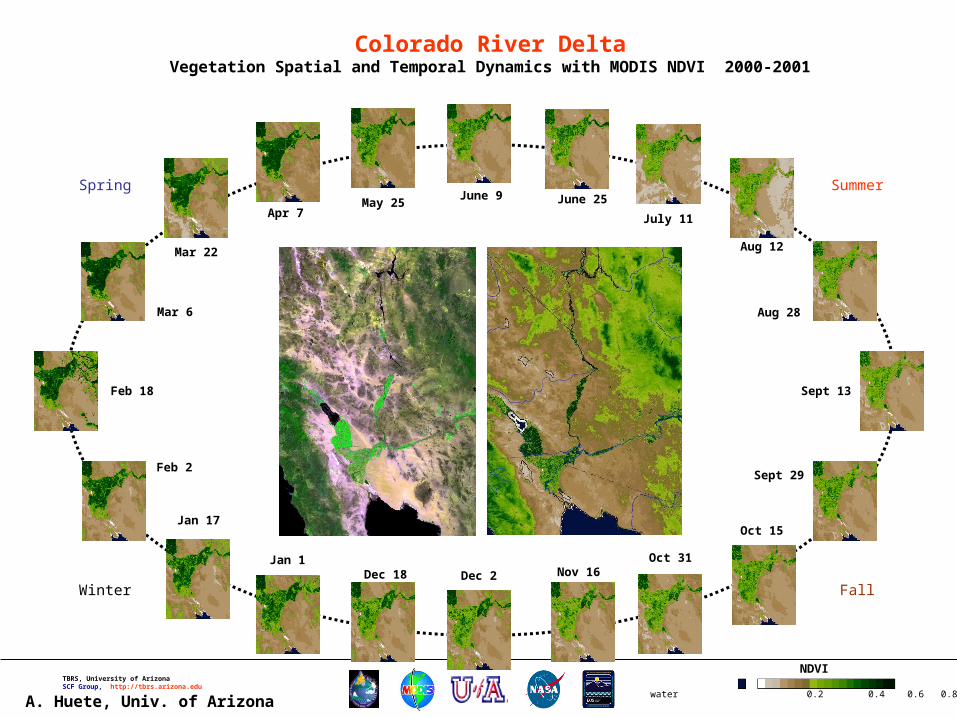
TBRS, University of ArizonaSCF Group, http://tbrs.arizona.edu
NDVI
water 0.2 0.4 0.6 0.8 1.0
Colorado River DeltaVegetation Spatial and Temporal Dynamics with MODIS NDVI 2000-2001
June 9May 25
Apr 7
Mar 22
Mar 6
Feb 18
Feb 2
Jan 17
Jan 1Dec 18 Dec 2
Spring Summer
FallWinter
Sept 13
Sept 29
Oct 15
Oct 31Nov 16
June 25
July 11
Aug 12
Aug 28
A. Huete, Univ. of Arizona

Rapid Response SystemNASA/GSFC
Terra & Aqua
Direct BroadcastReceiving Station
GES DAACNASA/GSFC
NOAA
University of MarylandGeography Dept
USDA Forest ServiceRemote Sensing
Application Center
EDOS MODISL0 Data
Active Fire andCorrected Reflectancehttp://rapidfire.sci.gsfc.nasa.gov
Cumulative Fire Mapshttp://www.fs.fed.us/eng/rsac
Active FireLocations Burn Severity Maps
Handcrafted Imagery
L1B Data
Active Fire LocationsSelected Imagery
Web Fire Maps and Fire Feature Server
http://rapidresponse.umd.edu
Backup FeedL1B Data
Active Fire Locations
GOFC Fire Partners
NASA Earth Observatoryhttp://earthobservatory.nasa.gov
MODIS Rapid Response Project: Design
T+2-5hrs
T+30min
Twice Daily 5am/pm MST
T+5hrs
T+5hrs
MODIS home pagehttp://modis.gsfc.nasa.gov

Example of 250m Corrected Reflectance ProductBrazil/Bolivia (08/02/01)
http://rapidfire.sci.gsfc.nasa.gov
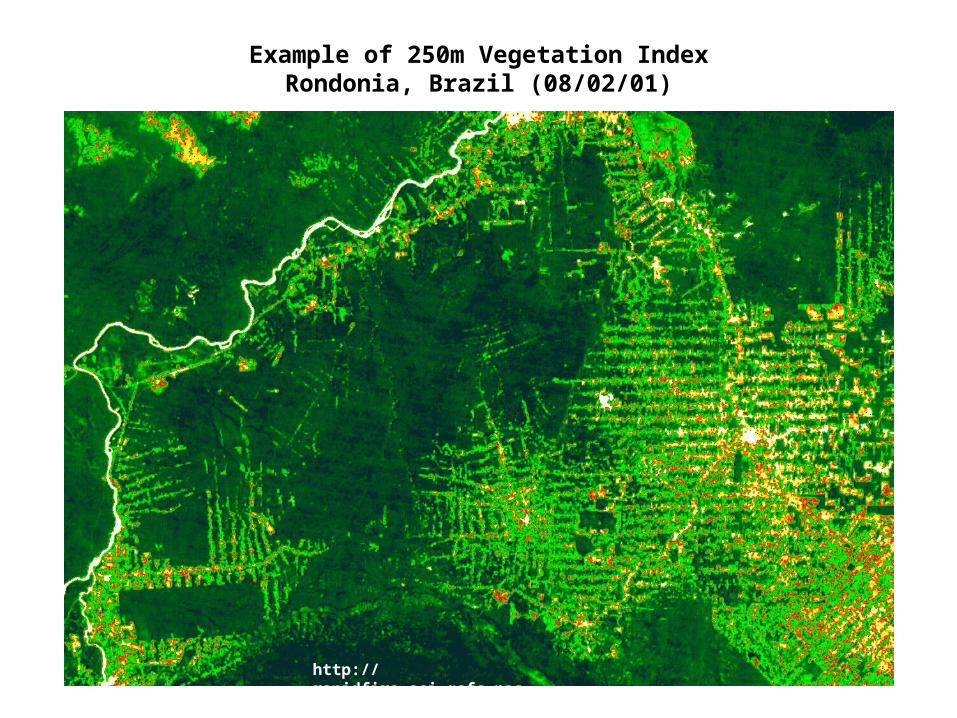
Example of 250m Vegetation IndexRondonia, Brazil (08/02/01)
http://rapidfire.sci.gsfc.nasa.gov
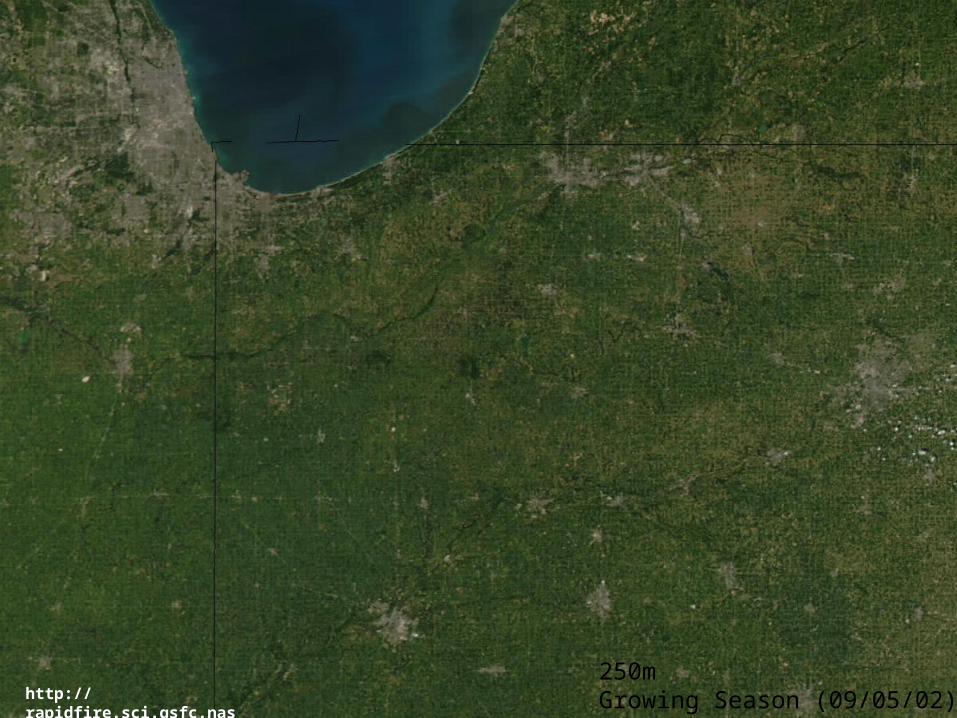
250mGrowing Season (09/05/02)http://rapidfire.sci.gsfc.nasa.gov

250mAfter Harvest (10/05/02)
http://rapidfire.sci.gsfc.nasa.gov

Nile Agricultural Region
I km 250m
http://rapidfire.sci.gsfc.nasa.gov
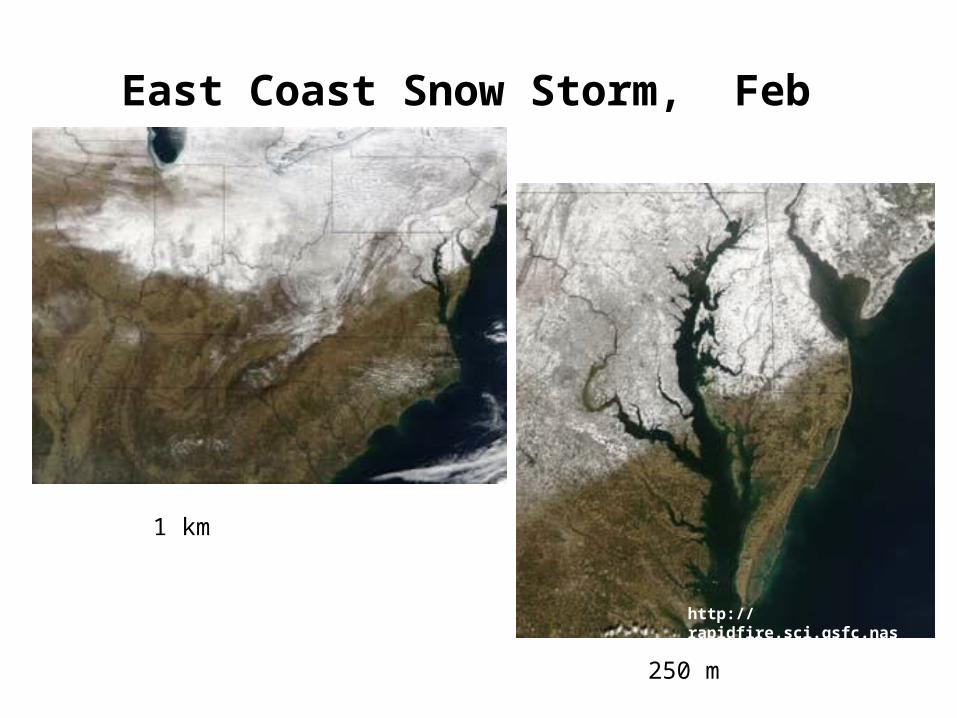
East Coast Snow Storm, Feb
1 km
250 m
http://rapidfire.sci.gsfc.nasa.gov

500m
1km
http://rapidfire.sci.gsfc.nasa.gov

IRAQ1Km NCC (01/13/03) http://rapidfire.sci.gsfc.nasa.gov

IRAQ250m NCC (01/13/03) http://rapidfire.sci.gsfc.nasa.gov

IRAQ1km FCC (01/13/03)
http://rapidfire.sci.gsfc.nasa.gov

IRAQ250m FCC (01/13/03)
http://rapidfire.sci.gsfc.nasa.gov

Next Steps – Short Term Strategy
• Proceed with MODIS technology insertion with FAS – build on NASA MODIS research
• Evaluation of New Indices and Products (EVI, LAI, LST)
• Develop multi-source satellite data base for FAS (AVHRR, SPOT VEG, MODIS)
• Closer link between NASA/USDA ag. field based research and operational users

Seasonal Patterns of Major Biomesin North America
A. Huete, Univ. of Arizona

Next Steps – Long Term Strategy
• Need to secure long term observations AVHRR>MODIS>VIIRS NPP > VIIRS NPOESS
• NASA can help USDA make the case for VIIRS requirements
• Need to ensure USDA requirements are included in the planning for data products and delivery from VIIRS
• Need to explore improved crop production forecasting combining satellite and weather data (seasonal to interannual forecasts, El Nino/ La Nina Conditions etc: NSIPP, IRI)
• Develop long term partnership between agencies e.g. joint projects and research announcements

CY 99 00 11 12 13 14 15 16 17 1803 08 09 1001 02 0704 05 06
Earliest AvailabilityS/CDeliveries
0530
1330
DMSP
0730 - 1030
NPOESSC3
POES
EOS-Aqua
NPOESSC2 or C1N’
Earliest Need to back-up launch
F20
NPOESSDMSP
POES
NPPEOS-Terra
METOP
NPOESSC1 or C2
F16
N
MF17 F19F15
F18
L (16)
WindSat/Coriolis
Satellite Transition Schedule(9 March 2001)
Slopes indicate 10-90% need (NPOESS GAP 5b)
Projected End of Life based on 50% Need
Local Eq
uato
rial C
rossin
g T
ime
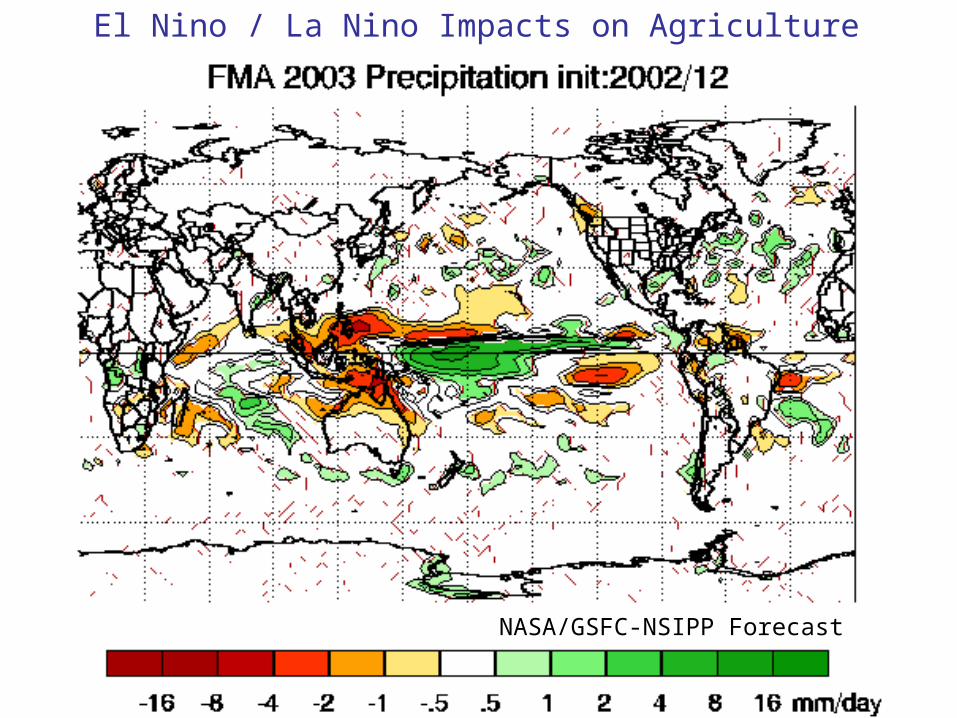
El Nino / La Nino Impacts on Agriculture
NASA/GSFC-NSIPP Forecast

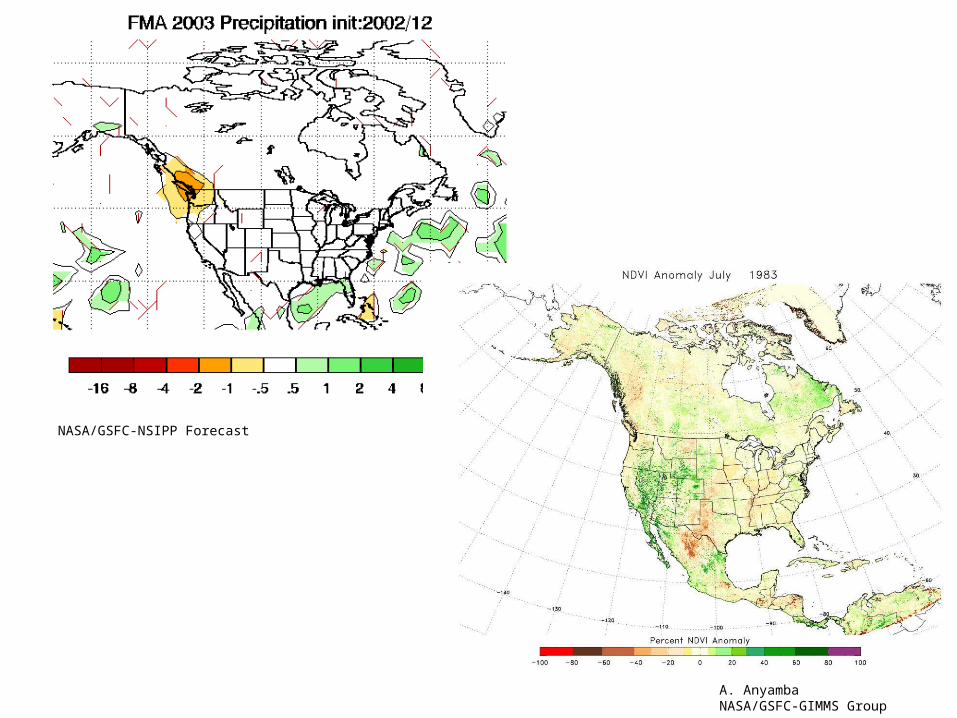
NASA/GSFC-NSIPP Forecast
A. AnyambaNASA/GSFC-GIMMS Group

NASA/GSFC-NSIPP Forecast
A. AnyambaNASA/GSFC-GIMMS Group
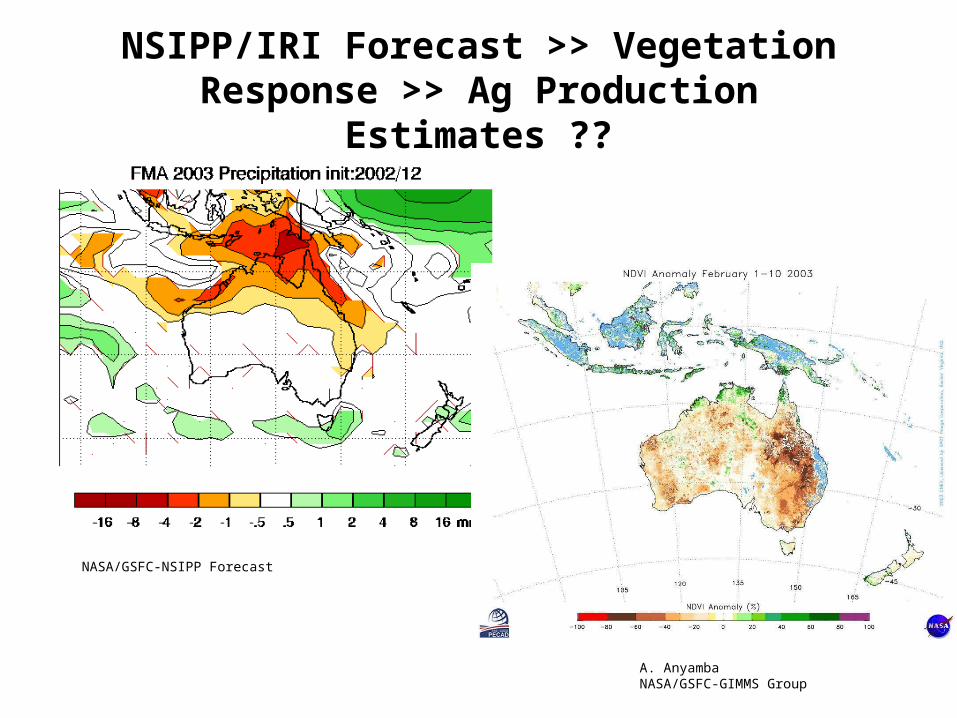
NSIPP/IRI Forecast >> Vegetation Response >> Ag Production Estimates ??
NASA/GSFC-NSIPP Forecast
A. AnyambaNASA/GSFC-GIMMS Group