Embed Size (px)
Citation preview
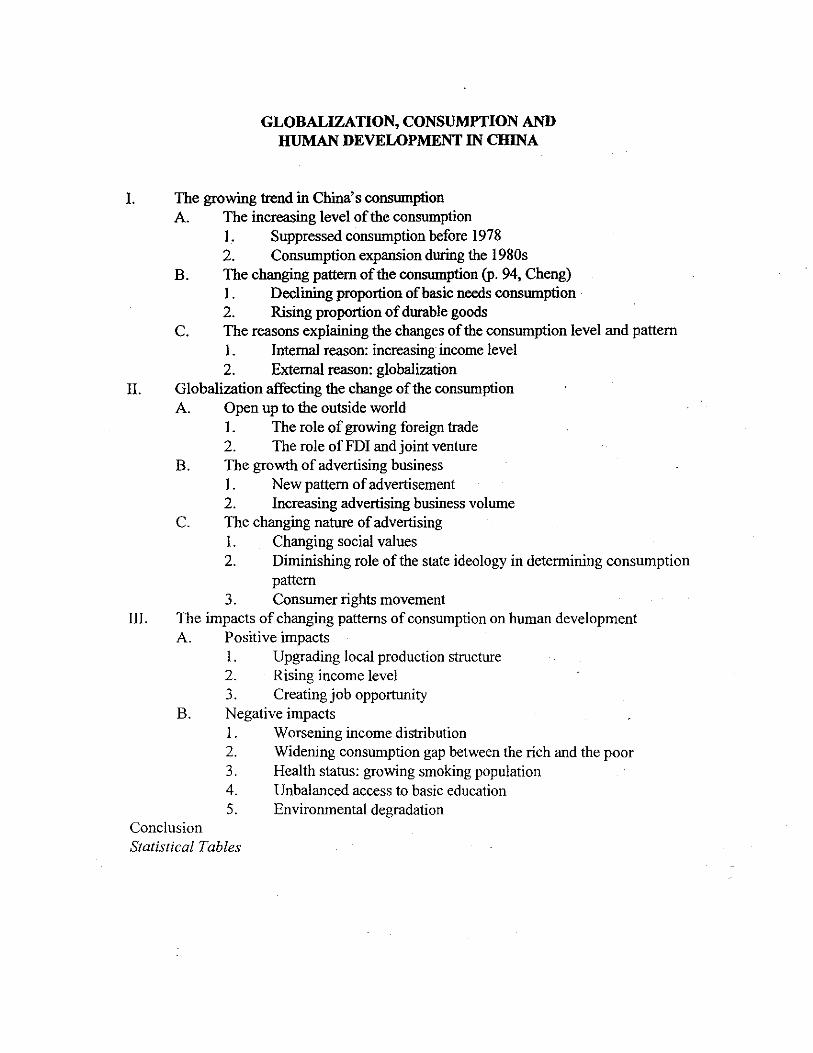
GLOBALIZATION, CONSUMPTION AND HUMAN DEVELOPMENT IN CHINA
(Draft)
AmeiZhang November 13, 1997
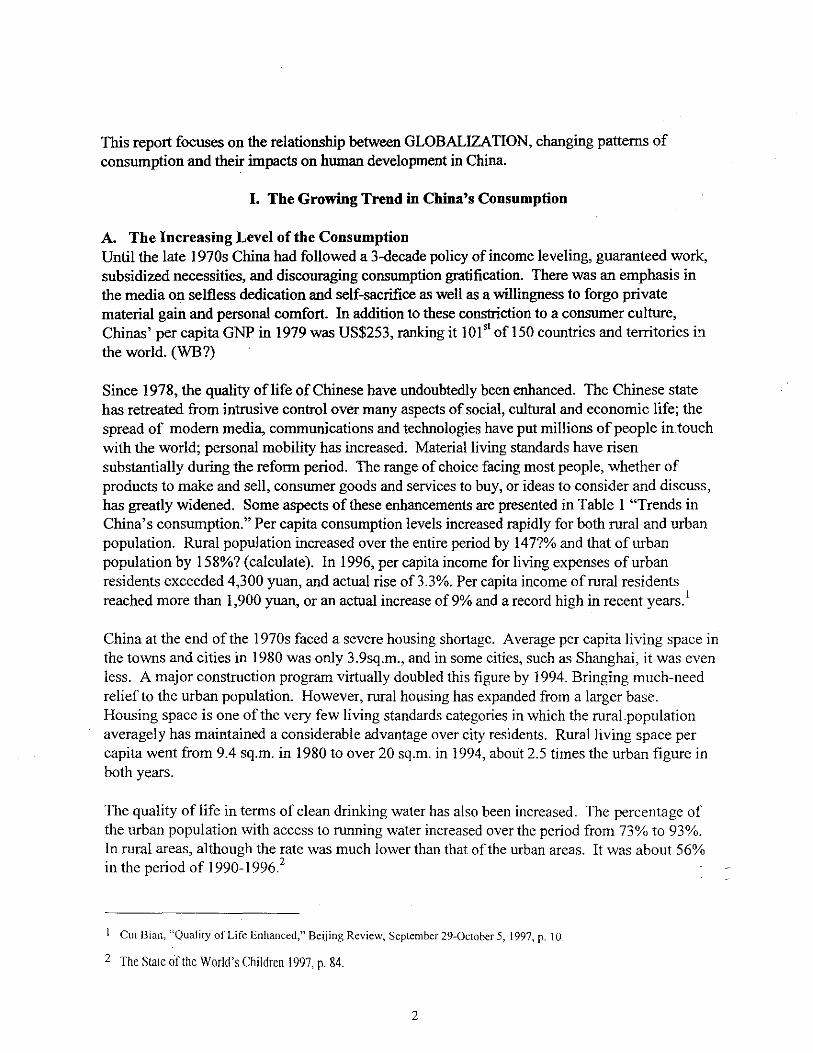
GLOBALIZATION, CONSUMPTION AND HUMAN DEVELOPMENT IN CHINA
I. The growing trend in China's consumption A. The increasing level of the consumption
I. Suppressed consumption before 1978 2. Consumption expansion during the 1980s
B. The changing pattern of the consumption (p. 94, Cheng) 1. Declining proportion of basic needs consumption 2. Rising proportion of durable goods
C. The reasons explaining the changes of the consumption level and pattern I. Internal reason: increasing income level 2. External reason: globalization
II. Globalization affecting the change of the consumption A. Open up to the outside world
1. The role of growing foreign trade 2. The role of FDI and joint venture
B. The growth of advertising business I. New pattern of advertisement 2. Increasing advertising business volume
C. The changing nature of advertising I. Changing social values 2. Diminishing role of the state ideology in determining consumption
pattern 3. Consumer rights movement
III. The impacts of changing patterns of consumption on human development A. Positive impacts
1. Upgrading local production structure 2. Rising income level 3. Creating job opportunity
B. Negative impacts 1. Worsening income distribution 2. Widening consumption gap between the rich and the poor 3. Health status: growing smoking population 4. Unbalanced access to basic education 5. Environmental degradation
Conclusion Statistical Tables
This report focuses on the relationship between GLOBALIZATION, changing patterns of consumption and their impacts on human development in China
I. The Growing Trend in China's Consumption
A. The Increasing Level of the Consumption Until the late 1970s China had followed a 3-decade policy of income leveling, guaranteed work, subsidized necessities, and discouraging conswnption gratification. There was an emphasis in the media on selfless dedication and self-sacrifice as well as a willingness to forgo pri vate material gain and personal comfort. In addition to these constriction to a consumer culture, Chinas' per capita GNP in 1979 was US$253, ranking it 10 I 51 of 150 countries and territories i'l the world. (WB?)
Since 1978, the quality of life of Chinese have undoubtedly been enhanced. The Chinese state has retreated from intrusive control over many aspects of social, cultural and economic life; the spread of modem media, communications and technologies have put millions of people in touch with the world; personal mobility has increased. Material living standards have risen substantially during the reform period. The range of choice facing most people, whether of products to make and sell, conswner goods and services to buy, or ideas to consider and discuss, has greatly widened. Some aspects of these enhancements are presented in Table 1 "Trends in China's consumption." Per capita consumption levels increased rapidly for both rural and urban population. Rural population increased over the entire period by 147?% and that of urban population by 158%? (calculate). In 1996, per capita income for living expenses of urban residents exceeded 4,300 yuan, and actual rise of 3.3%. Per capita income of rural residents reached more than 1,900 yuan, or an actual increase of 9% and a record high in recent years. I
China at the end of the 1970s faced a severe housing shortage. Average per capita living space in the towns and cities in 1980 was only 3.9sq.m., and in some cities, such as Shanghai, it was even less. A major construction program virtually doubled this figure by 1994. Bringing much-need relief to the urban population. However, rural housing has expanded from a larger base. Housing space is one of the very few living standards categories in which the rural.population averagely has maintained a considerable advantage over city residents. Rural living space per capita went from 9.4 sq.m. in 1980 to over 20 sq.m. in 1994, about 2.5 times the urban figure in both years.
The quality of life in terms of clean drinking water has also been increased. The percentage of the urban population with access to running water increased over the period from 73% to 93%. In rural areas, although the rate was much lower than that of the urban areas. It was about 56% in the period of 1990-19962
I Cui Bian, "Quality of Life Enhanced," Beijing Review, September 29-0ctober 5, 1997, p. 10.
2 The Slale cirtlle World's Children 1997, p. 84.
2
The food consumption has also been improved. Just a few years ago, Chinese would eat mostly rice and vegetables, but now they enjoy a spread of meat, fish, and eggs. Per capita global consumption of beef, pork, and poultry has surged 11?"10 in the past decade, The hog herd soar to 510 million by 2000, from 307 million a decade ago.3 In addition, the population greatly increased its access to consume all kinds of durable goods, from bicycles to VCRs. By 1994, there were almost two bicycles per urban household (and 1.4 per rural household) and virtually the entire urban population had television sets, mostly color sets.
Throughout China middle classes are emerging with spending power. Measured by their purchasing power parities (PPP), China's consumers are valuting up the ranks of consuming nations, although the country still has very low GNP per head levels. Furthermore, in China consumer spending still accounts for a relatively small proportion of GDP, the share grow rapidly.
Food accounts for above 50% of consumer spending in China, and together with clothing and footwear and other goods and services, represents 80% of total spending. Ongoing urbanization has caused the overall share of spending on food and drink to fall as consumers move from the farm and spend more on housing and related goods, health and transport. But the fall in spending on food as a percentage of total spending is not dramatic.
To study the change of response of consumer demand to changes in income, income elasticity for two time intervals, 1981-85 and 1985-90, are presented as Table: ?"Elesticities of expenditures." As indicated, elasticity's offood expenditure were less than unity for both groups of households, while those of staple food were negative and declined steadily for rural households. It is interesting that the elasticity's of foods of rural households became negative in the period 1985-89. One possible explanation is that Chinese peasants squeezed food consumption in order to make cash available for building new houses, acquiring consumer durable and purchasing services. The elasticity for clothing also declined and remained at a low level between 1985 and 1990. Elasticity's for housing and services rose significantly for both groups. For urban households the biggest jump is recorded for housing expenditure, whereas for rural households services displayed the largest increase. While elasticity's for daily goods and other consumer durable for rural households increased steadily and remained high, those for urban llOuseholds declined and became negative during 1985-90, indicating either that consumption of some basic durable goods had reached saturation point, or the diversion of expenditures for private housing construction and ownership.
B. The Changing Pattern of the Consumption There is a close association between rapid rising incomes and significant changes in consumption patterns. Rapid economic growth over the past two decades led to rapid increases in both urban and rural per capita incomes. Per capita food consumption soared, especially for meats (see Table 3: Per capita Food Consumption: 1978-1995). Growth in urban per capita incomes is
3 "The New Economics of Food," in I3usiness Week. May 20, 1996. p. 78.
3
especially important. Because the urban population, which is expected to increase from 19% in 1980 to 35% in the coming decade, consumes most foreign imported products. Rapid increases in incomes induced urban consumers to eat less food grains, such as corn and sorghum, and consume more meat, eggs, fruits, vegetables, and processed foods. By 1995, China's per capita consumption of red meat equaled that in Japan and Korea which had much higher living standards. Urban consumers have placed a high priority on the variety, quality and freshness of foods consumed.
Rising incomes in rural areas also induced changes in the patterns offood consumption, but only moderately. Rural per capita incomes rose from 191 in 1980 to 465 yuan in 1995 (in 1980 princes). In the past two 'decades, rural residents increased consumption of meat, vegetables and fruits and reduced consumption of corn, sorghum and sweet potatoes which is included as grain.
Since 1978 real per capita material consumption in China has risen at an average annual rate of 7% and more than double the living standard of the average citizen.4 The shares of most basic necessities such as food, clothing and fuel in total household expenditures were significantly. reduced, whereas those of mostly nonbasic goods rose.
Some argue that once an economy breaks through an annual per capita income barrier of roughly US$I,OOO, consumers move beyond buying staples and begin shopping for durables such as television sets, nonessential processed foods like ice cream, and packaged goods, including brand name vanities.
The quality of people's lives in China has improved further and more rapidly over the past five years thanks to the deepening reform and further opening policies. Rural and urban residents' actual income, consumption level and overall quality of life have improved remarkably, particularly in housing conditions. Coupons once used for the formerly limited supply of goods were eliminated in the five years following the 14th National Congress of the Communist Party of China in 1992. The marke,ts now have just about everything people would expect to find. At the same time, increases in actual income have been important in raising people's living standards. People now have more surplus money for durable consumer goods.
Durable consumer goods are rapidly-growing category of consumption, which refer to "new" consumer durables such as refrigerators, washing machines, air conditioners, vacuum cleaners and motor cars. During the Cultural Revolution the "three bigs" in Chinese consumption aspirations were a bicycle, a wristwatch and a manual sewing machine; however, by the early 1980s half of all Chinese households owned at least one of these former "three bigs", and by the mid-1980s a "new three bigs (a refrigerator, a washing machine, and a television set) had been developed. Meanwhile, a "new big six" that added cassette recorders, electric fans, and motorcycles and the "eight new things" that changed black-and-while television sets to color sets and added cameras and video recorders to the set of consumption aspirations.
4 Cheng, 1996, p. 95.
4
Durable consumer goods in urban and rura1 households rose year by year, as Table 4 shown. Color TV s for every 100 urban households increased from 17.2 sets in 1985 to 93.5 sets in 1996 while for every 100 rural households, it went up from 0.39 sets in 1980 to 16.9 sets in 1995.
In addition, people have more surplus money to build or purchase houses. In 1996, 1.1 billion square meters of housing were built in rura1 and urban areas. Per capita floor area in rural areas increased by 21.7 square meters, a rise of 3.9 square meters over 1990. Per capita floor area in cities increased to 8.4 square meters, up by 1.7 square meters over the same year. s
A study compared the Chinese consumption level and pattern during 1985-90 with that of Taiwan and Japan at a comparable state of development (Japan in 1955-60 and Taiwan in the late 1960s) in terms of nutritional standards, housing conditions and others. The result (see Table 5: International comparison) shows that the calorie, fat and oil daily intake was higher in China than in Japan in the 1950s; that per capita floor space, which rose sharply during 1978-90 from 8.11 to 17.8 sq.rn. for rural households, and from 3.6 sq.m. to 6.7 sq.m. for urban households. by 1990, average floor space for all households had reached 14.8 sq.m. which was considerably. higher than that of Japan in the late 1950s and eyen exceeded that of Taiwan in 1974.
Changes in the consumption pattern of rural and urban households during the past 10 years are presented in Table 2: Changes in Consumption Patterns). The data are based on the urban and rural household survey. The former covers non-agricultural households such as those of workers and other employees, and the latter coverS agricultural of peasant households. "Consumption" in the surveys includes not only commodities or services purchased but also those produced by households.
As Table 2 shows, the consumption pattern has changed markedly because of the rapid rise in the level of consumption. Between 1981 and 1990, the nominal share of basic necessities (such as staple food, clothing and fuel) in total expenditure declined for both groups of households, whereas that of non-basic items (non-staple foods. housing daily goods and others) as well as services, increased. For urban households, the nominal share of expenditure on staple food fell by almost half from 1981 to 1990. A similar pattern is also observable for rural households. The decline in expenditure for clothing for both groups was less dramatic during the same period. The share of fuel appears to have been fairly stable for both groups.
For rural households the nominal share of expenditure on non-staple food increased by more than 30 percent from 1981 to 1990. The rate of increase was more modest for urban households during the same period. This difference in the rate of increase appears to be related to income differential between the two groups. A similar pattern is discernible for service expenditure. Whereas the nominal share of service expenditure of rural households increased by 208 per cent between 1981 to 1990, it rose by only 39 per cent for urban households. This difference reflects the relatively high level of service consumption already enjoyed by urban households at the beginning of the reform period.
5 Ibid, p. 12 ..
5
Despite the shift in the pattern of consumption, the rank order of the major consumption categories in the urban household budget remained fairly stable during 1981-90. Food remained the largest expenditure item, absorbing just under half of the total real expenditure by 1990. The next major category is daily goods and other consumer durables, accounting for about onequarter. The third is clothing, taking up less than one-sixth, followed by services, housing and fuel. In future, with the abolition of state subsidies on many of these items and the deregulation ofthe housing market, their shares can be expected to increase substantially.
C. The Rt!asons Explaining the Changes of the Consumption Level and Pattern Economic refonn and open door policies are directly contributed to the changes in the consumption level and pattern.
1. Internal reason Economic refonn--rise of income level
Market mechanism has played a role in stimulating consumption goods supply. Before the refonn the ruuply of consumption goods depended largely on the behavior of the central planner. Since 1979, the economic reform has resulted in the decentralization of decision-making power in state-owned down stream sectors, and in the rapid development of non-state sectors. As a result, consumption goods supply has been increasingly responsive to consumption demand.
The government policy has changed from suppressing or constraining consumption to encouraging consumption (more).
2. External reason: GLOBALIZATION GLOBALIZATION refers to not ouly the international flow of trade and capital but also the international spread of cultures, values, ideas. In the China's case, a high integration with the world economy and international community by liberalizing foreign trade and stimulating exports has directly contributed to increasing income level, guiding consumer behavior, enhancing the consumption level and shifting the consumption pattern through imports and exports, promoting technology transfer and upgrading local production structure.
Emulation of consumption models aroused by GLOBALIZATION .. from imported goods.
II. GLOBALIZATION Affecting the Change of the Consumption
A. Opening Up to the Outside World In 1979, a policy of "Open Door" was formally adopted by the Chinese govemment. It
. recognized the critical importance of foreign capital and advanced technologies to Chinas' own drive for modernization. In Fall 1979, the Law of the People's Republic of China on Joint Ventures Using Chinese and Foreign Investment" was adopted, granting foreign investment a legal status in China. By 1980, four special economic zones (SEZs) had been established along the southeast coast--Shenzhen, Zhuhai, Xiamen, and Shantou. In 1984, the concept of SEZs was extended to another fourteen coastal cities and Hainan Island. In 1985, three "development
6
triangles" -- the Yangtze River delta, the Pearl River delta in guangdong, and the Min Nan region in Fujian--were also opened to foreign investors. In April 1988, Hainan Island became a province and China's fifth - and largest SEZ. In 1990, the concept of SEZs was extended to the Shanghai Pudong New Area. Most recently, the China's opening has expanded significantly, spreading from the coastal areas to the hinterland and extending from agriculture and processing to basic industries and infrastructure facilities as well as finance, insurance and commerce.
Opening up provides the critical inputs shaping China's economic evolution. Foreign trade and investment have played a crucial role in the growth of the Chinese economy.
1. The role of growing foreign trade. For three decades, China's economy basically kept its domestic orientation and developed in isolation from the international market. Up till 1978, total export/import trade volumes respectively accounted for about 2.00/0 of the total output value of the society, with limited favorable balance of trade in the majority of those years. Under the rigid management system subjected to mandatory plans, science and technology were divorced from production and enterprises lacked motivation for technical improvement, which explains the retarded technological advancement for a long time in the past.
The degree of interdependence between China's economy and the global economy has never been so great as it is today. Table? contains the growth index of the gross value of imports and exports, compared to the level of 1979 (1979=100), and the degree of openness of economy. The degree of openness of economy, which is calculated by trade against GOP, is strikingly rising from 11 % in 1978, 50 % in 1996,6 as Figure 2 indicates. While accomplishing this trade growth, China has also recently achieved the foreign exchange reserves about $100 billion, ranking the 2nd place in the world after Japan. Furthermore, China successfully implemented extensive exchange rate system reform at the beginning of 1994, when, the dual exchange rate system that had been effective since 1986, was unified on January 1 1994 at the rate of Y8. 7 per dollar. In addition, China has attracted tens of billions of dollars offoreign direct investment, and its actually used direct foreign investment totaled nearly US$200 billion, ranking the 2nd place in the world,7 merely after the USA for four consecutive years.
GOP growth stood at 11.6% during the period from 1993 to 1996, and it continued growing at 9.5% in early 1997.8 Foreign trade has become an important factor in boosting rapid economic development. The value of imports and exports increased from US$20.6 billion in 1978 to US$289 billion in 1996. In 1996, total trade value reached US$289.9 billion, a 110% rise over 1991 with the average annual increase rate standing at 16.4%. Imports amounted to US$138.8
6 These official figures probably onvcrstate the true magnitude of the rise of foreign trade, however, there is no doubt that china has achieved a high level of foreign trade for a country so large in terms of population and geographical area. For a further discussion of these issues, see Nicholas Lardy, Foreign Trade and Economic Reform in China, 1978-1990. Cambridge: Cambridge University Press, 1992.
7 Cui I3ian, "Opening Policy Builds Strong Momentum," Beijing Review, September 19-0ctober 5,1997, p. 15.
8 Beijing Review, September 19-0ctober 5,1997, p. 18.
7
billion, with average annual growth being 15.7%, and exports amounted to US$151.1 billion, with average annual growth being 16.9%, and a favorable trade balance standing at US$26.5 billion.9 The nation's rankitig in world trade rose from 32nd to 11th .
Growing foreign trade, especially imported western brands has played an active role in shifting the consumption pattern. Chinese consumers have a strong preference for famous foreign products such as Christian Dior cosmetics, Rado watches and gold jewelry, Unilever's Lux shampoo, Heinz infant cereal, Nestle powered milk, Toshiba refrigerators and Panasonic color TV sets and Pioneer stereo systems. Other popular Western brands for Chinese consumers today at least include Coca-Cola, which had sales of 2.2 billion cans in 1994, Kentucky Fried Chicken, Band-Aids by Johnson & Johnson, contact cold capsules by SmithKline Beecham, hair care products by Procter & Gamble, contact lenses by Bausch & Lomb, and Avon ladies, and etc.
10 etc ..
2. The role of FDI and joint venture· Most of the physical transfer of technology is through trade in goods and services, through the purchase and importation of equipment, designs, training services, technical materials, and other kinds of purchased information. FDI is more valuable for technology transfers than in its role as a funds provider. It provides both proprietary technologies .unavailable for purchase and transfers of managerial skills. Skills for management include not only those for production management, but business decision-making skills such as marketing and customer follow-up.
The use of foreign capital has rapidly grown. China has actually used US$204.3 billion over the past five years, or six times the total foreign capital used in the previous 13 years. FDI hit US$151.5 billion, with average annual growth reaching 57.1 %. The scale of foreign funded projects changed from small to large, the quality of the use of foreign capital has improved, and the structure of such capital has been further optimized. In addition china has signed contracts with 180 countries and regions, with the total value of the contracts amounting to US$41.32 billion and actual business volume reaching US$27.859 billion. There also has been a substantial increase in the nation's foreign exchange reserves, reaching US$ 105 billion at the end of 1996, or five times that in late 1991. 11
There are disagreements about the role and impact of foreign capital in developing countries. Some argue that foreign capital inflows can help accelerate. the developmental process by improving efficiency and by raising the real rate of economic growth while others contend that foreign capital inflows almost invariably are detrimental to development countries by substituting for, rather than supplementing, domestic savings.
In China's case, there is a positive relationship between foreign direct investment and economic growth. A study suggests that a I % increase in For a year ago is associated with a 0.635%
9 Ibid.
10 Chen, pp. 95.96.
11 Ibid. p. 14·15.
8
increase in GDP in the current year.12 The impactofFDI on GNP can be further demonstrated by examining the situations of the two shorthorn coastal provinces where more than 50% of total FDI have been committed. During the 1980s, Guangdong's output grew at an average rate of 135 a year. The growth of output in Shenzhen, one of China's first four SEZs, has been astonishing, averaging 47% a year during the 1980s. In 1990, Guangdong's GDP has been estimated to be $78 billion, accounting for almost 20% of China's GDP. FDI has been the driving force behind the rapid growth in Fujian, ..
The contribution ofFDI to the expansion of China's foreign trade has also been growing very rapidly, as indicated by the data presented in Table: China's export and foreign capital ventures (P699). FDI's share of Chinas' total export soared from a negligible 0.3% in 1984 to more than 5% in 1988 to 12% in 1990,20% in 1992, and 39%? In 1995.
Joint ventures and wholly foreign-owned subsidiaries became increasingly important. The former share of China's total pledged FDI rose from a mere $14 million in 1979 to more than $2 billion in 1985, to $2.7 billion in 1990.? The latter's share grew from $20 million in 1980 to $1.6 billion in 1989, and to $2.4 billion by 1990. The growing foreign-funded enterprises is an example. Now there are more than 290,000 approved foreign funded firms. Their total employees number more than 17 million, their tax payments account for more than 1I10th of total industrial and commercial tax revenues, and their export value amounts to around 40% of the nations' total. 13
Table? shows the geographical distribution ofFDI in China over the period of I 979-96? It reveals the fact that FDI in China was concentrated mainly in the coastal provinces, and particularly in the two southern ones--Guangdong and Fujian. Guangdong province alone accounted for more than $9.1 billion -51.8%-- of the total FDI pledged during 1979-87, while the inland provinces' combined total was only $2 billion - a mere 11.3%. In 1990, the two southern coastal provinces'share declined to about 50% of total (actual) FDI (from more than 56.4% of the cumulative total for 1979-87). The share of the inland provinces rose from 11.3% of the cumulative total for 1979-87 to 17.7% of China's total FDI in 1990. FDI in the three major industrial cities - Beijing, Shanghai, and Tianjin -declined from 21 % of the cumulative total for 1979-87 to about 14% of the total in 1990.
Permitting FDI and successful joint ventures force the domestic manufacturers to compete globally by upgrading local production structure, improving management, increasing variety, raising quality, lowering production costs .and achieving better economic results. Electronic industry is such a good example.
More important, FDI also contributes to progressively made the factory managers and government officials develop and adopt the rules and laws of a market economy.
12 Chen Chung, Lawrence Chang and Yimin Zhang, "The Role of Foreign Direct Investment in China's Post~1978 Economic Development," World Development, 1995 Vol. 23, No.4, p.697.
13 Cui Bian."Opcning Policy Builds Strong Momentum." Beijing Review. September 19·0ctober 5. 1997. p. 15.
9
B. The growth of advertising business Globalization has not only contributed the increase offoreign trade, FDI, but also contributed to the spread of cultures, values and ideas. Advertising is one of methods to facilitate the spread of cultures, values, ideas, or universal lifestyle. "The governing ideas and guiding principles for thought and action through advertising messages are regarded as powerful forces shaping consumers' motivations, life-styles, and product choices" (Srikandath, 1991; and Tse et al., 1989).
1. New pattern of advertisement
2. Increasing advertising business volume During the Cultural Revolution all advertisements disappeared from newspapers; all shop windows were pasted with "big character posters." There were only political slogans on billboards. All advertising agencies were reduced to producing political posters and finally closed. State ideology played a dominant role in eliminating advertisements. Judged by the party's policy, advertising was treated as a "capitalist tool," a "societal waste," "not adding any value to commodities."
Since the late 1970s, advertising in China has been marked by a dramatic revival, coupled with the open door policy and economic reform. Advertising has been seen as a "means of promoting trade, earning foreign exchange, and broadening the masses' horizons," and it was officially called "an accelerator for the economic development in China." This viewpoint reflected a real breakthrough in the party ideology in the beginning year ofthe reform. Eventually, the first foreign advertisement that appeared in China after the Cultural Revolution was an advertisement for the Swiss-made Rado watch on Wenhui Daily on the March IS, 1979.14
Since then, advertising in China has experienced consistently rapid growth .. The annual business volumes rose at an average rate of over 40% between 1981 and 1992, far faster than the increase in the GNP of the country. Table China's Advertising Industry Growth: 1981-1992 highlights the growth of China's advertising sector during these years. In 1986, the business ~olume of Chinese advertising only ranked 34th in the world, but in 1993 it had climbed to the 15th
. That year was named the "Advertising Year of China" because of the unprecedented growth of the advertising industry. In that year, China's advertising's turnover soared to 13.4 billion yuan (about US$ 1.9 billion), a rise of 43% over the 1992. Another source said that from 1992 to 1995, China's advertising market quadrupled to US$3 billion. At the same time, the number of advertising units reached 31,770, which was almost double that of 1992, and advertising employees totaled 310,638, a 66% increased compared to 1992. The fast growth of the Chinese advertising market is expected to soar to US$22 billion by the year 2000. 15 In 1995, in addition
14 Cheng Hong. 1996. "Advertising inChina: A social it Experiment." Avertising in Asia: Communication, Culture and Consumption. Edited by Katherine toland Frith. Ames: Iowa State University Press. p. 78.
15 Xu, Baiyi." 1996. Markting To China: One Billion New Cuslomers. Lincolnwood: NTC Busioess Books. p. 393.
10
to 43,000 Chinese advertising agencies there were also 167 foreign joint ventures with local partners.
Foreign advertising agencies are growing business. In 1986 and 1992, foreign advertising accounted for US$15 million and US$75 million respectively-about 6% of China's total advertising spending in those two years. In 1993, foreign advertising business volume reached US$133 million, taking up 7% of the national turnover. The billings of foreign advertising were mainly generated by a dozen transitional agencies and thirty-odd Hong Kong-based companies. The leading foreign agencies operating in China from 1992 through 1993 are listed in Table Top Foreign Advertising Agencies in China
The world's major advertising agencies rushed into the Chinese market during the last 15 years and are now recording annual billing growth of up to 400%. Dentsu, Young & Rubicam was the rust transitional advertising agency starting offices in Beijing and Shanghai soon after advertising was resumed in 1979. Leo Burnett has made the development of China "the highest priority of any new market in the world". In 1993, Saatchi & Saatchi turned out to the most . successful foreign advertising agency in the Chinese market. Many of the agencies prefer to go into joint ventureship, which has become a popular way to enter the Chinese market. By 1993, 79 advertising ventures had been set up in 16 provinces and municipalities in China, with 31 of them located in Beijing, II in Shanghai, 9 in Jiangsu Province, and 6 in Guangdong Province.16
C. The Changing Nature of Advertising
1. Changing social values (rhe mixture of Eastern and Western cultural values.) Through advertising, globalization created a great opportunity for western culture, ideology and western living styles to enter China. Western values such as materialism, individualism, modernity and worship of money have greatly affected the common Chinese. As the result of globalization, the nature of advertisement has been changed from the monopolistic dominance with state ideology to a large-scale experiment with Westem "capitalist" commercial practices in the fastest-growing market in the world. 17
By analyzing a total of572 Chinese magazine advertisements from 1982 and I 992,.a study identified "modernity," "technology," and "quality" as three predominant cultural values manifest in Chinese advertising over those 10 years, which reflected Western culture. 18
Modernity, which means the notion of being new, contemporary, up-to-date, and ahead of time is emphasized in a commercial. In contemporary China, modernity's simply specified as the ongoing "Four Modernization's" program started in the late 1970s. From then on, China's
16 Ibid. pp. 83-84.
17 Cheng, Hong and John C. Scheitzer. 1996. "Cultural Values Reflected in Chinese and U.S. Television Commercials." in Journal of Advertising Research, May/June 1996, p. 27.
18 Cheng anq Schweizer, 1996. "Cultural Values Reflected in.Chinese and U.S. Television Commercials." Journal of Advertising Research, May/June 1996. p. 28.
II

primary national goal has been to achieve the basic modernization of industry, agriculture, science, and technology, and national defense by the tum of the century. So, modernity in today's Chinese culture stands for a strong national tendency to adopt management and marketing skills as well as advanced science and technology from industrialized countries. In fact, modernity has provided great momentum for Chinese advertising's revival in the late 1970s and unprecedented growth since then.
It is evident that the most dominant values in Chinese television commercialsl9 are "modernity" (32.3%), "youth" (7.5%), "family" (6.9%), "technology" (6.7%), and "tradition" (5.3%).20 "Modernity" is used most frequently for "automobile" (63.2%), "Industrial products" (44.4%), "clothing" (42.9%), and "household appliances" (42.2%); while the value "tradition" is mainly used for "food and drink" (12.2%) and "medicine" (102.%). Some typical Western cultural values such as "individualism," "modernity," and "sex," portrayed in Chinese television commercials, were most frequently used with imported products, followed by joint-venture products.
The reasons for the predominance of "modernity" in Chinese advertising are more complicated and are both internal and external. Internally, modernization is an overwhelming national theme currently promoted by Chinese leadership. So, those advertising campaigns having "modernity" as the dominant value are in accord with govemment policy. Therefore, it is easy for them to win approval of the Administration for Industry and Commerce which supervises advertising business in China at both national and local levels.
The most important point is that to Chinese leadership, modernization does not mean Westernization. Chinese leadership has always tried to draw a line between the two notions, with a clear preference for modernization without Westemization. This policy has a great impact on China's advertising regulations. As a result, those cultural values promoting Western lifestyles are, on the whole, infrequent in Chinese television commercials. This list of "disfavored" values includes "adventure" (0.2%), "competition" (2.6%), "enjoyment' (2.0%), "individualism" (4.5%), "leisure" (2.2%), and "sex" (1.4%)21 .
The external reason for the predominance of "modernity" in Chinese television commercials is the influence from the transitional advertising agencies which mainly run the campaigns for imported and joint-venture products in the Chinese market. The value "modernity" in Chinese television commercials is most frequently used for imported products and secondly for jointventure products. Transitional advertising is exerting a considerably strong influence on Chinese television commercials and is the pace-setter for Western cultural values portrayed in China's d
.. 22 a vertlsmg.
19 Television was the second largest advertising medium in China.
20 Cheng and Schweizer, p. 34.
21 Cheng and Schweizer, p. 40.
22 Cheng and Schweizer, pp. 40-42.
12
2. Diminishing role of the state ideology in guiding advertising to determine consnmption Although Chinese state ideology still has important impact on the social (or cultural) values carried in advertising messages, advertising becomes much less ideology-oriented when compared with the early years of the 1980s. Most advertisements in China still need governmental sanctions. Although the requirement that all advertisements in China must be sanctioned by the Administration for Industry and Commerce at the nation or local level was abolished in a few selected cities in 1993, advertising content still requires approval for certain product categories, which include household appliances, drugs, foodstuffs, alcoholic beverages and cosmetics. As consumer products make up the lion's share of the products advertised in . China, censorship of advertisements for consumer products virtually means censorship of most advertising content in the country (Cheng, p. 28).
For Chinese leadership, modernization does not mean Westernization. Since the inception of the "Four Modernization's" program, Chinese leadership has tried to draw a line between modernization and Westernization with a strong preference for modernization without Westernization. While the nationwide adoption of advanced technology and management skills from industrialized countries is regarded as a major step to achieving the FourModernization's, Western lifestyles and political systems are either discouraged or prohibited. This demarcation line is also clearly drawn in China's advertising regulations. For example, in the Regulations for Advertising Management that were released in 1987 and still in effect when the data for this study were collected, it was clearly stated that advertising in China should be used for "the promotion of socialist construction" (Xu, 1990), and an advertisement "shall not be released of it is reactionary, obscene, superstitious, or absurd in content" (Xu, 1990).
In addition to the "Four Modernization's," modernity stands for "building socialism with Chinese characteristics" (Beij ing Review, 1987). The most important of those "Chinese characteristics" is what is currently called "a socialist market economy" (China Daily, 1993), which combines central planning and market mechanisms.
The highest administrative body in charge of advertising in China is the SAIC, which is authorized by the State Council to supervise and provide guidance to all advertising agencies, advertising media, and advertisers in China. While implementing the general regulations for advertising promulgated by the State Council, the Advertising Office of the SAlC drafts detailed rules governing advertising in China. It inspects and registers units engaged in advertising business; issues advertising business licenses; examines and supervises advertising activities; solves disputes in advertising business; encourages the disclosure of deception and other illegal behavior in advertising; and gives guidance to advertising associations.
The first national regulation for advertising was the interim Regulations for Advertising Management, promulgated by the State Council in February 1982. In December 1987, the Regulations for Advertising Management superseded the Interim Regulations. The 1982 regulations set a strong ideological tone in the statement of purpose, stressing that the establishment of an effective control over the advertising was to ensure that advertising "effectively serve the needs of socialist construction and promote socialist moral standards;"
13
while the 1987 regulations were less ideological .. In the 1982 regulations all of the five items contained in a list of forbidden advertising content in Article 8 were ideology oriented while in the 1987 regulations, which had six such items, however, the number of ideology -oriented rUles dropped to three. The two items not mentioned in the new regulations were "libelous propaganda" and "state secrets." This change was in line with the social trend in the post-Mao China--the ideological and political coloring has, on the whole, faded away little by little, while economic development has become a dominant national theme. On October 27,1994, the Advertising Law of People's Republic of China, the first of its kind in China's history, was passed by the People's National Congress. The new law is much less ideology oriented when compared with the 1987 regulations. Although the word "socialism" is used twice in the new law, those more aggressive political terms such as "the dignity of the Chinese nation," and "reactionary," which were still used in the 1987 regulations do not occur in the new law.
3. Consumer rights movement The consumer movement started with (see Advertising in Malaysia, p. 14) The Xinle County Consumer's Association in Hebei province was founded in May of 1983, the first organization to protect the interests of consumer. The Guangzhou Consumer's Committee, the first semi-official city consumers organization, was established on September of 1984.23 The Consumers' Committee run by the students' Union ofShenzhen University, in the filed of consumer protection is a popular organization.
The China Consumer's Association (CCA) is an official social organization, founded in December 1984 to protect the interests of consumers. It deals with consumer complaints, requests compensation for faulty goods, carries out research on consumption and consumer issues, and advises government authorities on consumer protection legislation. Its board was made up of representatives from government departments and news agencies; there were no consumer representatives on the board. The Association relied mainly on subsidies and contributions from government for its income, though it had received some money from international organization such as UNDP and the International consumers' Alliance, of which it is a member.
24 There are the sharp increase in the number of complaint letters on deceptive
advertisements the CCA received in the late 1980s and the early 1990s. From 1987 through 1988, the CCA received about 1,000 such letters. However, the number in only the.first half of 1990 jumped to 6,162?5
III. The Impacts of Changing Consumption on Human Development
A. Positive impacts
23 Wu, Shaozhong, Lin Daidai and Yi Ran. 1990. Zhongguo Xiaofci Yanjiu (China's Consumption). Shanghai: Xinhua Press. pp. 262·268.
24 White. Gordon, Jude Howell, and Shang XiaoYuall. 1996. In Search ofCi,-ii Society: Market Refonn and Social Change in Contemporary China. Oxford: Clarendon Press. P. Ill.
25 Cheng Hong, 1996, p 92.
14
1. Upgrading local prodnction structure From 1953 to 1978, China's industrial structure was marked by the gigantic heavy industry and the dwindling light industry, a heavy accumulation and suppressed consumption. The constrained consumption demand and inaction of market mechanisms prevented the stateplanned resource flow into the heavy industry from trickling down to the light industry and other industries. During this period, China's national income increased by 5.1 times, but accumulation increased by 6.4 times. Out of the national income, nearly one third was set aside for accumulation, and in the total capital construction investment of state-owned enterprises, 90% went to the heavy industry. While the total output value of the whole society increased by 7.25 times, that of the heavy industry recorded an increase of 27.8 times.
Such a situation in the industrialization process was accompanied by a painfully slow increase of the people's income and consumption. From 1953 to 1978, the income of the urban and rural population increased by 4.2 times, lower than the increase rate of the national income (5.1 times). Therefore, consumption demand in the market had little effect on the economic growth and the economic sectors directly related to daily consumption needs developed very slowly. From 1953 to 1978, the share of consumption in the national income increased only 3,96 times, the output values of agriculture, light-industry and commerce increased 3A, 9.71 and 3.87 times
. I 26 respectIve y.
Since 1978, light industries, textile industries and other businesses producing the daily necessities of people have increased their investments, the production capacities for many consumer products in short supply have been rapidly expanded, and their increased output has eased the urgent demand in the market. Consequently, purchase coupons have been gradually abolished and the variety of commodities has been increased.
The remarkable increase in the cash income of peasants and the wage increase for the urban employees have strengthened market demand. Between 1978-85, the social purchasing power for commodities grew by 17.24% annually, almost tripling the annual growth rate of 6.3 I % for the period between 1953-77. This undoubtedly has exerted a strong pull at market supply. Correlative analysis also indicates that the growth rate of the output value of light industries has changed from past non-correlative to highly correlative (r=0.8496) with the growth rate of society's cash income of the proceeding year. The rapid growth in the production of consumer goods has caused its weight in the national economy to increase.
Between 1979 and 1985, the output value of the light industry had increased 12.6% annually, but that of the heavy industry increased only by 8. I %. This reversed trend has marked up by the higher proportion of the output value of the light industry in the total industrial output value, which increased from 43.1% in 1978 to 46.7% in 1985 (The figure of 1981 reached 51.5%, with a slight decline in 1982-84 period).
26 Economic .System Reform Institute of China State Commission for Restructuring Economic Systems, "Industrial Growth and Structural Contradictions." pp. 5-20.
15
For the traditional durable goods such as sewing machines, watches, bicycles that began their popularity in the 60s and had a slow growth in 70s, mainly due to supply restrictions, their growth in this period also shows the "consumption-hungry demand" characteristics.
When the consumption hunger has been satisfied to some extent, the increase in the consumption of basic and traditional durable consumer goods will inevitably slow down, and its share in the income increment will being to diminish. Especially with the accelerated income increase of the urban population and the emulation of consumption models aroused by the open-door policy, the demand for modem durable consumer goods represented by home electric appliances has been rapidly increasing
According to a family survey, the absolute sum the urban dwellers spent on tr:tditional durables began to decline. In 1985, they spent 9.24% less on such durables than 1981. Whereas, they spent 1.7 times more on newly emerging durables, the increased proportion amounted to 18.48% of the income increment, with a elasticity coefficient of3.38.
The demand for new durables has been growing at an unprecedented pace. In the period between 1953 and 1976, the sales volume of sewing machines, bicycles and watches recorded an average annual increase of about 15%. But between 1983 and 1985, the average annual increase rates of washing machines, tape-recorders, TV sets and refrigerators were respectively 63%, 73%, 42%, and 180%. But to the product up-grading (e.g. from single-tub washing machines to double-tub ones, and then to automatic washing machines; from back-white TV to color TV, and from single-door refrigerators to double-door refrigerators ... ), the increase rate of retail value is way higher than that of the retail volume.
The strong wind of emulating consumption models has made the new durables popularize much faster than the income has increased. Between 1981 to 1985, the per capita income ofthe urban population increased by 50.36%, but the popularization rate of washing machines, refrigerators and color TV sets has risen by 8 to 40 times.
As can be seen from a comparison between new durables made by the low-income grouped in 1985 and that made by the high-income group in 1981, the purchases made by the high-income group have been emulated by the low-income group to such an extent that before their income reached the 1981 level of the high-income group, that had far outdone the latter in terms of purchasing durable consumer goods.
The newly emerging durable consumer goods have ushered in a more advanced stage of consumption, marking a higher consumption leveL The reason for the consumption expansion and upgrading by groups can be traced mainly to the consumption motives of government bodies and public as well as business units. With the advantages of "eating from the same big pot" still available, the more autonomy they enjoy, the greater their impulse for consumption. .
Pushed by the new upsurge of consumption demand, the industrial sectors directly interfaced with the urge for upgrading consumer goods achieved a development pace that was much faster than that of the entire industry during the Six Five-Year-Plan period. Compared with 1980,
16
30.8% of the total industrial output value increment in 1985 came from the big new consumer goods producing units, whose proportion in the total industrial output value increased from 18.8% in 1980 to 23.5% in 1985, whereas, the proportion of the big traditional consumer goods producing units in the total industrial output value declined from 28.2% in 1980 to 26.1 % in 1985.
The electronic industry is representative of the group of "new" (consumer durables) industries which formed the major impetus behind the spectacular growth of economy over the past 16 years. Between 1980 and 1994, the industry registered an average growth rate of23% per annum, far faster than the rate of 13% of all industries?7 Out of the industry, the consumer electronic sector is representative of modem mass production and consumption industries, while semiconductors, computer and telecommunication sectors have pervasive effects on the technical change of a wide range of industries.
The rapid growth of the electronically industry has been made possible by both technology imports and the expansion of domestic consumption demand. Indeed, starting from almost nowhere in 1978, China became the world' largest TV receivers manufacturer by the mid-1980s, accounting for 23% of world total output volume in 1988. However, low concentration ratio, small economic scale and fragmentation of the industrial structure were significantly shortcomings in the mid-1980s.
Initially, the development of consumer durable industries relied on an uncoordinated import of technologies and conversion of existing production facilities to consumer durable production. This resulted in a pattern of excess dispersion of production and uneconomical small scale. By 1984, among the 29 provincial-level administrative areas, 27 of them produced TV sets, 28 of them produced washing machines and 19 produced refrigerators. Only 4 provinces' production capacities of washing machines have surpassed 500,000 units, but as many as 15 provinces are each producing less than 100,000 units. There were 130 washing machines factories (the number of such factories reached at the highest 300), and in 1985 after some stream-lining, 80 factories with an annual output of more than 10,000 units still remained, out of which only 14 reached the minimal rational scale (an annual output of200,000), and 100 factories produced a yearly aggregate of merely 4.5 million units. In comparison, Japan produced 5.28 million washing machines in 1984, and there are only 15 producers that run the complete production processes?8
Within a few years around 110 production lines were imported and installed in almost same number of enterprises. None of them reached the minimum efficient scales by world standard. With most 0 the production lines imported in the form of turnkey pants and virtually all the
27 This rate is comparable to those of the electronics industires of Japan, South Korea and Taiwan in their respective take-ofr periods. See Die Lo_ Market and instituliona/ Regulation ill Chinese illduslriali::ation, 1978-94, London and New York: St. Martin's Press, Inc., 1996, p. 152.
28 Arnei Zhang, "The Structural Contradictions & the Obstacles to Technology Transformation," Economic Development & System Reform, No.4, 1987; also sec Economic System Reform Institute of China, China: Development and Reform 1986, 1986, p. 38 I; World ·Bank, China: Macroeconomic Stability and Industrial Growth lIndrr Decentralized Socialjam, 1990, p. 153.
17
established brand names of the industrialized world, the industry became heavily dependent on imported components.
The persistence of consumption booms provided a precondition for the rapid expansion of the . dustry 29 III .
The changes in consumption demand is of vital importance to the growth of the market-oriented economy, and the rise of consumption standard and the shift in the consumption structure will undoubtedly be the primary driving force in the upgrading process of the industrial structure. The industries adapted to newly emerging demand are generally marked by their in-depth processing and technology-intecensiveness. How the "pull of demand" will influence the industrial structure of our country has become a practical problem of great importance in the process of our economic development. Further analysis is needed on how the new-demandinduced industrial restructuring actually takes place and hot it affects the interface with other industries. These questions are vital to the successful upgrading of the industrial structure.
Changes in consumption demand have brought about an increase in the direct imports of consumer goods, and also fostered the development of new consumer goods producing businesses. But the prosperity of such businesses has brought in its train the dependence on foreign imports. Since 1978, the correlation between China's economy growth and imports has strengthened, as is shown by the dependence indices calculations (imports increase/national income increment). Import dependence indices rose fonn 3.10 in 1982 to 53.46 in 198530
The rise of imports dependence indices is, at the same time, closely related to the growth rate of the national economy. The years of higher economic growth have coincided with years of higher import dependency, i.e. in the periods of accelerated growth, the import increases have exceeded the increases of the industrial output values.
Highly demanded consumer durables has created the conditions for rapid development of consumer durable industries. In the past, such production was discouraged; because such goods were considered "luxuries" and subjected to discriminatory policies as well as high taxes. Such policies effectively stifle industries that require large production runs to be cost effective. Since 1978, policy has shifted to encourage the production of such items, and output has grown very rapidly: the creation of entire new industries has. been one of the most impressive accomplishments of the past several years, and the diffusion of consumer durables among the urban population has occurred with unprecedented speed. By 1986, production of consumer durables (excluding vehicles) accounted for 4.4% of total industrial output, and 19.5% of machinery outputvalue nationwide.
29 For a good discription, see La's book, Chapter 6, "The Electronics Industry: State Industrial Policy and Development," Market and institu.tional Regulation in Chinese industrialization, 1978-94, pp. 147-171.
30 Tigaisuo, p. 20.
18
The government intervened the reshaping of the industry by adopting a series of measures as follows: the first concerns rationalization, including the measures to promote agglomeration and restricting new entrants; the second is on assimilating and improving upon imported technology. One prominent measure is the State-enforced unified negotiation with transitional corporations for technology transfer; and the third area of intervention involves state-initiated developments of particular projects and technologies.
In response to the government policy, domestic consumption boom is cooling down and competition is tending to become acute, local authorities and enterprises have exhibited motivations for technical upgrading and exports. The reform of company organization and the broader institutional framework has also proved to be helpful in this regard. As a result, there has been important achievements in terms of indigenizing imported technology and expanding exports. By late 1990, the industry had been transformed from an assembler of imported semi-or completely-knocked down kits just a few years ago to one capable of using computer-aided design and manufacturing technology in product and process development and turning out products with more than 95% local contents. In addition, the wave of mergers and agglomerations in 1989-92, which was mainly aimed at enhancing enterprise competitiveness. In 1994, there were five Chinese color TV manufacturers with individual output column exceeding one million sets per annum, of which the biggest produced almost two million. By the early 1990s, there have been a number of positive developments of which exports expansion is the most significant. In 1990, China exported US$ 3.8 billion of electronics goods, a 15-times increase over the value ofUS$0.2 billion in 1985. Some of them are technologically sophisticated products, which indicates the standard the domestic production capability has obtained. Before 1987, China's color TV exports had never exceeded the value ofUS$1 00 million; while in 1990, it exported 2.6 million sets with value ofUS$405 million. In 1993, China exported 9.4 million television sets, of which 3.7 million were color. These represent 31 % and 26% of domestic output volumes respectively in that year.31 In view of the rigidity of the Chinese industrial system in general, and the serious fragmentation of the color TV industry just a few years gao in particular, this is a tremendous achievement
After 1984, the declining concentration ratios of new electrical and electronic consumer goods have been reversed. The number of producers of both washing machines and refrig~rator reduced to 80 in 1985. The electronic consumer durable industry in China began to show the effects of competition between producers in different regions through reducing cost, cutting price, merges and acquisitions. China's technology import policy has also shifted to stress coordinated import of a few large-scale production technologies in this field. In 1986, China offered foreign corporations the opportunity to bid for a contract to construct four large-scale color television tube factories, while trying to obtain at the same time full access to the technology and designs involved. In 1990, China television capacity reached over 30 million, ranking the first place in the world32
31 Lo. p. 157.
32 Wang Xiaoqiang, "On 30 million Television Production Capacity." Fllture alld Choice, 1997, No. 97-9, pp. 8-9 ..
19
2. Creating job opportunities consumption-related jobs: imports and exports, services, advertising, consumer goods manufacturer.
B. Negative impacts The impact of the GLOBALIZATION on the needs and aspirations of poor people or people in poor areas is not always encouraging. People in coastal areas enjoy advantage in higher integration with the world economy, while inland provinces have less at stake in GLOBALIZATION. Progress toward increasing consumption, shifting consumption patterns, eliminating poverty and other forms ofinequaIity, enforing all people participation in their decision-making process has been slow.
1. Worsening regional disparity The most striking aspect of GLOBALIZATION is the great differences between the coastal and inland provinces. Two important dimensions of GLOBALIZATION involve regional disparities and income inequality.
In the early 1980s, China's different regions shared the rapid growth in terms of consumption. But after the mid-1980s, regional disparity has become wider than before 1980. One study indicates that relative regional disparity coefficient declined from 32.8 to 28.7 between the late 1970s and the early 1980s, while it increased from 28.8 in 1985 to 33.6 in 199233
. Regional disparities have worsened between coastal interior regions since 1984-85. Easy coastal access to world markets has resulted in a strong concentration of external investment and trade-related activities in coastal provinces. Rapid job growth at relatively attractive wages is drawing migrants from the interior regions to coastal cities.
For most of the inland provinces trade is still peripheral to their economic development. Export in inland province only accounts for around 1% of the national total, and as low as?% of GNP. All top ten provinces in exports in 1990 are from the coastal region. About. 22%?? of the total national export was conducted by Guandong, the leading province in trade .. Liaoning and Shanghai account for 11 % respectively. All in all, for coastal provinces, trade has become central for economic growth, and these provinces are the primary participants and beneficiaries of globalization. The importance of foreign trade to coastal provinces has permeated even the rural areas which used to be the most autarkic. The rural town and village enterprises are noteworthy examples. They abandoned the old 'self-production and self-consumption' economic model and incorporated themselves into the export-oriented economy. Exports from town and village enterprises increased rapidly from about 4 billion dollars in 1985 to more than 12 billion dollars in 1991, accounting for more than 20% of total national exports. These export-oriented town and village enterprises are mostly located in the coastal provinces34
33 Sec Hu Angang and Wang Shaoguang, "Changes in China's Regional Disparities," a paper prepared for The Washington Center for China Studies, Inc., Vol. 6, No.9, September 1996. p. 29.
34 Nicholas R. Lardy, "Chinese Foreign Trade," China Quarterly, No. 131 (September 1992), p. 710.
20
There are significant differences between these poor provinces and rich coastal provinces in both consumption level and consumption patterns. Table regional Differences in Consumption: 1995 shows regional disparity of urban-rural consumption gap in terms ofliving expenditures, including food, clothing, residence. It suggests that the poor the provinces, the wider the urbanrural gap. For example, while the urban-rural ratio in teons of living expenditures for the coastal areas is around 2.4 in 1995, the ratio for the western areas is above 3.0. In terms of clothing expenditure, the urban-rural ratio for the coastal areas is around 4.0, while it is over 6.0 for the western areas.
The poorest areas--the western provinces are also characterized by highest adult illiteracy rate--22%, while this figure in the coastal provinces was 13%. It also has 62% of people without access to safe water while there is only 22% in the coastal areas.
These inherent disparities are compounded by national pricing and taxation policies that in the 1980s have been much heavier on the inland provinces. In some areas, the rich are getting richer but the poor are getting richer also, though not necessarily as fast. To take an extreme example, the agricultural production per capita of the minority areas ofGuizhou province was 25.7% of the national average and 52.4% of the provincial average in 1985; by 1988 it had sunk to 17.3% of the national average and 41.2% of the provincial figure35
The Ninth Five-Year Plan apparently has a host of programs intended to address the issues of regional disparities and resulting migration. These include inducements to encourage infrastructure and FDI investment in "interior deltas" along major river systems and a strategy of new town construction to encourage migrants to settle outside already existing major metropolitan areas.
2. Consumption gap between the rich and the poor Urban-rural disparity. Both rural and urban areas enjoyed fast economic growth between 1978 and 1985. As a result, income disparity between two areas declined and the ratio of urban to rural income reduced from 2.4 to 1.7. After 1985, the ratio started to rise. In 1994, the income of urban residents was 2.6 times that of the peasants, which presents the widest gap after 1978. If the various types of subsidies that urban residents enjoy are included, and if all k.inds of extra responsibilities and burdens from the peasant incomes such as expenses and fees for subsidizing the members of families of the People's Liberation Anny and revolutionary martyrs, subsidizing for cadres, and for planned childbirth and etc., are deducted, the urban-rural consumption gap could be expressed as a ratio of 4 to 1.36
In the early year of refonn, rural incomes grew faster than urban, reducing the substantial urbanrural gap in consumption per capita from 2.8:1 in 1980 to 2.3:1; however, the growth in rural
3S Brantly Womack and Guangzhi Zhao, "The Many Worlds of China's Pro\ inces: Foreign Trade and Diversification," China Deconstructs: Politics. Trade and Regionalism. Edited by David S.G. Goodman and Gerald Segal. London and New York: Routledge, p. 171.
36 Zhu Qing(ang, "The Urban-Rural Gap and Social Problems in the Countryside," Chinese Law and Government, Jan-Fcb. 1995, Vol. 28;Nu. I, pp. 81-82.
21
incomes slowed considerably while urban incomes forged ahead, and the gap widened again to 3.6:1 in 1994 (update).
The consumption gap between urban and rural areas can also be seen from the Table? Durable goods. This table suggests: (1), the consumption gap of urban-rural in terms of durable goods is narrowing; and (2) there are still a huge differences in durable goods consumption between urban rural areas. Black and while TV sets is exceptional. For every 100 urban households, about 90 of them possess washing machines and color TV sets, and about two-third of them own refrigerators, while only 5, 17, and 13 out of 100 rural household own these durable goods, respectively.
The increasing unevenness of health care is also suggested by Table? Medical Facilities and Personnel,: 1970-1994, whiet, shows the increase in numbers of doctors and hospital beds from 1970 to 1994 by urban or rural areas. Since 1980, the number of hospital beds in the towns and cities has more than doubled, but in rural areas is has declined by 7%. Similarly, the number of doctors more than double in urban areas but increased by only 17% in the countryside. In both cases, the urban-rural ratios moved sharply against the rural population.
In addition, between one-quarter to one-third of the rural population have critical water supply needs--Proper sanitation, furthermore, is almost totally lacking in rural areas. The percentage of urban population without access to sanitation between 1990-96 was 26% while this figure was 93% in rural areas during the same period.37
Consumption gap within urban areas. The external challenge to the income inequality can be shown as follows: outsiders resident on the mainland and Chinese employees of foreign organizations create a tension for higher urban incomes across the board, ever more luxurious lifestyles of outsiders, and those with economic ties to outsiders could cause relative urban . . f: 38 mcomes to flse even aster.
3. Negative correlation between economic growth and educational advancement Inequalities in education and health care remain large. Provinces with lower per capita incomes and a higher proportion of minorities tend to have weaker social indicators. For instance, functional illiteracy rates in the Western areas are twice those in the coastal areas. The divergence in school attendance among the regions would predict a persistence in these patterns.
One study suggests that the educational level in the whole of China, after a decade, has increased only a little. In 1982, only Beijing and Shanghai had reached an average of 9 years of education, Tainjin 8.5, and three others had reached more than 7.9, while the rest were all below 7.9 years. By 1990, only two provinces had gone beyond the nine-year mark, 12 provinces had reached eight years of education, and 15 provinces had remained below the eight-year mark. Although
37 UNICEF (United Nations Children's Fund), The State of the World's Child/"t'n 1997, Table 3, p. 84.
38 Albert Ke~dcl Ill, "Domestic Impact of China's External Economic Tics:' in PRe Tomorrow: Development Under the Ninth Five-Year Plan. Kaohsiung: National Sun Yat-Scn University. p. n l.
22
these figures suggest somewhat improvement in most provinces, 93% of the provinces still had an average educational standard that fell below the nine-year compulsory standard.39 At the provincial level, while the disparity in the absolute standard of education is small, the variation in the degree of improvement is relatively large. What is more, the empirical results also indicate that there is a negative correlation between socioeconomic development and educational advancement. Provinces that have experienced the largest degree of advancement in educational standard are mostly located in the central and western regions, i.e., the more remote and border regions where economies are less developed. On the other hand, the coastal provinces that have experienced fast economic growth and intensive globalization during the last decade mostly fall into the category oflow advancement in educational standard,4o while provinces in the remote and border regions, whose economic development lags far behind, have achieved a larger rise in educational level. If this trend of negative correlation were to continue, then it remains highly questionable whether China can sustain a long-term economic development in and beyond the 21st century. The more rapid the economic growth of a province, the slower the increase in its educational level. (Reason see, 23, zhao and tong).
4. Health Status: growing smoking population. China is a country that is full of contradiction: at the same time that the government is modernizing the tobacco industry and profits heavily from its tax revenues, state regulations against smoking are being tightened and Beijing hosted a major international anti-smoking event; at the same time that the borders are opened up for partnerships with the western world, the authority stop joint ventures within the tobacco sector.
Lung cancer and other smoking-related diseases are the leading cause of death in China, with 750,000 fatalities a year, projected to rise to 2 million by the year 2025. but many of them seem unaware of the hazards of tobacco. Study unveiled in Beijing at the 10th World Conference on Tobacco and Health estimates that smoking kills 750,000 Chinese each year, pushing into second place the US toll of 400,000. The survey led by the Chinese Academy of Medical sciences and the University of Oxford, predicts that one-tier of the 300 million Chinese men now under the age of 30 will be killed by cigarettes. ("Tobacco Deaths in China Now Firsfin the World," New Scientist, Sep. 6,1997.) According to the survey of the Chinese Academy of preventive medicine in 1996, Chinese males take their first puff at the age of 20, compared with 23 in 1986, and smoking among the people aged 15-25 rose faster than among other age groups.
The world's biggest tobacco company is Chinese. CSTM makes 1.7 trillion cigarettes a year. The tobacco industry in China is a strong economic sector, profits from the China State Tobacco Monopoly Bureau's manufacture and sale of cigarettes account for a tenth of tax revenue and generate a further US$ 600 million a year in exports (Tom Lorski, "Money Talks in Smoking and Health Debate," South China Morning Post. Seep. 6, 1997). Government policy toward tobacco
39 Simon X.a. Zhao and Christopher S.P. Tong, "Spatial Disparity in China's Educational Development," China Information, Vol. Xl. No.4 (Spring. 1997), p. 17.
40 Simon X.B. Zhao and Christopher S.P. Tong, "Spatial Disparity in China's Educational Development," China Information, Vol. Xl. No. 4 (Spring, 1997), p. 17.
23
in China is muddle and contradictory, where the government has a monopoly over cigarette production and gets 12% of its annual revenue from cigarette sales.
Anti-smoking comparing: 138 leading officials at the ministerial level from 49 central government departments have signed a pledge to refrain from smoking in public places. According to the China smoking and health association, the number of Chinese male smokers have swelled to over 300 million and those of female smokers to 20 million, with tobacco threatening the health of over 590 million Chinese citizens. Central government departments launched a quit-smoking companion May of 1996, with over 50% of ministry officials and 20% of ministerial level building now offering smoke free environments (Xinhua News Agency, 19-Aug-97). There is a nascent Chinese public health movement.
S. Environmental degradation
While globalization has brought considerable wealth for coastal areas, it has simultaneously degraded the environmental quality oflife for the local people and reduced the sustainability of the environment for further economic expansion. Given that the local economy is currently growing and that the people ofNanhai are all preoccupied with seeking higher profits at any cost, it is unlikely that they will stop exploiting natural resources or make sacrifices to preserve a sustainable environment for the sake of the future generations. On the contrary, as industrial and agricultural production continue to expand, natural resources and the environment will have to suffer even further to satisfy the ever-growing demand of the local people for wealth and consumer goods. Therefore, rural industrialization, which is essentially unplanned, small scale and intimately related with the natural environment, has been and will continue to be one of the most powerful forces changing not only the space economy of the region but also the natural ecosystem for human habitat.
In addition to changes in the population distribution and land use, rural industrialization has resulted in some significant environmental consequences which are usually overlooked by scholars and planners who tend to focus on environmental problems in large cities. As revealed in the analysis above, industrial production in Nanhai was mostly on a small scale with unsophisticated technology for simple manufacturing. Many of these factories did not have the necessary facilities and advanced techniques for the proper treatment or recycling of industrial waste simply because they were too small to afford them. Their location, virtually in the "gray area of the countryside where environmental regulations were much loosed than in the city has further accentuated unregulated and untreated disposal of industrial waste. Moreover, as hazardous and polluting industries were no longer tolerated in large cities, Nanhai, which is a suburban county immediately next to the cities of Foshan and Guangzhou, has increasingly become a major target for relocation of heavily polluting industries including sugar refining, cement production, textile printing and dyeing, electroplating and aluminum processing. Consequently, much of the Nanhai area has been treated as a dumping ground for various waste materials generated by industrial production.
An early survey conducted by the local environmental agency revealed tllat in 1988 industrial production released a total of 4,166.3 tonnes of sulfur dioxide, nitrous oxide, carbon dioxide and
24
particulate into the air. The emission of these hazardous materials skyrocketed to 60,737.56 tonnes in 1990 as a result of the rapid growth of rural industry. At the same time, the amount of waste water discharged from industrial production jumped from 52.71 million tonnes to 135.64 million tonnes. Most of the waste gas emission came from the combustion of poor quality coal which provided almost all the energy and electric power for rural industry. The waste water was generated primarily by those factories that were involved in sugar refining, paper pulp processing, textile dyeing and electroplating. It was often released directly into streams which provided water for rice or vegetable fields, and even into fish ponds, without proper treatment or purification, leading to serious contamination of farmland and crops. In Lidong district of Dali town, for instance, among thc 90 mu of fish ponds, 70 mu were contaminated. On average, one out of every five mu of cultivated land in Nanhai was found to have been contaminated. Similarly, increasing waste gas emission has caused severe air pollution and resulted in some damage to the local ecosystem. Acid rain has been reported to be more frequent that ever before, with occurrence rising significantly from 1.6 per cent in 1986 to 17.49 per cent in 1990. Some of these ecological changes could irreversible and disastrous.
Conclusion
2S
References:
Chen Chung, Lawrence Chang and Yimin Zhang. 1995. "The Role of Foreign Direct Investment in China's Post-1978 Economic Development." World Development, Vol. 23, No.4, pp. 691-703.
Chen, Edward K.Y. and Teresa Y.c. Wong. 1995. "Economic Synergy: A Study of Two-Way Foreign Direct Investment Flow between Hong Kong and Mainland China." The New Wave of Foreign Direct Investment in Asia. Compiled by Nomura Research Institute and Institute of Southeast Asian Studies. Singapore: Prime Packaging Industries Pte. Ltd.
Cheng and Schweizer, 1996. "Cultural Values Reflected in Chinese and U.S. Television Commercials." Journal of Advertising Research, May/June 1996. p. 28.
Cheng Hong. 1996. "Advertising inCh ina: A Socialit Experiment." Averting in Asia: Communication, Culture and Consumption. Edited by Katherine toland Frith. Ames: Iowa State University Press.
Colton, Luke S. and Wayne M. Morrison. 1997. "The Chinese Transportation System: A Bottleneck or An Engine of Growth?" in joint economic committee.
Crook, Frederick W, 1997. "An Assessment of China's Agricultural Economy: 1980-2005," in China's Economic Future: Challenges to US.Policy, edited by the Joint Economic Committee, Congress of the United States. Armonk and London: M.E. Sharpe.
Cui, Bian. 1997. "Opening Policy Builds Strong Momentum," Beijing Review, September 19-0ctober 5.
Cui, Bian. 1997. "Quality of Life Enhanced," Beijing Review, September 29-0ctober 5.
Economic System Refonn Institute of China. 1987. China: Development and Reform 1986. Chengdu: Sichuan People Press.
Hu, Angang. 1997. "Zhongguo jiuye zhuangkang fenxi (Analysis of Employment in Contemporary China." Future and Choice, No. 97-5.
Keidel, Albert III. 1996. "Domestic Impact of China's External Economic Ties." PRC Tomorrow: Development Under The Ninth Five-Year Plan. Kaohsiung: National Sun Yat-Sen University.
Lardy, Nicholas R. 1992. "Chinese Foreign Trade." China Quarterly, No. 131 (September).
Lin, C.S. 1997. "Transformation of a Rural Economy in the Zhujiang Delta." The China Quarterly. Vol. 149 (March).
Lin, George C.S. 1997. "Transformation of a Rural Economy in the Zhujiang Delta" The China Quarterly. Vol. 149, March 1997.
Lo, Die. 1996. Market and Institutional Regulation in Chinese Industrialization, 1978-94. London and New York: St. Martin's Press, Inc.
Riskin, Carl. 1997. "Social Development, Quality of Life and the Environment." China's Economic Future: Challenges to US.Policy, edited by the Joint Economic Committee, Congress of the United States. Armonk and London: M.E. Sharpe.
Simon X.B. Zhao and Christopher S.P. Tong. 1997. "Spatial Disparity in China's Educational Development," China lriformation, Vol. XI. No.4 (Spring).
UNICEF. 1997. The State of the World's Children. New York: Oxford University Press.
26
Wang, Xiaoqiang. 1997. "On 30 million Television Production Capacity." Future and Choice, No. 97-9.
White, Gordon, Jude Howell, and Shang Xiao Yuan. 1996. In Search of Civil Society: Market Reform and Social Change in Contemporary China. Oxford: Clareudon Press
Womack, Brantly and Guangzhi Zhao. 1994. "The Many Worlds of China's Provinces: Foreign Trade and Diversification," China Deconstructs: Politics, Trade and Regionalism. Edited by David S.G. Goodman and Gerald Segal. London and New York: Routledge.
World Bank. 1990. China: Macroeconomic Stability and Industrial Growth under Decentralized Socialiam. Washingtong, D.C.: The World Bank.
World Bank. 1996. The Chinese Economy: Fighting Inflation, Deepening Reforms. Washington, D.C.: The World Bank.
Wu, Shaozhong, Lin Daidai and Yi Ran. 1990. Zhongguo Xiaofei Yanjiu (China's Consumption). Shanghai: Xinhua Press.
Xu, Baiyi. 1996. Marketing To China: One Billion New Customers. Lincolnwood: NTC Business Books.
Zhang, Amei. 1987. "The Structural Contradictions & the Obstacles to Technology Transformation:: Economic Development & System Reform, No.4, 1987.
27
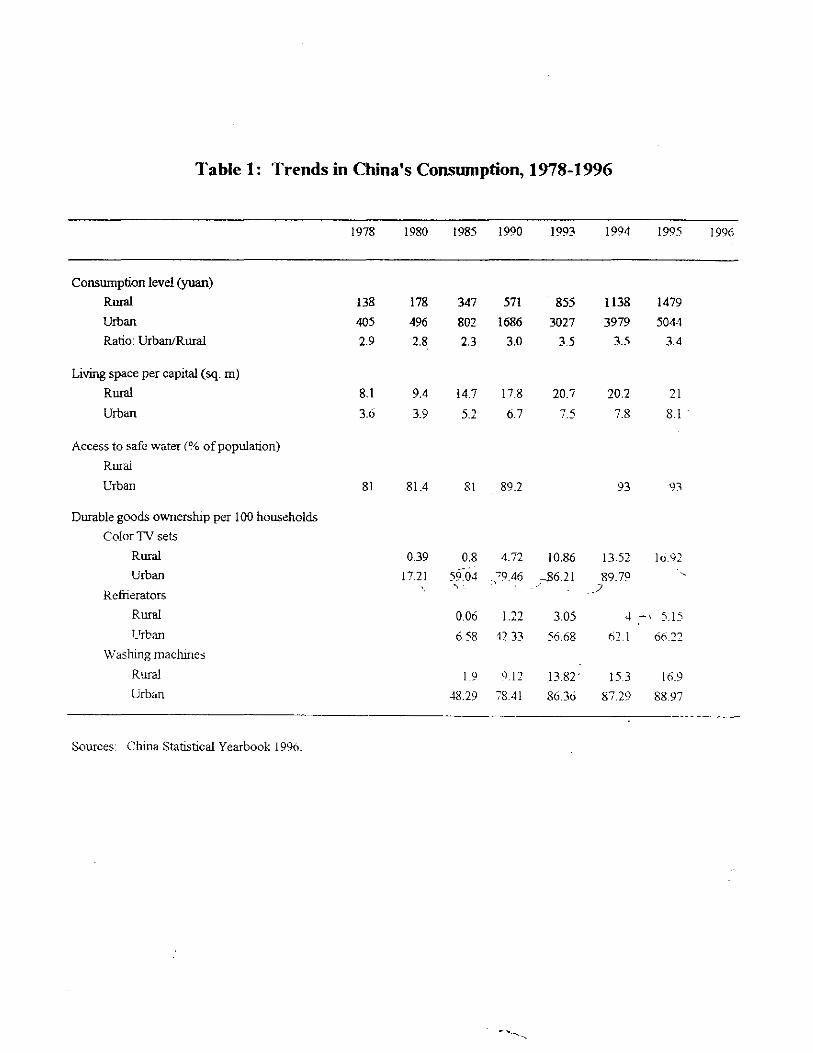
Table 1: Trends in China's Conswnption, 1978-1996
1978 1980 1985 1990 1993 [994 1995 1996
Consumption level (yuan)
Rural 138 178 347 571 855 1138 1479
Urban 405 496 802 1686 3027 3979 5044
Ratio: Urban/Rural 2.9 2.8 2.3 3.0 3.5 3.5 3.4
Living space per capital (sq. m)
Rural 8.1 9.4 14.7 17.8 20.1 20.2 21
Urban 3.6 3.9 5.2 6.7 7.5 7.8 8.1 .
Access to safe water (% of population)
Rurai
Urban 81 81.4 81 89.2 93 93
Durable goods ownership per 100 households
Color TV sets
Rural 0.39 0.8 4.72 10.86 1352 10.92
Urban 17.21 59.04 ...,i9.~6 -$6.21 89.7° , .' j Refrierators
Rural 0.06 1.22 3.05 4 ~, 5.15
l'rban 658 1233 56.68 62.1 66.22
Washing machines
Rural 1.9 ().l2 13.82· 15.3 16.9
Urban 48.29 78.41 86.36 8~.29 88.97
Sources: China Statistical Yearbook 1996.
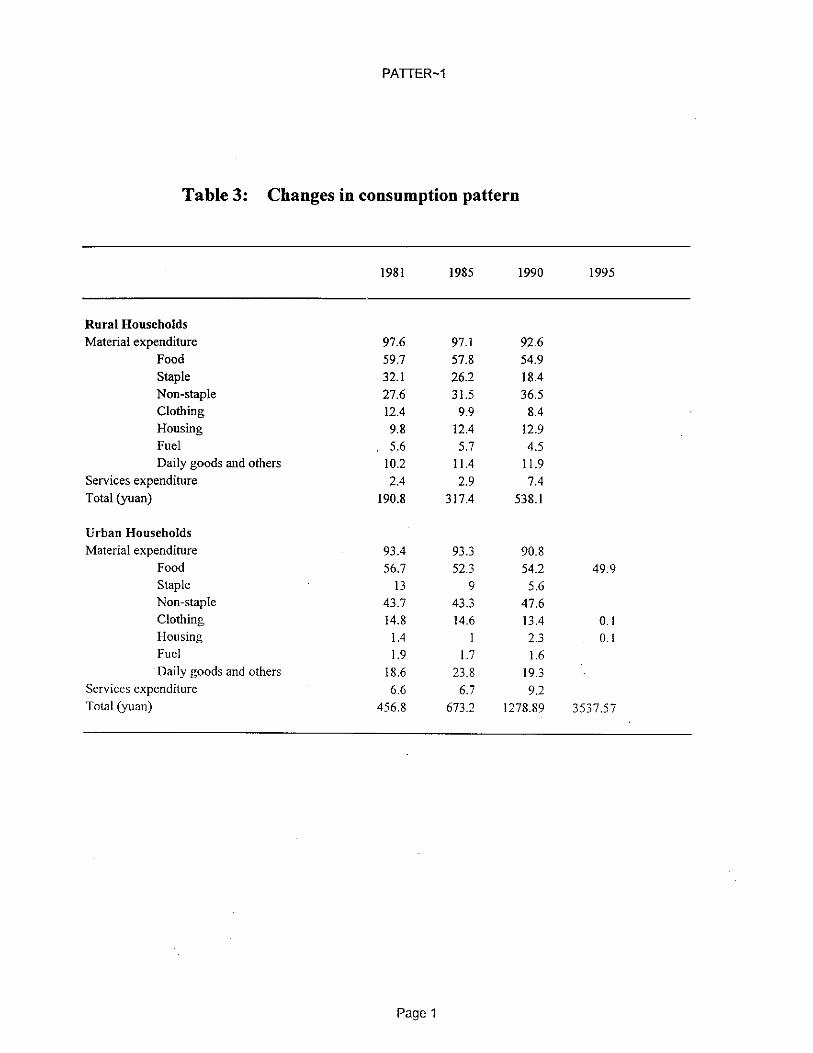
PATIER-1
Table 3: Changes in consumption pattern
1981 1985 1990 1995
Rural Households Material expenditure 97.6 97.1 92.6
Food 59.7 57.8 54.9 Staple 32.1 26.2 18.4 Non-staple 27.6 31.5 36.5 Clothing 12.4 9.9 8.4 Housing 9.8 12.4 12.9 Fuel 5.6 5.7 4.5 Daily goods and others 10.2 11.4 11.9
Services expenditure 2.4 2.9 7.4 Total (yuan) 190.8 317.4 538.1
Urban Households Material expenditure 93.4 93.3 90.8
Food 56.7 52.3 54.2 49.9 Staple 13 9 5.6 Non-staple 43.7 43.3 47.6 Clothing 14.8 14.6 13.4 0.1 Housing 1.4 2.3 0.1 Fuel 1.9 1.7 1.6 Daily goods and others 18.6 23.8 19.3
Services expenditure 6.6 6.7 9.2 Total (yuan) 456.8 673.2 1278.89 3537.57
Page 1
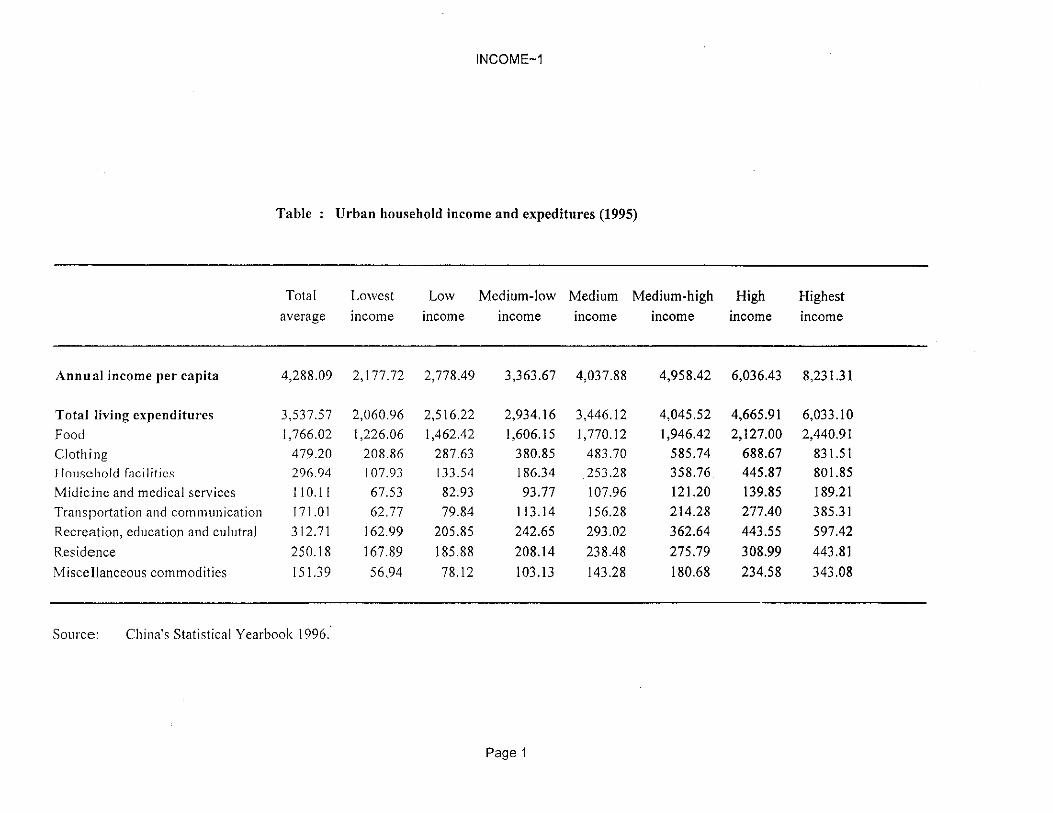
INCQME-1
Table Urban household income and expeditures (1995)
Total
average
Annual income per capita 4,288.09
Total living expenditures 3,537.57
Food 1,766.02
Clothing 479.20 IlouschoJd facilities 296.94
Midicine and medical services 110.11
Transportation and communication 17l.01
Recreation, education and culutral 312.71
Residence 250.18
Miscellanceous commodities 151.39
Source: Cbina's Statistical Yearbook 1996.'
Lowest
income
2,177.72
2,060.96
1,226.06
208.86 107.93
67.53
62.77
162.99
167.89
56 . .94
Low Medium-low Medium Medium-high High
income income income income income
2,778.49 3,363.67 4,037.88 4,958.42 6,036.43
2,516.22 2,934.16 3,446.12 4,045.52 4,665.91
1,462.42 1,606.15 1,770.12 1,946.42 2,127.00
287.63 380.85 483.70 585.74 688.67 133.54 186.34 253.28 358.76 445.87
82.93 93.77 107.96 121.20 139.85
79.84 113.14 156.28 214.28 277.40
205.85 242.65 293.02 362.64 443.55
185.88 208.14 238.48 275.79 308.99
78.12 103.13 143.28 180.68 234.58
Page 1
Highest
income
8,231.31
6,033.10
2,440.91
831.5 t 801.85
189.21
385.31
597.42
443.81
343.08
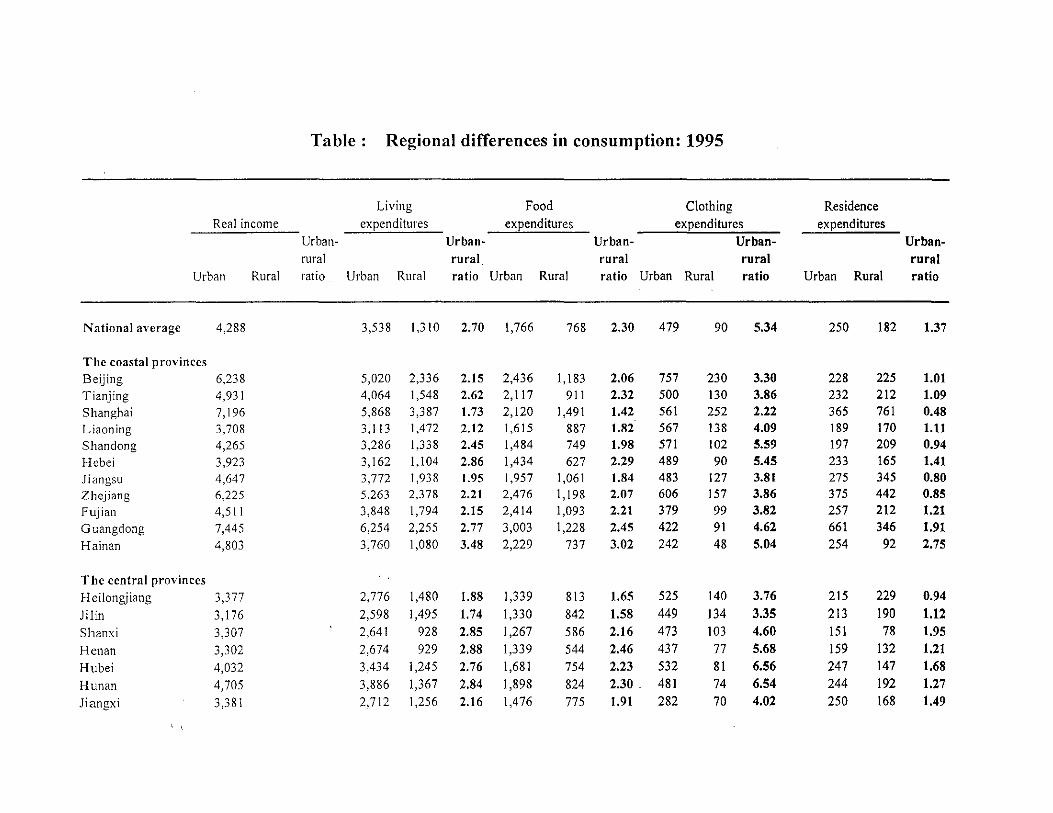
Table: Regional differences in consumption: 1995
Living Food Clothing Residence Real income expenditures expenditures expenditures expenditures
Urban- Urban- Urban- Urban- Urban-rural rural rural rural rural
Urban Rural ratio Urban Rural ratio Urban Rural ratio Urban Rural ratio Urban Rural ratio
National average 4,288 3,538 1,310 2.70 1,766 768 2.30 479 90 5.34 250 182 1.37
The coastal provinces Beijing 6,238 5,020 2,336 2.15 2,436 1,183 2.06 757 230 3.30 228 225 1.01
Tianjing 4,931 4,064 1,548 2.62 2,117 911 2.32 500 130 3.86 232 212 1.09
Shanghai 7,196 5,868 3,387 1.73 2,120 1,491 1.42 561 252 2.22 365 761 0.48
Liaoning 3,708 3,113 1,472 2.12 1,615 887 1.82 567 138 4.09 189 170 1.11
Shandong 4,265 3,286 1,338 2.45 1,484 749 1.98 571 102 5.59 197 209 0.94
Hebei 3,923 3,162 1,104 2.86 1,434 627 2.29 489 90 5.45 233 165 1.41
Jiangsu 4,647 3,772 1,938 1.95 1,957 1,061 1.84 483 127 3.81 275 345 0.80
Zhejiang 6,225 5,263 2,378 2.21 2,476 1,198 2.07 606 157 3.86 375 442 0.85
Fujian 4,511 3,848 1,794 2.15 2,414 1,093 2.21 379 99 3.82 257 212 1.21
Guangdong 7,445 6,254 2,255 2.77 3,003 1,228 2.45 422 91 4.62 661 346 1.91
Hainan 4,803 3,760 1,080 3.48 2,229 737 3.02 242 48 5.04 254 92 2.75
The central provinces Heilongjiang 3,377 2,776 1,480 1.88 1,339 813 1.65 525 140 3.76 215 229 0.94
Jilin 3,176 2,598 1,495 1.74 1,330 842 1.58 449 134 3.35 213 190 1.12
Shanxi 3,307 2,641 928 2.85 1,267 586 2.16 473 103 4.60 151 78 1.95
Henan 3,302 2,674 929 2.88 1,339 544 2.46 437 77 5.68 159 132 1.21
Hubei 4,032 3,434 1,245 2.76 1,681 754 2.23 532 81 6.56 247 147 1.68
Hunan 4,705 3,886 1,367 2.84 1,898 824 2.30 . 481 74 6.54 244 192 1.27
Jiangxi 3,381 2,712 1,256 2.16 1,476 775 1.91 282 70 4.02 250 168 1.49
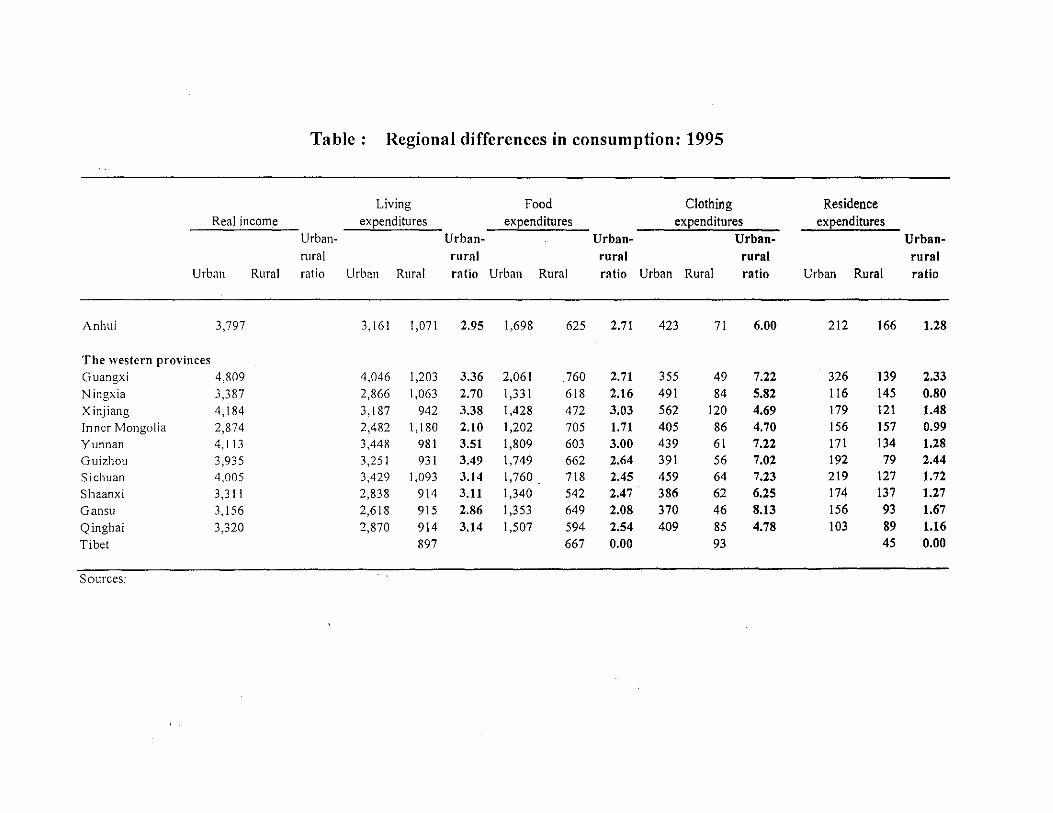
Table: Regional differences in consumption: 1995
Living Food Clothing Residence Real income expenditures expenditures expenditures expenditures
Urban- Urban- Urban- Urban- Urban-rural rural rural rural rural
Urban Rural ratio Urbnn Rural ratio Urban Rural ratio Urban Rural ratio Urban Rural ratio
Anhui 3,797 3,161 1,071 2.95 1,698 625 2.71 423 71 6.00 212 166 1.28
The western provinces Guangxi 4,809 4,046 1,203 3.36 2,061 .760 2.71 355 49 7.22 326 139 2.33
Ningxia 3,387 2.866 1,063 2.70 1,331 618 2.16 491 84 5.82 116 145 0.80
Xinjiang 4,184 3,187 942 3.38 1,428 472 3.03 562 120 4.69 179 121 1.48
Inner Mongolia 2,874 2,482 1,180 2.10 1,202 705 1.71 405 86 4.70 156 157 0.99
Yunnan 4,113 3,448 981 3.51 1,809 603 3.00 439 61 7.22 171 134 1.28
Guizhou 3,935 3,251 931 3.49 1,749 662 2.64 391 56 7.02 192 79 2.44
Sichuan 4,005 3,429 1,093 3.14 1,760 718 2.45 459 64 7.23 219 127 1.72
Shaanxi 3,311 2,838 914 3.11 1,340 542 2.47 386 62 6.25 174 137 1.27
Gansu 3,156 2,618 915 2.86 1,353 649 2.08 370 46 8.13 156 93 1.67
Qinghai 3,320 2,870 914 3.14 1,507 594 2.54 409 85 4.78 103 89 1.16
Tibet 897 667 0.00 93 45 0.00
Sources:
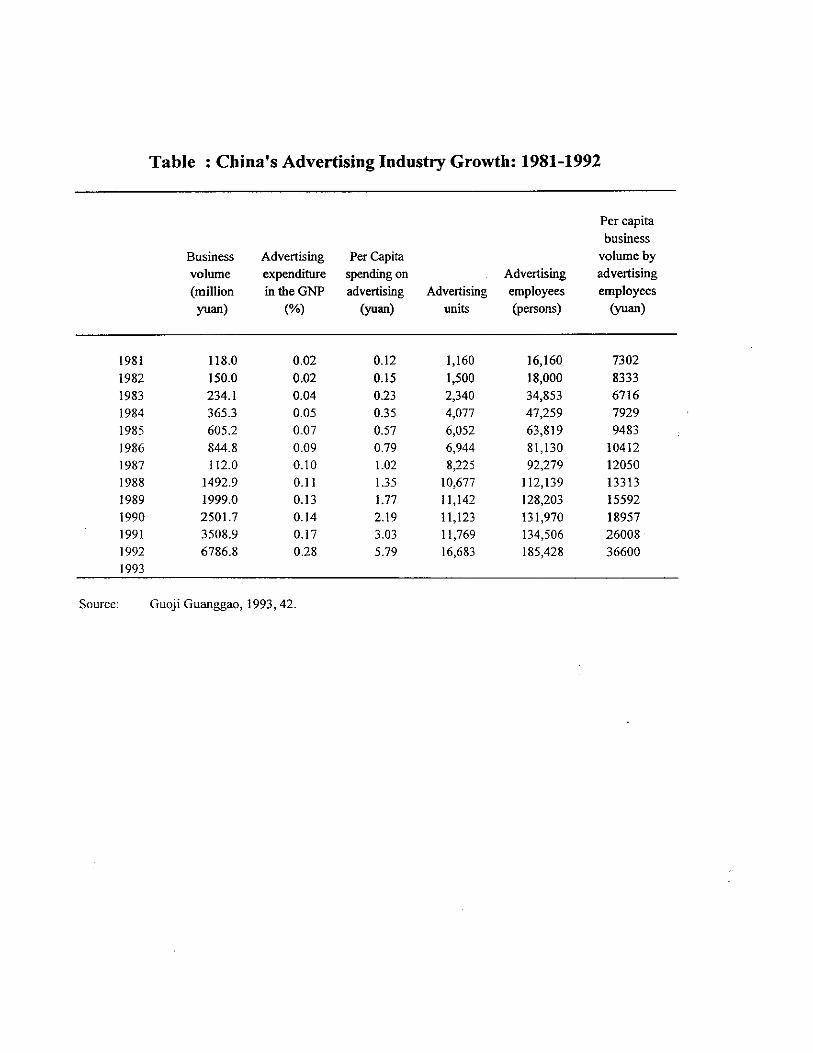
Table: China's Advertising Industry Growth: 1981-1992
Per capita business
Business Advertising Per Capita volume by
volume expenditure spending on Advertising advertising
(million in the GNP advertising Advertising employees employees yuan) (%) (yuan) units (persons) (yuan)
1981 ll8.0 0.02 0.12 1,160 16,160 7302
1982 150.0 0.02 0.15 1,500 18,000 8333 1983 234.1 0.04 0.23 2,340 34,853 6716 1984 365.3 0.05 0.35 4,077 47,259 7929 1985 605.2 0.07 0.57 6,052 63,819 9483
1986 844.8 0.09 0.79 6,944 81,130 10412 1987 112.0 0.10 1.02 8,225 92,279 12050 1988 1492.9 0.11 1.35 10,677 112,139 13313 1989 1999.0 0.13 1.77 11,142 128,203 15592 1990 2501.7 0.14 2.19 11,123 131,970 18957 1991 3508.9 0.17 3.03 11,769 134,506 26008 1992 6786.8 0.28 5.79 16,683 185,428 36600 1993
Source: Guoji Guanggao, 1993,42.
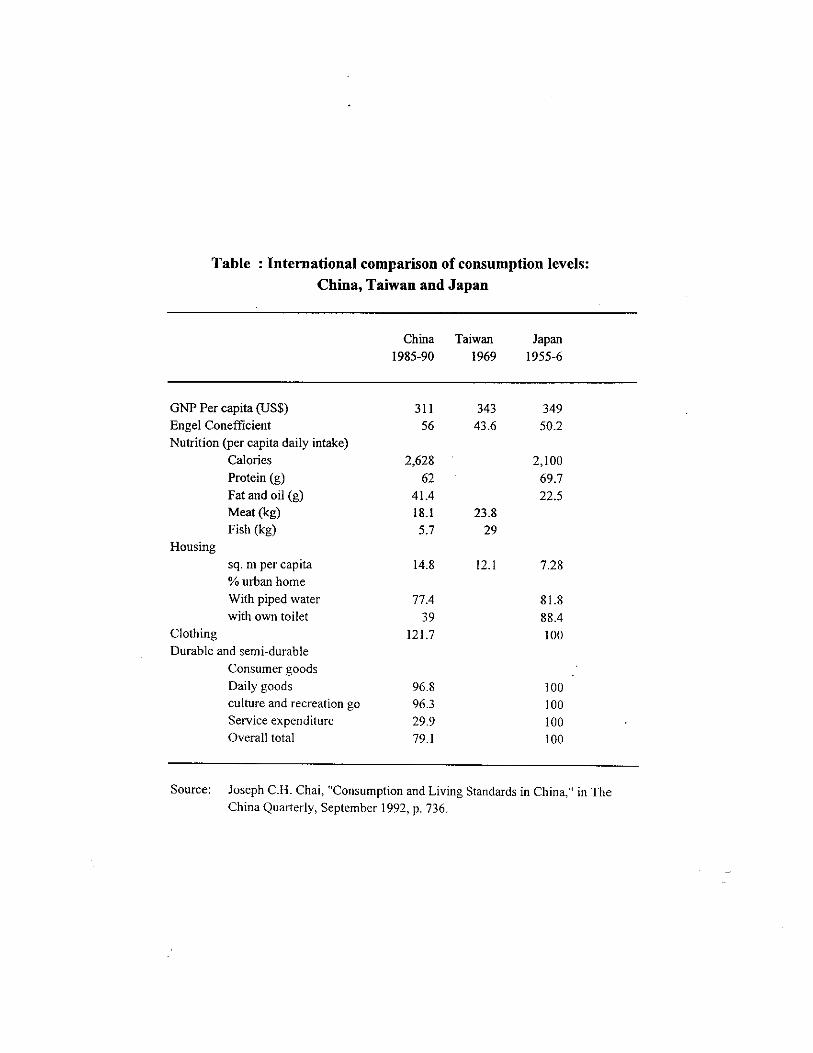
Table : International comparison of consumption levels: China, Taiwan and Japan
GNP Per capita (US$) Engel Conefficient
Nutrition (per capita daily intake) Calories
Protein (g)
Fat and oil (g) Meat (kg) Fish (kg)
Housing
sq. m per capita % urban home With piped water
with own toilet Clothing Durable and semi-durable
Consumer goods Daily goods culture and recreation go
Service expenditure Overall total
China 1985-90
3II 56
2,628
62 41.4 18. I 5.7
14.8
77.4
39 121.7
96.8 96.3 29.9 79.1
Taiwan 1969
343 43.6
23.8 29
12. I
Japan 1955-6
349 50.2
2,100
69.7 22.5
7.28
81.8
88.4 100
100 100
100 100
Source: Joseph C.H. Chai, "Consumption and Living Standards in China," in The China Quarterly, September 1992, p. 736.
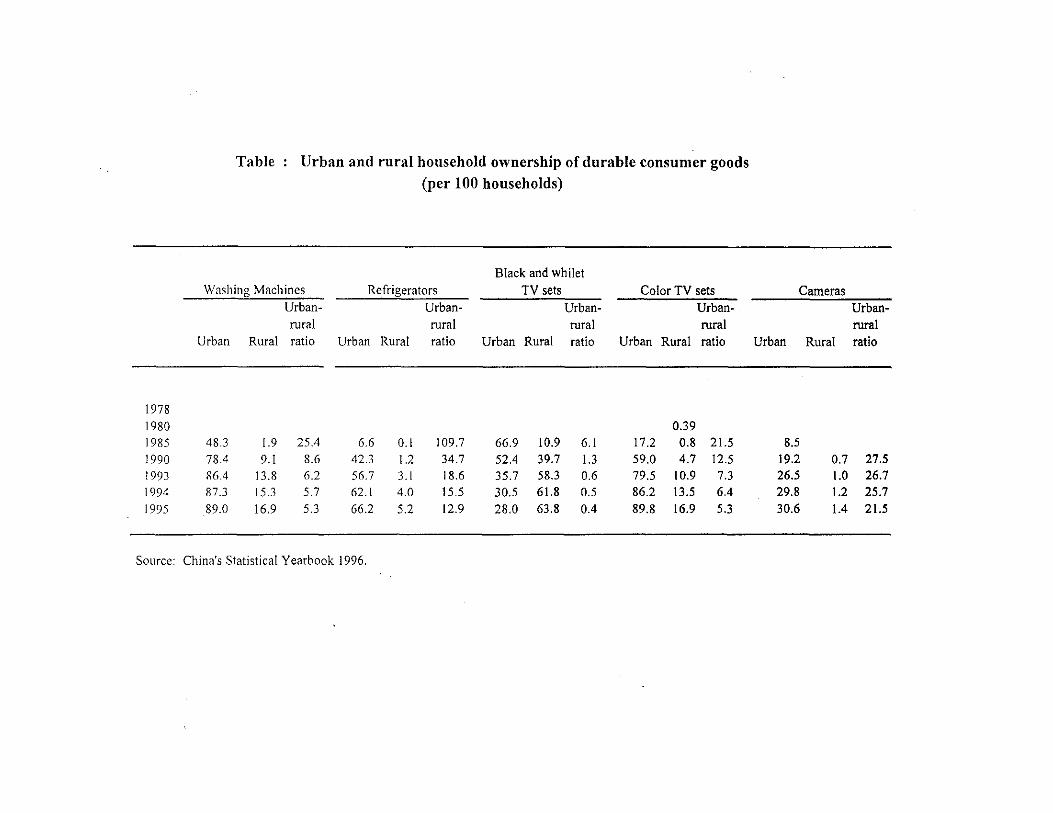
1978 1980 1985 1990 1993 1994 1995
Table Urban and rural household ownership of durable consumer goods (per 100 households)
Black and whilet \Vashing Machines Refrigerators TV sets Color TV sets
Urban- Urban- Urban- Urban-rural rural rural rural
Urban Rural ratio Urban Rural ratio Urban Rural ratio Urban Rural ratio
0.39 48.3 1.9 25,4 6.6 0.1 109.7 66.9 10.9 6.1 17.2 0.8 21.5 78,4 9.1 8.6 42.3 1.2 34.7 52,4 39.7 1.3 59.0 4.7 12.5 86,4 13.8 6.2 56.7 3.1 18.6 35.7 58.3 0.6 79.5 10.9 7.3 87.3 15.3 5.7 62.1 4.0 15.5 30.5 61.8 0.5 86.2 13.5 6.4 89.0 16.9 5.3 66.2 5.2 12.9 28.0 63.8 0,4 89.8 16.9 5.3
Source: China's Statistical Yearbook 1996.
Cameras Urban-rural
Urban Rural ratio
8.5 19.2 0.7 27.5 26.5 1.0 26.7 29.8 1.2 25.7 30.6 1.4 21.5
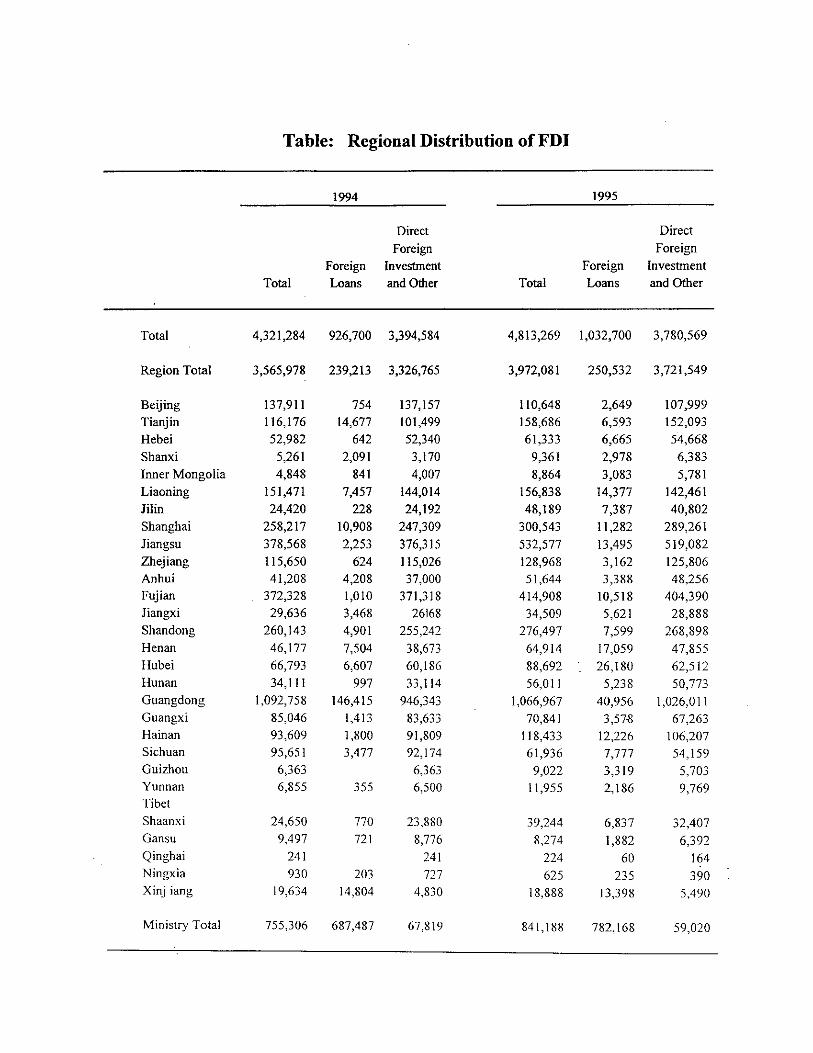
Table: Regional Distribution ofFDI
1994 1995
Direct Direct
Foreign Foreign Foreign Investment Foreign Investment
Total Loans and Other Total Loans and Other
Total 4,321,284 926,700 3,394,584 4,813,269 1,032,700 3,780,569
Region Total 3,565,978 239,213 3,326,765 3,972,081 250,532 3,721,549
Beijing 137,911 754 137,157 110,648 2,649 107,999 Tianjin 116,176 14,677 101,499 158,686 6,593 152,093 Hebei 52,982 642 52,340 61,333 6,665 54,668
Shanxi 5,261 2,091 3,170 9,361 2,978 6,383 Inner Mongolia 4,848 841 4,007 8,864 3,083 5,781 Liaoning 151,471 7,457 144,014 156,838 14,377 142,461 Jilin 24,420 228 24,192 48,189 7,387 40,802 Shanghai 258,217 10,908 247,309 300,543 11,282 289,261
Jiangsu 378,568 2,253 376,315 532,577 13,495 519,082 Zhejiang 115,650 624 115,026 128,968 3,162 125,806 Anhui 41,208 4,208 37,000 51,644 3,388 48,256 Fujian 372,328 1,010 371,318 414,908 10,518 404,390 Jiangxi 29,636 3,468 26168 34,509 5,621 28,888 Shandong 260,143 4,901 255,242 276,497 7,599 268,898 Henan 46,177 7,504 38,673 64,914 17,059 47,855 Hubei 66,793 6,607 60,186 88,692 26,180 62,512 Hunan 34, III 997 33,114 56,011 5,238 50,773 Guangdong 1,092,758 146,415 946,343 1,066,967 40,956 1,026,011 Guangxi 85,046 1,413 83,633 70,841 3,578 67,263 Hainan 93,609 1,800 91,809 118,433 12,226 106,207 Sichuan 95,651 3,477 92,174 61,936 7,777 54,159 Guizhou 6,363 6,363 9,022 3,319 5,703 Yunnan 6,855 355 6,500 11,955 2,186 9,769 Tibet Shaanxi 24,650 770 23,880 39,244 6,837 32,407 Gansu 9,497 721 8,776 8,274 1,882 6,392 Qinghai 241 241 224 60 164 Ningxia 930 203 727 625 235 390 Xinj iang 19,634 14,804 4,830 18,888 13,398 5,490
Ministry Total 755,306 687,487 67,819 841,188 782,168 59,020
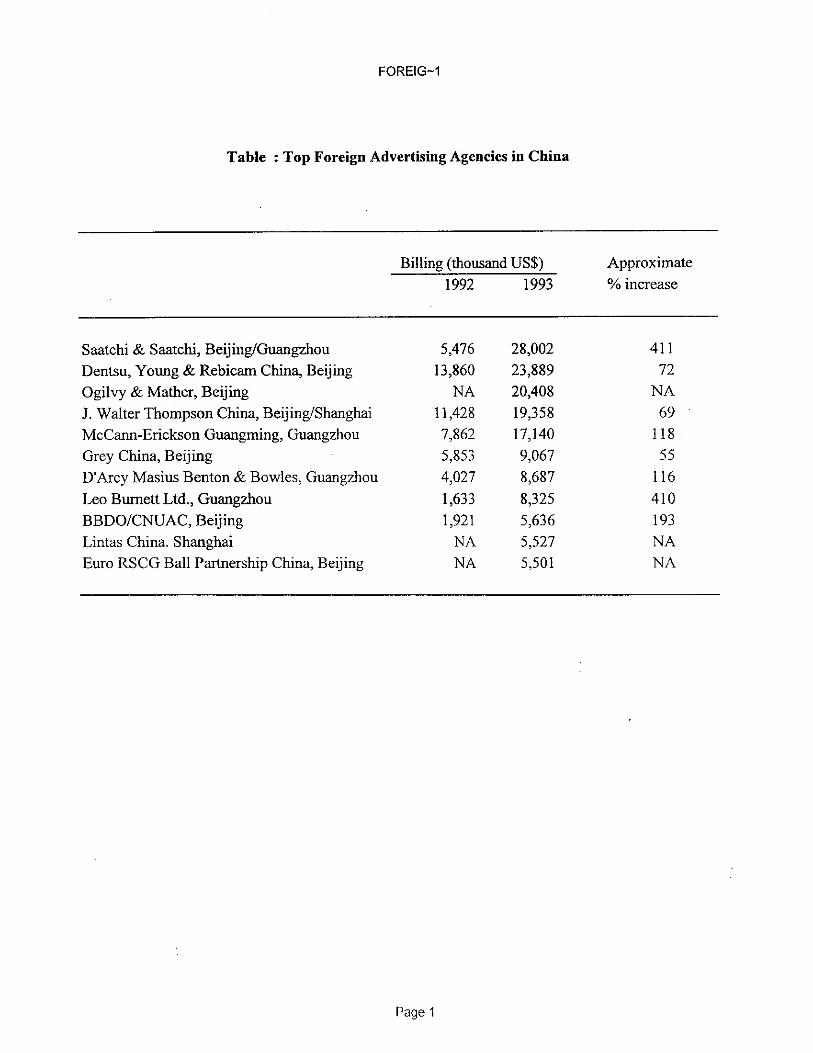
FOREIG-1
Table : Top Foreign Advertising Agencies in China
Billing (thousand US$)
1992 1993
Saatchi & Saatchi, Beijing/Guangzhou 5,476 28,002
Dentsu, Young & Rebicam China, Beijing 13,860 23,889
Ogilvy & Mather, Beijing NA 20,408
J. Walter Thompson China, Beijing/Shanghai 11,428 19,358
McCann-Erickson Guangming, Guangzhou 7,862 17,140
Grey China, Beijing 5,853 9,067
D'Arcy Masius Benton & Bowles, Guangzhou 4,027 8,687
Leo Burnett Ltd., Guangzhou 1,633 8,325
BBDO/CNUAC, Beijing 1,921 5,636
Lintas China. Shanghai NA 5,527
Euro RSCG Ball Partnership China, Beijing NA 5,501
Page 1
Approximate
% increase
411
72
NA
69
118
55
116
410
193
NA
NA
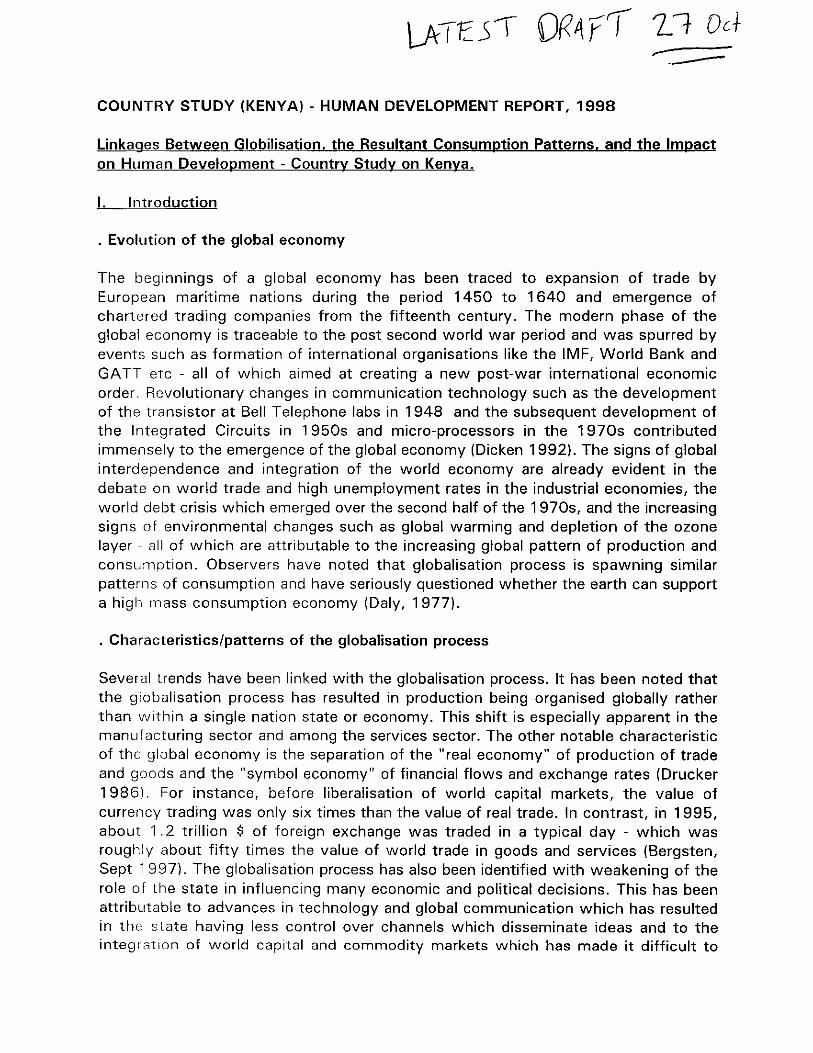
LATESI Or<4PrJ L'1 Oc+ ,-
COUNTRY STUDY (KENYA) - HUMAN DEVELOPMENT REPORT, 1998
Linkages Between Globilisation, the Resultant Consumption Patterns. and the Impact on Human Development - Country Study on Kenya.
I. Introduction
. Evolution of the global economy
The beginnings of a global economy has been traced to expansion of trade by European maritime nations during the period 1450 to 1640 and emergence of chartered trading companies from the fifteenth century. The modern phase of the global economy is traceable to the post second world war period and was spurred by events such as formation of international organisations like the IMF, World Bank and GATT etc - all of which aimed at creating a new post-war international economic order. Revolutionary changes in communication technology such as the development of the transistor at Bell Telephone labs in 1948 and the subsequent development of the Integrated Circuits in 1950s and micro-processors in the 1970s contributed immensely to the emergence of the global economy (Dicken 1992). The signs of global interdependence and integration of the world economy are already evident in the debate on world trade and high unemployment rates in the industrial economies, the world debt crisis which emerged over the second half of the 1970s, and the increasing signs of environmental changes such as global warming and depletion of the ozone layer - all of which are attributable to the increasing global pattern of production and consumption. Observers have noted that globalisation process is spawning similar patterns of consumption and have seriously questioned whether the earth can support a high mass consumption economy (Daly, 1977) .
. Characteristics/patterns of the globalisation process
Several trends have been linked with the globalisation process. It has been noted that the globalisation process has resulted in production being organised globally rather than within a single nation state or economy. This shift is especially apparent in the manufacturing sector and among the services sector. The other notable characteristic of the global economy is the separation of the "real economy" of production of trade and goods and the "symbol economy" of financial flows and exchange rates (Drucker 19861. For instance, before liberalisation of world capital markets, the value of currency trading was only six times than the value of real trade. In contrast, in 1995, about 1.2 trillion $ of foreign exchange was traded in a typical day - which was roughly about fifty times the value of world trade in goods and services (Bergsten, Sept 1997). The globalisation process has also been identified with weakening of the role of the state in influencing many economic and political decisions. This has been attributable to advances in technology and global communication which has resulted in the state having less control over channels which disseminate ideas and to the integration of world capital and commodity markets which has made it difficult to
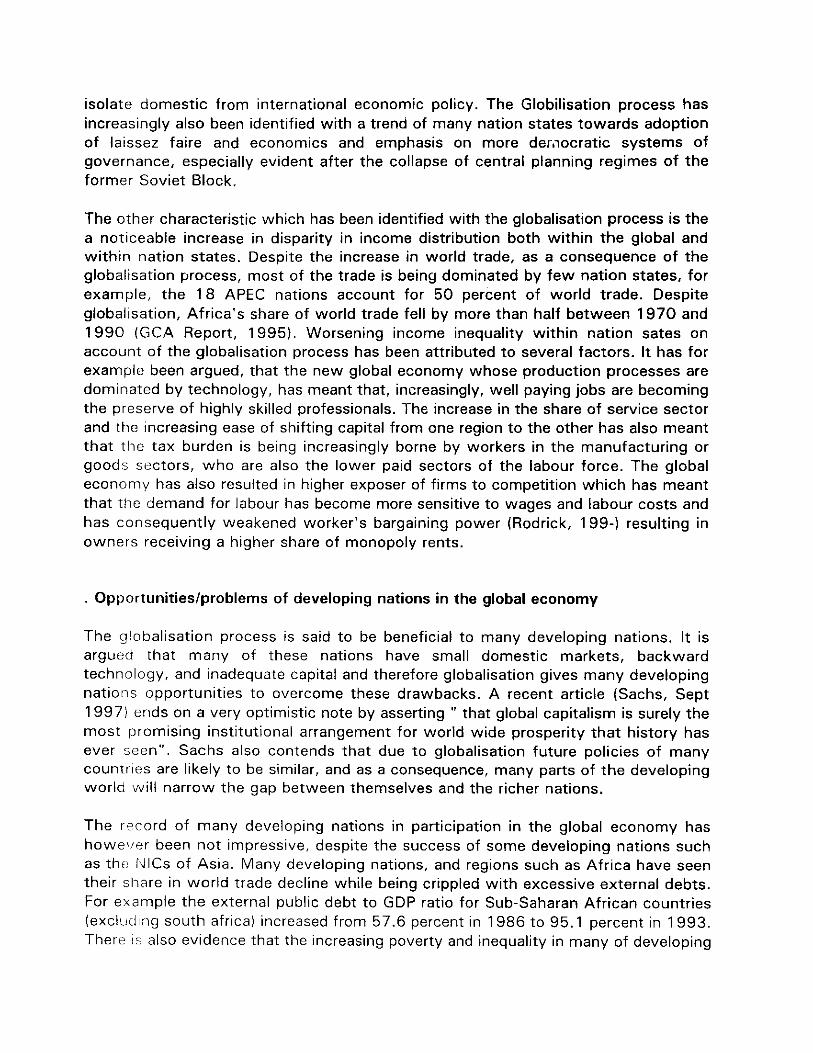
isolate domestic from international economic policy. The Globilisation process has increasingly also been identified with a trend of many nation states towards adoption of laissez faire and economics and emphasis on more der.l0cratic systems of governance, especially evident after the collapse of central planning regimes of the former Soviet Block.
The other characteristic which has been identified with the globalisation process is the a noticeable increase in disparity in income distribution both within the global and within nation states. Despite the increase in world trade, as a consequence of the globalisation process, most of the trade is being dominated by few nation states, for example, the 18 APEC nations account for 50 percent of world trade. Despite globalisation, Africa's share of world trade fell by more than half between 1970 and 1990 (GCA Report, 1995). Worsening income inequality within nation sates on account of the globalisation process has been attributed to several factors. It has for example been argued, that the new global economy whose production processes are dominated by technology, has meant that, increasingly, well paying jobs are becoming the preserve of highly skilled professionals. The increase in the share of service sector and the increasing ease of shifting capital from one region to the other has also meant that the tax burden is being increasingly borne by workers in the manufacturing or goods sectors, who are also the lower paid sectors of the labour force. The global economy has also resulted in higher exposer of firms to competition which has meant that the demand for labour has become more sensitive to wages and labour costs and has consequently weakened worker's bargaining power (Rodrick, 199-) resulting in owners receiving a higher share of monopoly rents .
. Opportunities/problems of developing nations in the global economy
The globalisation process is said to be beneficial to many developing nations. It is argued that many of these nations have small domestic markets, backward technology, and inadequate capital and therefore globalisation gives many developing nations opportunities to overcome these drawbacks. A recent article (Sachs, Sept 1997) ends on a very optimistic note by asserting" that global capitalism is surely the most promising institutional arrangement for world wide prosperity that history has ever seen". Sachs also contends that due to globalisation future policies of many countries are likely to be similar, and as a consequence, many parts of the developing world will narrow the gap between themselves and the richer nations.
The r"cord of many developing nations in participation in the global economy has howe'Jer been not impressive, despite the success of some developing nations such as th£: f\llCs of Asia. Many developing nations, and regions such as Africa have seen their share in world trade decline while being crippled with excessive external debts. For example the external public debt to GOP ratio for Sub-Saharan African countries (exclucilng south africa) increased from 57.6 percent in 1986 to 95.1 percent in 1993. There IS also evidence that the increasing poverty and inequality in many of developing
nations is contributing to global environmental degradation through practices such as de-forestation. Statistics indicate that presently about 30 acres of rain forest are cleared every minute (Adams, 1995).
Protectionist measures ;n major world economies such as high textile and agricultural barriers in the US and EU has limited the benefits of many developing countries in terms of increasing their trade and income. More recently, short-term speculative capital flows have demonstrated the vulnerability of economies such as those of Mexico, Thailand, and Malaysia to actions of speculators in the world currency markets. The active promotion of laissez-faire policies by the Bretton Woods institutions and the increasing acceptance and implementation of these policies in many developing countries have in several cases resulted in inadequate safety-nets to cushion adjustment burdens and little or no worker re-training geared to make them survive in the new industries, the result has been high unemployment and attendant social friction. Such developments have made many observers question some aspects of the operations of the new global economy on developing nations societies. The other negative aspect of the globalisation process has been the effect on local cultures and communities. As a consequence of media and the global communication revolution and changes in consumption patterns local cultures and communities are being marginalised worldwide and in the process many of the positive aspects of such societies give way to the new global culture with its emphasis on consumption and individualism .
. Colonial history and integration of Kenyan communities within the global economy.
The British colonial presence in Kenya has it's origins in the granting of a Royal Charter to the Imperial British East Africa Company in 1888 and the subsequent establishment of British administration in 1895. At the time of colonial contact, four broad groups of people could be classified by economic organisation, namely - settled agriculturalists, nomadic pastoralists, small craftsmen, and traders (Collier and Lal, 1986), By the early 20 century these pre-colonial modes of production were already on the wane as the focus shifted on com'Tlodity production for world markets in which Britain, the colonial power, was a key player (Swainson, 1980).
The post second world war period saw further consolidation of the Kenyan economy within the global economy. The operations of TNCs came to be closely aligned with the colonial government plans to develop cash crops such as pyrethrum and tea. The influence of Multinational Corporations (MNCs) in production was further consolidated with the corporations managing to influence quantity and quality of production and at the same time acting as mediums of distribution in the world market (Swainson, 1980). The policy of promoting cash crop production was more formally articulated in the Swynnerton Plan of 1954 which "aimed at developing indigenous agriculture for the world market" (Swainson, 1980). TNCs also dominated manufacturing production aimed at the domestic market which had already (by the 1950s) seen a sizeable african consumers whose consumption patterns supported local manufactures.
Changes in production and consumption patterns of local communities over the colonial period.
By 1920's expansion of cash crop cultivation in parts such as Central and Nyanza province had already created specialisation of labour involved in the purchase, sale and transport of crops and linked to imported consumer goods (Kitching, 199-). In precolonial times, before maize was introduced into the Kenyan diet, the staple foods for many of the local communities were millet, sorghum and tubers such as cassava and sweet potatoes. By the 1920s the new mode of production had already created a major change in the food consumption patterns of indigenous people with maize displacing local millet as the indigenous staple and providing the main cash crop for surplus (Kitching, 199-). Table I.A (Statistical Appendix) shows the dramatic increase in maize production in the Nyanza region of Kenya between 1909 to 1918 (from 469 to 5,689 tonnes). The Table also shows the dramatic decline in production of the traditional food crop of the area - millet/sorghum (mtama and mtama flour) from 1,770 tonnes in 1909 to 19 tonnes in 1918.
Earlier documented changes of the effects of changes in consumption and production patterns of local communities.
Earlier studies of local communities diets noted that the diets of many of the communities were quite varied (Wilson, 1925). The effects of changes in consumption patterns of the local people are documented in a series of surveys (Phillip, 1943) done on the general health of the Digo ethnic community on the Kenyan coast. The study noted that the change from the multi-coloured or yellow maize (common varieties among the Digo) to white maize contributed to the occurrence of Vitamin A Deficiency among the Digo. The higher nutritional status of the old mixed colour maize compared to the white maize was also confirmed by Patertson's study of the Kikuyu community in Kenya (Paterson, 1940). Negative effects of changes in the dietary habits of indigenous communities were also linked in susceptibility to some diseases. A study of dietary habits of the Nandi (Anderson, 1927) noted that the increasing reliance of maize diet among the Nandi (whose diet was mostly based on milk and blood and some sorghum) contributed to increased morbidity from malaria. The First Report of the Committee on Nutrition in Colonial Empire (London, 1939) assigned the high mortality rate among the East African Carrier Corps during the earlier part of the first world war to the earlier part of railway construction to "improper feeding".
II. Globilisation and Changing Consumption Patterns
MNCs al.d the emergence of the advertising Industry in Kenya
Records trace the establishment of the first advertising agency in Kenya to 1 938 - a locally incorporated multinational firm. At the time of independence (1963) advertising agencies had increased to three, two of them being Multinational corporations (Ogutu.1983). By 1989 the advertising agencies had increased to 30 (Odour, 1989). Presently the number of advertising and marketing agencies is in excess of 70 ( Kenya postal directory, yellow pages). In 1976 a survey of advertising in Africa showed that Kenya spent 0.59 percent of GDP on advertising - the highest in Sub-Sahara Africa in that year. By 1977 Kenya was already a member of the International Convention to facilitate the Imports of Commercial Samples and advertising (Manley. 1977).
Langdon (1981) provides evidence of the dominance of foreign MNC firms in the advertising industry in Kenya. His study found that 39 domestic subsidiaries of MNCs in 1973 (with a total turn over Kenya Pounds 54.3 in financial year 1972/73) allocated 1.98 percent of their revenues to advertising. The study indicated that 22 out of the 39 firms (which produced consumer goods) allocated a higher proportion (3.45 percent) of their total turnover on media advertising compared with only 0.28 percent for the remaining 1 7 firms selling intermediate goods. Langdon estimate of advertising expenditure in the early seventies was Kenya pounds 3 to 3.5 million each year, with 90 percent being accounted for by international subsidiaries of MNCs. Table II A. (Statistical Appendix) reproduces the study's findings of advertising trends of 27 final consumer goods MNCs subsidiaries in Kenya over the period 1972 to 1973. The findings suggest that advertising has been especially important for MNCs entering the Kenyan market after the post independence period. Langdon (1981) further noted that, with the exceptions of airline advertising which aimed at the top or elitist market, most of the advertising was aimed at influencing the consumption patterns of the mass market in Kenya.
Records of the marketing society of Kenya (the umbrella organisation of advertising agencies in Kenya) indicate that, by 1983, 14 advertising agencies were operating in the country. A study of operations of advertising agencies in Kenya (Ogutu, 1983) indicated that 46.2 percent of the advertising agencies were Kenyan owned, and the rest foreign owned. The study indicated that 30.8 percent of the foreign owned agencies were American, 15.4 percent British, and 7.7 percent were Canadian.
The Advertising Industry in Kenya has over the years developed sophisticated methods of advertising. In 1985 The Annual Association of Practitioners of Advertising Awards (APA) was introduced. The main focus of world trade organisations over the more recent period has been on opening up of telecommunications and on de-regulation of
the services sector of member nations (Bergsten, Sept 1997). The opening up of domestic media and telecommunication industry is a major focus of the International Advertising Association (lAA) congress recently held in Nairobi (13-16 October, 1997). In 1996 the Kenya Chapter of IAA was launched. Currently several foreign owned Media companies have applied for licenses to operate radio and TV stations. A foreign owned FM radio station, owned by an MNC, supported mostly by advertising revenue, has been operating on 24 hr basis from 1996. The Kenya Broadcasting Corporation has also set up a full-time FM radio station supported mostly by advertising revenues.
Diffusion of channels of advertising and trends and changes in the modes of advertising in Kenya.
The main channels of advertising in Kenya are radio, newspapers, television, magazines, point of purchase advertising, cinema or film advertising, and transit advertising (interior and exterior of public means of transportation such as buses). By 1977, a firm in Kenya operated 17 mobile theatres, each providing 29 shows per month at 464 towns and villages in throughout the agricultural areas of Kenya (Manley, 1977). The audiences averaged 2,00 per show and such media was extensively used to promote advertising. The firm also arranged for the distribution of advertising leaflets in exhibition areas.
Tables II.B and II.C (Statistical Appendix) report trends in daily newspaper circulation and annual sales of radio and television in Kenya for the period 1972 to 1996. Table II.B indicates that daily circulation of both English and Swahili newspapers increased up to 1989 after which there occurred significant decreases in daily newspaper circulation during the 1990s. Table II.C on the other hand shows a dramatic increase in the sales of new radios and television sets over the past two and a half decades. Especially significant is the sharp increase in the sales of both radio and television sets over the past three years - a period most closely identified with implementation of drastic liberalisatio'1 of the economy, and a period, therefore, in which Kenya's economy has been most open to the forces spurring on the globalisation process. Between 1995 and 1994 sales of radios increased by 620 percent and sales of television sets by 600 percent. In 1996 alone more television sets were sold than over a 19 year period (between 1972 and 1990).
Table 11.0 (Statistical Appendix) reproduced from (Langdo,l, 1981) indicates that in 1973 the main instrument used by MNCs for reaching the mass African consumer market was the Swahili (national language) radio-net work. The Table analyses advertising time and content monitored over varying eight hr periods (over a period of three weeks). The Table indicates that, in 1973, 81 percent of advertising over the swahili radio and 74 percent of advertising in the national press was by MNC subsidiaries and focused on promoting the consumption of beverages, pharmaceutical and cosmetic products, food products and a variety of manufactured products. The main channel of advertising in the 1970s were th2 radio and newspapers. ThE; increasing tre'1ds of newspaper circulation and radio sales shown in Tables II.B and II.C
corroborate the trends in advertising shown in Table 11.0 over the 1970s.
There is evidence, however, that ten years later, by 1983, of television having emerged as an important channel of advertising. Table II.E (Statistical Appendix) which shows the various services offered by advertising agencies in Kenya in 1983, indicate that about 85 percent of the agencies surveyed used television as a medium of advertising - a percentage which was similar to that of advertising through the radio. In the 1990s there is further evidence of increasing reliance on Television as a channel of advertisement. A study of the attitudes of middie class consumers towards advertising in Nairobi (Ahmed, 1992) ranked TV commercials as a source of 75 percent of consumer information, while 71 percent mentioned advertisements in newspapers and radio commercials as a source. (Table II.F Statistical Appendix).
Up until recently, out-door advertising (through billboards) was only allowed in public places such as railway stations and stadiums and was banned in most places in urban areas. A study (Odhiambo, 1986) found that only 10 percent of the advertising agencies surveyed did out-door advertising. However over the past three years billboard advertising has emerged as an important means of advertisement in urban areas in Kenya.
MNCs, as agents of the globilisation process, have played a prominent role in the emergence of the advertising industry. The MNC firms are the main advertisers in Kenya and also make up a higher proportion of the advertising agencies in Kenya. Secondly, the globalisation process has also influenced advertising modes in Kenya by changing media patterns in Kenya. Developments in communication technology, such as satellite television broadcasting have played a large part in the phenomenal sale of television sets in Kenya over the 1990s. The decline in daily newspaper circulation to a large extent can be explained by the spread of television and satellite TV broadcasting, and is indicative of trend in the spread of the main channel responsible for the diffusion of global culture.
Advertising trends and changes in local consumption patterns.
Many firms in Kenya engage in advertising to influence sales of their products. Waruingi (1982) indicated that expenditure on advertising in Kenya amounted to 0.5 percen: of GDP in 1974. Advertising expenditures in the country were put at Kshs 200 million in 1988 (Steadman, 1988). In 1990 (Steadman and Associates) put total adverting expenditure in Kenya at Kshs 395 million. Mwangi (1991) indicated that 66 percent of the respondents expected a likely future increase in their advertising budgets. In 1995 a total of Kshs 1.7 billion is said to have been spent on advertising. While advertising expenditures have been rising over the years, up until 1993, there no significant increase in advertising expenditures was registered (Steadman, October, 1997). The main factor behind the growth of advertising expenditures beginning 1993 has been the acceleration of liberalisation of Kenya's economy. In 1993, advertising expenditures grew by 10 percent in real terms. In 1994 there occurred a 40 percent
increase in advertising expenditure in real terms (Steadman, October 1997). This huge increase in advertising expenditure is linked to liberalisation of the economy which resulted in many new products entering the market and which has consequently resulted in an increase in advertising expenditures.
Corchoran and Tyrell (1979) found that more money was spent on foods and drinks than any other group of products. The seconds group of products were household supply, while soaps and paints took up the number three position. Out of the top ten advertisers only one of them (in ninth positicn) was a local firm (House of Manji) a producer of bakery products, the rest were mostly MNC subsidiaries (two of them foreign firms with some public or local share holding). Apart from presenting the general information on price and characteristics of the products the advertisements put emphasis on status "products are presented as being produrts which contribute toward status and smartness" (Langdon, 1981, pg 61).
Waruingi (1980) provides evidence that advertising does influence sales in Kenya. Out of 205 respondents surveyed (67 percent response rate). 50.6 percent mentioned advertising as a factor which influenced them to purchase a product. On the other hand up to 85 percent of the retailers surveyed agreed that advertising speeded up the introduction of new products and 59 percent of them agreed that advertisements often persuaded people to buy things they should not buy.
There is a dearth of empirical studies on the relationship between advertising and changes in consumption patterns in Kenya mostly due to data limitation. However (Oduor, 1989) found some statistical correlation (mostly on the basis of correlation coefficient) between advertising expenditure and sales volume of 97 percent of the products studied. The Study's data was obtained through a questionnaire completed by 34 advertising executives in Kenya and focused on the sale of fifty brand products. The Study used simple regression analysis with sale volume as the dependent variable and the product's advertising expenditure as the explanatory variable. The study found out that personal care items (beauty soaps and perfumes) had the highest number of positive relationships between advertising expenditure and sales volume, next were household items (dish-washing items, floor polish etc). third were beverages (such as soft drinks) and fourth were pharmaceutical products.
National Ideology/Policies and Consumption Patterns.
National development policy is enunciated in various Government publications (National Development Plans, Sessional Papers etc) and through various fora (Presidential addresses, Chiefs Barazas, official media etc). In the 1970s the "buy Kenya build Kenya slogan" was popularised in the media but it's principal focus was on domestically produced manufactured goods. The 4th national development plan (1979-83) marked another attempt at official policy in influencing consumption patterns. The plan advocated measures aimed at improvement of expenditure patterns as one of the means of alleviation of poverty. The Sessional Paper No. of 1986 also addressed the
issue of changing consumption patterns. The paper noted the increasing dependence on wheat as food product and sought to promote the consumption of Triticale (a high gluten wheat-rye cross - with higher yield than wheat in drier regions) as a substitute of imported wheat. The program sought to promote Triticale and sorghum breeding to produce marketable varieties for flour-milling. Despite the stated objectives nc attempt was done to use the state media to promote the consumption of Triticale.
Apart from the above mentioned attempts and some selected interventions (in areas such as promoting breast feeding instead of baby foods or selective intervention in promoting micro-nutrients) national development policy has not seriously addressed the consumption side or seriously attempted to influence consumption patterns - it has mostly adopted are laissez faire attitude to consumption issues. More recently (Decemb<;r 1994) Kenya producec' a National Plan of Action For Nutrition but the plan does not address, in any meaningful way, bring in the sustained utilisation of the state media in carrying dissemination campaign to improve consumption patterns in Kenya.
The role of the State Media in influencing consumption patterns.
An effective public media network can be used as a channel to create awareness and pass information related to influencing consumption patterns. The existing public media has the capacity to assist the Government in achieving such an objective. The Kenya Broadcasting Corporation (KBC) operates two Short-Wave stations, 3 FM stations and 5 Television stations (8th National Development Plan). Presently the KBC reaches 95 percent and 40 percent of the population through radio and television signals. By the year 2001, the Government plans to increase this coverage to 99 percent and 70 percent respectively (8th National Development Plan). The KBC currently broadcasts nationally in English and Kiswahili. The Corporation regional service also operates in 17 local languages. The current national development plan (1997-2001) also aims at modernising the Kenya Mobile Cinema Unit to play a major role in disseminating information in both rural and urban areas. With respect to the print media, currently the Ministry of information operates 11 rural press newspaper stations.
Since october 1987 the KBC corporation has been broadcasting health education programmes on a weekly basis, both in English and Kiswahili. Some of these programmes are aimed at influencing practices such as encouraging breast feeding among mothers and health information related to preventive health care. The potential of such programmes to educate and influence behaviour is borne out by a follow up survey of a radio programme on diarrhoeal disease which indicated significant increase in home treatment which reduced the incidence of infection (UNICEF, 1992). However compared to the time devoted to consumer related advertising by MNCs, the time devoted to educative programmes on state media is modest. Data available for 1992 indicates, for example, that only 1.1 percent of the time on the national Kiswahili service and 2.6 percent of the time in the English service were allocated to maternal and child health issues (UNICEF, 1992).
Legislation on consumer protection and rights and the formation of consumer organisations in Kenya.
Many of the laws relating to consumer protection in Kenya were inherited from Britain. Among such laws are: - The Sales of Goods Act, Prevention of Food Adulteration Act, The Drugs and Cosmetics Act, The Weights and Measures Act, The Trade Descriptions Act and the Price Control Act.
The beginnings of the consumer organisations in Kenya can be traced to 1953 with the formation of Housewives Consumer Organisation during the colonial period. Initially it's membership was limited to Europeans alone. Presently, the Housewives organisation has been converted to the Kenya Consumer Association (Kanyi, 1978). It was noted (Gaya, 1975) that by 1975 there was no well "organised, efficient and articulate consumer organisations as those that exist in Britain or United States. The only consumer organisation at that time was the Housewives Consumer Society which was unrepresentative in that it catered for a small segment of the urban people. Gaya identified several local circumstances which militated against the effective formation and operation of consumer groups. It was noted that factors such as widespread illiteracy, lack of sufficient funds, lack of consumer awareness of their rights and phobia to engage in litigation were some of the factors which rendered the consumer associations ineffective. Kanyi (1978) observed that among the objectives of the Kenya Consumer Association were to present consumer complaints against deceitful advertising and labelling in light of the proliferation of production and advertising of many manufactured products. Paying visits to factories was also listed as one of the protective activities of the Kenya Consumer Organisation. As in the earlier cited study Kanyi also observed that lack of consumer knowledge and the elitist nature of operation of the Kenya Consumer Association which confined it's activities to urban areas was an important factor in rendering the Association's work ineffective.
Objectives and modes of operation of consumer organisations in Kenya.
The Consumer Housewives Association as noted above was mostly confined to urban areas and from the beginning published a monthly magazine title "Contact" which was the main channel through which it used to provide services to its members. The main service appears (from perusal of it's publications) to have been publication of list of prices of various items available in the various stores; with the objective of guiding it's members on where to go for bargains. Members also used the Association's magazine as a channel to voice their complaints against various items through letters published in the magazine. A review of letters published in Contact and another weekly magazine (Wariungi, 1980) indicated that consumers complaints covered an array of products such as nails, screws, butter, cheese, milk, bottles, bed sheets, toilet paper, beer, and matches. The complaints were varied and had to do with, for example, adulteration,
spoilage, breakages, product defects and short weights. In 1988 the Kenya Consumer Association (KCA) came under new management. The new management succeeded in attracting financial assistance from the Ford Foundation up to 1993. From 1988 onwards the KCA managed to publicise consumer issues through the media. For example, with the assis~ance of the Public Law Institute, KCA took two Government Corporations - Kenya Posts and Kenya Power Corporation - to court over the hiking of postal and electricity charges. Among the issues publicised by the KCA were the dangers of high levels of mercury in beauty products, use of certain pesticides, and threats to the consumers from location of chemical factories (the most famous case was a chemical factory located in Thika which was polluting the environment and linked to strange ailments of the people living in the area). Presently the Kenya Consumer Organisation is non-operational (it's offices closed in June 1997) due to lack of finances). Currently another organisation - The Consumer Information Association has been registered but has not yet fully taken off.
The success/failure of consumer rights organisations in affecting consumption patterns in Kenya.
Consumer rights organisations have largely been unsuccessful in affecting consumption patterns in Kenya. As indicated above the main activities of the organisations focused more on consumer protection - for instance from sub-standard goods, expired goods, over charging etc. The Consumer organisations did not attempt to influence the purchase or consumption of certain foods which are for example rich in nutrients. In protecting the consumer from shoddy products the consumer organisations used media publicity and brought to the attention of the Kenya Bureau of Standards consumer complaints on quality of certain goods. Even in this area of consumer protection, the consumer organisation was severely hampered by lack of manpower with the technical expertise to sit in the many committees of the Kenya Bureau of Standards. The activities of the consumer protection organisations were also hampered by lack of finance and also lack of financial management. The activities of consumer organisations also appear to have been mostly based on urban areas due to financial constraints. The legal structure in Kenya also played apart in making the activities of consumer organisations ineffective. For example even when the consumer organisations succeeded in taking a retailer or a manufacturer to court, the fines or penalties levied were very low insignificant (often Kshs 2,000) and did not have any deterrence effect.
Kenya's Trade Policies and Their Effect On Consumption Patterns - 1963 to 1997.
During the first decade and over much of the second after independence Kenya continued with the policy of import substituting industrialisation (lSI) it inherited from the colonial period aimed at protecting domestic manufacturing firms from foreign competition. Kenya also continued, up to 1977 to be a member of a customs union with Uganda and Tanzania. With respect to agriculture, Kenya continued to promote cash crop production especially among small holders over much of the first and second
decade.
The initial change in trade policy during the first decade after independence was the replacement of tariffs by selective import quotas as the primary instrument of protection. The main shift in trade policy occurred much later - 4th National Development Plan (1979-1984) - which indicated govemment intention to move away from lSI strategy and reducing protection accorded to domestic industry. The trade reforms focused on two areas (i) the phased replacement of quantitative restrictions with tariffs and (ii) tariff rationalisation to provide a more uniform structure of protection. Problems with the BOP brought about by the oil crisis of 1982 brought about the re-introduction of many import controls. It has been observed that the initial attempt at (1979-84) reform resulted in an increase in the share of imports under the quota-free category from 24 percent in 1980 to 48 percent in 1985 (Swamy, 1994).
The second main shift in trade policy occurred in 1988, the focus was on further liberalisation of the import regime. More specifically, on the classification of imports into five schedules. Schedule I (unrestricted licensing) and four other schedules (Schedules II, lilA, IIIB, and IIIC) with progressively stricter licensing requirements. Over the years, automatic or unrestricted licensing was extended to schedules II, IliA, and IIIB. By 1991 quantitative restrictions affected only 22 percent of importable items compared with 40 percent in 1987.
The third and most significant shift in Kenya's trade policy occurred over the 1990s. Over this decade there has been significant liberalisation of the import regime. The budget for FY 1989/90 reduced the number of tariff categories from 25 to 17. In FY 1990/91 more was done to replace quantitative restrictions by tariffs - by moving a large number of Schedule III C items to IIIB. In FY 1991/92 the number of duty rates were reduced from 15 to 11 and the highest duty rate was lowered from 100 % to 70 percent. In the same year, as part of the import liberalisation policy, the average duty rate in Schedules I, II, IliA and IIIB were reduced by 5 percentage points. In FY 1992/93 the number of tariff bands were reduced from 11 to 9 and the top duty rate was reduced from 70 to 60 percent and all 60 percent rates to 50 percent. The budget for FY 1995/96 implemented significant changes in tariff classifications agreed upon with the World Customs Union (effective from 1 st January 1996). The 45, 30, and 20 percent import duty rates were each lowered by 5 percentage points. In FY (1996/97) further rationalisation of the import regime occurred with lowering of the top rate on import duty from 40 to 35 percent.
In terms of exports in 1988 Kenya began implementing measures to promote production of non-traditional exports (coffee and tea were the traditional exports) with the introduction of a manufacturing under bond scheme which was followed by an import duty/value added scheme in 1990. From 1992 to present Kenya has set up Export Processing Zones (EPZs)- currently 54 firms operate in the EPZ's.
With respect to the exchange rate regime. The Kenyan Shilling was tied to the US $
from 1971 to 1975. In 1986 a shift in the exchange rate regime occurred when the shilling was tied to the SDR. In October 1991 a significant step was taken towards creating a legal free market for foreign exchange with the issuance of foreign exchange bearer certificates under which anyone changing foreign currency not derived from exports was entitled to the certificate to be exchanged in the future at the ruling exchanse rate. In 1993 Kenya removed exchange controls and in 1995 the exchange rate of the Shilling against external currencies was left to be market determined after the Exchange Control Act was repealed.
The liberalisation of the trade regime and the opening up of the economy in Kenya has, to a very large extent, been influenced by agreements with the Bretton Woods institutions. The Second Structural Adjustment loan with the World Bank in 1982 and an agreement reached with the IMF in the same year had conditionalities related to import liberalisation. Many subsequent agreements with these two institutions have placed conditionalities aimed at influencing Kenya's trade policy and have focused on liberalisation of the import and exchange rate regimes. As noted In Section I above the globalisation process has been linked with the policies and influence of these two institutions.
Trade Policies and Consumption Patterns.
Trade policies affect consumption patterns in a country is various ways. The exchange rate for example determines the domestic price of imported products and therefore influences domestic consumption patterns. The extent of tariff protection or liberalisation of imports also influences domestic consumption as, other things given, it lowers the domestic price and increases the variety of imported goods. Trade policies also affect consumption patterns through their influence on domestic income.
Tables 1.0 and 1.1 below provide some evidence of the effects of the shifts in trade policies described above on domestic production of manufactured items and on domestic consumption of imported items. Table 1.1 indicates that the import liberalisation policy which was initiated from 1988 and accelerated during the 1990s has contributed to an increase in the volume of imports. Between 1996 and 1992, the period associated with the intensification of the import liberalisation in Kenya, the quantum index of non-oil imports increased by a phenomenal 90 percent. The previous highest rate of increase in the volume of non-oil imports over the past three decades (47 percent over 1978 and 1975) occurred during the coffee boom period. The Tables also indicate that the import liberalisation policies actively pursued over the 1990s have contributed to a reduction in the rate of growth of domestic manufactured output. Between 1996 and 1992, domestic production of beverages and tobacco declined for the first time reflecting competition from imports - the volume of imports of beverages and tobacco increased by 90.3 percent between 1990 and 1994. Table 1 .1 shows that domestic production of textiles declined over the 1990s (1996 to 1990) by a cumulative 48 percent while domestic production of clothing declined by 132 percent over the same period. The decline in clothing is explained by the increase

in the volume of imports of manufactured and miscellaneous manufactured articles (categories under which imported clothing and textiles are classified). Import liberalisation has also contributed to a wide variety of imported items into the country. For example over the past four years more than 20 variety of car makes have entered the domestic car market (Sept, KTN).
The phenomenal increase in the volume of non-oil imports over the 1 990s of about 140 percent and the dampening effect on growth of domestic manufacturing indicate that consumption patterns are increasingly favouring imported items. The trend implies underutilisation of domestic manufacturing capacity and lowering of income growth. The trend also has implications for income distribution favouring income of retailers and importers rather than workers in the domestic manufacturing sector.
Table 1.0 Cumulative Percentage Changes In The Quantum Index Of Selected Imports (1973 - 1996)
1975/ 1978/ 1985/ 1990/ 1994/ 1996/ 73 75 81 86 90 92
Beverages + 20.0 45.5 -54.7 37.7 90.3 43.0 Tobacco
Crude Materials, -21.8 8.4 -13.0 22.4 12.0 15.4 inedible
Mineral fuels 6.3 -1.8 -15.0 10.6 5.7 26.3
Animal + -16.3 66.6 3.6 33.9 17.3 24.4 vegetable oils & fats
Manufactured -33.6 45.4 -31.0 11.3 5.5 121.0 goods
Machinery + 1.0 46.6 -38.0 29.8 -17.7 54.0 Transport
Miscellaneous -18.0 27.2 -51.4 -6.6 56.1 78.5 manufactured articles
All imports -13.4 36.5 -27.1 17.8 21.0 56.0
Non-oil Imports -18.4 46.6 -29.0 22.3 26.0 89.4
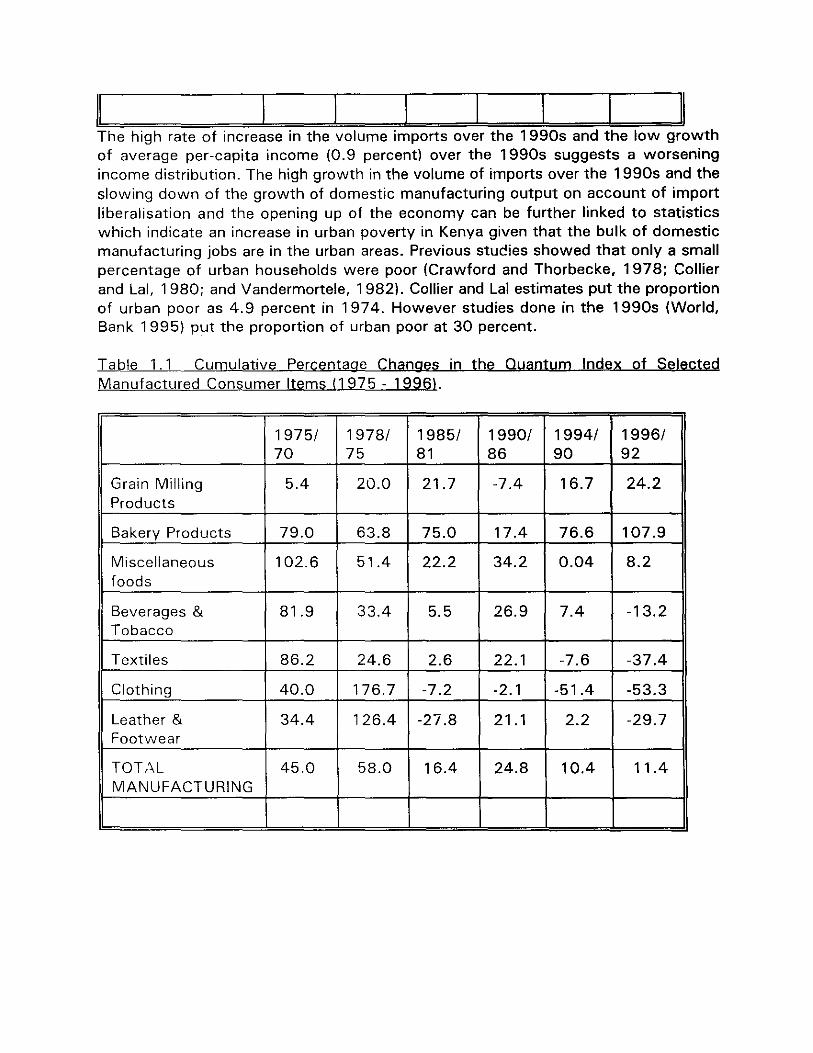
II II The high rate of increase in the volume imports over the 1990s and the low growth of average per-capita income (0.9 percent) over the 1990s suggests a worsening income distribution. The high growth in the volume of imports over the 1990s and the slowing down of the growth of domestic manufacturing output on account of import liberalisation and the opening up of the economy can be further linked to statistics which indicate an increase in urban poverty in Kenya given that the bulk of domestic manufacturing jobs are in the urban areas. Previous stuc!ies showed that only a small percentage of urban households were poor (Crawford and Thorbecke. 1978; Collier and Lal, 1980; and Vandermortele, 1982). Collier and Lal estimates put the proportion of urban poor as 4.9 percent in 1974. However studies done in the 1990s (World, Bank 1995) put the proportion of urban poor at 30 percent.
Table 1.1 Cumulative Percentage Changes in the Quantum Index of Selected Manufactured Consumer Items (1975 - 19961.
1975/ 1978/ 1985/ 1990/ 1994/ 1996/ 70 75 81 86 90 92
Grain Milling 5.4 20.0 21.7 -7.4 16.7 24.2 Products
Bakery Products 79.0 63.8 75.0 17.4 76.6 107.9
Miscellaneous 102.6 51.4 22.2 34.2 0.04 8.2 foods
Beverages & 81.9 33.4 5.5 26.9 7.4 -13.2 Tobacco
Textiles 86.2 24.6 2.6 22.1 -7.6 -37.4
Clothing 40.0 176.7 -7.2 -2.1 -51.4 -53.3
Leather & 34.4 126.4 -27.8 21.1 2.2 -29.7 Footwear
TOT,\L 45.0 58.0 16.4 24.8 10.4 11.4 MANUFACTURING
III. Changing Consumption Patterns and Their Effect on Human Development.
Changing consumption patterns impact human development through various channels. Changing food consurnption patterns may, for example, affect the nutritional content of the diet and subsequently affect health status. Changing consumption patterns may also affect human development through their influence on demand and consequently their influence on production and income structure. For example changing consumption patterns on imported products may reduce domestic production and income. The subsequent fall in income may thus exercerbate poverty and negatively impact many indicators of human development such as increase the prevalence stunting in children and lead to higher incidence of school drop out rates.
Presently about 80 percent of Kenya's population live in the rural areas and depend on agriculture on their livelihood. The Integrated Rural Survey (IRS) of 1974-75 indicated that small holder agriculture accounted for 75 percent of the population. The IRS 1974-75 also indicated that 70 percent of total employment was provided by the smallholders in Kenya. About 80 percent of the total land surface in Kenya is classified as Arid and Semi Arid Lands (ASAL). About 25 percent of Kenya's population are found in the ASAL areas. Food Consumption accounts for the bulk of household expenditure in both rural and urban areas of Kenya and is a major source of employment and income in Kenya (Greer and Thorbecke, 1986).
Changing Consumption and Income Patterns 19705-19905
Analysis of data from Integrated Rural Surveys (IRS) and Urban Household Budget Surveys permits one to trace changes in consumption and income patterns. The IRS-I (1974175), the Nairobi Household Budget Survey (1974) and the Urban Food Purchasing Survey (1977)' the Rural Household Budget Survey of 1981/82, the Urban Household Budget Survey (1982/83) and the Welfare Monitoring Survey II of 1994, A provide useful data which indicates changes in consumption and income patterns from the mid 1 970s to 1994.
The IRS-I indicated that rural households in 1974175 spent 78.5 percent of their household budget on food, 7.3 percent on clothing, 3.7 percent on manufactures, 2.6 percent on transport and 7.9 percent on other category (Table liLA -Statistical Appendix). The Table indicates that urban households spent about half of their income on food and, compared with urban households, almost four times as much on manufactured items. Table III.B (Statistical Appendix) shows a breakdown of food expenditure of rural household in 1974175 in terms of Kshs. Table III.C (Statistical Appendix) shows the allocation of food expenditure of urban household in 1977 in terms of percentages. A comparison of the Tables indicate that urban households consume a lower proportion of other cereals flour than rural households. Table III.C also shows that in 1977 Nairobi and Mombasa, the two main urban centres were consuming a higher percentage of their expenditure on cereals on wheat (around 18
percent) compared to 3 percent for Kisumu and Nakuru (the third and fourth largest urban centres).
In terms of sources of household income (Table 111.0 - Statistical Appendix) shows that in 1974/75 farm income (farm operating surplus) accounted for 62.5 percent of the income of rural households. Next was wage income which accounted for 15.6 percent of rural income while transfers (remittances, loans, and gifts) accounted for 12.1 percent and income from crafts 9.8 percent. Detailed analysis of IRS-I and Urban Household Budget Survey of 1974 (Vandermortele and Der Hoeven, 1982)indicated that urban households had a higher marginal propensity to consume (0.666) compared to rural households (0.451). The study also found a high import-content of nonagriculture sector employees and among professionals who spent a larger share of their income r;n imported manufacturer' consumer goods.
Table III.E (Statistical Appendix) shows average rural household expenditure by expenditure item in 1981/82. A comparison with Table liLA indicates that the share of rural household expenditure on food had fallen to 63.9 from 78.5. By 1981/82, rural households were spending a higher proportion (9.3 percent) of their expenditure on Households goods (mostly manufactured items) compared to 3.7 percent in 1974175. The Urban Household Budget Survey 1982/83 indicated that bread consumption was spreading among urban households. The survey indicated that in Kisumu bread consumption was the third important food item while maize flour was fourth. This can be contrasted with data from Table Ill.e which indicated that maize flour was the dominant food item in Kisumu in 1977. In terms of source of income Table III. F indicates that farm income accounted for 58.7 percent of rural household income in 1981/82 compared with 60.2 percent in 1974175. The Table also shows that the share of wages and salary as a source of income for rural household had increased to 21.4 percent in 1981/82 compared with 13.3 percent in 1974175.
The Welfare Monitoring Survey II of 1994 indicates further changes in consumption and income patterns. Table III. G and Table III.H (Statistical Appendix) shows mean monthly expenditure by broad categories in terms of Kshs and percentages respectively. Table III.H suggests that in 1994 the percentage of expenditure on manufactures had increased. The "other non-food share"(a category which includes manufactured items) accounted for 20.3 percent of household expenditure. The "Durables share" shown in Table mostly accounts for expenditure on house construction.
Table III.J and Table III.K (Statistical Appendix) show mean monthly household income from different sources in 1994 in terms of Kshs and percentages respectively. As indicated in Table III.K the share of total agricultural income declined to 30 percent in 1994 compared to 58 percent in 1981/82 (Table III.F) and 62.5 percent in 1974/75 (Table 111.0). By 1994, the share of wages in household income had increased to 51 percent. The rural household survey of 1981/82 (Table III.F) put the wage share at 21.4 percent. A comparison of Table III.F and III.K indicates a doubling of the share
of wages as a source of rural household income between 1982 and 1994. The rural wage share is proxied by provincial shares of fable III. K.
Changing Consumption Patterns and Human Development Status
The effect of changing consumption patterns in Kenya on human development indicators such income and nutritional status are many and varied. Firstly the change in reliance on a single food crop has negatively impacted nutritional status. As noted earlier by Wilson (1925), during the pre-colonial period, before the reliance on maize as the dominant food crop, the diets of many communities in Kenya were varied. Reliance on maize has resulted in food crops such as millet, sorghum and tubers such as cassava and sweet potatoes falling out of favour. Table III.L (Statistical Appendix) shows for example that between 1977 and 1988 maize production increased from 2,079 to 2,450 thousand metric tonnes while sorghum and millet production declined from 350 to 180 thousand tonnes. It is observed that many of the displaced food crops can be competitively grown in the arid and semi arid lands (ASAL areas) and the introduction of maize in such areas has seriously destabilised the staple food supply (UNICEF 1992). The first significant change of changing food consumption patterns in Kenya is related to the lowering of nutritional status by foregoing a varied diet and also by increasing the exposure of the population of ASAL areas to famine through discouraging demand and production of drought resistance crops.
Since food production is a major source of income among smallholders in Kenya changing consumption patterns especially between alternative food crops and between food and non-food expenditures have implications on income and income allocation. The increasing reliance on wheat as a food crop as an alternative to maize has important implications on income and nutritional status. As indicated by Greer and Thorbecke (1986) most of the wheat produced in Kenya is produced on large farms and also as noted by Crawford and Thorbecke (1978) the employment effects of wheat production are lower than those of maize. It was noted that maize production per hectare required 350 man hours compared to 70 hours for wheat production, i.e the employment effects for wheat were five times less than maize. Wheat production in Kenya is mostly grown on large farms rather than smallholdings, changing consumption patterns in favour of wheat imply worsening distribution of income in favour of owners of large wheat growing farms and against smallholder maize producers. The lower employment effects of wheat production also imply lower growth of income of rural agricultural workers. Table III.L indicates that between 1977 and 1988 wheat production increased from 166 to 207 thousand metric tonnes - representing a cumulative growth rate of 25 percent compared to 18 percent for maize over the same period.
The shifting consumption pattern in favour of wheat impact income and therefore welfare not only through the employment effects but also affects nutritional status directly. As indicated in Tables III.M and III.N which indicate monthly consumption patterns of the rural and urban poor in 1994, bread (which is a major wheat-based
food consumed) only provides 240 calories per 100g compared to 340 calories per 100g provided by maize. Despite being a nutritionally inferior food, consumers were paying (in 1982 prices) Kshslkg 4.38 for bread compared with Kshslkg 1.83 for maize. Bread thus cost the poor two and a half times more and provided them with 30 percent less calories per 100g th2n maize. The Tables thus provide telling evidence of the negative effect of shifting consumption patterns on human development status in Kenya.
Table IILP (Statistical Appendix) indicates that changing food consumption patterns have increased reliance on imported food crops such as wheat. As indicated by the Table, by 1996, wheat imports were almost four times greater than domestic production. In comparison in 1973 domestic production of wheat was one and a half times greater than imports. Domestic capacity for wheat production by the year 2,000 was put at 400,000 metric tonnes (Sessional Paper No.1 of 1986). As indicated in Table IILP over the past 5 years domestic wheat production has never exceeded 150,000 tonnes. Available data also indicate similar shortfalls between domestic production and consumption of sugar. In 1980 domestic production of sugar stood at 401 thousand tonnes while imports amounted to 107 thousand tonnes. By 1996 domestic production had decreased to 389 thousand tonnes and imports had increased to 226 thousand tonnes. The increasing reliance on consumption of imported food crops, is one of the factors which explains the decrease in the share of farm income of rural households indicated in Tables IILF and IILK.
Data from the IRS-I, Urban Household Budget Surveys of 1974 and 1982/83 and Welfare monitoring Survey II of 1994 indicates a growing trend in consumption of manufactured items. Tables 1.0 above provides evidence of an upward trend in the consumption of imported manufactures in Kenya, mostly as a consequence of import liberalisation. The increase in consumption of imported food may thus be linked to reduction of farm income discussed above and the increase in consumption of imported manufactured items may be linked to increase in the high incidence of poverty in urban areas. The World Bank Poverty Assessment Report (1995) indicates that the proportion of the population below the food poverty line of (2,250 calories) increased from 34.5 to 37.4 percent. A recent Survey (Participatory Poverty Assessment II - A Methodological Research, 1997) indicates that when respondents were asked to compare current poverty situation with that of five years ago, 70 percent or more of households indicated a worsening situation. A recent Study (World Bank Poverty Assessment Report, 1995) indicates that the bottom expenditure decile has a (net) pri mary school enrolment ratio of only 62 percent.
There is also evidence that a worsening income distribution over the 1990s compared to 1980s. The Gini-coefficient based on expenditure for rural areas increased from 0.4 in 1982 to 0.49 in 1992 indicating a worsening income distribution. Statistics on Income Distribution (World Development Report 1997) indicate a worsening income distribution in favour of the richer segments of the population as the share of the highest 20 % in 1992 increased to 62.1 percent compared with 60.4 percent in 1976
while that of the highest 10 % increased to 47.7 percent compared to 45.8 percent over a similar period. The worsening income distribution and the increase in poverty witnessed over the current decade - a decade of rapid liberalisation of the economy to competitive forces of global market place - threatens to compromise the considerable success in school enrolment achieved in the past decades. Data collected for the World Bank report (1995) shows that 32 to 63 percent of househo:js had one or more child who had dropped out of school - the predominant reason being lack of school fees.
IV. CONCLUSION
· It may be concluded that the globalisation process has to a large extent contributed to changes in lifestyles and consumption patterns in Kenya. MNCs in Kenya have been the main advertisers in Kenya and many of the advertising agencies have
themselves been subsidiaries of foreign MNCs.
· This paper provides evidence which indicates substantial changes in consumption patterns in Kenya. Among the main changes has been increasing reliance on
consumption of wheat as a food crop. Table 1.1 above indicates that the quantum index of manufacturing of bakery products (wheat based food products) has been increasing at a phenomenal rate. Langdon (1981) cites Unga Limited - the main producer of wheat flour in Kenya - as a major advertiser on the national radio. Waruingi (1980) cites House of Manji - the main producer of bakery products in Kenya as being among the top ten advertisers.
· This paper provides evidence of an increasing trend towards consumption of manufactured goods - especially of manufactured imports. Indications are that the trend is not due to increases in income (growth of real per-capita income has been stagnant over much of the past two decades) but is due to in large part to
liberalisation of the import regime and the influence of advertising - which as noted in Table - has focused mostly on manufactured items - including beer and
beverages and some manufactured food items.
· There is evidence that trade policy has been passive in as far as protecting domestic manufacturing and employment. Tables 1.0 and 1.1 indicate that over the 1990s -the period associated with the accelerated opening up of the economy to global
economic forces- there occurred slowing down and negative growth of some sectors of domestic manufacturing. This development can be linked to statistics which
indicate a rise in urban poverty.
· The decl.ine in the share of farm income as a source of income of rural smallholders can also be linked to the globalisation process and a passive domestic trade policy. In the late 1970s Kenya's sugar industry was relatively accorded a high level of
protection - with a nominal protection coefficient of 1.98 (Biswanger 1983). In the early 1980s domestic production was sufficient to meet domestic demand. From
the mid 1 980s onwards imports of sugar have been increasing - reflecting to a large extent failure to provide enough protection to domestic sugar industry. Currently
statistics indicate that Nyanza Province - a major sugar producer has a high incidence of poverty compared to the national average .
. Consumer protection organisations have been largely ineffective in protecting consumer rights due to financial constraints which have hampered their
effectiveness. The legal structure has also not been supportive of consumer protection in Kenya. There is little evidence that the consumer organisations have attempted to actively influence consumption patterns there have concentrated mostly on consumer protection.
. Government policy (and state idealogy) has also not been effective in influencing consumption patterns. There is no evidence that the Government media has been used in a concentrated manner to effect broad changes in consumption patterns.
Finally, there is evidence (World Bank 1997) of increasing inequality of income as during the 1990s and also of poverty (World Bank 1995). These trends have been associated with a period of closer integration of Kenya's economy within the global economy.
V. APPENDICES AND TABLES
VI. BIBLIOGRAPHY - E. J. Hobsbawn, The Development of The World Economy, Cambridge Journal of Economics, Vol 3, 1997.
- Peter Dicken, The Internationalisation of Economic Activity, Chapman Publishing House, 1992 - D. Rodrick, Has Globilisation Gone Too Far 7, Institute of International Economics,
Washington D.C, 1997. - P. Drucker, The Changed World Economy, Foreign Affairs, Vo1.64, pp 768-91. - H. Daly, Steady State Economics: The Economics of Biophysical Equilibrium and Moral Growth
- World Economy: A Survey, The Economist 20th - 26th September 1997. W. Cline, Trade. Jobs and Income Distribution, Institute of International Economics, Washington D.C, 1997.
- Africa: 1990 -1995 And Beyond: Draft Report, Global Coalition For Africa, June 1995.
- G. Harriss, The Globilisatlon of Advertising, International Journal of Advertising pp 223-34, 1984.
- Hatchen W.A, Mass Media in Africa, in A. Wells (ed) Mass Communications: A World View, National Press BOOk, Palo Alto, 1974.
- C. Cherry, World Communication: Threat or Promise 7, Wily Chicester, 1978.
- K. Kumar (ed) Transnational Enterprises: Their Impact on Third World Societies and Cultures, West View Press, Boulder, pp 109-36.
- H. Binswanger and L. ScandizZD, Patterns in Agricultural Protection. Agricultural Research Unit Discussion Paper No.15, World Bank, Nov 1987.
- W. Adam, Green Development: Environment and Sustainability in The Third World, London, Routledge, 1990.
- J. Marete, Environmental Degradation in Nairobi: A Case Study, Thesis, University of Nairobi, 1987. - J. Sachs, The Limits of Convergence: Nature. Nurture. and Growth, The Economist,
June 14th 1997. - Collier and Lall, Labour and Poverty in Kenya:1900-1980, Clarendon Press, Oxford,
1986. - G. Kitching, Class and Economic Change in Kenya: The Making Of An African Petite-Bourgeoisie: 1905-1970, New Haven, Yale University Press.
- N. Swainson, The Development of Corporate Capitalism in Kenya: 1918-1977. Heinman London, 1982.
- Colin Leys, Underdevelopment in Kenya: The political Economy of Neo-colonialism, General Printers Ltd, Nairobi, 1975.
- R. Kaplinsky, Readings on The Multinational Corporation in Kenya, Nairobi, Oxford University Press.
- S. Langdon, M.N.C's. Taste Transfer and Underdeyelopment, Review of African Political Economy,2, Spring 1975.
- M. Manley, Marketing in Kenya, Us Dept of Commerce, 1977. - C. Waruingi Advertising and Advertising Attitudes in Kenya, Journal of African Management, Vol 10, Oct 1982.
- R. Steadman, Media Monitoring: Annual Report, 1988. - K. Hellenier, The Role of MNC's in LDCs Trade in Technology. World Development,
1: 7,1973. - The Pattern of Income, Expenditure and Consumption of Africans in Nairobi, 1957 (58, Colonial Government Report, 1959
- B.F. - Expenditure Patterns in the Central Province of Kenya: A Preliminary Analysis, IDS Paper, University of Nairobi.
- J. Heyer, Household Expenditure in Nairobi: A Statistical Analysis of Consumer Behaviour, Economic and Cultural Change 17 (2) pg 212-234, Jan 1969.
- E. Whitelaw" Nairobi Household Survey: Some Preliminary Results, IDS MP Paper No. 117, University of Nairobi.
- M. Cowen, Notes On Capital, Class and Household Production, IDS MP Paper No. 84, University of Nairobi.
- R. Ascroft, F. Chege, J. Kariuki and N. Roling, Accelerating The Flow of New Ideas to Rural People: A Proposal for A Pilot Extension Training Project in Nyeri, IDS Paper No. 133, University of Nairobi.
- I. Livingstone, Economic Irrationality Among Pastoral Peoples Myth or Reality?, IDS Paper, University of Nairobi.
- R. Gaya, Sale of Goods and Consumer Protection in v enya , Thesis, University of Nairobi, 197 r:;.
- B. Waruingi, The Consumer and The Marketing System in A Developing Country: Kenya, Thesis, Bloomington University, Graduate School of Business, 1980.
- M. Harper, The Discovery and Satisfaction of The Perceived and Actual Needs of Rural Shopkeepers in Kenya, IDS Research Paper, University of Nairobi.
- Radio Broadcasting: Kenya, Kenya Broadcasting Commission Report, Govt Printer, 1954.
- Sessional Paper No.4 of 1957/58 : Broadcasting Development, Government Printer. - Kenya Ministry of Information and Broadcasting. Annual Report, Govt Printer, 1965 - A. Hawkins, Radio and Television Times 1959-1962, Nairobi, 1962. - Corcoran and Tyrell, Nairobi, Kenya Media Advertising Review. - A. Akinyi, A Comparative Case Study to Determine The Extent to Which Two Registered Consumer Co-operative Societies in Nairobi Area Haye Met Their
Objectives. Thesis, University of Nairobi, 1984, - Nairobi Housewives Consumer Organisation, lIus, Monthly, - G. Kanyi, Consumer Protection in Kenya, With Special Reference to The Sale of Goods Act, Hire-Purchase Act and Socio-Economic Legislation, Thesis, University of Nairobi, 1978,
- N, Ngethe, W. Mitullah and M, Ngunyi, Non-Governmental Organisation: Local Capacity Building and Community Mobilisation, IDS WP No. 469, April 1990,
- G, Otieno, An Action Research Carried out in Kikuyu, Gitaru, Riruta, and Waithaka to Evaluate Effectiveness of "Yakupasao Kujua" Radio Programme, Thesis, University of Nairobi, 1980.
- T, Rose, UNICEF Sponsored Radio Programme: Listnership and Education Impact: Evaluative Report, University of Nairobi, 1975,
- M. Ogutu, Advertising Agencies: Their Nature and Operations, M,B.A Thesis, 1983 - K. Mwangi, The Practice of Evaluating Advertising Effectiveness in Kenya, M.B.A Thesis, University of Nairobi, 1991.
- J. Odhiambo, Advertising timing Strategy: The Practice in Kenya, M.B.A Thesis, University of Nairobi, 1986.
- P. Oduor, The Relationship Between Advertising Expenditure and Sales Volume For Selected Products M.B.A Thesis, 1989.
- C.J Wilson, Native Diets, Kenya Medical Journal, 2, 1925. - First Report of the Committee on Nutrition in Colonial Empire, H.M.S. Govt, London
(1939). - R. Paterson. Nutrition and Agriculture, East African Medical Journal (17), 1940, - Likirrani, Inadequacy of Protein Food, Report of National Nutrition Seminar, 1973, - W. Mugo, Health Problems in Urban Areas in C, Vogel, S. Muller, S, Odingo, Z. Onyango, and J, Quinn, Health and Disease in Kenya, Kenya Literature Bureau,
1974. - B. Melville, Are Land Availability and Cropping Patterns Critical Factors in
Determining Nutritional Status?, Food and Nutrition Bulletin 10 (2): 44-48. - M. Shah and H. Fromberg, Food Consumption Patterns in Rural and Urban Kenya,
International Institute for Applied Systems Analysis, 1980. - H. Meilninck, Agricultural Pricing Policy in Kenya: Scope and Impact, FNSP Research
Report, 1987.
- H. Rempel and J. House, The Determinants of the Changes in the Structure of Wages and Employment in the Manufacturing Sector of the Kenya Economy, IDS
Research Paper No 150, University of Nairobi. - G. Neumman and G. Harrison, Onset and Evolution of Stunting in Infants and Children: Examples from the Human Nutrition Collaborative Research Support.
Kenyaand Egypt Studies, European Journal of Clinical Nutrition 48 (Supp 1). - A. Jansen, T. Horelli and J. Quinn, Food and Nutrition in Kenya: A Historical Review. - J. Greer and E. Thorbecke, Food Poverty and Consumption Patterns in Kenya,
iLO,1986 - S. Maxwell and R. Fankenberger, Household Food Security: Concepts and Indicators. Measurements: A Technical Review, New York/Rome, UNICEF/IFAD.
- A. Bigsten, Welfare and Economic Growth in Kenya, 1914-76, World Development, 12(10),1976.
- A. Oketch, Kenya's CoallFuel Oil Substitution potential:lmplications to Dependence On Imported Oil and The Economy's Adjustment Capability, IDS WO No. 404,
University of Nairobi. - G. Swamy, Kenya: Patchy. Intermittent Commitment, Adjustment in Africa: Lessons from Country Cases Studies. The World Bank, Washington D.C, 1994. - E. Stewart and D. Ghai, Statistics on Income Distribution in Kenya, Staff Paper No.
25, IDS, University of Nairobi. - M. Hodd, Income Distribution in Kenya. 1963 -72, Journal of Development Studies,
12 (3) April 1978. - J. Vandermoortele Income Distribution and Poverty in Kenya: A Statistjcal Analysis,
Discussion Paper No. 275, IDS, University of Nairobi. - T. Kmetowick and P. Webley, Statistical Allalysis of Income Distribution in Central
Province of Kenya. Eastern Africa Economic Review, 7 (2) December 1975. - A. Hazelwood, Income Distribution and Poverty- An Unfashionable View, in Killick (ed) Papers on the Kenyan Economy: Performance Problems and Policies, Heinmann, 1981.
- J. Od2da and J. Otieno (eds) Socio-Economic p~ofiles, Kenya, 1990. - J. Vandermortele, Kenya Data Compendium: 1964-1982, April 1984. - Long Range Planning Division, Historical Economic Data For Kenya, 1991. - ILO, Employment. Incomes and Equality: A Strategy For Increasing Productive
Employment In Kenya, 1972. - Integrated Rural Survey 1974-75 : Basic Report, 1977. - Child Nutrition in Rural Kenya, 1977 - The Integrated Rural Surveys 1976-79 : Basic Report, 1981. - UNICEF, Report of the Child Nutrition Survey, 1978-79, 1982. - UNICEF, Third Rural Child Nutrition Survey 1982, Dec 1983. - UNICEF, Situation Analysis of Children and Women in Kenya, Vol. 1-4. - SOCial Indicators: Selected Data on Social Conditions in Kenya, Dec 1985. - Rural Labour Force Survey, 1988. - Rural Household Budget Survey 1981182, Chapter 3, Economic Survey 1988. - Fourth Rural Child Nutrition Survey, Sept 1987 - UNICEF, Children and Women in Kenya: A Situation Analysis, Vol. 1-4, 1992.
- National Household Welfare Monitoring and Evaluation Suryey, Chapter 3, Economic Survey 1993.
- Welfare Perspectives, Chapter 3, Economic Survey 1994. - Welfare Monitoring, Fifth Child Nutrition, Chapter 3, Economic Survey 1995. - African Socialism and it's Application to Planning in Kenya, Govt Printer 1985. - Sessional Paper No.1 of 1986 On Economic Management For Renewed Growth, Government Printer, 1986.
- Sessional Paper No 1 of 1994 on Recovery and Sustainable Deyelopment to the year 2010, Government Printer, 1994.
- Various Issues of Statistical Abstracts, C.B.S, Republic of Kenya. - Various Issues of Economic Surveys, C.B.S, Republic of Kenya. - Various Issues of Kenya National Deyelopment Plans - World Bank, Kenya Poverty Ass'lSsment Report No. 13152 KE. March 1995. - Various Issues of UN/World Bank Agency Reports and Publications. - Various Sessional Papers. Republic of Kenya
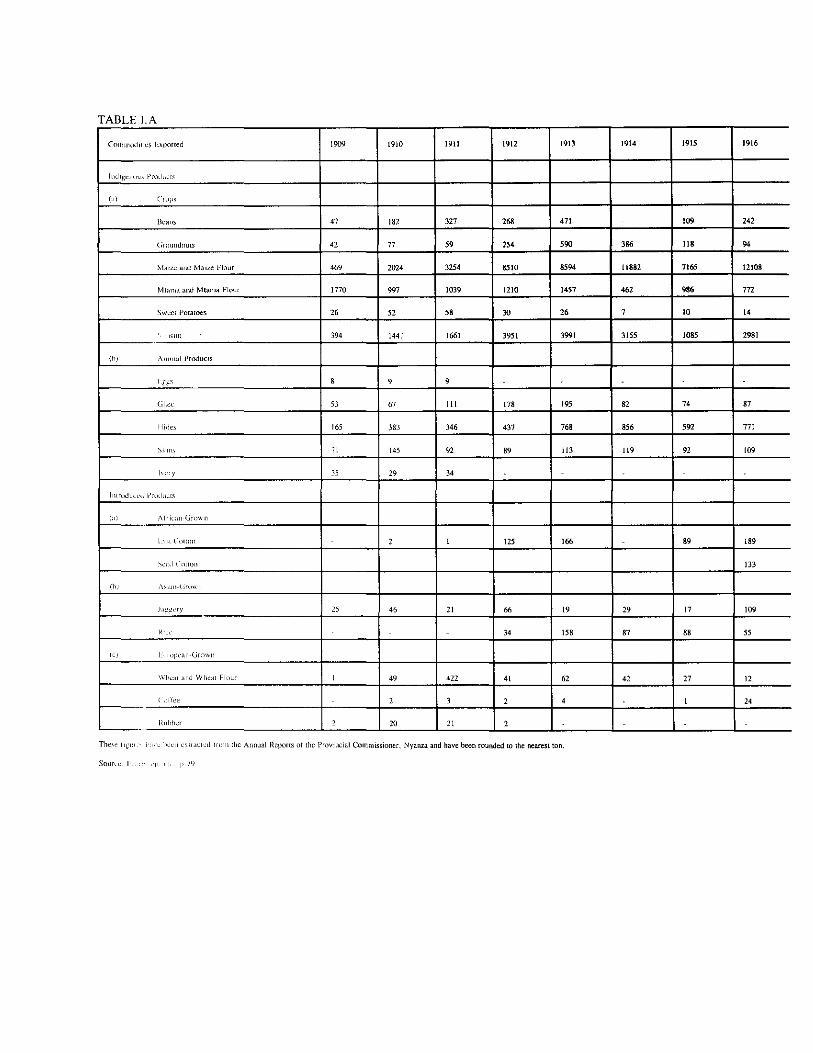
TABLE I A
C(llllln(l<hll~S !,xported 1909 1910 1911 1912 1913
]",hl(clIu,,, Prod,,([;
("I ("Ujll
Jle~lls 47 182 327 268 471
(irOlIlUiIlU[S 42 n " 254 590
Ma,w and Mall.C Flour 469 2024 3254 8510 8594
MI,11lla and Mtanla Flour 1770 m 1039 1210 1457
SW~C[ Potatoes 26 52 58 30 26
<"111111 394 144; 1661 3951 3991
(h) A,"mal I'roduc(s
I fl." 8 9 9
(;ILt:~ 5) 67 111 178 195
II,de' 165 383 346 437 768
"""" 71 145 92 89 113
h,"I' 35 29 34
l,llroJucl'(: l'rudu~ls
(;1) 1\lr !Call (jrowil
i_'"I("()ilOIi 2 I 125 166
\,',-.1 ( oilOLl
(\>1 ,\,,,,,,·(,"'''''1
I"~f'~ry 25 46 21 66 19
R'Lc' 34 158
,e, i_,II"i'l'JII·(jro"ll
\\'I,~a[ ami Wll~"t Flour I 49 422 41 62
("llee 2 3 2 4
I<"hl,,"' 2 20 21 2
Th~,e II~I"
Source_ I,
lc'"" nll,rued IrOllllllc Allllual R~ports 01 the I'rovlllClal Commissioner, Nyafl1.a and have been rourKled 10 the nearest (on,
I' 79
1914 1915 1916
109 242
386 118 94
11882 7165 12108
462 986 772
7 10 14
3155 1085 2981
82 74 87
856 592 771
119 92 109
89 189
133
29 17 109
87 88 55
42 27 12
I 24
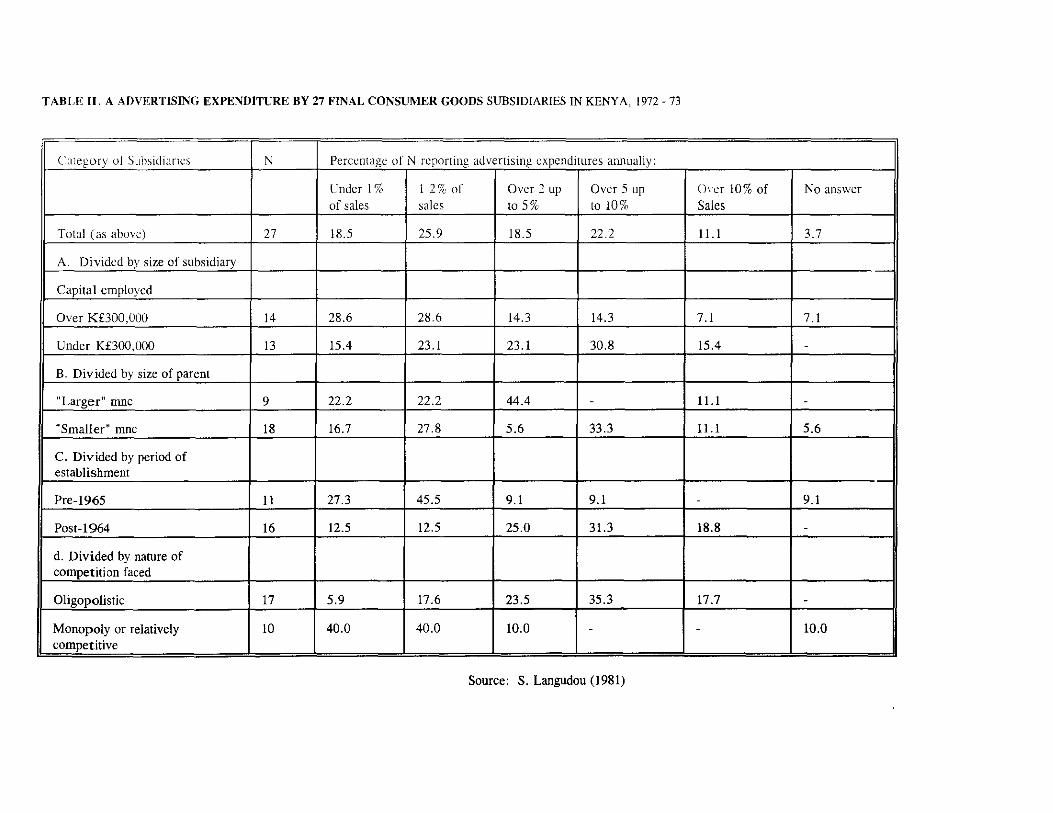
TABLE II. A ADVERTISING EXPENDITURE BY 27 FINAL CONSUMER GOODS SUBSIDIARIES IN KENYA. 1972 -73
('alegor)/ or Subsidiarit:s N Percentage of N reponing advertising expenditures annually:
Under 1% 1-2 % of Over 2 up Over 5 up 0, or 10% of No answer of sales sales 105% to 10% Sales
Total (as above) 27 18.5 25.9 18.5 22.2 11.1 3.7
A. Divided by size of subsidiary
Capital employed
Over K£300.000 14 28.6 28.6 14.3 14.3 7.1 7.1
Under K£300.000 13 15.4 23.1 23.1 30.8 15.4 -
B. Divided by size of parent I I
"Larger" rnnc 9 22.2 22.2 44.4 - 11.1 -
"Smaller" mne 18 16.7 27.8 5.6 33.3 11.1 5.6
C. Divided by period of establishment --
! Pre-1965 11 27.3 45.5 9.1 9.1 - 9.1
Post-1964 16 12.5 12.5 25.0 31.3 18.8 -
d. Divided by nature of competition faced
Oligopolistie 17 5.9 17.6 23.5 35.3 17.7 -
Monopoly or relatively 10 40.0 40.0 10.0 - - 10.0 ~J2etitive
._-
Source: S. Langudou (1981)
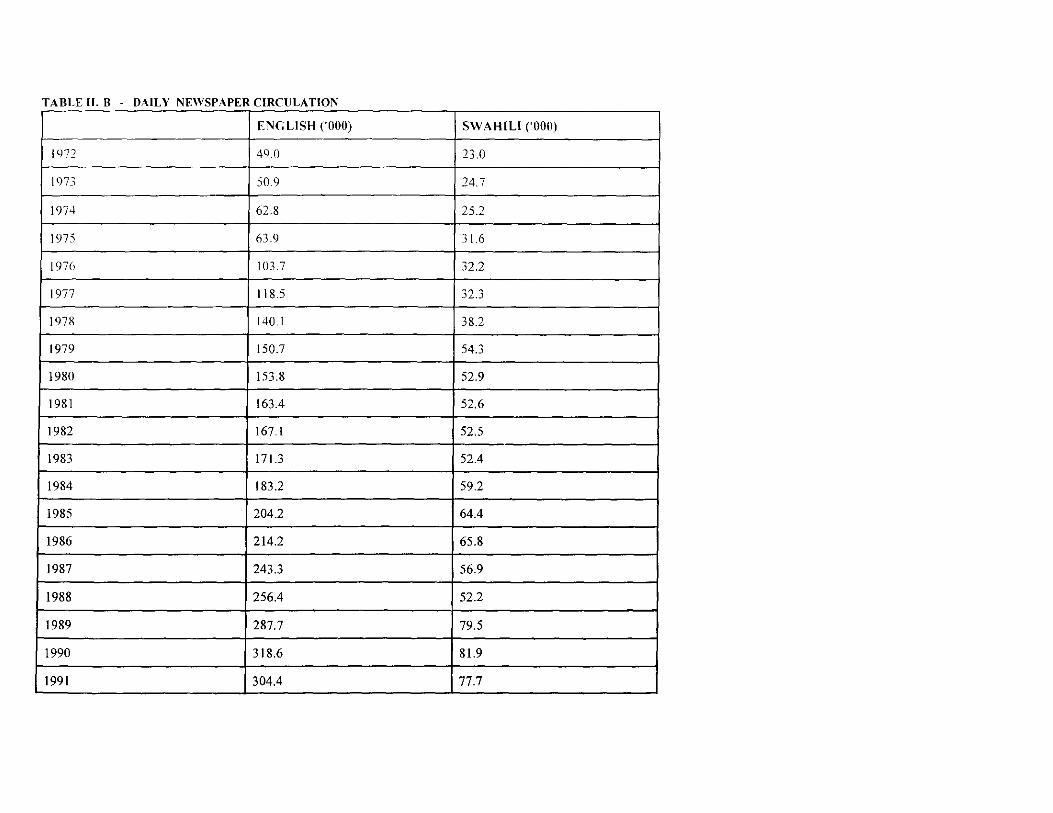
TABLE II. B . DAILY NEWSPAPER CIRCliLATION
ENGLISH ('000) SWAHILI ('000)
ILJ72 49.0 23.0
1973 50.9 24.7
1974 62.8 25.2
1975 63.9 31.6
1976 103.7 32.2
1977 118.5 32.3
1978 140.1 38.2
1979 150.7 54.3
1980 153.8 52.9
1981 163.4 52.6
1982 167.1 52.5
1983 171.3 52.4
1984 183.2 59.2
1985 204.2 64.4
1986 214.2 65.8
1987 243.3 56.9
I 1988 256.4 52.2
1989 287.7 79.5 ,
1990 318.6 81.9
1991 304.4 77.7 --
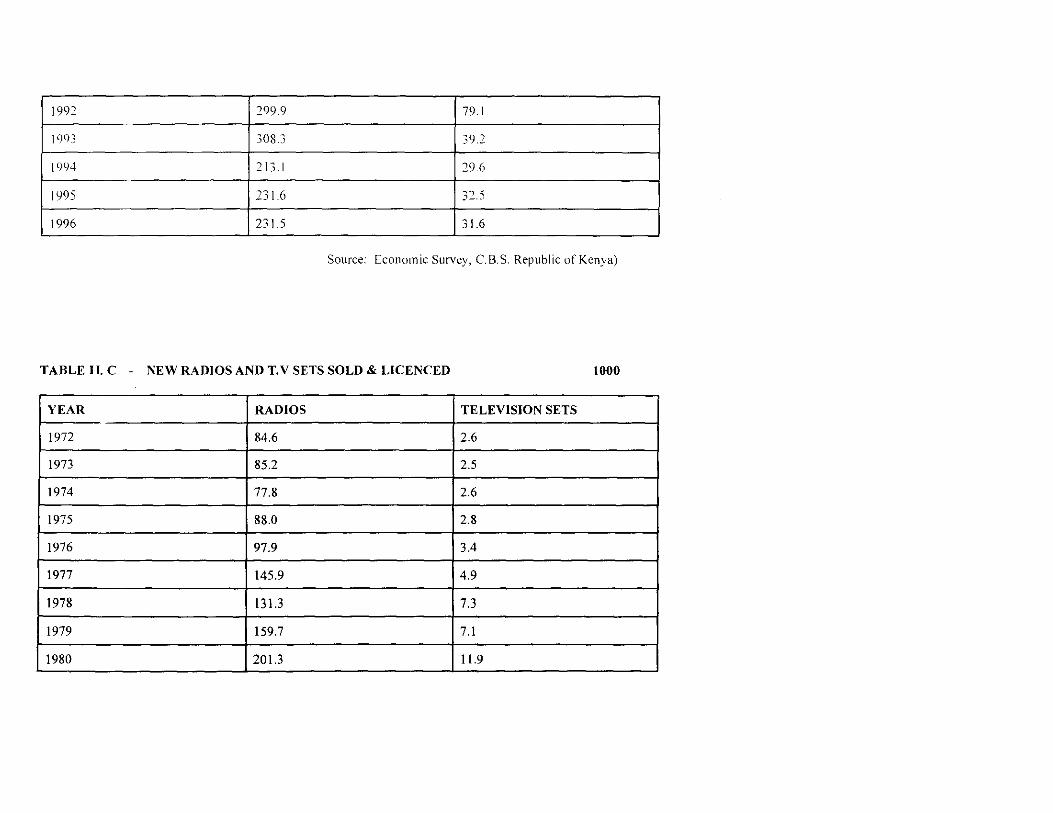
1992 299.9 79.1
199J 308.3 39.2
199<1 213.1 29.6
1995 231.6 32.5
1996 231.5 31.6
Source: Economic Survey, c.B.S. Republic of Kcnya)
TABLE II. C - NEW RADIOS AND T.V SETS SOLD & LICENCED 1000
YEAR RADIOS TELEVISION SETS
1972 84.6 2.6
1973 85.2 2.5
1974 77.8 2.6
1975 88.0 2.8
1976 97.9 3.4
1977 145.9 4.9
1978 131.3 7.3
1979 159.7 7.1
1980 201.3 11.9 - - - - .- - - _ ... _.- - -
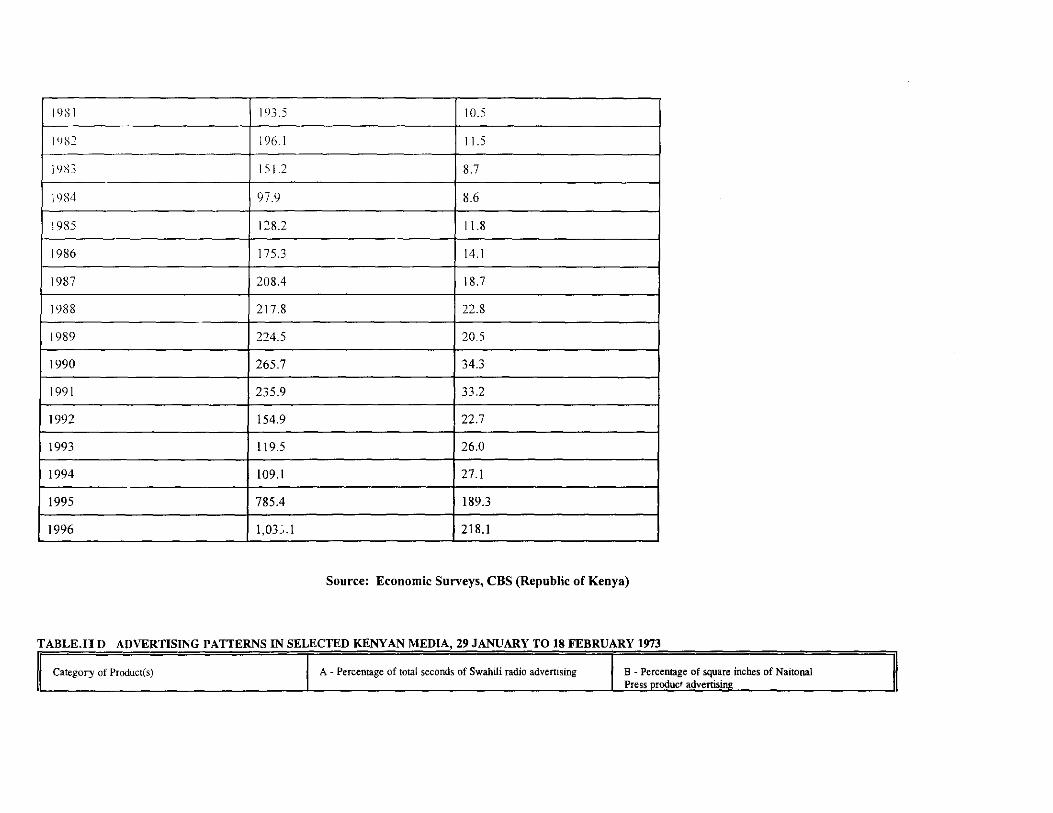
1981 193.5 10.5
]9t)2 196.1 11.5
]l)X3 151.2 8.7
1984 97.9 8.6
1985 128.2 11.8
1986 175.3 14.1
1987 208.4 18.7
1988 217.8 22.8
1989 224.5 20.5
1990 265.7 34.3
1991 235.9 33.2
1992 154.9 22.7
1993 119.5 26.0
1994 109.1 27.1
1995 785.4 189.3
1996 1,03~.1 218.1 I - - - .- - - - - - -
Source: Economic Surveys, CBS (Republic of Kenya)
TABLE.II D ADVERTISING PATTERNS IN SELECTED KENYAN MEDIA, 29 JANUARY TO 18 FEBRUARY 1973
Category of Product(s) A - Percentage of total seconds of Swahili radio advertising B - Percentage of square inches of Naitona1 Press proQ.uct agvertisjng ._
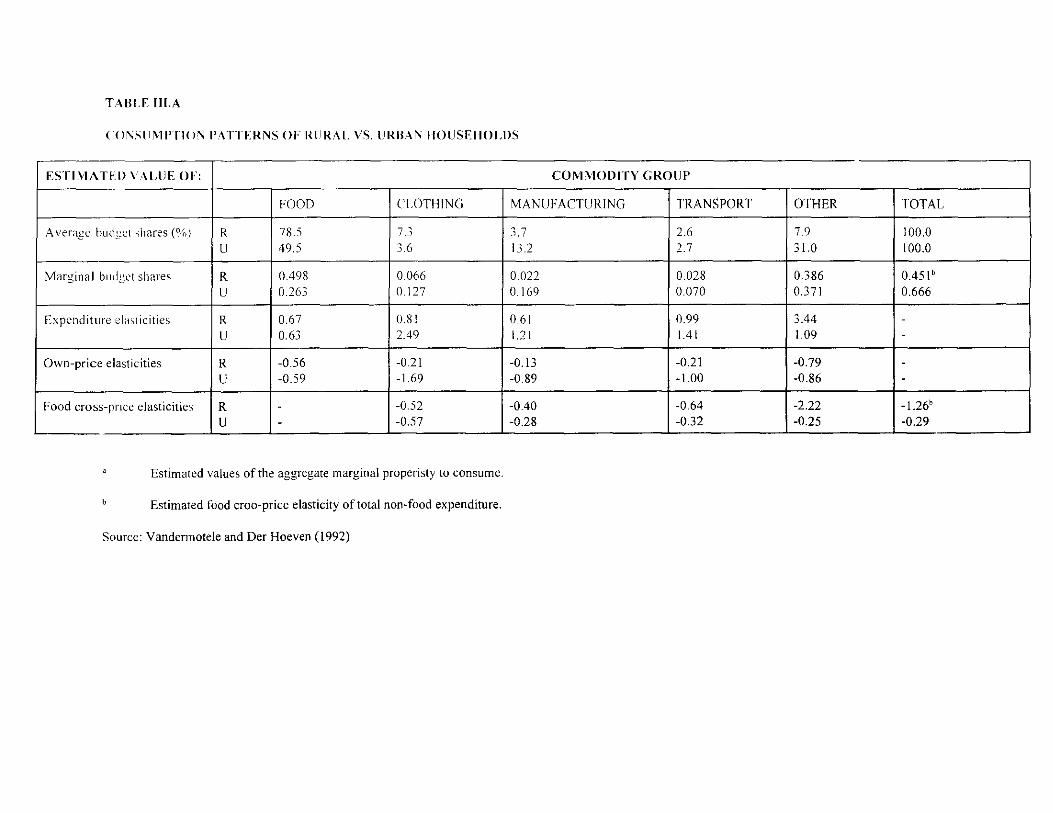
TABU: liLA
C()r-,.'II~lI'TI()'1I'ATTER'IS OF IWRAL VS. URBAI\ HOl!SEIIOLDS
ESTIMATED \ALLIE OF: COMMODITY GROlJP
FOOD CLOTHING MANUFACTURING TRANSPORT OTHER TOTAL
A veragc budget "hares (%) R 78.5 7.3 3,7 2.6 7.9 100.0 U 49.5 3.6 13.2 2.7 31.0 100.0
Marginal budget shares R OAn 0.066 0.022 0.028 0.386 0.451 b
l! 0.263 0.127 0.169 0.070 0.371 0.666
Expenditure claqicities R 0.67 0.81 0.61 0.99 3.44 -
l! 0.63 2.49 1.21 1.41 1.09 -
Own-price elasticities R -0.56 -0.21 -0.13 -0.21 -0.79 -U -0.59 -1.69 -0.89 -1.00 -0.86 -
Food cross-price elasticities R - -0.52 -0.40 -0.64 -2.22 -1.26b
l! - -0.57 -0.28 -0.32 -0.25 -0.29 ~-- - --
Estimated values of the aggregate marginal properisty to consume.
Estimated food croo-price elasticity of total non-food expenditure.
Source: Vandermotele and Der Hoeven (1992)
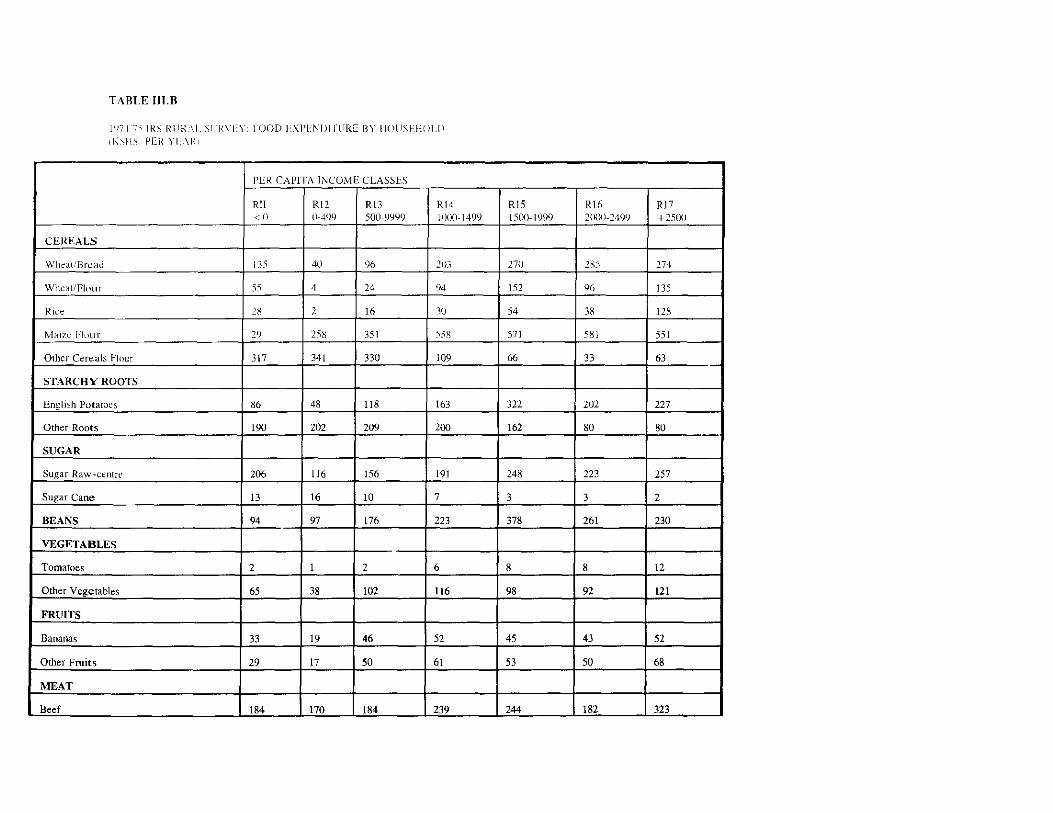
TABLE IIJ.B
1'17-1- 7~ IR.S Rtll{ \1. Sl-RY!":)" !"()OD FXl'El\IJI !'lIRE BY IIUl.ISU-l()l.IJ {f\.'iIlS PER YEAI':I
PER CAPrL\ I0ICO,\lE CLASSES
RlI R12 RI3 RI4 <() 0-499 500-99YY 1000-1499
CEREALS
Wllt',ll/Bn:ad ]35 40 96 203
\V!lt::ttiFI(lllr 5:'1 4 24 94
Rice 2H 2 16 ]0
M,IIZC Flour 29 258 351 :"58
Other Cereals Flour 317 341 330 109
STARCHY ROOTS
English Potatoes 86 48 118 163
Other Roots 190 202 209 200
SUGAR
Sugar Raw-centre 206 116 156 191
Sugar Cane 13 16 10 7
BEANS 94 97 176 223
VEGETABLES
Tomatoes 2 1 2 6
Other Vegetables 65 38 102 116
FRUITS
Bananas 33 19 46 52
Other Fruits 29 17 50 61
MEAT
I Beef 184 170 184 239
RI5 Rio RI7 1500-1999 2000-249lJ +2500
270 2:-:5 274 ,
152 96 135 ,
54 3g 128
571 581 551
66 33 63
322 202 227
162 80 80
248 223 257
3 3 2
378 261 230
8 8 12
98 92 121
45 43 52
53 50 68
244 182 323
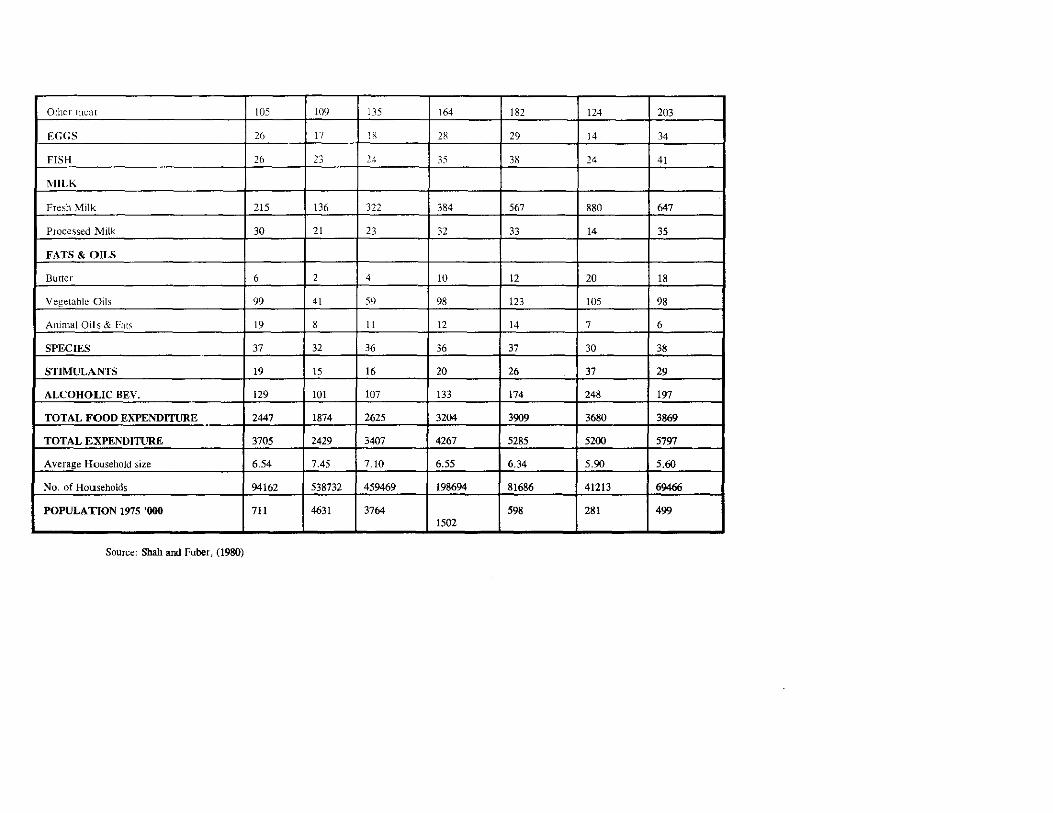
Other 111t:<l1 105 109 135 164 182 124 203
E(;(;S 26 17 1 S 2R 29 14 34
FISH 26 23 24 35 38 24 41
MILK
Fresh Milk 215 136 322 384 567 880 647
Processed Milk 30 21 23 32 33 14 35
FATS & OILS
Burter 6 2 4 10 12 20 18
Vegetable Oils 99 41 59 98 123 105 98
Animal Oils & Fats 19 8 11 12 14 7 6
SPECIES 37 32 36 36 37 30 38
STIMULANTS 19 15 16 20 26 37 29
ALCOHOLIC BEV. 129 101 107 133 174 248 197
TOTAL FOOD EXPENDITURE 2447 1874 2625 3204 3909 3680 3869 -TOTAL EXPENDITURE 3705 2429 3407 4267 5285 5200 5797
Average Household size 6.54 7.45 7.10 6.55 6.34 5.90 5.60
No. of Households 94162 538732 459469 198694 81686 41213 69466
POPULATION 1975 '000 711 4631 3764 598 281 499
-------- L.- __ -------_ 1502 ___
~ ---- -- - '--- .-
Source: Shah and Fuber, (1980)
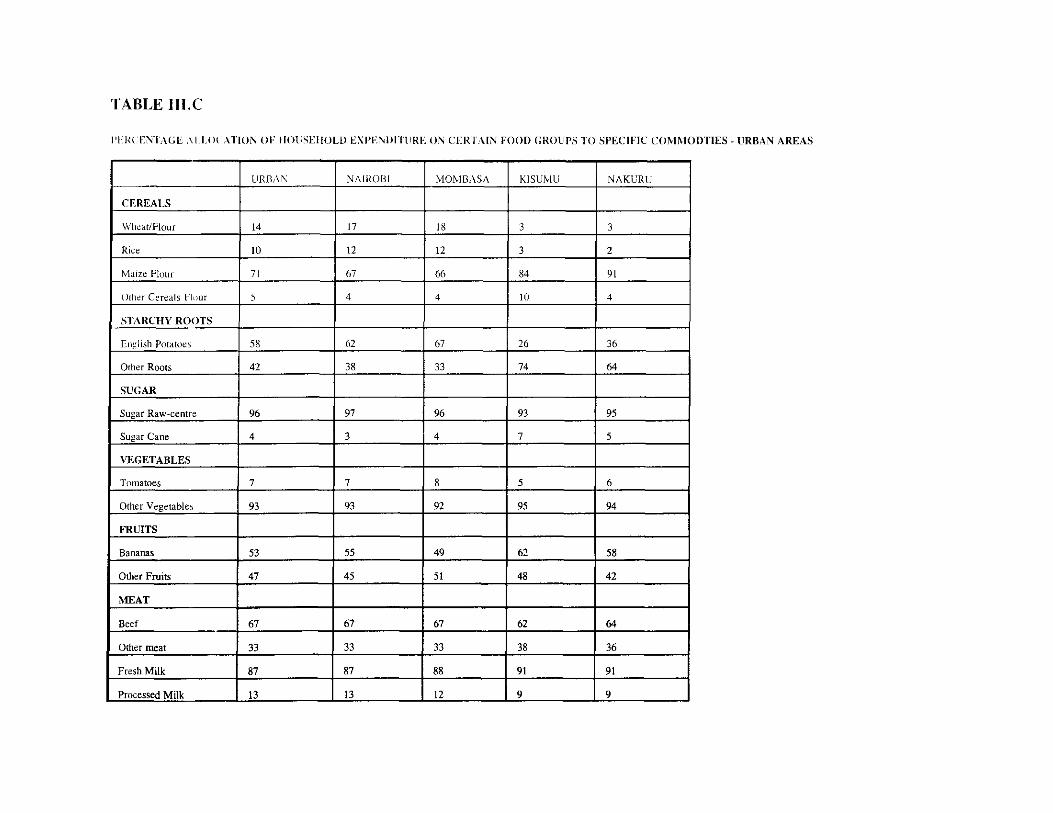
TABLE m.e
I'FHCENT,\(;E ,\I.t()(',-\TiOl\ OF II()l;SEI!OLU EXPEi\DITlIRE Ol\ CERTAI:"-i FOOD (;ROLIPS TO SPECIFIC COMJ\IODTIES - URBAN AREAS
URB,\)\ NAIROBI MOMBASA KISUivlU NAKURU
CEREALS
Wllcat/Flour 14 17 18 3 3
Rice 10 12 12 3 2
Maize Flour 71 67 66 84 91
Otha Cereals HLm[ 5 4 4 10 4
STARCHY ROOTS
EI1~lish Potatoe~ 58 62 67 26 36
Other Roots 42 38 33 74 64
SVGAR
Sugar Raw-centre 96 97 96 93 95
Sugar Cane 4 3 4 7 5
VEGETABLES
Tomatoes 7 7 8 5 6
Other Vegetable~ 93 93 92 95 94
FRUITS
Bananas 53 55 49 62 58
Other Fruits 47 45 51 48 42
MEAT
Beef 67 67 67 62 64
Other meat 33 33 33 38 36
Fresh Milk 87 87 88 91 91
Processed Milk --- 13 13 12 9 9
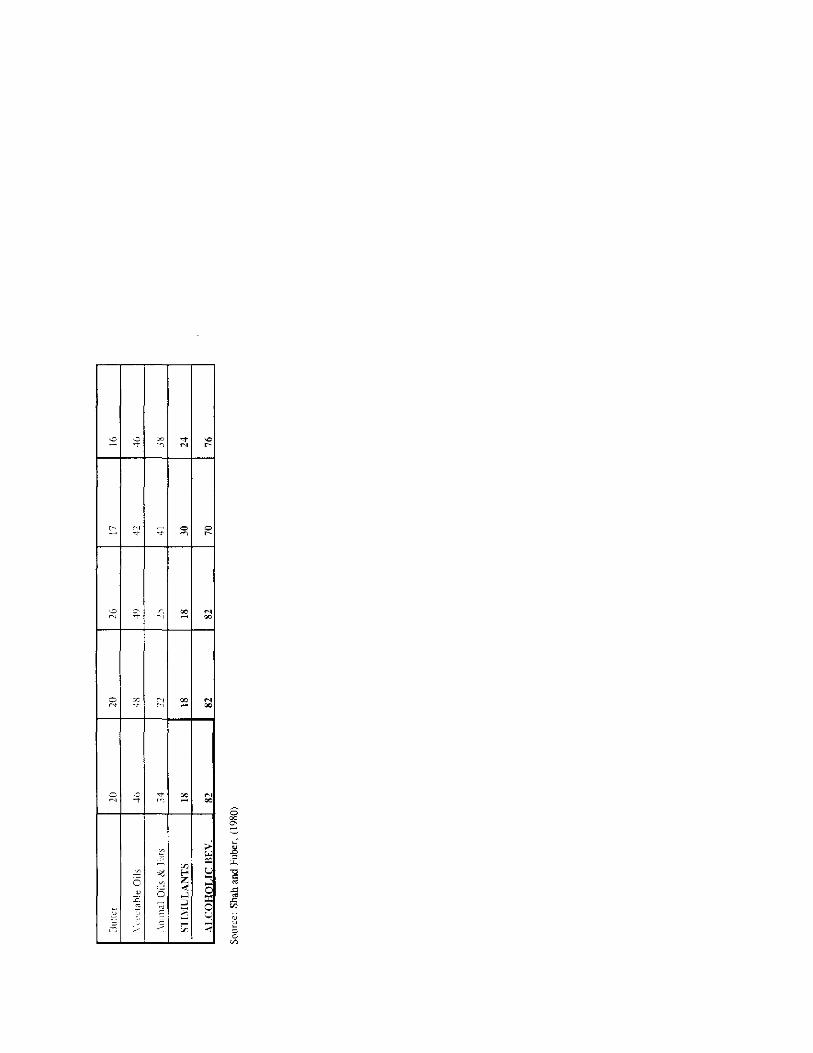
'" ~ " ~ N ., " ~
8 00
2:
'" i
i " en "' - '"
,... -g 0 ;-: • " 0 .. "' ,.., • :c =: "' ~ , g on
.~ ~
" i: ~
~ ..J
" "' z ., " 0
'"
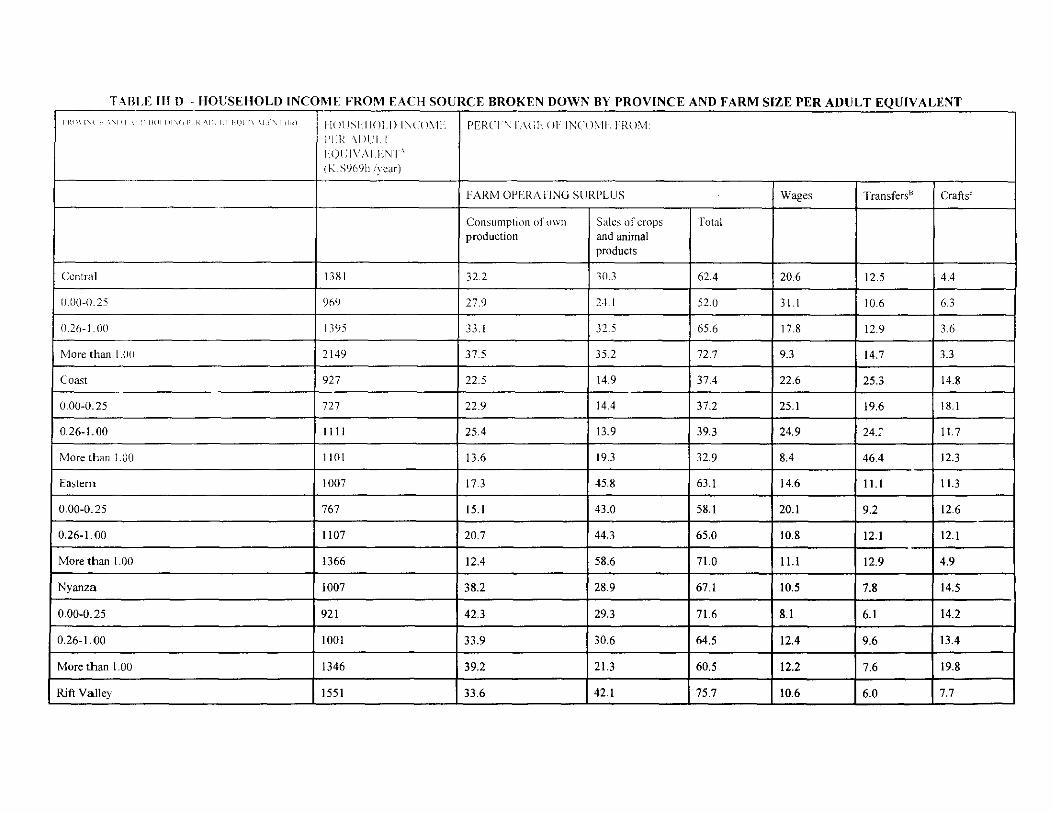
TABLE III D - HOUSEHOLD INCOME FROM EACH SOURCE BROKEN DOWN BY PROVINCE AND FARM SIZE PER ADULT EQUIVALENT
I'I({)\ I\.( -I \\.1) I "11101 Ill,(, 1'1 I{ ·\1)1 I I f-I}l-[\ -\)I-'\.I ,1,,0) IIOI! SIII()I.I) I"C(lol L PERCI "1,\(;1,. OF Ii':C(),1i FR(),1 1)L1~ \1 WI. I I<)I:I\',\[LN [' ( K.Sl)()9h,,/ycar)
FARM OPERA liNG SlIRPLlIS Wages Transfers fl Crafts"
Consumption or own Sales of crops rota1 production and animal
products
Central 1381 32.2 30.3 62.4 20.6 12.5 4,4
0.00·0.25 96'J 27.9 24.1 520 31.1 10.6 6.3
0.26-1.011 1395 33.1 32.5 656 17.8 12.9 3.6
More than l.OU 2149 37.5 35.2 72.7 9.3 14.7 3.3
Coast 927 22.5 14.9 37.4 22.6 25.3 14.8
0.00-0.25 727 22.9 14.4 37.2 25.1 19.6 18.1
0.26-1.00 1111 25.4 13.9 39.3 24.9 24.7 IL7
More than 1.00 1101 13.6 19.3 32.9 8.4 46.4 12.3
Eastern 1007 17.3 45.8 63.1 14.6 ILl ILl
0.00-0.25 767 15.1 43.0 58.1 20.1 9.2 12.6
0.26-1.00 1107 20.7 44.3 65.0 10.8 12.1 12.1
More than 1.00 1366 12.4 58.6 71.0 11.1 12.9 4.9
Nyanza 1007 38.2 28.9 67.1 10.5 7.8 14.5 I
0.00-0.25 921 42.3 29.3 71.6 8.1 6.1 14.2
0.26-1.00 1001 33.9 30.6 64.5 12.4 9.6 13.4
More than 1.00 1346 39.2 21.3 60.5 12.2 7.6 19.8
Rift Valley 1551 33.6 42.1 75.7 10.6 6.0 7.7 - - - -- - - ._- .. _- ----- - -- -- .. - - -
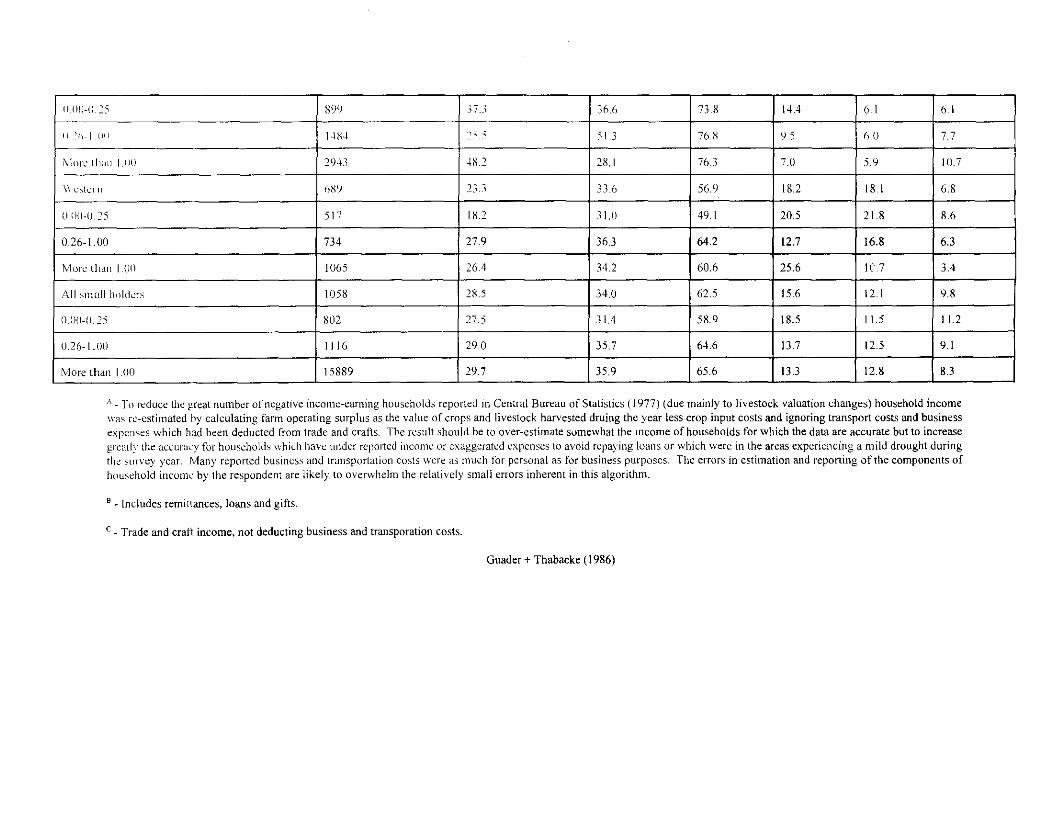
() ()(I-(L:5 gS/y 37.3 .16.6 7].8 14.4 61 6.1 ~--
11.:11-1 III1 1484 :: "i. ~ 51.3 768 9.':; h.O 7.7
i\ lure t I1dl1 l.lI() 29-1-3 ~g.2 28.1 763 7.0 5.9 111.7
\\ C~lcI II 6XY r· _.1 .. 1 33.6 56.9 18.2 18.1 6.8
(l.(j()-(J.25 517 182 3UI 49.1 20.5 21.8 8.6
0.26-1.00 734 27.9 36.3 64.2 12.7 16.8 6.3
i\lorc than l.on 1065 26.4 34.2 60.6 25.6 IU 3.4
All :'ll1all hol(krs 1058 28.5 34.0 62.5 15.6 12.1 9.8
O.()()-O.15 802 27.5 31.4 589 18.5 11.5 11.2
U.26-I.OO 1116 29.0 35.7 64.6 13.7 12.5 9.1
More than 1.00 15889 29.7 35.9 65.6 13.3 12.8 8.3
A _ To t"l'duce the ~reat number of negative income-earning households reported in Central Bureau of Statistics (1977) (due mainly to livestock valuation changes) household income was fe-estimated hy calculating farm operating surplus as the value of crops and livestock harvested druing the year less crop input costs and ignoring transport costs and business expenses \vhich had been deducted from trade and crafts. The result should be to over-estimate somewhat the iOcome of households for which the data are accurate but 10 increase greatl) the accuracy for households which have under rcpolted income or exaggerated expenses to avoid repaying loans or \vhich were in the areas experiencing a mild drought during the survey year. Many reported business and transportation costs \Vere as much for personal as for business purposes. The errors in estimation and reporting of the components of household income by the respondent are likely to overwhelm the relatively small errors inherent in this algorithm.
B w Includes remittances, loans and gifts.
C _ Trade and craft income, not deducting business and transporation costs.
Guader + Thabacke (1986)
-
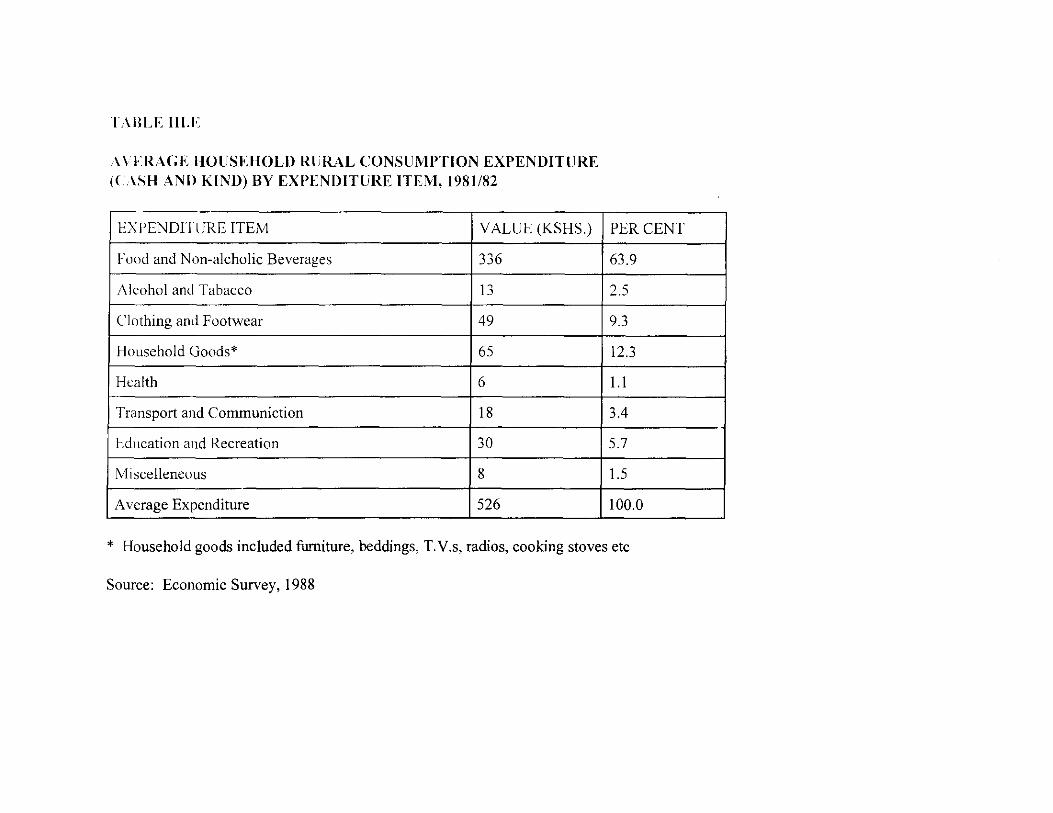
T\BLE lilY
A \ERAGE HOUSEHOLD RURAL CONSUMPTION EXPENDITURE (C\SH AND KIl\"D) BY EXPENDITURE ITEM, 1981182
EXPENDITURE ITEM VALUE (KSHS.)
Food and Non-alcholic Beverages 336
Alcohol and Tabacco 13
Clothing and Footwear 49
Household Goods' 65
Health 6
Transport and Communiction 18
Fducation and Recreation 30
Miscelleneous 8
Average Expenditure 526 - ._- --- ._---
PERCENT
63.9
2.5
9.3
12.3
l.l
3.4
5.7
1.5
100.0 - .-
• Household goods included furniture, beddings, T. V.s, radios, cooking stoves etc
Source: Economic Survey, 1988
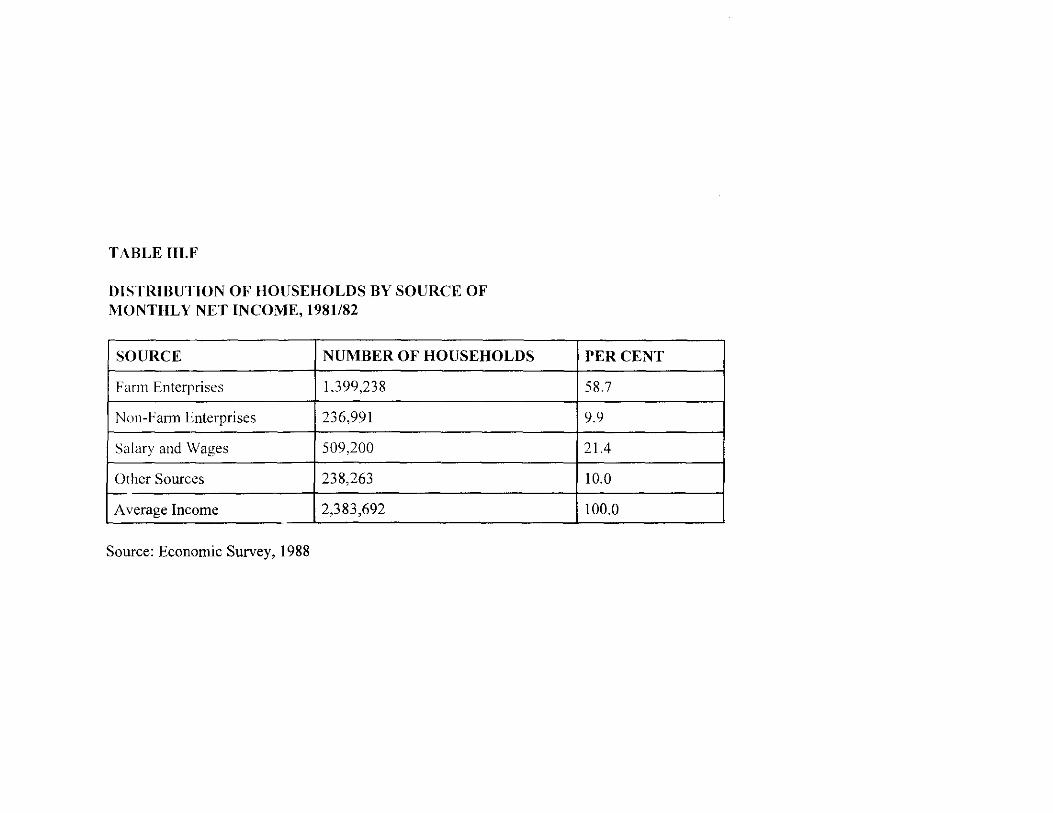
TABLE III.F
DISTRIBUTION OF HOUSEHOLDS BY SOURCE OF MONTHLY NET INCOME, 1981182
SOURCE NUMBER OF HOUSEHOLDS
Farm Enterprises 1.399,238
Non-Fann Enterprises 236,991
Salary and Wages 509,200
Other Sources 238,263 -Average Income 2,383,692
Source: Economic Survey, 1988
PERCENT I
58.7
9.9
21.4
10.0
100.0
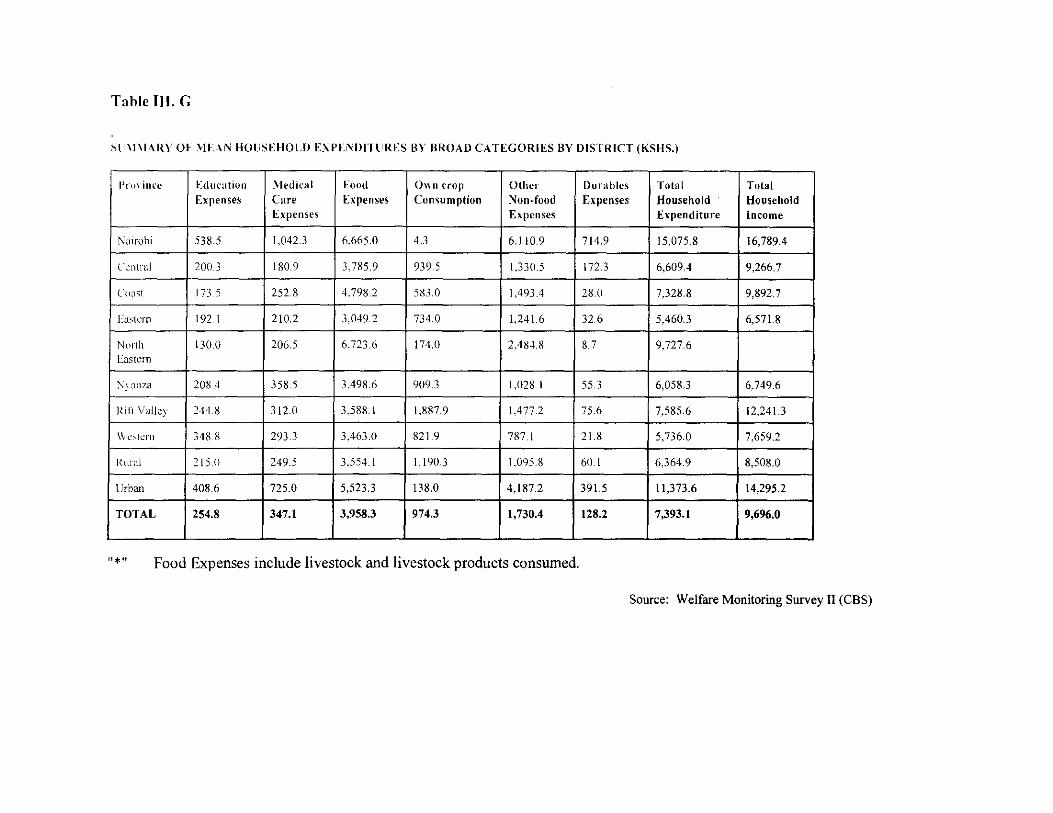
Table lIT. G
Sll\I\lAI{\ Of .'11 AN HOliS[HOLlJ EXPENIJITl'RES BY BROAIJ CATEGORIES BY DISTRICT (KSHS.)
Province Educatiull j\-Ieliic<i I Food OWII crop Other Durablcs Total Total Expenses; Care Expenses Con'lurnption Non-food Expenses Household HQusehold
Expenses Expenses Expenditure Income
Nairobi 538.5 1.042.3 6,665.0 4.3 6.110.9 714.9 15,075.8 16,789.4
Central 200.3 180.9 3.785.9 939.5 1.330.5 172.3 6,609.4 9,266.7
( '()(l~t 1735 252.8 4.798.2 5nO 1,493,4 28.0 7.328.8 9,892.7
!:aslcrn 192.1 210.2 3,049.2 734.0 1,241.6 32.6 5,460.3 6,571.8
Nllrlh 130.0 206.5 6.723.6 174.0 2.484.8 8.7 9,727.6 Eastern
:\) (lllza 208.4 358.5 3,498.6 909.3 1,1l28 I 55.3 6,058.3 6.749.6
Rih ValJey 244.8 312.0 3.588.1 1,887.9 1.477.2 75.6 7,585.6 12,241.3
W("tern 348 X 293.3 3.463.0 821.9 787.1 21.8 5,736.0 7,659.2
Rllral 215_0 249.5 3.554.1 1.1903 1,095.8 60.1 6.364.9 8,508.0
Urban 408.6 725.0 5,523.3 138.0 4,187.2 391.5 11,373.6 14,295.2
. TOTAL 254.8 347.1 3,958.3 974,3 1,730.4 128.2 7,393.1 9,696,0
tI*!t Food Expenses include livestock and livestock products consumed.
Source: Welfare Monitoring Survey II (CBS)
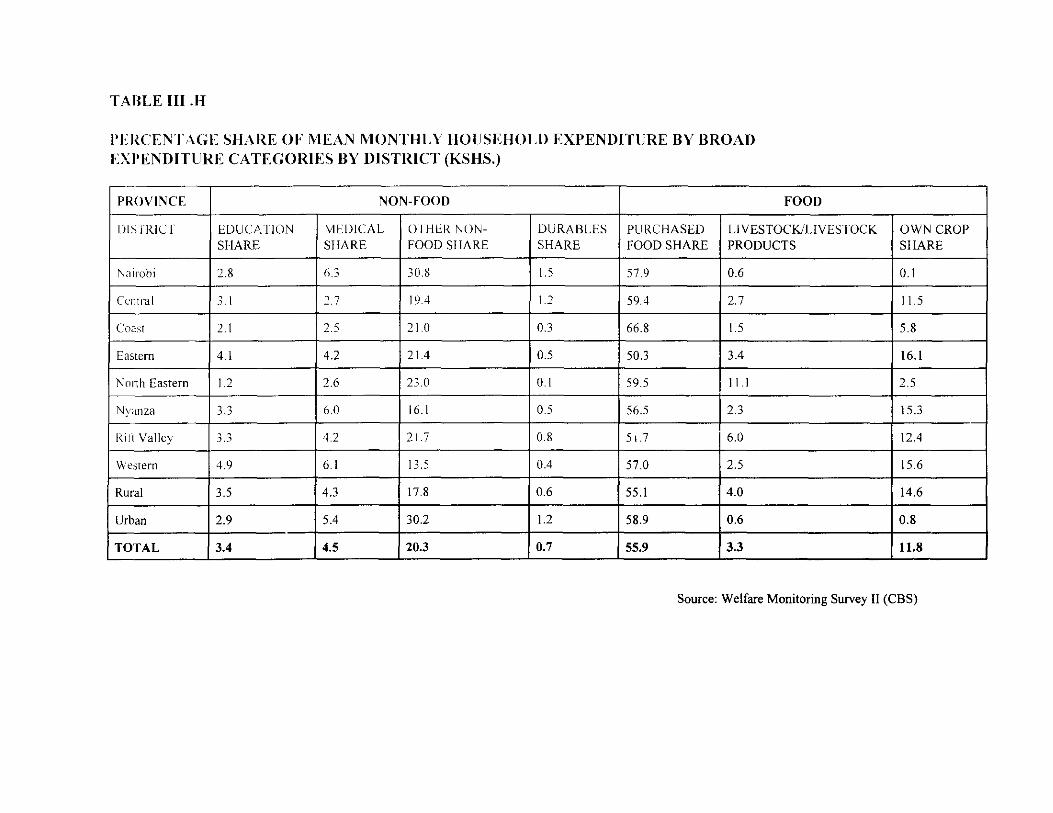
TABLE III.II
PERCENTAGE SHARE OF MEAN MONTHLY HOUSEHOLD EXPENDITURE BY BROAD EXPENDITURE CATEGORIES BY DISTRICT (KSHS.)
PROVINCE NON-FOOD FOOD
Ill' [RIC I EDUCATION ME[)ICAL 01 HER NON- DURABLES PURCHASED L1VESTOCKILIVESIOCK SHARE SHARE FOOD SHARE SHARE FOOD SHARE PRODUCTS
Nairobi 2.8 6.3 30.8 1.5 57.9 0.6
Central 3.1 2.7 19.4 1.2 59.4 2.7
Coast 2.1 2.5 21.0 0.3 66.8 1.5
Eastern 4.1 4.2 21.4 0.5 50.3 3.4
North Eastern 1.2 2.6 230 0.1 59.5 11.1
Nyanza 3.3 6.0 16.1 0.5 56.5 2.3
Rili Valley , ,
4.2 2i.7 0.8 51.7 6.0 .J ._,
V/estern 4.9 6.1 13.5 0.4 57.0 2.5
Rural 3.5 4.3 17.8 0.6 55.\ 4.0
Urban 2.9 5.4 30.2 1.2 58.9 0.6
TOTAL 3.4 4.5 20.3 0.7 55.9 3.3
OWN CROP SHARE
0.1
11.5
5.8
\6.1
2.5
15.3
12.4
15.6
\4.6
0.8
H.S
Source: Welfare Monitoring Survey II (CBS)
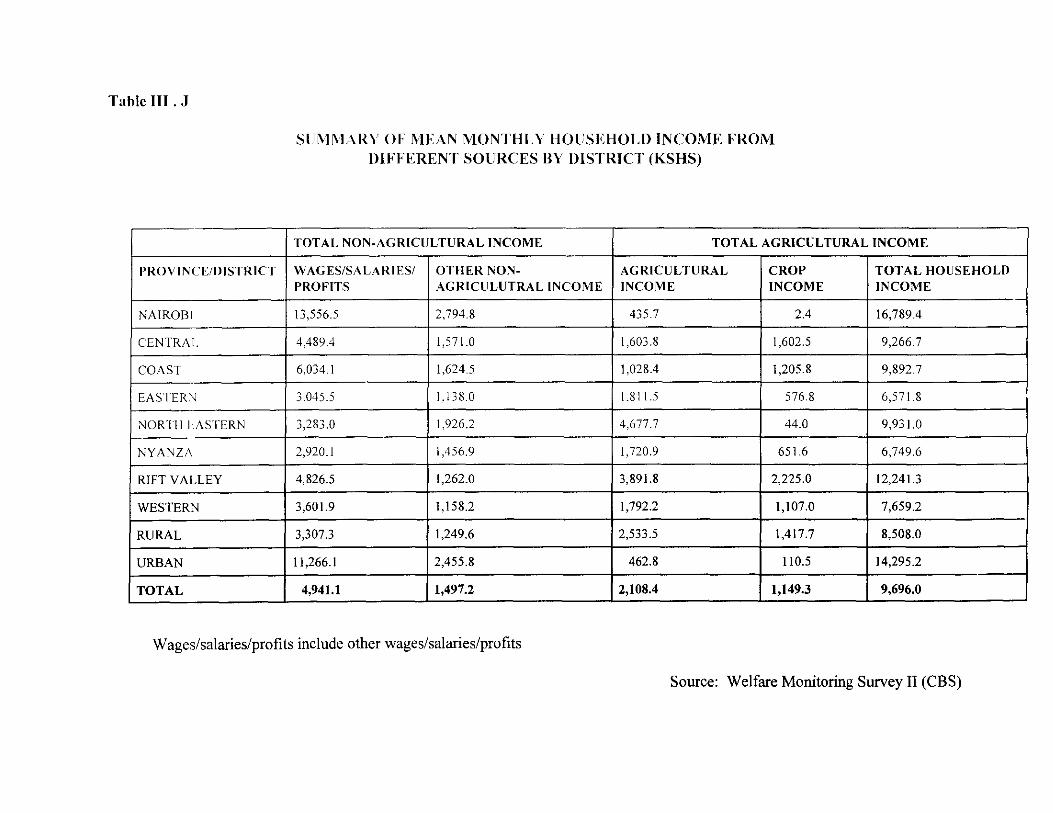
Table III. J
('ROY I NCE/DISTRICT
NAIROBI
CENTRAL
COAST
EASTER"
NORTH 1 ASTERN 1--
NYANZA
RlFTYALLEY
WESTERN
RURAL
URBAN
TOTAL
Slli\IMARY OF MEAN MONTHLY 1I0liSEHOLD INCOME FROM DIFFERENT SOURCES BY DISTRICT (KSHS)
TOT AL NON-AGRICULTURAL INCOME TOTAL AGRICULTURAL INCOME
WAGES/SALARIES/ OTHER NON- AGRICULTURAL CROP TOTAL HOUSEHOLD PROFITS AGRICULUTRAL INCOME INCOME INCOME INCOME
13,556.5 2,794.8 435.7 2.4 16,789.4
4,489.4 1,571.0 1,603.8 1,602.5 9,266.7
6,034.1 1,624.5 1,028.4 1,205.8 9,892.7
3.045.5 1.138.0 1.811.5 576.8 6,571.8
3,283.0 1,926.2 4,677.7 44.0 9,931.0
2,920.1 1,456.9 1,720.9 651.6 6,749.6
4,826.5 1,262.0 3,891.8 2,225.0 12,241.3
3,601.9 1,158.2 1,792.2 1,107.0 7,659.2
3,307.3 1,249.6 2,533.5 1,417.7 8,508.0
11,266.1 2,455.8 462.8 1l0.5 14,295.2
4,941.1 1,497.2 2,108.4 1,149.3 9,696.0 --
Wages/salaries/profits include other wages/salaries/profits
Source: Welfare Monitoring Survey II (CBS)
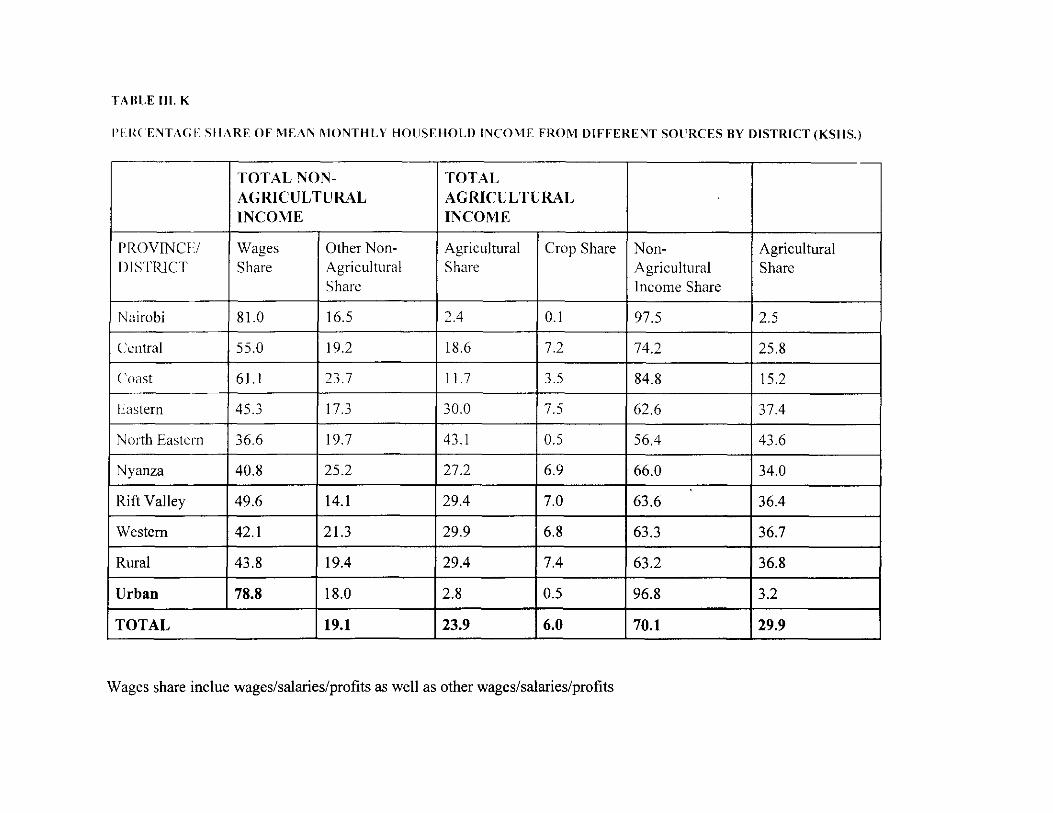
T A litE III. K
I'I.IHENTAG E SIIARE OF MEAN MONTHLY HOIISF.HOLD INCOME FROM DIFFERENT SOURCES BY DISTRICT (KSHS.)
TOTAL NON- TOTAL AGRICULTURAL AGRICUL TURAL INCOME INCOME
PROVINCFI Wages Other Non- Agricultural Crop Share Non- Agricultural DISTRICT Share Agricultural Share Agricultural Share
Sharc Income Share
Nairobi 81.0 16.5 2.4 0.1 97.5 2.5
Central 55.0 19.2 18.6 7.2 74.2 25.8
Coast 61.1 23.7 11.7 3.5 84.8 15.2
Lastern 45.3 17.3 30.0 7.5 62.6 37.4
North Eastern 36.6 19.7 43.1 0.5 56.4 43.6
Nyanza 40.8 25.2 27.2 6.9 66.0 34.0
Rift Valley 49.6 14.1 29.4 7.0 63.6 36.4
Western 42.1 21.3 29.9 6.8 63.3 36.7
Rural 43.8 19.4 29.4 7.4 63.2 36.8
Urban 78.8 18.0 2.8 0.5 96.8 3.2
TOTAL 19.1 23.9 6.0 70.1 29.9
Wages share inclue wages/salaries/profits as well as other wages/salaries/profits
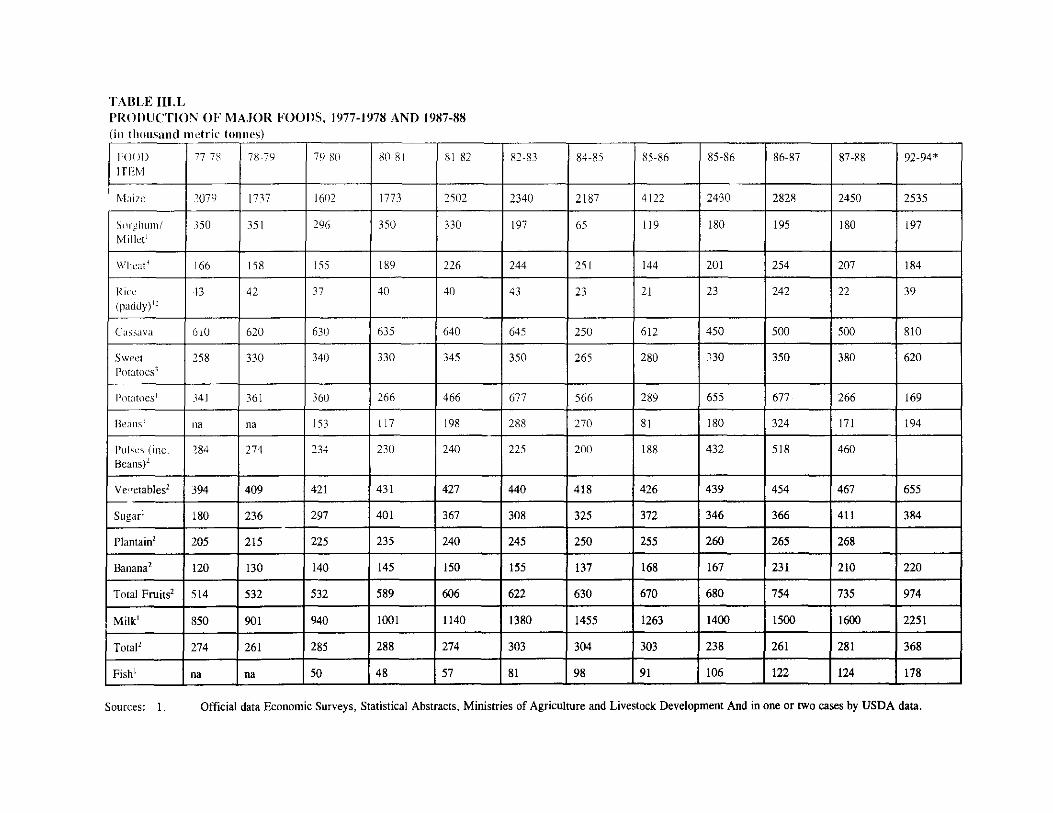
TABLE m.L PROlllJ(,TI()'\' OF MAJOR FOODS. 1977-1978 AND J987-88 (in thousand metric tOIlIlCS)
FOOD 77-78 78-79 79-80 80-81 81-82 ITEM
i'vlaizc 2079 1737 1602 1773 2502
Sllrghuml ISO 35 I 296 350 330 Millet l
\Vhcat' 166 ISS l55 189 226
Rice 43 42 37 40 40 (paddy)"
Cas.sava 610 620 630 635 640
Sweet 258 330 340 330 345 Potatoes3
Potatoes I 341 361 360 266 466
Beans l I\a I\a 153 117 198
Pul<;cs (inc. 284 274 234 230 240 Bcans)l
Ve,retables2 394 409 421 431 427 r--
Sugarl 180 236 297 401 367
PlantainZ 205 215 225 235 240
Banana2 120 130 140 145 150
Total Fruits2 514 532 532 589 606
I Milk1 850 901 940 1001 1140
Total 2 274 261 285 288 274
Fishl na na 50 48 57 I .. _____ --
R2-83 84-85 85-86 85-86 86-87 87-88 92-94*
2340 2187 4122 2430 2828 2450 2535
197 65 119 180 195 180 197
244 251 144 201 254 207 184
43 23 21 23 242 22 39
645 250 612 450 500 500 810
350 265 280 ''.30 350 380 620
677 566 289 655 677 266 169
288 270 81 180 324 171 194
225 200 188 432 518 460
440 418 426 439 454 467 655
308 325 372 346 366 411 384
245 250 255 260 265 268
155 137 168 167 231 210 220
622 630 670 680 754 735 974
1380 1455 1263 1400 1500 1600 2251
303 304 303 238 261 281 368
81 98 91 106 122 124 178
Sources: 1. Official data Economic Surveys, Statistical Abstracts. Ministries of Agriculture and Livestock Development And in one or two cases by USDA data.

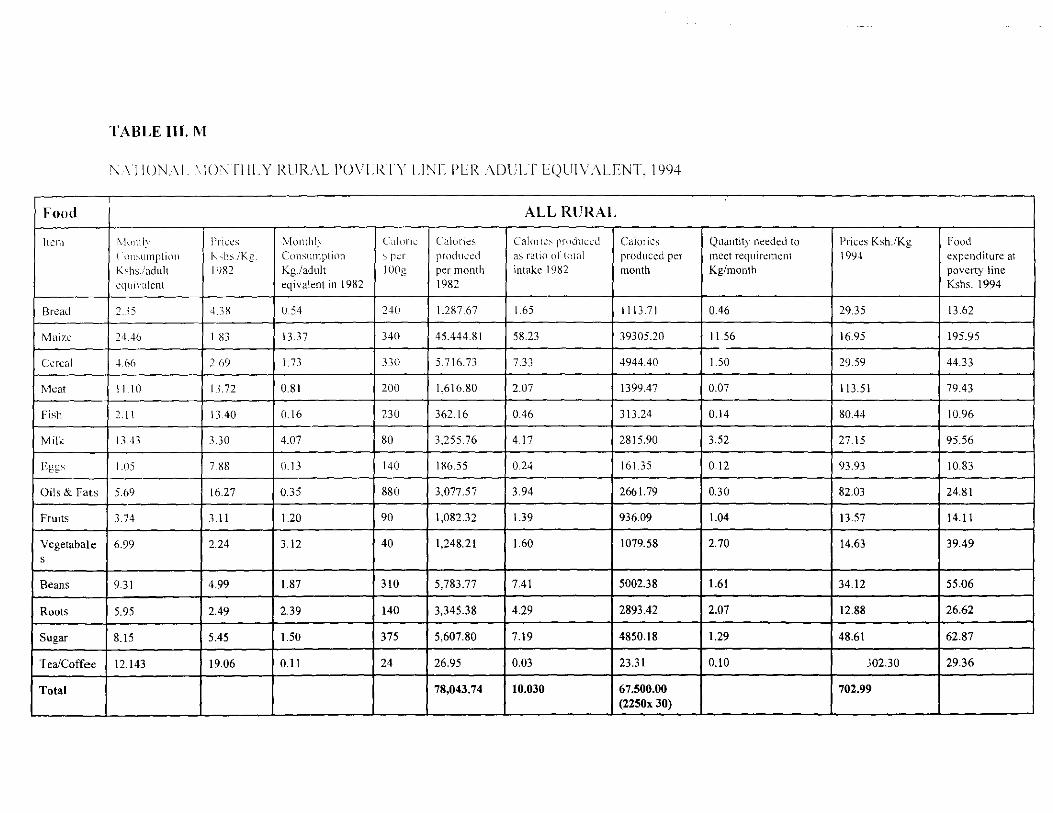
TABLE III. 1\1
"\IION.\I. \10" rilLY RURAL I'OVI.IZTY I.I"'F I'LR /\DULT U)U1VALENT. 1994
Food ALL RURAL
1t~1l1 ]\'!Ullll) l\ic-:s :"\0111111;- Cllul'ic Caluric:'- Calmi~~ PrudUCl"d Calories Quantity needed to Prices Ksh./Kg Food ( '(lIl"UlllpliPII I( "h:;.iKg COn~1l1l1pli()1l '> p..:r produced as ratio 01- (owl produced per meet requin.:mcnl 1994 expenditure at Kshs./adult 1982 Kg.laduit IOOg per month intake 19S2 month Kg/month poverty line
cqlli\ alent eqivalent in 1982 1982 Kshs. 1994
Bread 2 .. 15 cJ .3X OSl 2-l-(j 1.2K7.67 1.65 111l.71 0.46 29.35 13.62
Maize 2446 1.83 13.37 340 45.444.81 58.23 39305.20 1156 16.95 195.95
Cereal 4.66 269 1.73 330 5,716.73 7.33 4944.40 1.50 29.59 44.33
Meat 11.1 0 13.72 0.81 200 1.616.80 2.07 1399.47 0.Q7 IIl.51 79.43
Fish 2.\1 13.40 0.16 230 362.16 0.46 31l.24 0.14 80.44 10.96
Milk 1343 3.30 4.07 80 3.255.76 4.17 2815.90 3.52 27.15 95.56
Egg" 1.115 H8 11.13 140 186.55 0.24 16135 0.12 93.93 10.83
Oils & fats 5.69 16.27 0.35 880 3,077.57 3.94 2661.79 030 82.03 24.81
Fruits 3.74 3.11 1.20 90 1.082.32 1.39 936.09 1.04 13.57 14.11
Vegetabale 6.99 2.24 3.12 40 1,248.21 1.60 1079.58 2.70 14.63 39.49 I s
Beans 9.31 4.99 1.87 310 5,783.77 7.41 5002.38 1.61 34.12 55.06 I
Roots 5.95 2,49 2.39 140 3,345.38 4.29 2893.42 2.07 12.88 26.62 I
Sugar 8.15 5,45 1.50 375 5,607.80 7.19 4850.18 1.29 48.61 62.87 I
Tea/Coffee 12.143 19.06 0.11 24 26.95 0.Q3 23.31 0.10 .102.30 29.36 I I
Total 78,043.74 10.030 67.500.00 702.99 I
(2250x 30) - --.I

" u ':; o
r/l
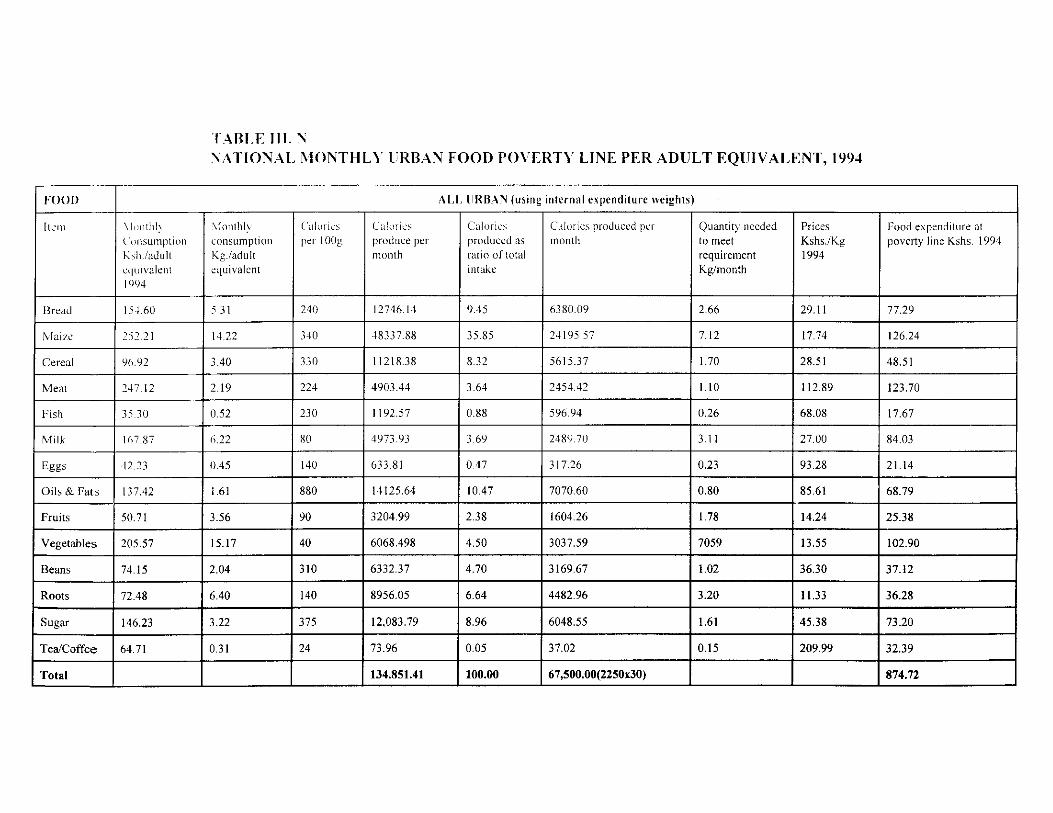
TABLE III. :\ :\ATIONAL I\IONTHL Y URBAN FOOD POVERTY LINE PER ADULT EQUIVALENT, 1994
fOOD ALL URB:-\N (using internal expenditure weights)
he-Ill \ 1 \ '11th 1:- \10nll1l) Cduri-.:s l'almics Calories Cdoric::. produced per Quantity needed Prices Food expenditure at C'(lilsurnption consumption per I aOg produce per produced as month to meet Kshs.lKg poverty line Kshs. 1994 Ksh.!adult Kg.ladult month ratio of total requirement 1994 cqulvaknt equivalent intake Kg/month 1994
Bread 15~.60 ~,31 240 12746.14 9.45 6380.09 2.66 29.11 77.29
jovIai7C ~jl_21 14.22 340 48337.88 35.85 24195.57 7.12 17.74 126.24
Cereal 96.42 3.40 330 11218.38 8.32 5615.37 1.70 28.51 48.51
Meat 247.12 2.19 224 4903.44 3.64 2454.42 1.10 112.89 123.70
Fish 35.30 0.52 230 1192.57 0.88 596.94 0.26 68.08 17.67
Milk lh7.87 6.22 80 4973.93 3.69 24Wi.70 3. i 1 27.00 84.03
Eggs 42.23 0.45 140 633.81 0.47 317.26 0.23 93.28 21.14
Oils & Fats 137.42 1.61 880 14125.64 10.47 7070.60 0.80 85.61 68.79
Fruits 50.71 3.56 90 3204.99 2.38 1604.26 1.78 14.24 25.38
Vegetables 205.57 15.17 40 6068.498 4.50 3037.59 7059 13.55 102.90
Beans 74.15 2.04 310 6332.37 4.70 3169.67 1.02 36.30 37.12
Roots 72.48 6.40 140 8956.05 6.64 4482.96 3.20 11.33 36.28
Sugar 146.23 3.22 375 12,083.79 8.96 6048.55 1.61 45.38 73.20
Tea/Coffee 64.71 0.31 24 73.96 0.05 37.02 0.15 209.99 32.39
Total 134.851.41 100.00 67,500.00(2250x30) 874.72 --

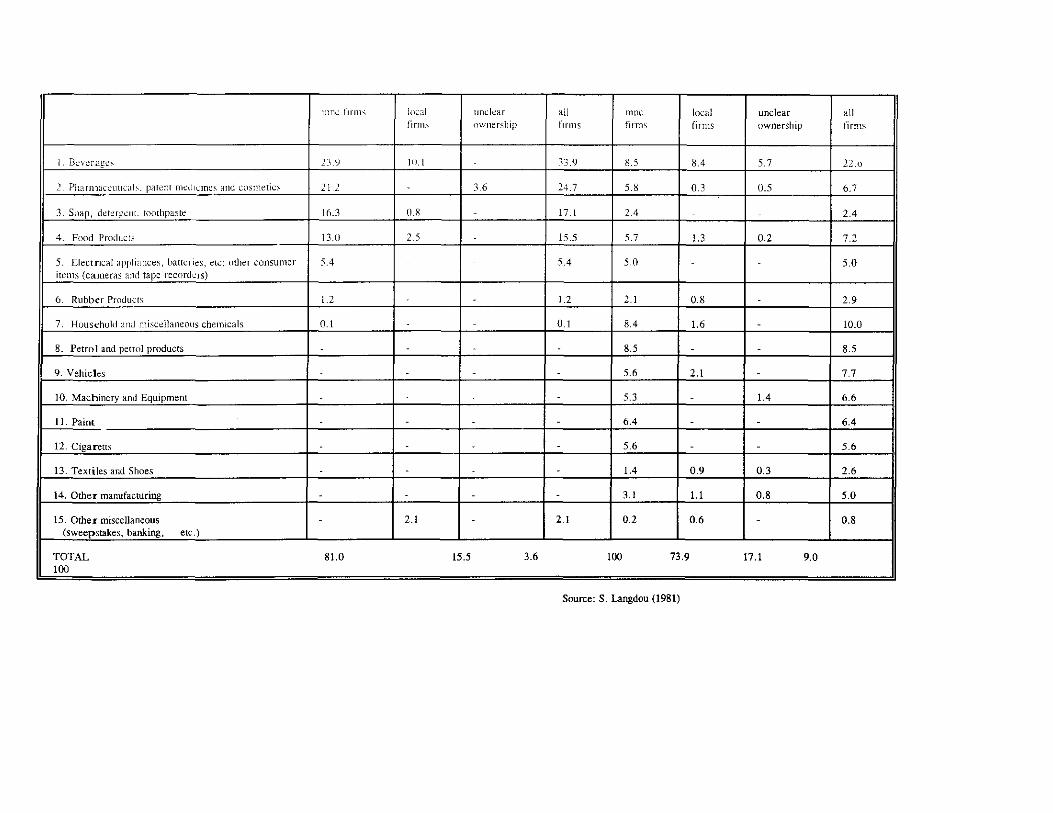
I11I1l: t IrIllS l(l..:al unclear all mile local unclear ail finm own<:rsllip flfms firlll~ firms ownership firms
I Bcvcrag..:~ 13.9 111.1 33.9 8.5 H4 5.7 22.0
, Pllarnl<lCcutlcal". patent Illt:dl(inc~ and COSIlletics 21 .2 3.6 24.7 5.8 0.3 0.5 6.7
3. Soap, detagclIl. toothpaste 16.3 0.8 17.1 24 2.4
4. Food Products !3.0 2.5 15.5 5.7 1.3 0.2 7.2
5. Electrical appliances, batteries, etc; other consumer 5.4 54 5.0 5.0 items (cameras and tape reconkrs)
6. Rubber Pr()duct~ 1.2 1.2 2.1 0.8 2.9
7. Household and miscellaneolls chemicals 0.1 0.1 8.4 1.6 - 10.0
8. Petrol and petrol products - - 8.5 - - 8.5
9. Vehicles - 5.6 2.1 - 7.7
10. Machinery and Equipment 5.3 - 14 6.6
11. Paint - - - 64 - - 6.4
12. Cigareus - - - 5.6 - - 5.6
13. Textiles and Shoes - - - 1.4 0.9 0.3 2.6
14. Other manufacturing - - - - 3.1 1.1 0.8 5.0
15. Other miscellaneous - 2.1 - 2.1 0.2 0.6 - 0.8 (sweepstakes, banking, etc.)
TOTAL 81.0 15.5 3.6 100 73.9 17.1 9.0 100
------------ --- ---
Source: S. Langdou (1981)
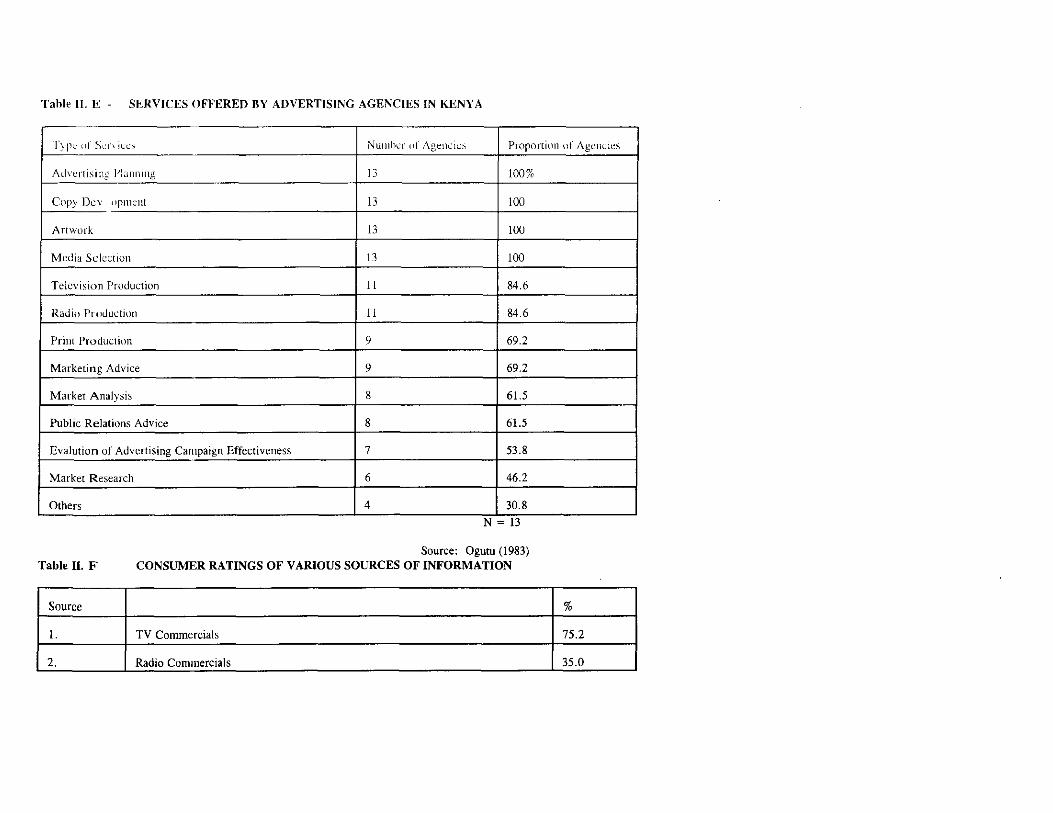
Tahle II. E - SERVICES OFFERED BY ADVERTISING AGENCIES IN KENYA
T) pl' (If Sen iu:~ NUlllher (11' Age!lcil'::' Proportion of Agencies
Advt'nisint! Planning 13 100%
Copy Dc\-' (lJ1ment 13 100
Artwork 13 100
MeJia Selection 13 100
Television Production 11 84.6
Radio Prouuctiull 11 84.6
Print Production 9 69.2
Marketing Advice 9 69.2
Market Analysis 8 61.5
Public Relations Advice 8 61.5
Evalution of Advertising Campaign Effectiveness 7 53.8
Market Research 6 46.2
~s 4 30.8 ------
N=i3
Table II. F Source: Ogutu (1983)
CONSUMER RATINGS OF VARIOUS SOURCES OF INFORMATION
Source
I. TV Commercials
2. Radio Commercials - --
%
75.2
35.0
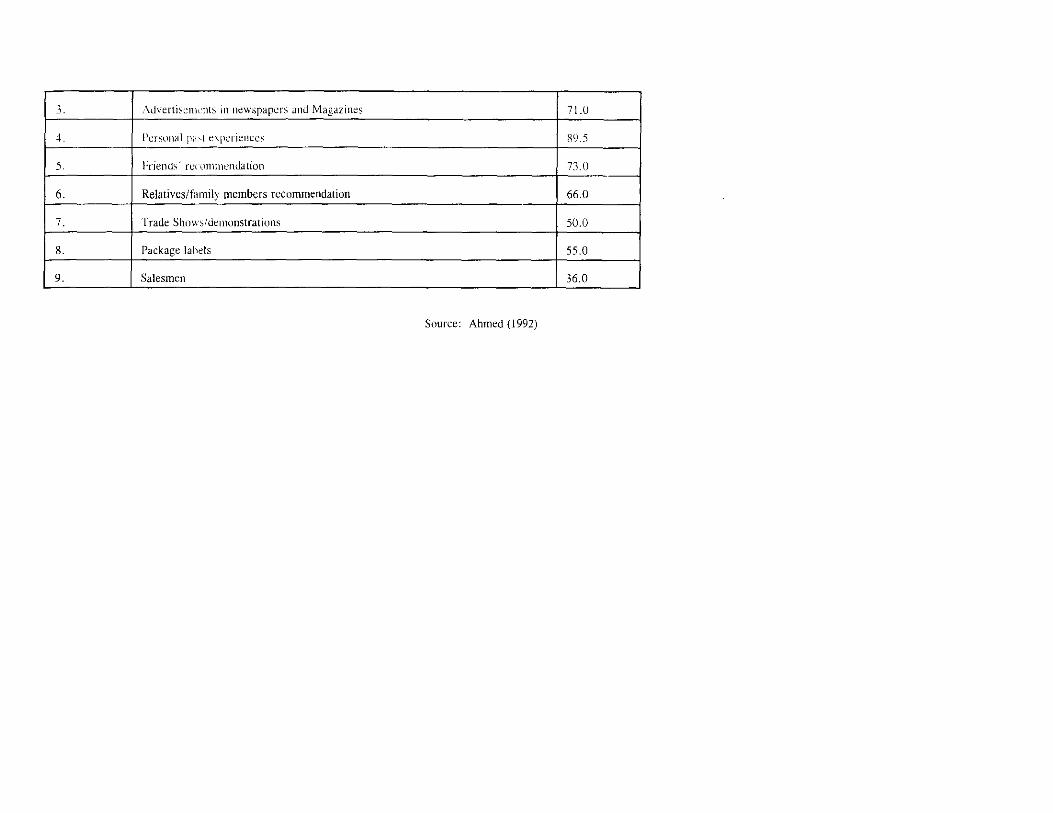
3. ;\dvertis~I1l"nts ill newspapers and Magazines 71.0
~. I\;rsullal Pd'( e'periences R9.S
S. h-iends' fL'l-\ll1l111endation no
6. Relatives/family members recommendation 66.0
7. Trade Shows/detnonstrations SO.O
8. Package labels SS.O
9. Salesmen 36.0
Source: Ahmed (1992)