Embed Size (px)
Citation preview
e J A D Eelectronic Journal of Agricultural and Development Economics
Agricultural and Development Economics Division (ESA) FAO available online at www.fao.org/es/esa/eJADE
Vol. 1, No. 2, 2004, pp. 220-241
Globalization, Urbanization and Nutritional Changein the Developing World
Michelle A. Mendez and Barry M. Popkin Carolina Population Center, University of North Carolina
Chapel Hill, NC, [email protected]
Abstract
Urbanization and globalization may enhance access to non traditional foods as a result of changingprices and production practices, as well as trade and marketing practices. These forces haveinfluenced dietary patterns throughout the developing world. Longitudinal case study data from Chinaindicate that consumption patterns closely reflect changes in availability, and that potentiallyobesogenic dietary patterns are emerging, with especially large changes in rural areas with highlevels of urban infrastructure and resources. Recent data on women from 36 developing countriesillustrate that these dietary shifts may have implications for overweight/obesity in urban and ruralsettings. These data emphasize the importance of developing country policies that include preventivemeasures to minimize further adverse shifts in diet and activity, and risk of continued rises inoverweight.
Keywords: dietary patterns, developing countries, overweight, food policy
1. Introduction
Over the past 15 years, there is increasing evidence that the structure of dietary intakes and theprevalence of obesity around the developing world have been changing at an increasingly rapid pace(Popkin 2002b). While there is some evidence to link urbanization with these changes, even less is
e-JOURNAL OF AGRICULTURAL AND DEVELOPMENT ECONOMICS Vol. 1, No. 2, 2004, pp. 220-241
220
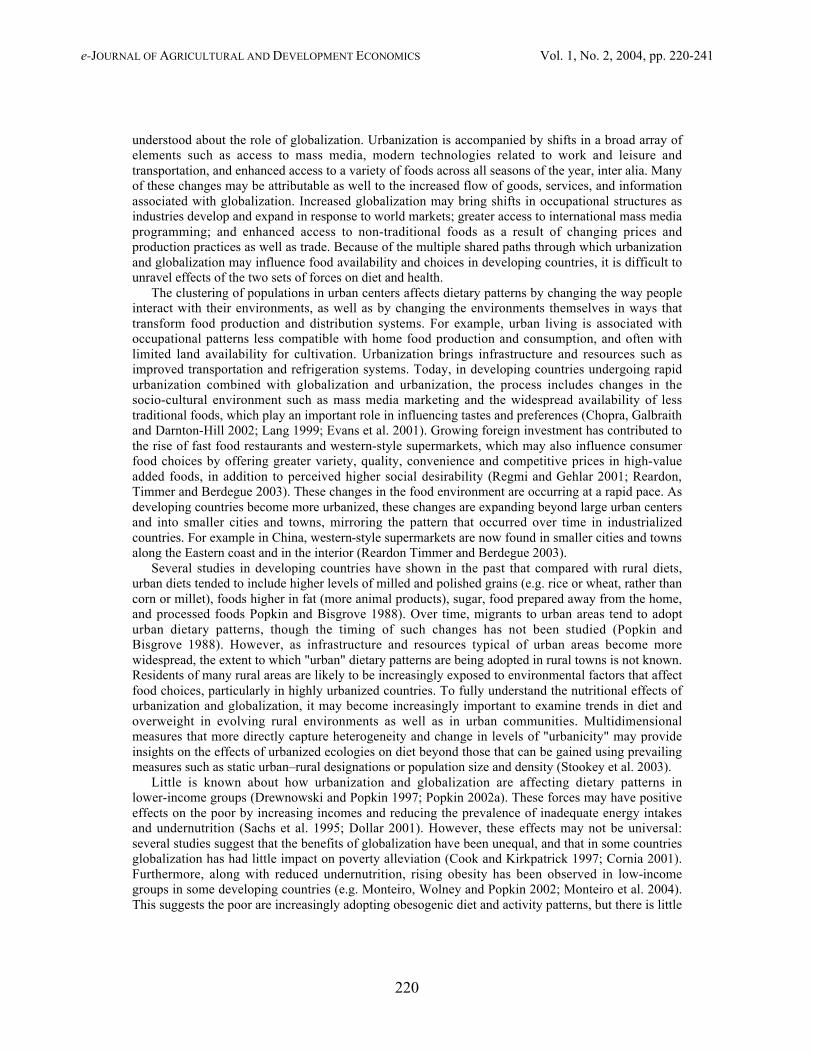
understood about the role of globalization. Urbanization is accompanied by shifts in a broad array ofelements such as access to mass media, modern technologies related to work and leisure andtransportation, and enhanced access to a variety of foods across all seasons of the year, inter alia. Manyof these changes may be attributable as well to the increased flow of goods, services, and informationassociated with globalization. Increased globalization may bring shifts in occupational structures asindustries develop and expand in response to world markets; greater access to international mass mediaprogramming; and enhanced access to non-traditional foods as a result of changing prices andproduction practices as well as trade. Because of the multiple shared paths through which urbanizationand globalization may influence food availability and choices in developing countries, it is difficult tounravel effects of the two sets of forces on diet and health.
The clustering of populations in urban centers affects dietary patterns by changing the way peopleinteract with their environments, as well as by changing the environments themselves in ways thattransform food production and distribution systems. For example, urban living is associated withoccupational patterns less compatible with home food production and consumption, and often withlimited land availability for cultivation. Urbanization brings infrastructure and resources such asimproved transportation and refrigeration systems. Today, in developing countries undergoing rapidurbanization combined with globalization and urbanization, the process includes changes in thesocio-cultural environment such as mass media marketing and the widespread availability of lesstraditional foods, which play an important role in influencing tastes and preferences (Chopra, Galbraithand Darnton-Hill 2002; Lang 1999; Evans et al. 2001). Growing foreign investment has contributed tothe rise of fast food restaurants and western-style supermarkets, which may also influence consumerfood choices by offering greater variety, quality, convenience and competitive prices in high-valueadded foods, in addition to perceived higher social desirability (Regmi and Gehlar 2001; Reardon,Timmer and Berdegue 2003). These changes in the food environment are occurring at a rapid pace. Asdeveloping countries become more urbanized, these changes are expanding beyond large urban centersand into smaller cities and towns, mirroring the pattern that occurred over time in industrializedcountries. For example in China, western-style supermarkets are now found in smaller cities and townsalong the Eastern coast and in the interior (Reardon Timmer and Berdegue 2003).
Several studies in developing countries have shown in the past that compared with rural diets,urban diets tended to include higher levels of milled and polished grains (e.g. rice or wheat, rather thancorn or millet), foods higher in fat (more animal products), sugar, food prepared away from the home,and processed foods Popkin and Bisgrove 1988). Over time, migrants to urban areas tend to adopturban dietary patterns, though the timing of such changes has not been studied (Popkin andBisgrove 1988). However, as infrastructure and resources typical of urban areas become morewidespread, the extent to which "urban" dietary patterns are being adopted in rural towns is not known.Residents of many rural areas are likely to be increasingly exposed to environmental factors that affectfood choices, particularly in highly urbanized countries. To fully understand the nutritional effects ofurbanization and globalization, it may become increasingly important to examine trends in diet andoverweight in evolving rural environments as well as in urban communities. Multidimensionalmeasures that more directly capture heterogeneity and change in levels of "urbanicity" may provideinsights on the effects of urbanized ecologies on diet beyond those that can be gained using prevailingmeasures such as static urban–rural designations or population size and density (Stookey et al. 2003).
Little is known about how urbanization and globalization are affecting dietary patterns inlower-income groups (Drewnowski and Popkin 1997; Popkin 2002a). These forces may have positiveeffects on the poor by increasing incomes and reducing the prevalence of inadequate energy intakesand undernutrition (Sachs et al. 1995; Dollar 2001). However, these effects may not be universal:several studies suggest that the benefits of globalization have been unequal, and that in some countriesglobalization has had little impact on poverty alleviation (Cook and Kirkpatrick 1997; Cornia 2001).Furthermore, along with reduced undernutrition, rising obesity has been observed in low-incomegroups in some developing countries (e.g. Monteiro, Wolney and Popkin 2002; Monteiro et al. 2004).This suggests the poor are increasingly adopting obesogenic diet and activity patterns, but there is little
e-JOURNAL OF AGRICULTURAL AND DEVELOPMENT ECONOMICS Vol. 1, No. 2, 2004, pp. 220-241
221
data about the nature of changing dietary behaviors, or the extent to which behavioral changes may beattributable to living in urban (or urbanizing) environments. Understanding the health and nutritioneffects of urban environments on the poor is increasingly important, as the process of urbanization inmany developing countries has included a massive shift of less advantaged groups to urban areas. Infact, in some countries, as urban populations surpass rural ones, the number of persons defined asliving in poverty is greater in urban compared to rural areas (Haddad, Ruel and Garrett 1999).
In this paper, we examine the types of shifts in food availability, dietary intake patterns and obesitythat have taken place in developing countries during a period of rapid globalization and urbanization.Between 1960 and 2000 the proportion of the developing country population living in urban areasdoubled, from 21.6 percent to 40.4 percent (United Nations Population Division 2002). Recentchanges have been particularly rapid in China, where the urban population increased by 39.8 percentbetween 1980 and 1990 (from 19.6 percent to 27.4 percent) and by another 20.7 percent from 1990 to2000 (reaching 35.8 percent). In the Middle East, Latin America, and Oceania, the pace ofurbanization is slower, but 65 to 75 percent of the population in these regions resided in urban areas bythe year 2000. These population shifts have been accompanied by accelerated globalization, asillustrated by factors such as large increases in foreign direct investment (from $24 billion to $170billion from 1990 to 1998), and a doubling of merchandise exports and imports in the past two decades(World Bank 2001).
The first part of this paper presents shifts in the availability of key food groups during this periodof rapid change. We present information on regional shifts in edible oils, animal source foods (ASFs),fresh fruits and vegetables, and added sugars. Using case study data from China, we examine changesin food group intakes in greater detail, assessing the extent to which potentially obesogenic dietarypatterns are emerging in rural as well as in urban areas. To better illustrate the effects of urbanizingenvironments, we present data on dietary patterns in urban and rural areas that differ in terms ofinfrastructure and resources. This case study also explores how food group consumption patterns havechanged in low- and high-income groups in urban and rural settings. Finally, we assess someimplications of these global dietary shifts by briefly describing levels of under- and overweight inwomen living in urban and rural areas of developing countries. We describe how the prevalence ofeach type of malnutrition varies across countries at different levels of urbanization. Aspects ofurbanization and globalization that influence physical activity in addition to diet play a major role inthe ongoing transition from underweight to overnutrition, but are not the focus of this paper.
2. Data and Methods
Global shifts in food available for consumption,1961 to 2000: Changes in global food availability werecalculated using food balance sheet data and population estimates for developing countries between1961 and 2000. These data were obtained from the Food and Agricultural Organization of the UnitedNations (http://apps.fao.org). For each year, 1961, 1970, 1980, 1990 and 2000, the mean foodavailability per capita was calculated for each region. This was based on 118 countries of thedeveloping world: 44 in sub-Saharan Africa; 15 in the Middle East; 34 in Latin America and theCaribbean; and 25 in the Far East (including China). The added sugar category includes sugars andsweeteners; fruits excludes wine; vegetables excludes potatoes; edible oils are vegetable oils; dairyincludes milk, yogurt and cheese; meat includes bovine, sheep, pig, goat, poultry and other (butexcludes animal source fats such as lard); fish includes fish and seafood. Animal source foods combineeggs, meats and poultry, fish and dairy products, but excludes animal source fats such as lard.
The China Case Study: The case study uses data from the China Health and Nutrition Survey (CHNS)from 1991 to 1997. The CHNS was conducted in eight provinces across China. Multistage clustersampling was used to select communities from areas that differ substantially with respect to economicand health status, as well as geography. Details on the sample and data collection methods have been
e-JOURNAL OF AGRICULTURAL AND DEVELOPMENT ECONOMICS Vol. 1, No. 2, 2004, pp. 220-241
222
published elsewhere (Entwisle et al. 1995; Guo et al. 1999), and are available online(http://www.cpc.unc.edu/projects/china/). Individual-level dietary intake data, collected using threeconsecutive 24-hour recalls, are used to estimate consumption trends in key food groups amongChinese adults aged 20 to 45 years. Added caloric sweetener data is not available as this is not found inthe food composition table for China. Anthropometric data collected by trained interviewers were usedto calculate body mass index (weight in kg/height in m2), with which participants were categorized asoverweight or obese (BMI ≥ 25.0) or as underweight (BMI ≤ 18.5). Income was estimated based onearnings from market and non-market activities as well as subsidies. Urbanicity was characterizedusing the China Urbanization Index, a multidimensional index of infrastructure and resources in tencategories: population size, population density, access to markets, transportation,communications/media, economic factors, environment/sanitation, health, education, and housingquality (Stookey et al. 2003). The index was developed using data from community surveys,supplemented with household level information.
Nutritional Status Changes: To analyze changes in under- and overweight, we used national data setsfrom surveys conducted between 1992 and 2000 in 36 developing countries: 20 in sub-Saharan Africa,eight in Latin America and the Caribbean (including Brazil and Mexico), five in Asia (including Chinaand India), and three in North Africa and the Middle East. Many DHS datasets are not used due to lackof appropriate maternal anthropometry data. The China and Mexico data sets are from national healthand nutrition surveys conducted by these countries in 1997 and 1999, respectively (see for referenceson these two survey systems Rivera et al. 2002; Popkin et al. 1993). All other national data setscorrespond to standardized USAID/Macro Demographic Health Surveys (DHSs) conducted between1992 and 2000 (Boerma and Sommerfelt 1993). We used only the most recent data for countries inwhich two or more DHSs were conducted in this period. DHS data sets were downloaded fromhttp://www.macroint.com/dhs/ or obtained directly from the State Statistical Offices (SSOs) thatconducted the surveys.
We restricted analyses in all data sets to non-pregnant women aged 20 to 49 years. Average samplesize was 4 266, ranging from 1 460 in Bolivia to 21 171 in Peru, with a total of 157 844 womenstudied. Average non-response rates were less than 0.2 percent for weight and height measurementsand less than 0.7 percent for questions on SES. In the case of the DHS data, most women were mothersof children under five years of age. All analyses presented in this article were age-adjusted to allow fordifferences in age distribution between, and within, countries (Ahmad et al. 1999).
The overall prevalence of underweight (BMI ≤ 18.5) and overweight-plus-obesity (BMI > 25) werecalculated for women in each country based on weight and height measurements. Prevalences wereestimated for both urban and rural areas. We also calculated the social distribution of underweight andoverweight-plus-obesity for each country using country-specific indicators of SES – namely, thecountry’s quartiles of the women’s years of formal education. Since years of education are a numericnon-continuous variable, close to 25 percent of women in each country fall in the education quartiles.However, in some countries, women were highly concentrated in some education categories, and itwas necessary to combine one or more quartiles. Prevalence figures were age-adjusted by the directmethod, using the age distribution of the world population as a reference (Ahmad et al. 1999). We usedsurvey-specific sample weights, so all estimates are nationally representative (except for the Chinasurvey, which only represents eight provinces).
We first tested the significance of differences in overweight (and underweight) prevalence in urbanvs. rural areas. Next, we tested the differences in overweight vs. underweight prevalence within bothurban and rural areas. Finally, we examined the magnitude and direction of the associations betweenSES and prevalence of malnutrition (underweight or overweight– plus–obesity) in each country, bycalculating age-adjusted prevalence ratios (with 95 percent confidence intervals) comparing thehighest to the lowest education quartile within urban and rural areas.
e-JOURNAL OF AGRICULTURAL AND DEVELOPMENT ECONOMICS Vol. 1, No. 2, 2004, pp. 220-241
223
3. Results
Global shifts in food available for consumption: 1961–2000
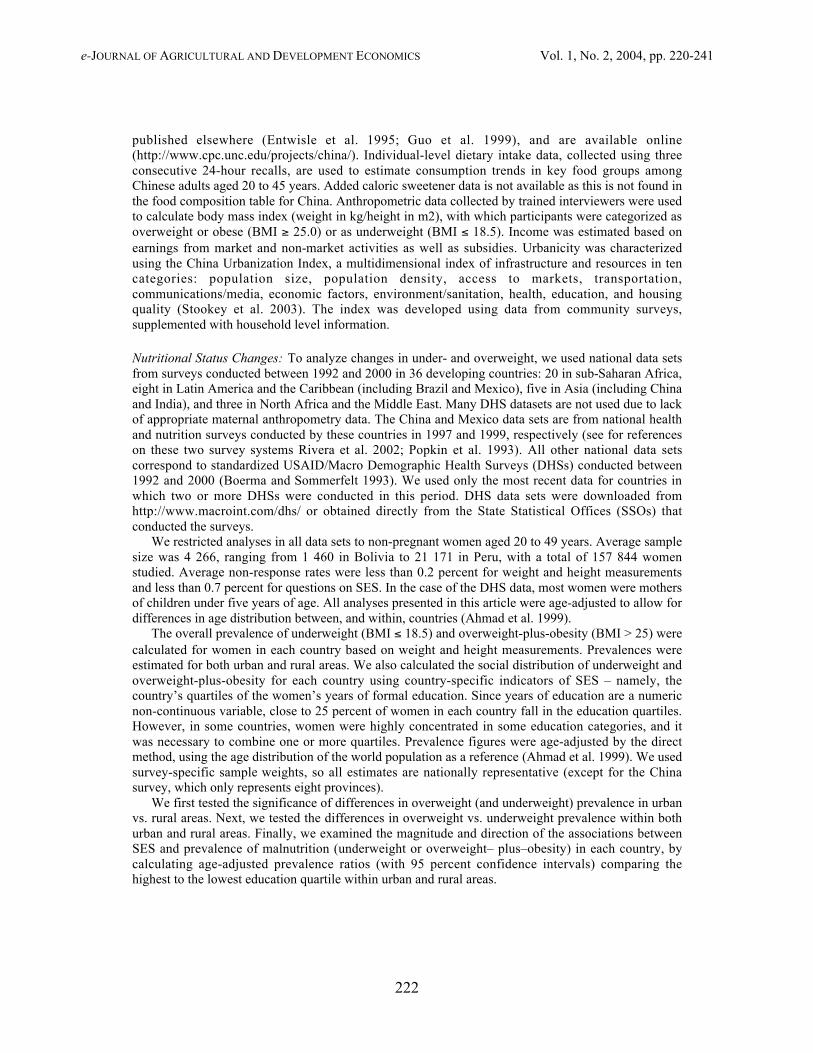
Edible oils: Throughout the developing world, the availability of edible vegetable oils forconsumption has nearly tripled (see Figure 1). In some countries, the increase has been even moremarked. For instance, availability of edible oil for consumption in China has risen six fold over thisperiod, while intakes in the rest of Asia and Oceania tripled. In the past two decades, edible oilavailability continued to rise in Asia and Oceania. However, availability of oils in Latin America andthe Middle East – already more than 65 percent higher than in other regions by 1990 – appears to haveleveled off.
Figure 1: Regional trends in availability for consumption of edible oils, 1961-2000
0
50
100
150
200
250
300
350
1961 1970 1980 1990 2000
Subsaharan Africa Middle East
Latin America and Carribean Far East and Oceania w/o China
China Total Developing Countries Incl China
Source: Food balance data from FAOSTAT data base
e-JOURNAL OF AGRICULTURAL AND DEVELOPMENT ECONOMICS Vol. 1, No. 2, 2004, pp. 220-241
224
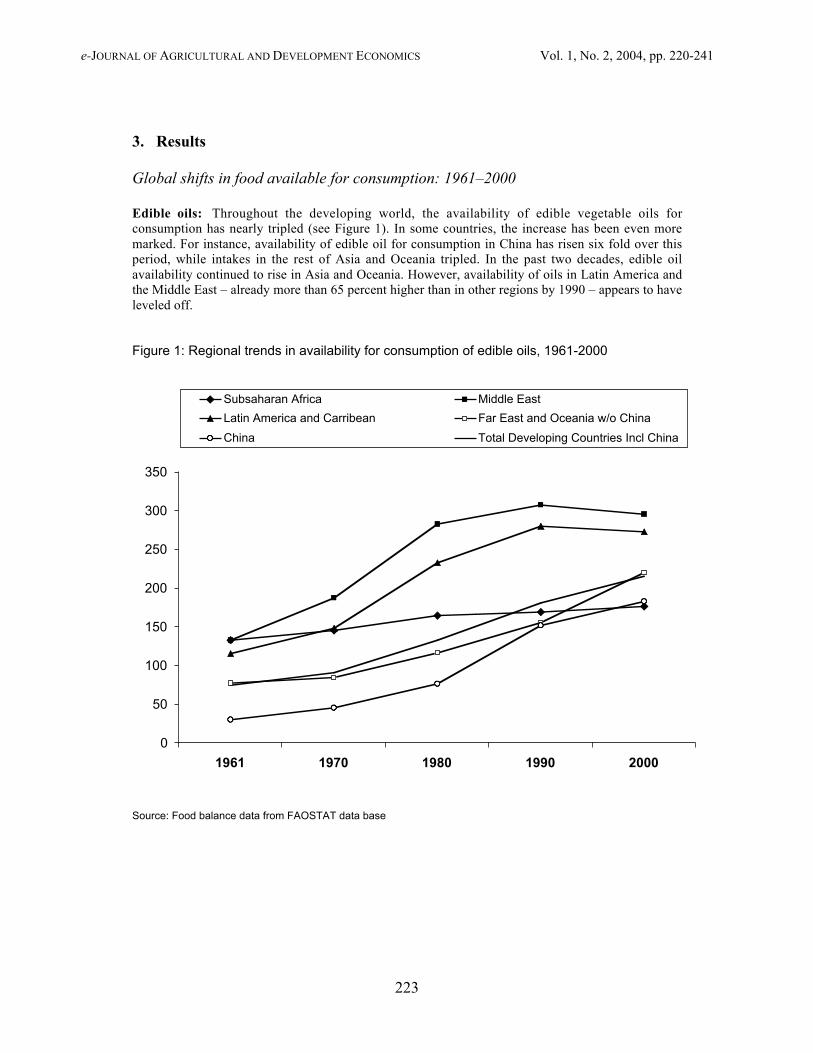
Animal source foods: Figure 2 illustrates changes in world production of animal source foods (ASF)available for human consumption, including eggs, meats (pork, all others), poultry, dairy and fish.There was almost a tenfold increase of ASF’s in China, and overall a tripling of the amounts availablefor consumption in the developing world. In most regions, ASF intakes continued to increase rapidlyin past two decades: only sub-Saharan Africa and the Middle East did not experience substantialchanges in animal food consumption over that period. However, levels of ASF consumption in theMiddle East were already consistently higher than those in most other developing regions.
Figure 2: Regional trends in availability for consumption of total animal source foods, 1961-2000
0
100
200
300
400
500
600
1961 1970 1980 1990 2000
Subsaharan Africa Middle East Latin America and Carribean Far East and Oceania w/o ChinaChina Far East and OceaniaTotal Developing Countries Incl China
Source: Food balance data from FAOSTAT data base
e-JOURNAL OF AGRICULTURAL AND DEVELOPMENT ECONOMICS Vol. 1, No. 2, 2004, pp. 220-241
225
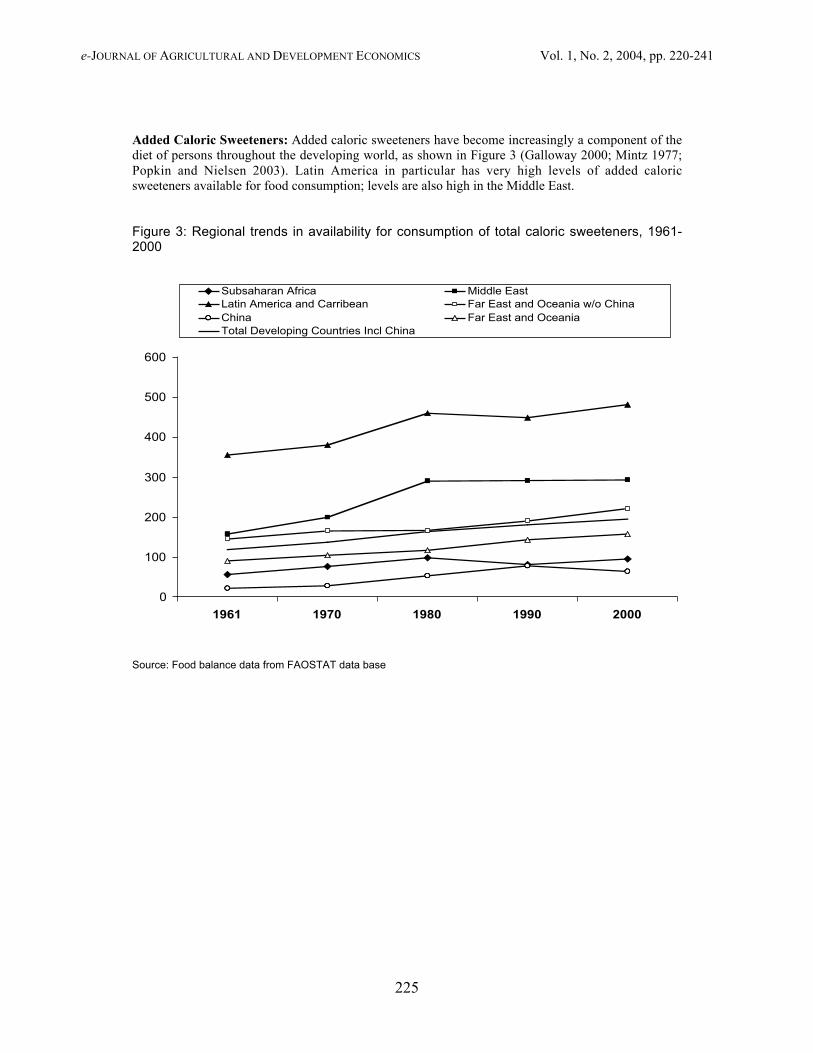
Added Caloric Sweeteners: Added caloric sweeteners have become increasingly a component of thediet of persons throughout the developing world, as shown in Figure 3 (Galloway 2000; Mintz 1977;Popkin and Nielsen 2003). Latin America in particular has very high levels of added caloricsweeteners available for food consumption; levels are also high in the Middle East.
Figure 3: Regional trends in availability for consumption of total caloric sweeteners, 1961-2000
0
100
200
300
400
500
600
1961 1970 1980 1990 2000
Subsaharan Africa Middle East Latin America and Carribean Far East and Oceania w/o ChinaChina Far East and OceaniaTotal Developing Countries Incl China
Source: Food balance data from FAOSTAT data base
e-JOURNAL OF AGRICULTURAL AND DEVELOPMENT ECONOMICS Vol. 1, No. 2, 2004, pp. 220-241
226
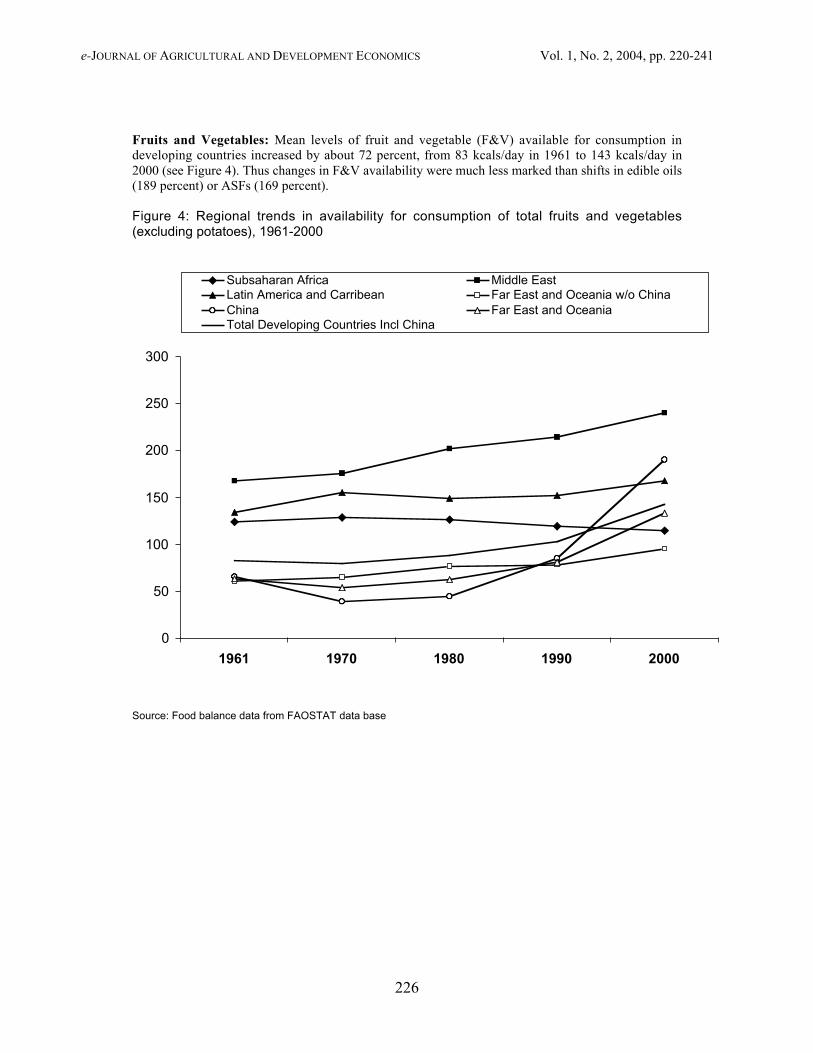
Fruits and Vegetables: Mean levels of fruit and vegetable (F&V) available for consumption indeveloping countries increased by about 72 percent, from 83 kcals/day in 1961 to 143 kcals/day in2000 (see Figure 4). Thus changes in F&V availability were much less marked than shifts in edible oils(189 percent) or ASFs (169 percent).
Figure 4: Regional trends in availability for consumption of total fruits and vegetables(excluding potatoes), 1961-2000
0
50
100
150
200
250
300
1961 1970 1980 1990 2000
Subsaharan Africa Middle East Latin America and Carribean Far East and Oceania w/o ChinaChina Far East and OceaniaTotal Developing Countries Incl China
Source: Food balance data from FAOSTAT data base
e-JOURNAL OF AGRICULTURAL AND DEVELOPMENT ECONOMICS Vol. 1, No. 2, 2004, pp. 220-241
227
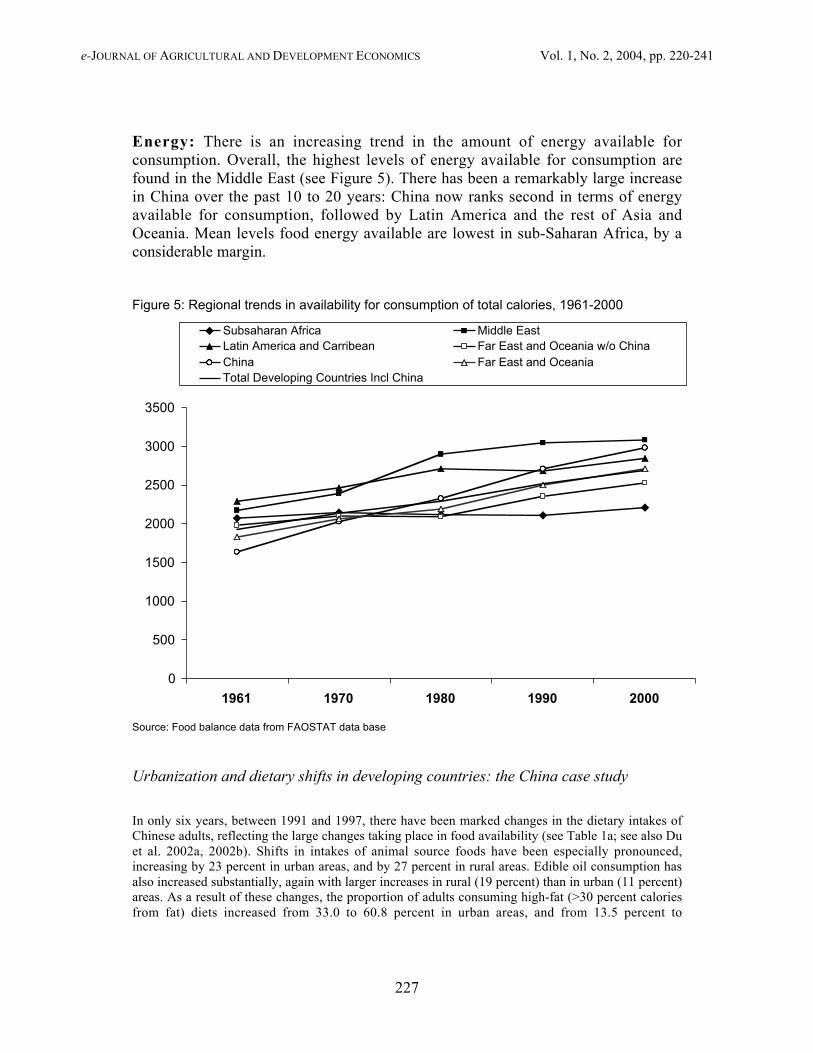
Energy: There is an increasing trend in the amount of energy available forconsumption. Overall, the highest levels of energy available for consumption arefound in the Middle East (see Figure 5). There has been a remarkably large increasein China over the past 10 to 20 years: China now ranks second in terms of energyavailable for consumption, followed by Latin America and the rest of Asia andOceania. Mean levels food energy available are lowest in sub-Saharan Africa, by aconsiderable margin.
Figure 5: Regional trends in availability for consumption of total calories, 1961-2000
0
500
1000
1500
2000
2500
3000
3500
1961 1970 1980 1990 2000
Subsaharan Africa Middle East Latin America and Carribean Far East and Oceania w/o ChinaChina Far East and OceaniaTotal Developing Countries Incl China
Source: Food balance data from FAOSTAT data base
Urbanization and dietary shifts in developing countries: the China case study
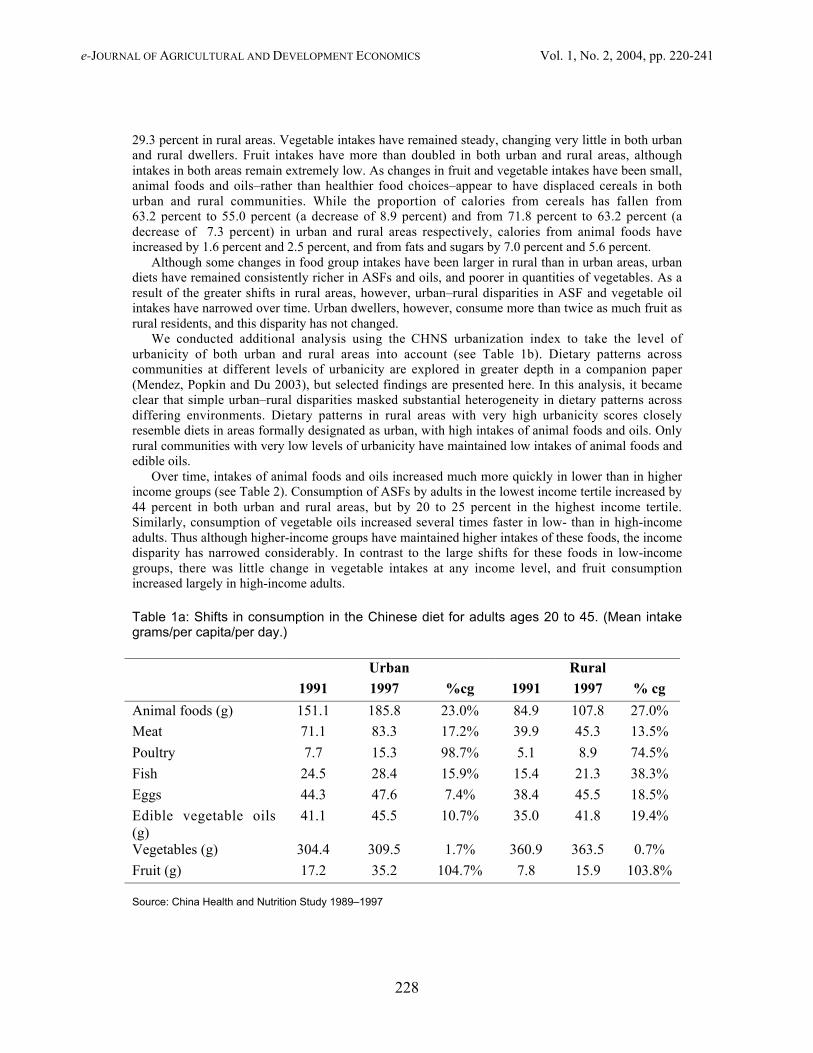
In only six years, between 1991 and 1997, there have been marked changes in the dietary intakes ofChinese adults, reflecting the large changes taking place in food availability (see Table 1a; see also Duet al. 2002a, 2002b). Shifts in intakes of animal source foods have been especially pronounced,increasing by 23 percent in urban areas, and by 27 percent in rural areas. Edible oil consumption hasalso increased substantially, again with larger increases in rural (19 percent) than in urban (11 percent)areas. As a result of these changes, the proportion of adults consuming high-fat (>30 percent caloriesfrom fat) diets increased from 33.0 to 60.8 percent in urban areas, and from 13.5 percent to
e-JOURNAL OF AGRICULTURAL AND DEVELOPMENT ECONOMICS Vol. 1, No. 2, 2004, pp. 220-241
228
29.3 percent in rural areas. Vegetable intakes have remained steady, changing very little in both urbanand rural dwellers. Fruit intakes have more than doubled in both urban and rural areas, althoughintakes in both areas remain extremely low. As changes in fruit and vegetable intakes have been small,animal foods and oils–rather than healthier food choices–appear to have displaced cereals in bothurban and rural communities. While the proportion of calories from cereals has fallen from63.2 percent to 55.0 percent (a decrease of 8.9 percent) and from 71.8 percent to 63.2 percent (adecrease of 7.3 percent) in urban and rural areas respectively, calories from animal foods haveincreased by 1.6 percent and 2.5 percent, and from fats and sugars by 7.0 percent and 5.6 percent.
Although some changes in food group intakes have been larger in rural than in urban areas, urbandiets have remained consistently richer in ASFs and oils, and poorer in quantities of vegetables. As aresult of the greater shifts in rural areas, however, urban–rural disparities in ASF and vegetable oilintakes have narrowed over time. Urban dwellers, however, consume more than twice as much fruit asrural residents, and this disparity has not changed.
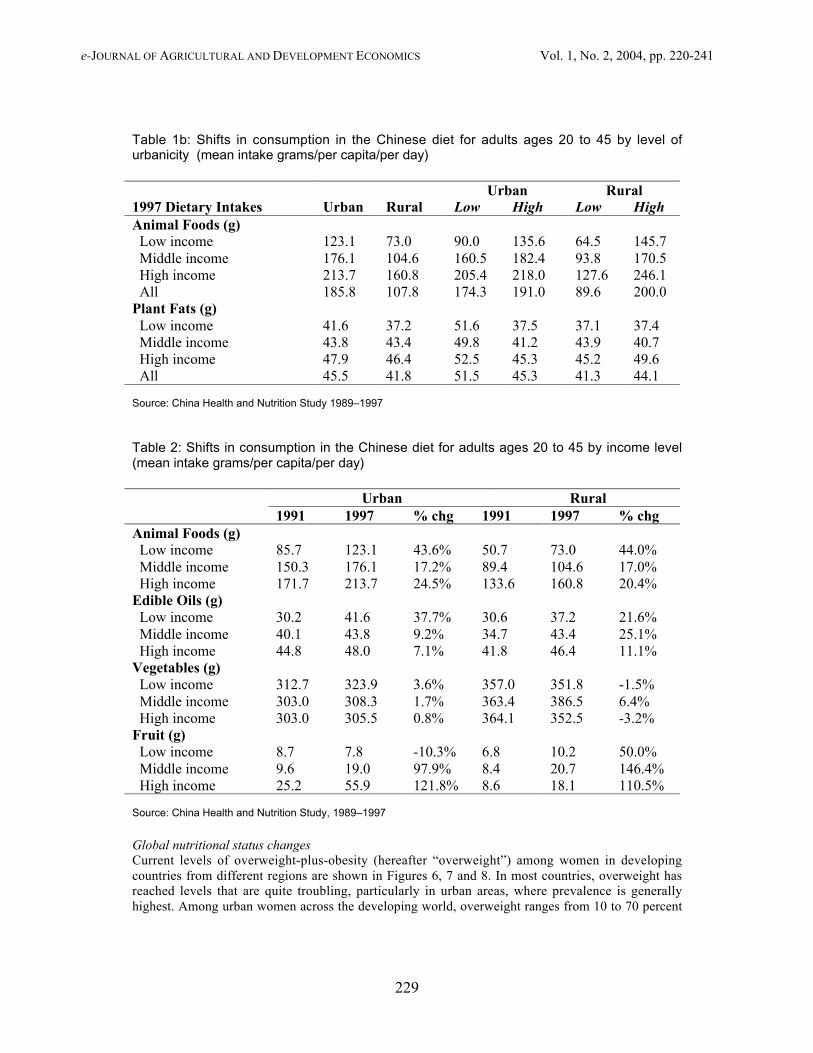
We conducted additional analysis using the CHNS urbanization index to take the level ofurbanicity of both urban and rural areas into account (see Table 1b). Dietary patterns acrosscommunities at different levels of urbanicity are explored in greater depth in a companion paper(Mendez, Popkin and Du 2003), but selected findings are presented here. In this analysis, it becameclear that simple urban–rural disparities masked substantial heterogeneity in dietary patterns acrossdiffering environments. Dietary patterns in rural areas with very high urbanicity scores closelyresemble diets in areas formally designated as urban, with high intakes of animal foods and oils. Onlyrural communities with very low levels of urbanicity have maintained low intakes of animal foods andedible oils.
Over time, intakes of animal foods and oils increased much more quickly in lower than in higherincome groups (see Table 2). Consumption of ASFs by adults in the lowest income tertile increased by44 percent in both urban and rural areas, but by 20 to 25 percent in the highest income tertile.Similarly, consumption of vegetable oils increased several times faster in low- than in high-incomeadults. Thus although higher-income groups have maintained higher intakes of these foods, the incomedisparity has narrowed considerably. In contrast to the large shifts for these foods in low-incomegroups, there was little change in vegetable intakes at any income level, and fruit consumptionincreased largely in high-income adults.
Table 1a: Shifts in consumption in the Chinese diet for adults ages 20 to 45. (Mean intakegrams/per capita/per day.)
Urban Rural1991 1997 %cg 1991 1997 % cg
Animal foods (g) 151.1 185.8 23.0% 84.9 107.8 27.0%
Meat 71.1 83.3 17.2% 39.9 45.3 13.5%
Poultry 7.7 15.3 98.7% 5.1 8.9 74.5%
Fish 24.5 28.4 15.9% 15.4 21.3 38.3%
Eggs 44.3 47.6 7.4% 38.4 45.5 18.5%
Edible vegetable oils(g)
41.1 45.5 10.7% 35.0 41.8 19.4%
Vegetables (g) 304.4 309.5 1.7% 360.9 363.5 0.7%
Fruit (g) 17.2 35.2 104.7% 7.8 15.9 103.8%
Source: China Health and Nutrition Study 1989–1997
e-JOURNAL OF AGRICULTURAL AND DEVELOPMENT ECONOMICS Vol. 1, No. 2, 2004, pp. 220-241
229
Table 1b: Shifts in consumption in the Chinese diet for adults ages 20 to 45 by level ofurbanicity (mean intake grams/per capita/per day)
Urban Rural1997 Dietary Intakes Urban Rural Low High Low HighAnimal Foods (g) Low income 123.1 73.0 90.0 135.6 64.5 145.7 Middle income 176.1 104.6 160.5 182.4 93.8 170.5 High income 213.7 160.8 205.4 218.0 127.6 246.1 All 185.8 107.8 174.3 191.0 89.6 200.0Plant Fats (g) Low income 41.6 37.2 51.6 37.5 37.1 37.4 Middle income 43.8 43.4 49.8 41.2 43.9 40.7 High income 47.9 46.4 52.5 45.3 45.2 49.6 All 45.5 41.8 51.5 45.3 41.3 44.1
Source: China Health and Nutrition Study 1989–1997
Table 2: Shifts in consumption in the Chinese diet for adults ages 20 to 45 by income level(mean intake grams/per capita/per day)
Urban Rural1991 1997 % chg 1991 1997 % chg
Animal Foods (g) Low income 85.7 123.1 43.6% 50.7 73.0 44.0% Middle income 150.3 176.1 17.2% 89.4 104.6 17.0% High income 171.7 213.7 24.5% 133.6 160.8 20.4%Edible Oils (g) Low income 30.2 41.6 37.7% 30.6 37.2 21.6% Middle income 40.1 43.8 9.2% 34.7 43.4 25.1% High income 44.8 48.0 7.1% 41.8 46.4 11.1%Vegetables (g) Low income 312.7 323.9 3.6% 357.0 351.8 -1.5% Middle income 303.0 308.3 1.7% 363.4 386.5 6.4% High income 303.0 305.5 0.8% 364.1 352.5 -3.2%Fruit (g) Low income 8.7 7.8 -10.3% 6.8 10.2 50.0% Middle income 9.6 19.0 97.9% 8.4 20.7 146.4% High income 25.2 55.9 121.8% 8.6 18.1 110.5%
Source: China Health and Nutrition Study, 1989–1997
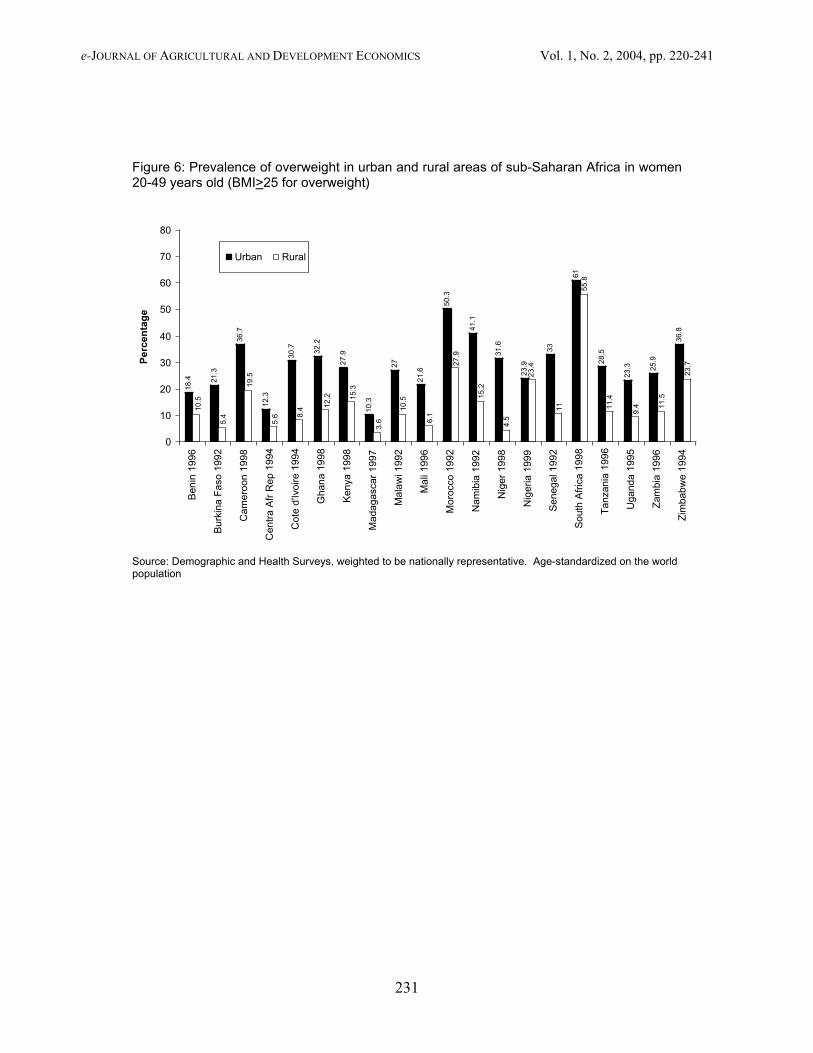
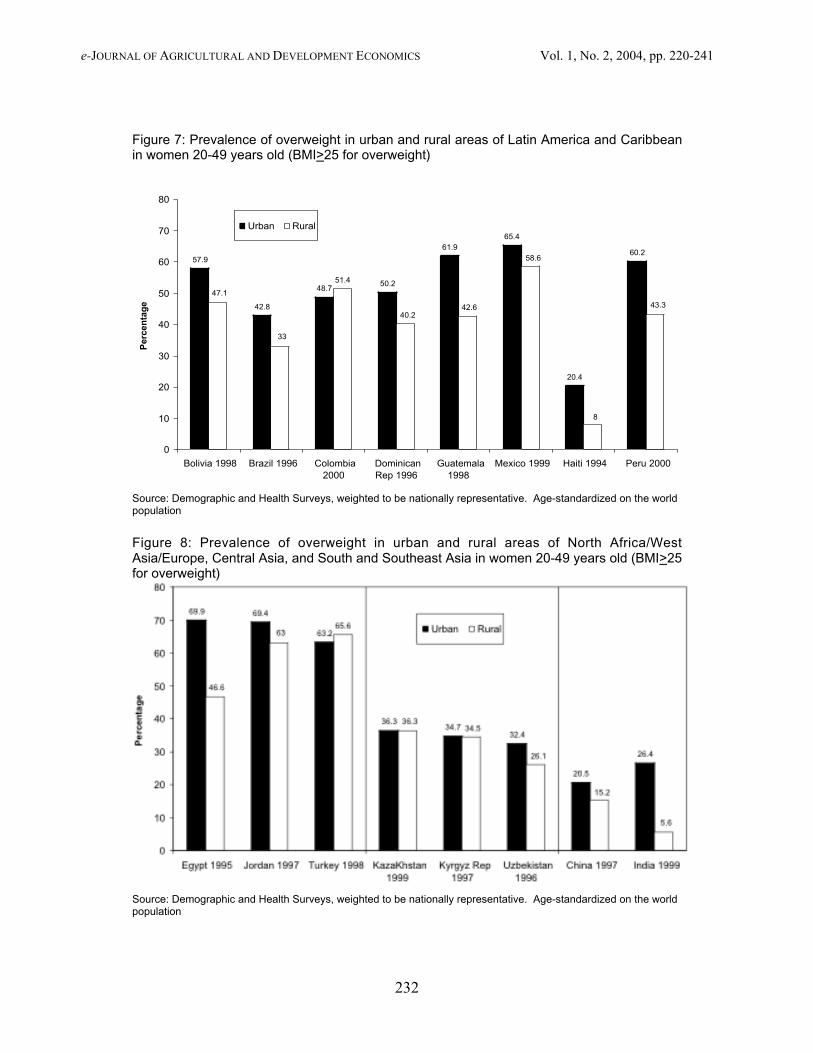
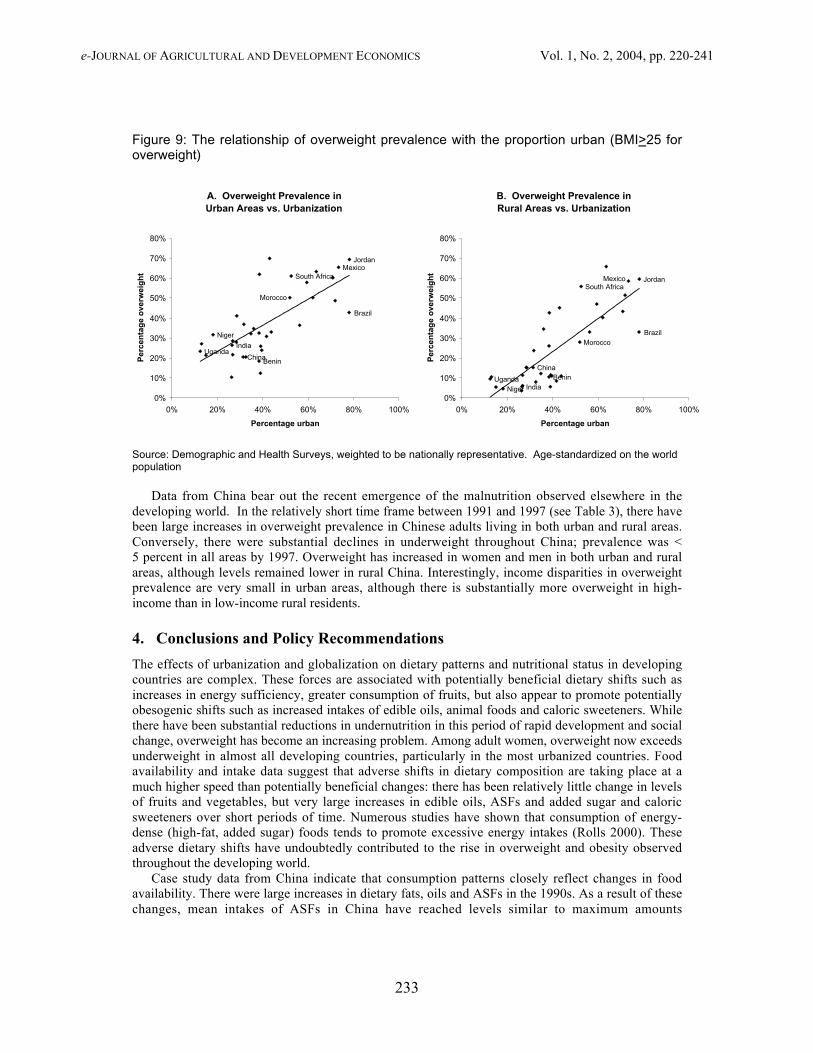
Global nutritional status changesCurrent levels of overweight-plus-obesity (hereafter “overweight”) among women in developingcountries from different regions are shown in Figures 6, 7 and 8. In most countries, overweight hasreached levels that are quite troubling, particularly in urban areas, where prevalence is generallyhighest. Among urban women across the developing world, overweight ranges from 10 to 70 percent
e-JOURNAL OF AGRICULTURAL AND DEVELOPMENT ECONOMICS Vol. 1, No. 2, 2004, pp. 220-241
230
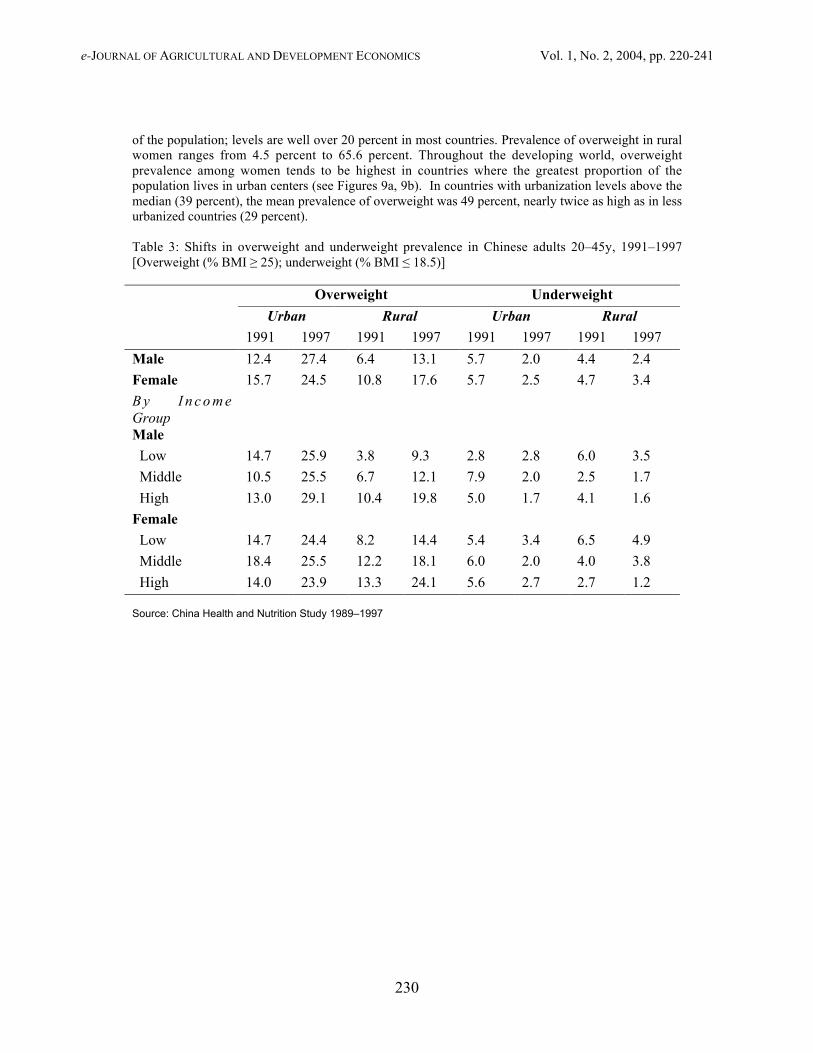
of the population; levels are well over 20 percent in most countries. Prevalence of overweight in ruralwomen ranges from 4.5 percent to 65.6 percent. Throughout the developing world, overweightprevalence among women tends to be highest in countries where the greatest proportion of thepopulation lives in urban centers (see Figures 9a, 9b). In countries with urbanization levels above themedian (39 percent), the mean prevalence of overweight was 49 percent, nearly twice as high as in lessurbanized countries (29 percent).
Table 3: Shifts in overweight and underweight prevalence in Chinese adults 20–45y, 1991–1997[Overweight (% BMI ≥ 25); underweight (% BMI ≤ 18.5)]
Overweight Underweight
Urban Rural Urban Rural
1991 1997 1991 1997 1991 1997 1991 1997
Male 12.4 27.4 6.4 13.1 5.7 2.0 4.4 2.4
Female 15.7 24.5 10.8 17.6 5.7 2.5 4.7 3.4
B y I n c o m eGroupMale
Low 14.7 25.9 3.8 9.3 2.8 2.8 6.0 3.5
Middle 10.5 25.5 6.7 12.1 7.9 2.0 2.5 1.7
High 13.0 29.1 10.4 19.8 5.0 1.7 4.1 1.6
Female
Low 14.7 24.4 8.2 14.4 5.4 3.4 6.5 4.9
Middle 18.4 25.5 12.2 18.1 6.0 2.0 4.0 3.8
High 14.0 23.9 13.3 24.1 5.6 2.7 2.7 1.2
Source: China Health and Nutrition Study 1989–1997
e-JOURNAL OF AGRICULTURAL AND DEVELOPMENT ECONOMICS Vol. 1, No. 2, 2004, pp. 220-241
231
Figure 6: Prevalence of overweight in urban and rural areas of sub-Saharan Africa in women20-49 years old (BMI>25 for overweight)
18.4 21
.3
36.7
12.3
30.7 32
.2
27.9
10.3
27
21.6
50.3
41.1
31.6
23.9
33
61
28.5
23.3 25
.9
36.8
23.4
19.5
5.4
10.5
23.7
11.5
9.411
.4
55.8
11
4.5
15.2
27.9
6.1
3.6
15.3
12.2
8.4
5.6
10.5
0
10
20
30
40
50
60
70
80
Ben
in 1
996
Bur
kina
Fas
o 19
92
Cam
eroo
n 19
98
Cen
tra
Afr
Rep
199
4
Cot
e d'
Ivoi
re 1
994
Gha
na 1
998
Ken
ya 1
998
Mad
agas
car
1997
Mal
awi 1
992
Mal
i 199
6
Mor
occo
199
2
Nam
ibia
199
2
Nig
er 1
998
Nig
eria
199
9
Sen
egal
199
2
Sou
th A
fric
a 19
98
Tan
zani
a 19
96
Uga
nda
1995
Zam
bia
1996
Zim
babw
e 19
94
Percentage
Urban Rural
Source: Demographic and Health Surveys, weighted to be nationally representative. Age-standardized on the worldpopulation
e-JOURNAL OF AGRICULTURAL AND DEVELOPMENT ECONOMICS Vol. 1, No. 2, 2004, pp. 220-241
232
Figure 7: Prevalence of overweight in urban and rural areas of Latin America and Caribbeanin women 20-49 years old (BMI>25 for overweight)
57.9
42.8
48.750.2
61.965.4
20.4
60.2
51.4
33
47.1
43.3
8
58.6
42.640.2
0
10
20
30
40
50
60
70
80
Bolivia 1998 Brazil 1996 Colombia2000
DominicanRep 1996
Guatemala1998
Mexico 1999 Haiti 1994 Peru 2000
Percentage
Urban Rural
Source: Demographic and Health Surveys, weighted to be nationally representative. Age-standardized on the worldpopulation
Figure 8: Prevalence of overweight in urban and rural areas of North Africa/WestAsia/Europe, Central Asia, and South and Southeast Asia in women 20-49 years old (BMI>25for overweight)
Source: Demographic and Health Surveys, weighted to be nationally representative. Age-standardized on the worldpopulation
e-JOURNAL OF AGRICULTURAL AND DEVELOPMENT ECONOMICS Vol. 1, No. 2, 2004, pp. 220-241
233
Figure 9: The relationship of overweight prevalence with the proportion urban (BMI>25 foroverweight)
A. Overweight Prevalence in Urban Areas vs. Urbanization
Uganda
Niger
India
South Africa
Morocco
Benin
Brazil
MexicoJordan
China
0%
10%
20%
30%
40%
50%
60%
70%
80%
0% 20% 40% 60% 80% 100%
Percentage urban
Per
cen
tag
e o
verw
eig
ht
B. Overweight Prevalence in Rural Areas vs. Urbanization
UgandaNiger India
South Africa
Morocco
Benin
Brazil
Mexico Jordan
China
0%
10%
20%
30%
40%
50%
60%
70%
80%
0% 20% 40% 60% 80% 100%
Percentage urbanP
erce
nta
ge
ove
rwei
gh
t
Source: Demographic and Health Surveys, weighted to be nationally representative. Age-standardized on the worldpopulation
Data from China bear out the recent emergence of the malnutrition observed elsewhere in thedeveloping world. In the relatively short time frame between 1991 and 1997 (see Table 3), there havebeen large increases in overweight prevalence in Chinese adults living in both urban and rural areas.Conversely, there were substantial declines in underweight throughout China; prevalence was <5 percent in all areas by 1997. Overweight has increased in women and men in both urban and ruralareas, although levels remained lower in rural China. Interestingly, income disparities in overweightprevalence are very small in urban areas, although there is substantially more overweight in high-income than in low-income rural residents.
4. Conclusions and Policy Recommendations
The effects of urbanization and globalization on dietary patterns and nutritional status in developingcountries are complex. These forces are associated with potentially beneficial dietary shifts such asincreases in energy sufficiency, greater consumption of fruits, but also appear to promote potentiallyobesogenic shifts such as increased intakes of edible oils, animal foods and caloric sweeteners. Whilethere have been substantial reductions in undernutrition in this period of rapid development and socialchange, overweight has become an increasing problem. Among adult women, overweight now exceedsunderweight in almost all developing countries, particularly in the most urbanized countries. Foodavailability and intake data suggest that adverse shifts in dietary composition are taking place at amuch higher speed than potentially beneficial changes: there has been relatively little change in levelsof fruits and vegetables, but very large increases in edible oils, ASFs and added sugar and caloricsweeteners over short periods of time. Numerous studies have shown that consumption of energy-dense (high-fat, added sugar) foods tends to promote excessive energy intakes (Rolls 2000). Theseadverse dietary shifts have undoubtedly contributed to the rise in overweight and obesity observedthroughout the developing world.
Case study data from China indicate that consumption patterns closely reflect changes in foodavailability. There were large increases in dietary fats, oils and ASFs in the 1990s. As a result of thesechanges, mean intakes of ASFs in China have reached levels similar to maximum amounts
e-JOURNAL OF AGRICULTURAL AND DEVELOPMENT ECONOMICS Vol. 1, No. 2, 2004, pp. 220-241
234
recommended in the United States guidelines and food pyramid (USDA 2000). In contrast, intakes offruits and vegetables fall below recommendations, which would be in the range of 500–700g/day(authors’ calculations based on three fruit and four vegetable servings/day)– levels comparable tothose reported for some Mediterranean countries (Moreno, Sarria and Popkin 2002). In the past twodecades, levels of fruit and vegetable availability in most regions have been relatively flat, with theexception of large increases reported for China. However, it is not clear to what extent the rise inreported availability of fruits and vegetables in China reflects patterns of human consumption.Between 1991 and 1997, fruit and vegetable availability in China nearly doubled, increasing from 324to 580g/day (88 to 152 kcals/day), while reported consumption in adults in the CHNS changed verylittle–from 354 to 369g/day. This raises questions about the accuracy of the Chinese fruit andvegetable availability data. Worldwide, current availability of fruit and vegetables–especially in sub-Saharan Africa and the Far East–remains well below availability levels in Mediterranean countries likeSpain (249 kcals/day) and Greece (359 kcals/day) (FAO 2001).
With globalization, many developing countries are experiencing large shifts in food imports.Between 1990 and 1998, there were large increases in trade in processed grain products, while trade inunprocessed bulk grains has declined (Regmi and Gehlar 2001). Similarly, there have been largeincreases in trade in oils (Williams 1984). At the same time, foreign direct investment in the foodindustry, notably supermarkets and fast food restaurants, has expanded several-fold in many countries(Reardon, Timmer and Berdegue 2003; Bolling and Somwaru 2001). For example, between 1989 and1998, sales by U.S. owned food processing affiliates in South America grew from US$5 billion to $15billion, and sales in Asia increased from US$5 billion to US$20 billion (Bolling and Somwaru 2001).These shifts have been accompanied by marketing of brands and shifts in cultural norms that haveinfluenced tastes (Chopra, Galbraith and Darnton-Hill 2002). Urbanization is associated withoccupations that involve spending more time away from home (Popkin and Bisgrove 1988). Thus inmany urbanized countries, intakes of processed foods, ready-to-eat meals and snacks, and streetvendor, restaurant and fast food meals have increased (Regmi and Gehlar 2001). These eating patternsare associated with the higher intakes of fat, sugars and energy.
Elsewhere we have written about some of the reasons for the large shifts in edible oil consumptionin developing countries (Drewnowski and Popkin 1997). Technological breakthroughs in thedevelopment of high-yield oilseeds and in the refining of high-quality vegetable oils greatly reducedthe cost of baking and frying fats, margarine, butter like spreads, and salad and cooking oils in relationto animal-based products (Williams 1984). Worldwide demand for vegetable fats was fueled by healthconcerns regarding the consumption of animal fats and cholesterol. Furthermore, a number of majoreconomic and political initiatives led to the development of oil crops not only in Europe and the US,but in South East Asia (palm oils) and in Brazil and Argentina (soybean oils) (USDA 1966).
Delgado has written perceptively about the ASF revolution in low-income developing countries, orthe increase in demand for and production of meat, fish, and milk (Delgado et al. 1999, 2001; Delgado2003). As relative commodity prices decrease and incomes increase, people usually increase thediversity of their diet and shift into higher priced commodities and processed convenience foods.While average income growth explains overall growth, urbanization and population growth also helpto explain the greater increase in ASF demand in developing countries relative to developed countries.From 1975 to 1999, animal products drove the expansion of production in developing countries, whichnow account for more than half the world’s meat production (Delgado 2003). In contrast, growth inASF production in the developed world is now flat—the market is saturated. Since 81 percent of theworld’s people live in developing countries, small shifts in their diets result in huge changes in theworld market. Since 1970 relative prices of food have dropped considerably, most dramatically forbeef (Delgado 2003). Due to market saturation and technological changes that increase productivity,the ASF revolution is projected to level off by 2020.
In many countries, we also observed large increases in consumption of sugar. Sugar is the world’spredominant sweetener but there are marked increases also in consumption of high fructose corn syrup(Bray, Nielson and Popkin 2004). Increasing sugar and sweetener use has been linked with
e-JOURNAL OF AGRICULTURAL AND DEVELOPMENT ECONOMICS Vol. 1, No. 2, 2004, pp. 220-241
235
industrialization, and with the proliferation of processed foods and beverages that have sugar added tothem (e.g. tea, coffee, cocoa, soft drinks). Elsewhere we review in far more detail the way the world’sdiet has changed with respect to added caloric sweeteners (Popkin and Nielsen 2003).
As shown using data from China these emerging, potentially adverse dietary patterns are especiallymarked in urban areas. Compared to rural dwellers, urban residents continue to consume higher levelsof fats and animal foods, along with lower intakes of vegetables. However, the dietary effects ofurbanization and globalization appear to be expanding into areas designated as rural. With markedincreases in oils and ASF consumption in rural areas, the disparity between urban and rural intakes hasbecome smaller over time. Rural consumption of these foods is particularly high in areas that arehighly urbanized in terms of infrastructure and resources. In a companion paper, we explore dietarypatterns in different urban contexts in greater detail (Mendez, Du and Popkin 2003). Only areas withvery low levels of urbanicity have maintained traditional diets, low in fat and animal source foods.“Urban” dietary patterns are likely to become more common throughout developing countries as theprocess of rural development—or increased urbanicity in rural areas—continues.
Disturbingly, there is evidence that the adverse changes in dietary intakes associated withurbanization are taking place at all levels of SES, and likely contribute the rising levels of low-incomeobesity observed in some developing countries. In China, although low-income adults consumed lowerlevels of animal foods and oils than higher-income adults, the rate of increase ASF and edible oilconsumption is, overall, faster in low-income groups. Relatively high levels of overweight wereobserved in low SES women in numerous developing countries, resulting in relatively small disparitiesin overweight between high and low SES groups.
These dietary shifts have occurred along with increased sedentarism in occupational activity andcommuting, as well as in the nature of leisure time activity (e.g. from increased television watching)(Bell, Ge and Popkin 2001, 2002; Hu et al. 2002, Tudor-Locke et al. 2002). Because of their tendencyto promote over-consumption, the dietary changes currently taking place in developing countries mayhelp to explain energy imbalance and obesity, as individuals fail to adapt their energy intakes to matchreduced energy expenditure levels. Together, these shifts in diet and activity have contributed to therising obesity observed throughout the developing world, at all income levels and increasingly in ruralareas. The high speed of change is also a concern, as individuals exposed to undernutrition earlier inlife are also making these dietary shifts. Individuals with very poor nutrition in early life may be atgreater risk of adverse consequences including diabetes, cardiovascular disease or weight gain fromthese dietary shifts (Barker 2001; Schroeder, Martorell and Flores 1999; Sawaya et al. 2003;Reddy 2002).
In addition to obesity, the dietary changes associated with urbanization and globalization are ofgreat concern because of the implications for risk of obesity-related chronic disease. Large increases inthe prevalence of numerous obesity-related chronic diseases have been documented around thedeveloping world, including diabetes and cardiovascular diseases (Kumanyika et al. 2002; Yusufet al. 2001). A large body of evidence, including data from clinical trials, shows that diets lower inmeats and fats, and richer in fruits and vegetables, reduce blood pressure and risk of diabetes incidenceas much or more than costly pharmacological treatments (Knowler et al. 2002; Vollmer, Sacks andSvetkey 2001).
Researchers working in many developing countries have begun to move beyond documentingshifts in obesity, to also document the dietary and activity shifts underlying the ongoing nutritiontransition. Studies in several other developing countries have described dietary trends similar to thosedescribed here (e.g. Shetty 2002; Kosulwat 2002). The need to develop policies appropriate for thecurrent nutrition climate, in which overweight has become a major health issue in developingcountries, has been highlighted (Uauy and Kain 2001). In a few countries, policies and programmes toshift dietary practices in developing countries to address obesity in addition to undernutrition are beingput in place, although the effectiveness of these efforts is yet unknown (Coitinho, Monteiro, Wolneyand Popkin 2002; Zhai et al. 2002).
e-JOURNAL OF AGRICULTURAL AND DEVELOPMENT ECONOMICS Vol. 1, No. 2, 2004, pp. 220-241
236
As part of its National Plan of Action for Nutrition, China has developed important educationaltools such as the Chinese pagoda, a set of dietary guidelines for Chinese residents (Zhai et al. 2002).Schools have been asked to increase time allotted to physical activity. The government has usedsubsidies to promote urban vegetable consumption in northern areas of China, and to promote ruralgardens. Promotion of pulse consumption has been identified as a strategy for maintaining proteinquality, while providing as an alternative to meats as a source of protein (Leterme and CarmenzaMuñoz 2002). As part of its nutrition plan, China has developed policies to increase soybeanproduction and consumption (Zhai et al. 2002). While meat production has nearly kept pace with risingdemand and consumption, however, increases in soybean production and consumption to date havebeen relatively small (Geissler 1999). Despite the large shifts in consumption and availability, meatimports were 1.7 percent of the total supply in 1990, and 3.6 percent in 2001 (FAO 2001). Meanwhile,estimated availability of pulses in China remains fairly low – 36.6 grams/capita/day in 2001(FAO 2001) – as do mean reported intakes of pulses in recent surveys (39.0g/day in 1991 and44.6g/day in 1997, among CHNS adults).
Brazil has also developed a new national food nutrition policy, addressing the emergence ofobesity rather than underweight as the major problem of adult malnutrition (Coitinho, Monteiro andPopkin 2002; Monteiro, Conde and Popkin 2004). In addition to continuing efforts to combatmalnutrition, components of this policy include development of nutrition labels, regulation of healthclaims about foods, and the regulation of school meals, but their effectiveness remains unknown.However, even before those policies were implemented, there was a marked decline in the rates ofincrease in obesity among high SES women (Monteiro et al. 2000). The researchers suggested thatintensive mass media attention paid to the epidemic of obesity may have contributed to the decline.Television and print media programmes provided extensive information on the consequences ofobesity, as well as on obesity prevention measures.
Developing countries may benefit from preventive measures that minimize further adverse shifts indiet, rather than attempting to reverse shifts after new dietary patterns are even more established ascultural norms. Given that adverse dietary and activity patterns appear to be widespread geographicallyand socioeconomically, strategies with broad reach are appropriate, such as the use of mass media. Theexperience in Brazil suggests that mass media nutrition education efforts may be effective for reachingsome population groups.
Another important component of obesity prevention may involve working with the food industry.In the U.S., increases in portion sizes in commercial food products may have contributed to higherintakes of energy-dense foods, and exceed standard serving sizes (Young and Nestle 2003; Nielsen andPopkin 2003). Working with or regulating the restaurant and supermarket industries to maintainappropriate portion sizes may help to minimize excess intakes. Pricing has also been shown to play akey role in food choices in both developed and developing countries (French 2003; Guo et al. 1999).The use of subsidies or other incentives to ensure that fresh fruits and vegetables are affordable mayhelp to promote healthier food choices. Since high intakes of meats are associated with increased riskof hypertension and cardiovascular disease, more effective policies, developing countries shouldcontinue to explore agricultural and educational policies that promote the production and consumptionof pulses as protein substitutes.
Tastes and preferences begin to be established in early life (Hill 2002). Therefore, schools mayprovide an important opportunistic venue through which preferences for more healthy options can beencouraged. Workplaces also provide an opportunity to encourage or provide opportunities forexercise and healthier diets, and efforts in some countries have targeted work sites (Doak 2002).Dietary policies should be accompanied by programmes to address country-specific barriers tomaintaining high levels of physical activity, such as efforts to facilitate safe active commuting, and thepromotion of physical activity during leisure-time.
e-JOURNAL OF AGRICULTURAL AND DEVELOPMENT ECONOMICS Vol. 1, No. 2, 2004, pp. 220-241
237
References
Ahmad, O.B., Boschi-Pinto, C., Lopez, A.D., Murray, C.J., Lozano, R. and Inoue, M. 1999. Agestandardization of rates: a new WHO standard. GPE Discussion Paper Series No. 31.Geneva,World Health Organization.
Barker, D., ed. 2001. Fetal Origins of Cardiovascular and Lung Disease. New York, Marcel Dekker,Inc.
Bell, C., Ge, K. & Popkin, B.M. 2001.Weight gain and its predictors in Chinese adults. Int Jour. Obes.Relat. Metab. Disord., 25(7): 1079–86.
Bell, C., Ge, K. & Popkin, B.M. 2002. The road to obesity or the path to prevention? Motorizedtransportation and obesity in China. Obes. Res., 10(4): 277–83.
Boerma, J.T. & Sommerfelt, A.E. 1993. Demographic and Health Surveys (DHS): Contributions andlimitations. World Health Stat. Qtly, 46: 222–26.
Bolling, C. & Somwaru, A. 2001. U.S. food companies access foreign markets though directinvestment. Food Rev., 24(3): 23–28 (available at http://www.ers.usda.gov/publications/FoodReview/septdec01/)
Bray, G.A., Nielsen, S.J. & Popkin, B.M. 2004. Consumption of high-fructose corn syrup inbeverages may play a role in the epidemic of obesity. Amer. Jour. of Clinical Nut., 79(4): 537–43.
Chopra, M., Galbraith, S. & Darnton-Hill, I. 2002. A global response to a global problem: Theepidemic of overnutrition. Bull. World Health Org., 80: 952–58.
Coitinho, D., Monteiro, C.A. & Popkin, B.M. 2002. What is Brazil doing to promote healthy diets andactive lifestyles? Public Health Nutr., 5(1A): 263–67.
Cook, P. & Kirkpatrick, C. 1997. Globalization, regionalization and third world development.Regional Studies, 31(1): 55–66.
Cornia, G.A. 2001. Globalization and health: Results and options. Bull. World Health Org., 79:834–41.
Delgado C.L. 2003. Rising consumption of meat and milk in developing countries has created a newfood revolution. Jour. Nutr., 133: 3907S–3910S.
Delgado, C., Rosegrant, M., Steinfeld, H., Ehvi, S. & Courbois, C. 1999. Livestock to 2020: The nextfood revolution. Food, Agriculture, and the Environment Discussion Paper 28. Washington DC,International Food Policy Research Institute.
Delgado, C., Rosegrant, M., Steinfeld, H., Ehvi, S. & Courbois, C. 2001. Livestock to 2020: The nextfood revolution. Outlook on Agr., 30(1): 27–29.
Doak, C. 2002. Large-scale interventions and programmes addressing nutrition-related chronicdiseases and obesity: Examples from 14 countries. Public Health Nutr., 5(1A): 275–77.
Dollar, D. 2001. Is globalization good for your health? Bull. World Health Org., 79(9): 827–33.
e-JOURNAL OF AGRICULTURAL AND DEVELOPMENT ECONOMICS Vol. 1, No. 2, 2004, pp. 220-241
238
Drewnowski, A. & Popkin, B.M. 1997. The nutrition transition: New trends in the global diet. Nutr.Rev., 55(2): 31–43.
Du, S., Lu, B., Zhai, F. & Popkin, B.M. 2002a. A new stage of the nutrition transition in China. PublicHealth Nut., 5(1A): 169–74.
Du, S., Lu, B., Zhai, F. & Popkin, B.M. 2002b. The nutrition transition in China: A new stage of theChinese diet. In: B. Caballero & B.M. Popkin, eds. The Nutrition Transition: Diet and Disease inthe Developing World. London, Academic Press, pp. 205–22.
Entwisle, B., Henderson, G.E., Short, S., Bouma, J. & Fengying, Z. 1995. Gender and FamilyBusinesses in Rural China. Amer. Sociol. Rev. 60: 36–57.
Evans, M., Sinclair, R.C., Fusimalohi, C. & Liava’a, V. 2001. Globalization, diet, and health: Anexample from Tonga. Bull. World Health Org., 79(9): 856–862.
Food and Agricultural Organization of the United Nations. Food Balance Sheets (available athttp://apps.fao.org). Data extracted June, 2002. Rome, FAO.
French, S.A. 2003. Pricing effects on food choices. Jour. Nutr., 133(3): 841S–843S.
Galloway, J.H. 2000. Sugar. In: K.F. Kiple & K.C. Ornelas, eds. The Cambridge World History ofFood. Vol I. New York, Cambridge University Press, pp. 437–49.
Geissler, C. 1999. China: The soyabean-pork dilemma. Proc. Nutr. Soc., 58(2): 345–53.
Guo, X., Popkin, B.M., Mroz, T.A. & Zhai, F. 1999. Food price policy can favorably altermacronutrient intake in China. Jour. Nutr., 129(5): 994–1001.
Haddad, L., Ruel, M.T. & Garrett, J.L. 1999. Are urban poverty and undernutrition growing? Somenewly assembled evidence. World Dev., 27: 1891–1904.
Hill, A.J. 2002. Developmental issues in attitudes to food and diet. Proc. Nutr. Soc., 61(2): 259–66.
Hu, G., Pekkarinen, H., Hanninen, O., Yu, Z., Guo, Z. & Tian, H. 2002. Physical activity duringleisure and commuting in Tianjin, China. Bull. World Health Org., 80(12): 933–38.
Knowler, W., Barrett-Connor, E., Fowler, S., Hamman, R., Lachin, J., Walker, E. & Nathan, D. 2002.Reduction in the incidence of type 2 diabetes with lifestyle intervention or metformin. New Eng.Journ. Med., 346(6): 393–403.
Kosulwat, V. 2002. The nutrition and health transition in Thailand. Public Health Nutr., 5(1A):183–89.
Kumanyika, S., Jeffery, R.W., Morabia, A., Ritenbaugh, C. & Antipatis, V.J. 2002. Obesityprevention: The case for action. Int. Jour. Obes., 26(3): 425–36.
Lang, T. 1999. Diet, health and globalization: Five key questions. Proc. of the Nut. Soc., 58(2):335–43.
e-JOURNAL OF AGRICULTURAL AND DEVELOPMENT ECONOMICS Vol. 1, No. 2, 2004, pp. 220-241
239
Leterme, P. & Carmenza Muñoz, L. 2002. Factors influencing pulse consumption in Latin America.Brit. Jour. Nutr., 88(Suppl 3): S251–55.
Mendez, M., Du, S. & Popkin, B.M. 2003. Urbanization, income and the nutrition transition in China:A case study. Paper prepared for the FAO technical workshop on Globalization of food systems:Impacts on food security and nutrition. 8–10 October 2003. Rome, Italy.
Mintz, S. 1977. Time, sugar, and sweetness. In: C. Counihan, & P. Van Esterik, eds. Food andCulture: A Reader. New York, Routledge, pp. 357–69.
Monteiro, C.A., Benicio, M.H., Conde, W.L.& Popkin, B.M. 2000. Shifting obesity trends in Brazil.Eur. Jour. Clin. Nut., 54: 342–46.
Monteiro, C.A. , Conde, W.L., Lu, B. & Popkin, B.M. 2004. Obesity and health inequities in thedeveloping world. Intl. Jour. of Obes. Relat. Metab. Disord., 28(9): 1181–86.
Monteiro, C.A., Conde, W.L. & Popkin, B.M. 2004. The burden of disease due to under- and over-nutrition in countries undergoing rapid nutrition transition: A view from Brazil. Amer. Jour. ofPub. Health, 94(3): 433–44.
Monteiro, C.A., Wolney, L.C. & Popkin, B.M. 2002. Is obesity replacing or adding to undernutrition?Evidence from different social classes in Brazil. Publ. Health Nutr., 5(1A): 105–12.
Moreno, L.A., Sarría, A. & Popkin, B.M. 2002. The nutrition transition in Spain: A EuropeanMediterranean Country. Eur. Jour. Clin. Nutr., 56(10): 992–1003.
Nielsen, S.J. & Popkin, B.M. 2003. Patterns and trends in food portion sizes, 1977–98. JAMA, 289(4):450–53.
Popkin, B.M. 2002a. An overview on the nutrition transition and its health implications: The Bellagiomeeting. Publ. Health Nutr., 5(1A): 93–103.
Popkin, B.M. 2002b. The shift in stages of the nutrition transition in the developing world differs frompast experiences! Publ. Health Nutr., 5(1A): 205–14.
Popkin, B.M. & Bisgrove, E.Z. 1988. Urbanization and nutrition in low-income countries. Food Nutr.Bull., 10(1): 3–23.
Popkin, B.M. & Du, S. 2003. Dynamics of the Nutrition Transition toward the Animal Foods Sector inChina and its Implications: A Worried Perspective. Jour. of Nut., 133: 3898S–3906S.
Popkin, B.M., Ge, K., Zhai, F., Guo, X., Ma, H. & Zahoor, N. 1993. The nutrition transition in China:A cross-sectional analysis. Eur. Jour. Clin. Nutr., 47(5): 333–46.
Popkin, B.M. & Nielsen, S.J. 2003. The sweetening of the world's diet. Obes.Res., 11(11): 1325–32.
Reardon, T., Timmer, C.P. & Berdegue, J.A. 2003. The rise of supermarkets in Latin America andAsia: Implications for international markets for fruits and vegetables. In: A. Regmi & M. Gehlhar,eds. Global Markets for High Value Food Products. Agricultural Information Bulletin, UnitedStates Department of Agriculture-Economic Research Service. Washington DC, USDA.
e-JOURNAL OF AGRICULTURAL AND DEVELOPMENT ECONOMICS Vol. 1, No. 2, 2004, pp. 220-241
240
Reddy, K.S. 2002. Cardiovascular diseases in the developing countries: Dimensions, determinants,dynamics and directions for public health action. Publ. Health Nutr., 5(1A): 231–37.
Regmi, A. & Gehlar, M. 2001. Consumer preferences and concerns shape global food trade. FoodRev., 24(3): 2–8.
Rivera, J.A., Barquera, S., Campirano, F., Campos, I., Safdie, M. & Tovar, V. 2002. Epidemiologicaland nutritional transition in Mexico: Rapid increase of non-communicable chronic diseases andobesity. Publ. Health Nutr., 5(1A): 113–22.
Rolls, B.J. 2000. The role of energy density in the overconsumption of fat. Jour. Nutr., 30(2S):268S–271S.
Sachs, J.D. & Warner, A. 1995. Economic Reform and the Process of Global Integration. BrookingsPapers on Economic Activity, 25th Anniversary Issue. 1: 1–118.
Sawaya, A.L., Martins, P., Hoffman, D. & Roberts, S.B. 2003. The link between childhoodundernutrition and risk of chronic diseases in adulthood: A case study of Brazil. Nutr. Rev., 61(5 Pt1): 168–75.
Schroeder, D.G., Martorell, R. & Flores, R. 1999. Infant and child growth and fatness and fatdistribution in Guatemalan adults. Amer. Jour. Epidemiol., 149(2): 177–85.
Shetty, P.S. 2002. Nutrition transition in India. Publ. Health Nutr., (1A): 175–82.
Stookey, J.D., Mendez, M.A., Adair, L.S. & Popkin, B.M. 2003. Measuring urbanization and itspotential impact on health: The China case. (Chapel Hill, NC unpublished manuscript)
Tudor-Locke, C., Neff, L.J., Ainsworth, B.E., Addy, C.L. & Popkin, B.M. 2002. Omission of activecommuting to school and the prevalence of children's health-related physical activity levels: TheRussian Longitudinal Monitoring Study. Child Care Health Dev., 28(6): 507–12.
Uauy, R. & Kain, J. 2002. The epidemiological transition: need to incorporate obesity prevention intonutrition programmes. Public Health Nutr., 5(1A): 223–29.
United Nations Population Division. 2002. World Urbanization Prospects: The 2001 Revisionavailable at http://www.un.org/esa/population/publications/wup2001/ WUP2001Annextab.pdf).
United States Department of Agriculture. 1966. U.S. Fats and Oils Statistics, 1909–1965. StatisticalBulletin No. 376. ERS. Washington DC, USDA.
United States Department of Agriculture-Center for Nutrition Policy and Promotion. 2000. DietaryGuidelines For Americans (available at http://www.health.gov/dietaryguidelines/dga2000/document/contents.htm).
Vollmer, W.M., Sacks, F.M. & Svetkey, L.P. 2001. New insights into the effects on blood pressure ofdiets low in salt and high in fruits and vegetables and low-fat dairy products. Curr. Control TrialsCardiovasc. Med., 2(2): 71–74.
Williams, G.W. 1984. Development and future direction of the world soybean market. Quar. Jour.Intl. Agr., 23: 319–37.
e-JOURNAL OF AGRICULTURAL AND DEVELOPMENT ECONOMICS Vol. 1, No. 2, 2004, pp. 220-241
241
World Bank. 2001. World Development Report 2000/2001: Attacking Poverty. New York, OxfordUniversity Press.
Young, L.R. & Nestle, M. 2003. Expanding portion sizes in the US marketplace: Implications fornutrition counseling. Jour. Amer. Diet. Assoc., 103(2): 231–34.
Yusuf, S., Reddy, S., Ounpuu, S. & Anand, S. 2001. Global burden of cardiovascular diseases: Part I:General considerations, the epidemiologic transition, risk factors, and impact of urbanization.Circulation, 104(22): 2746–53.
Zhai, F., Fu, D., Du, S., Ge, K., Chen, C. & Popkin, B.M. 2002. What is China doing inpolicy-making to push back the negative aspects of the nutrition transition? Publ. Health Nutr.5(1A): 269–73.