Embed Size (px)
Citation preview
1
Glottal and Vocal Tract Characteristics of VoiceImpersonators
Talal Bin Amin, Student Member, IEEE, Pina Marziliano, Member, IEEE, and James Sneed German
Abstract—Voice impersonators possess a flexible voice whichallows them to imitate and create different voice identities. Theseimpersonations present a challenge for forensic analysis andspeaker identification systems. To better understand the phe-nomena underlying successful voice impersonation, we collecteda database of synchronous speech and ElectroGlottoGraphic(EGG) signals from three voice impersonators each producingnine distinct voice identities. We analysed glottal and vocal tractmeasures including F0, speech rate, vowel formant frequencies,and timing characteristics of the vocal folds. Our analysisconfirmed that the impersonators modulated all four parametersin producing the voices, and provides a lower bound on the scaleof variability that is available to impersonators. Importantly,vowel formant differences across voices were highly dependenton vowel category, showing that such effects cannot be capturedby global transformations that ignore the linguistic parse. Weaddress this issue through the development of a no-referenceobjective metric based on the vowel-dependent variance of theformants associated with each voice. This metric both ranksthe impersonators natural voices highly, and correlates stronglywith the results of a subjective listening test. Together, theseresults demonstrate the utility of voice variability data for thedevelopment of voice disguise detection and speaker identificationapplications.
Index Terms—acoustic, disguise, glottal, speech rate, openquotient, formant, vocal tract, voice impersonator, voice identity.
I. INTRODUCTION
VOICE impersonation is an art which involves changingone’s voice to sound like another person. It is mostly
used for entertainment purposes (e.g., for caricaturization andin media related fields). However, the study of voice imper-sonators is also important in other fields of research includingforensics [1], speaker recognition [2], Text-To-Speech (TTS)synthesis and voice conversion [3]. From the point of view offorensics, for example, one can mask one’s identity throughvoice disguise in order to avoid being identified. It is thereforeimportant to develop methods that allow law enforcement au-thorities to identify individuals in spite of such modifications.Similar issues apply to security systems based on speakerrecognition, which are also vulnerable to circumvention byvoice impersonators [4], [5]. Currently, many speech trans-formation applications such as voice conversion [6], [3] andText-To-Speech (TTS) synthesis also suffer from a lack of
Talal Bin Amin is a Ph.D. student at the School of Electrical and ElectronicEngineering, Nanyang Technological University, 639798 Singapore e-mail:[email protected].
Pina Marziliano is an Associate Professor in the Division of InformationEngineering at the School of Electrical and Electronic Engineering andJames Sneed German is an Assistant Professor in the Division of Linguisticsand Multilingual Studies at the School of Humanities and Social Sciences,Nanyang Technological University, Singapore.
naturalness in the synthesized speech. This suggests that keyaspects of speech that contribute to naturalness are beingignored by current speech transformation techniques. Thereexists a need, therefore, to identify the set of voice parametersthat are involved in successful (i.e., natural-sounding) voicemodification, and to explore how these can be used to improvevoice disguise identification, voice identity detection, as wellas how these parameters can be manipulated in a way thatpreserves naturalness across transformations.
A direct inspiration can be drawn from voice impersonators,who successfully maintain both naturalness and individualitywhile producing different voice identities. Such imperson-ations can be natural enough to deceive humans as well asautomated speaker identification systems [4], [5].
The analysis of the glottal and vocal tract parametersof impersonated voices can be useful for voice disguiseidentification, where there is a need to identify a set ofparameters that can be used to determine whether a voice isdisguised or not. In this regard, the analysis and comparisonof an impersonator’s natural voice with the impersonated(disguised) voices reveals how various acoustic parameters aremanipulated to extend a space of disguised voices around thenatural voice. It can also reveal any invariant parameters orsystematic relationships between the natural and impersonatedvoices, either of which may be readily exploited for voicedisguise identification. In [3] the need for studying voiceimpersonators was specifically highlighted in connection withvoice conversion applications in order to better understand howthe issue of naturalness under identity changes can be betterincorporated into speech transformation algorithms.
Not all portions of the range of variation that a speaker iscapable of producing will result in natural-sounding speech. Atthe same time, there are limitations on the range of variationthat a given speaker can produce. Speech parameters such asF0 (pitch) range and formant frequency, for example, maybe constrained by a speaker’s physical traits (esp. vocal cordanatomy and vocal tract length). As a first step, then, it isimportant to be able to model not only the amount and typeof variation within the total parameter space that results innatural-sounding voices, but also to consider which regionsof that space are achievable by a single speaker given hisor her inherent physical limitations. In that sense, a centralgoal of our study is to begin to “map out” the space ofvariation in speech parameters that corresponds to natural-sounding speech, and to do so in a way that takes into accountspeaker-specific limitations.
Some voice parameters can be important both for speakeridentity as well as for the actual linguistic content of theutterances involved. Vowel formant frequencies, for example,
2
are influenced by vocal tract length, and therefore serve as animportant cue to a speaker’s age and gender. Simultaneously, itis the relative differences between vowel formant frequenciesthat ultimately creates the distinction between different vowelsounds (e.g., the difference between the vowels in the words“bed” and “bad”). Crucially, this suggests that the space ofvariation cannot be correctly modeled without taking intoaccount linguistic structure. A second goal of our study, there-fore, is to explore the extent to which the variation exhibitedacross different natural-sounding voice identities depends onlinguistic structure in a systematic way. In essence, we seek totest whether the shape of this parameter space is influenced orconstrained by specific features of the language involved. Moregenerally, we hope to bring to light previously undocumentedchallenges faced by current approaches to voice disguise,speaker identification, voice conversion, and speech synthesis,and to identify potential solutions to those challenges.
Studies on voice impersonation are limited [4], [7], [8],[9]. The focus of existing studies has been to determine howclosely an impersonator can approximate a target speaker, aswell as whether the glottal and vocal tract measures exhibit aclose correspondence. Different data sets have led to differentobservations in this regard. For example, in [7], 30-secondexcerpts of uninterrupted Swedish sentences were analyzed,while in [8], only two short Japanese sentences were used.In [4], different sentences were used for different target voices,and only one word was common to all sentences and thereforeuseful for comparison. Additionally, the sentences used in [4]were designed to be humorous and therefore lacked emotionalneutrality, a fact which may have confounded or masked theeffects of voice identity. In [7], it was concluded that the voiceimpersonator found it difficult to accurately modify vocal tractcharacteristics towards the target speaker, whereas in [8] theimpersonator was able to modify both the prosodic and vocaltract characteristics towards the target speaker. The differentoutcomes among these studies may be attributed to the fact thatthe impersonators had different skill sets, and different voicetargets to imitate in different languages. In all four previousstudies, the goal of the impersonator was to imitate the voicesof specific speakers.
This is in contrast to our study, where the impersonatorscreatively adapted their voices to produce character voicesfrom their own repertoire. While the impersonators gavelabels to some of these voices that were indicative of certainidentity traits (e.g., “high pitch female”), they were not giveninstructions to target specific identities, voices, or identitytraits. This allowed the impersonators to more fully expressthe flexibility of their voices, by impersonating a wide rangeof voice identities that they were comfortable producing.This in turn allowed us to explore the issues of variationand naturalness rather than similarity to a target speaker. Inour previous study [10], we analyzed nine different voicesfrom a single voice impersonator using a single sentence. Inthis paper, we build upon the previous analysis and bettergeneralize our earlier findings by (i) using three impersonators(including one from the previous study [10]), (ii) using a morecomprehensive sample of vowel categories for the analysis ofthe vocal tract characteristics, and (iii) using a total of 486
sentence tokens for analysis (versus 9 in the previous study).Crucially, none of the previous studies have investigated
how vocal fold behavior changes when an impersonator pro-duces different voices. For languages like English, vocal foldbehavior (e.g., creakiness or breathiness) is largely unimpor-tant for word or sentence meaning, though it is known to be as-sociated with social identity traits, especially gender [11]. Wetherefore hypothesize that our voice impersonators will be ableto recruit variation in vocal fold parameters in their attemptto create distinct voice identities. If they cannot, then there isevidence for one or more speaker-specific stable parametersthat may be useful for speaker identification or voice disguiseidentification. Here, we make use of the ElectroGlottoGraphic(EGG) signal, which provides a direct representation of thevocal fold vibration patterns and is free from the filteringeffects of the vocal tract. The EGG signal has been found to beindependent of vowel category [12] and to depend primarily onthe anatomical characteristics of a speaker’s vocal folds [13].While a few studies have shown that the EGG signal can beused for speaker identification [13], this is, to our knowledge,the first study to use EGG signals for the analysis of voiceimpersonations.
In the first part of our study, we seek to determine whichvocal and acoustic parameters the impersonators make use ofin order to achieve different voice identities, and to a certainextent, the relationship of those parameters to specific identitytraits indicated by the associated labels (e.g., age or gender).The parameters we chose to investigate are in fact largelymotivated by what is already believed to have implicationsfor voice identity (e.g., F0 or pitch is indicative of gendersince female speakers are generally associated with a highermean F0 and greater temporal variation than males [14],[15], [16]), though identifying such associations was not thecentral goal of this study since these are mostly well-known.Instead, we seek to explore the issue of how large the spaceof variation is within the constraints of naturalness, and howthis is influenced by both speaker-specific traits as well aslinguistic structure (in this case, the structure of the Englishvowel inventory). In the second part of the paper, we reportthe results of a subjective test by naive listeners that providesan estimate of how realistic the impersonated voices wereand relates this to their natural voice productions. Since ourfindings on vowel formants reveal an important effect of vowelcategory dependency, we introduce a no-reference objectivemeasure for voice disguise that accounts for such effects.The resulting scores of this objective test are then comparedagainst those of the listening test. Section II explains thedata collection process, Section III describes each part of theanalysis in detail, including additional background, results andpreliminary conclusions and Section IV concludes the paper.
II. DATA COLLECTION
Three professional voice-over artists (one female, two male)served as the impersonators in this study. We refer to themhenceforth as impersonator 1F, 2M and 3M respectively. Thefirst and dominant language of all three impersonators isEnglish, with some differences in dialectal features (South

3
TABLE IMEAN AND STANDARD DEVIATION OF F0 IN HERTZ.
(a) Impersonator 1FVoice Label µµµ σσσV8 YM 151.43 33.78V5 OM 159.39 47.28V1 - 196.75 53.81V6 OF 212.72 64.15V3 - 258.80 88.27V4 YM 266.96 63.66V9 YF 274.73 67.81V7 YF 294.34 70.99V2 - 414.87 88.15
(b) Impersonator 2MVoice Label µµµ σσσV1 - 94.52 25.06V6 - 100.49 36.59V2 - 103.82 44.53V5 - 124.45 28.66V7 OM 150.53 34.63V3 - 155.73 51.39V9 YM 170.39 57.79V8 OM 204.14 58.27V4 YF 235.85 62.81
(c) Impersonator 3MVoice Label µµµ σσσV8 - 113.73 52.98V7 OM 123.75 36.36V1 - 125.25 32.60V6 - 142.54 36.92V9 - 149.67 48.30V4 - 166.93 39.94V2 - 178.53 35.82V5 - 185.98 40.43V3 - 309.19 70.24
Asian, Southeast Asian and North American for 1F, 2M and3M, respectively).
Data collection took place inside a sound-attenuated room,and synchronous speech and EGG signals were recorded fromthe productions. The speech signal was recorded using anAKG C520L head-mounted condenser microphone. The EGGsignals were obtained using a EG2-PCX2 Electroglottogramby Glottal Enterprises [17]. This required placing two elec-trodes, 35mm in diameter, externally over the larynx in orderto measure the electrical conductance of the vocal folds duringvoiced phonation. The analog speech and EGG signals werecaptured on separate channels using a Zoom H4n recorder, andwere digitized in WAV format at a sampling rate of 44.1 kHzwith 16-bit resolution. Following the recording, the speechdata was segmented at both the word- and phone- 1 level usingthe Penn Phonetics Lab Forced Aligner [18]. The results ofthe automated segmentation were then manually corrected bya trained phonetician.
A. Protocol
The impersonators were given no target speakers to imitateand had the freedom to choose the voices they wanted toimpersonate. They were instructed to use a consistent regionalvariety of English across the nine voices being impersonated,but were given freedom to vary any other identity charac-teristics of the voices including age and gender. Each voiceimpersonator produced nine distinct voice identities whichincluded eight (fictional) character voices and their naturalvoices. Thus a total of 27 distinct voice identities wereproduced by the voice impersonators. All of these voices werenatural-sounding and readily distinguished from each other.
B. Speech material
The same speech materials were used for all 27 voicesamples, and consisted of nine short sentences. For each imper-sonated voice, the impersonators produced the nine sentencesin a sequence, and then repeated the sequence in the samevoice, for a total of 18 sample sentences per voice. Thus atotal of 486 sentences were collected for analysis.
Each sentence included two monosyllabic target wordscontaining one of the vowels /æ/, /2/, /I/, /i/, /u/, and /E/.
1A phone is a unit of speech, or segment, that can be distinguished onthe basis of articulatory, acoustic and perceptual properties. In our data, it isroughly equivalent to an allophone.
These target vowels were chosen (a) to provide a representativesample of the overall vowel ‘space’ of English (i.e., theorganization of vowels in the F1-F2 plane, explained in moredetail in Section III-C), and (b) because they are relativelyrobust to subtle differences in regional dialect (e.g., the vowelin ‘heard’ was excluded on this basis, since American speakerstend to produce it with a stronger ‘r’-quality than mostBritish speakers). Factors affecting word prominence, suchas sentence stress and phrasing, are known to affect vowelformant measures [19]. To maximize consistency across sam-ples, therefore, target words were placed in positions withinthe sentence that are associated with maximal prominence.Specifically, the sentences were designed so that target wordswould be produced with a nuclear accent and occur at the rightedge of an intonational phrase boundary.
III. ANALYSIS AND RESULTS
According to the source-filter theory of speech produc-tion [20], the fundamental frequency (F0) and speech ratecan be viewed as source characteristics, while the formantsreflect the filtering effects of various vocal tract parameters,particularly the positioning of the tongue, lips, jaw, etc. All ofthese features may be readily extracted from the speech signal.In this section, we present the critical analysis and results forthese voice parameters.
A. Glottal measures
1) Fundamental frequency (F0): Fundamental frequency(F0) is the acoustic correlate of perceived pitch in speech.Since certain F0 characteristics of speech may vary signif-icantly from speaker to speaker, it is important to considertheir relevance for voice identity. A number of studies [14],[15], [16] have investigated the role of mean F0 values fordistinguishing the voices of men and women. Overall, themean F0 tends to be inversely correlated with the length andsize of the vocal folds, thus men generally have a lower meanF0 compared to women [21], while adults tend to have a lowermean F0 than children. Additionally, women tend to exhibita higher degree of temporal variation in F0 than men [22],[23], meaning that there are more frequent peaks and valleysin the temporal F0 contour, and the differences between thosepeaks and valleys tend to be larger. It is therefore important toconsider the extent to which the voice impersonators exploit
4
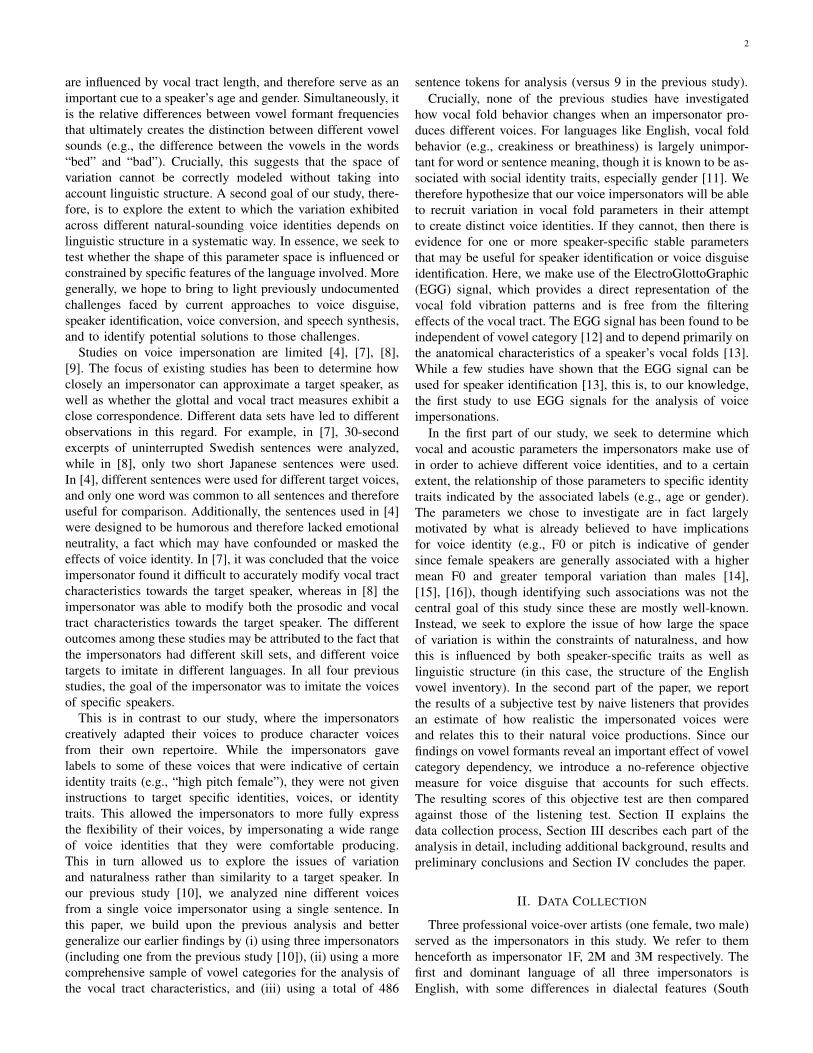
TABLE IIMEAN AND STANDARD DEVIATION OF THE SPEECH RATE (SYLLABLES PER SECOND).
(a) Impersonator 1FVoice Label µµµ σσσV5 OM 2.33 0.36V7 YF 2.52 0.35V6 OF 2.53 0.29V3 - 3.48 0.47V1 - 3.95 0.61V2 - 3.81 0.47V9 YF 4.08 0.60V4 YM 4.31 0.41V8 YM 4.48 0.46
(b) Impersonator 2MVoice Label µµµ σσσV8 OM 3.19 0.48V5 - 3.25 0.45V6 - 3.31 0.51V7 OM 3.46 0.47V2 - 3.54 0.53V3 - 3.94 0.55V1 - 4.17 0.48V4 YF 4.19 0.57V9 YM 4.22 0.55
(c) Impersonator 3MVoice Label µµµ σσσV7 OM 3.42 0.55V1 - 3.70 0.52V5 - 3.85 0.64V9 - 4.03 0.49V6 - 4.06 0.51V3 - 4.09 0.65V4 - 4.20 0.71V2 - 4.53 0.69V8 - 4.61 0.75
this variability in F0 characteristics in creating the variousvoice identities.
For the F0 analyses, Praat [24] was used to first obtainF0 samples at 10 ms intervals, using a frequency window of75-600 Hz. The mean and standard deviation were estimatedfrom all samples occurring within the voiced portions ofall 18 sentences for a given voice. Table-I shows the meanand the standard deviation of F0 for all the voices of thethree impersonators arranged by mean F0. The various voiceidentities are represented by Vi, where i refers to the voicenumber for that speaker, and V1 is always the natural voice.In some cases, the impersonators provided labels for the voicesthat were indicative of either age or gender identity. Weindicate this using a combination of the labels “Y” (young),“O” (old), “M” (male), and “F” (female). Speakers chose theirvoices freely, and numbering was assigned arbitrarily, so thereis no correspondence between same-numbered voices acrossimpersonators.
A first glance at Table I reveals that all impersonators wereflexible with their pitch in creating different voice identities.The mean F0 exhibited a range of at least one octave across thevoices for each impersonator. Not surprisingly, the male voicesranked consistently lower than the female voices both in termsof mean F0 and standard deviation. For the female speaker 1F,the two voices with the lowest mean and standard deviation(V5 and V8) are both male, while for the male speaker 2M,the voice with the highest mean and standard deviation i.e.V4is the only female voice he produced. While the role of age isless apparent, it can be noted that for 1F, the “old female” (V6)has the lowest mean and standard deviation among the femalevoices, while the “old male” is very close to the bottom ofthe range. 2M and 3M show a similar tendency. A one-wayANOVA confirmed that the effect of voice on mean F0 is sig-nificant for all three impersonators (F (8, 51216)=7606.244,F (8, 42224)=4755.150, F (8, 43253)=8367.154; p<0.05 for1F, 2M and 3M, respectively).
These results confirm our assumption that the impersonatorswould exploit the stereotypical correspondences between F0and identity in order to achieve different voice identities. It alsoillustrates the sense in which variability for a given parametermay be limited on a speaker-specific basis. Even when 1F wasusing a stereotypically male voice, her mean F0 was higherthan the lowest voices for the two male impersonators, 2Mand 3M. Similarly, neither 2M or 3M exhibited a mean F0
as high as the maximum for 1F, and their standard deviationswere remarkably consistent in being lower than those for 1F.Interestingly, the lowest voice for 2M is his natural voice (onboth measures), suggesting that he typically speaks near thebottom of his range, and can only increase both the mean andstandard deviation of F0 in order to achieve variation in voiceidentity.
2) Speech Rate: Speech rate has been linked to a numberof stylistic factors, though it can also be related to speakeridentity features, including gender and age. Men, for example,generally speak faster than women [25], [26], [27] while youngadults tend to speak faster than older adults [26], [27], [28]. Wetherefore explored the extent to which differences in speechrate were exploited by the voice impersonators in creatingdifferent voice identities.
The speech rate, in syllables per second, was calculatedfor each voice by counting the total number of syllables ineach sample and then dividing by the overall duration of allnon-silent portions of the sample. Table-II shows the averagespeech rate and standard deviation for the voices of eachimpersonator arranged by the average speech rate. All imper-sonators showed differences in speech rate across the voices ofat least 32% (for 2M) and as much as 92% (for 1F). Consistentwith earlier studies on age effects, the highest and lowestspeaking rates for each impersonator were instantiated by“young” and “old” voices respectively. Additionally, “young”and “old” voices tend to cluster at the top and bottom of therange, respectively, for each impersonator. The exception isV7 of 1F, which impressionistically sounds like a small childspeaking deliberately and somewhat effortfully. The role ofgender is less clear. The fastest speaking rate for both 1F and2M was instantiated by a male voice rather than a femaleone (as predicted), though overall, the effect of age appearsto dominate. Since these labels do not represent controlledvariables in the proper sense (e.g., a given “young” voice maynot correspond to precisely the same age as another “young”voice), it is not possible to clearly isolate the contributionof gender. Nevertheless, our results confirm the predictionthat impersonators use speech rate as an important parameterin the creation of distinct voice identities, and they providean indication of the amount of variability that is achievablefor a given speaker within the bounds of naturalness andindividual physical traits. A one-way ANOVA revealed thatthere was a significant effect of voice on the speech rate for all
5
three impersonators (F (8, 153)=53.760, F (8, 153)=12.800,F (8, 153)=6.603; p<0.05 for 1F, 2M and 3M, respectively).
B. Measures using the Electroglottogram
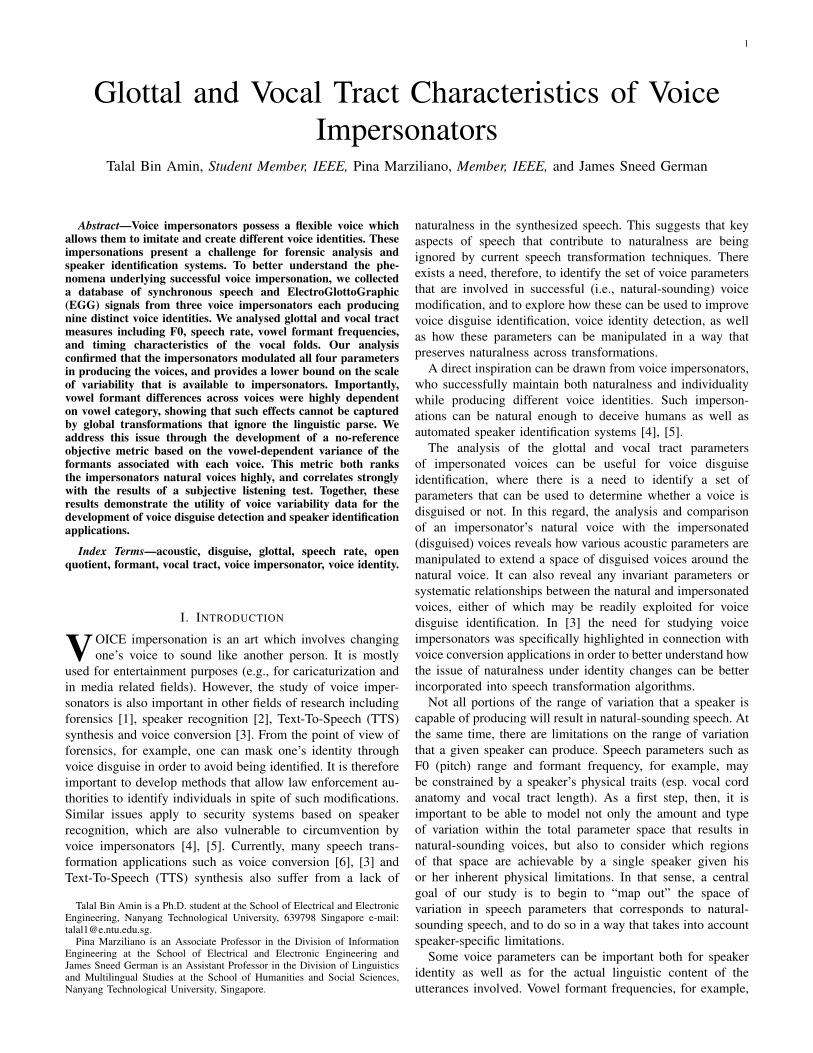
The ElectroGlottoGraphic (EGG) signal provides an esti-mate of the vocal fold contact area [29] by measuring theelectrical conductance between the vocal folds. It is useful foranalyzing the complex three dimensional movements of thevocal folds since it provides an image of the signal generatedat the glottis. Compared to the speech signal, then, the EGGsignal is generally free from the filtering effects of the vocaltract. Historically, the EGG signal has been used for detectingvoice quality [30] as well as for speaker identification [13].Some studies including [31] have suggested that speakers donot possess as much voluntary control over their vocal foldbehavior as compared to their vocal tract characteristics. Therationale behind using the EGG signals is therefore to explorewhether and in what ways the voice impersonators activelyexploit differences in vocal fold patterns while impersonatingdifferent voices. The measure used for our study was theOpen Quotient (OQ), which is directly related to the timingcharacteristics of the vocal folds, and is described in detailbelow. A number of studies have reported a correspondencebetween this measure and various identity features, includingage and gender [32], [33], [34], as well as voice quality [30].On that basis, we predicted that OQ would differ across voicesfor a given speaker, and that these differences would show anapproximate correspondence with the identity labels providedby the impersonators.
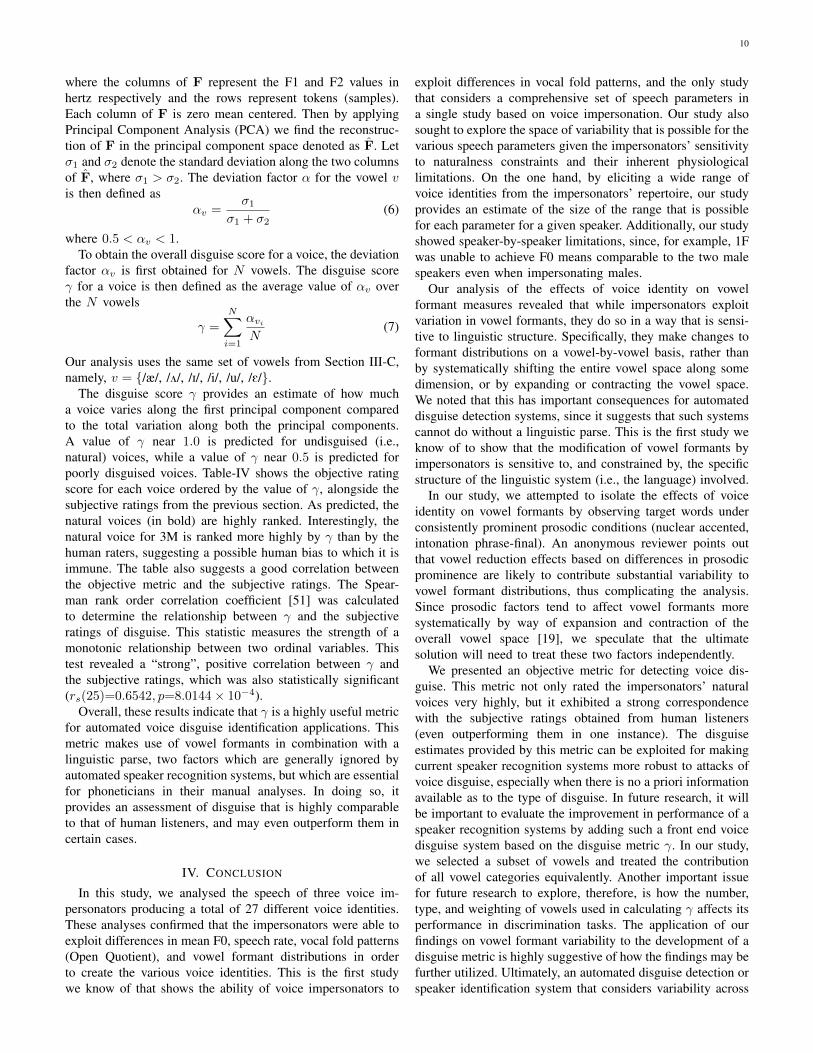
For voiced phonation, the vocal folds vibrate in a periodicmanner, moving in and out of contact with each other. Thus,the EGG signal also varies periodically as a function of thecontact area between the vocal folds. Now consider a vocalfold vibratory cycle in which the vocal folds are initiallynot in contact, resulting in the electrical conductance beingminimum. As the vocal folds begin to move in contact, theelectrical conductance starts to increase. The time instant atwhich the glottis becomes closed is called the Glottal ClosingInstant (GCI). The glottal closing is generally abrupt andappears as a steep slope in the EGG signal as shown inFigure 1. It is widely accepted that the GCI appears as asharp positive peak in the Differentiated ElectroGlottoGraphic(DEGG) signal [29], [35]. The glottis then remains closedfor a short period of time before the vocal folds start sep-arating again, causing the measured electrical conductance todecrease. The time instant at which the glottis becomes openedis called the Glottal Opening Instant (GOI). The GOI appearsas a low amplitude peak in the DEGG signal with a polarityopposite to that of the GCI peak [35]. The EGG and DEGGsignals corresponding to a voiced segment of speech togetherwith the labeled GCIs and GOIs are shown in Figure 1. Usingthe GCIs and GOIs as two distinct landmarks in the DEGGsignal, we can now define some of the glottal parameters, i.e.the open and close phase as shown in Figure 1. The period oftime for which the glottis remains closed over a glottal cycleis called the Closed Phase (CP). For the kth glottal period
0 0.004 0.008 0.012
−0.5
0
0.5
1
Time (seconds)
1/R
esis
tanc
e
EGGDEGGGCIsGOIs
CP OP
Fig. 1. The EGG and DEGG signals corresponding to a voiced speechsegment with the labeled GCIs and GOIs.
T(k), the CP(k) and OP(k) are defined as
CP(k) = GOI(k)− GCI(k). (1)
The period of time for which the glottis remains opened over aglottal cycle is called the Open Phase (OP). For the kth glottalperiod T(k), the OP(k) is given as
OP(k) = GCI(k + 1)− GOI(k). (2)
The time period of the kth glottal cycle is then defined as
T(k) = CP(k) + OP(k). (3)
Once the CP and OP are obtained, we can define the openquotient.
1) Open Quotient (OQ): The OQ represents the percentageof time for which the glottis remains opened over a glottalperiod. For the kth glottal period, the OQ(k) is defined as
OQ(k) = OP(k)/T(k). (4)
Various studies have investigated the relationship betweenthe OQ and the perceived age and gender of the speaker.The authors in [32], [33] report that the OQ decreases withincreasing age for females, while in [32] the OQ increasedwith increasing age for males. Since the OQ measure has beenfound to be mostly independent of the vowel category [12],in our study, all target vowels for a given voice were used toobtain the final estimate of its mean and standard deviation.Table-III shows the mean OQ and its standard deviation forthe voices of all three impersonators arranged by mean OQ.The method in [36] was used to estimate the GCIs and GOIsfrom the DEGG signals.
From Table-III, we find that overall, the “young” voices con-sistently showed higher OQ means than the “old” voices (in thecase of 1F and 2M). Consistent with earlier studies showing aninteraction between age and gender, within the young voices,female voices had higher OQ means than male voices, whilethere was no difference between genders for the two old voicesproduced by 1F. There was a significant effect of voice on the
6
TABLE IIIMEAN AND STANDARD DEVIATION OF OPEN QUOTIENT
(a) Impersonator 1FVoice Label µµµ σσσV5 OM 0.60 0.11V6 OF 0.60 0.20V8 YM 0.61 0.13V3 - 0.63 0.22V4 YM 0.70 0.13V7 YF 0.72 0.12V1 - 0.72 0.12V9 YF 0.73 0.09V2 - 0.78 0.09
(b) Impersonator 2MVoice Label µµµ σσσV1 - 0.54 0.14V6 - 0.57 0.16V8 OM 0.59 0.17V7 OM 0.61 0.13V5 - 0.65 0.15V9 YM 0.75 0.08V2 - 0.78 0.12V3 - 0.79 0.07V4 YF 0.79 0.07
(c) Impersonator 3MVoice Label µµµ σσσV9 - 0.43 0.09V4 - 0.46 0.07V5 - 0.48 0.05V2 - 0.48 0.06V1 - 0.49 0.09V7 OM 0.52 0.17V6 - 0.55 0.14V8 - 0.58 0.23V3 - 0.83 0.07
mean OQ for all three impersonators (F (8, 7286)=203.998,F (8, 5257)=319.113, F (8, 6332)=1806.637; p<0.05 for 1F,2M and 3M, respectively). Together, these results show that theimpersonators not only have significant voluntary control overtheir vocal fold patterns, but that they actively manipulatedthese patterns in order to achieve distinct voice identities.
C. Vocal tract measures
Formant frequencies are identified by the peaks in thespectral envelope of the speech signal, and are determined bythe natural resonances of the vocal tract. For a given speaker,changes in formant frequencies depend primarily on changesin the shape and position of the articulators (tongue, lips, jaw,etc.) during speech production. For linguistic purposes, thefirst two formant frequencies, F1 and F2, are the principleacoustic correlates of perceptual differences among vowelcategories, and are also responsible for subtle differencesbetween tokens (spoken instances) of the same vowel. A usefulway to visualize relationships between the vowels and formantfrequencies is through a two-dimensional Cartesian plot ofF1 versus F2, otherwise known as the “vowel space” (seeFigure 2 for example). Each data point in the vowel spacerepresents a token of a particular vowel category, and differentvowel categories will tend to have distributions of tokens thatoccupy different regions of the space. The vowel category/i/, for example, tends to occupy a region corresponding toa low F1 and a high F2, while /a/ tends to have a high F1and a low F2. It is this differentiation that makes it possiblefor vowel sounds, which are distributed over a continuousspace, to be perceived and represented in discrete, categoricalterms. Nevertheless, there is typically some overlap betweenthe distributions of neighboring vowels, and the arrangementand positioning of vowels in the vowel space can be sensitiveto dialectal [25], stylistic [37], prosodic [19], [25], and impor-tantly for our study, speaker-specific factors (esp. the lengthand proportioning of the vocal tract) [38].
One important influence of the speaker has to do with thefact that the overall range of formant values depends inverselyon vocal tract length. In general, men have a vocal tract thatis approximately 20 cm longer than females [39], so it isexpected that men have lower overall formant frequenciesthan females when producing the same vowel [40]. Sincevocal tract length increases as children grow, adults gener-ally have lower overall formant frequencies than children.
Additionally, speakers may vary in how spread out theirvowels are from one another in the vowel space (otherwiseknown as “dispersion”). For American English speakers, thisdifference can be recruited as a marker of identity, with femaleand gay male speakers generally showing higher levels ofdispersion than other groups [41], [42]. In short, speakers tendto exhibit substantial variation in the overall positioning ofvowels in the vowel space, though the relative positions ofthe vowels tend to be constant for a given language. Giventhat formant frequencies are an important cue to differencesbetween speakers, they are predicted to be an important sourceof variability for voice identity construction [43]. We thereforeanalyzed the key formants (F1 and F2) of six vowel categoriesin the inventory of English, in order to explore whether thevoice impersonators systematically manipulated aspects of therange, positioning, and distribution of the vowels in theirattempts to create distinct voice identities.
The Burg method in Praat [24] was used to obtain formantmeasures by estimating the value of F1 and F2 at the temporalcenter of each target vowel. A frequency window of 0-5.5kHz was used with an analysis window length of 25 ms,and the number of poles set at 12. Following extraction, asmall number of tokens were identified as having potentiallyerroneous formant estimates based on what is typical for eachvowel. Visual inspection of the Short Time Fourier Transform(STFT) time-frequency distribution (spectrogram) was thenused to determine whether each such measurement was indeederroneous, and to obtain a manual reading using Praat’s built-in formant tracking.
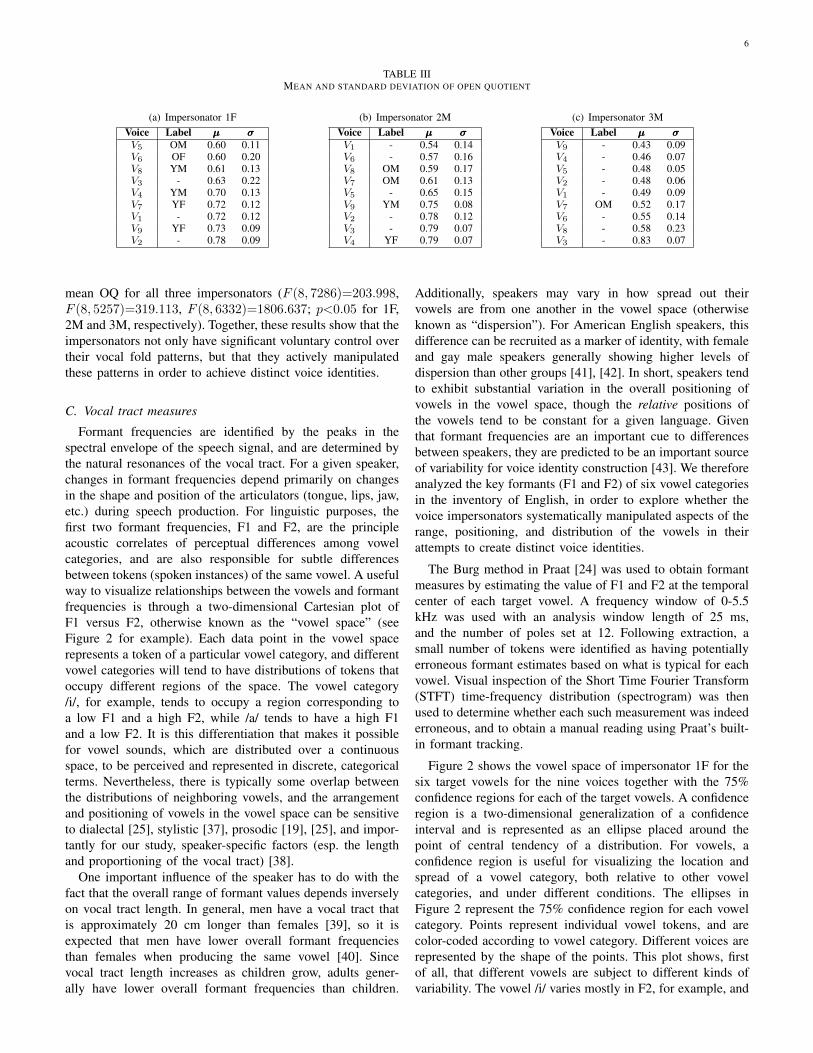
Figure 2 shows the vowel space of impersonator 1F for thesix target vowels for the nine voices together with the 75%confidence regions for each of the target vowels. A confidenceregion is a two-dimensional generalization of a confidenceinterval and is represented as an ellipse placed around thepoint of central tendency of a distribution. For vowels, aconfidence region is useful for visualizing the location andspread of a vowel category, both relative to other vowelcategories, and under different conditions. The ellipses inFigure 2 represent the 75% confidence region for each vowelcategory. Points represent individual vowel tokens, and arecolor-coded according to vowel category. Different voices arerepresented by the shape of the points. This plot shows, firstof all, that different vowels are subject to different kinds ofvariability. The vowel /i/ varies mostly in F2, for example, and
7
Fig. 2. The vowel space for the nine impersonated voices of impersonator 1F. The vowel ellipses represent the 75% confidence region.
/æ/ varies mostly in F1, while /E/ varies in both dimensions.Some clustering by voice is evident in Figure 2, suggestingthat at least some of the within-vowel variation is due to theeffects of voice.
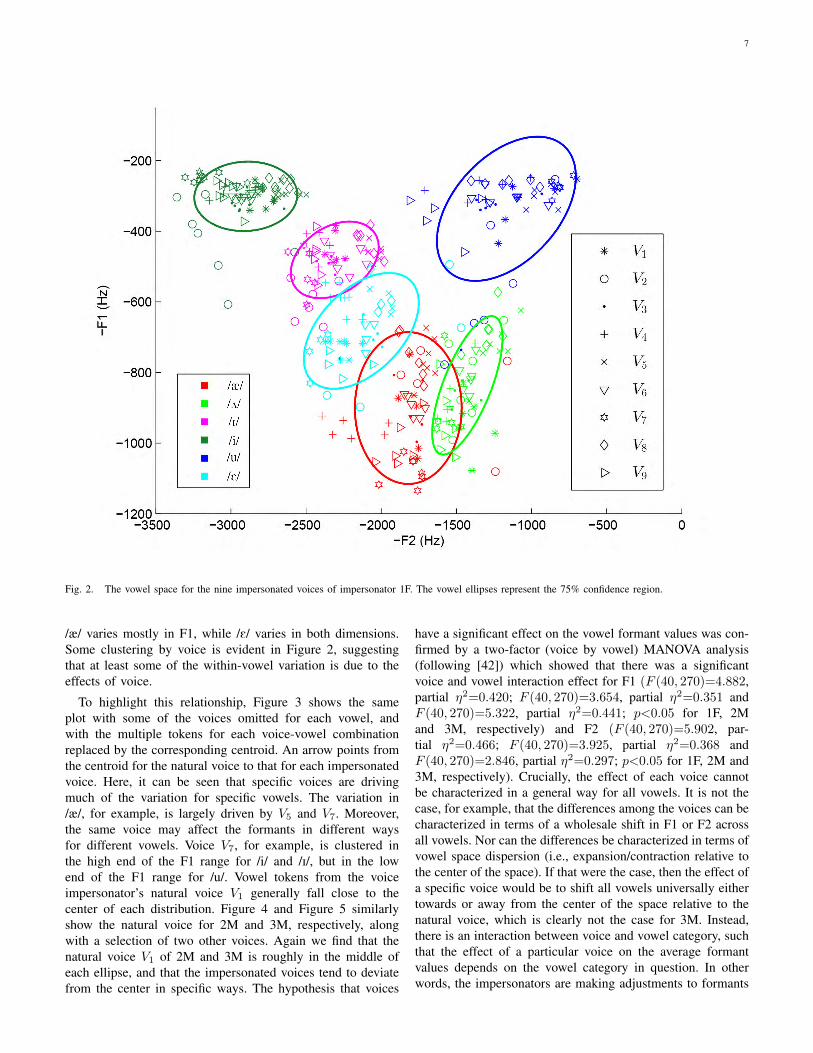
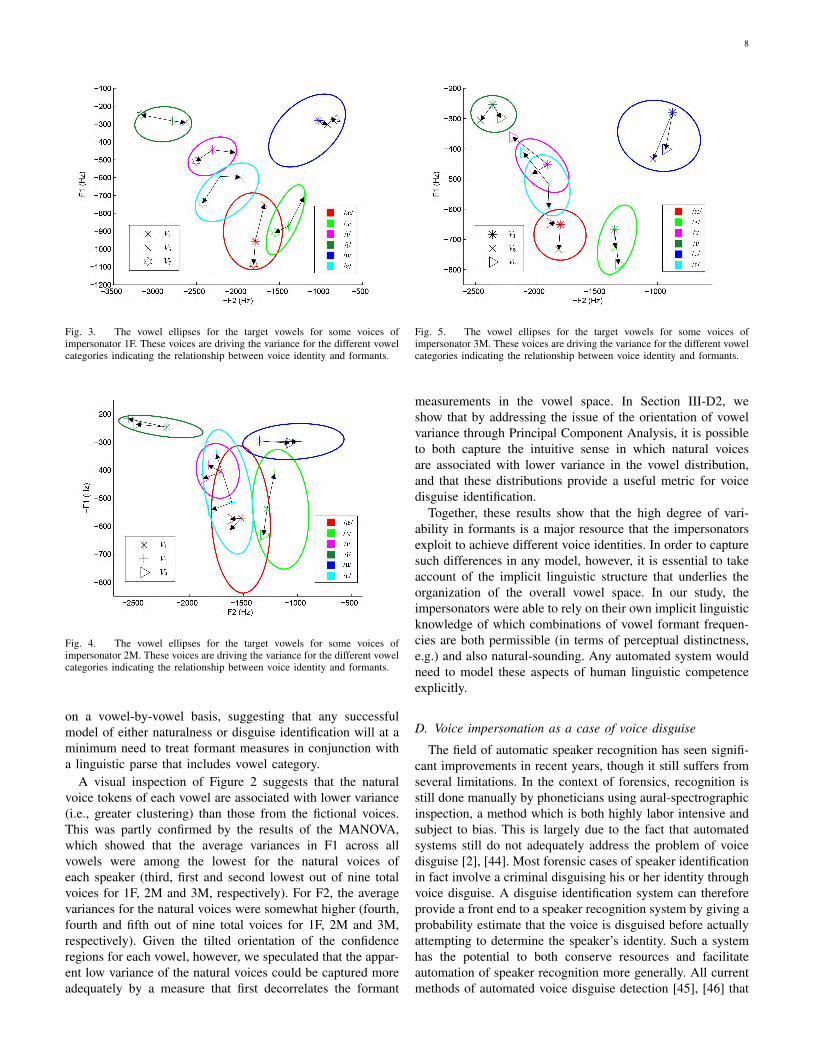
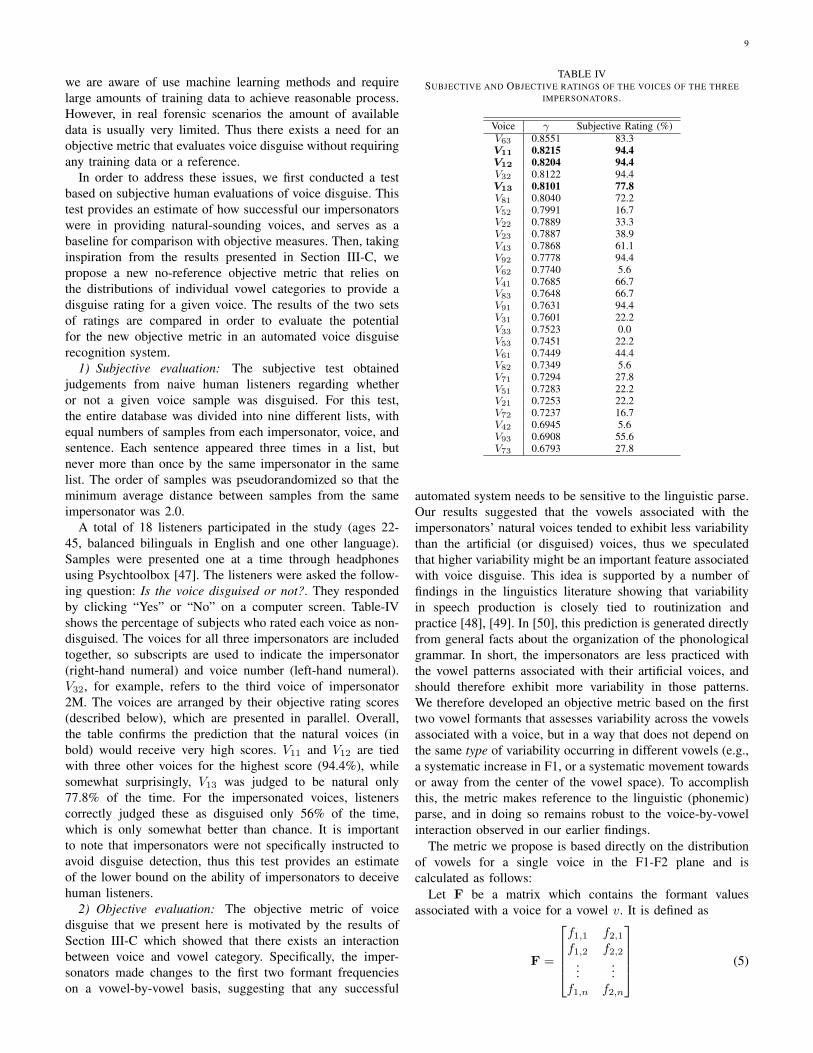
To highlight this relationship, Figure 3 shows the sameplot with some of the voices omitted for each vowel, andwith the multiple tokens for each voice-vowel combinationreplaced by the corresponding centroid. An arrow points fromthe centroid for the natural voice to that for each impersonatedvoice. Here, it can be seen that specific voices are drivingmuch of the variation for specific vowels. The variation in/æ/, for example, is largely driven by V5 and V7. Moreover,the same voice may affect the formants in different waysfor different vowels. Voice V7, for example, is clustered inthe high end of the F1 range for /i/ and /I/, but in the lowend of the F1 range for /u/. Vowel tokens from the voiceimpersonator’s natural voice V1 generally fall close to thecenter of each distribution. Figure 4 and Figure 5 similarlyshow the natural voice for 2M and 3M, respectively, alongwith a selection of two other voices. Again we find that thenatural voice V1 of 2M and 3M is roughly in the middle ofeach ellipse, and that the impersonated voices tend to deviatefrom the center in specific ways. The hypothesis that voices
have a significant effect on the vowel formant values was con-firmed by a two-factor (voice by vowel) MANOVA analysis(following [42]) which showed that there was a significantvoice and vowel interaction effect for F1 (F (40, 270)=4.882,partial η2=0.420; F (40, 270)=3.654, partial η2=0.351 andF (40, 270)=5.322, partial η2=0.441; p<0.05 for 1F, 2Mand 3M, respectively) and F2 (F (40, 270)=5.902, par-tial η2=0.466; F (40, 270)=3.925, partial η2=0.368 andF (40, 270)=2.846, partial η2=0.297; p<0.05 for 1F, 2M and3M, respectively). Crucially, the effect of each voice cannotbe characterized in a general way for all vowels. It is not thecase, for example, that the differences among the voices can becharacterized in terms of a wholesale shift in F1 or F2 acrossall vowels. Nor can the differences be characterized in terms ofvowel space dispersion (i.e., expansion/contraction relative tothe center of the space). If that were the case, then the effect ofa specific voice would be to shift all vowels universally eithertowards or away from the center of the space relative to thenatural voice, which is clearly not the case for 3M. Instead,there is an interaction between voice and vowel category, suchthat the effect of a particular voice on the average formantvalues depends on the vowel category in question. In otherwords, the impersonators are making adjustments to formants
8
Fig. 3. The vowel ellipses for the target vowels for some voices ofimpersonator 1F. These voices are driving the variance for the different vowelcategories indicating the relationship between voice identity and formants.
Fig. 4. The vowel ellipses for the target vowels for some voices ofimpersonator 2M. These voices are driving the variance for the different vowelcategories indicating the relationship between voice identity and formants.
on a vowel-by-vowel basis, suggesting that any successfulmodel of either naturalness or disguise identification will at aminimum need to treat formant measures in conjunction witha linguistic parse that includes vowel category.
A visual inspection of Figure 2 suggests that the naturalvoice tokens of each vowel are associated with lower variance(i.e., greater clustering) than those from the fictional voices.This was partly confirmed by the results of the MANOVA,which showed that the average variances in F1 across allvowels were among the lowest for the natural voices ofeach speaker (third, first and second lowest out of nine totalvoices for 1F, 2M and 3M, respectively). For F2, the averagevariances for the natural voices were somewhat higher (fourth,fourth and fifth out of nine total voices for 1F, 2M and 3M,respectively). Given the tilted orientation of the confidenceregions for each vowel, however, we speculated that the appar-ent low variance of the natural voices could be captured moreadequately by a measure that first decorrelates the formant
Fig. 5. The vowel ellipses for the target vowels for some voices ofimpersonator 3M. These voices are driving the variance for the different vowelcategories indicating the relationship between voice identity and formants.
measurements in the vowel space. In Section III-D2, weshow that by addressing the issue of the orientation of vowelvariance through Principal Component Analysis, it is possibleto both capture the intuitive sense in which natural voicesare associated with lower variance in the vowel distribution,and that these distributions provide a useful metric for voicedisguise identification.
Together, these results show that the high degree of vari-ability in formants is a major resource that the impersonatorsexploit to achieve different voice identities. In order to capturesuch differences in any model, however, it is essential to takeaccount of the implicit linguistic structure that underlies theorganization of the overall vowel space. In our study, theimpersonators were able to rely on their own implicit linguisticknowledge of which combinations of vowel formant frequen-cies are both permissible (in terms of perceptual distinctness,e.g.) and also natural-sounding. Any automated system wouldneed to model these aspects of human linguistic competenceexplicitly.
D. Voice impersonation as a case of voice disguise
The field of automatic speaker recognition has seen signifi-cant improvements in recent years, though it still suffers fromseveral limitations. In the context of forensics, recognition isstill done manually by phoneticians using aural-spectrographicinspection, a method which is both highly labor intensive andsubject to bias. This is largely due to the fact that automatedsystems still do not adequately address the problem of voicedisguise [2], [44]. Most forensic cases of speaker identificationin fact involve a criminal disguising his or her identity throughvoice disguise. A disguise identification system can thereforeprovide a front end to a speaker recognition system by giving aprobability estimate that the voice is disguised before actuallyattempting to determine the speaker’s identity. Such a systemhas the potential to both conserve resources and facilitateautomation of speaker recognition more generally. All currentmethods of automated voice disguise detection [45], [46] that
9
we are aware of use machine learning methods and requirelarge amounts of training data to achieve reasonable process.However, in real forensic scenarios the amount of availabledata is usually very limited. Thus there exists a need for anobjective metric that evaluates voice disguise without requiringany training data or a reference.
In order to address these issues, we first conducted a testbased on subjective human evaluations of voice disguise. Thistest provides an estimate of how successful our impersonatorswere in providing natural-sounding voices, and serves as abaseline for comparison with objective measures. Then, takinginspiration from the results presented in Section III-C, wepropose a new no-reference objective metric that relies onthe distributions of individual vowel categories to provide adisguise rating for a given voice. The results of the two setsof ratings are compared in order to evaluate the potentialfor the new objective metric in an automated voice disguiserecognition system.
1) Subjective evaluation: The subjective test obtainedjudgements from naive human listeners regarding whetheror not a given voice sample was disguised. For this test,the entire database was divided into nine different lists, withequal numbers of samples from each impersonator, voice, andsentence. Each sentence appeared three times in a list, butnever more than once by the same impersonator in the samelist. The order of samples was pseudorandomized so that theminimum average distance between samples from the sameimpersonator was 2.0.
A total of 18 listeners participated in the study (ages 22-45, balanced bilinguals in English and one other language).Samples were presented one at a time through headphonesusing Psychtoolbox [47]. The listeners were asked the follow-ing question: Is the voice disguised or not?. They respondedby clicking “Yes” or “No” on a computer screen. Table-IVshows the percentage of subjects who rated each voice as non-disguised. The voices for all three impersonators are includedtogether, so subscripts are used to indicate the impersonator(right-hand numeral) and voice number (left-hand numeral).V32, for example, refers to the third voice of impersonator2M. The voices are arranged by their objective rating scores(described below), which are presented in parallel. Overall,the table confirms the prediction that the natural voices (inbold) would receive very high scores. V11 and V12 are tiedwith three other voices for the highest score (94.4%), whilesomewhat surprisingly, V13 was judged to be natural only77.8% of the time. For the impersonated voices, listenerscorrectly judged these as disguised only 56% of the time,which is only somewhat better than chance. It is importantto note that impersonators were not specifically instructed toavoid disguise detection, thus this test provides an estimateof the lower bound on the ability of impersonators to deceivehuman listeners.
2) Objective evaluation: The objective metric of voicedisguise that we present here is motivated by the results ofSection III-C which showed that there exists an interactionbetween voice and vowel category. Specifically, the imper-sonators made changes to the first two formant frequencieson a vowel-by-vowel basis, suggesting that any successful
TABLE IVSUBJECTIVE AND OBJECTIVE RATINGS OF THE VOICES OF THE THREE
IMPERSONATORS.
Voice γ Subjective Rating (%)V63 0.8551 83.3V11 0.8215 94.4V12 0.8204 94.4V32 0.8122 94.4V13 0.8101 77.8V81 0.8040 72.2V52 0.7991 16.7V22 0.7889 33.3V23 0.7887 38.9V43 0.7868 61.1V92 0.7778 94.4V62 0.7740 5.6V41 0.7685 66.7V83 0.7648 66.7V91 0.7631 94.4V31 0.7601 22.2V33 0.7523 0.0V53 0.7451 22.2V61 0.7449 44.4V82 0.7349 5.6V71 0.7294 27.8V51 0.7283 22.2V21 0.7253 22.2V72 0.7237 16.7V42 0.6945 5.6V93 0.6908 55.6V73 0.6793 27.8
automated system needs to be sensitive to the linguistic parse.Our results suggested that the vowels associated with theimpersonators’ natural voices tended to exhibit less variabilitythan the artificial (or disguised) voices, thus we speculatedthat higher variability might be an important feature associatedwith voice disguise. This idea is supported by a number offindings in the linguistics literature showing that variabilityin speech production is closely tied to routinization andpractice [48], [49]. In [50], this prediction is generated directlyfrom general facts about the organization of the phonologicalgrammar. In short, the impersonators are less practiced withthe vowel patterns associated with their artificial voices, andshould therefore exhibit more variability in those patterns.We therefore developed an objective metric based on the firsttwo vowel formants that assesses variability across the vowelsassociated with a voice, but in a way that does not depend onthe same type of variability occurring in different vowels (e.g.,a systematic increase in F1, or a systematic movement towardsor away from the center of the vowel space). To accomplishthis, the metric makes reference to the linguistic (phonemic)parse, and in doing so remains robust to the voice-by-vowelinteraction observed in our earlier findings.
The metric we propose is based directly on the distributionof vowels for a single voice in the F1-F2 plane and iscalculated as follows:
Let F be a matrix which contains the formant valuesassociated with a voice for a vowel v. It is defined as
F =
f1,1 f2,1f1,2 f2,2
......
f1,n f2,n
(5)
10
where the columns of F represent the F1 and F2 values inhertz respectively and the rows represent tokens (samples).Each column of F is zero mean centered. Then by applyingPrincipal Component Analysis (PCA) we find the reconstruc-tion of F in the principal component space denoted as F. Letσ1 and σ2 denote the standard deviation along the two columnsof F, where σ1 > σ2. The deviation factor α for the vowel vis then defined as
αv =σ1
σ1 + σ2(6)
where 0.5 < αv < 1.To obtain the overall disguise score for a voice, the deviation
factor αv is first obtained for N vowels. The disguise scoreγ for a voice is then defined as the average value of αv overthe N vowels
γ =N∑i=1
αvi
N(7)
Our analysis uses the same set of vowels from Section III-C,namely, v = {/æ/, /2/, /I/, /i/, /u/, /E/}.
The disguise score γ provides an estimate of how mucha voice varies along the first principal component comparedto the total variation along both the principal components.A value of γ near 1.0 is predicted for undisguised (i.e.,natural) voices, while a value of γ near 0.5 is predicted forpoorly disguised voices. Table-IV shows the objective ratingscore for each voice ordered by the value of γ, alongside thesubjective ratings from the previous section. As predicted, thenatural voices (in bold) are highly ranked. Interestingly, thenatural voice for 3M is ranked more highly by γ than by thehuman raters, suggesting a possible human bias to which it isimmune. The table also suggests a good correlation betweenthe objective metric and the subjective ratings. The Spear-man rank order correlation coefficient [51] was calculatedto determine the relationship between γ and the subjectiveratings of disguise. This statistic measures the strength of amonotonic relationship between two ordinal variables. Thistest revealed a “strong”, positive correlation between γ andthe subjective ratings, which was also statistically significant(rs(25)=0.6542, p=8.0144× 10⁻⁴).
Overall, these results indicate that γ is a highly useful metricfor automated voice disguise identification applications. Thismetric makes use of vowel formants in combination with alinguistic parse, two factors which are generally ignored byautomated speaker recognition systems, but which are essentialfor phoneticians in their manual analyses. In doing so, itprovides an assessment of disguise that is highly comparableto that of human listeners, and may even outperform them incertain cases.
IV. CONCLUSION
In this study, we analysed the speech of three voice im-personators producing a total of 27 different voice identities.These analyses confirmed that the impersonators were able toexploit differences in mean F0, speech rate, vocal fold patterns(Open Quotient), and vowel formant distributions in orderto create the various voice identities. This is the first studywe know of that shows the ability of voice impersonators to
exploit differences in vocal fold patterns, and the only studythat considers a comprehensive set of speech parameters ina single study based on voice impersonation. Our study alsosought to explore the space of variability that is possible for thevarious speech parameters given the impersonators’ sensitivityto naturalness constraints and their inherent physiologicallimitations. On the one hand, by eliciting a wide range ofvoice identities from the impersonators’ repertoire, our studyprovides an estimate of the size of the range that is possiblefor each parameter for a given speaker. Additionally, our studyshowed speaker-by-speaker limitations, since, for example, 1Fwas unable to achieve F0 means comparable to the two malespeakers even when impersonating males.
Our analysis of the effects of voice identity on vowelformant measures revealed that while impersonators exploitvariation in vowel formants, they do so in a way that is sensi-tive to linguistic structure. Specifically, they make changes toformant distributions on a vowel-by-vowel basis, rather thanby systematically shifting the entire vowel space along somedimension, or by expanding or contracting the vowel space.We noted that this has important consequences for automateddisguise detection systems, since it suggests that such systemscannot do without a linguistic parse. This is the first study weknow of to show that the modification of vowel formants byimpersonators is sensitive to, and constrained by, the specificstructure of the linguistic system (i.e., the language) involved.
In our study, we attempted to isolate the effects of voiceidentity on vowel formants by observing target words underconsistently prominent prosodic conditions (nuclear accented,intonation phrase-final). An anonymous reviewer points outthat vowel reduction effects based on differences in prosodicprominence are likely to contribute substantial variability tovowel formant distributions, thus complicating the analysis.Since prosodic factors tend to affect vowel formants moresystematically by way of expansion and contraction of theoverall vowel space [19], we speculate that the ultimatesolution will need to treat these two factors independently.
We presented an objective metric for detecting voice dis-guise. This metric not only rated the impersonators’ naturalvoices very highly, but it exhibited a strong correspondencewith the subjective ratings obtained from human listeners(even outperforming them in one instance). The disguiseestimates provided by this metric can be exploited for makingcurrent speaker recognition systems more robust to attacks ofvoice disguise, especially when there is no a priori informationavailable as to the type of disguise. In future research, it willbe important to evaluate the improvement in performance of aspeaker recognition systems by adding such a front end voicedisguise system based on the disguise metric γ. In our study,we selected a subset of vowels and treated the contributionof all vowel categories equivalently. Another important issuefor future research to explore, therefore, is how the number,type, and weighting of vowels used in calculating γ affects itsperformance in discrimination tasks. The application of ourfindings on vowel formant variability to the development of adisguise metric is highly suggestive of how the findings may befurther utilized. Ultimately, an automated disguise detection orspeaker identification system that considers variability across
11
both glottal and vocal tract parameters is likely to achieveadditional gains in reliability.
V. ACKNOWLEDGEMENTS
The authors would like to thank the voice-over artists:Noella Menon, Marc X Grigoroff and Rishi Budhrani; Char-maine Hon for helping with the manual segmentation of thedata and Ng Chen Yi for the programming of the subjectiveexperiment.
REFERENCES
[1] H. Hollien, Forensic voice identification. Academic Press, 2002.[2] J. Bonastre, F. Bimbot, L. Boe, J. Campbell, D. Reynolds, and I. Magrin-
Chagnolleau, “Person authentication by voice: A need for caution,” inEighth European Conference on Speech Communication and Technol-ogy, 2003, pp. 33–36.
[3] Y. Stylianou, “Voice transformation: A survey,” in IEEE InternationalConference on Acoustics, Speech and Signal Processing, 2009, pp.3585–3588.
[4] E. Zetterholm, “Same speaker–different voices. a study of one imper-sonator and some of his different imitations,” in Proceedings of the 11thAustralian International Conference on Speech Science & Technology,2006, pp. 70–75.
[5] M. Farrus, M. Wagner, D. Erro, and J. Hernando, “Automatic speakerrecognition as a measurement of voice imitation and conversion,” TheInternational Journal of Speech, Language and Law, vol. 17, no. 1, pp.119–142, 2010.
[6] A. Machado and M. Queiroz, “Voice conversion: A critical survey,”Proc. Sound and Music Computing (SMC), 2010.
[7] A. Eriksson and P. Wretling, “How flexible is the human voice?-a case study of mimicry,” in Fifth European Conference on SpeechCommunication and Technology, 1997, pp. 1043–1046.
[8] T. Kitamura, “Acoustic analysis of imitated voice produced by a profes-sional impersonator,” in Proc. Interspeech, 2008, pp. 813–816.
[9] E. Zetterholm, “Impersonation: a phonetic case study of the imitationof a voice,” Lund Working Papers in Linguistics, vol. 46, pp. 269–287,2009.
[10] T. B. Amin, P. Marziliano, and J. S. German, “Nine Voices, One Artist:Linguistic and Acoustic Analysis,” in IEEE International Conference onMultimedia and Expo (ICME), 2012, pp. 450–454.
[11] L. Wolk, N. B. Abdelli-Beruh, and D. Slavin, “Habitual use of vocalfry in young adult female speakers,” Journal of Voice, vol. 26, no. 3,pp. e111–e116, 2012.
[12] M. Epstein, “Voice quality and prosody in English,” Ph.D. dissertation,University of California, 2002.
[13] W. Campbell, T. Quatieri, J. Campbell, and C. Weinstein, “Multimodalspeaker authentication using nonacoustic sensors,” in Workshop Multi-modal User Authentication, 2003, pp. 215–222.
[14] J. Hillenbrand and M. Clark, “The role of f0 and formant frequenciesin distinguishing the voices of men and women,” Attention, Perception,& Psychophysics, vol. 71, no. 5, pp. 1150–1166, 2009.
[15] D. Honorof and D. Whalen, “Identification of speaker sex from onevowel across a range of fundamental frequencies,” The Journal of theAcoustical Society of America, vol. 128, no. 5, pp. 3095–3103, 2010.
[16] M. Sambur, “Selection of acoustic features for speaker identification,”IEEE Transactions on Acoustics, Speech and Signal Processing, vol. 23,no. 2, pp. 176–182, 1975.
[17] M. Rothenberg, “A multichannel electroglottograph,” Journal of Voice,vol. 6, no. 1, pp. 36–43, 1992.
[18] J. Yuan and M. Liberman, “Speaker identification on the SCOTUScorpus,” in Proceedings of Acoustics, 2008, pp. 5687–5690.
[19] E. Lee and J. Cole, “Acoustic effects of prosodic boundary on vowelsin American English,” in Proceedings of the 42nd Annual Meeting ofthe Chicago Linguistic Society, Illiniois, Chicago, 2006.
[20] G. Fant, Acoustic theory of speech production with calculations basedon X-ray studies of Russian articulations. Mouton & Co. N.V., TheHague, 1970.
[21] M. Latinus and P. Belin, “Human voice perception,” Current Biology,vol. 21, no. 4, pp. R143–R145, 2011.
[22] J. van Rie and R. van Bezooijen, “Perceptual characteristics of voicequality in dutch males and females from 9 to 85 years,” in Proceedingsof the XIIIth International Congress of Phonetic Sciences 2, 1995, pp.290–293.
[23] R. Brend, “Male-female intonation patterns in american english,” Lan-guage and sex: Difference and dominance, vol. 86, 1975.
[24] P. Boersma and D. Weenink, “Praat: doing phonetics by computer[Computer program]. Version 5.3,” Retrieved October 21, 2011, fromhttp://www.praat.org/.
[25] D. Byrd, “Relations of sex and dialect to reduction,” Speech Communi-cation, vol. 15, no. 1-2, pp. 39–54, 1994.
[26] J. Yuan, M. Liberman, and C. Cieri, “Towards an integrated understand-ing of speaking rate in conversation,” in Ninth International Conferenceon Spoken Language Processing, 2006, pp. 541–544.
[27] E. Jacewicz, R. Fox, C. O’Neill, and J. Salmons, “Articulation rateacross dialect, age, and gender,” Language variation and change, vol. 21,no. 02, pp. 233–256, 2009.
[28] B. Smith, J. Wasowicz, and J. Preston, “Temporal characteristics ofthe speech of normal elderly adults,” Journal of Speech and HearingResearch, vol. 30, no. 4, pp. 522–529, 1987.
[29] D. Childers and A. Krishnamurthy, “A critical review of electroglottog-raphy.” Critical reviews in biomedical engineering, vol. 12, no. 2, p.131, 1985.
[30] A. Fourcin, “Voice quality and electrolaryngography,” in Voice QualityMeasurement, R. Kent and M. Ball, Eds. San Diego: SingularPublishing Group, 2000.
[31] A. Neocleous and P. Naylor, “Voice source parameters for speakerverification,” in Proc. Eur. Signal Process. Conf, 1998, pp. 697–700.
[32] M. Higgins and J. Saxman, “A comparison of selected phonatory behav-iors of healthy aged and young adults,” Journal of Speech, Languageand Hearing Research, vol. 34, no. 5, pp. 1000–1010, 1991.
[33] R. Winkler and W. Sendlmeier, “Open quotient (EGG) measurements ofyoung and elderly voices: Results of a production and perception study,”ZAS Papers in Linguistics, vol. 40, pp. 213–225, 2005.
[34] E.-M. Ma and A. Love, “Electroglottographic evaluation of age and gen-der effects during sustained phonation and connected speech,” Journalof Voice, vol. 24, no. 2, pp. 146–152, 2010.
[35] N. Henrich, C. d’Alessandro, B. Doval, and M. Castellengo, “On theuse of the derivative of electroglottographic signals for characterizationof nonpathological phonation,” The Journal of the Acoustical Society ofAmerica, vol. 115, p. 1321, 2004.
[36] T. B. Amin and P. Marziliano, “Glottal activity detection from differenti-ated electroglottographic signals using finite rate of innovation methods,”submitted for publication.
[37] S.-J. Moon and B. Lindblom, “Interaction between duration, context, andspeaking style in English stressed vowels,” The Journal of the AcousticalSociety of America, vol. 96, p. 40, 1994.
[38] K. Stevens, Acoustic phonetics. The MIT press, 2000, vol. 30.[39] G. Fant, “A note on vocal tract size factors and non-uniform f-pattern
scalings,” Speech Transmission Laboratory Quarterly Progress andStatus Report, vol. 1, pp. 22–30, 1966.
[40] G. Peterson and H. Barney, “Control methods used in a study of thevowels,” Journal of the Acoustical Society of America, vol. 24, no. 2,pp. 175–184, 1952.
[41] A. R. Bradlow, G. M. Torretta, and D. B. Pisoni, “Intelligibilityof normal speech I: Global and fine-grained acoustic-phonetic talkercharacteristics,” Speech Communication, vol. 20, no. 3, pp. 255–272,1996.
[42] J. B. Pierrehumbert, T. Bent, B. Munson, A. R. Bradlow, and J. M.Bailey, “The influence of sexual orientation on vowel production (l),”The Journal of the Acoustical Society of America, vol. 116, p. 1905,2004.
[43] R. Coleman, “A comparison of the contributions of two voice qualitycharacteristics to the perception of maleness and femaleness in thevoice,” Journal of Speech and Hearing Research, vol. 19, no. 1, pp.168–180, 1976.
[44] J. P. Campbell, W. Shen, W. M. Campbell, R. Schwartz, J.-F. Bonastre,and D. Matrouf, “Forensic speaker recognition,” IEEE Signal ProcessingMagazine, vol. 26, no. 2, pp. 95–103, 2009.
[45] P. Perrot, G. Aversano, and G. Chollet, “Voice disguise and automaticdetection: review and perspectives,” in Progress in nonlinear speechprocessing. Springer, 2007, pp. 101–117.
[46] L. Mary, K. A. Babu, and A. Joseph, “Analysis and detection ofmimicked speech based on prosodic features,” International Journal ofSpeech Technology, vol. 15, no. 3, pp. 407–417, 2012.
[47] D. H. Brainard, “The Psychophysics Toolbox,” Spatial vision, vol. 10,no. 4, pp. 433–436, 1997.
[48] J. Edwards, M. E. Beckman, and B. Munson, “The interaction betweenvocabulary size and phonotactic probability effects on children’s pro-duction accuracy and fluency in nonword repetition,” Journal of Speech,Language and Hearing Research, vol. 47, no. 2, p. 421, 2004.
12
[49] B. Munson, “Phonological pattern frequency and speech productionin adults and children,” Journal of Speech, Language and HearingResearch, vol. 44, no. 4, p. 778, 2001.
[50] J. S. German, K. Carlson, and J. B. Pierrehumbert, “Reassignment ofconsonant allophones in rapid dialect acquisition,” Journal of Phonetics,vol. 41, no. 3, pp. 228–248, 2013.
[51] C. Spearman, “The proof and measurement of association between twothings,” The American Journal of Psychology, vol. 15, no. 1, pp. 72–101,1904.
Talal Bin Amin received the B.Sc. degree in Com-munication Systems Engineering from the Instituteof Space Technology, Pakistan in 2008 and the M.Sc.degree in Signal Processing from the Nanyang Tech-nological University, Singapore in 2009. In 2010, hejoined the Data Mining Department at the Institutefor InfoComm Research (I2R), Singapore as a Com-puter Programmer before joining the Laboratory ofAudio and Visual Perception at the Duke NUSGrduate Medical School, Singapore as a ResearchAssistant. Since August 2010, he is pursuing the
Ph.D. degree in the Division of Information Engineering at the NanyangTechnological University, Singapore.
His research interests include forensic speaker recognition, voice imperson-ation and voice disguise detection.
Pina Marziliano obtained a B.Sc. Applied Math-ematics in 1994 and the M.Sc. Computer Science(Operations Research) in 1997, both, from the Uni-versite de Montreal, Canada. In 2001 she completedher Ph.D degree in Communication Systems fromthe Swiss Federal Institute of Technology in Lau-sanne (EPFL), Switzerland. She then joined a start-up company, Genimedia SA in Lausanne, Switzer-land and developed perceptual quality metrics formultimedia applications. In 2003, she became anAssistant Professor in the School of Electrical and
Electronic Engineering at the Nanyang Technological University in Singapore,and was tenured and promoted to Associate Professor in August 2012. InOctober 2012, she co-founded and is a Director of PABensen Pte. Ltd. WhereArt and Science Design R©, a Singapore based design company engaged indeveloping innovative artistic objects and functional products that bridge thefields of art, science and technology.
In 2007, she received the 2006 Best Paper Award from the IEEE SignalProcessing Society Awards Board for the paper “Sampling Signals with FiniteRate of Innovation” co-authored with Prof. M. Vetterli and Dr. T. Blu whichappeared in IEEE Trans. Signal Processing, Vol. 50, June 2002. A patent forher work related to sampling was granted in May 2006 and then acquired byQualcomm Inc. USA in December 2007.
She has been an Associate Editor for IEEE Signal Processing Letters andIEEE Transactions on Signal Processing since January 2010 and February2013, respectively. She is also a Member of the IEEE Signal ProcessingSociety Signal Processing Theory and Methods Technical Committee sinceJanuary 2012 and has served on the Technical Program Committee ofnumerous international conferences.
She currently teaches undergraduate and graduate courses in Digital SignalProcessing and her research interests include sampling theory and applicationsin communications and biomedical engineering, information security andperceptual quality metrics for multimedia.
James Sneed German received the Ph.D. in lin-guistics from Northwestern University in 2009. Hethen spent two years as a Postdoctoral Researcher atthe Laboratoire Parole et Langage (CNRS) in Aix-en-Provence, France. Since 2010, he has been anAssistant Professor in the Division of Linguisticsand Multilingual Studies at Nanyang TechnologicalUniversity, Singapore.
His research interests cover the cognitive architec-ture of linguistic sound systems, as well as prosodyand the role it plays in signalling both literal and
non-literal meaning.


![How the peak glottal area affects linear predictive coding ... · [JFL] Pages: 223–232 I. INTRODUCTION The formants, or the resonances of the vocal tract, are fun-damental parameters](https://img.pdfslide.net/doc/110x75/600717b58bce6c0bf3547d67/how-the-peak-glottal-area-affects-linear-predictive-coding-jfl-pages-223a232.jpg)


![Qb ¹ w Impersonators and audiences share projections · ÔÀп_>E U\Qb ¹ w Impersonators and audiences share projections ( ] ) ! Ê Namiko KUBO -KAWA I ¡%± Ä ¨ ± Û °#](https://img.pdfslide.net/doc/110x75/5ecbc97ef45cbe03cf750601/qb-w-impersonators-and-audiences-share-projections-e-uqb-w-impersonators.jpg)