Embed Size (px)
Citation preview
!$MRK@Conf idential
Glucagon receptor antagonism induces increased cholesterol absorption
Hong-Ping Guan1, Xiaodong Yang1, Ku Lu1, Sheng-Ping Wang1, Jose M. Castro-Perez1, Stephen Previs1,
Michael Wright2, Vinit Shah1, Kithsiri Herath1, Dan Xie1, Daphne Szeto3, Gail Forrest3, Jing Chen Xiao1,
Oksana Palyha1, Li-Ping Sun1, Paula J. Andryuk4, Samuel S. Engel4, Yusheng Xiong5, Songnian Lin5, David
E. Kelley1, Mark D. Erion1, Harry R. Davis†, Liangsu Wang1
Departments of 1Cardiometabolic Disease, 2Late Stage In Vitro Pharmacology, 3Late Stage In Vivo
Pharmacology, and 5Discovery Chemistry, Merck Research Laboratories, 2015 Galloping Hill Rd,
Kenilworth, NJ 07033
4Clinical Research Department, Merck Research Laboratories, 126 Lincoln Ave, Rahway, NJ 07065
†Current address: CVPath Institute, Inc. 19 Firstfield Road, Gaithersburg, MD 20878
Running title: The increase of plasma cholesterol induced by a novel anti-diabetic class of agents,
glucagon receptor antagonists, is primarily caused by elevated cholesterol absorption.
Correspondence: Hong-Ping Guan, 2015 Galloping Hill Road, Kenilworth, NJ 07033, USA. Tel: +1-908-
740-7401. Fax: +1-908-740-5034. E-mail: Hong-Ping_Guan@ merck.com
Abbreviations:
Gcgr, glucagon receptor; Insr, insulin receptor; G6pc, glucose-6-phosphatase catalytic subunit; Gck,
glucokinase; Pck1, phosphoenolpyruvate carboxykinase 1 (soluble); Hk1, hexokinase 1; Hk2, hexokinase
2; Hmgcr, HMG-CoA reductase; Hmgcs1, HMG-CoA synthase 1; Hmgcs2, HMG-CoA synthase 2;
Insig1, insulin induced gene 1; Insig2, insulin induced gene 2; Pcsk9, proprotein convertase
subtilisin/kexin type 9; Srebp-1c, sterol regulatory element-binding protein-1c; Srebp-2, sterol regulatory
element-binding protein-2; Ldlr, LDL receptor; Cyp27a1, Cytochrome P450 family 27 subfamily A
polypeptide 1; Cyp39a1, Cytochrome P450 family 39 subfamily A polypeptide 1; Cyp46a1, Cytochrome
by guest, on July 16, 2018w
ww
.jlr.orgD
ownloaded from
!$MRK@Conf idential
2
P450 family 46 subfamily A polypeptide 1; Cyp51, Cytochrome P450 family 51; Cyp7a1, Cytochrome
P450 family 7 subfamily A polypeptide 1; Cyp7b1, Cytochrome P450 family 7 subfamily B polypeptide
1; Cyp8b1, Cytochrome P450 family 8 subfamily B polypeptide 1.
by guest, on July 16, 2018w
ww
.jlr.orgD
ownloaded from
!$MRK@Conf idential
3
ABSTRACT
Glucagon and insulin have opposing action in governing glucose homeostasis. In type 2 diabetes
(T2DM) plasma glucagon is characteristically elevated, contributing to increased
gluconeogenesis and hyperglycemia. Therefore, glucagon receptor antagonism has been
proposed as a pharmacologic approach to treat T2DM. In support of this concept, a potent small-
molecule glucagon receptor antagonist (GRA), MK-0893 for 12 weeks demonstrated in T2DM
dose-dependent efficacy to reduce hyperglycemia, with an HbA1c reduction of 1.5% at the 80 mg
dose. However, GRA treatment was associated with dose-dependent elevation of plasma LDL-
cholesterol (LDL-c). The current studies investigated the cause for increased LDL-c. We report
findings that link MK-0893 with increased GLP-2 and cholesterol absorption. There was not
however, a GRA related modulation of cholesterol synthesis. These findings were replicated
using structurally diverse GRAs. To examine potential pharmacologic mitigation, co-
administration of ezetimibe (a potent inhibitor of cholesterol absorption) in mice, abrogated the
GRA-associated increase of LDL-c. Although the molecular mechanism is unknown, our results
provide a novel finding by which glucagon and hence glucagon receptor antagonism governs
cholesterol metabolism.
Supplementary keywords: Diabetes, Glucagon receptor antagonist, Cholesterol/Absorption,
Hypercholesterolemia, GLP-2, Bile acids
by guest, on July 16, 2018w
ww
.jlr.orgD
ownloaded from
!$MRK@Conf idential
4
INTRODUCTION
It is through mostly opposing actions that the pancreatic islets hormones insulin and
glucagon interact in the governance of hepatic glucose production and its uptake. In type 2
diabetes mellitus (T2DM), and as well in type 1 diabetes mellitus, fasting plasma glucagon is
generally elevated, inappropriate to prevailing hyperglycemia, and there is less suppression
during prandial metabolism (1). This imbalance in secretion of islet hormones is considered to
be a key aspect of the pathophysiology causing hyperglycemia (1, 2). Glucagon receptor
antagonism has accordingly drawn considerable interest as a novel pharmacological approach for
treating T2DM. Several glucagon receptor antagonists (GRAs) have advanced into human
clinical trials in patients with T2DM. MK-0893 (3), MK-3577 (4), LY2409021 (5, 6), and an
anti-sense oligo targeting the glucagon receptor (ISIS-GCGRrx) (7) have each demonstrated
efficacy in lowering fasting and postprandial hyperglycemia, leading to substantial reductions of
HbA1c thereby providing clinical proof of concept for efficacy of GRA.
In a 12-week, placebo-controlled, dose ranging clinical study in T2DM using the GRA
MK-0893, dose-response improvement of hyperglycemia was observed, with a reduction of
HbA1c of 1.5% at 80 mg per day, the top dose examined (Supplemental Fig. S1) (3). This
efficacy is substantial and arguably as or more effective than contemporary standard-of-care oral
agents for treatment of T2DM. Yet, in association with the dose-responsive improvements in
hyperglycemia, a dose-dependent increase in plasma LDL-cholesterol (LDL-c) was observed.
At the 80 mg dose, plasma LDL-c increased by 16.7% relative to baseline, significantly greater
than under placebo or metformin treatment arms (-3.1 and 2.2% changes respectively)
(Supplemental Fig. S1) (3). LDL-c and T2DM are recognized to adversely influence risk for
by guest, on July 16, 2018w
ww
.jlr.orgD
ownloaded from
!$MRK@Conf idential
5
cardiovascular disease, and increased LDL-c in the setting of T2DM is concerning as this could
potentiate risk for cardiovascular disease risk (8-10).
The current studies were undertaken using a preclinical rodent model, cholesterol isotopic
flux determinations, as well as further exploration of archived plasma samples from the clinical
trial with MK-0893 to elucidate the principal mechanism underlying increased plasma LDL-c. A
fundamental related question is whether the findings are unique to a specific GRA compound or
instead represent a mechanism-based response. To address this, several structurally distinct
GRAs were investigated for effects on cholesterol homeostasis. The findings yield novel
insights into glucagon physiology as well as GRA pharmacology and indicate a substantial effect
in the regulation of cholesterol absorption.
by guest, on July 16, 2018w
ww
.jlr.orgD
ownloaded from
!$MRK@Conf idential
6
METHODS AND MATERIALS
Animal studies. All mice used in the studies were purchased from Taconic (Germantown, New
York) at 10-12 weeks of age. Animals were maintained in a 12 h/12 h light-dark cycle with free
access to food and water in an environment with temperature maintained at 22°C. Four mice
were housed in a regular cage. Male humanized GCGR mice (hGCGR) were generated on
B6.129S6 background and had been back-crossed to C57BL/6 for more than 13 generations.
This strain of mouse showed no metabolic phenotypes in glucose and cholesterol (11). All tests
were performed in the same strain of mouse and comparisons were made between compounds
treatment and vehicle groups. Animals were maintained on regular rodent chow diet 7012 (5%
dietary fat; 3.75 kcal/g) (Teklad, Madison, WI) for 2 weeks before receiving compound
treatments. Compounds were dissolved in 0.5% methylcellulose and oral gavage (p.o.) dosing
volume was 10 ml/kg body weight.
Glucagon challenge assay was performed in mice under ad libitum as previously described (12).
Briefly, at 1 h post compound administration via p.o., glucagon dissolved in PBS was injected at
15 µg/kg i.p. followed by glucose measurements using glucometer (Life Scan) via tail bleeding
at 0, 12, 24, and 48 min post injection. For cholesterol absorption and synthesis studies, stable
isotope labelled cholesterol was prepared as described previously (13). Briefly, 2,2,3,4,4,6-D6-
cholesterol (Cambridge Isotope Laboratory, 92543-08-3) and 3,4-13C2-cholesterol (Sigma,
662291) were dissolved in USP ethanol at 20 mg/ml and filtered through a 0.2 µm solvent-
resistant filter (Sterlitech). The solutions were warmed to 37˚C for 5 min and added dropwise
over 1 min to two volumes of 20% Intralipid (Sigma I141) with gentle mixing. After incubation
at 37˚C for 5 min, the solutions were cooled down to room temperature for 15 min, and then
by guest, on July 16, 2018w
ww
.jlr.orgD
ownloaded from
!$MRK@Conf idential
7
passed through a 1.2 micron filter (Sigma). Solutions were stored at 4˚C for 1 day before
administration.
Clinical samples. Human serum samples used in this study were obtained from a randomized,
double-blind, placebo-controlled, crossover trial comprising a 1-wk screening period and 6-wk
washout of previous anti-hyperglycemic agents followed by a 2-wk, placebo run-in period and
then 12-wk treatment periods (clinical trial NCT00479466). Available serum samples for
placebo (n = 8) and monotherapy of MK-0893 60 mg (n = 46) and MK-0893 80 mg (n = 16)
were assayed for glucose, total cholesterol, LDL-c, campesterol, sitosterol, and bile acid
profiling. For GLP-1 measurement, 6 samples in MK-0893 60 mg group had insufficient serum
left, thus sample numbers were placebo (n = 8), MK-0893 60 mg (n = 40), and MK-0893 80 mg
(n = 16).
cAMP production assay. Cryopreserved human primary hepatocytes were purchased from
CellzDirect (presently Life Technologies, Hu8080). One vial of frozen primary hepatocyte
(approximately 5 million cells in total) was quickly thawed to 37˚C in a water bath and washed
in Cryopreserved Hepatocyte Recovery Medium (CHRM) (Life Technologies, CM7000) and re-
suspended in buffer containing HBSS (Life Technologies 14025), 0.1% BSA (Sigma A9205) and
1.2 mM IBMX (Sigma, I-5879). To assess antagonist activity, 4000 cells per well were pre-
incubated with compounds or 0.1% DMSO for 30 min and stimulated with glucagon (5 nM)
(Sigma, G2044) for an additional 30 min at room temperature. The assay was terminated with
the addition of Cisbio Dynamic 2 (62AM4PEC) detection reagents as per the manufacturer’s
instructions (Cisbio). cAMP was detected by a decrease in time-resolved fluorescence energy
by guest, on July 16, 2018w
ww
.jlr.orgD
ownloaded from
!$MRK@Conf idential
8
transfer (TR-FRET) using an EnVision plate reader (PerkinElmer). The IC50 values were
calculated using nonlinear regression curve fit analysis in Prism (GraphPad).
Measurement of plasma or serum GLP-1 and GLP-2. Whole blood of mice was collected in
EDTA-coated tubes and plasma was separated by centrifugation at 8,500 rpm at 4°C and stored
at –80°C until assayed. Human serum was collected following standard blood collection
procedure after overnight fasting. Plasma or serum levels of GLP-1 and GLP-2 were measured
using a total GLP-1 assay kit (Meso Scale Discovery) and mouse / human GLP-2 kit (Alpco).
Analysis of plasma lipid, apolipoprotein, PCSK9, and fecal cholesterol. A commercial
enzymatic colorimetric kit was used for the determination of plasma total cholesterol (Wako
cholesterol E kit) according to manufacturer's instructions (WakoUSA). Plasma level of PCSK9
was determined by PCSK9 dissociation-enhanced lanthanide fluorescence immunoassay
(DELFIA) as described elsewhere (14). Plasma or serum lipoprotein profile was assayed by
FPLC as described previously (15). Fecal cholesterol was measured by extracting lipids using
the Folch method (16), whereby fecal samples were homogenized with 5 ml of
chloroform:methanol (2:1, v:v). The homogenate was then filtered and washed with 2 ml of
0.9% saline, followed by centrifugation and drying of lower phase under nitrogen gas. The
extract was reconstituted with 10% Triton X in isopropanol and analyzed using a commercial
cholesterol kit (WakoUSA).
2H-Labeling of body water and Analysis of 2H-labeling of total plasma cholesterol and
apoprotein. The 2H-labeling of body water was determined using headspace analyses following
exchange with acetone as described by Shah et al (17). Briefly, 20 µL of sample (or standard)
by guest, on July 16, 2018w
ww
.jlr.orgD
ownloaded from
!$MRK@Conf idential
9
was reacted with 2 µL of 10 N NaOH and 4 µL of a 5% (v/v) solution of acetone in acetonitrile
for 4 h at room temperature. The instrument is programmed to inject 5 µL of headspace gas from
the GC vial in a splitless mode. Samples were analyzed using a 2.0 min isothermal run (Agilent
5973 MS coupled to a 6890 GC oven fitted with an Agilent DB-5MS column, 30m x 250µm x
0.15µm, the oven was set at 170 0C and helium carrier flow was set at 1.0 mL x min-1), acetone
elutes at ~ 1.4 min, the mass spectrometer was set to perform selected ion monitoring of m/z 58
and 59 (10 ms dwell time per ion) in the electron impact ionization mode.
The isotopic labeling of total cholesterol was determined using GCMS (18). Lipids were
saponified by heating plasma (50 µL) with 1N KOH in 80% methanol (200 µL) at 65 °C for 1
hour. Samples were acidified with 25 µL 6N HCl and then extracted in 125 µL chloroform
followed by vigorous vortexing for 20 sec. The samples were centrifuged at 3000 rpm for 5 min,
100 µL of chloroform (lower layer) was collected and evaporated to dryness under N2. Samples
were derivatized by reacting with 100 µL of pyridine:acetic anhydride (1:2, v:v) at 65 °C for 1
hour. Excess reagent was evaporated to dryness under N2, the acetylated derivative was
reconstituted in 50 µL ethyl acetate for analysis by GC-MS. All analyses were performed using
an Agilent 5973 MS coupled to a 6890 GC oven fitted with an Agilent DB-5MS column (30m x
250µm x 0.15µm). The instrument was programmed to inject 1 µL of sample using a 10:1 split
(helium carrier flow was set at 1.0 mL × min-1), the oven temperature was started at 150°C,
raised at 20°C × min-1 to 310°C and held for 6 min oven, cholesterol elutes at ~ 9 min, the mass
spectrometer was set to perform selected ion monitoring of m/z 368 and 369 (10 ms dwell time
per ion) in the electron impact ionization mode.
by guest, on July 16, 2018w
ww
.jlr.orgD
ownloaded from
!$MRK@Conf idential
10
Calculations and statistical analysis. To quantify the contribution of cholesterol synthesis one
fits the data using a precursor:product labeling ratio to the general equation (18):
Newly made cholesterol = [Product labeling / (Precursor labeling × n)] × Concentration
where n is the number of exchangeable hydrogens (assumed to equal 26 for cholesterol) (2).The
change in the ratio of m/z 369:368 (i.e. M+1/M0) was used to model the product labeling,
whereas the precursor labeling was assumed to equal plasma water, the concentration of total
circulating cholesterol was determined via enzymatic assay (19, 20). Plasma level of ApoB and
flux of ApoB were quantified by LC-MS/MS method as described previously (21).
Analysis of campesterol and sitosterol in plasma or serum samples of mice and humans.
Five µl of plasma or serum were mixed with 25 μl of internal standard mix (1 µg/ml of D6-
campesterol and D7-sitosterol prepared in ethanol) and 100 µl of 1 N KOH in glass inserts placed
on a deep 96-well polypropylene plate. The mixture was sealed and heated at 80˚C with shaking
@ 600 rpm for 1 hr on an R-shaker (Eppendorf). Samples were evaporated under nitrogen to
dryness. One hundred and fifty microliters of derivatization reagent (1000 mg of 2-methyl 6-
nitro benzoic anhydride, 300 mg of 4-dimethyl pyridine, and 800 mg of piconilic acid dissolved
in 2 ml of TEA and 12 ml of pyridine) was added to each tube and the plate was incubated at
80˚C for 1 hr. After incubation, 500 µl of Hexane was added to each tube, vortexed and
centrifuged @ 4000 rpm at room temperature for 10 min. Four hundred microliters of
supernatant was transferred to a new glass microtube, evaporated to dryness under a constant
flow of nitrogen at 45˚C and reconstituted in 80 µl of loading solution (80% acetonitrile, 20%
by guest, on July 16, 2018w
ww
.jlr.orgD
ownloaded from
!$MRK@Conf idential
11
water and 0.1% of formic acid). Samples were then loaded for LC/MS analysis. Contents of
campesterol and sitosterol were normalized to the internal controls in each sample. For each
assay, 5 pooled plasma samples from multiple subjects were used as quality controls (QC) and
each QC sample was injected in triplicates for LC/MS assay. QCs with variation of ± 15%
coefficient were deemed as acceptable.
Bile acid and intermediates analysis. One hundred and fifty µl of serum was transferred into a
2 ml 96-deep well plate followed by the adding 585 µl ice-cold acetonitrile containing 0.1 %
formic acid solution and 5 µl 60 ng/ml internal standard mixture made of d6-7α,12α dihydroxy-
4-cholesten-3-one and d7-7α-hydroxy-4-cholesten-3-one. The plate was sealed and vortexed for
1 minute followed by centrifuge at 4,000 rpm for 20 minutes at room temperature. After
centrifugation, 600 µl of supernatant was passed through under positive pressure through a
protein precipitation plate which retained phospholipids but eluted the bile acid intermediates
(Ostro plate, Waters Corp, Milford, MA). The eluent was collected and evaporated under a
constant flow of N2 at 45˚C. The samples were then reconstituted in 100 µl of 80% acetonitrile
+0.1 % formic acid/ 20% water. The resultant extract was injected (10 µl) onto an LC/MS-MS
system operated in positive ion mode electrospray (UPLC/ Waters TQS mass spectrometer,
Milford, MA). Isotopic dilution quantitation was conducted to obtain concentrations of 7α,12α
dihydroxy-4-cholesten -3-one and 7a-hydroxy-4-cholesten-3-one.
Western blotting. One piece of liver weighed at ~ 100 mg was homogenized in 500 µl of RIPA
buffer by using FastPrep™-24 (MP Biomedicals). After incubation on ice for 30 min,
homogenate was centrifuged at 14,000 rpm at 4˚C for 30 min. Protein concentration of
by guest, on July 16, 2018w
ww
.jlr.orgD
ownloaded from
!$MRK@Conf idential
12
supernatant was determined by BCA protein assay kit (Pierce) and the final concentration was
calibrated to 1 mg/ml with RIPA buffer. After mixing with 2 × loading buffer and heated at
70˚C for 5 min, samples were loaded at 20 µg per well to a 4-10% SDS-PAGE gel for
electrophoresis. After transferring the protein to PVDF membrane, LDLR was blotted by using a
rabbit monoclonal antibody (RbMAb) (Abcam ab52818). Loading control was blotted by using
β-actin polyclonal antibody (CellSignaling).
Real-time quantitative PCR analysis and gene profiling
Liver samples isolated from mice treated with vehicle and GRA compound(s) were kept in
RNAlater solution (Qiagen) until processing. Tissues were homogenized and total RNA was
isolated by using RNA Easy kit and QIACube instrument (Qiagen). Two micrograms total RNA
from each sample was reverse transcribed with a cDNA kit (Life Technologies), and mRNA
levels for the genes of interest were measured by RT-PCR with Taqman Universal Mastermix
reagents and Taqman primer/probe sets (Life Technologies), or SYBR Green Mastermix
reagents and custom-designed PCR array developed in collaboration with SABiosciences-Qiagen
(22). The relative amounts of specific target amplicons for each gene were estimated by a cycle
threshold (CT) value and were normalized to the copy number of housekeeping genes, with all
genes in vehicle group arbitrarily set at 1 (22). The P values were determined by two-tailed equal
variance Student's t-test, comparing the 2-ΔCT values of the vehicle and GRAs-treated groups.
Data analysis and statistics. All data are presented as mean ± SEM. For rodent results,
statistical analysis was performed by using 1-way ANOVA followed by unpaired 2-tailed
Student’s t-test to compare mean values between treatment groups and control group. For
by guest, on July 16, 2018w
ww
.jlr.orgD
ownloaded from
!$MRK@Conf idential
13
human results, due to uneven number of human samples in different groups, the %change of the
measurements (parameters at 12 weeks vs. day -1) was calculated for each individual and then
averaged. Statistical analysis was performed by using Mann-Whitney test.
Declaration. For rodent studies, all testing protocols were reviewed and approved by the Merck
Research Laboratories Institutional Animal Care and Use Committee in Rahway and Kenilworth,
New Jersey. The Guide for the Care and Use of Laboratory Animals was followed in the
conduct of the animal studies. Veterinary care was given to animals requiring medical attention.
Finally, the ARRIVE guidelines published by NC3Rs were followed for reporting the in vivo
experiments in animal research.
Clinical trial protocols of MK-0893 were reviewed and approved by an independent Institutional
Review Board (IRB) or Ethical Review Committee (ERC) before being initiated. For each site,
the IRB/ERC and Merck’s Consent Form Review department (U.S. studies) or local medical
director (non-U.S. studies) approved the patient informed consent form. Written informed
consent was received from participants prior to inclusion in the study. In all cases, Merck
clinical studies were consistent with standards established by the Declaration of Helsinki and in
compliance with all local and/or national regulations and directives.
by guest, on July 16, 2018w
ww
.jlr.orgD
ownloaded from
!$MRK@Conf idential
14
RESULTS
Selection and characterization of GRA test compounds. Three GRA compounds (MK-0893
(23), GRA1 (24), and GRA2 (25)) were demonstrated to potently block glucagon binding to the
glucagon receptor (GCGR) and were selected for use in the preclinical studies that comprise this
investigation. MK-0893 and GRA1 were developed by Merck and GRA2 is under development
by Eli Lilly. GRA2 possesses a biaryl benzyl ether core that is distinctly different from the tri-
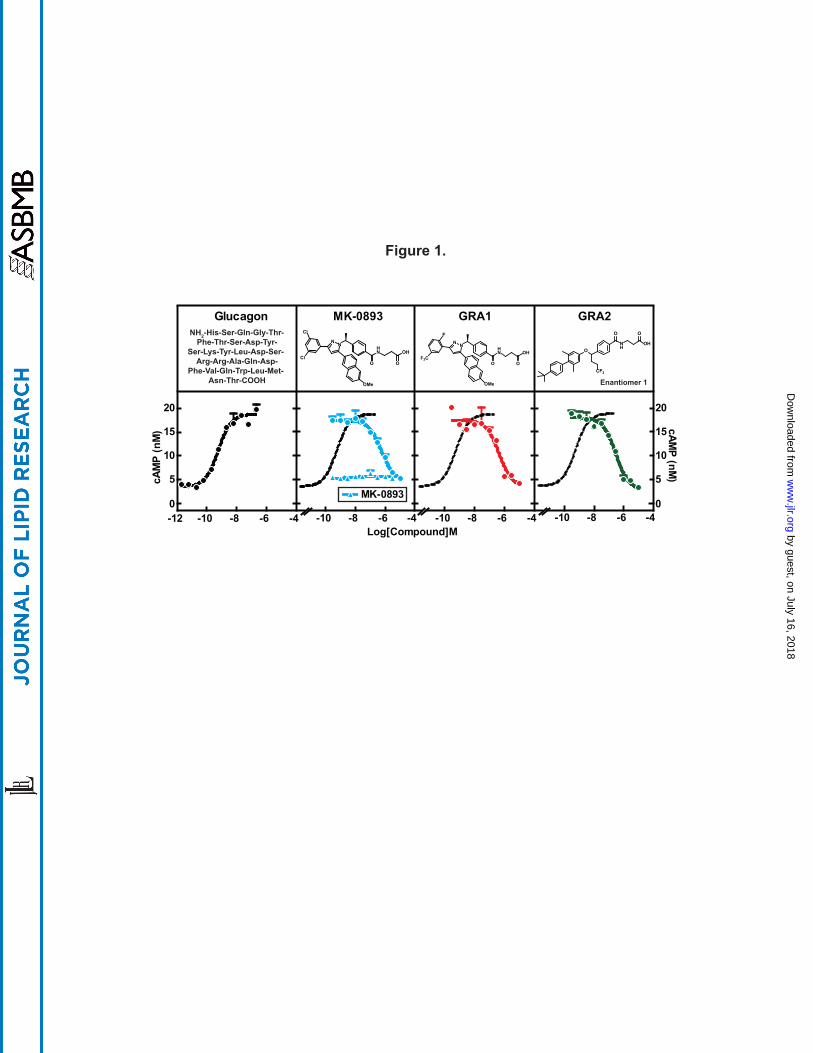
substituted diazole core present in GRA1 and MK-0893 (Fig. 1). To assess relative potencies,
cryopreserved human hepatocytes were incubated with MK-0893, GRA1, or GRA2 and in the
presence of 5 nM glucagon followed by cAMP quantitation in the culture media. Glucagon
induced cAMP production dose-dependently, with an EC50 of 575 pM, which is comparable to
physiological levels of glucagon in blood (2). MK-0893, GRA1, and GRA2 alone had no effect
on cAMP production. In the presence of glucagon, each compound suppressed cAMP
production, with IC50s of 563 nM, 448 nM and 292 nM, respectively (Fig. 1). Comparing these
results with values earlier obtained from CHO cells stably overexpressing human GCGR
(hGCGR.CHO) (23, 24), IC50s of the compounds are right-shifted, likely reflecting over-
expression of GCGR in engineered cells versus human primary hepatocytes. Nonetheless, these
data indicate the three GRA compounds are comparably potent. To further characterize these
compounds, the compounds were compared for effects on in vitro binding of glucagon to GCGR,
β-arrestin recruitment, cellular level of Ca2+, and cAMP production in hGCGR.CHO cells
(Supplemental Table S1). No meaningful differences amongst the three selected GRAs were
observed across these parameters, indicating good similarity of pharmacology of antagonizing
GCGR-mediated signaling.
by guest, on July 16, 2018w
ww
.jlr.orgD
ownloaded from

!$MRK@Conf idential
15
Effect of GRA on cholesterol synthesis and clearance in hGCGR mice. The next prerequisite
was to identify a relevant preclinical model, and for this purpose, the hGCGR mouse model was
chosen (11). The selected GRAs have more potent and specific binding for human than mouse
GCGR (24). hGCGR mice are lean, healthy, and without abnormal plasma glucose and lipids
(11). To test for qualification of hGCGR mice for these investigations, the mice were maintained
on chow diet and treated with GRA1 at 30 mpk once daily (QD) for 5 days. Glucagon-induced
glucose excursion on day 1 after a single dose and ambient glucose on day 5 were measured as
indicators of acute and subchronic GCGR blockade. Glucose excursion induced by glucagon
after a single dose was suppressed (Fig. 2A), and ambient glucose decreased by 20% after 5 days
(Fig. 2B), demonstrating effective target engagement. On chow diet under GRA1 treatment,
plasma levels of cholesterol, LDL-c, and HDL-cholesterol (HDL-c) were increased by 19%,
33%, and 21%, respectively (compared to vehicle) (Fig. 2B, Fig. 2D, and Supplemental Fig.
S3), an increase at least comparable to the rise in cholesterol observed clinically in T2DM (3,
26). Plasma TG level was not affected by GRA1 treatment (Supplemental Fig. S3). Taken
together, it is concluded that hGCGR mice are a suitable preclinical model for investigating the
mechanism of action by which GRA induces a rise in plasma cholesterol, LDL-c, and HDL-c.
It had been reported that glucagon inhibits 3-hydroxy-3-methylglutaryl-CoA reductase
(HMGCR) and suppresses cholesterol synthesis (27). Therefore, we initially focused upon
testing the hypothesis that GRA increases cholesterol synthesis. Isotope tracer methodology was
used; hGCGR mice were administered D2O (20 ml/kg body weight i.p.) to label newly
synthesized cholesterol and determine the rate of its synthesis as well for palmitate and ApoB.
(28). As a positive pharmacological comparator for the assays of palmitate and cholesterol
synthesis, T0901317, an LXR α and β agonist, was used (29). T0901317 treatment induced
by guest, on July 16, 2018w
ww
.jlr.orgD
ownloaded from
!$MRK@Conf idential
16
increased plasma cholesterol, LDL-c, and HDL-c by 76%, 166%, and 21%, respectively and
markedly increased synthesis of cholesterol and palmitate (Fig. 2). GRA1 treatment, while
replicating the increase in plasma cholesterol earlier described, did not have a significant effect
on synthesis of cholesterol, palmitate, or ApoB (Fig. 2E). Liver cholesterol content was similar
between vehicle and GRA1 treatment (Supplemental Fig. S3). It was also examined in these
studies whether GRA would alter key components governing LDL-c clearance. GRA1 treatment
had no effect relative to vehicle treatment on plasma PCSK9 and plasma ApoB (Fig. 2B), and
did not change hepatic LDLR protein level (Fig. 2C). Consistent with unchanged LDLR protein
level, LDL-c clearance was not affected by treatments of MK-0893, GRA1, and GRA2
(Supplemental Fig. S5).
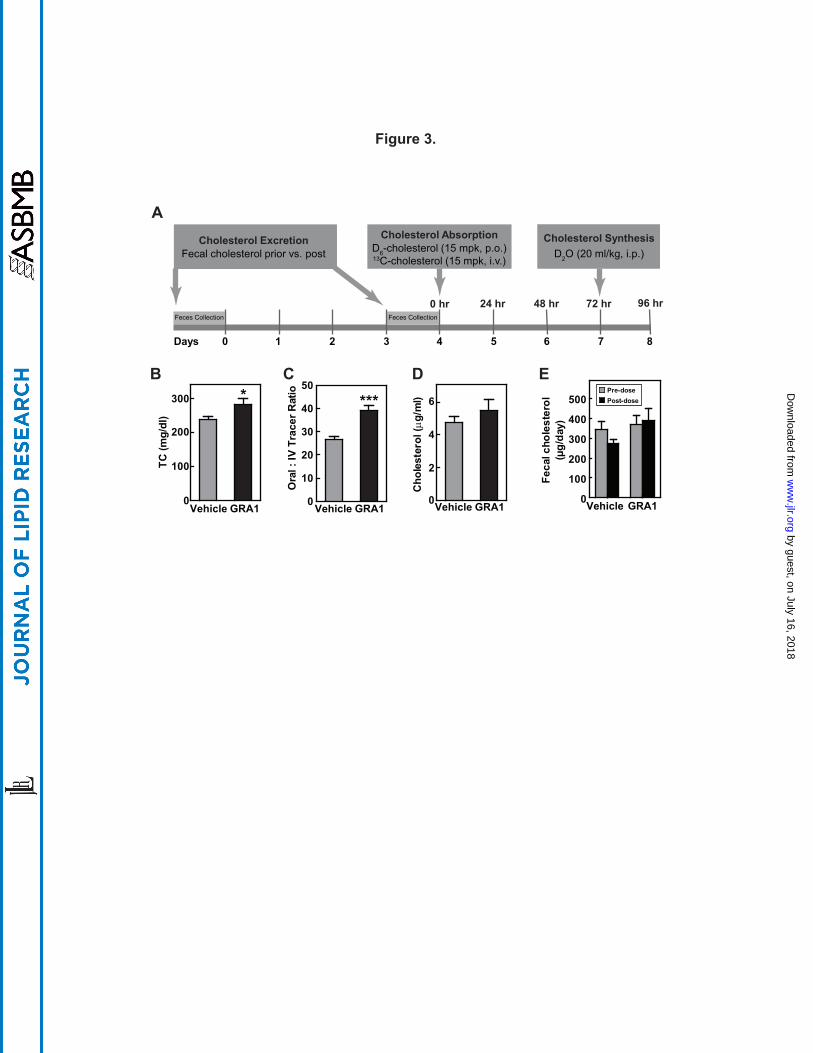
Effects of GRA on cholesterol absorption in hGCGR mice. The next set of studies were
undertaken to examine a potential effect of GRA1 on cholesterol absorption and its excretion.
An in vivo study performed in hGCGR mice on chow diet was adapted from a study design
previously published (28). Cholesterol absorption was measured using a stable isotope method
and cholesterol excretion was monitored by measuring fecal cholesterol. Stable isotope-labeled
cholesterol, 2,2,3,4,4,6-D6-cholesterol (15 mpk, p.o.) and 3,4-13C2-cholesterol (15 mpk i.v.),
were administered on day 4 followed by blood collection at 24, 48, and 72 hrs post injection.
Cholesterol absorption was calculated by the ratio of 2,2,3,4,4,6-D6-cholesterol to 3,4-13C2-
cholesterol in plasma at different time points. At 24-h prior to euthanasia, mice were dosed with
D2O (i.p., 20 ml/kg) for measurement of cholesterol and palmitate synthesis (Fig. 3A). After 9
days of treatment, GRA1 increased plasma level of total cholesterol by 18%; thus a highly
consistent response (Fig. 3B). Cholesterol absorption was found to be increased by 46% (Fig.
by guest, on July 16, 2018w
ww
.jlr.orgD
ownloaded from
!$MRK@Conf idential
17
3C). Similar increase of cholesterol absorption was observed for MK-0893 and GRA2
(Supplemental Fig. S5). It was again observed that there was not a significant change in rate of
cholesterol synthesis (Fig. 3D). Cholesterol excretion was not found to be significantly changed
(Fig. 3E).
GRA1 and GRA2 increase blood cholesterol and cholesterol absorption. A key aspect of
these studies was to address whether the finding of increased cholesterol absorption studies was
unique for a specific GRA compound or instead could be mechanism based. The isotope study
described above was repeated using the structurally distinct GRA2. A second aspect was to add
measurements of phytosterols, plant sterols, the plasma level of which are recognized as
biomarkers of intestinal cholesterol absorption (30). GRA1 and GRA2 were dosed (30 mpk each)
to achieve similar and robust target engagement, as assessed by blockade of a glucagon-induced
glucose excursion (Fig. 4A). After 5 days of treatment, GRA1 and GRA2 increased plasma total
cholesterol by 20% and 27.3% respectively (Fig. 4B). Both compounds increased cholesterol
absorption as indicated by treatment related increases in plasma phytosterols. Campesterol
increased 33.1% for GRA1 and 33.3% for GRA2, and plasma sitosterol 37.2% for GRA1 and
38.9% for GRA2 (Fig. 4B). Based on D2O labeling, no significant change in rate of cholesterol
synthesis was found for either GRA1 or GRA2. GRA2 slightly increased the plasma level of
lathosterol, however there was not a significant difference in the lathosterol-to-cholesterol ratio
on treatment with GRA1 or GRA2 (Fig. 4B), an indirect measurement of cholesterol synthesis
(31).
It was reported that plasma levels of GLP-1 and GLP-2 were dramatically increased in
GCGR-/- mice (32, 33). In hGCGR mice treated with GRA1 and GRA2, plasma levels of total
by guest, on July 16, 2018w
ww
.jlr.orgD
ownloaded from
!$MRK@Conf idential
18
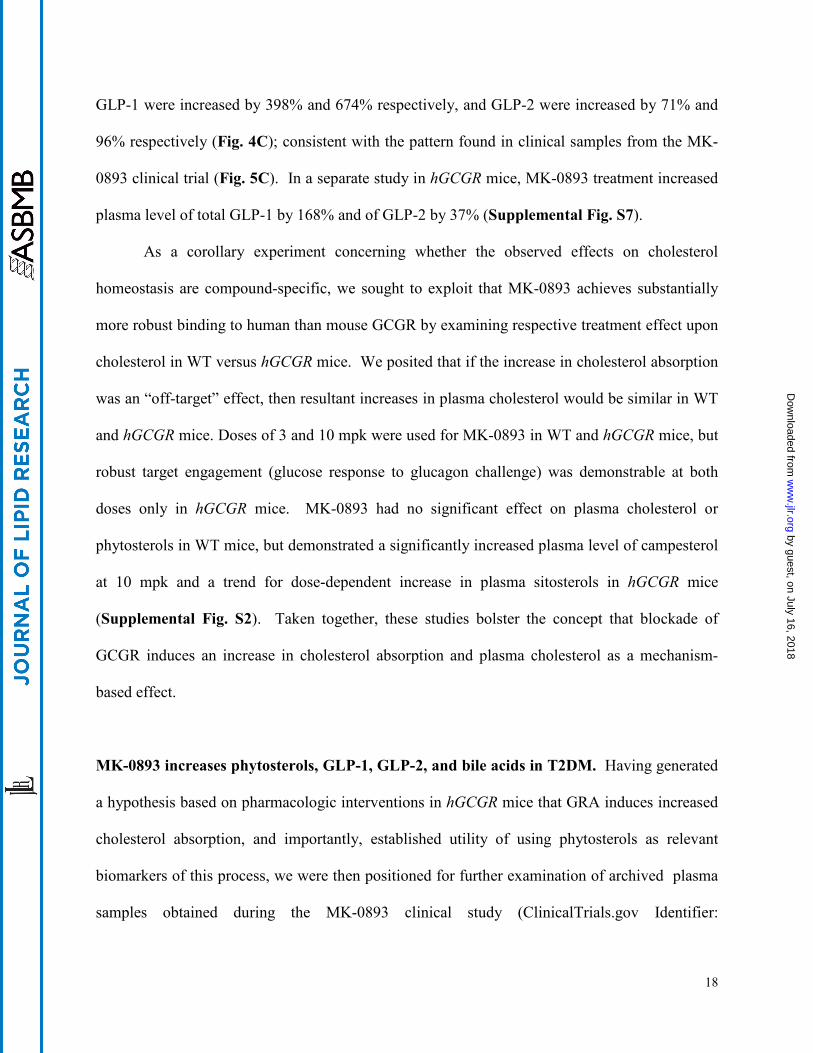
GLP-1 were increased by 398% and 674% respectively, and GLP-2 were increased by 71% and
96% respectively (Fig. 4C); consistent with the pattern found in clinical samples from the MK-
0893 clinical trial (Fig. 5C). In a separate study in hGCGR mice, MK-0893 treatment increased
plasma level of total GLP-1 by 168% and of GLP-2 by 37% (Supplemental Fig. S7).
As a corollary experiment concerning whether the observed effects on cholesterol
homeostasis are compound-specific, we sought to exploit that MK-0893 achieves substantially
more robust binding to human than mouse GCGR by examining respective treatment effect upon
cholesterol in WT versus hGCGR mice. We posited that if the increase in cholesterol absorption
was an “off-target” effect, then resultant increases in plasma cholesterol would be similar in WT
and hGCGR mice. Doses of 3 and 10 mpk were used for MK-0893 in WT and hGCGR mice, but
robust target engagement (glucose response to glucagon challenge) was demonstrable at both
doses only in hGCGR mice. MK-0893 had no significant effect on plasma cholesterol or
phytosterols in WT mice, but demonstrated a significantly increased plasma level of campesterol
at 10 mpk and a trend for dose-dependent increase in plasma sitosterols in hGCGR mice
(Supplemental Fig. S2). Taken together, these studies bolster the concept that blockade of
GCGR induces an increase in cholesterol absorption and plasma cholesterol as a mechanism-
based effect.
MK-0893 increases phytosterols, GLP-1, GLP-2, and bile acids in T2DM. Having generated
a hypothesis based on pharmacologic interventions in hGCGR mice that GRA induces increased
cholesterol absorption, and importantly, established utility of using phytosterols as relevant
biomarkers of this process, we were then positioned for further examination of archived plasma
samples obtained during the MK-0893 clinical study (ClinicalTrials.gov Identifier:
by guest, on July 16, 2018w
ww
.jlr.orgD
ownloaded from
!$MRK@Conf idential
19
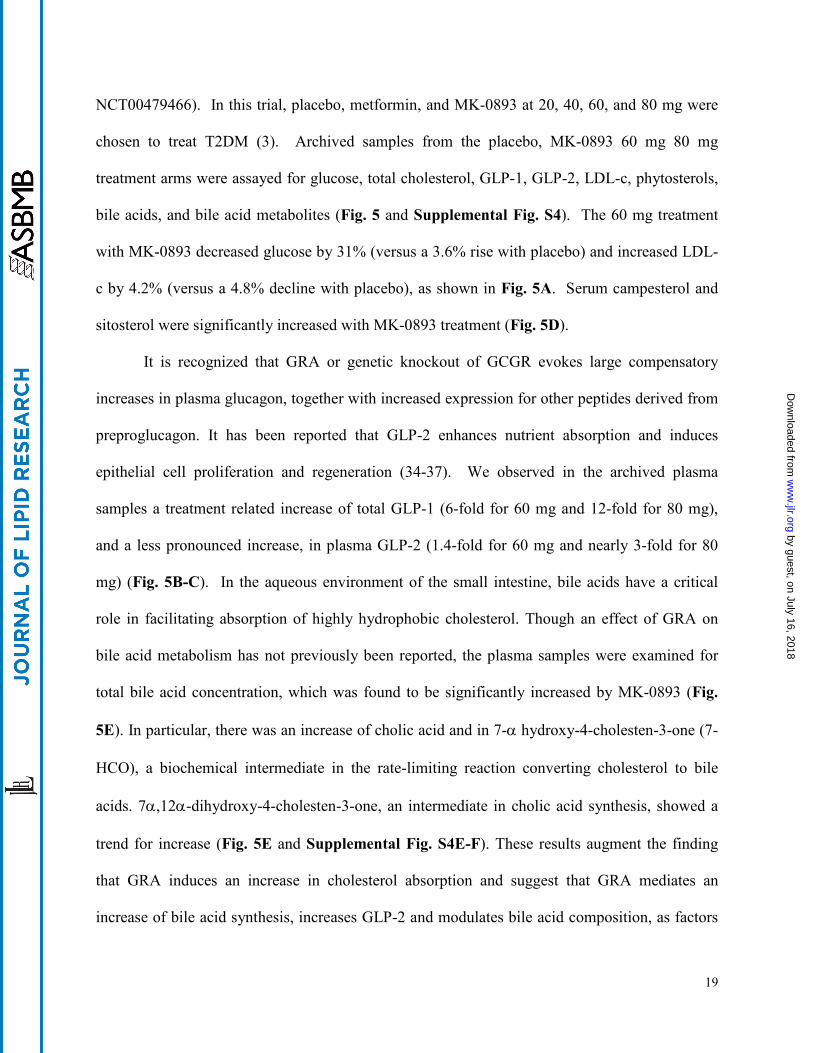
NCT00479466). In this trial, placebo, metformin, and MK-0893 at 20, 40, 60, and 80 mg were
chosen to treat T2DM (3). Archived samples from the placebo, MK-0893 60 mg 80 mg
treatment arms were assayed for glucose, total cholesterol, GLP-1, GLP-2, LDL-c, phytosterols,
bile acids, and bile acid metabolites (Fig. 5 and Supplemental Fig. S4). The 60 mg treatment
with MK-0893 decreased glucose by 31% (versus a 3.6% rise with placebo) and increased LDL-
c by 4.2% (versus a 4.8% decline with placebo), as shown in Fig. 5A. Serum campesterol and
sitosterol were significantly increased with MK-0893 treatment (Fig. 5D).
It is recognized that GRA or genetic knockout of GCGR evokes large compensatory
increases in plasma glucagon, together with increased expression for other peptides derived from
preproglucagon. It has been reported that GLP-2 enhances nutrient absorption and induces
epithelial cell proliferation and regeneration (34-37). We observed in the archived plasma
samples a treatment related increase of total GLP-1 (6-fold for 60 mg and 12-fold for 80 mg),
and a less pronounced increase, in plasma GLP-2 (1.4-fold for 60 mg and nearly 3-fold for 80
mg) (Fig. 5B-C). In the aqueous environment of the small intestine, bile acids have a critical
role in facilitating absorption of highly hydrophobic cholesterol. Though an effect of GRA on
bile acid metabolism has not previously been reported, the plasma samples were examined for
total bile acid concentration, which was found to be significantly increased by MK-0893 (Fig.
5E). In particular, there was an increase of cholic acid and in 7-α hydroxy-4-cholesten-3-one (7-
HCO), a biochemical intermediate in the rate-limiting reaction converting cholesterol to bile
acids. 7α,12α-dihydroxy-4-cholesten-3-one, an intermediate in cholic acid synthesis, showed a
trend for increase (Fig. 5E and Supplemental Fig. S4E-F). These results augment the finding
that GRA induces an increase in cholesterol absorption and suggest that GRA mediates an
increase of bile acid synthesis, increases GLP-2 and modulates bile acid composition, as factors
by guest, on July 16, 2018w
ww
.jlr.orgD
ownloaded from
!$MRK@Conf idential
20
that could potentially contribute to the mechanism for increasing intestinal absorption of
cholesterol.
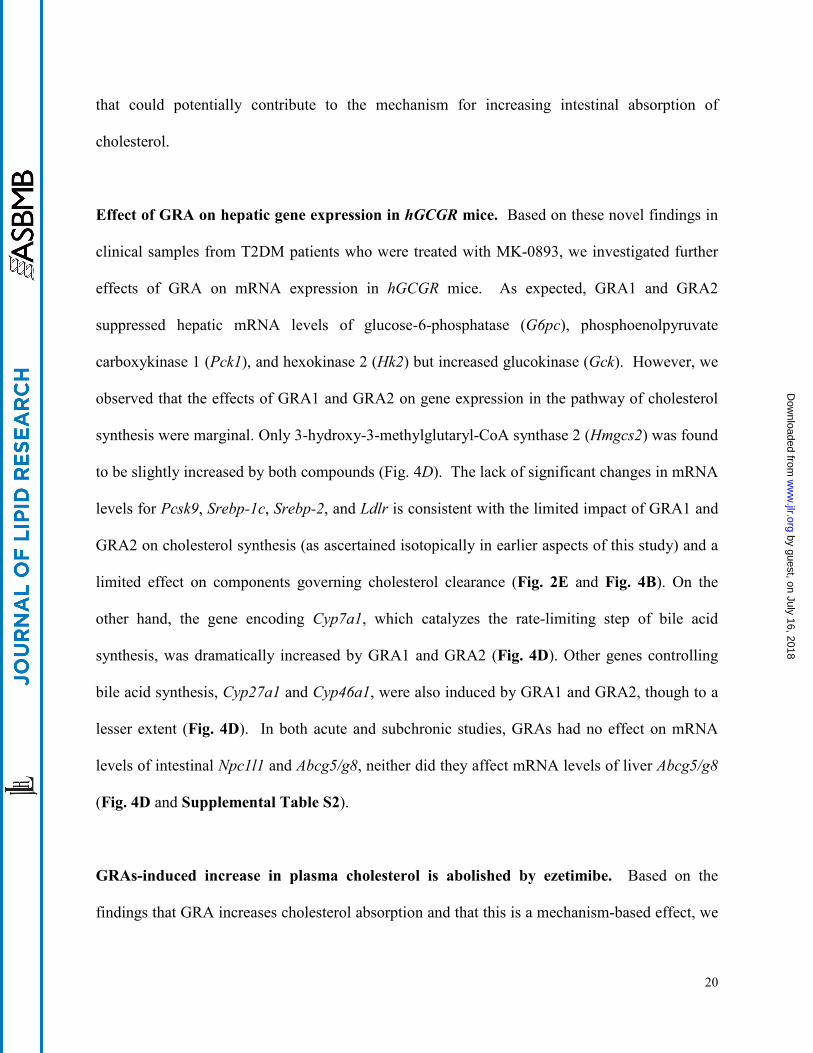
Effect of GRA on hepatic gene expression in hGCGR mice. Based on these novel findings in
clinical samples from T2DM patients who were treated with MK-0893, we investigated further
effects of GRA on mRNA expression in hGCGR mice. As expected, GRA1 and GRA2
suppressed hepatic mRNA levels of glucose-6-phosphatase (G6pc), phosphoenolpyruvate
carboxykinase 1 (Pck1), and hexokinase 2 (Hk2) but increased glucokinase (Gck). However, we
observed that the effects of GRA1 and GRA2 on gene expression in the pathway of cholesterol
synthesis were marginal. Only 3-hydroxy-3-methylglutaryl-CoA synthase 2 (Hmgcs2) was found
to be slightly increased by both compounds (Fig. 4D). The lack of significant changes in mRNA
levels for Pcsk9, Srebp-1c, Srebp-2, and Ldlr is consistent with the limited impact of GRA1 and
GRA2 on cholesterol synthesis (as ascertained isotopically in earlier aspects of this study) and a
limited effect on components governing cholesterol clearance (Fig. 2E and Fig. 4B). On the
other hand, the gene encoding Cyp7a1, which catalyzes the rate-limiting step of bile acid
synthesis, was dramatically increased by GRA1 and GRA2 (Fig. 4D). Other genes controlling
bile acid synthesis, Cyp27a1 and Cyp46a1, were also induced by GRA1 and GRA2, though to a
lesser extent (Fig. 4D). In both acute and subchronic studies, GRAs had no effect on mRNA
levels of intestinal Npc1l1 and Abcg5/g8, neither did they affect mRNA levels of liver Abcg5/g8
(Fig. 4D and Supplemental Table S2).
GRAs-induced increase in plasma cholesterol is abolished by ezetimibe. Based on the
findings that GRA increases cholesterol absorption and that this is a mechanism-based effect, we
by guest, on July 16, 2018w
ww
.jlr.orgD
ownloaded from
!$MRK@Conf idential
21
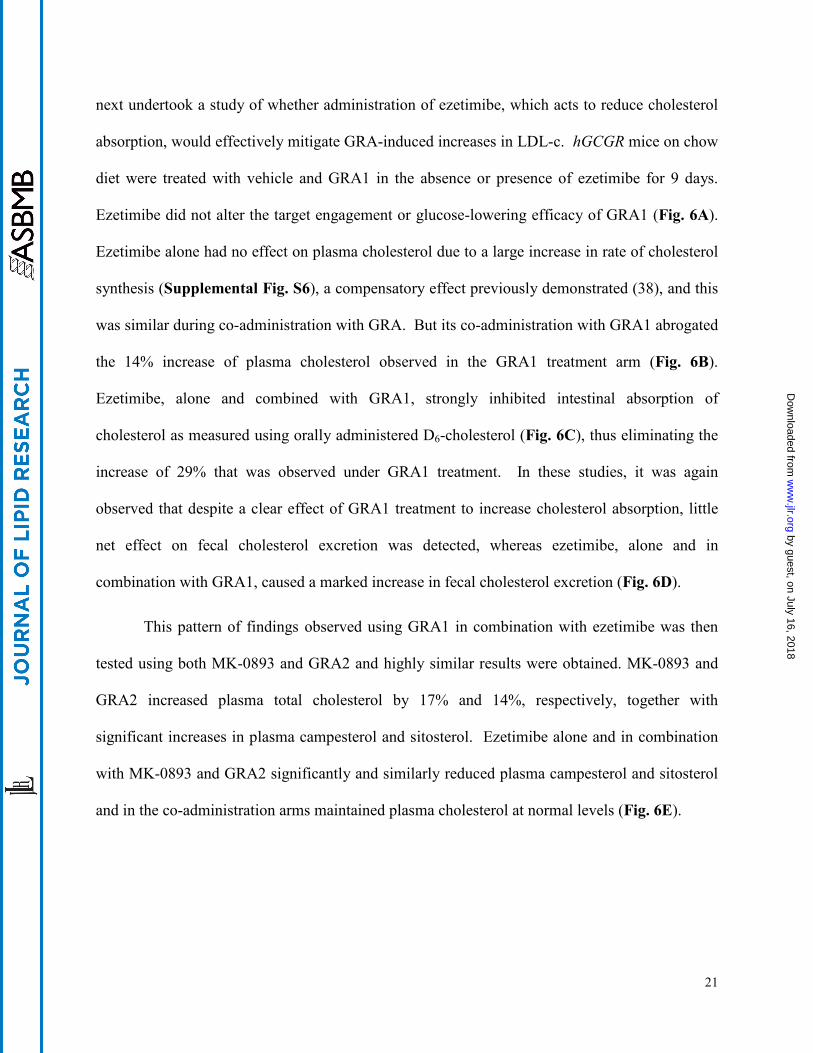
next undertook a study of whether administration of ezetimibe, which acts to reduce cholesterol
absorption, would effectively mitigate GRA-induced increases in LDL-c. hGCGR mice on chow
diet were treated with vehicle and GRA1 in the absence or presence of ezetimibe for 9 days.
Ezetimibe did not alter the target engagement or glucose-lowering efficacy of GRA1 (Fig. 6A).
Ezetimibe alone had no effect on plasma cholesterol due to a large increase in rate of cholesterol
synthesis (Supplemental Fig. S6), a compensatory effect previously demonstrated (38), and this
was similar during co-administration with GRA. But its co-administration with GRA1 abrogated
the 14% increase of plasma cholesterol observed in the GRA1 treatment arm (Fig. 6B).
Ezetimibe, alone and combined with GRA1, strongly inhibited intestinal absorption of
cholesterol as measured using orally administered D6-cholesterol (Fig. 6C), thus eliminating the
increase of 29% that was observed under GRA1 treatment. In these studies, it was again
observed that despite a clear effect of GRA1 treatment to increase cholesterol absorption, little
net effect on fecal cholesterol excretion was detected, whereas ezetimibe, alone and in
combination with GRA1, caused a marked increase in fecal cholesterol excretion (Fig. 6D).
This pattern of findings observed using GRA1 in combination with ezetimibe was then
tested using both MK-0893 and GRA2 and highly similar results were obtained. MK-0893 and
GRA2 increased plasma total cholesterol by 17% and 14%, respectively, together with
significant increases in plasma campesterol and sitosterol. Ezetimibe alone and in combination
with MK-0893 and GRA2 significantly and similarly reduced plasma campesterol and sitosterol
and in the co-administration arms maintained plasma cholesterol at normal levels (Fig. 6E).
by guest, on July 16, 2018w
ww
.jlr.orgD
ownloaded from
!$MRK@Conf idential
22
DISCUSSION
The impetus for these investigations of the effect of GRA on cholesterol homeostasis in
hGCGR mice arose from clinical observations that dose-dependent increases in LDL-c occur in
T2DM patients treated with the GRA MK-0893. The 12-week clinical trial of MK-0893
achieved clear evidence that antagonizing endogenous glucagon can improve hyperglycemia in
T2DM, attaining impressive efficacy on HbA1c and with minimal risk of hypoglycemia. Yet, the
collateral finding of a dose-dependent, statistically significant increase in LDL-c raises a concern
of increased cardiovascular risk despite substantial improvement in hyperglycemia.
This was therefore a “bedside-to-bench” inspired translational study, undertaken to
determine whether the rise in plasma LDL-c was restricted to MK-0893 or instead is more likely
to be mechanism-based. Because our data support that the effect is mechanism-based, we sought
to determine amongst cholesterol synthesis, excretion, absorption, or plasma clearance of LDL-c,
which is the mechanism primarily responsible. The initial step was to identify an appropriate
preclinical rodent model, a necessity because the GRA compounds had been optimized for
potency against human GCGR and are much weaker against mouse GCGR, reflecting species-
differences in GCGR homology (11). The hGCGR mouse demonstrated elevation of plasma
cholesterol with three structurally distinct GRA compounds and to an extent similar to the rise
observed in clinical studies, establishing both that this was a suitable model and inferring that the
rise in plasma LDL-c is mechanism-based. On the basis chiefly of isotopic flux determinations
of endogenous cholesterol synthesis and separately, of intestinal cholesterol absorption, it was
determined that GRA raises LDL-c by increasing cholesterol absorption. Bolstering this
interpretation is the observation that GRA significantly increases plasma phytosterols,
recognized biomarkers of intestinal absorption of cholesterol, and comparable to the increase of
by guest, on July 16, 2018w
ww
.jlr.orgD
ownloaded from
!$MRK@Conf idential
23
cholesterol absorption detected by isotopic methodology. Furthermore, these findings on plasma
phytosterols in the hGCGR mouse enabled our studies to pivot from back to “bench-to-bedside”,
and using archived samples from the clinical study of MK-0893, significant increases of
phytosterols were observed during treatment with this GRA.
The concept that glucagon influences cholesterol metabolism has been previously
reported though with uncertainty as to the responsible mechanism. Reports have appeared in the
literature since the 1950’s, describing an association between glucagon action and cholesterol.
For example, destruction of α-cells increased plasma cholesterol in rabbits (39) and dogs (40)
while infusing glucagon prevented hypercholesterolemia in rats fed with a high cholesterol diet
(41). LDL-c and the rate of cholesterol synthesis in a patient with familial hypercholesterolemia
were reduced by portacaval shunt surgery, which was associated with marked increases of
plasma glucagon and bile acids (42). Furthermore, glucagon infusion into humans profoundly
reduced plasma levels of cholesterol (43). GCGR-/- mice were reported to have a significantly
higher plasma LDL-c than WT (32). Plasma cholesterol was reported to increase in diet-induced
obese mice treated with a monoclonal antibody inhibiting GCGR (44). In preclinical studies
with MK-0893, there was not a prominent signal of increased plasma cholesterol that was noted
(unpublished results), perhaps simply reflecting the lesser potency of this compound for rodent
compared to human GCGR. Regardless, with the hindsight afforded by the clinical trial data with
MK-0893, it is clear that the published literature does contain precedents for the observation that
GRA can influence cholesterol metabolism.
The mechanism underlying the prior findings was not rigorously addressed though the
findings were variously attributed, prominent amongst which is the hypothesis that antagonism
of glucagon can increase cholesterol synthesis. There is a rationale that blocking glucagon
by guest, on July 16, 2018w
ww
.jlr.orgD
ownloaded from
!$MRK@Conf idential
24
signaling and hence an increase in cAMP would release inactivation of HMGCR (27). In
addition, it has been reported that glucagon suppresses plasma PCSK9 (45) and increases hepatic
LDL receptor (LDLR) protein levels (46), presumably as a consequence of effects on the Srebp-
2 pathway (45). Knockdown of GCGR in db/db mice significantly increased LDL-c, which was
attributed to elevated hepatic lipogenesis and cholesterol synthesis (47). Therefore, in the
current studies it was initially evaluated whether GRA mediated an increase in cholesterol
synthesis or might decrease LDL-c clearance. Our findings do not support either hypothesis.
LDLR, PCSK9, and rates of cholesterol synthesis were not significantly changed during
treatment with multiple GRAs despite unequivocal induction of increased plasma cholesterol.
Instead, our studies reveal the novel finding that there is a strong effect of GRA to
increase absorption of cholesterol. It appears there are marked differences between GRAs
treatment and GCGR knockdown. While GRAs increased LDL-c and HDL-c, GCGR
knockdown only increased LDL-c without any effect on HDL-c. Mechanistically, GCGR
knockdown induced cholesterol synthesis (47) whereas GRAs induced cholesterol absorption
without any effect on cholesterol synthesis. Though our studies did obtain some insights as to
what may in turn contribute to increased absorption of cholesterol, it is acknowledged that there
are a number of aspects of this novel hypothesis that will require further investigation. One
factor might be the effect of GRA to raise secretion of the gut hormone GLP-2. It is known that
glucagon, GLP-1, and GLP-2 are dramatically increased in GCGR-/- mice (33, 48). Plasma
levels of total GLP-1 and GLP-2 were both significantly increased by subchronic treatment of
GRA1, GRA2, and MK-0893 in hGCGR mice. Dramatic inductions of plasma total GLP-1 and
GLP-2 were observed in T2DM patients treated with MK-0893 chronically. GLP-2 has been
reported to induce crypt cell proliferation and its effect on intestinal lipid absorption depend on
by guest, on July 16, 2018w
ww
.jlr.orgD
ownloaded from
!$MRK@Conf idential
25
nutritional status and presence of GLP-1 (34, 36, 37, 49). Although induction of GRAs on GLP-2
is predictable based on results from GCGR-/- mice, it appears that GRA does not mirror the effect
of glucagon on cholesterol metabolism. This, however, does not negate the published findings of
glucagon on Srebp-2 pathway including LDLR (46), PCSK9 (50), and cholesterol synthesis (29).
The induction of GRA on GLP-2 is so dramatic that it might have masked the activation on
Srebp-2 pathway caused by blockade of GCGR inasmuch as intestinal cholesterol absorption and
hepatic cholesterol synthesis are reversely affected by each other (51, 52).
Another set of observations obtained in the present studies of GRA treatment that we
posit to be a fruitful for further examinations concerns bile acids. Bile acids serve a critical role
in facilitating intestinal absorption of hydrophobic lipids, notably including cholesterol and as
well bile acids are derived from cholesterol and thus intimately associated with hepatic
cholesterol metabolism. The archived plasma samples from the clinical study with MK-0893
were assayed for bile acid concentration and it was found that these levels were increased,
including cholic acid and cholic acid precursors. Cholic acid supplementation enhances
cholesterol absorption in humans (50). In GRA-treated hGCGR mice, a consistent finding is
increased Cyp7a1 mRNA expression, the enzyme that is rate-limiting in bile acid synthesis.
Consistent with increased mRNA level of Cyp7a1 in hGCGR mice, its proximal product (7-
HCO) was increased in T2DM during GRA treatment. It might also be considered that bile acids
can stimulate secretion of GLP-1 and GLP-2 from L-cell via activating bile acid receptor, TGR5
(53). There is resurgent interest in the role of bile acids in metabolic signaling, particularly in the
context of diabetes mellitus (54), and the current findings indicate that glucagon agonism and
antagonism can be influential in governing bile acid homeostasis.
by guest, on July 16, 2018w
ww
.jlr.orgD
ownloaded from
!$MRK@Conf idential
26
Our studies indicate that the effect of MK-0893 to increase LDL-c derives mostly from a
net increase in absorption of cholesterol and that this is a mechanism-based rather than
compound specific effect. This conclusion is based upon consistent findings in the hGCGR mice
using three structurally diverse GRAs. Yet, while the data of our preclinical studies indicate a
likely mechanism based effect to increase plasma LDL-c via increased cholesterol absorption,
we do recognize that the reported clinical findings to date with effect of GRA on plasma LDL-c
are inconsistent. In the clinical trials of LY2409021 (5, 6) and with ISIS-GCGRrx (7), no
induction of LDL-c was reported. It remains uncertain why these findings may differ from what
was observed in the clinical trial with MK-0893. Perhaps it is noteworthy that clinical trials of
LY2409021 and ISIS-GCGRrx were not exclusively GRA monotherapy as was the situation with
the clinical dose-ranging study of MK-0893; instead many of the T2DM participants in those
studies were also receiving metformin treatment (5, 7). Metformin generally improves
hypercholesterolemia in humans, although the mechanism is still not well understood (55).
Clinical studies conducted using MK-0893 in combination with metformin treatment was found
to have increased efficacy in reducing hyperglycemia and substantially mitigated the increase in
LDL-c observed with GRA monotherapy in T2DM (26).
In keeping with a translational emphasis of the present studies, the effectiveness of
ezetimibe to abrogate a GRA-induced increase in cholesterol absorption and plasma LDL-c was
investigated. Ezetimibe, the molecular target for which is inhibition of NPC1L1, effectively
abolished the increase in cholesterol absorption caused by GRA and without interfering with
efficacy in reducing hyperglycemia. It is possible that GRA-induced hypercholesterolemia could
be mediated in part by an effect on Npc1l1, (56, 57), this remains to be more fully characterized
but regardless, we describe in a rodent model that blocking NPC1L1 with ezetimibe effectively
by guest, on July 16, 2018w
ww
.jlr.orgD
ownloaded from
!$MRK@Conf idential
27
suppresses the GRA-induced hypercholesterolemia. We postulate that co-administering GRAs
and ezetimibe will work equally or better in humans because unlike the exclusive expression of
Npc1l1 in intestine in mice, NPC1L1 is expressed abundantly in liver and intestine in humans
(58) and ezetimibe exerts its lipid lowering effect by blocking NPC1L1 in both liver and
intestine in humans (59).
In summary, we used various pharmacological tools to study the major cause of GRA-
induced hypercholesterolemia in mice and humans. Studies in mice demonstrated that increased
plasma cholesterol was mainly attributable to cholesterol absorption. Consistent with this
finding obtained in rodent, we report the novel finding that the increase of plasma LDL-c and
cholesterol was associated with increases in plasma phytosterols in humans. With respect to
potential mechanisms that mediate GRA-induced increase in cholesterol absorption, it was
observed that GRA-induced increases in GLP-2 and a trend of increase in bile acid
concentrations in patients with T2DM and as well in the rodent model, together with mRNA
expression of hepatic bile acid synthesis enzymes in mice. These are factors that can plausibly
contribute to increased cholesterol absorption. Finally, in keeping with the translational
emphasis of these studies, it was shown that ezetimibe effectively mitigated GRA-induced
cholesterolemia in mice. Thus combining GRA and ezetimibe may provide a feasible approach
to mitigating MK-0893-induced elevation of cholesterol in patients with T2DM. Collectively,
these results provide novel insights into the effect of glucagon and glucagon receptor antagonism
in governing cholesterol homeostasis.
by guest, on July 16, 2018w
ww
.jlr.orgD
ownloaded from
!$MRK@Conf idential
28
Acknowledgments / grant support
The authors thank Taro Akiyama and Peter Stein for critically reading the manuscript and
providing constructive suggestions. Doug Johns, Cai Li, Dan Kemp, Tom Roddy, Jing Li,
Kristian Jensen, Juliann Ehrhart, Heather Zhou, Seongah Han, Eric Muise, Brad Sherborne, and
Paul Carrington provided insightful suggestions to the study design and data interpretation.
This work was supported by Merck Research Laboratories, Merck & Co., Inc.
by guest, on July 16, 2018w
ww
.jlr.orgD
ownloaded from
!$MRK@Conf idential
29
REFERENCES
1. Muller, W. A., G. R. Faloona, E. Aguilar-Parada, and R. H. Unger. 1970. Abnormal alpha-cell function in diabetes. Response to carbohydrate and protein ingestion. The New England journal of medicine 283: 109-115. 2. Unger, R. H., and A. D. Cherrington. 2012. Glucagonocentric restructuring of diabetes: a pathophysiologic and therapeutic makeover. The Journal of clinical investigation 122: 4-12. 3. Engel, S. S., L. Xu, P. J. Andryuk, M. J. Davies, A. John, K. Kaufman, and B. J. Goldstein. 2011. Efficacy and Tolerability of MK-0893, a Glucagon Receptor Antagonist (GRA), in Patients with Type 2 Diabetes (T2DM). Diabetes 60 Suppl 1: A85. 4. Engel, S. S., M. Reitman, L. Xu, P. J. Andryuk, M. J. Davies, K. Kaufman, and B. J. Goldstein. 2012. Glycemic and Lipid Effects of the Short-Acting Glucagon Receptor Antagonist MK-3577 in Patients With Type 2 Diabetes. Diabetes 61 Suppl 1: A266. 5. Kazda, C. M., S. A. Headlee, Y. Ding, R. P. Kelly, P. Garhyan, T. A. Hardy, and A. J. Lewin. 2013. The glucagon receptor antagonist LY2409021 significantly lowers HbA1c and is well tolerated in patients with type 2 diabetes mellitus: a 24-week phase 2 study. Diabetologia 56 Suppl 1: S391. 6. Kelly, R. P., P. Garhyan, E. Raddad, H. Fu, C. N. Lim, M. J. Prince, J. A. Pinaire, M. T. Loh, and M. A. Deeg. 2015. Short-term administration of the glucagon receptor antagonist LY2409021 lowers blood glucose in healthy subjects and patients with type 2 diabetes. Diabetes Obes Metab. 7. Morgan, E., A. Smith, L. Watts, S. Xia, W. Cheng, R. Geary, and S. Bhanot. 2014. ISIS-GCGRRX, an Antisense Glucagon Receptor Antagonist, Caused Rapid, Robust, and Sustained Improvements in Glycemic Control without Changes in BW, BP, Lipids, or Hypoglycemia in T2DM Patients on Stable Metformin Therapy. Diabetes 63 Suppl 1A: LB28. 8. Colhoun, H. M., D. J. Betteridge, P. N. Durrington, G. A. Hitman, H. A. Neil, S. J. Livingstone, M. J. Thomason, M. I. Mackness, V. Charlton-Menys, and J. H. Fuller. 2004. Primary prevention of cardiovascular disease with atorvastatin in type 2 diabetes in the Collaborative Atorvastatin Diabetes Study (CARDS): multicentre randomised placebo-controlled trial. Lancet 364: 685-696. 9. Betteridge, J. 2005. Benefits of lipid-lowering therapy in patients with type 2 diabetes mellitus. Am J Med 118 Suppl 12A: 10-15. 10. Howard, B. V., D. C. Robbins, M. L. Sievers, E. T. Lee, D. Rhoades, R. B. Devereux, L. D. Cowan, R. S. Gray, T. K. Welty, O. T. Go, and W. J. Howard. 2000. LDL cholesterol as a strong predictor of coronary heart disease in diabetic individuals with insulin resistance and low LDL: The Strong Heart Study. Arterioscler Thromb Vasc Biol 20: 830-835. 11. Shiao, L. L., M. A. Cascieri, M. Trumbauer, H. Chen, and K. A. Sullivan. 1999. Generation of mice expressing the human glucagon receptor with a direct replacement vector. Transgenic research 8: 295-302. 12. Dallas-Yang, Q., X. Shen, M. Strowski, E. Brady, R. Saperstein, R. E. Gibson, D. Szalkowski, S. A. Qureshi, M. R. Candelore, J. E. Fenyk-Melody, E. R. Parmee, B. B. Zhang, and G. Jiang. 2004. Hepatic glucagon receptor binding and glucose-lowering in vivo by peptidyl and non-peptidyl glucagon receptor antagonists. European journal of pharmacology 501: 225-234. 13. Bosner, M. S., L. G. Lange, W. F. Stenson, and R. E. Ostlund, Jr. 1999. Percent cholesterol absorption in normal women and men quantified with dual stable isotopic tracers and negative ion mass spectrometry. Journal of lipid research 40: 302-308. 14. Ni, Y. G., S. Di Marco, J. H. Condra, L. B. Peterson, W. Wang, F. Wang, S. Pandit, H. A. Hammond, R. Rosa, R. T. Cummings, D. D. Wood, X. Liu, M. J. Bottomley, X. Shen, R. M. Cubbon, S. P. Wang, D. G. Johns, C. Volpari, L. Hamuro, J. Chin, L. Huang, J. Z. Zhao, S. Vitelli, P. Haytko, D. Wisniewski, L. J. Mitnaul, C. P. Sparrow, B. Hubbard, A. Carfi, and A. Sitlani. 2011. A PCSK9-binding antibody that structurally mimics the EGF(A) domain of LDL-receptor reduces LDL cholesterol in vivo. Journal of lipid research 52: 78-86. 15. Castro-Perez, J., F. Briand, K. Gagen, S. P. Wang, Y. Chen, D. G. McLaren, V. Shah, R. J. Vreeken, T. Hankemeier, T. Sulpice, T. P. Roddy, B. K. Hubbard, and D. G. Johns. 2011. Anacetrapib promotes reverse cholesterol transport and bulk cholesterol excretion in Syrian golden hamsters. Journal of lipid research 52: 1965-1973. 16. Folch, J., M. Lees, and G. H. Sloane Stanley. 1957. A simple method for the isolation and purification of total lipides from animal tissues. J Biol Chem 226: 497-509. 17. Shah, V., K. Herath, S. F. Previs, B. K. Hubbard, and T. P. Roddy. 2010. Headspace analyses of acetone: a rapid method for measuring the 2H-labeling of water. Anal Biochem 404: 235-237.
by guest, on July 16, 2018w
ww
.jlr.orgD
ownloaded from
!$MRK@Conf idential
30
18. Previs, S. F., A. Mahsut, A. Kulick, K. Dunn, G. Andrews-Kelly, C. Johnson, G. Bhat, K. Herath, P. L. Miller, S. P. Wang, K. Azer, J. Xu, D. G. Johns, B. K. Hubbard, and T. P. Roddy. 2011. Quantifying cholesterol synthesis in vivo using (2)H(2)O: enabling back-to-back studies in the same subject. Journal of lipid research 52: 1420-1428. 19. Turley, S. D., M. W. Herndon, and J. M. Dietschy. 1994. Reevaluation and application of the dual-isotope plasma ratio method for the measurement of intestinal cholesterol absorption in the hamster. Journal of lipid research 35: 328-339. 20. Zilversmit, D. B., and L. B. Hughes. 1974. Validation of a dual-isotope plasma ratio method for measurement of cholesterol absorption in rats. Journal of lipid research 15: 465-473. 21. Zhou, H., W. Li, S. P. Wang, V. Mendoza, R. Rosa, J. Hubert, K. Herath, T. McLaughlin, R. J. Rohm, M. E. Lassman, K. K. Wong, D. G. Johns, S. F. Previs, B. K. Hubbard, and T. P. Roddy. 2012. Quantifying apoprotein synthesis in rodents: coupling LC-MS/MS analyses with the administration of labeled water. Journal of lipid research 53: 1223-1231. 22. Jensen, K. K., S. F. Previs, L. Zhu, K. Herath, S. P. Wang, G. Bhat, G. Hu, P. L. Miller, D. G. McLaren, M. K. Shin, T. F. Vogt, L. Wang, K. K. Wong, T. P. Roddy, D. G. Johns, and B. K. Hubbard. 2012. Demonstration of diet-induced decoupling of fatty acid and cholesterol synthesis by combining gene expression array and 2H2O quantification. Am J Physiol Endocrinol Metab 302: E209-217. 23. Xiong, Y., J. Guo, M. R. Candelore, R. Liang, C. Miller, Q. Dallas-Yang, G. Jiang, P. E. McCann, S. A. Qureshi, X. Tong, S. S. Xu, J. Shang, S. H. Vincent, L. M. Tota, M. J. Wright, X. Yang, B. B. Zhang, J. R. Tata, and E. R. Parmee. 2012. Discovery of a novel glucagon receptor antagonist N-[(4-{(1S)-1-[3-(3, 5-dichlorophenyl)-5-(6-methoxynaphthalen-2-yl)-1H-pyrazol-1-yl]ethyl}phenyl)carbo nyl]-beta-alanine (MK-0893) for the treatment of type II diabetes. Journal of medicinal chemistry 55: 6137-6148. 24. Mu, J., S. A. Qureshi, E. J. Brady, E. S. Muise, M. R. Candelore, G. Jiang, Z. Li, M. S. Wu, X. Yang, Q. Dallas-Yang, C. Miller, Y. Xiong, R. B. Langdon, E. R. Parmee, and B. B. Zhang. 2012. Anti-diabetic efficacy and impact on amino acid metabolism of GRA1, a novel small-molecule glucagon receptor antagonist. PloS one 7: e49572. 25. Conner, S. E., and G. Zhu. 2010. Glucagon receptor antagonists, preparation and therapeutic uses. In. Eli Lilly and Company (Indianapolis, IN, US), United States. 26. Engel, S. S., R. Teng, R. J. Edwards, M. J. Davies, K. Kaufman, and B. J. Goldstein. 2011. Efficacy and safety of the glucagon receptor antagonist, MK-0893, in combination with metformin or sitagliptin in patients with type 2 diabetes mellitus. Diabetologia 54 Suppl 1: S86. 27. Edwards, P. A., D. Lemongello, and A. M. Fogelman. 1979. The effect of glucagon, norepinephrine, and dibutyryl cyclic AMP on cholesterol efflux and on the activity of 3-hydroxy-3-methylglutaryl CoA reductase in rat hepatocytes. Journal of lipid research 20: 2-7. 28. Wang, S. P., E. Daniels, Y. Chen, J. Castro-Perez, H. Zhou, K. O. Akinsanya, S. F. Previs, T. P. Roddy, and D. G. Johns. 2013. In vivo effects of anacetrapib on prebeta HDL: improvement in HDL remodeling without effects on cholesterol absorption. Journal of lipid research 54: 2858-2865. 29. Schultz, J. R., H. Tu, A. Luk, J. J. Repa, J. C. Medina, L. Li, S. Schwendner, S. Wang, M. Thoolen, D. J. Mangelsdorf, K. D. Lustig, and B. Shan. 2000. Role of LXRs in control of lipogenesis. Genes Dev 14: 2831-2838. 30. Miettinen, T. A., R. S. Tilvis, and Y. A. Kesaniemi. 1989. Serum cholestanol and plant sterol levels in relation to cholesterol metabolism in middle-aged men. Metabolism 38: 136-140. 31. Lakoski, S. G., F. Xu, G. L. Vega, S. M. Grundy, M. Chandalia, C. Lam, R. S. Lowe, M. E. Stepanavage, T. A. Musliner, J. C. Cohen, and H. H. Hobbs. 2010. Indices of cholesterol metabolism and relative responsiveness to ezetimibe and simvastatin. The Journal of clinical endocrinology and metabolism 95: 800-809. 32. Gelling, R. W., X. Q. Du, D. S. Dichmann, J. Romer, H. Huang, L. Cui, S. Obici, B. Tang, J. J. Holst, C. Fledelius, P. B. Johansen, L. Rossetti, L. A. Jelicks, P. Serup, E. Nishimura, and M. J. Charron. 2003. Lower blood glucose, hyperglucagonemia, and pancreatic alpha cell hyperplasia in glucagon receptor knockout mice. Proceedings of the National Academy of Sciences of the United States of America 100: 1438-1443. 33. Ali, S., B. J. Lamont, M. J. Charron, and D. J. Drucker. 2011. Dual elimination of the glucagon and GLP-1 receptors in mice reveals plasticity in the incretin axis. The Journal of clinical investigation 121: 1917-1929. 34. Drucker, D. J. 2001. Glucagon-like peptide 2. The Journal of clinical endocrinology and metabolism 86: 1759-1764. 35. Grigoryan, M., M. H. Kedees, M. J. Charron, Y. Guz, and G. Teitelman. 2012. Regulation of mouse intestinal L cell progenitors proliferation by the glucagon family of peptides. Endocrinology 153: 3076-3088.
by guest, on July 16, 2018w
ww
.jlr.orgD
ownloaded from
!$MRK@Conf idential
31
36. Hein, G. J., C. Baker, J. Hsieh, S. Farr, and K. Adeli. 2013. GLP-1 and GLP-2 as yin and yang of intestinal lipoprotein production: evidence for predominance of GLP-2-stimulated postprandial lipemia in normal and insulin-resistant states. Diabetes 62: 373-381. 37. Drucker, D. J., P. Erlich, S. L. Asa, and P. L. Brubaker. 1996. Induction of intestinal epithelial proliferation by glucagon-like peptide 2. Proceedings of the National Academy of Sciences of the United States of America 93: 7911-7916. 38. Sudhop, T., M. Reber, D. Tribble, A. Sapre, W. Taggart, P. Gibbons, T. Musliner, K. von Bergmann, and D. Lutjohann. 2009. Changes in cholesterol absorption and cholesterol synthesis caused by ezetimibe and/or simvastatin in men. Journal of lipid research 50: 2117-2123. 39. Caren, R., and L. Carbo. 1956. Pancreatic alpha-cell function in relation to cholesterol metabolism. The Journal of clinical endocrinology and metabolism 16: 507-516. 40. Caren, R., and L. Corbo. 1960. Glucagon and cholesterol metabolism. Metabolism 9: 938-945. 41. Eaton, R. P. 1973. Hypolipemic action of glucagon in experimental endogenous lipemia in the rat. Journal of lipid research 14: 312-318. 42. Bilheimer, D. W., J. L. Goldstein, S. M. Grundy, and M. S. Brown. 1975. Reduction in cholesterol and low density lipoprotein synthesis after portacaval shunt surgery in a patient with homozygous familial hypercholesterolemia. The Journal of clinical investigation 56: 1420-1430. 43. Aubry, F., Y. L. Marcel, and J. Davignon. 1974. Effects of glucagon on plasma lipids in different types of primary hyperlipoproteinemia. Metabolism 23: 225-238. 44. Gu, W., H. Yan, K. A. Winters, R. Komorowski, S. Vonderfecht, L. Atangan, G. Sivits, D. Hill, J. Yang, V. Bi, Y. Shen, S. Hu, T. Boone, R. A. Lindberg, and M. M. Veniant. 2009. Long-term inhibition of the glucagon receptor with a monoclonal antibody in mice causes sustained improvement in glycemic control, with reversible alpha-cell hyperplasia and hyperglucagonemia. The Journal of pharmacology and experimental therapeutics 331: 871-881. 45. Persson, L., C. Galman, B. Angelin, and M. Rudling. 2009. Importance of proprotein convertase subtilisin/kexin type 9 in the hormonal and dietary regulation of rat liver low-density lipoprotein receptors. Endocrinology 150: 1140-1146. 46. Rudling, M., and B. Angelin. 1993. Stimulation of rat hepatic low density lipoprotein receptors by glucagon. Evidence of a novel regulatory mechanism in vivo. The Journal of clinical investigation 91: 2796-2805. 47. Han, S., T. E. Akiyama, S. F. Previs, K. Herath, T. P. Roddy, K. K. Jensen, H. P. Guan, B. A. Murphy, L. A. McNamara, X. Shen, W. Strapps, B. K. Hubbard, S. Pinto, C. Li, and J. Li. 2013. Effects of small interfering RNA-mediated hepatic glucagon receptor inhibition on lipid metabolism in db/db mice. Journal of lipid research 54: 2615-2622. 48. Vuguin, P. M., and M. J. Charron. 2011. Novel insight into glucagon receptor action: lessons from knockout and transgenic mouse models. Diabetes Obes Metab 13 Suppl 1: 144-150. 49. Hsieh, J., C. Longuet, A. Maida, J. Bahrami, E. Xu, C. L. Baker, P. L. Brubaker, D. J. Drucker, and K. Adeli. 2009. Glucagon-like peptide-2 increases intestinal lipid absorption and chylomicron production via CD36. Gastroenterology 137: 997-1005, 1005 e1001-1004. 50. Woollett, L. A., D. D. Buckley, L. Yao, P. J. Jones, N. A. Granholm, E. A. Tolley, P. Tso, and J. E. Heubi. 2004. Cholic acid supplementation enhances cholesterol absorption in humans. Gastroenterology 126: 724-731. 51. Tremblay, A. J., B. Lamarche, V. Lemelin, L. Hoos, S. Benjannet, N. G. Seidah, H. R. Davis, Jr., and P. Couture. 2011. Atorvastatin increases intestinal expression of NPC1L1 in hyperlipidemic men. Journal of lipid research 52: 558-565. 52. Engelking, L. J., M. R. McFarlane, C. K. Li, and G. Liang. 2012. Blockade of cholesterol absorption by ezetimibe reveals a complex homeostatic network in enterocytes. Journal of lipid research 53: 1359-1368. 53. Parker, H. E., K. Wallis, C. W. le Roux, K. Y. Wong, F. Reimann, and F. M. Gribble. 2012. Molecular mechanisms underlying bile acid-stimulated glucagon-like peptide-1 secretion. Br J Pharmacol 165: 414-423. 54. Haeusler, R. A., B. Astiarraga, S. Camastra, D. Accili, and E. Ferrannini. 2013. Human insulin resistance is associated with increased plasma levels of 12alpha-hydroxylated bile acids. Diabetes 62: 4184-4191. 55. Bolen, S., L. Feldman, J. Vassy, L. Wilson, H. C. Yeh, S. Marinopoulos, C. Wiley, E. Selvin, R. Wilson, E. B. Bass, and F. L. Brancati. 2007. Systematic review: comparative effectiveness and safety of oral medications for type 2 diabetes mellitus. Ann Intern Med 147: 386-399. 56. Alrefai, W. A., F. Annaba, Z. Sarwar, A. Dwivedi, S. Saksena, A. Singla, P. K. Dudeja, and R. K. Gill. 2007. Modulation of human Niemann-Pick C1-like 1 gene expression by sterol: Role of sterol regulatory element binding protein 2. Am J Physiol Gastrointest Liver Physiol 292: G369-376.
by guest, on July 16, 2018w
ww
.jlr.orgD
ownloaded from
!$MRK@Conf idential
32
57. Davis, H. R., Jr., L. J. Zhu, L. M. Hoos, G. Tetzloff, M. Maguire, J. Liu, X. Yao, S. P. Iyer, M. H. Lam, E. G. Lund, P. A. Detmers, M. P. Graziano, and S. W. Altmann. 2004. Niemann-Pick C1 Like 1 (NPC1L1) is the intestinal phytosterol and cholesterol transporter and a key modulator of whole-body cholesterol homeostasis. J Biol Chem 279: 33586-33592. 58. Pramfalk, C., Z. Y. Jiang, and P. Parini. 2011. Hepatic Niemann-Pick C1-like 1. Curr Opin Lipidol 22: 225-230. 59. Davis, H. R., Jr., A. M. Tershakovec, J. E. Tomassini, and T. Musliner. 2011. Intestinal sterol transporters and cholesterol absorption inhibition. Curr Opin Lipidol 22: 467-478.
by guest, on July 16, 2018w
ww
.jlr.orgD
ownloaded from
!$MRK@Conf idential
33
FIGURE LEGENDS
Figure 1. GRAs suppress glucagon-induced cAMP production in human primary
hepatocytes. Human primary hepatocytes were thawed and washed with CHAMPS buffer
followed by cAMP production assay. The assay was done in triplicates. EC50 of glucagon on
cAMP production is 575 pM. IC50s of MK-0893, GRA1, and GRA2 are 563 nM, 448 nM and
292 nM, respectively. All compound treatments were performed in presence of 5 nM of
glucagon. Dose titration of MK-0893 alone is shown in the panel of MK-0893. All treatments
were done in duplicates. Dotted curve is a replication of glucagon dose response curve in the
panel of glucagon.
Figure 2. GRA1 increases plasma total cholesterol, LDL-c and HDL-c without effect on
cholesterol synthesis. Male hGCGR mice at 10-12 wks of age were treated with vehicle, GRA1
(30 mpk) and T0901317 (40 mpk) QD for 5 days (n = 8). (A) Glucagon-induced glucose
excursion after single dose on day 1 in mice under ad libitum. (B) Plasma levels of glucose,
cholesterol, PCSK9, and ApoB after 5 days of treatment in mice under ad libitum. (C) Liver
LDLR protein levels determined by western blotting. LDLR is shown as a single band at
molecular weight between 100 and 150 kDa of protein markers. (D) Lipoprotein profile
determined by FPLC on plasma samples obtained from hGCGR mice after 5 days of treatment.
(E) Synthesis of cholesterol, palmitate, and ApoB after 24-h incorporation of D2O prior to
euthanasia of mice followed by processing of plasma samples and measurement of stable
isotope-labeled cholesterol by LC/MS. All data are shown as the means ± SEM. Statistical
significance is calculated by unpaired two-tailed Student's t test. Asterisks denote statistical
significance of the compounds treatment groups compared to the vehicle group. *P ≤ 0.05, **P
≤ 0.01, ***P ≤ 0.001.
Figure 3. GRA1 increases plasma total cholesterol and cholesterol absorption in hGCGR
mice. (A) Experimental design for the effect of GRAs treatment on cholesterol excretion,
absorption, and synthesis: Male hGCGR mice at 10-12 wks of age were treated with vehicle,
GRA1 (30 mpk) QD for 9 days (n = 8). For cholesterol excretion measurement, feces were
collected for 1 day pre and for 1 day (day 3 to 4) following GRA1 treatment. Stable isotope-
by guest, on July 16, 2018w
ww
.jlr.orgD
ownloaded from
!$MRK@Conf idential
34
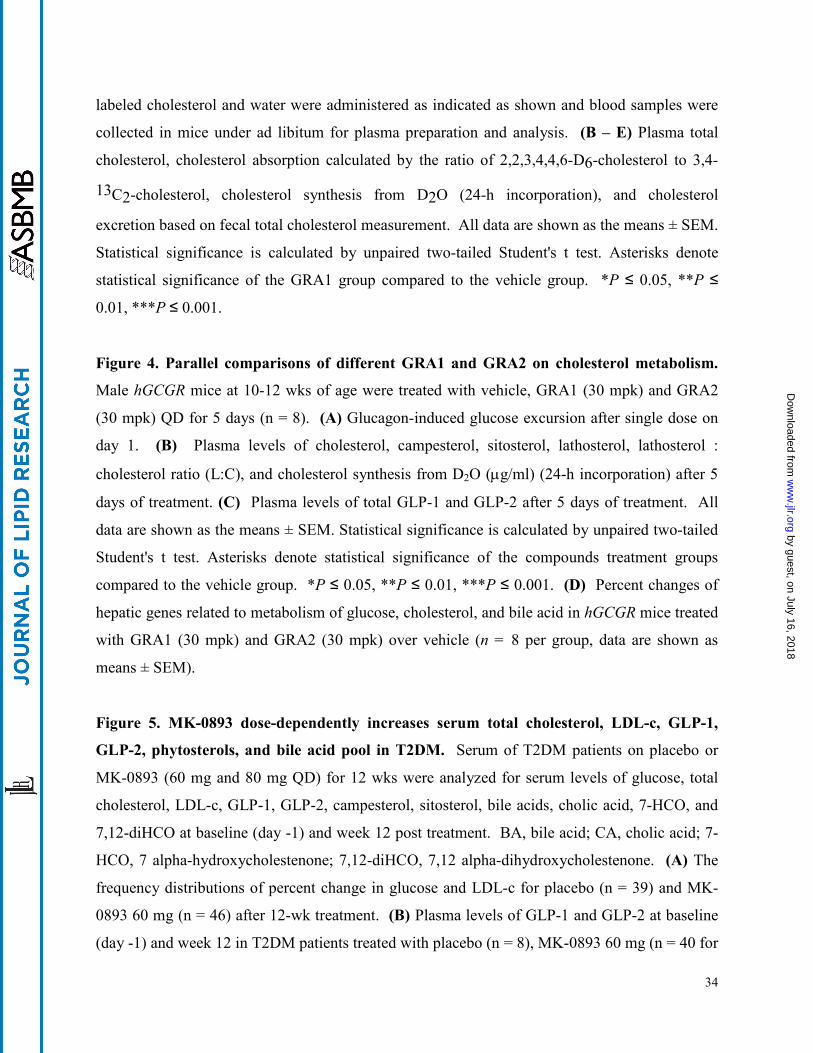
labeled cholesterol and water were administered as indicated as shown and blood samples were
collected in mice under ad libitum for plasma preparation and analysis. (B – E) Plasma total
cholesterol, cholesterol absorption calculated by the ratio of 2,2,3,4,4,6-D6-cholesterol to 3,4-
13C2-cholesterol, cholesterol synthesis from D2O (24-h incorporation), and cholesterol
excretion based on fecal total cholesterol measurement. All data are shown as the means ± SEM.
Statistical significance is calculated by unpaired two-tailed Student's t test. Asterisks denote
statistical significance of the GRA1 group compared to the vehicle group. *P ≤ 0.05, **P ≤
0.01, ***P ≤ 0.001.
Figure 4. Parallel comparisons of different GRA1 and GRA2 on cholesterol metabolism.
Male hGCGR mice at 10-12 wks of age were treated with vehicle, GRA1 (30 mpk) and GRA2
(30 mpk) QD for 5 days (n = 8). (A) Glucagon-induced glucose excursion after single dose on
day 1. (B) Plasma levels of cholesterol, campesterol, sitosterol, lathosterol, lathosterol :
cholesterol ratio (L:C), and cholesterol synthesis from D2O (µg/ml) (24-h incorporation) after 5
days of treatment. (C) Plasma levels of total GLP-1 and GLP-2 after 5 days of treatment. All
data are shown as the means ± SEM. Statistical significance is calculated by unpaired two-tailed
Student's t test. Asterisks denote statistical significance of the compounds treatment groups
compared to the vehicle group. *P ≤ 0.05, **P ≤ 0.01, ***P ≤ 0.001. (D) Percent changes of
hepatic genes related to metabolism of glucose, cholesterol, and bile acid in hGCGR mice treated
with GRA1 (30 mpk) and GRA2 (30 mpk) over vehicle (n = 8 per group, data are shown as
means ± SEM).
Figure 5. MK-0893 dose-dependently increases serum total cholesterol, LDL-c, GLP-1,
GLP-2, phytosterols, and bile acid pool in T2DM. Serum of T2DM patients on placebo or
MK-0893 (60 mg and 80 mg QD) for 12 wks were analyzed for serum levels of glucose, total
cholesterol, LDL-c, GLP-1, GLP-2, campesterol, sitosterol, bile acids, cholic acid, 7-HCO, and
7,12-diHCO at baseline (day -1) and week 12 post treatment. BA, bile acid; CA, cholic acid; 7-
HCO, 7 alpha-hydroxycholestenone; 7,12-diHCO, 7,12 alpha-dihydroxycholestenone. (A) The
frequency distributions of percent change in glucose and LDL-c for placebo (n = 39) and MK-
0893 60 mg (n = 46) after 12-wk treatment. (B) Plasma levels of GLP-1 and GLP-2 at baseline
(day -1) and week 12 in T2DM patients treated with placebo (n = 8), MK-0893 60 mg (n = 40 for
by guest, on July 16, 2018w
ww
.jlr.orgD
ownloaded from
!$MRK@Conf idential
35
GLP-1, n = 46 for GLP-2), and MK-0893 80 mg (n = 16). (C) Averaged percent changes of
plasma GLP-1 and GLP-2 on week 12 from baseline (day -1) in B. (D – E) Percent change of
plasma total cholesterol, LDL-c, campesterol, sitosterol, bile acids, cholic acid, 7-HCO, and
7,12-diHCO on week 12 from baseline (day -1) in T2DM patients treated with placebo (n = 8),
MK-0893 60 mg (n = 46), and MK-0893 80 mg (n = 16). The data in B - E are shown as the
means ± SEM. Statistical significance is calculated by nonparametric two-tailed Mann-Whitney
test. Asterisks denote statistical significance of the MK-0893 group compared to the placebo
group. *P ≤ 0.05, **P ≤ 0.01, ***P ≤ 0.001.
Figure 6. Induction of GRAs on cholesterol is abolished by combined treatment with
ezetimibe. Male hGCGR mice at 10-12 wks of age were treated with vehicle, GRA1 (30 mpk),
MK-0893 (30 mpk), GRA2 (30 mpk) with or without ezetimibe (10 mpk) for 9 days (n = 8). (A)
Glucagon-induced glucose excursion after single dose on day 1. (B) Plasma levels of total
cholesterol. (C) Cholesterol absorption calculated by the ratio of 2,2,3,4,4,6-D6-cholesterol to
3,4-13C2-cholesterol in plasma. N.D., non-detectable. (D) Cholesterol excretion determined by
the percent change in fecal total cholesterol on day 4 versus day 0. E: Plasma levels of glucose,
total cholesterol, campesterol, and sitosterol after 9-day treatment. All data are shown as the
means ± SEM. Statistical significance is calculated by unpaired two-tailed Student's t test.
Asterisks denote statistical significance of the compounds treatment groups compared to the
vehicle group. *P ≤ 0.05, **P ≤ 0.01, ***P ≤ 0.001.
by guest, on July 16, 2018w
ww
.jlr.orgD
ownloaded from
Log[Compound]M
cAM
P (n
M)
-12 -10 -8 -6 -40
5
10
15
20
cAMP (nM
)
0
5
10
15
20
Glucagon MK-0893
-10 -8 -6 -4
MK-0893
GRA1
-10 -8 -6 -4
GRA2
-10 -8 -6 -4
NHN
O
N
OH
OF3C
OMe
F
O
CF3
O
NH
OH
O
NHN
O
N
OH
OCl
OMe
Cl
Enantiomer 1
NH2-His-Ser-Gln-Gly-Thr-Phe-Thr-Ser-Asp-Tyr-
Ser-Lys-Tyr-Leu-Asp-Ser-Arg-Arg-Ala-Gln-Asp-
Phe-Val-Gln-Trp-Leu-Met-Asn-Thr-COOH
Figure 1.
by guest, on July 16, 2018w
ww
.jlr.orgD
ownloaded from
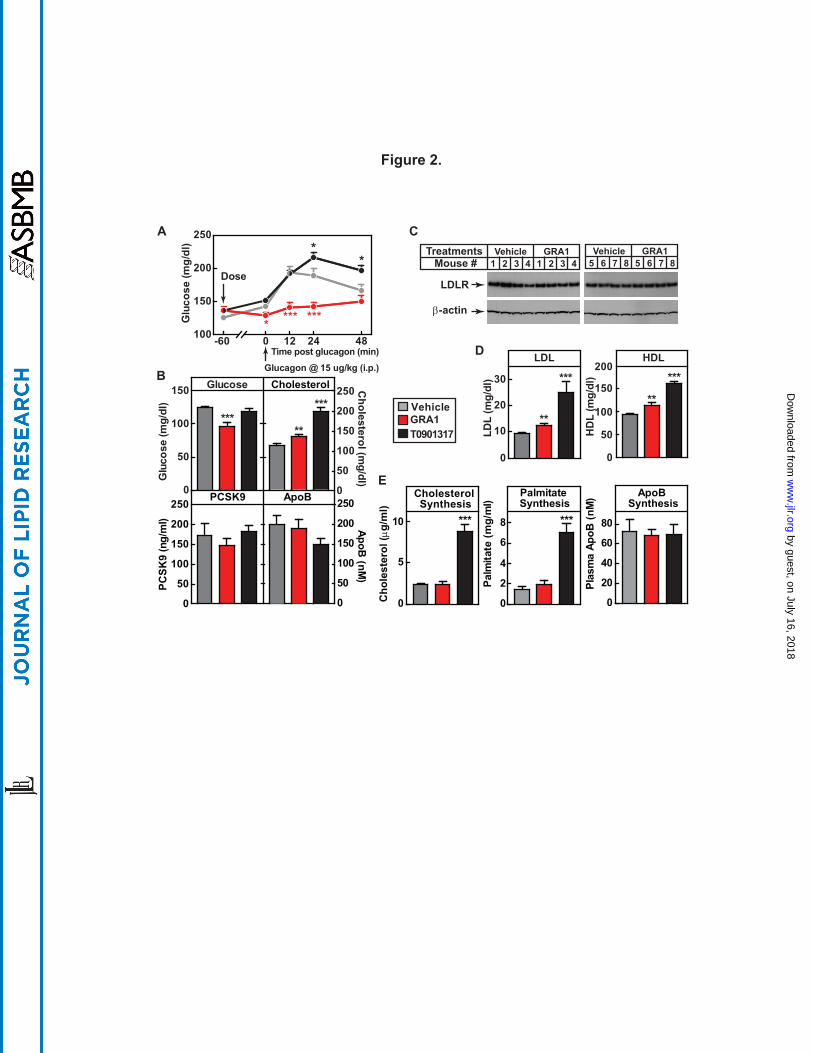
Figure 2.
Glucose
0
50
100
150
***
Glu
cose
(mg/
dl)
0
50
100
150
200
250
**
***
Cholesterol (m
g/dl)
LDL
0
10
20
30
**
***
LDL
(mg/
dl)
HDL
0
50
100
150
200
**
***
HD
L (m
g/dl
)
VehicleTreatmentsMouse #
GRA11 2 3 4 1 2 3 4
Vehicle GRA15 6 7 8 5 6 7 8
LDLR
β-actin
Cholesterol Synthesis
0
5
10 ***
PCSK9
0
50
100
150
200
250
PCSK
9 (n
g/m
l)
ApoB
Cholesterol
0
50
100
150
200
250
ApoB (nM
)
ApoB Synthesis
0
20
40
60
80
Plas
ma
ApoB
(nM
)Palmitate Synthesis
0
2
4
6
8 ***
Palm
itate
(mg/
ml)
B
E
VehicleGRA1T0901317
100
150
200
250
*** ***
*
Glucagon @ 15 ug/kg (i.p.)
*
*
Time post glucagon (min)
Dose
Glu
cose
(mg/
dl)
-60 0 12 24 48
A C
D
Cho
lest
erol
(µg/
ml)
by guest, on July 16, 2018w
ww
.jlr.orgD
ownloaded from
Feces Collection Feces Collection
Cholesterol AbsorptionD6-cholesterol (15 mpk, p.o.)13C-cholesterol (15 mpk, i.v.)
Days 0
24 hr 48 hr0 hr 72 hr 96 hr
31 2 4 85 6 7
Cholesterol ExcretionFecal cholesterol prior vs. post
Cholesterol SynthesisD2O (20 ml/kg, i.p.)
Vehicle GRA1 Vehicle GRA1Vehicle GRA10
100
200
300 *
TC (m
g/dl
)
0
2
4
6
0
10
20
30
40
50***
Ora
l : IV
Tra
cer R
atio
A
B C D E
Figure 3.
Vehicle GRA10
100
200
300
400
500Pre-dosePost-dose
Feca
l cho
lest
erol
(µg/
day)
Cho
lest
erol
(µg/
ml)
by guest, on July 16, 2018w
ww
.jlr.orgD
ownloaded from
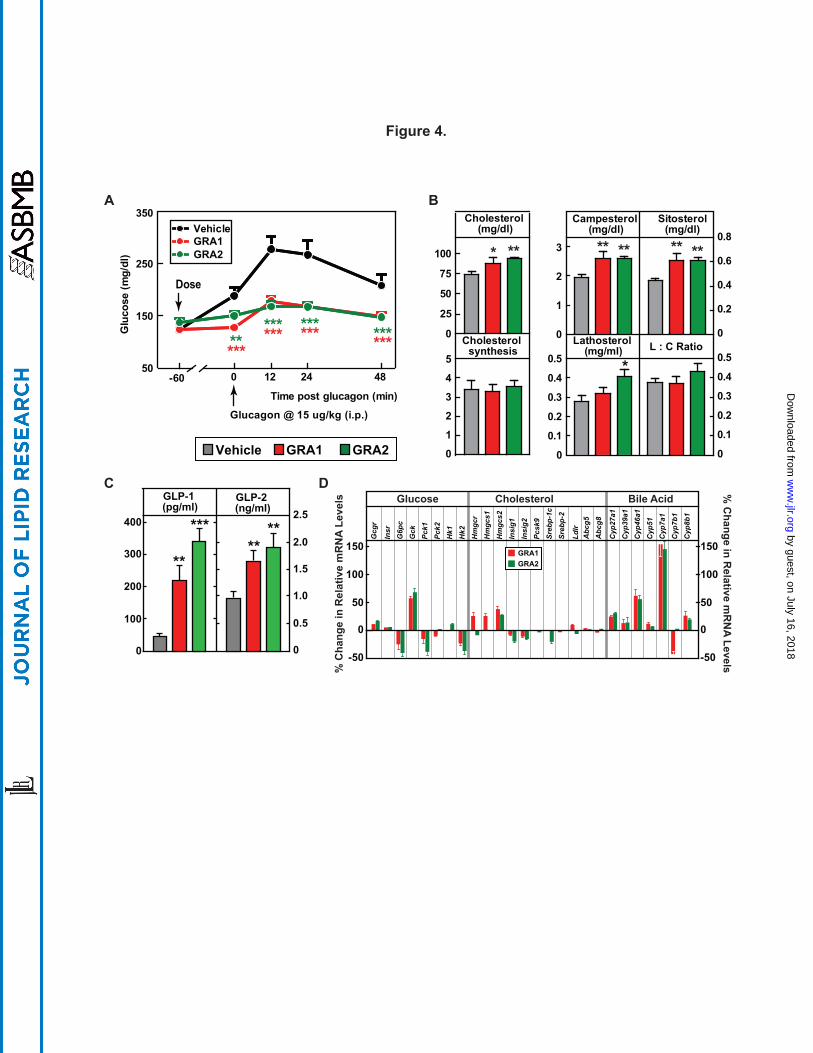
Gcg
r
Insr
G6p
cG
ckPc
k1Pc
k2H
k1H
k2H
mgc
rH
mgc
s1H
mgc
s2In
sig1
Insi
g2Pc
sk9
Sreb
p-1c
Sreb
p-2
Ldlr
Cyp
27a1
Cyp
39a1
Cyp
46a1
Cyp
51C
yp7a
1C
yp7b
1C
yp8b
1
150
100
50
0
-50
150
100
50
0
-50
% C
hang
e in
Rel
ativ
e m
RN
A Le
vels
% C
hange in Relative m
RN
A Levels
GRA1GRA2
GRA1Vehicle GRA2
Glucose Cholesterol Bile AcidDC
A B
Figure 4.
0
50
25
75
100 * **
Cholesterol (mg/dl)
0
0.1
0.2
0.3
0.4
0.5 *
Lathosterol (mg/ml)
0
0.1
0.2
0.3
0.4
0.5L : C Ratio
0
1
2
3
4
5
Cholesterol synthesis
0
1
2
3 ** **
Campesterol (mg/dl)
0
0.2
0.4
0.6
0.8** **
Sitosterol(mg/dl)
50
150
250
350VehicleGRA1
Glucagon @ 15 ug/kg (i.p.)
Time post glucagon (min)
Dose
GRA2
********
***************G
luco
se (m
g/dl
)
-60 0 12 24 48
Abc
g8A
bcg5
****
GLP-2 (ng/ml)
**
***
GLP-1 (pg/ml)
0
0.5
1.0
1.5
2.0
2.5
0
100
200
300
400
by guest, on July 16, 2018w
ww
.jlr.orgD
ownloaded from
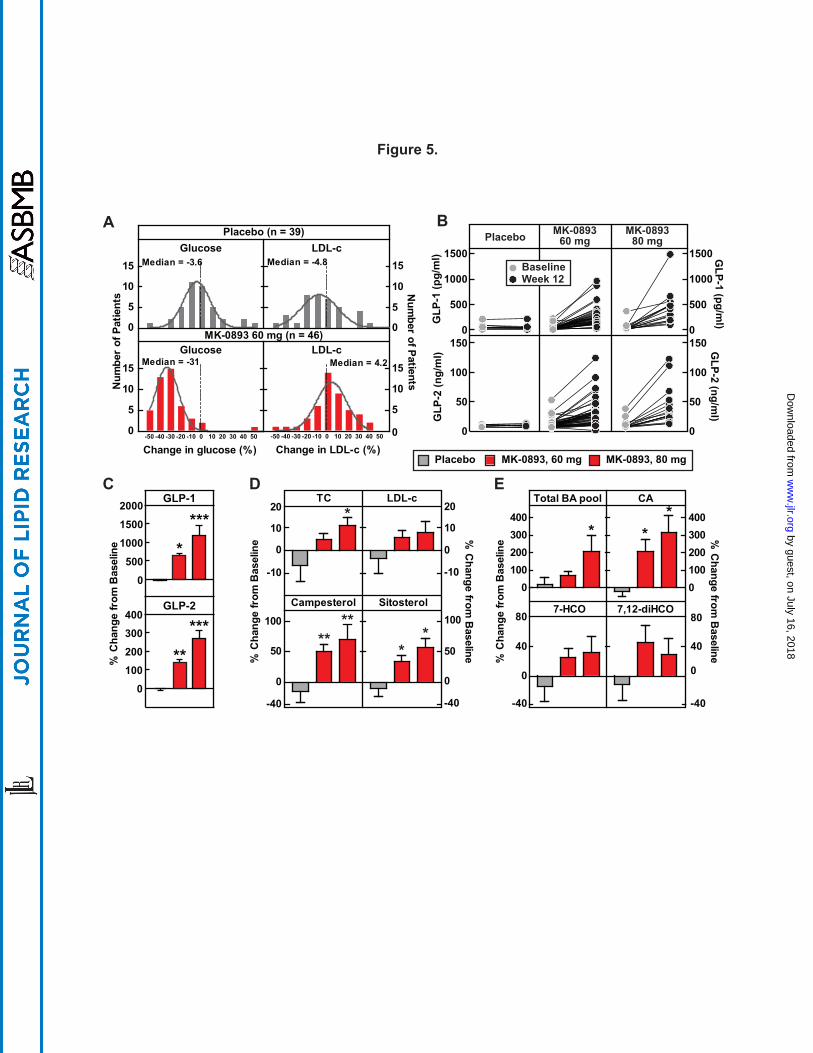
TC
-10
0
10
20LDL-c
-10
0
10
20
Campesterol
Placebo MK-0893, 60 mg MK-0893, 80 mg
-40
0
50
100
Sitosterol
-40
0
50
100
****
*
**
DC E
A B
0
5
10
15Median = -4.8
0
5
10
15 Median = -3.6
-50 -40 -30 -20 -10 0 10 20 30 40 50 0
5
10
15Median = 4.2
Change in LDL-c (%)
Num
ber of Patients
MK-0893 60 mg (n = 46)
Placebo (n = 39)
GLP-1
GLP-2
Glucose LDL-c
Glucose LDL-c
-50 -40 -30 -20 -10 0 10 20 30 40 500
5
10
15 Median = -31
Change in glucose (%)
Num
ber
of P
atie
nts
Figure 5.
CA
0100200300400
0100200300400
**
% C
hang
e fr
om B
asel
ine
% C
hang
e fr
om B
asel
ine
% C
hange from B
aseline% C
hang
e fr
om B
asel
ine %
Change from
Baseline
7-HCO
-40
0
40
807,12-diHCO
-40
0
40
80
Total BA pool
*
0
500
1000
1500
2000
****
0100200300400
**
***
0
500
1000
1500
0
50
100
1500
500
1000
1500
0
50
100
150
GLP
-1 (p
g/m
l)G
LP-2
(ng/
ml)
GLP-1 (pg/m
l)G
LP-2 (ng/ml)
Baseline
Placebo MK-089360 mg
MK-089380 mg
Week 12
by guest, on July 16, 2018w
ww
.jlr.orgD
ownloaded from
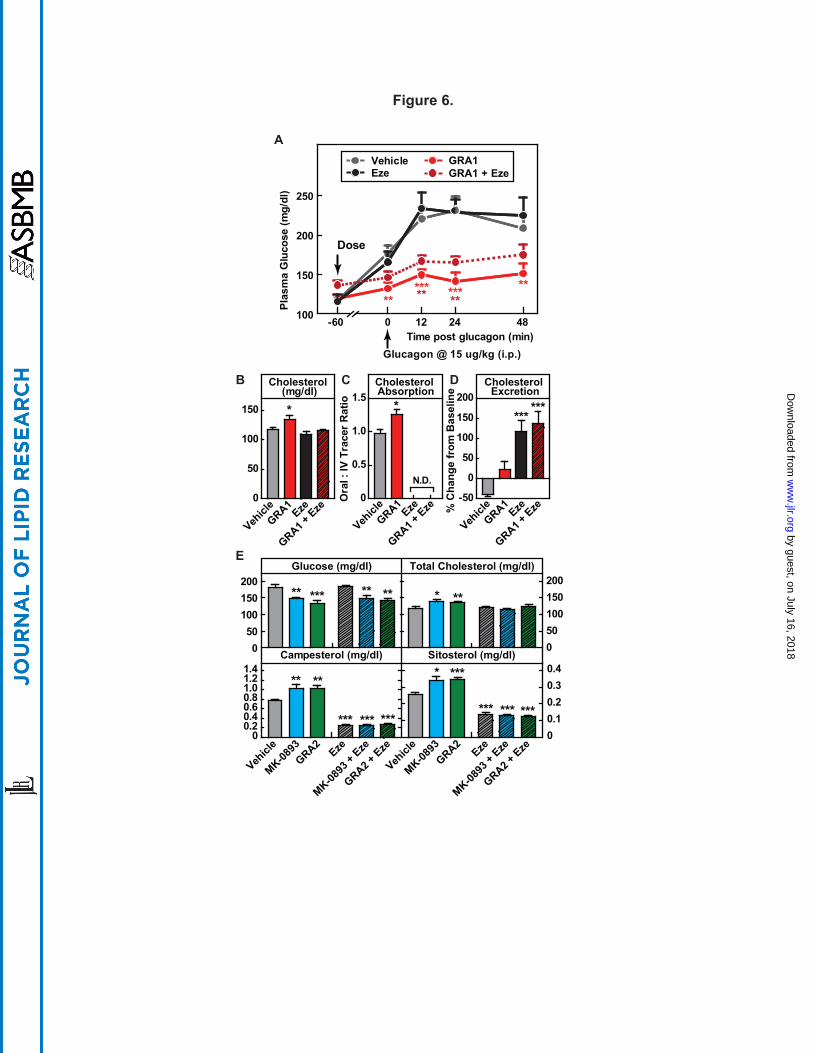
100
150
200
250
Vehicle GRA1Eze
Glucagon @ 15 ug/kg (i.p.)Time post glucagon (min)
Dose
GRA1 + Eze
*****-60 0 12 24 48
*******
**Plas
ma
Glu
cose
(mg/
dl)
A
Figure 6.
Vehicl
eGRA1
Eze
GRA1 + Eze
Vehicl
eGRA1
Eze
GRA1 + Eze
Vehicl
eGRA1
Eze
GRA1 + Eze
0
50
100
150 *
Cholesterol (mg/dl)
Cholesterol Absorption
Cholesterol Excretion
0
0.5
1.0
1.5
N.D.
Ora
l : IV
Tra
cer R
atio *
% C
hang
e fr
om B
asel
ine
-50
0
50
100
150
200
******
D
E
B C
Glucose (mg/dl)
050
100150200
** *** ** **
Total Cholesterol (mg/dl)
050100150200
* **
Sitosterol (mg/dl)
Vehicl
e
MK-0893
GRA2Eze
MK-0893
+ Eze
GRA2 + Eze
Vehicl
e
MK-0893
GRA2Eze
MK-0893
+ Eze
GRA2 + Eze
00.10.20.30.4* ***
*** *** ***
Campesterol (mg/dl)
00.20.40.60.81.01.21.4
** **
*** *** ***
by guest, on July 16, 2018w
ww
.jlr.orgD
ownloaded from