Embed Size (px)
Citation preview
© Institute of Geological and Nuclear Sciences Limited, 2015 www.gns.cri.nz
ISSN 1177-2425 (Print) ISSN 2350-3424 (Online) ISBN 978-1-927278-97-0 (Print) ISBN 978-0-478-19936-9 (Online)
E. Mroczek, M. Climo and D. Evans GNS Science, Wairakei Research Centre, Private Bag 2000, Taupo 3352, New Zealand
BIBLIOGRAPHIC REFERENCE
Mroczek, E.; Climo, M.; Evans, D. 2015. The composition of high temperature geothermal fluids in New Zealand producing geothermal fields. GNS Science Report 2014/68. 25 p.
GNS Science Report 2014/68 i
CONTENTS
EXECUTIVE SUMMARY ........................................................................................................ II
KEYWORDS .......................................................................................................................... II
1.0 INTRODUCTION ........................................................................................................ 1
2.0 PROJECT SCOPE ..................................................................................................... 1
3.0 METHODOLOGY ....................................................................................................... 3
4.0 NEW ZEALAND’S GEOTHERMAL FLUID COMPOSITIONS .................................... 5
4.1 Major and Minor Elements ............................................................................................ 5 4.2 Bicarbonate ................................................................................................................. 12 4.3 Trace Elements ........................................................................................................... 13
5.0 SUMMARY ............................................................................................................... 15
6.0 ACKNOWLEDGEMENTS ......................................................................................... 15
7.0 REFERENCES ......................................................................................................... 16
8.0 GENERAL BIBLIOGRAPHY .................................................................................... 18
FIGURES Figure 2.1: Geothermal areas in the Taupo Volcanic Zone and Ngawha ....................................................... 2 Figure 4.1: Relative concentration (mg/kg) of chemical species in the geothermal systems studied,
corrected to TD. ............................................................................................................................ 7 Figure 4.2: The figure presents the geothermal field having the greatest annual flux of the major
species (Cl, Na, SiO2 and K). ....................................................................................................... 9 Figure 4.3: The figure presents the geothermal field having the greatest annual flux of major species
(B, SO4, Ca, Li). .......................................................................................................................... 10 Figure 4.4: The figure presents the geothermal field having the greatest annual flux of minor
elements (Rb, Cs, Mg)................................................................................................................ 11 Figure 4.5: Visual representation of bicarbonate concentration (left) and annual flux (right) in
selected geothermal fields. ......................................................................................................... 12
TABLES Table 3.1: Elements and anions, included in this study and their chemical symbol/formula.......................... 3 Table 4.1: Representative fluid composition of selected TVZ and Ngawha geothermal wells; values
in mg/kg. ....................................................................................................................................... 6 Table 4.2: Total annual flux of the major elements for producing geothermal fields in New Zealand. ........... 8 Table 4.3: Range of silver, copper and gold concentrations; values in μg/kg. ............................................. 13 Table 4.4: Elements detected in Kawerau production well samples. ........................................................... 14
APPENDICES
APPENDIX 1: STATISTICAL SUMMARY ............................................................................ 20
APPENDIX TABLES Table A1.1 Statistical summary of representative fluid composition of selected TVZ and Ngawha
geothermal wells given in Table 4.1; values in mg/kg. ............................................................... 20
GNS Science Report 2014/68 ii
EXECUTIVE SUMMARY
This literature review updates and summarises the chemical composition of geothermal waters from wells in the Taupo Volcanic Zone and Ngawha, with the aim of characterising the “typical” reservoir water composition for the developed, high-temperature geothermal systems. The reservoir liquid composition is also calculated to atmospheric pressure which is the maximum amount of steam separation.
Most information was available on the major chemical components: Na, K, Ca, Cl, B, SiO2, SO4 and HCO3, but also minor components of Li, Rb, Cs and Mg. This study also presents limited information on trace elements and precious metals, in particular Au, Ag and Cu but data for these species is limited in the surface discharges.
The representative concentration of each species is provided for nine high temperature geothermal fields; namely Ohaaki, Kawerau, Mokai, Ngatamariki, Ngawha, Rotokawa, Rotorua, Tauhara, Wairakei and Ngawha. The estimated annual flux of each species is given based on the representative concentration multiplied by the consented fluid take for the producing geothermal fields.
This compositional and flux data provides input data for determining the economics of mineral extraction from New Zealand’s geothermal fields.
KEYWORDS
Geothermal fluids, chemical composition, New Zealand, mineral extraction.
GNS Science Report 2014/68 1
1.0 INTRODUCTION
This review compiles and presents a comparative analysis of publically available data on chemical species in geothermal waters from wells in the Taupo Volcanic Zone (TVZ) and Ngawha. The purpose is to broadly represent the typical reservoir water composition at various locations around the TVZ.
This compilation is a component of a broader inquiry into the commercial potential in New Zealand for the extraction of dissolved minerals and metals (for example silica, lithium, silver and gold) from geothermal fluids under the Ministry of Business, Innovation and Employment “From Waste to Wealth” research programme (CO5X1307).
In addition to the references cited in the text an additional bibliography gives references of general interest on this subject.
2.0 PROJECT SCOPE
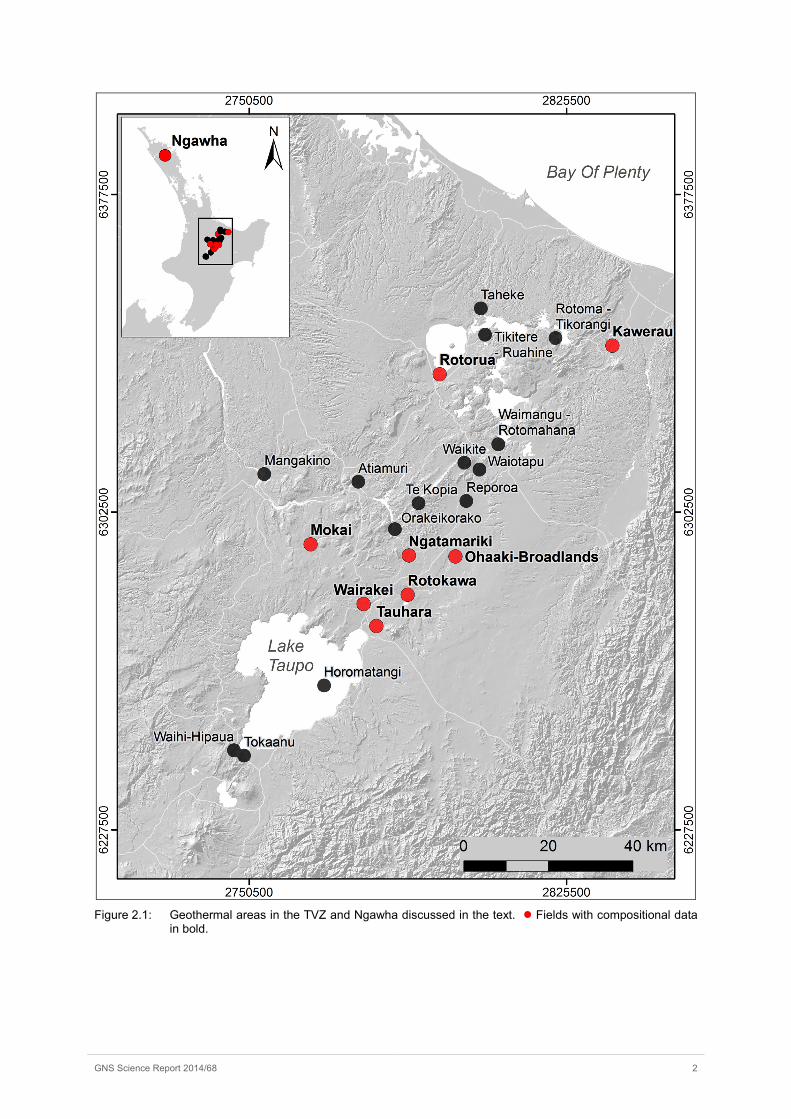
The focus of this review was on well water compositions of nine high temperature geothermal fields, namely Ohaaki, Kawerau, Mokai, Ngatamariki, Ngawha, Rotokawa, Rotorua, Tauhara, Wairakei (Figure 2.1, Ngawha in the insert). Excluded are spring compositions and data from surface sinter rocks and power station scales. The exclusions are on the basis that these are unlikely to be sources of species or minerals for commercial harvesting.
Other high temperature geothermal fields are either protected from development (Waikato Regional Council (WRC), 2007; Bay of Plenty Regional Council, 2008) or insufficient well data is available to infer with confidence the chemical composition of their deeper geothermal reservoir fluids. For example Waimangu, Waiotapu and Orakei Korako fall into the first category while Tokaanu, Atiamuri and Horohoro fall into the second category.
GNS Science Report 2014/68 2
Figure 2.1: Geothermal areas in the TVZ and Ngawha discussed in the text. Fields with compositional data
in bold.
GNS Science Report 2014/68 3
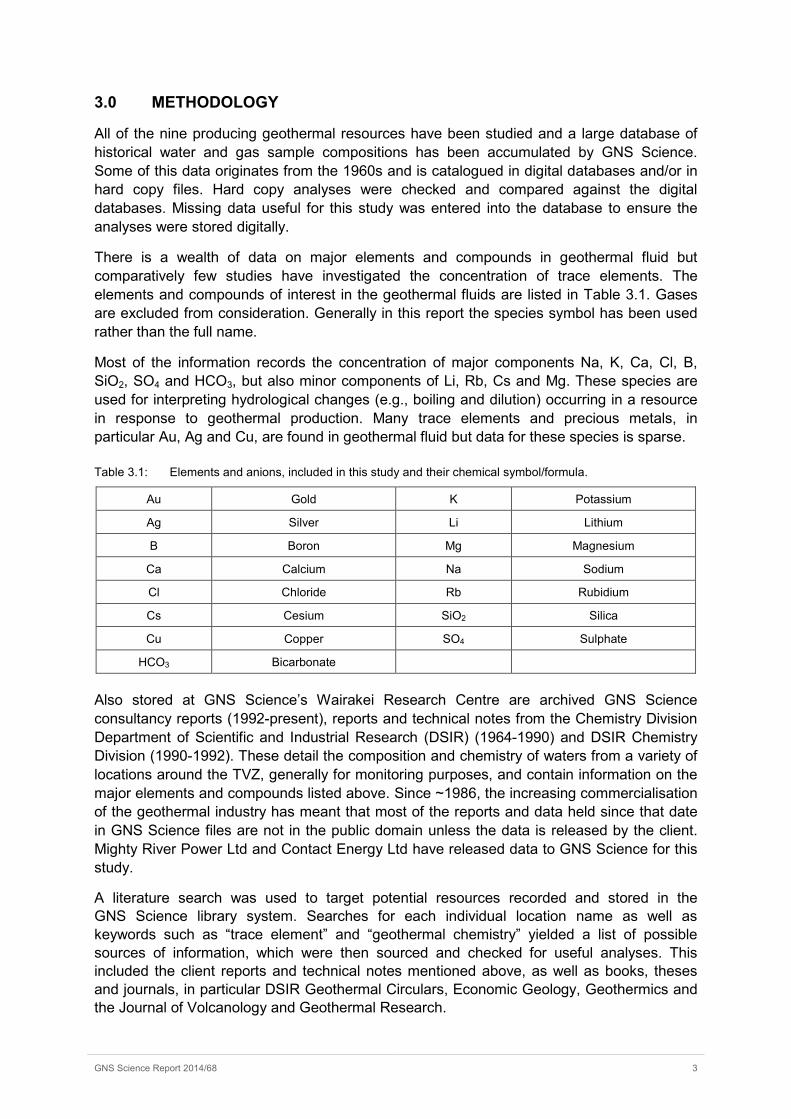
3.0 METHODOLOGY
All of the nine producing geothermal resources have been studied and a large database of historical water and gas sample compositions has been accumulated by GNS Science. Some of this data originates from the 1960s and is catalogued in digital databases and/or in hard copy files. Hard copy analyses were checked and compared against the digital databases. Missing data useful for this study was entered into the database to ensure the analyses were stored digitally.
There is a wealth of data on major elements and compounds in geothermal fluid but comparatively few studies have investigated the concentration of trace elements. The elements and compounds of interest in the geothermal fluids are listed in Table 3.1. Gases are excluded from consideration. Generally in this report the species symbol has been used rather than the full name.
Most of the information records the concentration of major components Na, K, Ca, Cl, B, SiO2, SO4 and HCO3, but also minor components of Li, Rb, Cs and Mg. These species are used for interpreting hydrological changes (e.g., boiling and dilution) occurring in a resource in response to geothermal production. Many trace elements and precious metals, in particular Au, Ag and Cu, are found in geothermal fluid but data for these species is sparse.
Table 3.1: Elements and anions, included in this study and their chemical symbol/formula.
Au Gold K Potassium
Ag Silver Li Lithium
B Boron Mg Magnesium
Ca Calcium Na Sodium
Cl Chloride Rb Rubidium
Cs Cesium SiO2 Silica
Cu Copper SO4 Sulphate
HCO3 Bicarbonate
Also stored at GNS Science’s Wairakei Research Centre are archived GNS Science consultancy reports (1992-present), reports and technical notes from the Chemistry Division Department of Scientific and Industrial Research (DSIR) (1964-1990) and DSIR Chemistry Division (1990-1992). These detail the composition and chemistry of waters from a variety of locations around the TVZ, generally for monitoring purposes, and contain information on the major elements and compounds listed above. Since ~1986, the increasing commercialisation of the geothermal industry has meant that most of the reports and data held since that date in GNS Science files are not in the public domain unless the data is released by the client. Mighty River Power Ltd and Contact Energy Ltd have released data to GNS Science for this study.
A literature search was used to target potential resources recorded and stored in the GNS Science library system. Searches for each individual location name as well as keywords such as “trace element” and “geothermal chemistry” yielded a list of possible sources of information, which were then sourced and checked for useful analyses. This included the client reports and technical notes mentioned above, as well as books, theses and journals, in particular DSIR Geothermal Circulars, Economic Geology, Geothermics and the Journal of Volcanology and Geothermal Research.
GNS Science Report 2014/68 4
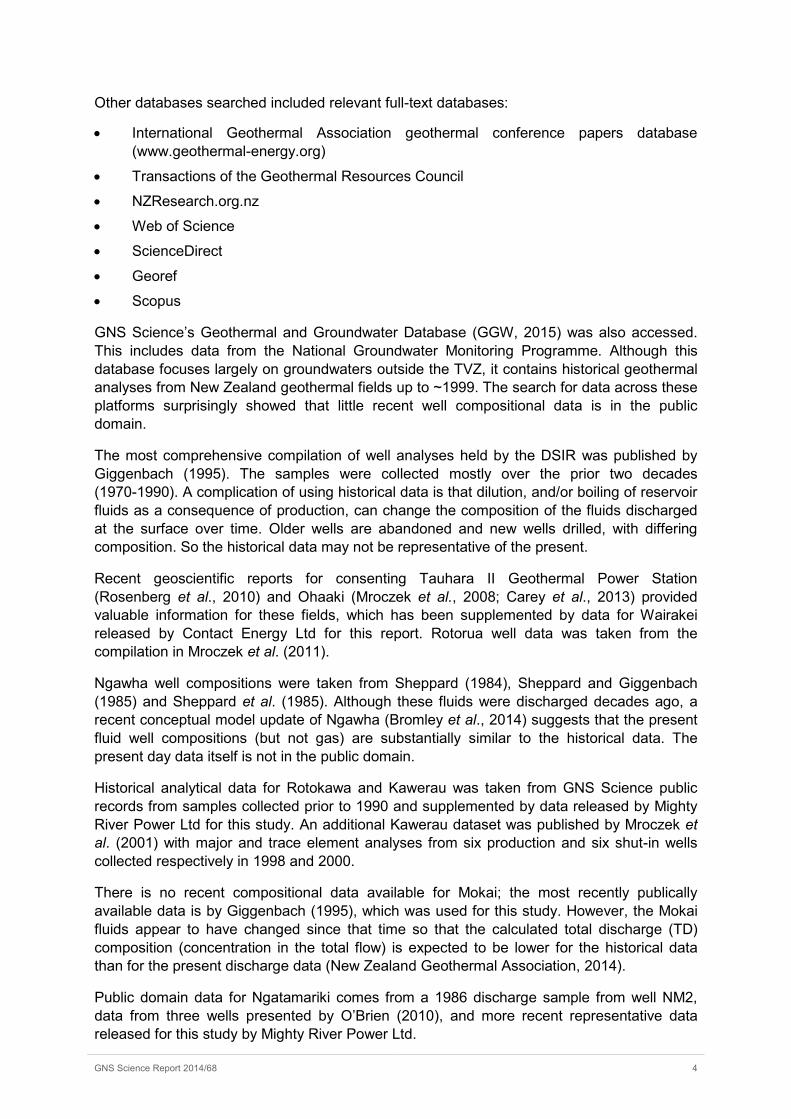
Other databases searched included relevant full-text databases:
• International Geothermal Association geothermal conference papers database (www.geothermal-energy.org)
• Transactions of the Geothermal Resources Council
• NZResearch.org.nz
• Web of Science
• ScienceDirect
• Georef
• Scopus
GNS Science’s Geothermal and Groundwater Database (GGW, 2015) was also accessed. This includes data from the National Groundwater Monitoring Programme. Although this database focuses largely on groundwaters outside the TVZ, it contains historical geothermal analyses from New Zealand geothermal fields up to ~1999. The search for data across these platforms surprisingly showed that little recent well compositional data is in the public domain.
The most comprehensive compilation of well analyses held by the DSIR was published by Giggenbach (1995). The samples were collected mostly over the prior two decades (1970-1990). A complication of using historical data is that dilution, and/or boiling of reservoir fluids as a consequence of production, can change the composition of the fluids discharged at the surface over time. Older wells are abandoned and new wells drilled, with differing composition. So the historical data may not be representative of the present.
Recent geoscientific reports for consenting Tauhara II Geothermal Power Station (Rosenberg et al., 2010) and Ohaaki (Mroczek et al., 2008; Carey et al., 2013) provided valuable information for these fields, which has been supplemented by data for Wairakei released by Contact Energy Ltd for this report. Rotorua well data was taken from the compilation in Mroczek et al. (2011).
Ngawha well compositions were taken from Sheppard (1984), Sheppard and Giggenbach (1985) and Sheppard et al. (1985). Although these fluids were discharged decades ago, a recent conceptual model update of Ngawha (Bromley et al., 2014) suggests that the present fluid well compositions (but not gas) are substantially similar to the historical data. The present day data itself is not in the public domain.
Historical analytical data for Rotokawa and Kawerau was taken from GNS Science public records from samples collected prior to 1990 and supplemented by data released by Mighty River Power Ltd for this study. An additional Kawerau dataset was published by Mroczek et al. (2001) with major and trace element analyses from six production and six shut-in wells collected respectively in 1998 and 2000.
There is no recent compositional data available for Mokai; the most recently publically available data is by Giggenbach (1995), which was used for this study. However, the Mokai fluids appear to have changed since that time so that the calculated total discharge (TD) composition (concentration in the total flow) is expected to be lower for the historical data than for the present discharge data (New Zealand Geothermal Association, 2014).
Public domain data for Ngatamariki comes from a 1986 discharge sample from well NM2, data from three wells presented by O’Brien (2010), and more recent representative data released for this study by Mighty River Power Ltd.
GNS Science Report 2014/68 5
4.0 NEW ZEALAND’S GEOTHERMAL FLUID COMPOSITIONS
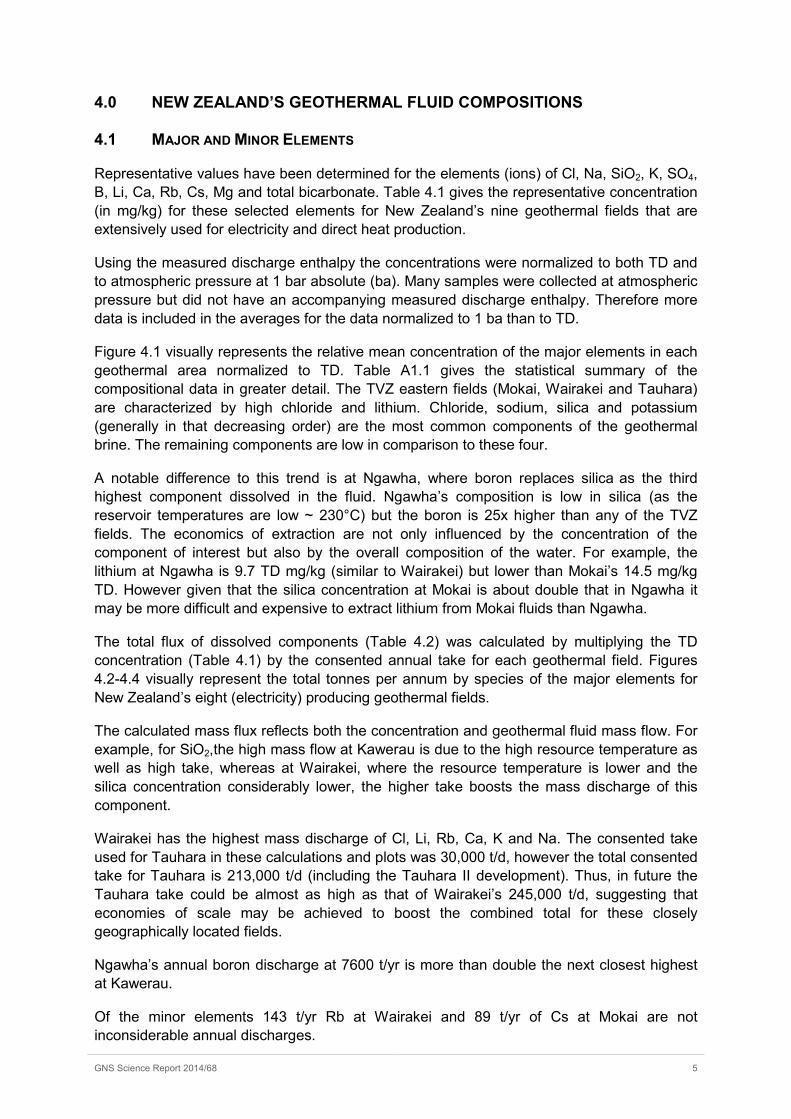
4.1 MAJOR AND MINOR ELEMENTS
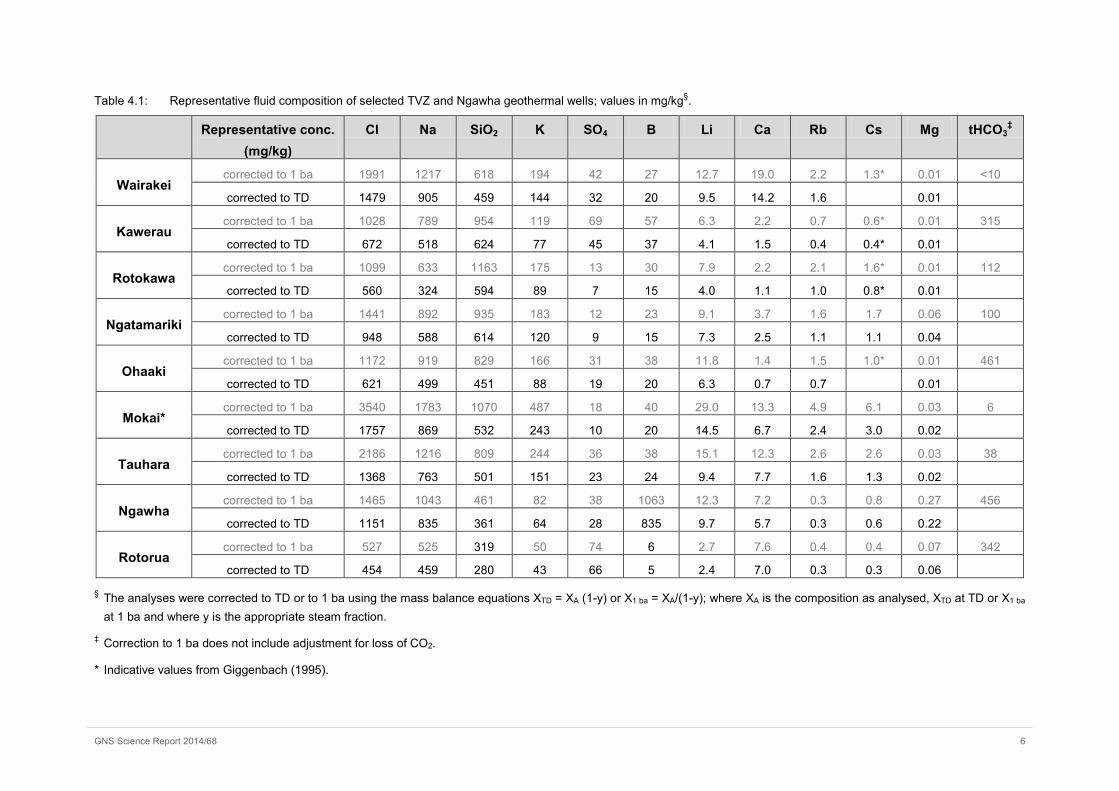
Representative values have been determined for the elements (ions) of Cl, Na, SiO2, K, SO4, B, Li, Ca, Rb, Cs, Mg and total bicarbonate. Table 4.1 gives the representative concentration (in mg/kg) for these selected elements for New Zealand’s nine geothermal fields that are extensively used for electricity and direct heat production.
Using the measured discharge enthalpy the concentrations were normalized to both TD and to atmospheric pressure at 1 bar absolute (ba). Many samples were collected at atmospheric pressure but did not have an accompanying measured discharge enthalpy. Therefore more data is included in the averages for the data normalized to 1 ba than to TD.
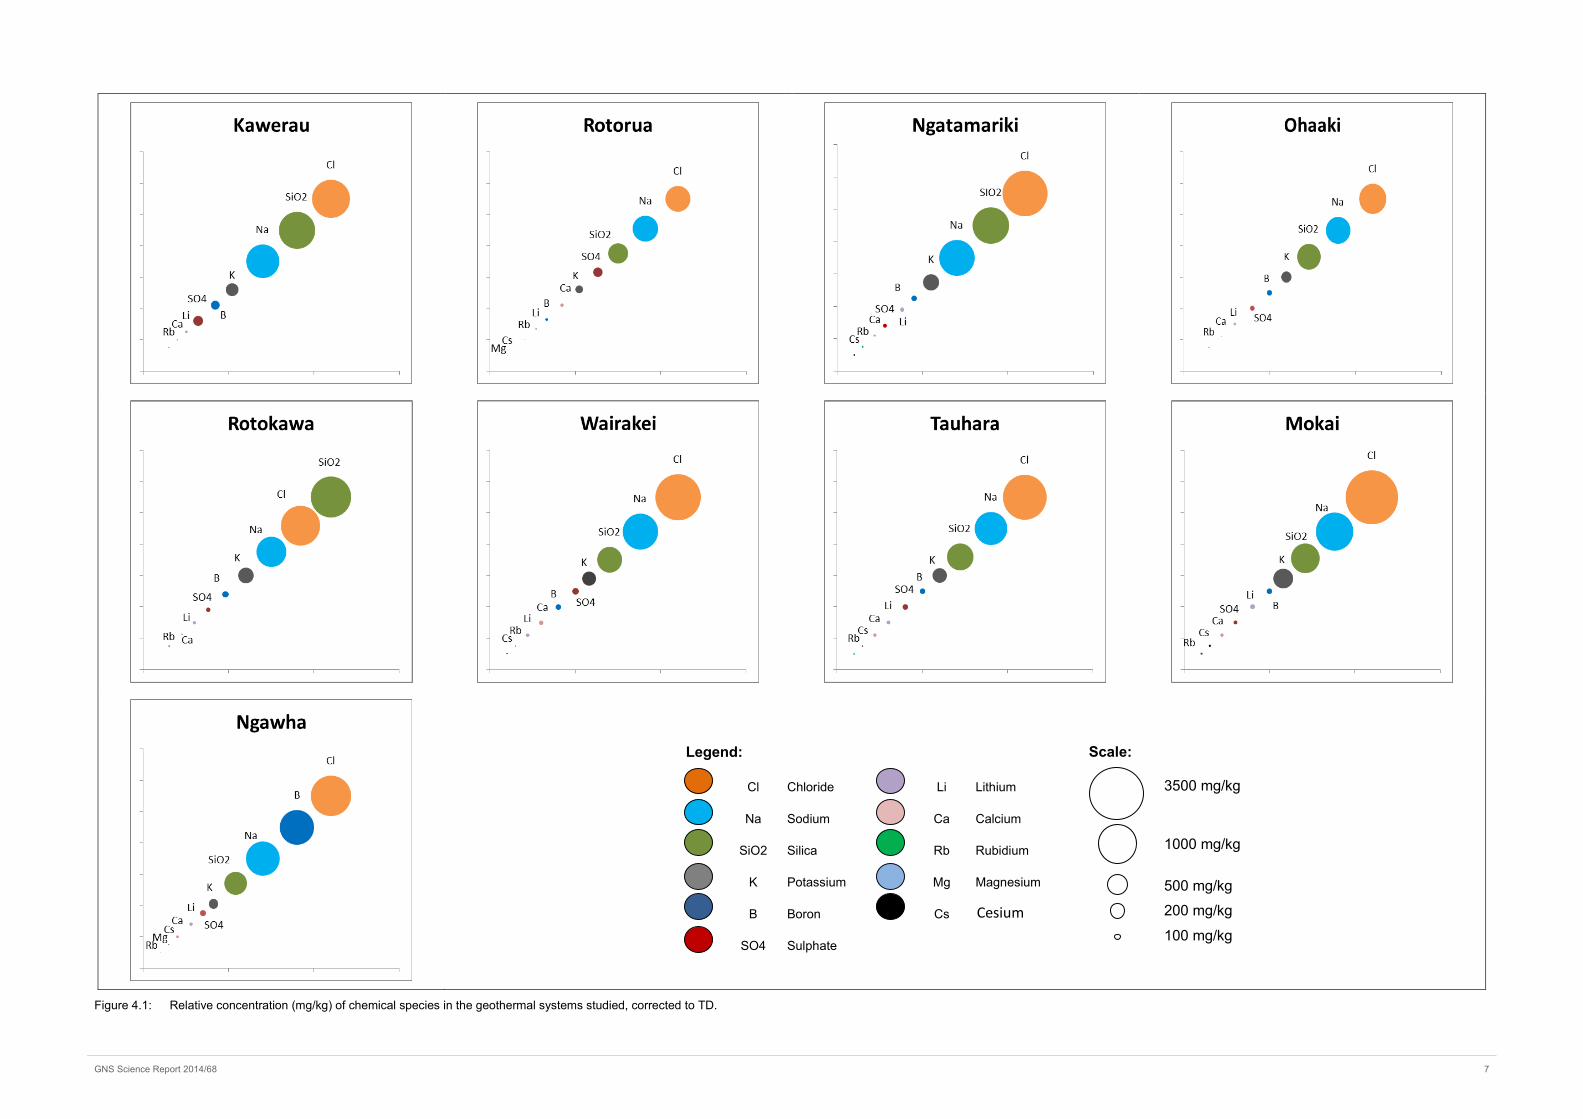
Figure 4.1 visually represents the relative mean concentration of the major elements in each geothermal area normalized to TD. Table A1.1 gives the statistical summary of the compositional data in greater detail. The TVZ eastern fields (Mokai, Wairakei and Tauhara) are characterized by high chloride and lithium. Chloride, sodium, silica and potassium (generally in that decreasing order) are the most common components of the geothermal brine. The remaining components are low in comparison to these four.
A notable difference to this trend is at Ngawha, where boron replaces silica as the third highest component dissolved in the fluid. Ngawha’s composition is low in silica (as the reservoir temperatures are low ~ 230°C) but the boron is 25x higher than any of the TVZ fields. The economics of extraction are not only influenced by the concentration of the component of interest but also by the overall composition of the water. For example, the lithium at Ngawha is 9.7 TD mg/kg (similar to Wairakei) but lower than Mokai’s 14.5 mg/kg TD. However given that the silica concentration at Mokai is about double that in Ngawha it may be more difficult and expensive to extract lithium from Mokai fluids than Ngawha.
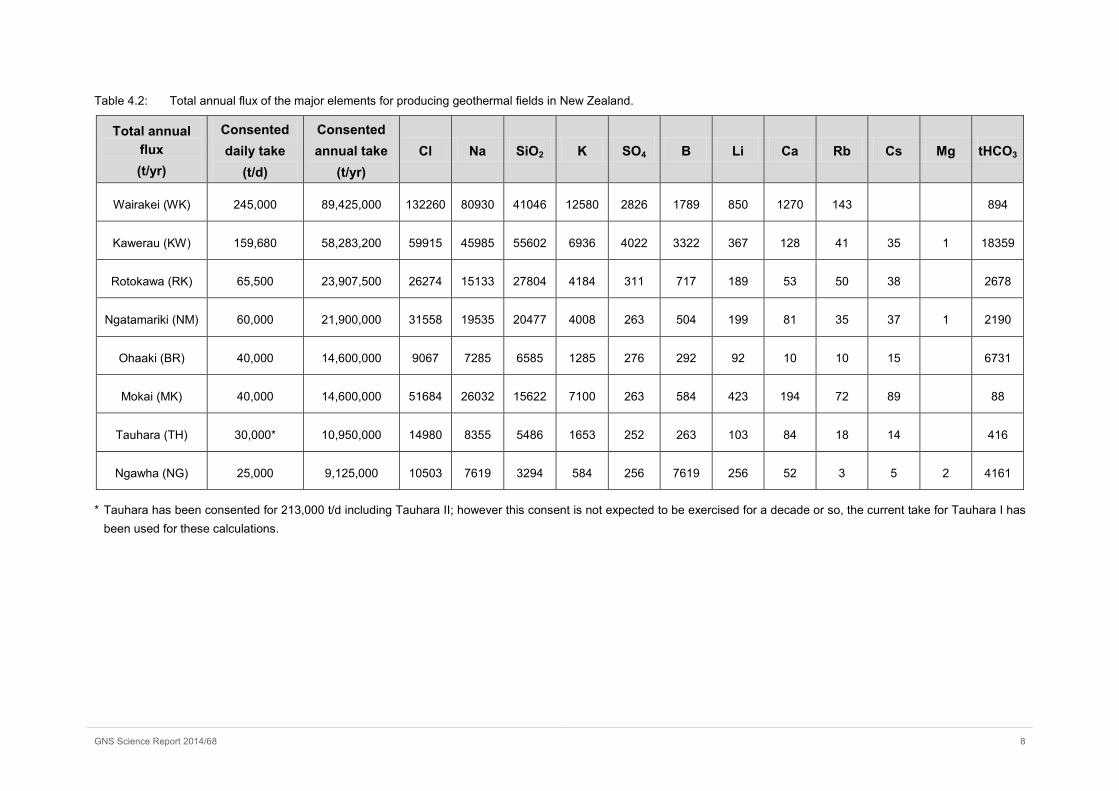
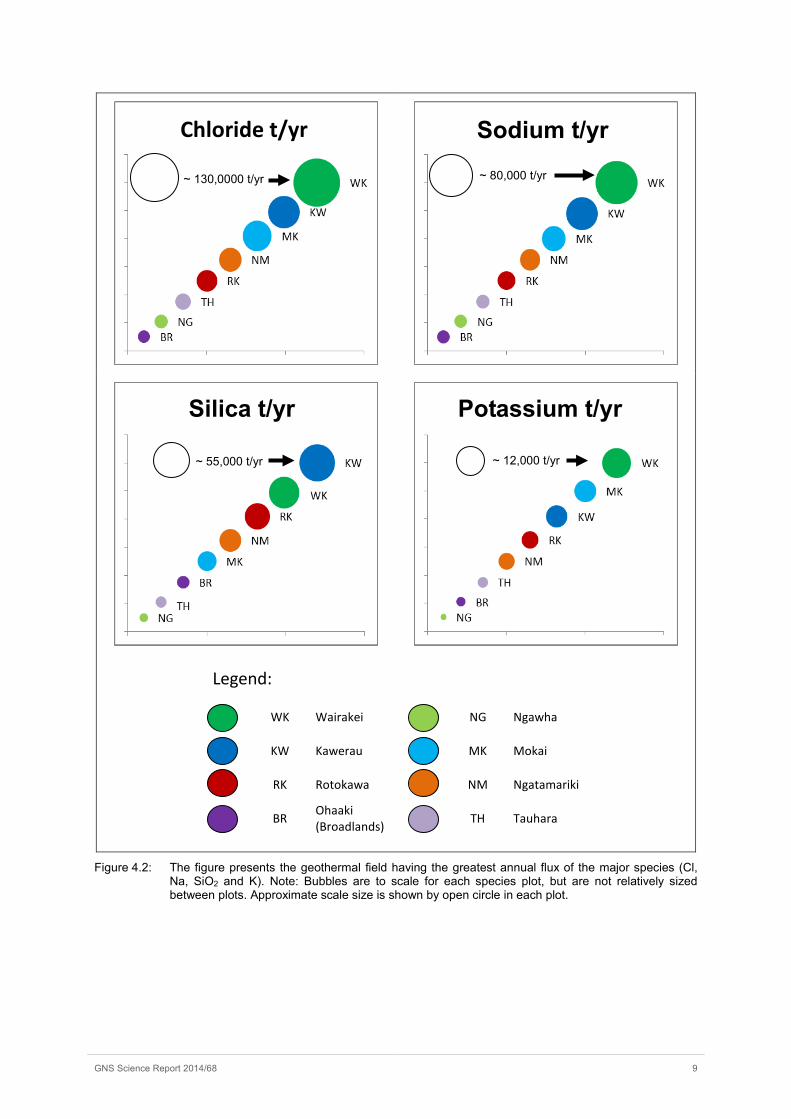
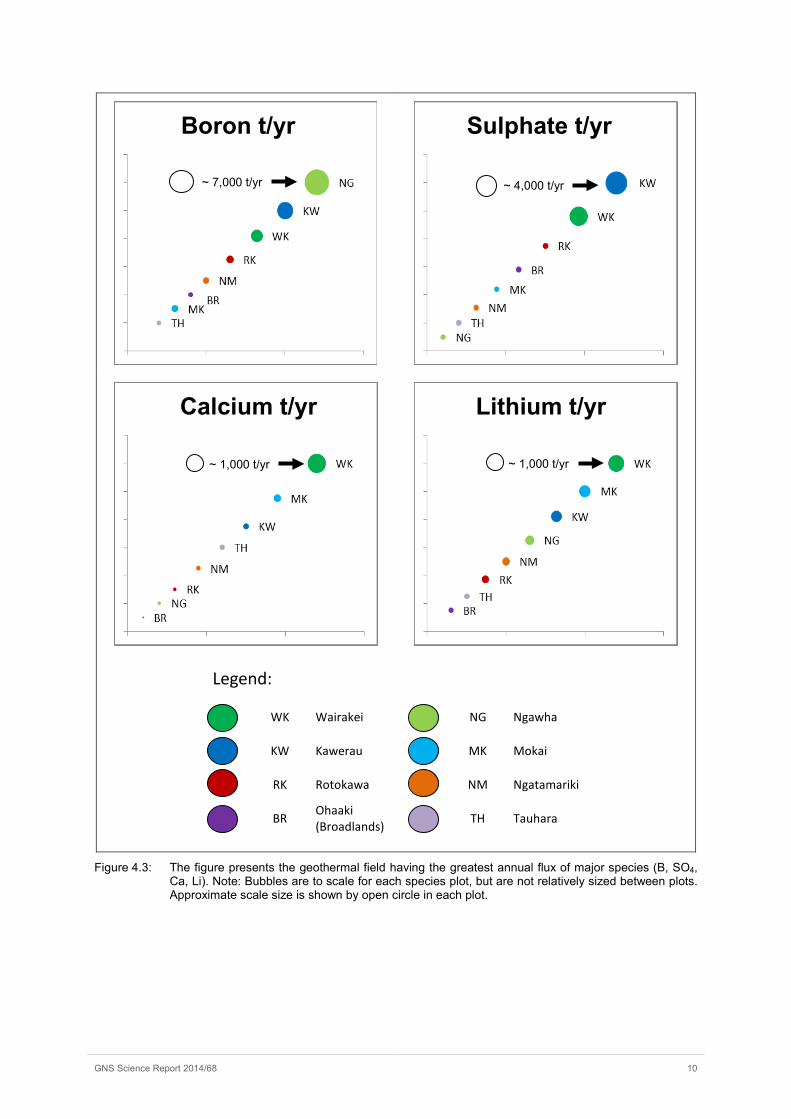
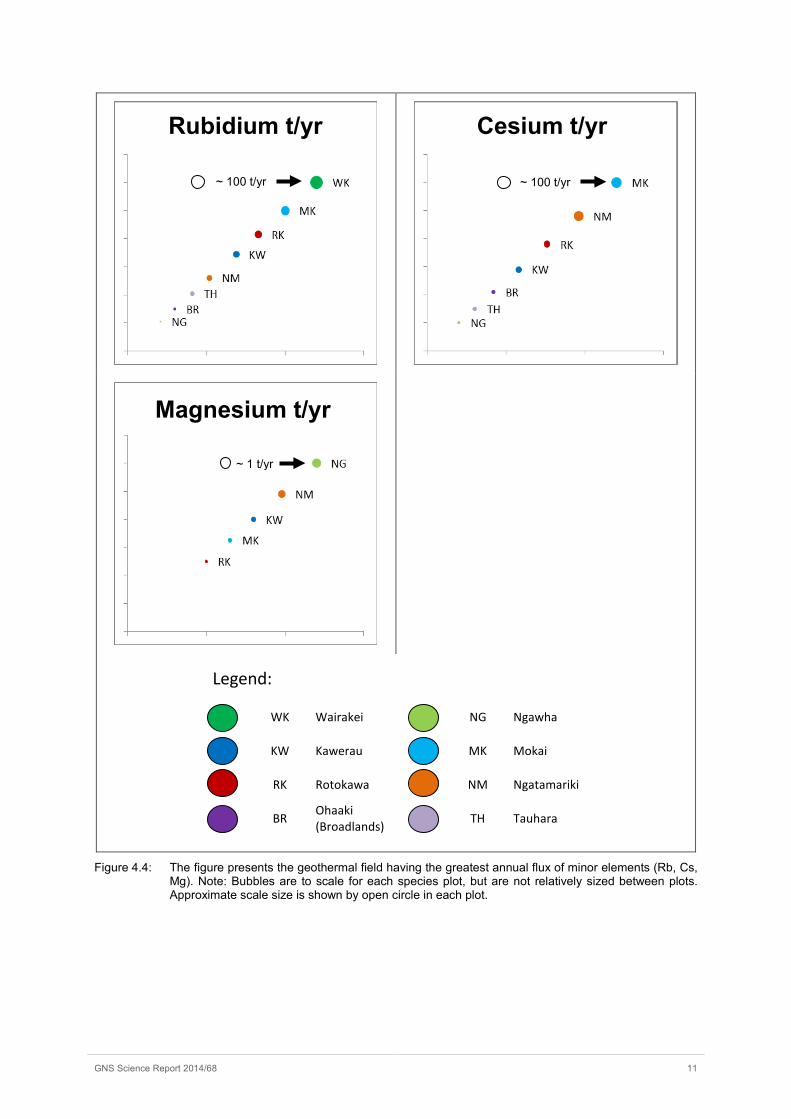
The total flux of dissolved components (Table 4.2) was calculated by multiplying the TD concentration (Table 4.1) by the consented annual take for each geothermal field. Figures 4.2-4.4 visually represent the total tonnes per annum by species of the major elements for New Zealand’s eight (electricity) producing geothermal fields.
The calculated mass flux reflects both the concentration and geothermal fluid mass flow. For example, for SiO2,the high mass flow at Kawerau is due to the high resource temperature as well as high take, whereas at Wairakei, where the resource temperature is lower and the silica concentration considerably lower, the higher take boosts the mass discharge of this component.
Wairakei has the highest mass discharge of Cl, Li, Rb, Ca, K and Na. The consented take used for Tauhara in these calculations and plots was 30,000 t/d, however the total consented take for Tauhara is 213,000 t/d (including the Tauhara II development). Thus, in future the Tauhara take could be almost as high as that of Wairakei’s 245,000 t/d, suggesting that economies of scale may be achieved to boost the combined total for these closely geographically located fields.
Ngawha’s annual boron discharge at 7600 t/yr is more than double the next closest highest at Kawerau.
Of the minor elements 143 t/yr Rb at Wairakei and 89 t/yr of Cs at Mokai are not inconsiderable annual discharges.
GNS Science Report 2014/68 6
Table 4.1: Representative fluid composition of selected TVZ and Ngawha geothermal wells; values in mg/kg§.
Representative conc. (mg/kg)
Cl Na SiO2 K SO4 B Li Ca Rb Cs Mg tHCO3‡
Wairakei corrected to 1 ba 1991 1217 618 194 42 27 12.7 19.0 2.2 1.3* 0.01 <10
corrected to TD 1479 905 459 144 32 20 9.5 14.2 1.6
0.01
Kawerau corrected to 1 ba 1028 789 954 119 69 57 6.3 2.2 0.7 0.6* 0.01 315
corrected to TD 672 518 624 77 45 37 4.1 1.5 0.4 0.4* 0.01
Rotokawa corrected to 1 ba 1099 633 1163 175 13 30 7.9 2.2 2.1 1.6* 0.01 112
corrected to TD 560 324 594 89 7 15 4.0 1.1 1.0 0.8* 0.01
Ngatamariki corrected to 1 ba 1441 892 935 183 12 23 9.1 3.7 1.6 1.7 0.06 100
corrected to TD 948 588 614 120 9 15 7.3 2.5 1.1 1.1 0.04
Ohaaki corrected to 1 ba 1172 919 829 166 31 38 11.8 1.4 1.5 1.0* 0.01 461
corrected to TD 621 499 451 88 19 20 6.3 0.7 0.7
0.01
Mokai* corrected to 1 ba 3540 1783 1070 487 18 40 29.0 13.3 4.9 6.1 0.03 6
corrected to TD 1757 869 532 243 10 20 14.5 6.7 2.4 3.0 0.02
Tauhara corrected to 1 ba 2186 1216 809 244 36 38 15.1 12.3 2.6 2.6 0.03 38
corrected to TD 1368 763 501 151 23 24 9.4 7.7 1.6 1.3 0.02
Ngawha corrected to 1 ba 1465 1043 461 82 38 1063 12.3 7.2 0.3 0.8 0.27 456
corrected to TD 1151 835 361 64 28 835 9.7 5.7 0.3 0.6 0.22
Rotorua corrected to 1 ba 527 525 319 50 74 6 2.7 7.6 0.4 0.4 0.07 342
corrected to TD 454 459 280 43 66 5 2.4 7.0 0.3 0.3 0.06
§ The analyses were corrected to TD or to 1 ba using the mass balance equations XTD = XA (1-y) or X1 ba = XA/(1-y); where XA is the composition as analysed, XTD at TD or X1 ba at 1 ba and where y is the appropriate steam fraction.
‡ Correction to 1 ba does not include adjustment for loss of CO2.
* Indicative values from Giggenbach (1995).
GNS Science Report 2014/68 7
Figure 4.1: Relative concentration (mg/kg) of chemical species in the geothermal systems studied, corrected to TD.
Legend:
Cl Chloride Li Lithium
Na Sodium Ca Calcium
SiO2 Silica Rb Rubidium
K Potassium Mg Magnesium
B Boron Cs Caesium
SO4 Sulphate
Scale: 3500 mg/kg
1000 mg/kg
500 mg/kg
200 mg/kg
100 mg/kg Cesium
GNS Science Report 2014/68 8
Table 4.2: Total annual flux of the major elements for producing geothermal fields in New Zealand.
Total annual flux (t/yr)
Consented daily take
(t/d)
Consented annual take
(t/yr) Cl Na SiO2 K SO4 B Li Ca Rb Cs Mg tHCO3
Wairakei (WK) 245,000 89,425,000 132260 80930 41046 12580 2826 1789 850 1270 143 894
Kawerau (KW) 159,680 58,283,200 59915 45985 55602 6936 4022 3322 367 128 41 35 1 18359
Rotokawa (RK) 65,500 23,907,500 26274 15133 27804 4184 311 717 189 53 50 38 2678
Ngatamariki (NM) 60,000 21,900,000 31558 19535 20477 4008 263 504 199 81 35 37 1 2190
Ohaaki (BR) 40,000 14,600,000 9067 7285 6585 1285 276 292 92 10 10 15 6731
Mokai (MK) 40,000 14,600,000 51684 26032 15622 7100 263 584 423 194 72 89 88
Tauhara (TH) 30,000* 10,950,000 14980 8355 5486 1653 252 263 103 84 18 14 416
Ngawha (NG) 25,000 9,125,000 10503 7619 3294 584 256 7619 256 52 3 5 2 4161
* Tauhara has been consented for 213,000 t/d including Tauhara II; however this consent is not expected to be exercised for a decade or so, the current take for Tauhara I has been used for these calculations.
GNS Science Report 2014/68 9
Figure 4.2: The figure presents the geothermal field having the greatest annual flux of the major species (Cl, Na, SiO2 and K). Note: Bubbles are to scale for each species plot, but are not relatively sized between plots. Approximate scale size is shown by open circle in each plot.
~ 80,000 t/yr ~ 130,0000 t/yr
~ 12,000 t/yr ~ 55,000 t/yr
WK Wairakei
NG Ngawha
KW Kawerau
MK Mokai
RK Rotokawa
NM Ngatamariki
BR Ohaaki (Broadlands)
TH Tauhara
Legend:
Chloride t/yr Sodium t/yr
Silica t/yr Potassium t/yr
GNS Science Report 2014/68 10
Figure 4.3: The figure presents the geothermal field having the greatest annual flux of major species (B, SO4, Ca, Li). Note: Bubbles are to scale for each species plot, but are not relatively sized between plots. Approximate scale size is shown by open circle in each plot.
~ 7,000 t/yr
~ 1,000 t/yr
WK Wairakei
NG Ngawha
KW Kawerau
MK Mokai
RK Rotokawa
NM Ngatamariki
BR Ohaaki (Broadlands)
TH Tauhara
Legend:
~ 4,000 t/yr
~ 1,000 t/yr
Lithium t/yr Calcium t/yr
Boron t/yr Sulphate t/yr
GNS Science Report 2014/68 11
Figure 4.4: The figure presents the geothermal field having the greatest annual flux of minor elements (Rb, Cs, Mg). Note: Bubbles are to scale for each species plot, but are not relatively sized between plots. Approximate scale size is shown by open circle in each plot.
~ 100 t/yr ~ 100 t/yr
WK Wairakei
NG Ngawha
KW Kawerau
MK Mokai
RK Rotokawa
NM Ngatamariki
BR Ohaaki (Broadlands)
TH Tauhara
Legend:
~ 1 t/yr
Rubidium t/yr Cesium t/yr
Magnesium t/yr
GNS Science Report 2014/68 12
4.2 BICARBONATE
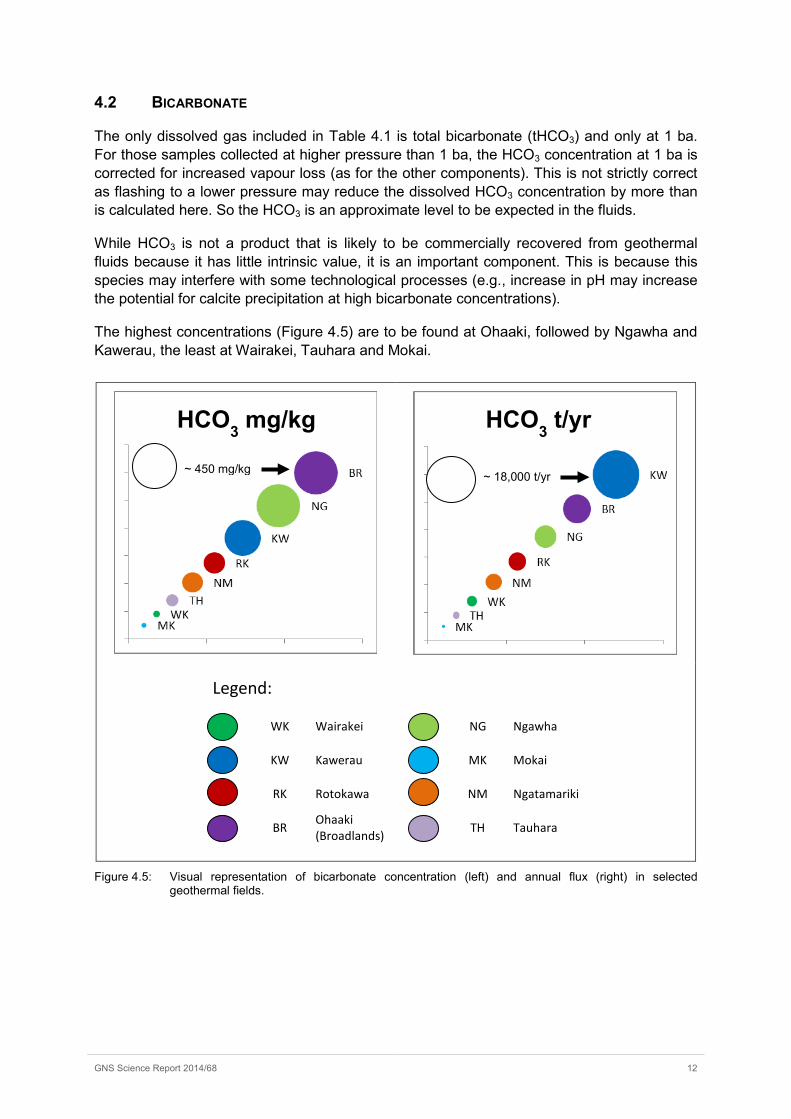
The only dissolved gas included in Table 4.1 is total bicarbonate (tHCO3) and only at 1 ba. For those samples collected at higher pressure than 1 ba, the HCO3 concentration at 1 ba is corrected for increased vapour loss (as for the other components). This is not strictly correct as flashing to a lower pressure may reduce the dissolved HCO3 concentration by more than is calculated here. So the HCO3 is an approximate level to be expected in the fluids.
While HCO3 is not a product that is likely to be commercially recovered from geothermal fluids because it has little intrinsic value, it is an important component. This is because this species may interfere with some technological processes (e.g., increase in pH may increase the potential for calcite precipitation at high bicarbonate concentrations).
The highest concentrations (Figure 4.5) are to be found at Ohaaki, followed by Ngawha and Kawerau, the least at Wairakei, Tauhara and Mokai.
Figure 4.5: Visual representation of bicarbonate concentration (left) and annual flux (right) in selected geothermal fields.
~ 450 mg/kg ~ 18,000 t/yr
WK Wairakei
NG Ngawha
KW Kawerau
MK Mokai
RK Rotokawa
NM Ngatamariki
BR Ohaaki (Broadlands)
TH Tauhara
Legend:
HCO3 t/yr HCO3 mg/kg
GNS Science Report 2014/68 13
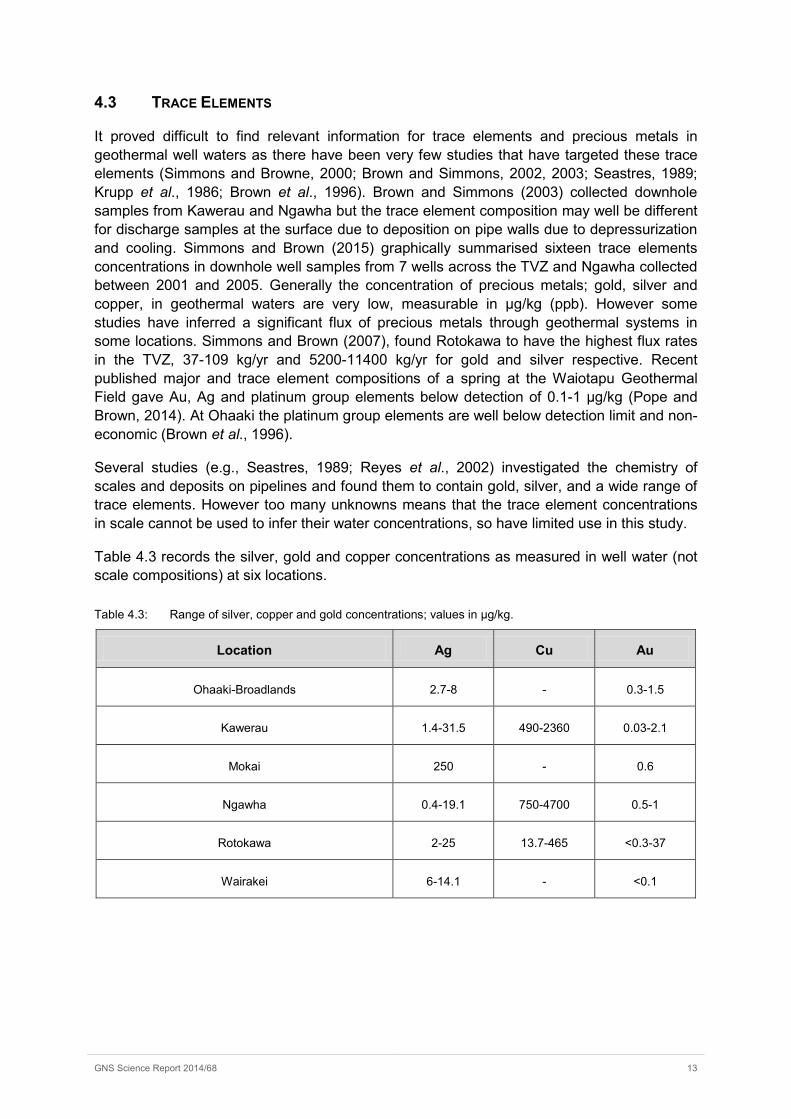
4.3 TRACE ELEMENTS
It proved difficult to find relevant information for trace elements and precious metals in geothermal well waters as there have been very few studies that have targeted these trace elements (Simmons and Browne, 2000; Brown and Simmons, 2002, 2003; Seastres, 1989; Krupp et al., 1986; Brown et al., 1996). Brown and Simmons (2003) collected downhole samples from Kawerau and Ngawha but the trace element composition may well be different for discharge samples at the surface due to deposition on pipe walls due to depressurization and cooling. Simmons and Brown (2015) graphically summarised sixteen trace elements concentrations in downhole well samples from 7 wells across the TVZ and Ngawha collected between 2001 and 2005. Generally the concentration of precious metals; gold, silver and copper, in geothermal waters are very low, measurable in µg/kg (ppb). However some studies have inferred a significant flux of precious metals through geothermal systems in some locations. Simmons and Brown (2007), found Rotokawa to have the highest flux rates in the TVZ, 37-109 kg/yr and 5200-11400 kg/yr for gold and silver respective. Recent published major and trace element compositions of a spring at the Waiotapu Geothermal Field gave Au, Ag and platinum group elements below detection of 0.1-1 μg/kg (Pope and Brown, 2014). At Ohaaki the platinum group elements are well below detection limit and non-economic (Brown et al., 1996).
Several studies (e.g., Seastres, 1989; Reyes et al., 2002) investigated the chemistry of scales and deposits on pipelines and found them to contain gold, silver, and a wide range of trace elements. However too many unknowns means that the trace element concentrations in scale cannot be used to infer their water concentrations, so have limited use in this study.
Table 4.3 records the silver, gold and copper concentrations as measured in well water (not scale compositions) at six locations.
Table 4.3: Range of silver, copper and gold concentrations; values in μg/kg.
Location Ag Cu Au
Ohaaki-Broadlands 2.7-8 - 0.3-1.5
Kawerau 1.4-31.5 490-2360 0.03-2.1
Mokai 250 - 0.6
Ngawha 0.4-19.1 750-4700 0.5-1
Rotokawa 2-25 13.7-465 <0.3-37
Wairakei 6-14.1 - <0.1
GNS Science Report 2014/68 14
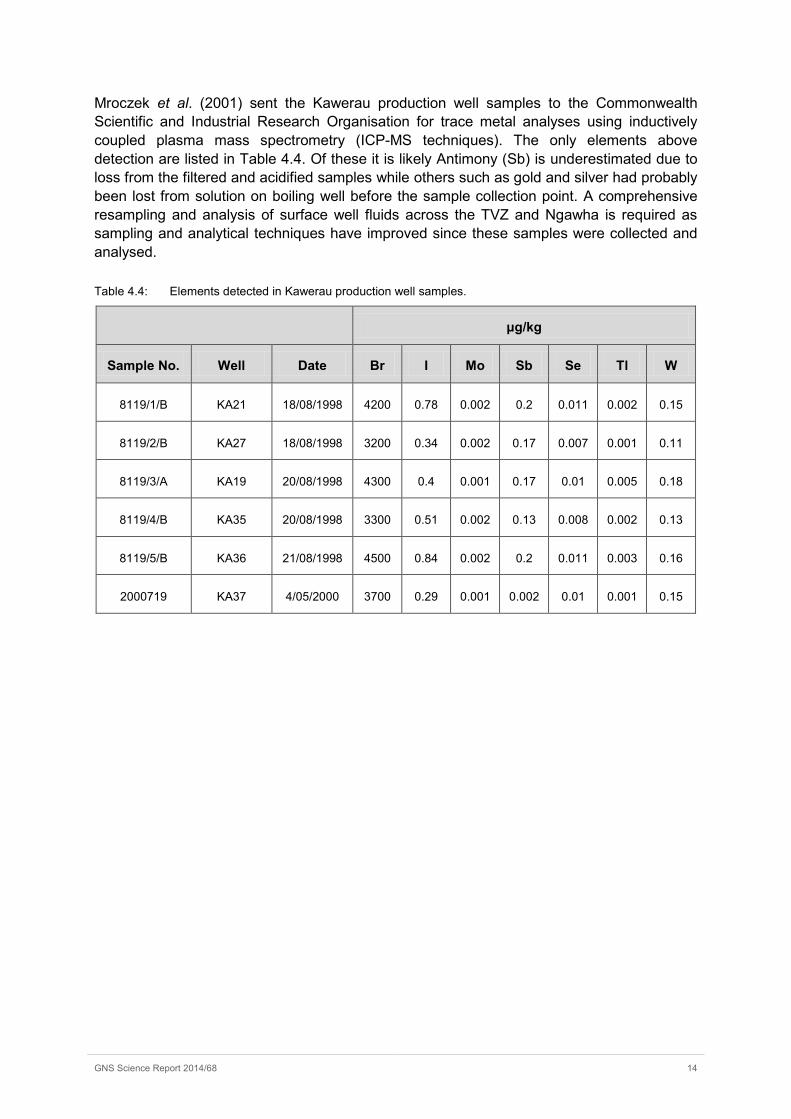
Mroczek et al. (2001) sent the Kawerau production well samples to the Commonwealth Scientific and Industrial Research Organisation for trace metal analyses using inductively coupled plasma mass spectrometry (ICP-MS techniques). The only elements above detection are listed in Table 4.4. Of these it is likely Antimony (Sb) is underestimated due to loss from the filtered and acidified samples while others such as gold and silver had probably been lost from solution on boiling well before the sample collection point. A comprehensive resampling and analysis of surface well fluids across the TVZ and Ngawha is required as sampling and analytical techniques have improved since these samples were collected and analysed.
Table 4.4: Elements detected in Kawerau production well samples.
μg/kg
Sample No. Well Date Br I Mo Sb Se Tl W
8119/1/B KA21 18/08/1998 4200 0.78 0.002 0.2 0.011 0.002 0.15
8119/2/B KA27 18/08/1998 3200 0.34 0.002 0.17 0.007 0.001 0.11
8119/3/A KA19 20/08/1998 4300 0.4 0.001 0.17 0.01 0.005 0.18
8119/4/B KA35 20/08/1998 3300 0.51 0.002 0.13 0.008 0.002 0.13
8119/5/B KA36 21/08/1998 4500 0.84 0.002 0.2 0.011 0.003 0.16
2000719 KA37 4/05/2000 3700 0.29 0.001 0.002 0.01 0.001 0.15
GNS Science Report 2014/68 15
5.0 SUMMARY
In this report the major elemental brine composition is updated and summarized for the major producing geothermal fields. Fields which are protected or for which insufficient data is available are excluded. The total flux of various species, in tonnes per year, has been derived using the geothermal fluid takes that are currently consented.
The species composition of the well fluids has been taken from published historical data and data recently released for this study by Contact Energy Ltd and Mighty River Power Ltd. No data has been publically published for Mokai since 1995, which means that there is uncertainty as to how closely the present discharge compositions match the historical data.
The trace elemental composition in geothermal well surface discharges is overall poorly known. More work (sampling and analysis) needs to be undertaken to adequately characterize the trace element compositions in the surface well discharges from the fields considered in this report. However downhole sample concentrations show the concentrations of metals of interest will be in the low part per billion (ppb) range.
This compositional and flux data will ultimately be used to assist determining the economics of mineral extraction at the different geothermal fields.
6.0 ACKNOWLEDGEMENTS
This study was funded from the “From Waste to Wealth: commercial recovery of products from geothermal fluids” geothermal research programme, led by GNS Science and funded by the New Zealand Ministry of Business, Innovation and Employment (CO5X1307).
The authors would like to thank Contact Energy Ltd and Mighty River Power Ltd for providing representative well fluid compositions, and Isabelle Chambefort (GNS Science) and Kevin Brown (GEOKEM) for reviewing this report.
GNS Science Report 2014/68 16
7.0 REFERENCES
Bay of Plenty Regional Council Geothermal Resources. 2008 Bay of Plenty Regional Water and Land Plan, pp. 143-144.
Bromley, C.; Burnell, J.; Mroczek, E.; Simpson, M. 2014 2014 Ngawha Conceptual Model. GNS Science consultancy report 2014/181. 33 p.
Brown, K.L.; Simmons, S.F. 2002 Preliminary results of precious metal analyses of downhole samples from Kawerau and Ngawha geothermal systems. Proceedings New Zealand Geothermal Workshop.
Brown, K.L.; Simmons, S.F. 2003 Precious metals in high-temperature geothermal systems in New Zealand. Geothermics 32: 619-625.
Brown, K.L.; Webster, J.G.; Christenson, B.W. 1996 Precious metal sampling in the Ohaaki Geothermal Field. Proc. 18th New Zealand Geotherm. Workshop: 169-174.
Carey, B.S.; Rae, A.J.; Alcaraz, S.A.; Lewis, B.; Soengkono, S.; Reeves, R.R.; Mroczek, E.K.; Bromley, C.J.; Bixley, P. 2013 Ohaaki Geothermal Power Plant. Project reference report : geoscientific and reservoir engineering review. GNS Science consultancy report 2011/273. 211 p.
Giggenbach, W.F. 1995 Variations in the chemical and isotopic compositions of fluids discharged from the Taupo Volcanic Zone, New Zealand. Journal of Volcanology and Geothermal Research 68: 89-116.
GNS Science. Geothermal and Groundwater Database (GGW). Accessed from: http://ggw.gns.cri.nz/ggwdata/ in 2015.
Krupp, E.; Browne, P.R.L.; Henley, R.W.; Seward, T.M. 1986 Rotokawa geothermal field. In: Henley, R.W.; Hedenquist, J.W.; Roberts, P.J. (Eds.). Guide to the Active Epithermal (Geothermal) Systems and Precious Metal Deposits of New Zealand. Gebruder Borntraeger, Berlin, Stuttgart: 47-55.
Mroczek, E.; Lee, S.G.; Smith, R.; Carey, B. 2008 Ohaaki West Bank Production Fluid Compositions. New Zealand Geothermal Workshop.
Mroczek, E.K.; Christenson, B.W.; Mountain, B.W.; Stewart, M.K. 2001 Kawerau fluid chemistry: analytical results. Lower Hutt, NZ: Institute of Geological and Nuclear Sciences. Institute of Geological and Nuclear Sciences science report 2001/14. 19 p.
Mroczek, E.K.; Graham, D.J.; Scott, B.J. 2011 Chemistry of the Rotorua Geothermal Field - Update of spring and well compositions 2008-2009. GNS Science internal report 2011/02. 84 p.
New Zealand Geothermal Association Web site. 2014 http:// www.nzgeothermal.org.nz/nz_geo_fields.html#Mokai.
O'Brien, J.M. 2010 Hydrogeochemical Characteristics of the Ngatamariki Geothermal Field and a Comparison with the Orakei Korako Thermal Area, Taupo Volcanic Zone, New Zealand. Master of Science Thesis, University of Canterbury. Geological Sciences.
Pope, J.; Brown K.L. 2014 Geochemistry of discharge at Waiotapu geothermal area, New Zealand – Trace elements and temporal changes. Geothermics, 51, 253-269.
Reyes, A.; Trompetter, W.; Britten, K.; Searle, J. 2002 Mineral deposits in the Rotokawa geothermal pipelines, New Zealand. Journal of Volcanology and Geothermal Research 119: 215-239.
Rosenberg, M.D.; Wallin, E.L.; Bannister, S.C.; Bourguignon, S.; Sherburn, S.; Jolly, G.E.; Mroczek, E.K.; Milicich, S.D.; Graham, D.J.; Bromley, C.J.; Reeves, R.R.; Bixley, P.; Clotworthy, A.; Carey, B.S.; Climo, M.; Links, F. 2010 Tauhara Stage II Geothermal Project : geoscience report. GNS Science consultancy report 2010/138. 268 p.
GNS Science Report 2014/68 17
Seastres, J.S. 1989 Ore petrography and mineral chemistry of trace metals extracted from geothermal fluids at Rotokawa, Taupo Volcanic Zone. Masters of Science Thesis. University of Auckland.
Sheppard, D.S. 1984 Fluid chemistry of the Ngawha reservoir. In Proceedings: 6th New Zealand Geothermal Workshop, 151-154.
Sheppard, D.S.; Giggenbach, W.F. 1985 Ngawha well fluid compositions. p. 103-119 IN: Mongillo, M.A. (comp.) The Ngawha geothermal field: new and updated scientific investigations. Wellington: Geothermal Coordination Group. DSIR geothermal report 8.
Sheppard, D.S.; Giggenbach, W.F.; Johnston, J.R. 1985 A listing of chemical and isotopic analyses on waters and gases from the Ngawha geothermal system and environs. [s.l.]: [s.n.]. Report / Chemistry Division 2359. 52 p.
Simmons, S.F.; Brown, K. 2015 Insights to High Temperature Geothermal Systems (New Zealand) from Trace Metal Aqueous Chemistry Stuart. Proceedings World Geothermal Congress 2015, Melbourne, Australia, 19-25 April 2015.
Simmons, S.F.; Brown, K.L. 2007 The flux of gold and related metals through a volcanic arc, Taupo Volcanic Zone: Geology, v. 35, p. 1099-1102.
Simmons, S.F.; Browne, P.R.L. 2000 Hydrothermal minerals and precious metals in the Broadlands-Ohaaki geothermal system: Implications for understanding low-sulfidation epithermal environments. Economic Geology and the Bulletin of the Society of Economic Geologists 95: 971-999.
Waikato Regional Council (WRC). 2007 Waikato Regional Plan, Environment Waikato Policy Series 2007/21; Reprinted April 2012 – incorporating Variations No.2, No.5, No.6 and No.7. www.wrc.govt.nz.
GNS Science Report 2014/68 18
8.0 GENERAL BIBLIOGRAPHY Brown, K.L. 1986 Gold deposition from geothermal discharges in New Zealand. Economic
Geology and the Bulletin of the Society of Economic Geologists 81: 979-983.
Christenson, B.W.; Mroczek, E.K.; Kennedy, B.M.; van Soest, M.C.; Stewart, M.K.; Lyon, G. 2002 Ohaaki reservoir chemistry: Characteristics of an arc-type hydrothermal system in the Taupo Volcanic Zone, New Zealand. Journal of Volcanology and Geothermal Research 115: 53-82.
Cox, M.; Browne, P.R.L 1991 Geochemistry of ground and thermal waters in the Ngawha area and elsewhere in Northland, New Zealand. Proc. 13th New Zealand Geotherm. Workshop.
Ellis, A.I.; Mahon, W.A.J. 1977 Chemistry and Geothermal Systems. New York, Academic Press.
Gallup, D.L. 1998 Geochemistry of geothermal fluids and well scales, and potential for mineral recovery. Ore Geology Reviews 12: 225-236.
Giggenbach, W.F.; Sheppard, D.S.; Robinson, B.W.; Stewart, M.K.; Lyon, G.L. 1994 Geochemical structure and position of the Waiotapu geothermal field, New Zealand. Geotermics, 23(5/6), 599-644.
Hedenquist, J.W. 1990 The thermal and geochemical structure of the Broadlands-Ohaaki geothermal system, New Zealand. Geothermics 19: 151-185.
Krupp, R.E.; Seward, T.M. 1987 The Rotokawa geothermal system, New Zealand: An active epithermal gold-depositing environment. Economic Geology and the Bulletin of the Society of Economic Geologists 82: 1109-1129.
Millot, R.; Hegan, A.; Negrel, P. 2012 Geothermal waters from the Taupo Volcanic Zone, New Zealand: Li, B and Sr isotopes characterization. Applied Geochemistry, 27, 677-688.
O'Brien, J. 2010 Characteristics of the Ngatamariki Geothermal field and a comparison with Ohaaki and Orakeikorako thermal areas, TVZ, New Zealand. Masters of Science Thesis, University of Canterbury.
Pope, J.G.; Brown, K.L.; McConchie, D.M. 2005 Gold concentrations in springs at Waiotapu, New Zealand: Implications for precious metal deposition in geothermal systems. Economic Geology, 100, 677-687.
Robinson, B.W.; Sheppard, D.S. 1986 A chemical and isotopic study of the Tokaanu-Waihi geothermal area, New Zealand. Journal of Volcanology and Geothermal Research 27: 135-151.
Sheppard, D.S. 1986A Fluid chemistry of the Waimangu geothermal system. Geothermics, 15 (3), 309-328.
Simmons, S.F.; Stewart, M.K.; Robinson, B.W.; Glover, R.B. 1994 The Chemical and Isotopic Compositions of Thermal waters at Waimangu, New Zealand. Geothermics 23(5/6): 539-553.
Weissberg, B.G. 1969 Gold-silver ore-grade precipitates from New Zealand thermal waters. Economic Geology and the Bulletin of the Society of Economic Geologists 64: 95-108.
Wood, S.A. 2006 Rare earth element systematics of acidic geothermal waters from the Taupo Volcanic Zone, New Zealand. Journal of Geochemical Exploration 89: 424-427.

GNS Science Report 2014/68 19
APPENDICES
GNS Science Report 2014/68 20
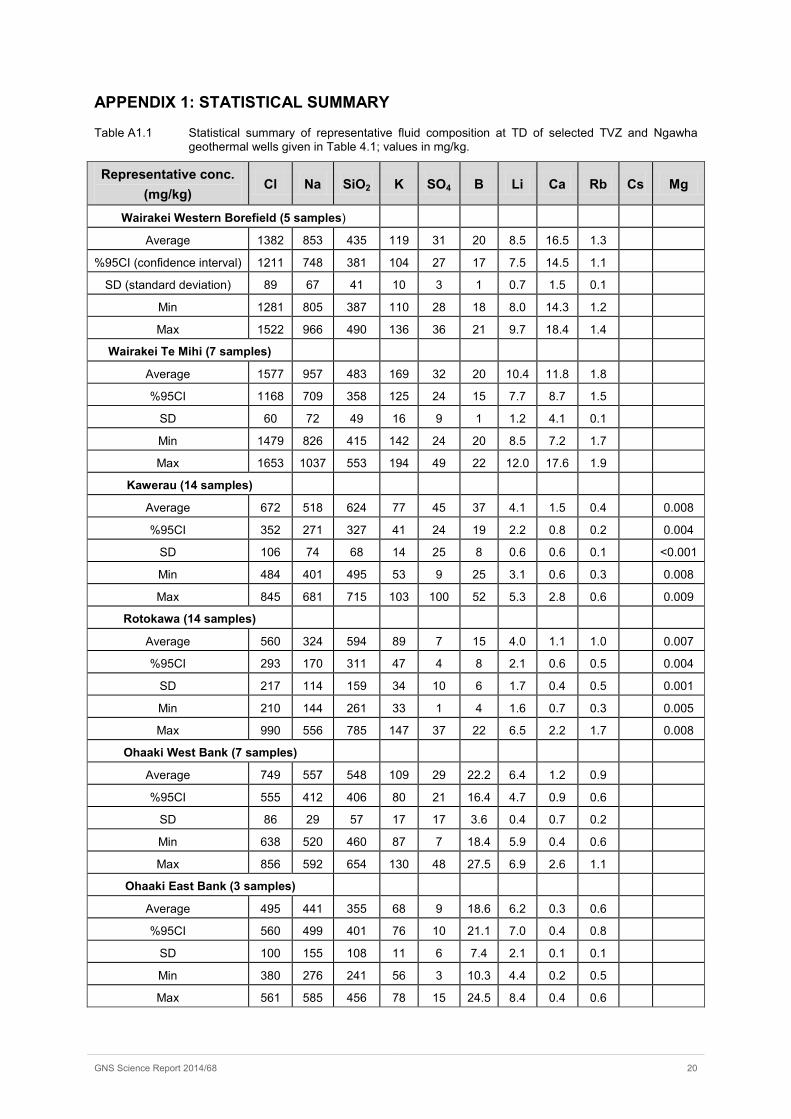
APPENDIX 1: STATISTICAL SUMMARY
Table A1.1 Statistical summary of representative fluid composition at TD of selected TVZ and Ngawha geothermal wells given in Table 4.1; values in mg/kg.
Representative conc. (mg/kg)
Cl Na SiO2 K SO4 B Li Ca Rb Cs Mg
Wairakei Western Borefield (5 samples)
Average 1382 853 435 119 31 20 8.5 16.5 1.3
%95CI (confidence interval) 1211 748 381 104 27 17 7.5 14.5 1.1
SD (standard deviation) 89 67 41 10 3 1 0.7 1.5 0.1
Min 1281 805 387 110 28 18 8.0 14.3 1.2
Max 1522 966 490 136 36 21 9.7 18.4 1.4
Wairakei Te Mihi (7 samples)
Average 1577 957 483 169 32 20 10.4 11.8 1.8
%95CI 1168 709 358 125 24 15 7.7 8.7 1.5
SD 60 72 49 16 9 1 1.2 4.1 0.1
Min 1479 826 415 142 24 20 8.5 7.2 1.7
Max 1653 1037 553 194 49 22 12.0 17.6 1.9
Kawerau (14 samples)
Average 672 518 624 77 45 37 4.1 1.5 0.4 0.008
%95CI 352 271 327 41 24 19 2.2 0.8 0.2 0.004
SD 106 74 68 14 25 8 0.6 0.6 0.1 <0.001
Min 484 401 495 53 9 25 3.1 0.6 0.3 0.008
Max 845 681 715 103 100 52 5.3 2.8 0.6 0.009
Rotokawa (14 samples)
Average 560 324 594 89 7 15 4.0 1.1 1.0 0.007
%95CI 293 170 311 47 4 8 2.1 0.6 0.5 0.004
SD 217 114 159 34 10 6 1.7 0.4 0.5 0.001
Min 210 144 261 33 1 4 1.6 0.7 0.3 0.005
Max 990 556 785 147 37 22 6.5 2.2 1.7 0.008
Ohaaki West Bank (7 samples)
Average 749 557 548 109 29 22.2 6.4 1.2 0.9
%95CI 555 412 406 80 21 16.4 4.7 0.9 0.6
SD 86 29 57 17 17 3.6 0.4 0.7 0.2
Min 638 520 460 87 7 18.4 5.9 0.4 0.6
Max 856 592 654 130 48 27.5 6.9 2.6 1.1
Ohaaki East Bank (3 samples)
Average 495 441 355 68 9 18.6 6.2 0.3 0.6
%95CI 560 499 401 76 10 21.1 7.0 0.4 0.8
SD 100 155 108 11 6 7.4 2.1 0.1 0.1
Min 380 276 241 56 3 10.3 4.4 0.2 0.5
Max 561 585 456 78 15 24.5 8.4 0.4 0.6
GNS Science Report 2014/68 21
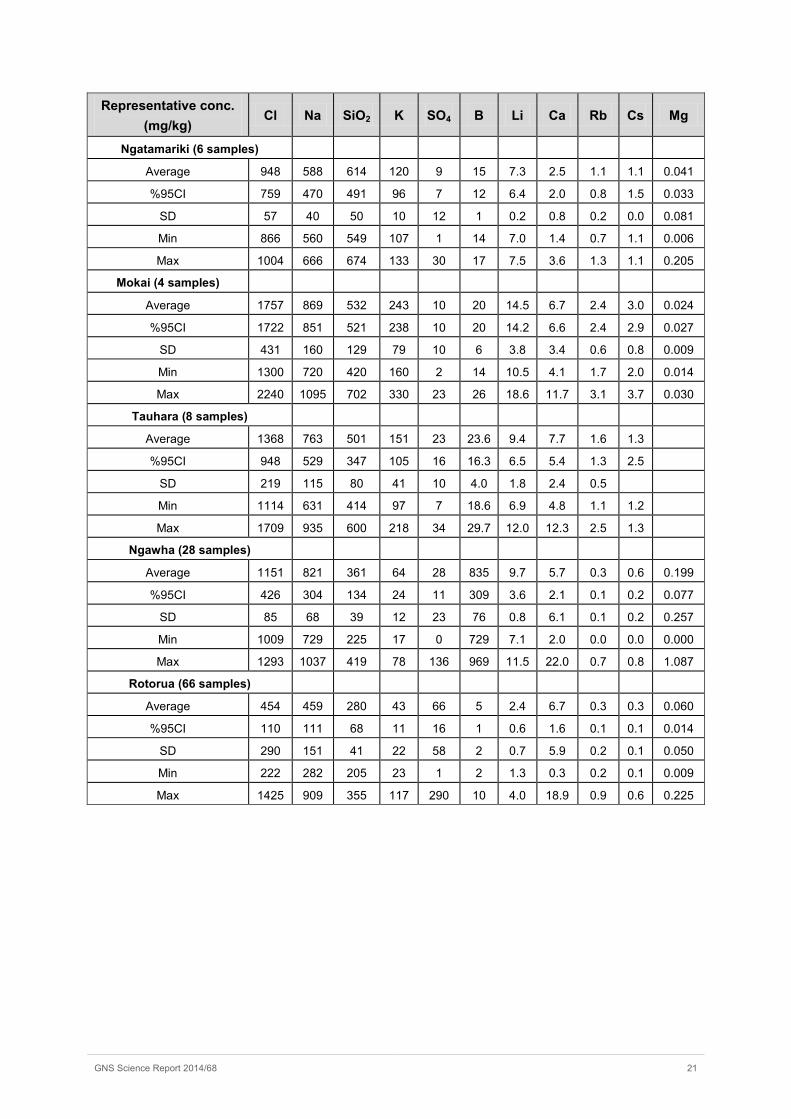
Representative conc. (mg/kg)
Cl Na SiO2 K SO4 B Li Ca Rb Cs Mg
Ngatamariki (6 samples)
Average 948 588 614 120 9 15 7.3 2.5 1.1 1.1 0.041
%95CI 759 470 491 96 7 12 6.4 2.0 0.8 1.5 0.033
SD 57 40 50 10 12 1 0.2 0.8 0.2 0.0 0.081
Min 866 560 549 107 1 14 7.0 1.4 0.7 1.1 0.006
Max 1004 666 674 133 30 17 7.5 3.6 1.3 1.1 0.205
Mokai (4 samples)
Average 1757 869 532 243 10 20 14.5 6.7 2.4 3.0 0.024
%95CI 1722 851 521 238 10 20 14.2 6.6 2.4 2.9 0.027
SD 431 160 129 79 10 6 3.8 3.4 0.6 0.8 0.009
Min 1300 720 420 160 2 14 10.5 4.1 1.7 2.0 0.014
Max 2240 1095 702 330 23 26 18.6 11.7 3.1 3.7 0.030
Tauhara (8 samples)
Average 1368 763 501 151 23 23.6 9.4 7.7 1.6 1.3
%95CI 948 529 347 105 16 16.3 6.5 5.4 1.3 2.5
SD 219 115 80 41 10 4.0 1.8 2.4 0.5
Min 1114 631 414 97 7 18.6 6.9 4.8 1.1 1.2
Max 1709 935 600 218 34 29.7 12.0 12.3 2.5 1.3
Ngawha (28 samples)
Average 1151 821 361 64 28 835 9.7 5.7 0.3 0.6 0.199
%95CI 426 304 134 24 11 309 3.6 2.1 0.1 0.2 0.077
SD 85 68 39 12 23 76 0.8 6.1 0.1 0.2 0.257
Min 1009 729 225 17 0 729 7.1 2.0 0.0 0.0 0.000
Max 1293 1037 419 78 136 969 11.5 22.0 0.7 0.8 1.087
Rotorua (66 samples)
Average 454 459 280 43 66 5 2.4 6.7 0.3 0.3 0.060
%95CI 110 111 68 11 16 1 0.6 1.6 0.1 0.1 0.014
SD 290 151 41 22 58 2 0.7 5.9 0.2 0.1 0.050
Min 222 282 205 23 1 2 1.3 0.3 0.2 0.1 0.009
Max 1425 909 355 117 290 10 4.0 18.9 0.9 0.6 0.225

1 Fairway Drive
Avalon
PO Box 30368
Lower Hutt
New Zealand
T +64-4-570 1444
F +64-4-570 4600
Dunedin Research Centre
764 Cumberland Street
Private Bag 1930
Dunedin
New Zealand
T +64-3-477 4050
F +64-3-477 5232
Wairakei Research Centre
114 Karetoto Road
Wairakei
Private Bag 2000, Taupo
New Zealand
T +64-7-374 8211
F +64-7-374 8199
National Isotope Centre
30 Gracefield Road
PO Box 31312
Lower Hutt
New Zealand
T +64-4-570 1444
F +64-4-570 4657
Principal Location
www.gns.cri.nz
Other Locations