Embed Size (px)
Citation preview
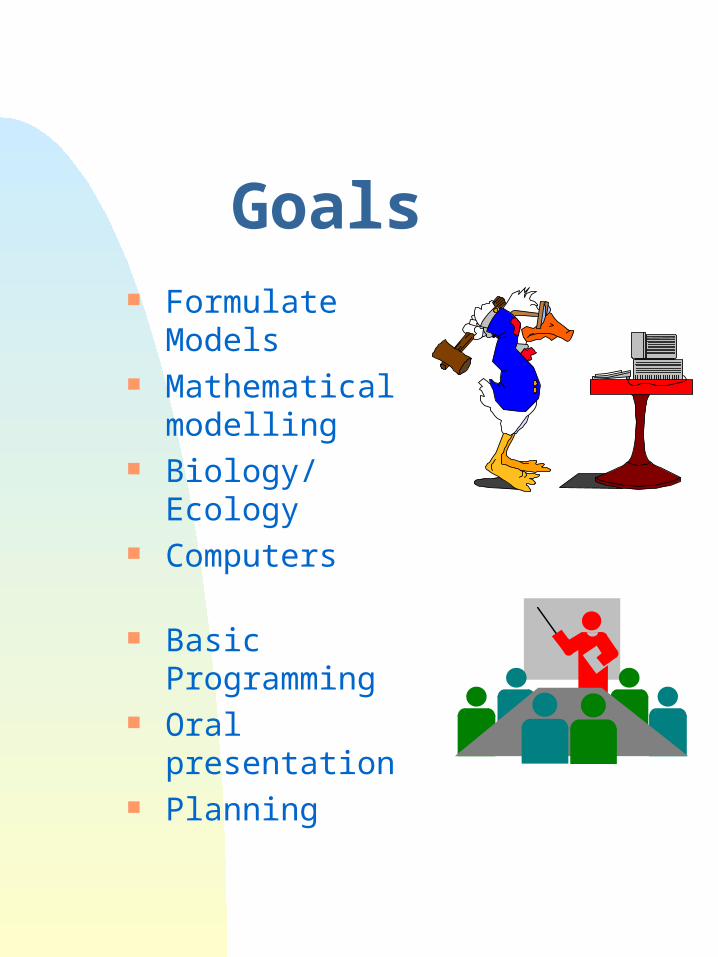
Goals Formulate Models Mathematical
modelling Biology/Ecology Computers
Basic Programming Oral presentation Planning
CourseOutline
Lecture Work on project Oral presenation of
project
New chapter
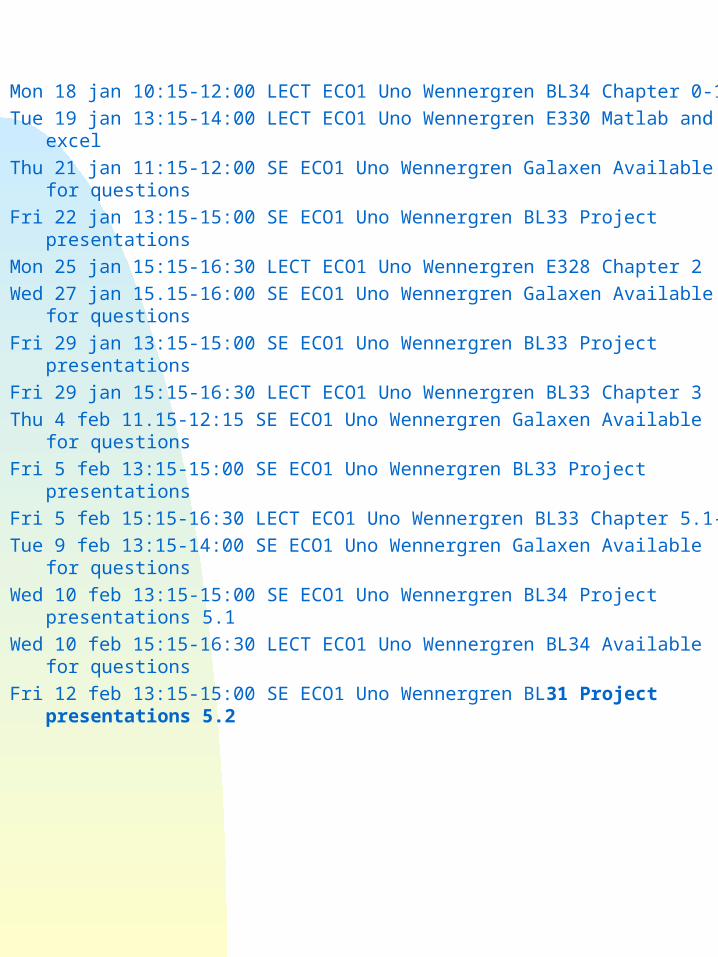
Mon 18 jan 10:15-12:00 LECT ECO1 Uno Wennergren BL34 Chapter 0-1
Tue 19 jan 13:15-14:00 LECT ECO1 Uno Wennergren E330 Matlab and excel
Thu 21 jan 11:15-12:00 SE ECO1 Uno Wennergren Galaxen Available for questions
Fri 22 jan 13:15-15:00 SE ECO1 Uno Wennergren BL33 Project presentations
Mon 25 jan 15:15-16:30 LECT ECO1 Uno Wennergren E328 Chapter 2
Wed 27 jan 15.15-16:00 SE ECO1 Uno Wennergren Galaxen Available for questions
Fri 29 jan 13:15-15:00 SE ECO1 Uno Wennergren BL33 Project presentations
Fri 29 jan 15:15-16:30 LECT ECO1 Uno Wennergren BL33 Chapter 3
Thu 4 feb 11.15-12:15 SE ECO1 Uno Wennergren Galaxen Available for questions
Fri 5 feb 13:15-15:00 SE ECO1 Uno Wennergren BL33 Project presentations
Fri 5 feb 15:15-16:30 LECT ECO1 Uno Wennergren BL33 Chapter 5.1-2
Tue 9 feb 13:15-14:00 SE ECO1 Uno Wennergren Galaxen Available for questions
Wed 10 feb 13:15-15:00 SE ECO1 Uno Wennergren BL34 Project presentations 5.1
Wed 10 feb 15:15-16:30 LECT ECO1 Uno Wennergren BL34 Available for questions
Fri 12 feb 13:15-15:00 SE ECO1 Uno Wennergren BL31 Project presentations 5.2
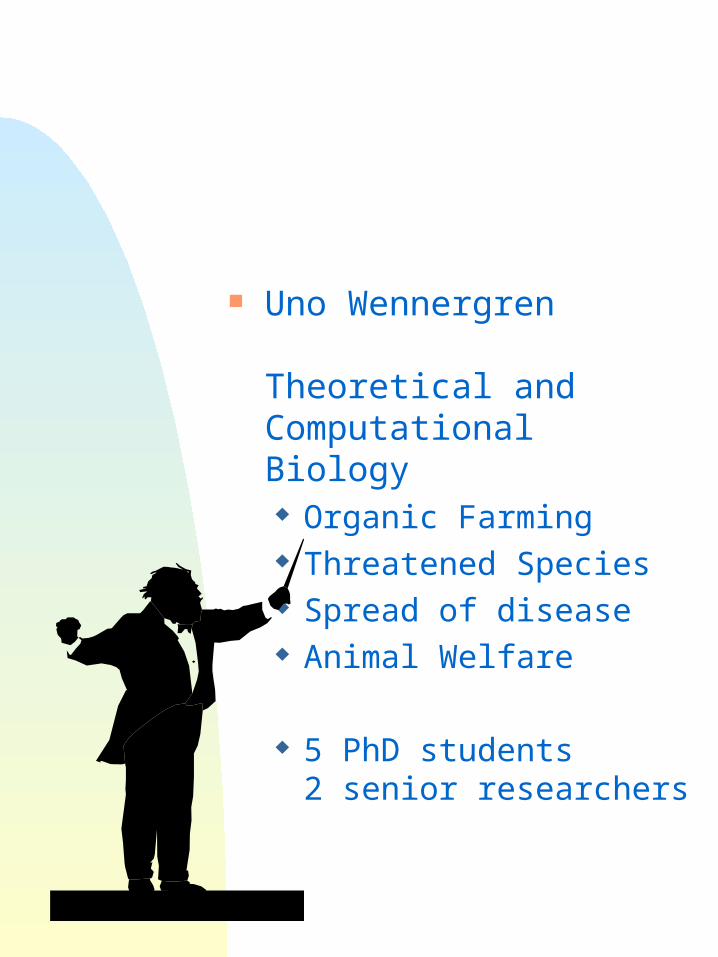
Uno Wennergren
Theoretical and Computational Biology Organic Farming Threatened Species Spread of disease Animal Welfare
5 PhD students2 senior researchers
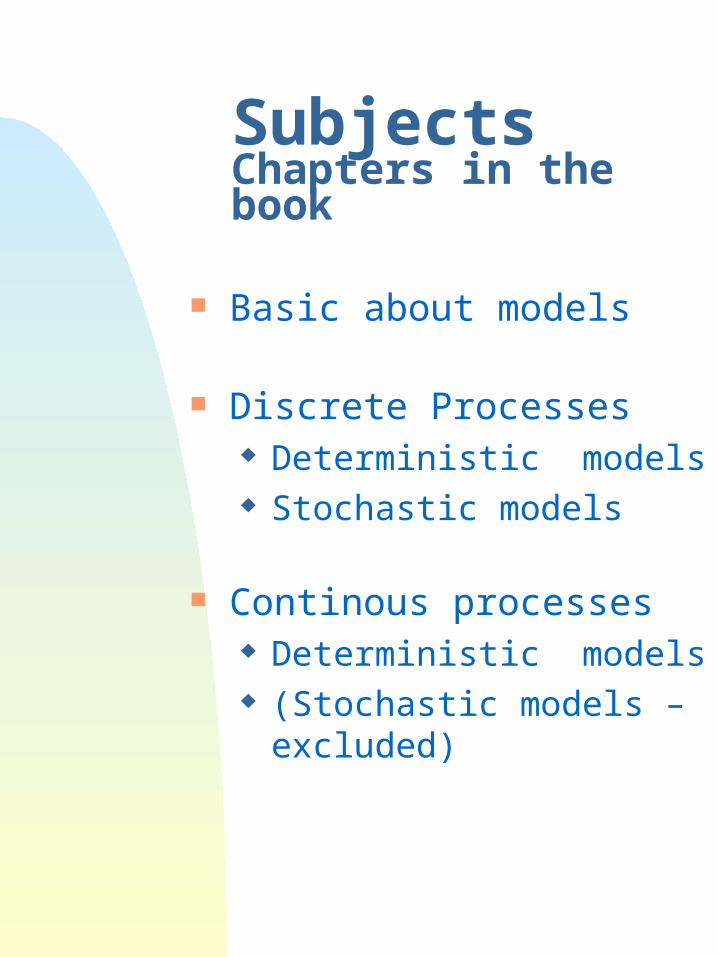
SubjectsChapters in the book
Basic about models
Discrete Processes Deterministic models Stochastic models
Continous processes Deterministic models (Stochastic models –
excluded)
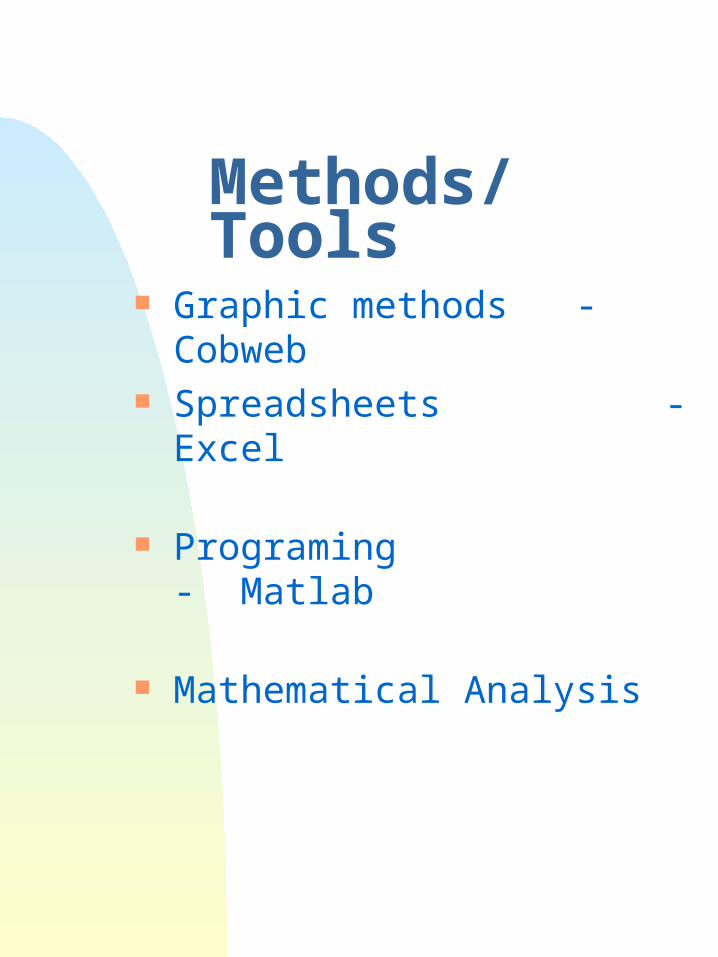
Methods/Tools Graphic methods -
Cobweb Spreadsheets - Excel
Programing - Matlab
Mathematical Analysis

Methods/Tools
Planning PowerPoint Excel Oral presentations
Computer-OH projector
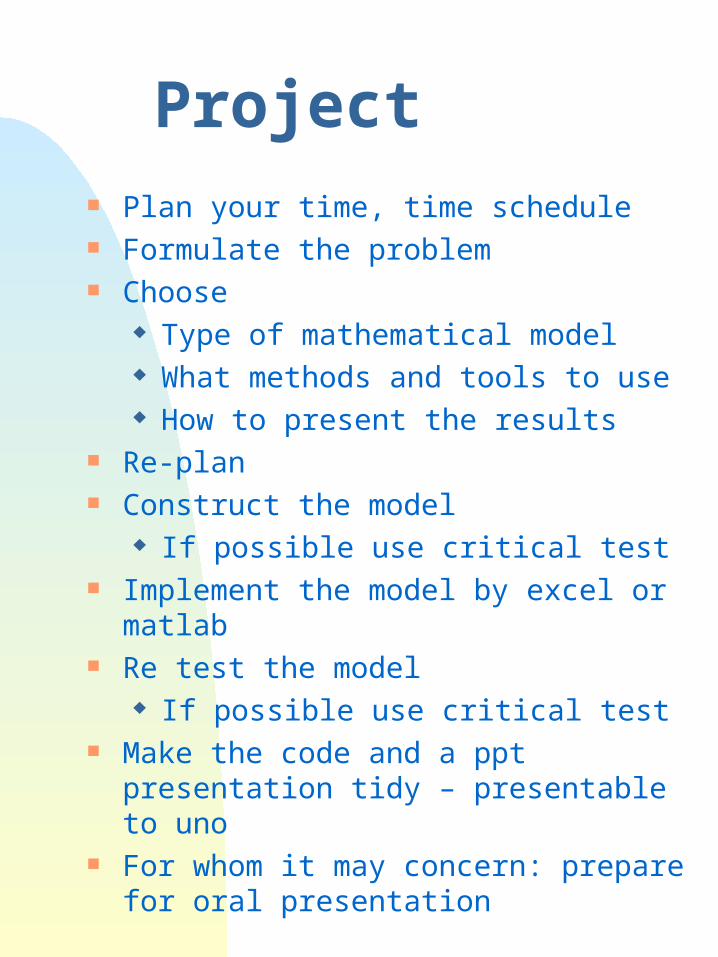
Project Plan your time, time schedule Formulate the problem Choose
Type of mathematical model What methods and tools to use How to present the results
Re-plan Construct the model
If possible use critical test Implement the model by excel or matlab Re test the model
If possible use critical test Make the code and a ppt presentation
tidy – presentable to uno For whom it may concern: prepare for
oral presentation
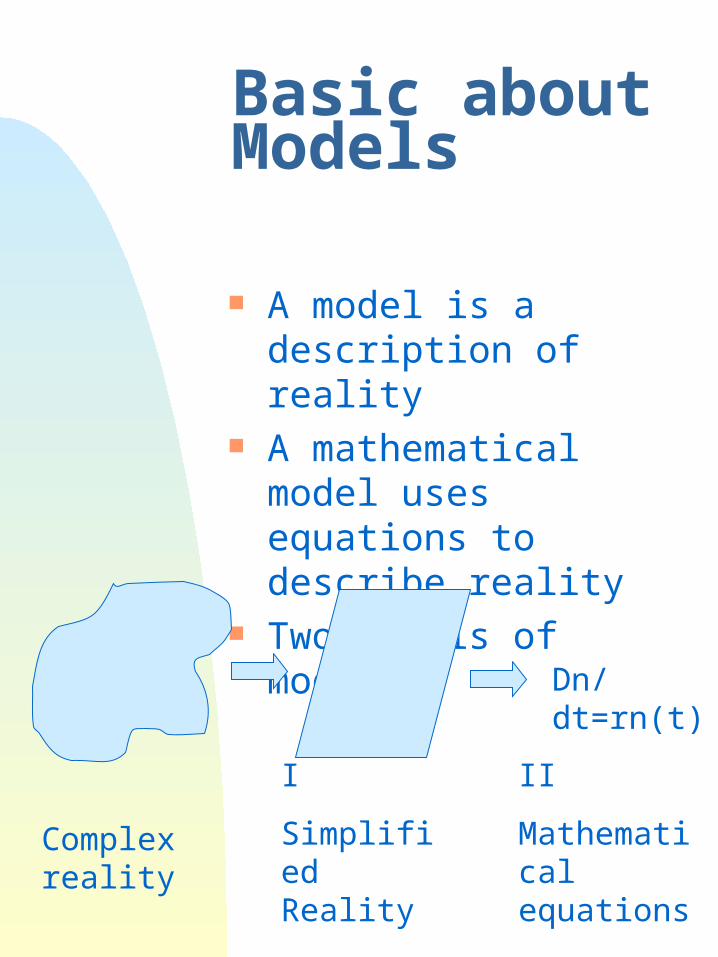
Basic about Models
A model is a description of reality
A mathematical model uses equations to describe reality
Two levels of modeling
Dn/dt=rn(t)
Complex reality
I
Simplified Reality
II
Mathematical equations
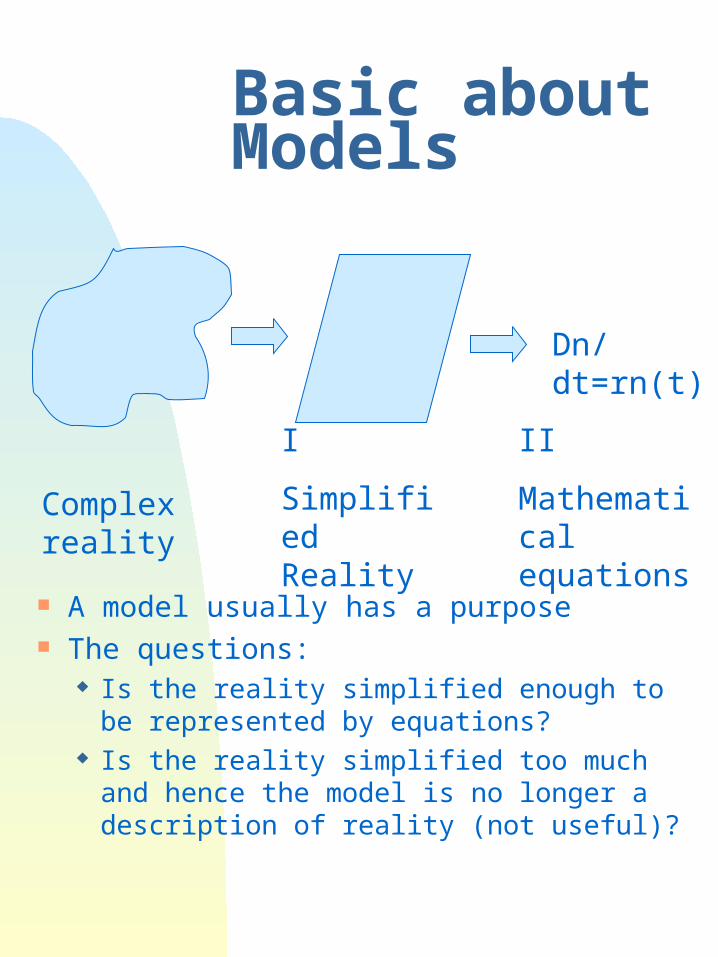
Basic about Models
A model usually has a purpose The questions:
Is the reality simplified enough to be represented by equations?
Is the reality simplified too much and hence the model is no longer a description of reality (not useful)?
Dn/dt=rn(t)
Complex reality
I
Simplified Reality
II
Mathematical equations
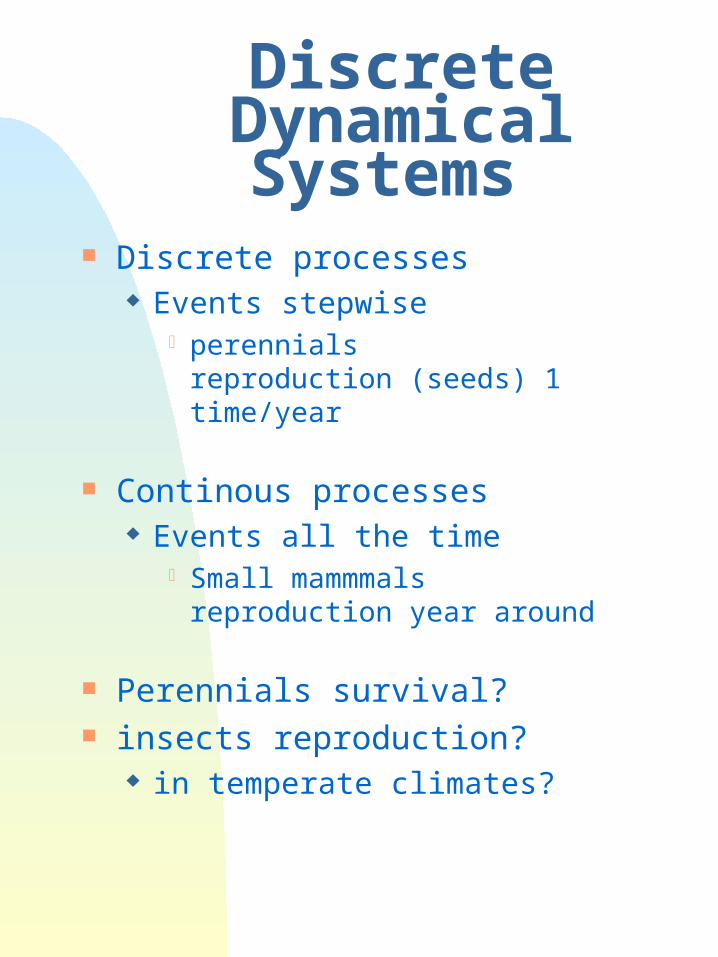
Discrete Dynamical Systems
Discrete processes Events stepwise
perennialsreproduction (seeds) 1 time/year
Continous processes Events all the time
Small mammmalsreproduction year around
Perennials survival? insects reproduction?
in temperate climates?
Deterministic models
Models don’t include variation/chance probability. Parameters are constant
All process are the same (within a specific model) and simply a specific chain of events.
The result is deterministic: one value
Stochastic models include variation/chance probability
The result is a set of values Every test generates a new chain of
events with its specific result
Recurrence equations
The equation generates a sequence of numbers
The equation calculates a number by using some of the previous number.
Example: How many were infected previously determines how many will be infected right now. Which in its turn…..
Note: specific step lengths
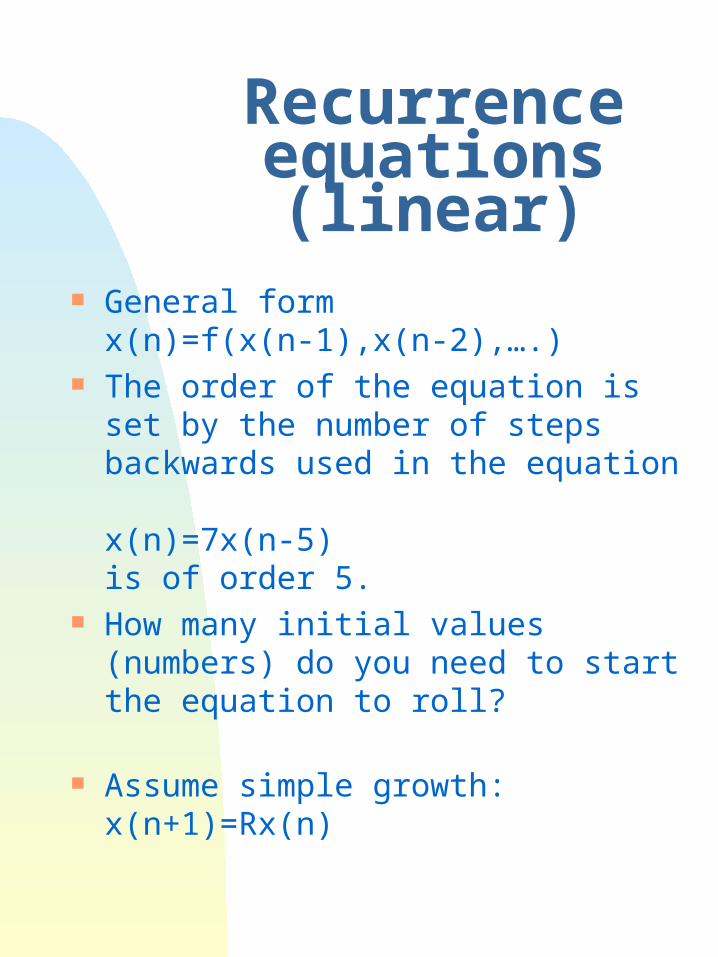
Recurrence equations
(linear) General form
x(n)=f(x(n-1),x(n-2),….) The order of the equation is set by
the number of steps backwards used in the equation x(n)=7x(n-5)is of order 5.
How many initial values (numbers) do you need to start the equation to roll?
Assume simple growth:x(n+1)=Rx(n)
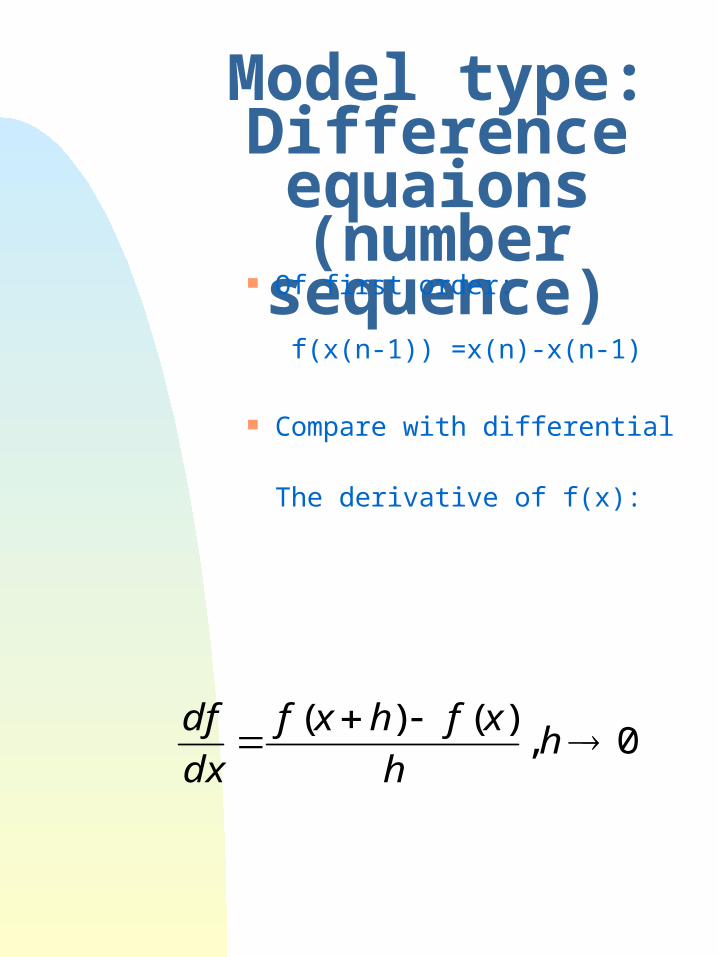
Model type:Difference equaions(number sequence)
Of first order:
f(x(n-1)) =x(n)-x(n-1)
Compare with differential
The derivative of f(x):
0,)()(
hh
xfhxf
dx
df
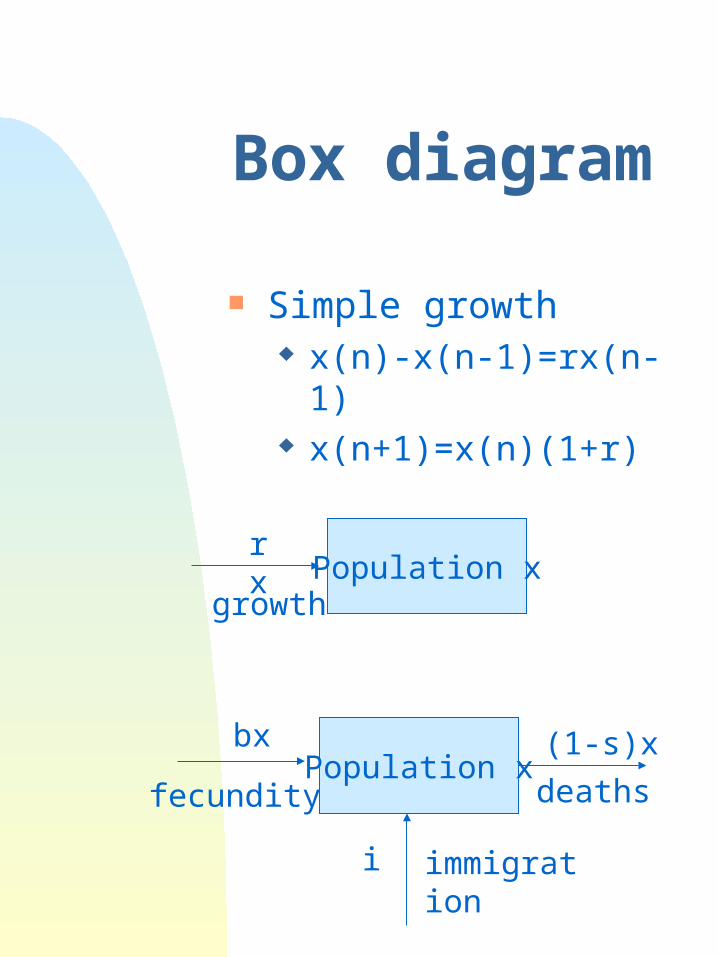
Box diagram
Simple growth x(n)-x(n-1)=rx(n-1) x(n+1)=x(n)(1+r)
Population xrx
growth
Population xbx
fecundity
(1-s)x
deaths
i immigration
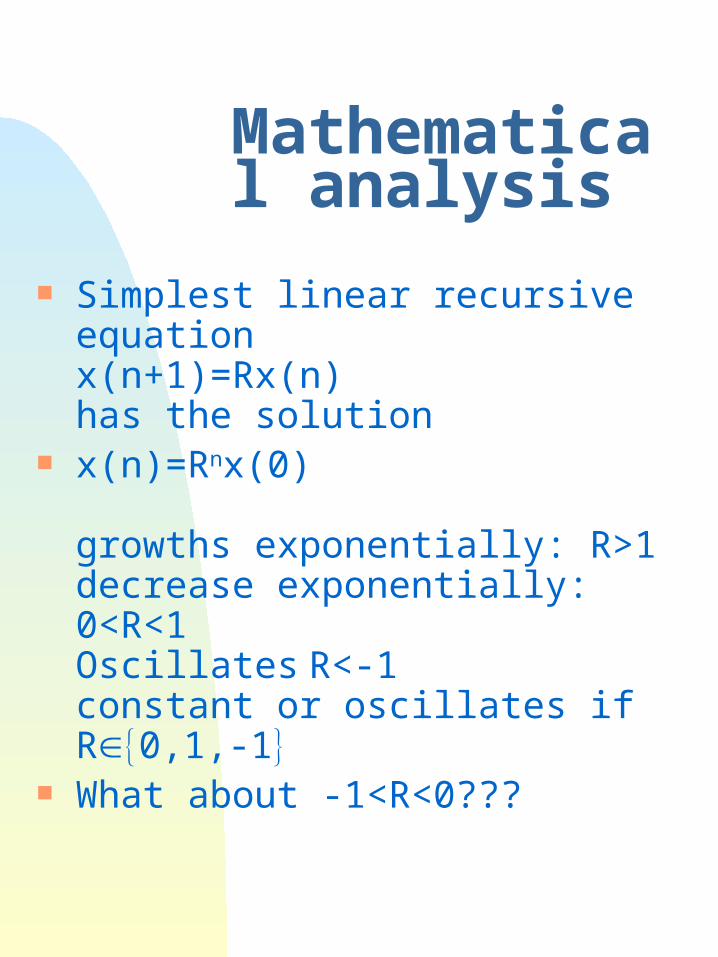
Mathematical analysis
Simplest linear recursive equationx(n+1)=Rx(n)has the solution
x(n)=Rnx(0)
growths exponentially: R>1decrease exponentially: 0<R<1Oscillates R<-1constant or oscillates if R0,1,-1
What about -1<R<0???
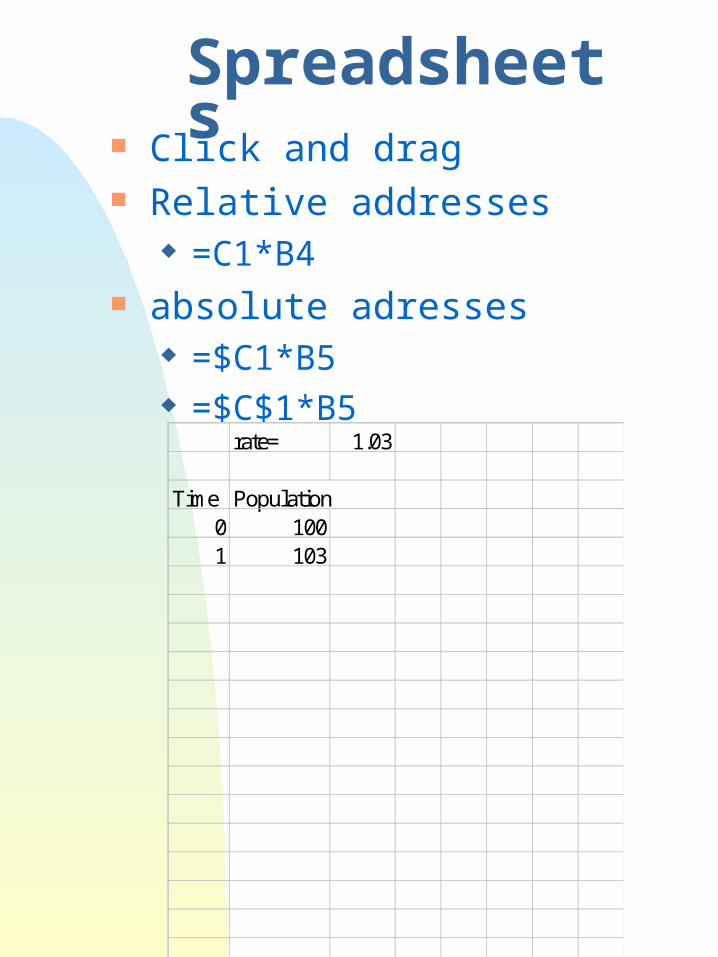
Spreadsheets Click and drag Relative addresses
=C1*B4 absolute adresses
=$C1*B5 =$C$1*B5
rate= 1.03
Time Population0 1001 103
Matematical analysis
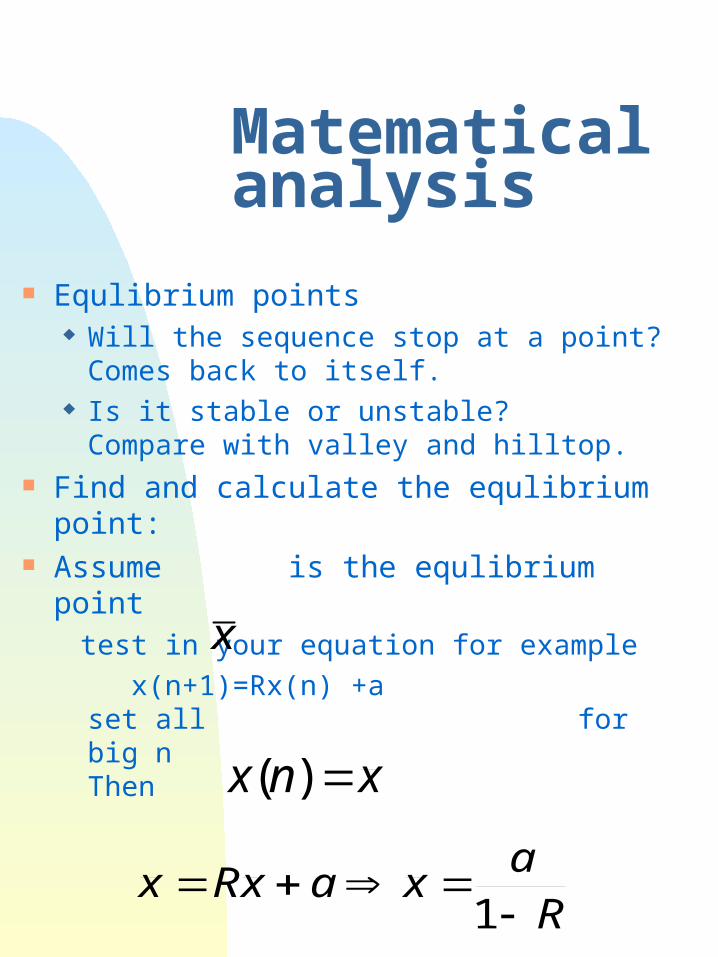
Equlibrium points Will the sequence stop at a point?
Comes back to itself. Is it stable or unstable?
Compare with valley and hilltop. Find and calculate the equlibrium
point: Assume is the equlibrium point
test in your equation for example
x(n+1)=Rx(n) +aset all for big nThen
xnx )(
Ra
xaxRx
1
x
Matematical analysis
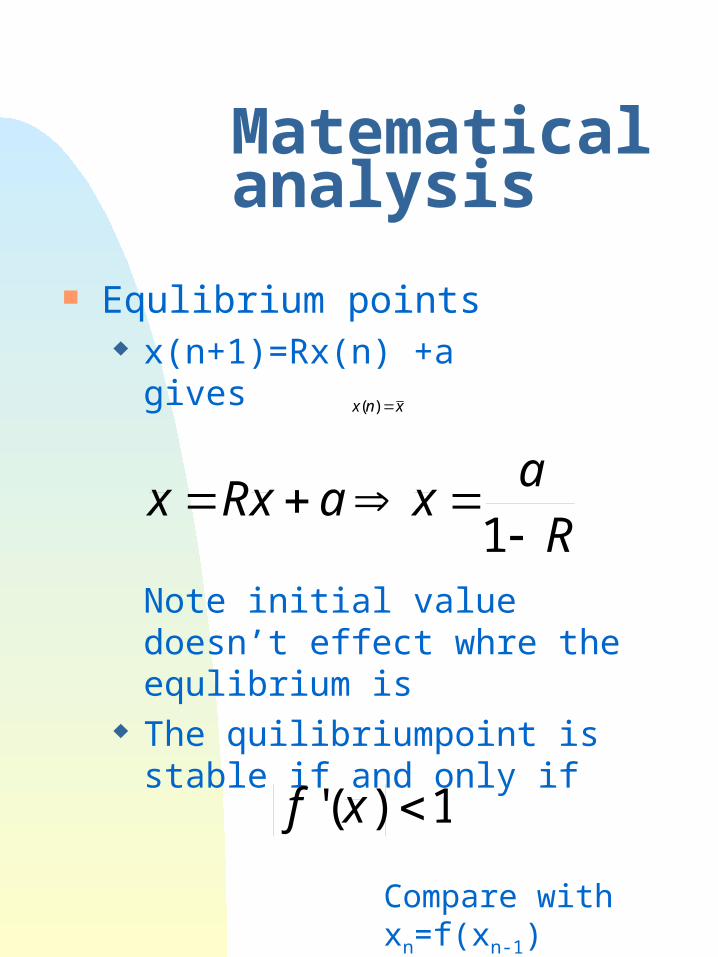
Equlibrium points x(n+1)=Rx(n) +a
gives
Note initial value doesn’t effect whre the equlibrium is
The quilibriumpoint is stable if and only if
xnx )(
Ra
xaxRx
1
1)(' xf
Compare with xn=f(xn-1)
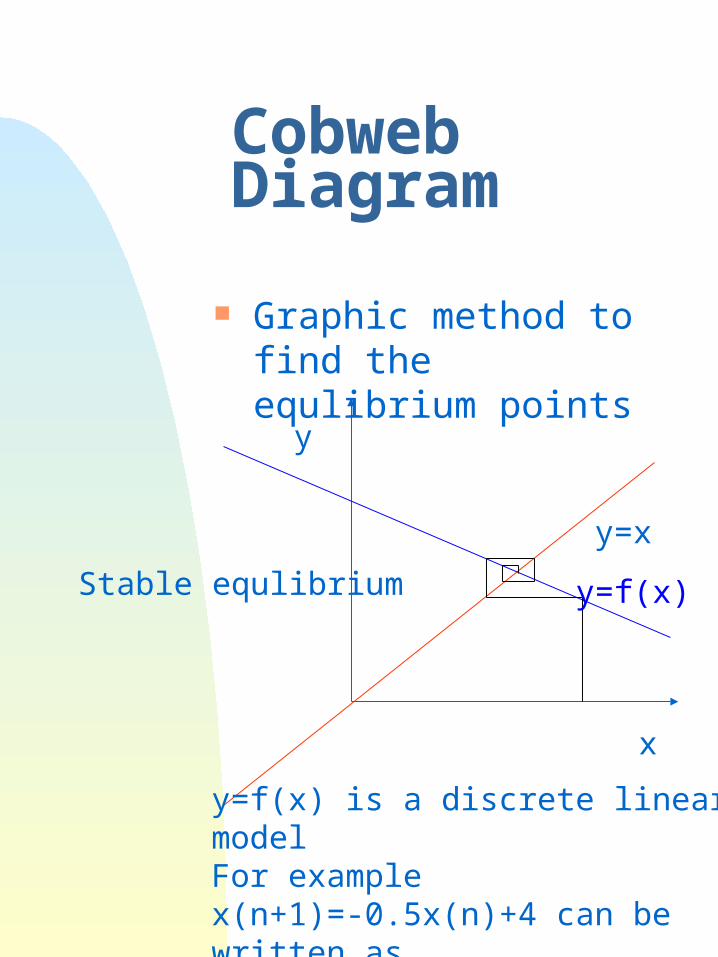
Cobweb Diagram
Graphic method to find the equlibrium points
y=x
y
x
y=f(x)Stable equlibrium
y=f(x) is a discrete linear modelFor examplex(n+1)=-0.5x(n)+4 can be written asy=-0.5x+4
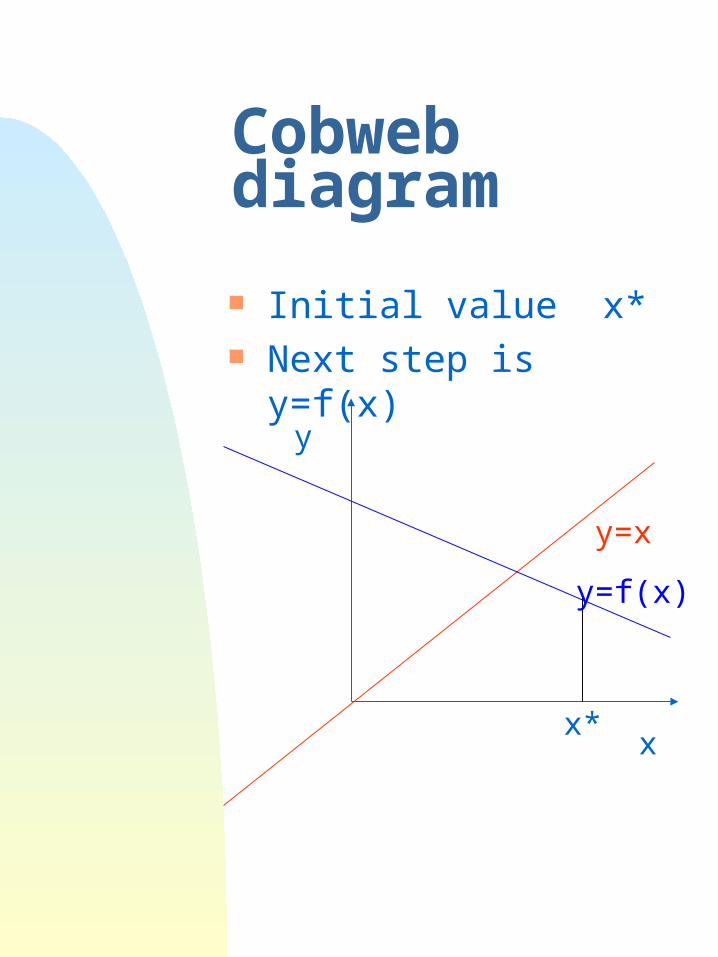
Cobweb diagram
Initial value x* Next step is y=f(x)
y=x
y
xx*
y=f(x)
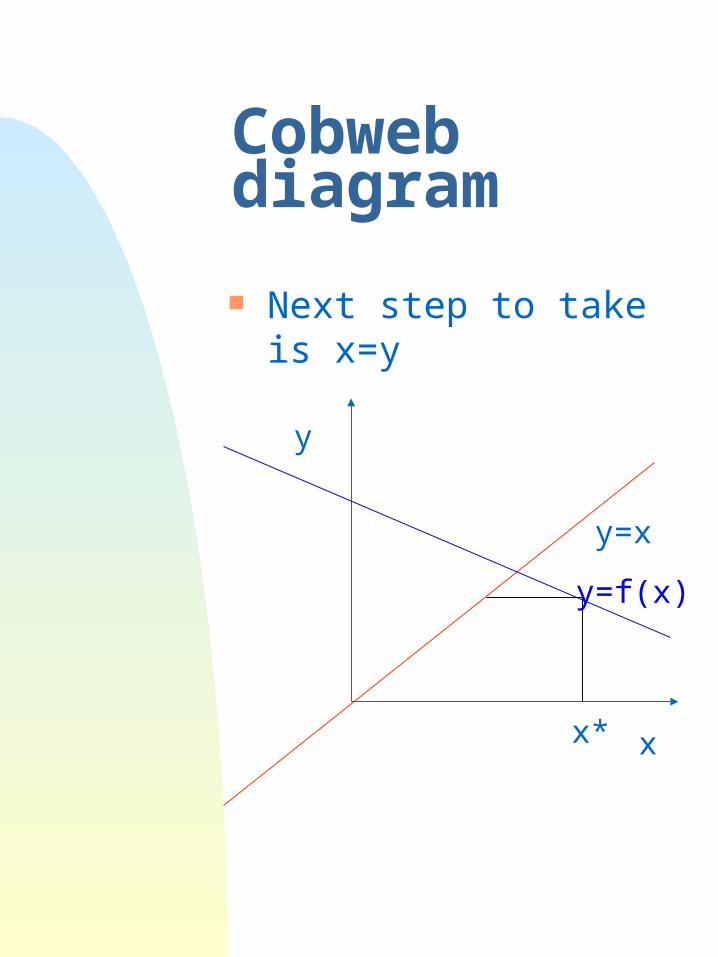
Cobweb diagram
Next step to take is x=y
y=x
y
x
y=f(x)
x*
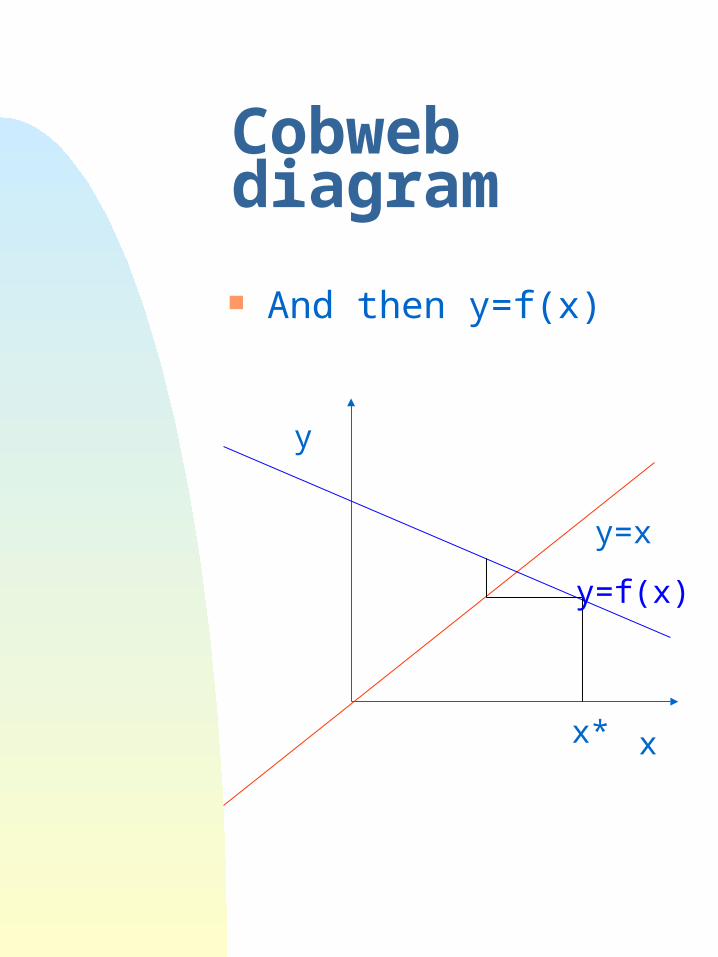
Cobweb diagram
And then y=f(x)
y=x
y
x
y=f(x)
x*
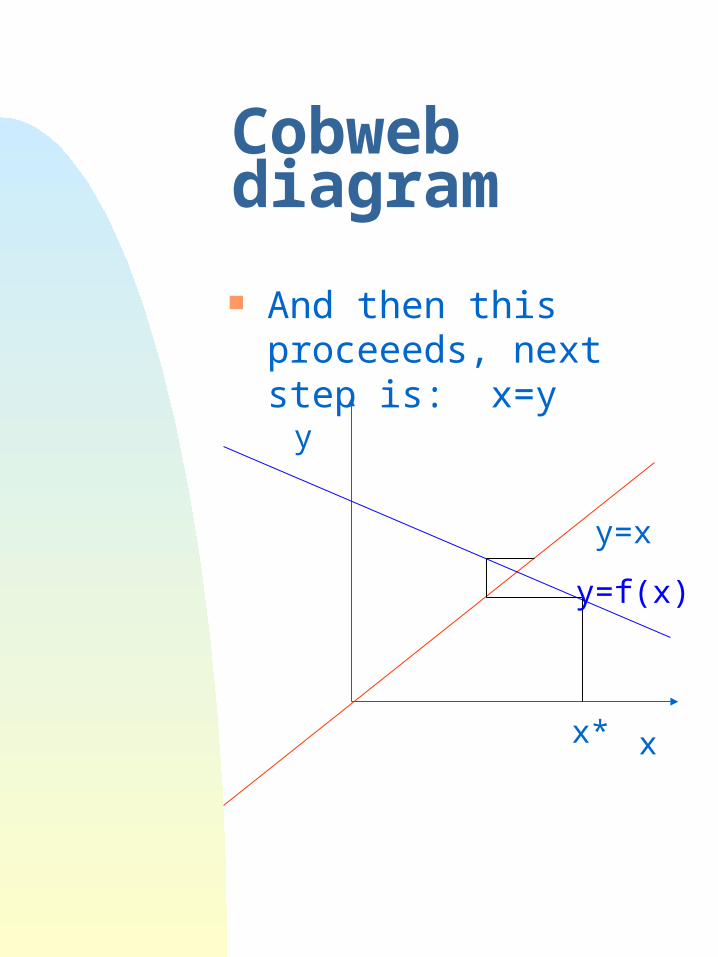
Cobweb diagram
And then this proceeeds, next step is: x=y
y=x
y
x
y=f(x)
x*
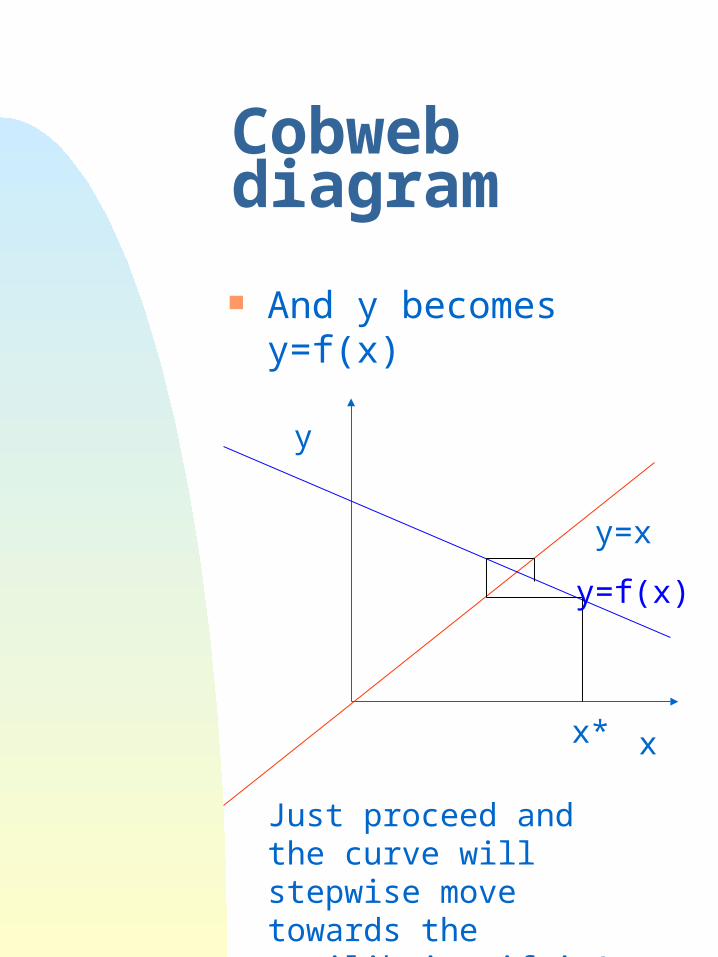
Cobweb diagram
And y becomes y=f(x)
y=x
y
x
y=f(x)
x*
Just proceed and the curve will stepwise move towards the equilibrium if it’s a stable one
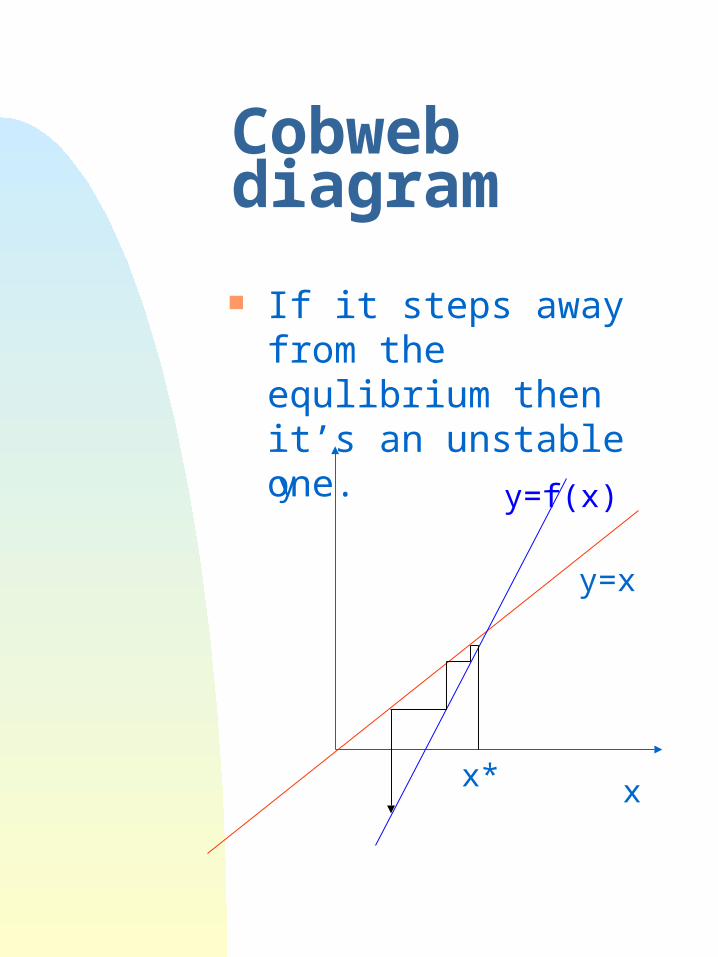
Cobweb diagram
If it steps away from the equlibrium then it’s an unstable one.
y=x
y
x
y=f(x)
x*
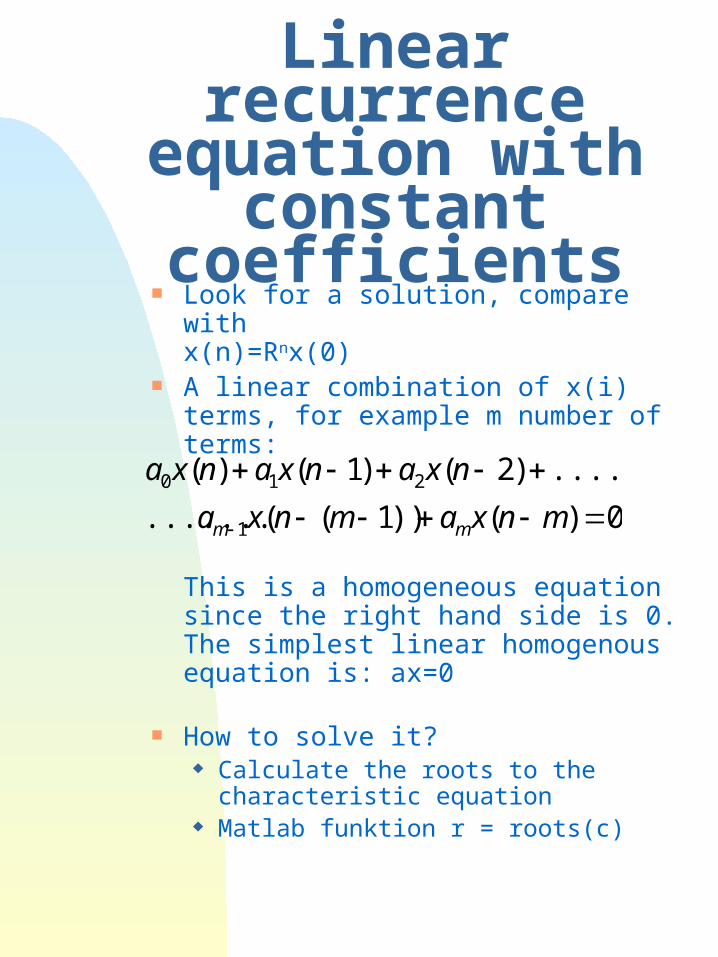
Linear recurrence equation with
constant coefficients Look for a solution, compare with
x(n)=Rnx(0) A linear combination of x(i) terms,
for example m number of terms:
This is a homogeneous equation since the right hand side is 0. The simplest linear homogenous equation is: ax=0
How to solve it? Calculate the roots to the
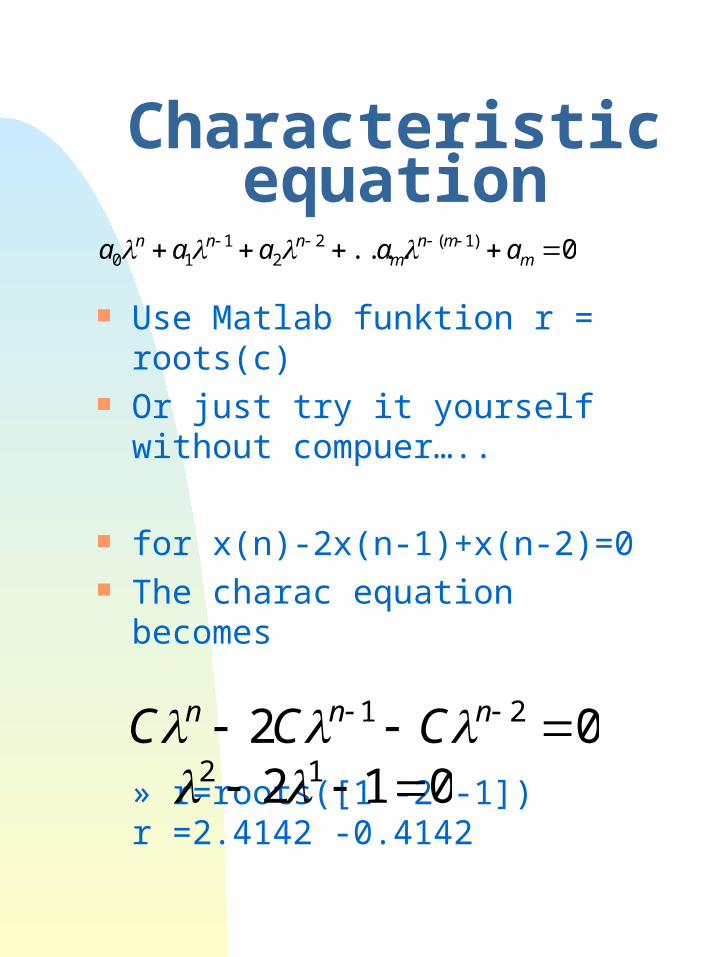
characteristic equation Matlab funktion r = roots(c)
0)())1((.......
....)2()1()(
1
210
mnxamnxa
nxanxanxa
mm
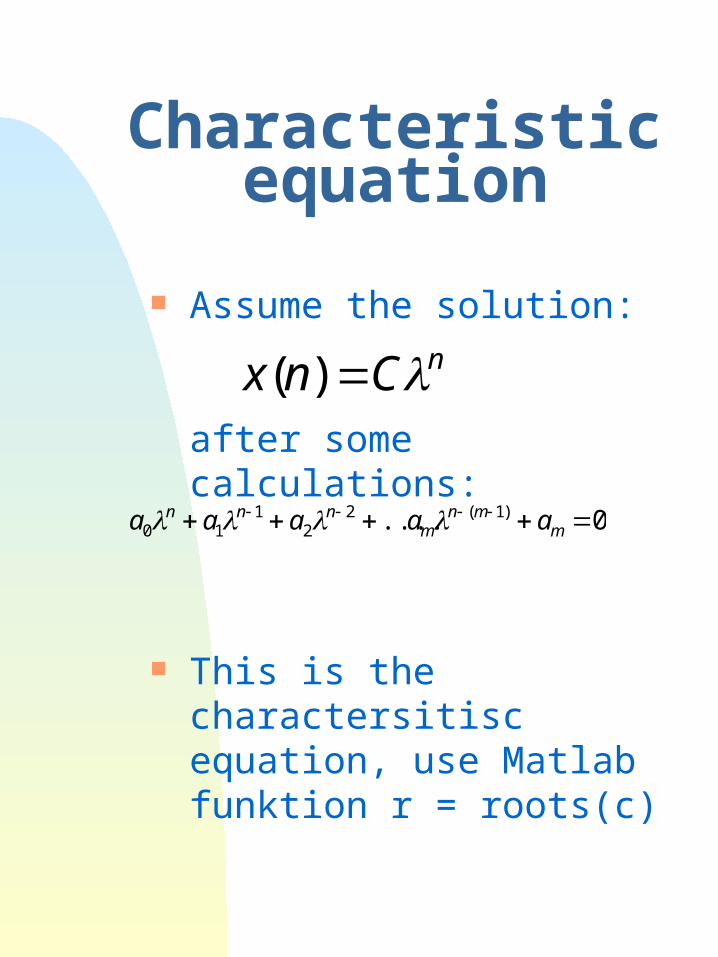
Characteristic equation
Assume the solution:
after some calculations:
This is the charactersitisc equation, use Matlab funktion r = roots(c)
nCnx )(
0.... )1(22
110
mmn
mnnn aaaaa
Characteristic equation
Use Matlab funktion r = roots(c) Or just try it yourself without
compuer…..
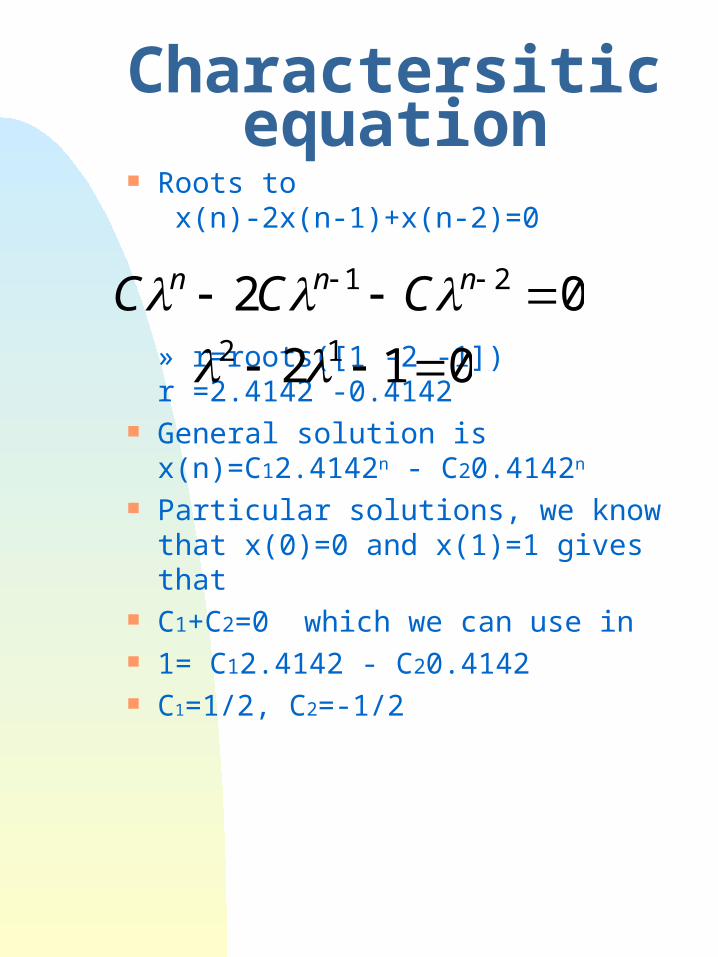
for x(n)-2x(n-1)+x(n-2)=0 The charac equation becomes
» r=roots([1 -2 -1])r =2.4142 -0.4142
0.... )1(22
110
mmn
mnnn aaaaa
02 21 nnn CCC 012 12
Charactersitic equation
Roots to x(n)-2x(n-1)+x(n-2)=0
» r=roots([1 -2 -1])r =2.4142 -0.4142
General solution isx(n)=C12.4142n - C20.4142n
Particular solutions, we know that x(0)=0 and x(1)=1 gives that
C1+C2=0 which we can use in 1= C12.4142 - C20.4142 C1=1/2, C2=-1/2
02 21 nnn CCC 012 12
Charactersitic equation
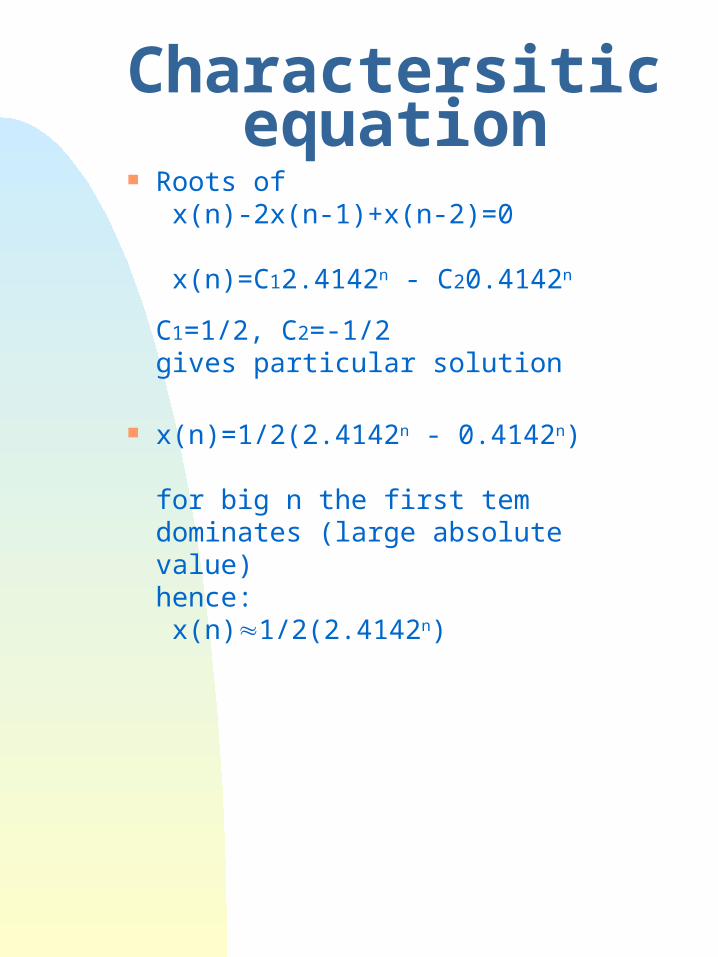
Roots of x(n)-2x(n-1)+x(n-2)=0
x(n)=C12.4142n - C20.4142n
C1=1/2, C2=-1/2gives particular solution
x(n)=1/2(2.4142n - 0.4142n)
for big n the first tem dominates (large absolute value)hence: x(n)1/2(2.4142n)
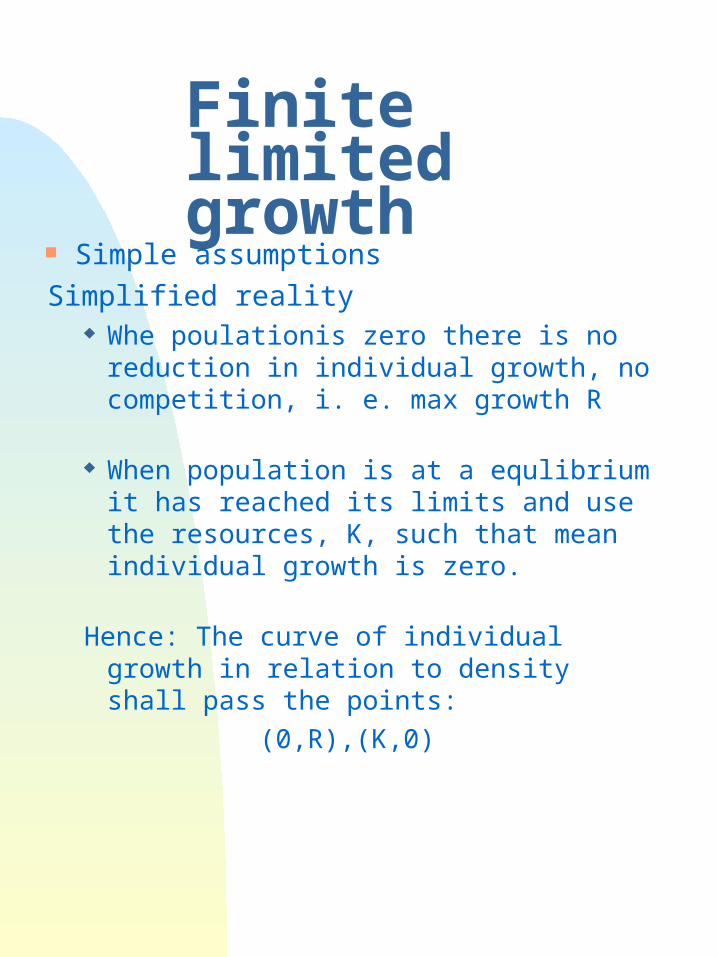
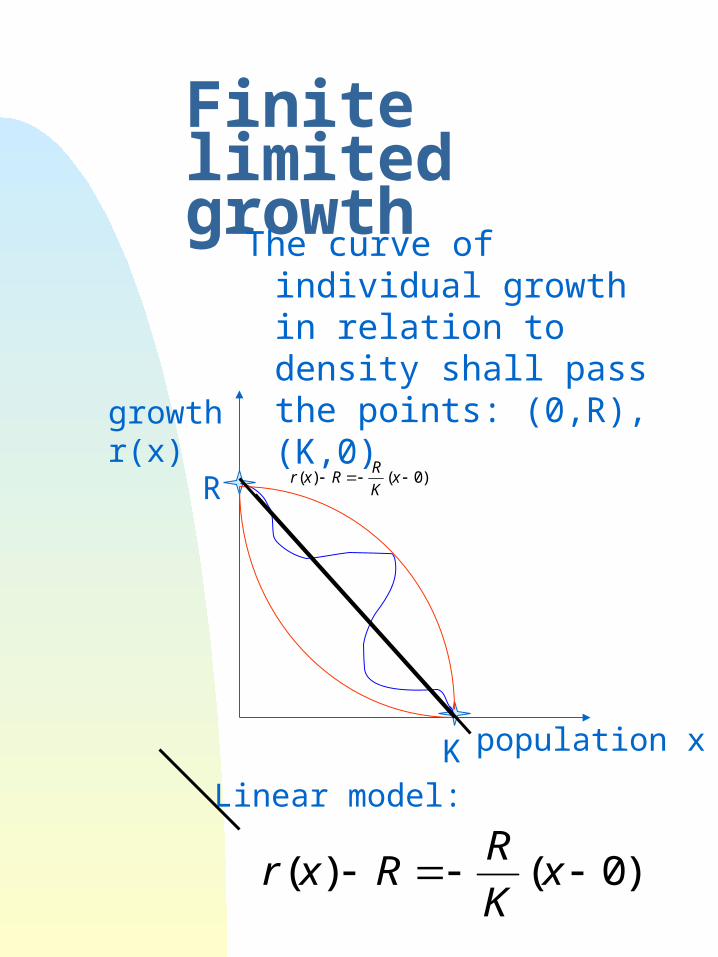
Finite limited growth
Simple assumptions
Simplified reality Whe poulationis zero there is no
reduction in individual growth, no competition, i. e. max growth R
When population is at a equlibrium it has reached its limits and use the resources, K, such that mean individual growth is zero.
Hence: The curve of individual growth in relation to density shall pass the points:
(0,R),(K,0)
Finite limited growth
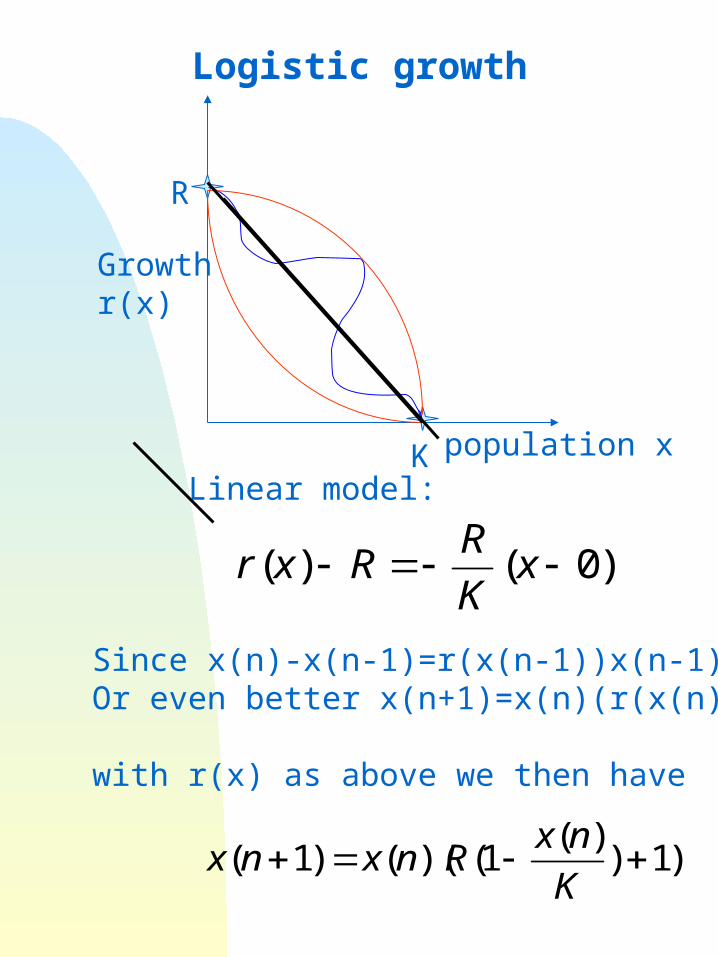
The curve of individual growth in relation to density shall pass the points: (0,R),(K,0)
growthr(x)
population xK
R
Linear model:
)0()( xK
RRxr
)0()( xK
RRxr
Growthr(x)
population xK
R
Linear model:
)0()( xK
RRxr
Since x(n)-x(n-1)=r(x(n-1))x(n-1)Or even better x(n+1)=x(n)(r(x(n))+1)
with r(x) as above we then have
)1))(
1()(()1( K
nxRnxnx
Logistic growth
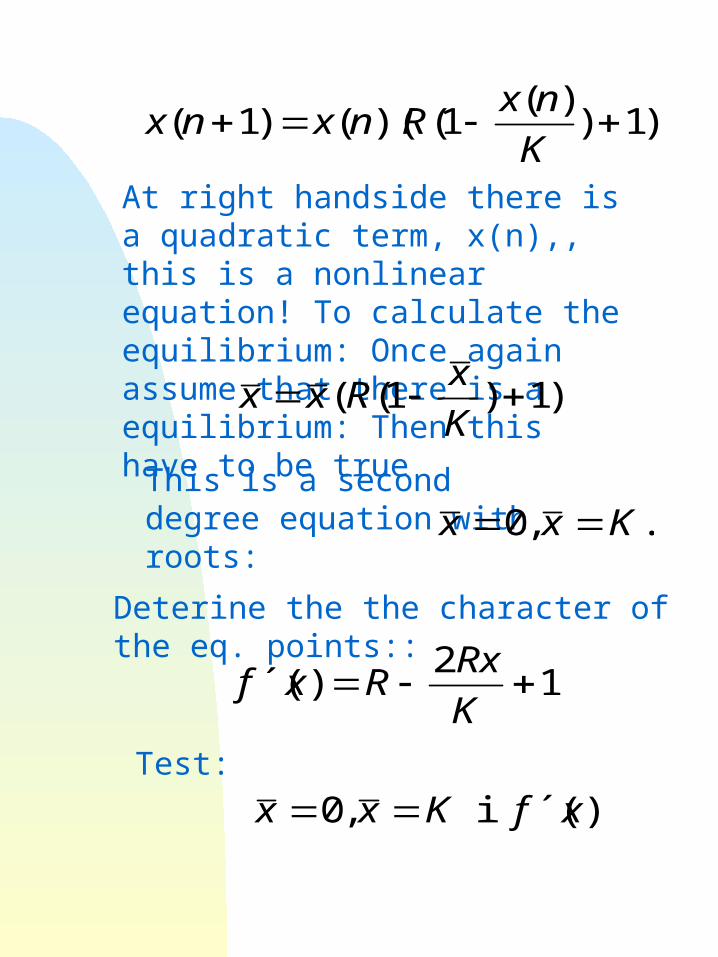
)1))(
1()(()1( K
nxRnxnx
At right handside there is a quadratic term, x(n),, this is a nonlinear equation! To calculate the equilibrium: Once again assume that there is a equilibrium: Then this have to be true
)1)1(( K
xRxx
This is a second degree equation with roots: .,0 Kxx
Deterine the the character of the eq. points::
12
)´( K
RxRxf
Test:
)´( i ,0 xfKxx
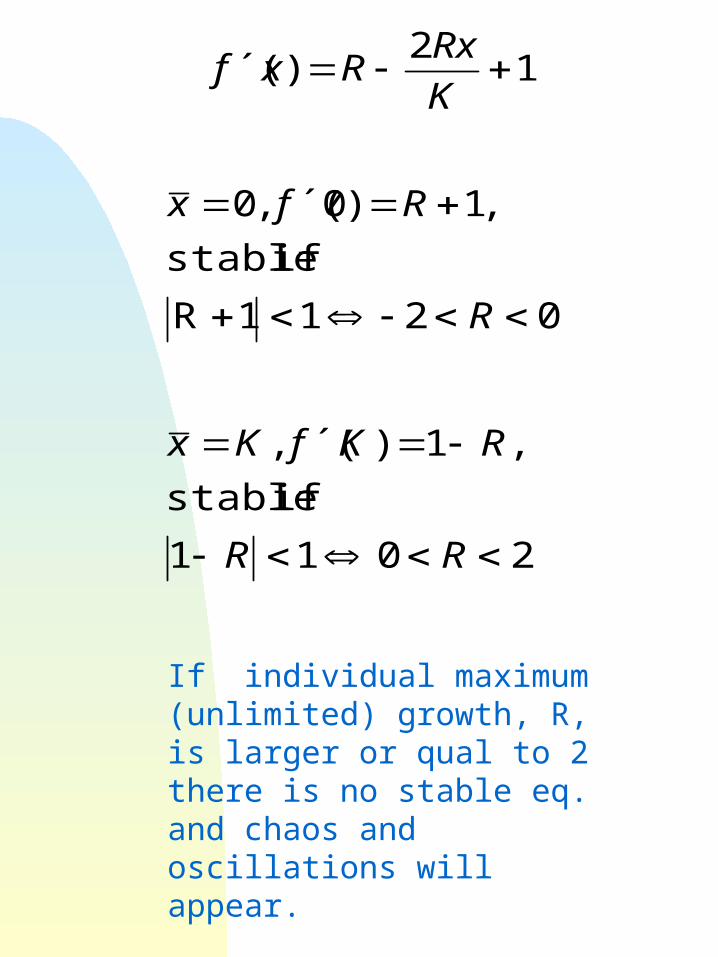
0211R
if stable
,1)0´(,0
R
Rfx
12
)´( K
RxRxf
2011
if stable
,1)´(,
RR
RKfKx
If individual maximum (unlimited) growth, R, is larger or qual to 2 there is no stable eq. and chaos and oscillations will appear.
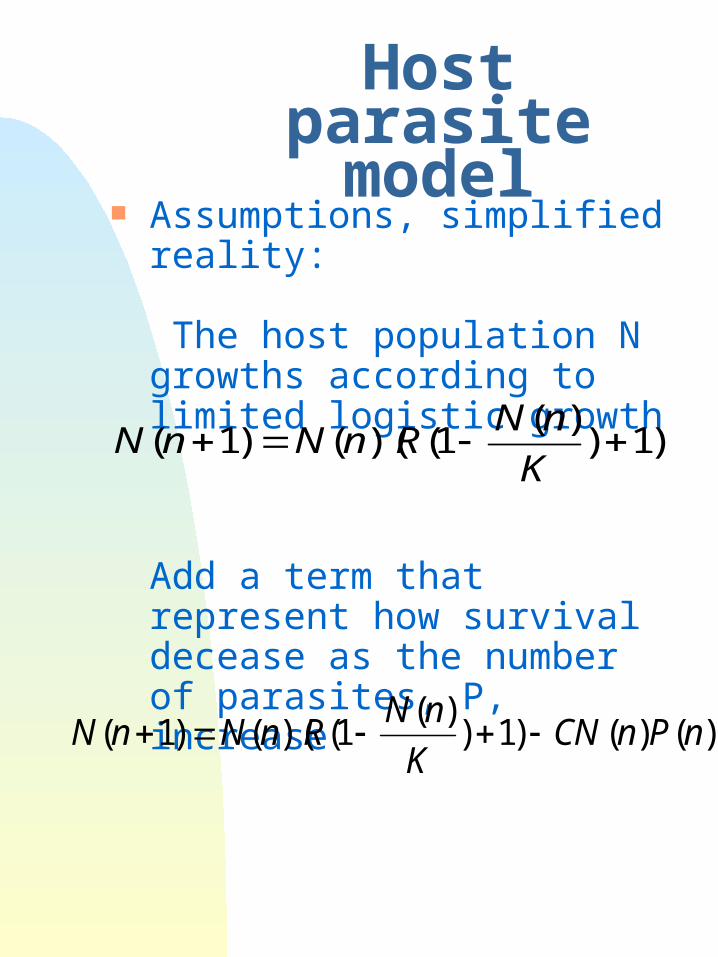
Host parasite model
Assumptions, simplified reality:
The host population N growths according to limited logistic growth
Add a term that represent how survival decease as the number of parasites, P, increase
)1))(
1()(()1( K
nNRnNnN
)()()1))(
1()(()1( nPnCNK
nNRnNnN
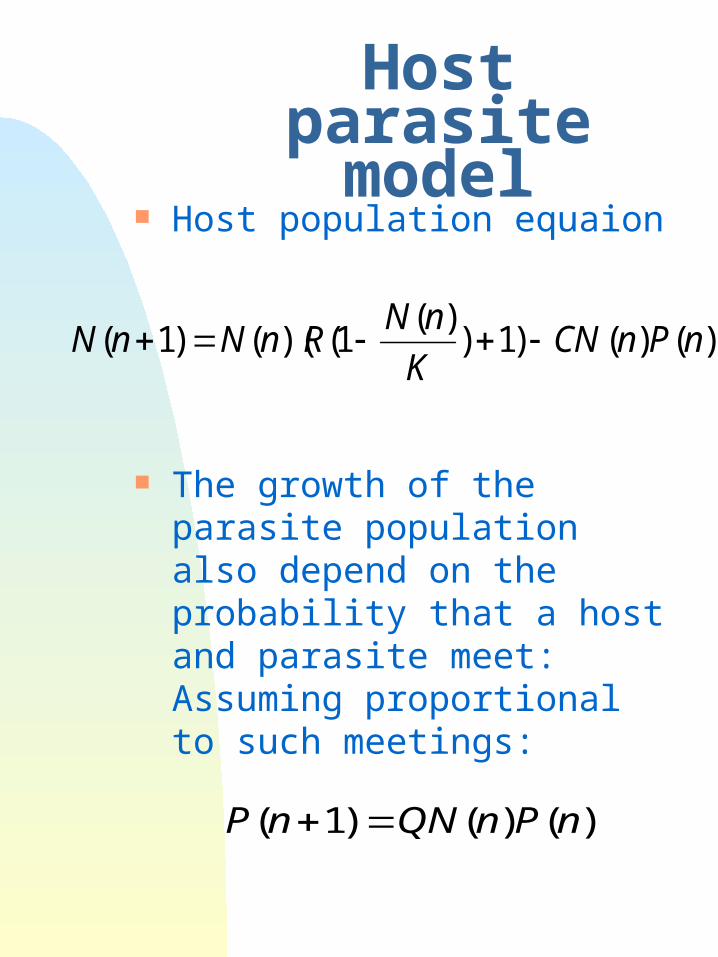
Host parasite model
Host population equaion
The growth of the parasite population also depend on the probability that a host and parasite meet: Assuming proportional to such meetings:
)()()1( nPnQNnP
)()()1))(
1()(()1( nPnCNK
nNRnNnN
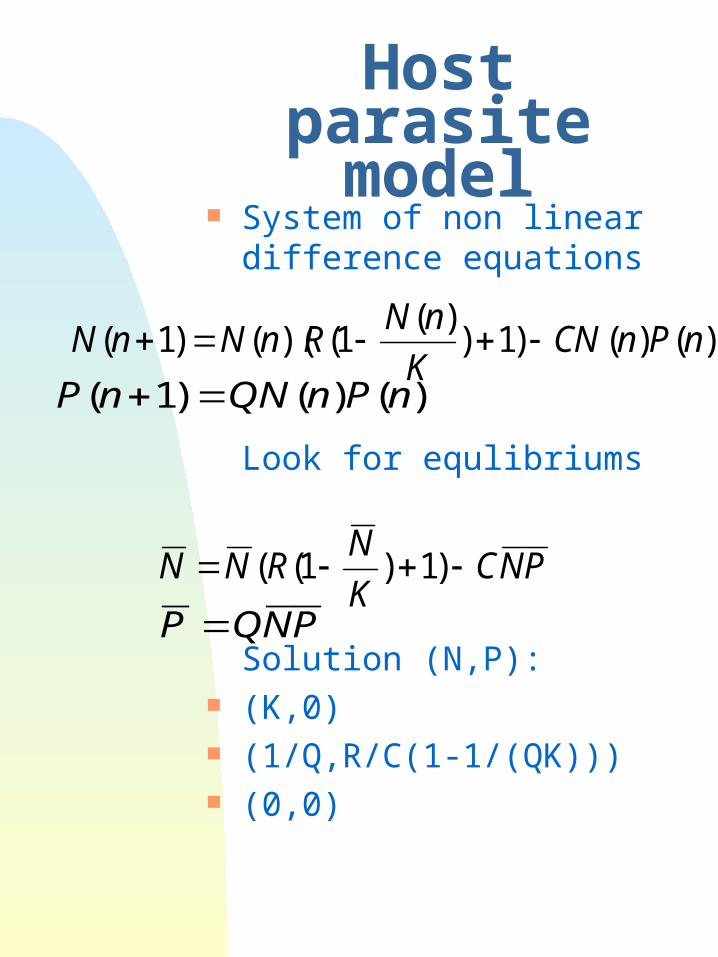
Host parasite model
System of non linear difference equations
Look for equlibriums
Solution (N,P): (K,0) (1/Q,R/C(1-1/(QK))) (0,0)
)()()1( nPnQNnP )()()1)
)(1()(()1( nPnCN
K
nNRnNnN
PNCK
NRNN )1)1((
PNQP
Kunskapstaxonomi fritt efter Benjamin Bloom
Fakta. Ange, räkna upp fakta, definiera begrepp.
Enkel begränsad kunskap. Beskrivning. Innebörden av begrepp och fakta.
Tolka, motivera, relatera till varandra. Tillämpning. Vad är innehållet användbart till.
Observera, beräkna, kalkylera, formulera, konstruera, lösa givna problem.
Analys. Bryta ner innehållet, dela upp, gruppera om, jämföra, generalisera se nya problem.
Syntes. Dra slutsatser, formulera regler, se samband också med annan kunskap, resonera, diskutera, skapa nytt.
Värdering. Avge omdömen, kritisera, värdera olika kunskap, hypoteser och teorier mot varandra.
Komplex, vidsträckt kunskap.
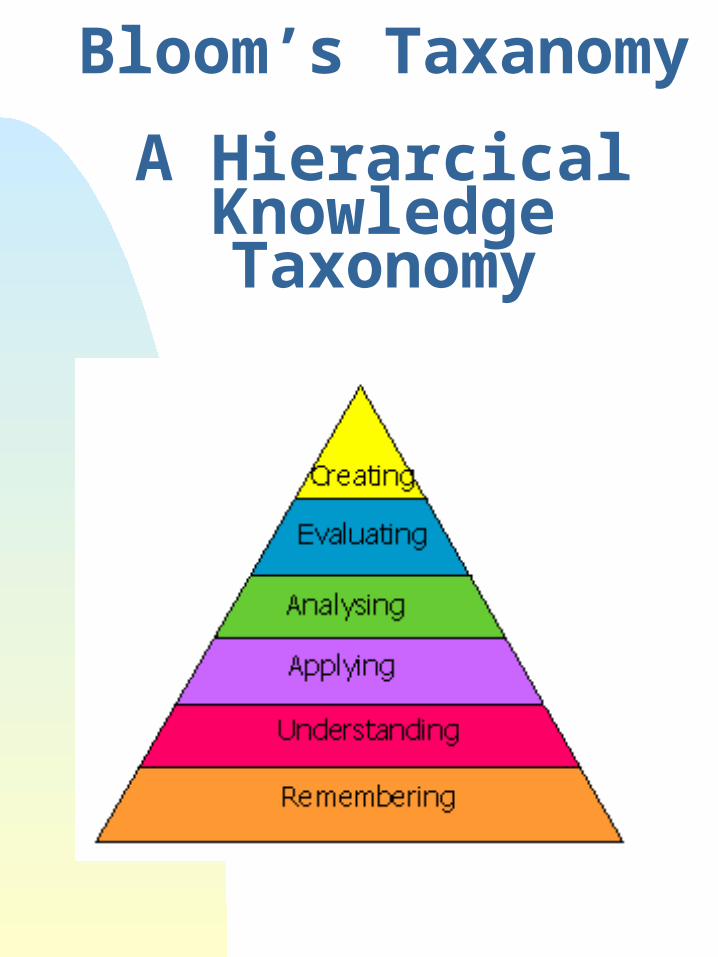
Bloom’s Taxanomy
A Hierarcical Knowledge Taxonomy
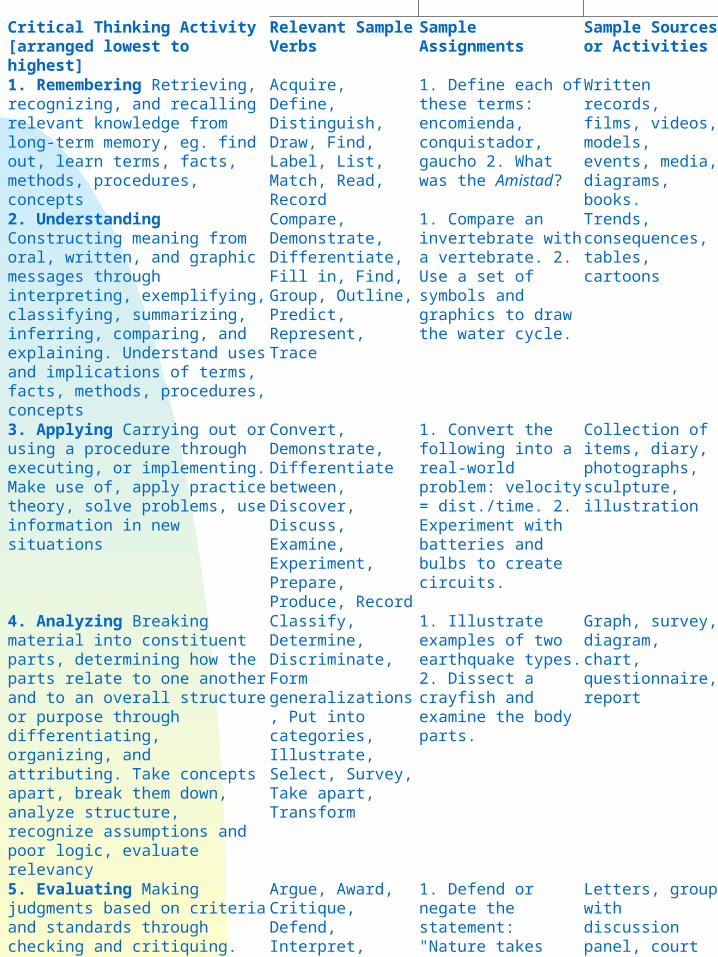
Critical Thinking Activity [arranged lowest to highest]
Relevant Sample Verbs
Sample Assignments Sample Sources or Activities
1. Remembering Retrieving, recognizing, and recalling relevant knowledge from long-term memory, eg. find out, learn terms, facts, methods, procedures, concepts
Acquire, Define, Distinguish, Draw, Find, Label, List, Match, Read, Record
1. Define each of these terms: encomienda, conquistador, gaucho 2. What was the Amistad?
Written records, films, videos, models, events, media, diagrams, books.
2. Understanding Constructing meaning from oral, written, and graphic messages through interpreting, exemplifying, classifying, summarizing, inferring, comparing, and explaining. Understand uses and implications of terms, facts, methods, procedures, concepts
Compare, Demonstrate, Differentiate, Fill in, Find, Group, Outline, Predict, Represent, Trace
1. Compare an invertebrate with a vertebrate. 2. Use a set of symbols and graphics to draw the water cycle.
Trends, consequences, tables, cartoons
3. Applying Carrying out or using a procedure through executing, or implementing. Make use of, apply practice theory, solve problems, use information in new situations
Convert, Demonstrate, Differentiate between, Discover, Discuss, Examine, Experiment, Prepare, Produce, Record
1. Convert the following into a real-world problem: velocity = dist./time. 2. Experiment with batteries and bulbs to create circuits.
Collection of items, diary, photographs, sculpture, illustration
4. Analyzing Breaking material into constituent parts, determining how the parts relate to one another and to an overall structure or purpose through differentiating, organizing, and attributing. Take concepts apart, break them down, analyze structure, recognize assumptions and poor logic, evaluate relevancy
Classify, Determine, Discriminate, Form generalizations, Put into categories, Illustrate, Select, Survey, Take apart, Transform
1. Illustrate examples of two earthquake types. 2. Dissect a crayfish and examine the body parts.
Graph, survey, diagram, chart, questionnaire, report
5. Evaluating Making judgments based on criteria and standards through checking and critiquing. Set standards, judge using standards, evidence, rubrics, accept or reject on basis of criteria
Argue, Award, Critique, Defend, Interpret, Judge, Measure, Select, Test, Verify
1. Defend or negate the statement: "Nature takes care of itself." 2. Judge the value of requiring students to take earth science.
Letters, group with discussion panel, court trial, survey, self-evaluation, value, allusions
6. Creating Putting elements together to form a coherent or functional whole; reorganizing elements into a new pattern or structure through generating, planning, or producing. Put things togther; bring together various parts; write theme, present speech, plan experiment, put information together in a new & creative way
Synthesize, Arrange, Blend, Create, Deduce, Devise, Organize, Plan, Present, Rearrange, Rewrite
1. Create a demonstration to show various chemical properties. 2. Devise a method to teach others about magnetism.
Article, radio show, video, puppet show, inventions, poetry, short story