Embed Size (px)
Citation preview
This is a research publication of Eagle Research Advisory Pty Ltd ABN 33 098 051 677 as a Corporate Authorised Representative reference number 384349 of Taylor Collison Limited ABN 53 008 172 450 AFS Licence 247 083.
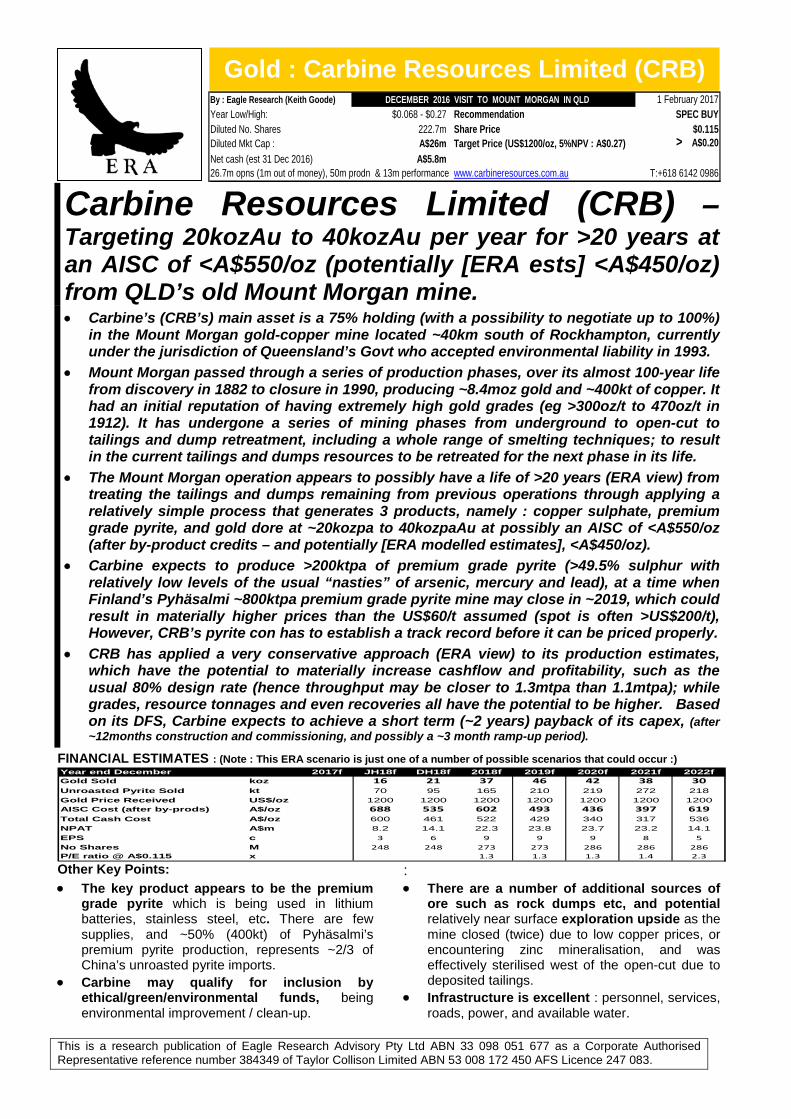
Gold : Carbine Resources Limited (CRB)
By : Eagle Research (Keith Goode) DECEMBER 2016 VISIT TO MOUNT MORGAN IN QLD 1 February 2017Year Low/High: $0.068 - $0.27 Recommendation SPEC BUYDiluted No. Shares 222.7m Share Price $0.115Diluted Mkt Cap : A$26m Target Price (US$1200/oz, 5%NPV : A$0.27) > A$0.20Net cash (est 31 Dec 2016) A$5.8m26.7m opns (1m out of money), 50m prodn & 13m performance www.carbineresources.com.au T:+618 6142 0986
Carbine Resources Limited (CRB) – Targeting 20kozAu to 40kozAu per year for >20 years at an AISC of <A$550/oz (potentially [ERA ests] <A$450/oz) from QLD’s old Mount Morgan mine.
• Carbine’s (CRB’s) main asset is a 75% holding (with a possibility to negotiate up to 100%) in the Mount Morgan gold-copper mine located ~40km south of Rockhampton, currently under the jurisdiction of Queensland’s Govt who accepted environmental liability in 1993.
• Mount Morgan passed through a series of production phases, over its almost 100-year life from discovery in 1882 to closure in 1990, producing ~8.4moz gold and ~400kt of copper. It had an initial reputation of having extremely high gold grades (eg >300oz/t to 470oz/t in 1912). It has undergone a series of mining phases from underground to open-cut to tailings and dump retreatment, including a whole range of smelting techniques; to result in the current tailings and dumps resources to be retreated for the next phase in its life.
• The Mount Morgan operation appears to possibly have a life of >20 years (ERA view) from treating the tailings and dumps remaining from previous operations through applying a relatively simple process that generates 3 products, namely : copper sulphate, premium grade pyrite, and gold dore at ~20kozpa to 40kozpaAu at possibly an AISC of <A$550/oz (after by-product credits – and potentially [ERA modelled estimates], <A$450/oz).
• Carbine expects to produce >200ktpa of premium grade pyrite (>49.5% sulphur with relatively low levels of the usual “nasties” of arsenic, mercury and lead), at a time when Finland’s Pyhäsalmi ~800ktpa premium grade pyrite mine may close in ~2019, which could result in materially higher prices than the US$60/t assumed (spot is often >US$200/t), However, CRB’s pyrite con has to establish a track record before it can be priced properly.
• CRB has applied a very conservative approach (ERA view) to its production estimates, which have the potential to materially increase cashflow and profitability, such as the usual 80% design rate (hence throughput may be closer to 1.3mtpa than 1.1mtpa); while grades, resource tonnages and even recoveries all have the potential to be higher. Based on its DFS, Carbine expects to achieve a short term (~2 years) payback of its capex, (after ~12months construction and commissioning, and possibly a ~3 month ramp-up period).
FINANCIAL ESTIMATES : (Note : This ERA scenario is just one of a number of possible scenarios that could occur :)
Year end December 2017f JH18f DH18f 2018f 2019f 2020f 2021f 2022fGold Sold koz 16 21 37 46 42 38 30Unroasted Pyrite Sold kt 70 95 165 210 219 272 218Gold Price Received US$/oz 1200 1200 1200 1200 1200 1200 1200AISC Cost (after by-prods) A$/oz 688 535 602 493 436 397 619Total Cash Cost A$/oz 600 461 522 429 340 317 536NPAT A$m 8.2 14.1 22.3 23.8 23.7 23.2 14.1EPS c 3 6 9 9 9 8 5No Shares M 248 248 273 273 286 286 286P/E ratio @ A$0.115 x 1.3 1.3 1.3 1.4 2.3
Other Key Points: : • The key product appears to be the premium
grade pyrite which is being used in lithium batteries, stainless steel, etc. There are few supplies, and ~50% (400kt) of Pyhäsalmi’s premium pyrite production, represents ~2/3 of China’s unroasted pyrite imports.
• Carbine may qualify for inclusion by ethical/green/environmental funds, being environmental improvement / clean-up.
• There are a number of additional sources of ore such as rock dumps etc, and potential relatively near surface exploration upside as the mine closed (twice) due to low copper prices, or encountering zinc mineralisation, and was effectively sterilised west of the open-cut due to deposited tailings.
• Infrastructure is excellent : personnel, services, roads, power, and available water.
2
Corporate Overview This is our first report on Carbine Resources Ltd (CRB), which listed in March 2007, mostly on its Red Dam and other prospects NW of Kalgoorlie which it sold to PXG (Phoenix Gold) for ~$2m in 2011 to focus on a number of prospects in NW Burkina Faso. Carbine entered into a formal agreement to acquire the Mount Morgan Project in QLD in Nov 2014 from Raging Bull Metals (Raging Bull) and Norton Goldfields.
The completion of the DFS on 8 December 2016 results in Carbine receiving a 75% interest in the Project from Raging Bull plus 2 milestone payments of 25m CRB shares when production exceeds 10kozAu and a further 25m CRB shares at 5ktCu. The completed DFS has triggered a negotiable 30-day option agreement in which CRB can acquire the remaining 25% from Raging Bull (no provision has been made for acquiring the 25%, as it has been assumed that this may be achieved through issuing shares).
Raging Bull has to pay Norton A$2m to acquire 100% of the Project (since a DTM or decision to mine has been achieved) and transfer the title to CRB. There are further payments by Raging Bull to Norton of A$13m on a deferred basis after the Project debt has been repaid. CRB has assumed that it will be paying the $2m and the later required $13m, however, that arrangement may also be able to be renegotiated too.
In the past year, CRB placed 12.5m shares at 6c to raise $0.75m in January 2016, followed by 35m shares at 20c in August 2016, raising $7m to delineate resources and complete the DFS, which has resulted in the current 197.04m fpo shares in issue. There are currently 26.7m options of which only 1m are slightly "out-of-the-money" at 12.4c. In addition to the two 25m milestone share issues, there are also 13m performance-based shares to 2021. Carbine underwent an almost complete board and partly senior management change in April 2016, with Tony James becoming MD.
Figure 1. Location of Mount Morgan in QLD, Aerial 3d Google Earth View of the Mount Morgan’s assets a. Location of Mount Morgan in Queensland
b. Aerial 3d Google Earth View of Mount Morgan’s assets
ERA first visited the Mount Morgan area ~40km SSW of Rockhampton in Queensland as shown in Figure 1a in August 2002 as part of the January 2003 Lodestone IPO (following a geological theory over the area SE of Mount Morgan) available on (www.eagleres.com.au/reports/item/jan-2003-lodestone-exploration). For this CRB report we spent ~4 days visiting & reviewing data in the Mount Morgan area in late November/early December 2016, over the assets shown west of the town of Mount Morgan in the 3d Google Earth image in Fig 1b. Background Geology and Mining of Mount Morgan (CRB : 75%) Mount Morgan (MM) was initially overlooked in ~1870s because it had gold-coloured flecked black boulders with the flecks identified as mundic or yellow-coloured pyrite & was hence ignored as ironstone, as gold was with quartz, and MM regionally became the ironstone mountain. When those flecked boulder specimens from Linda Gully were eventually assayed in ~1881/1882, they reputedly assayed ~3,700oz/t.
MM rapidly achieved a reputation for extremely high grades, initially from the oxidised gossan believed to have been intensified by leaching of the pyrite, followed by 3 almost vertical gold shoots. One (~41m long) shoot was encountered while removing the Grasstree shaft pillar in 1912 between the 315ft & 450ft levels ranging from 300oz/t to 471oz/t (9.2kg to 14.4kg/tAu); another 10ft to 25ft (3m to 7.5m) wide and ~50m long east of 27 shaft ranging from 16dwt at 395ft to 1140dwt (1745g/t) at 480ft and down to 2dwt at 559ft; and lastly the fourth and longest ~100m west of Crown Shaft at ~120m long, which ranged from 1 to 5oz/t at 950ft to 108oz/t (3,306g/t) at 696ft, to pinch-out at ~550ft.
Even the adjacent Sugarloaf had high gold and silver shoots at depth such as a 19oz/t gold shoot and a 9oz/t silver shoot (identified by 1953), but Sugarloaf had higher copper grades which did not suit the early chlorination process and hence it was left for later in the mine’s life. There were also higher copper grades at depth in the main orebody (10% to 12%Cu) plus 5cm to 8cm “seams” of chalcopyrite near the footwall.
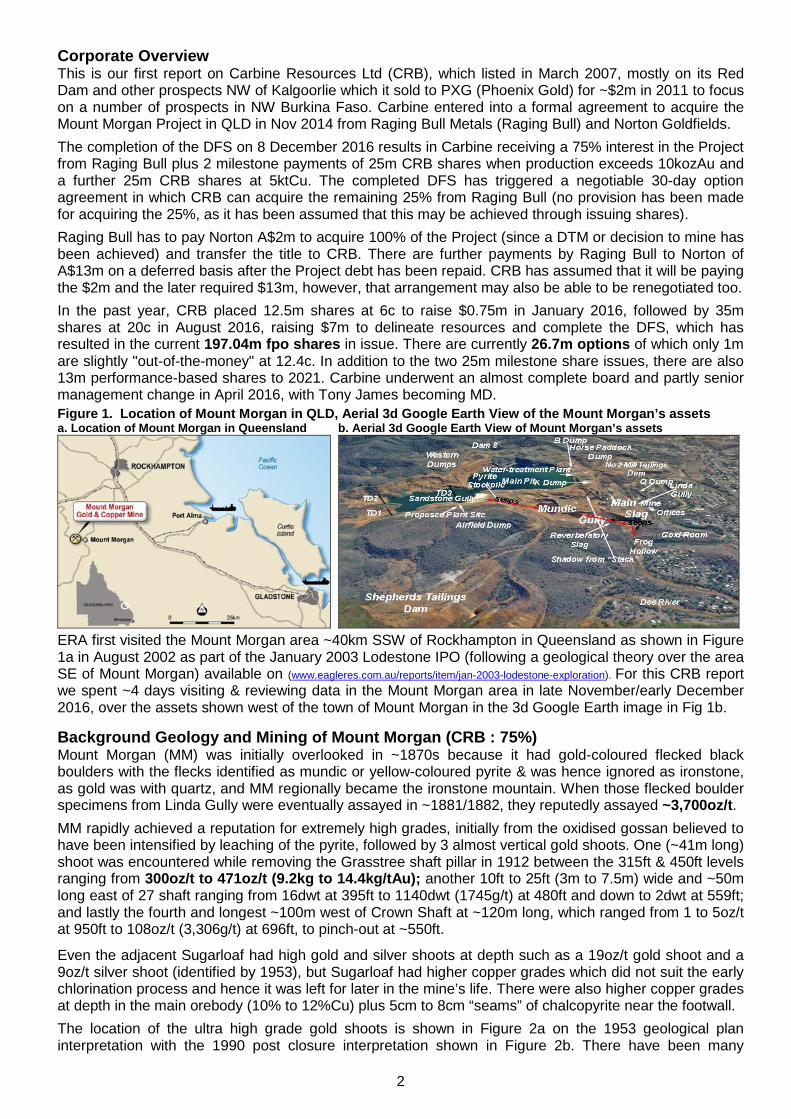
The location of the ultra high grade gold shoots is shown in Figure 2a on the 1953 geological plan interpretation with the 1990 post closure interpretation shown in Figure 2b. There have been many
3
theories and geological interpretations to try and explain why the main mineralisation was believed to truncate at depth as shown in Figures 2a & 2b. The initial belief was that of two hydrothermal geysers, partly due to the presence of sinters and honeycomb textures, over the original underground that became the first open-cut. That interpretation continued in various forms with the ore mineralisation “truncated” by the shallow dipping Linda fault shown in Figure 2a (with the inclined Linda shaft sunk above the contact).
One of the main theories was that Mount Morgan was a VMS deposit. However, that apparently changed when the Linda fault was interpreted as sub-vertical with Perilya “invoking” a fault to explain the geology (called the Invoka fault, Perilya also had an Infera fault further east as shown inset in Figure 2b).
Figure 2. Geological Plans, Sections and Possible Theoretical Schematic Model of Mount Morgan a.Geological Plan & Section of Mount Morgan in 1953
b. 1990 Plan & Sections and Possible Theoretical Model
The main mineralisation resembles a “boot-shape” in long section as shown in the inset sections in Figures 2a & 2b, with the possible theoretical model of its formation being a “pull-apart” (as per Corbett). As seen in the sections, there appears to be ore under the floor of the open-cut, however it was infilled with tailings up to possibly ~100m thick in places. The geological change of VMS to the main mineralisation that comprised MM can be seen in the sidewall next to the water-treatment plant resulting in classic VMS to the east as shown in Figure 5a, and MM resembling a slumped graben to the west.
The “boot shape” was only interpreted following drilling of the Sugarloaf orebody from 1949 and its subsequent mining in ~1963 (after the overburden had been gradually removed). The MM mine was originally mined as a near surface quarry, then underground, then glory hole and underground through to 1925 when it caught fire during a miner’s strike. (The copper price had fallen to £70/t in 1921 and it was uneconomic to mine underground at ~1000ft below “surface”. Wage reductions were sought and when a suggestion was made to mine by open-cut, the miners went on strike). Post the fire and flooding a study showed that an open-cut could be uneconomic due to dilution, and MM was liquidated in 1927, after 41 years of operation (1882 to 1923) in which 9.31mt had produced 5.345moz gold and ~140,000t copper.
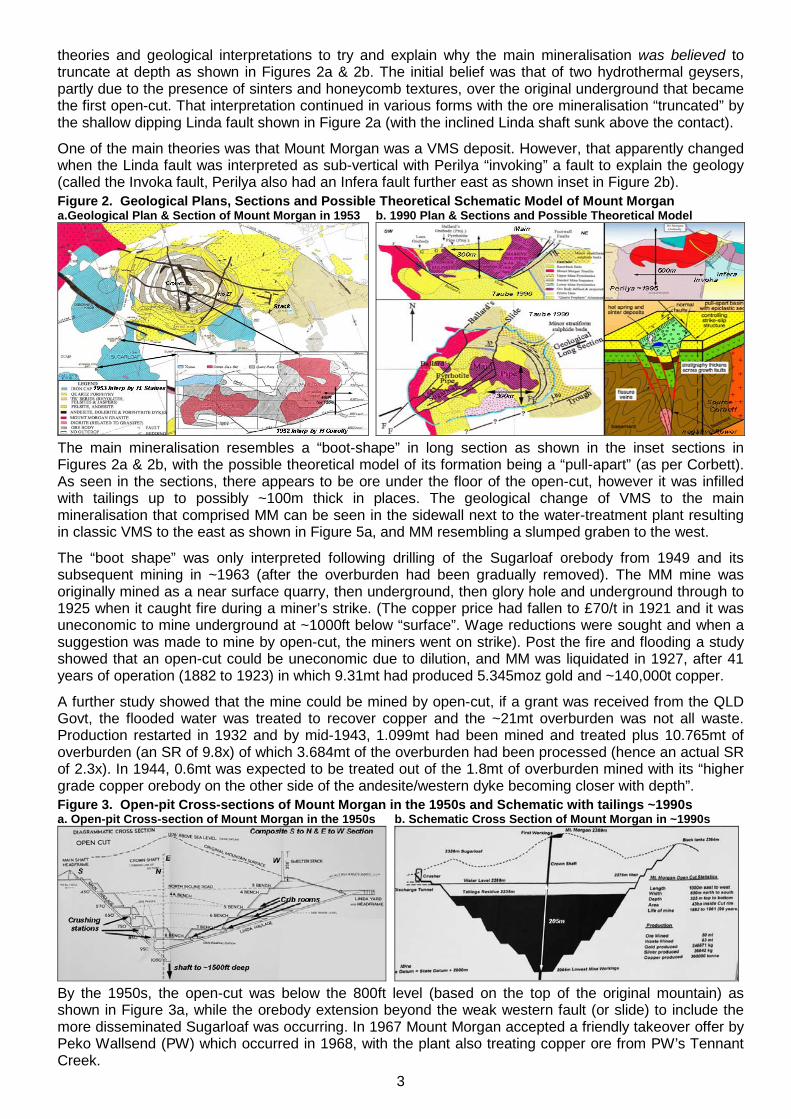
A further study showed that the mine could be mined by open-cut, if a grant was received from the QLD Govt, the flooded water was treated to recover copper and the ~21mt overburden was not all waste. Production restarted in 1932 and by mid-1943, 1.099mt had been mined and treated plus 10.765mt of overburden (an SR of 9.8x) of which 3.684mt of the overburden had been processed (hence an actual SR of 2.3x). In 1944, 0.6mt was expected to be treated out of the 1.8mt of overburden mined with its “higher grade copper orebody on the other side of the andesite/western dyke becoming closer with depth”.
Figure 3. Open-pit Cross-sections of Mount Morgan in the 1950s and Schematic with tailings ~1990s a. Open-pit Cross-section of Mount Morgan in the 1950s
b. Schematic Cross Section of Mount Morgan in ~1990s
By the 1950s, the open-cut was below the 800ft level (based on the top of the original mountain) as shown in Figure 3a, while the orebody extension beyond the weak western fault (or slide) to include the more disseminated Sugarloaf was occurring. In 1967 Mount Morgan accepted a friendly takeover offer by Peko Wallsend (PW) which occurred in 1968, with the plant also treating copper ore from PW’s Tennant Creek.
4
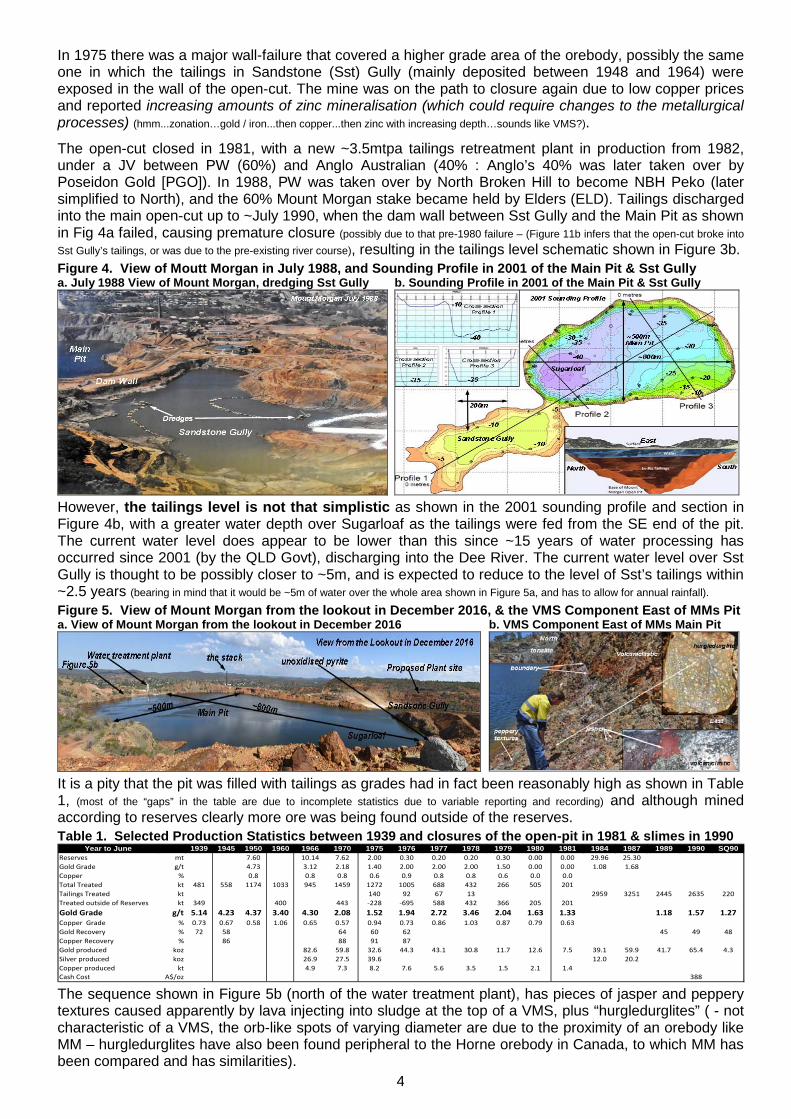
In 1975 there was a major wall-failure that covered a higher grade area of the orebody, possibly the same one in which the tailings in Sandstone (Sst) Gully (mainly deposited between 1948 and 1964) were exposed in the wall of the open-cut. The mine was on the path to closure again due to low copper prices and reported increasing amounts of zinc mineralisation (which could require changes to the metallurgical processes) (hmm...zonation…gold / iron...then copper...then zinc with increasing depth…sounds like VMS?).
The open-cut closed in 1981, with a new ~3.5mtpa tailings retreatment plant in production from 1982, under a JV between PW (60%) and Anglo Australian (40% : Anglo’s 40% was later taken over by Poseidon Gold [PGO]). In 1988, PW was taken over by North Broken Hill to become NBH Peko (later simplified to North), and the 60% Mount Morgan stake became held by Elders (ELD). Tailings discharged into the main open-cut up to ~July 1990, when the dam wall between Sst Gully and the Main Pit as shown in Fig 4a failed, causing premature closure (possibly due to that pre-1980 failure – (Figure 11b infers that the open-cut broke into Sst Gully’s tailings, or was due to the pre-existing river course), resulting in the tailings level schematic shown in Figure 3b.
Figure 4. View of Moutt Morgan in July 1988, and Sounding Profile in 2001 of the Main Pit & Sst Gully a. July 1988 View of Mount Morgan, dredging Sst Gully
b. Sounding Profile in 2001 of the Main Pit & Sst Gully
However, the tailings level is not that simplistic as shown in the 2001 sounding profile and section in Figure 4b, with a greater water depth over Sugarloaf as the tailings were fed from the SE end of the pit. The current water level does appear to be lower than this since ~15 years of water processing has occurred since 2001 (by the QLD Govt), discharging into the Dee River. The current water level over Sst Gully is thought to be possibly closer to ~5m, and is expected to reduce to the level of Sst’s tailings within ~2.5 years (bearing in mind that it would be ~5m of water over the whole area shown in Figure 5a, and has to allow for annual rainfall).
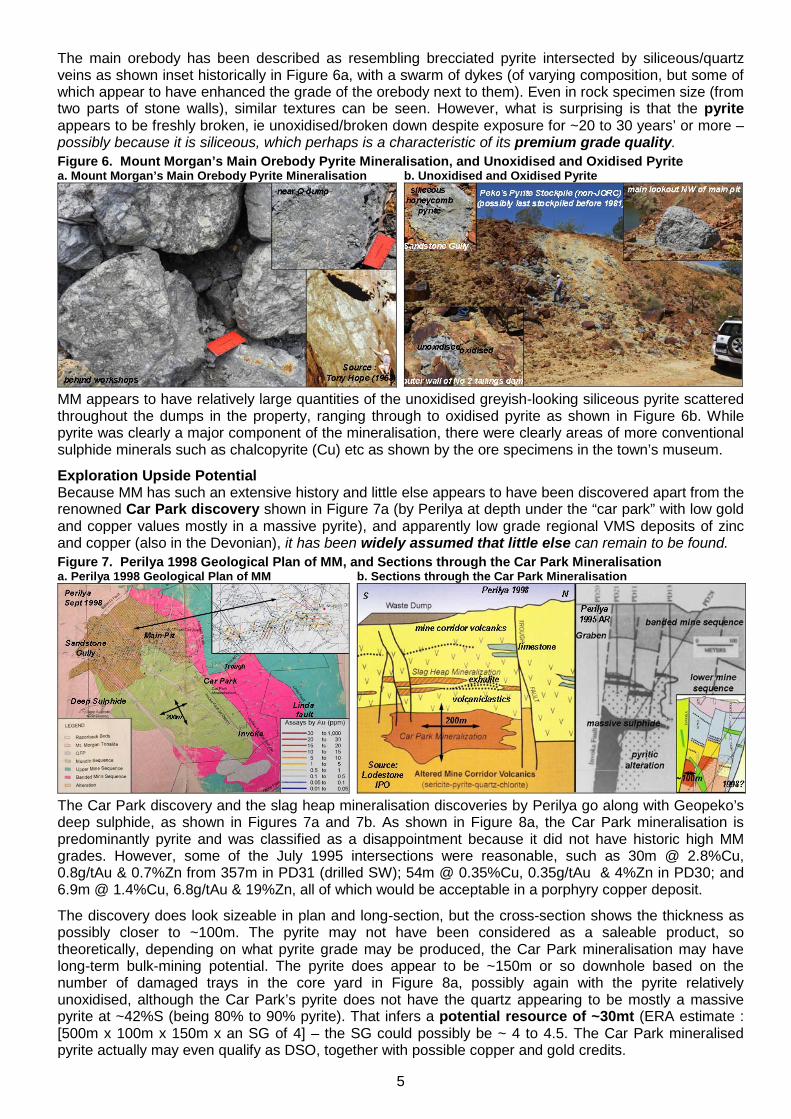
Figure 5. View of Mount Morgan from the lookout in December 2016, & the VMS Component East of MMs Pit a. View of Mount Morgan from the lookout in December 2016
b. VMS Component East of MMs Main Pit
It is a pity that the pit was filled with tailings as grades had in fact been reasonably high as shown in Table 1, (most of the “gaps” in the table are due to incomplete statistics due to variable reporting and recording) and although mined according to reserves clearly more ore was being found outside of the reserves.
Table 1. Selected Production Statistics between 1939 and closures of the open-pit in 1981 & slimes in 1990 Year to June 1939 1945 1950 1960 1966 1970 1975 1976 1977 1978 1979 1980 1981 1984 1987 1989 1990 SQ90
Reserves mt 7.60 10.14 7.62 2.00 0.30 0.20 0.20 0.30 0.00 0.00 29.96 25.30Gold Grade g/t 4.73 3.12 2.18 1.40 2.00 2.00 2.00 1.50 0.00 0.00 1.08 1.68Copper % 0.8 0.8 0.8 0.6 0.9 0.8 0.8 0.6 0.0 0.0Total Treated kt 481 558 1174 1033 945 1459 1272 1005 688 432 266 505 201Tailings Treated kt 140 92 67 13 2959 3251 2445 2635 220Treated outside of Reserves kt 349 400 443 -228 -695 588 432 366 205 201Gold Grade g/t 5.14 4.23 4.37 3.40 4.30 2.08 1.52 1.94 2.72 3.46 2.04 1.63 1.33 1.18 1.57 1.27Copper Grade % 0.73 0.67 0.58 1.06 0.65 0.57 0.94 0.73 0.86 1.03 0.87 0.79 0.63Gold Recovery % 72 58 64 60 62 45 49 48Copper Recovery % 86 88 91 87Gold produced koz 82.6 59.8 32.6 44.3 43.1 30.8 11.7 12.6 7.5 39.1 59.9 41.7 65.4 4.3Silver produced koz 26.9 27.5 39.6 12.0 20.2Copper produced kt 4.9 7.3 8.2 7.6 5.6 3.5 1.5 2.1 1.4Cash Cost A$/oz 388
The sequence shown in Figure 5b (north of the water treatment plant), has pieces of jasper and peppery textures caused apparently by lava injecting into sludge at the top of a VMS, plus “hurgledurglites” ( - not characteristic of a VMS, the orb-like spots of varying diameter are due to the proximity of an orebody like MM – hurgledurglites have also been found peripheral to the Horne orebody in Canada, to which MM has been compared and has similarities).
5
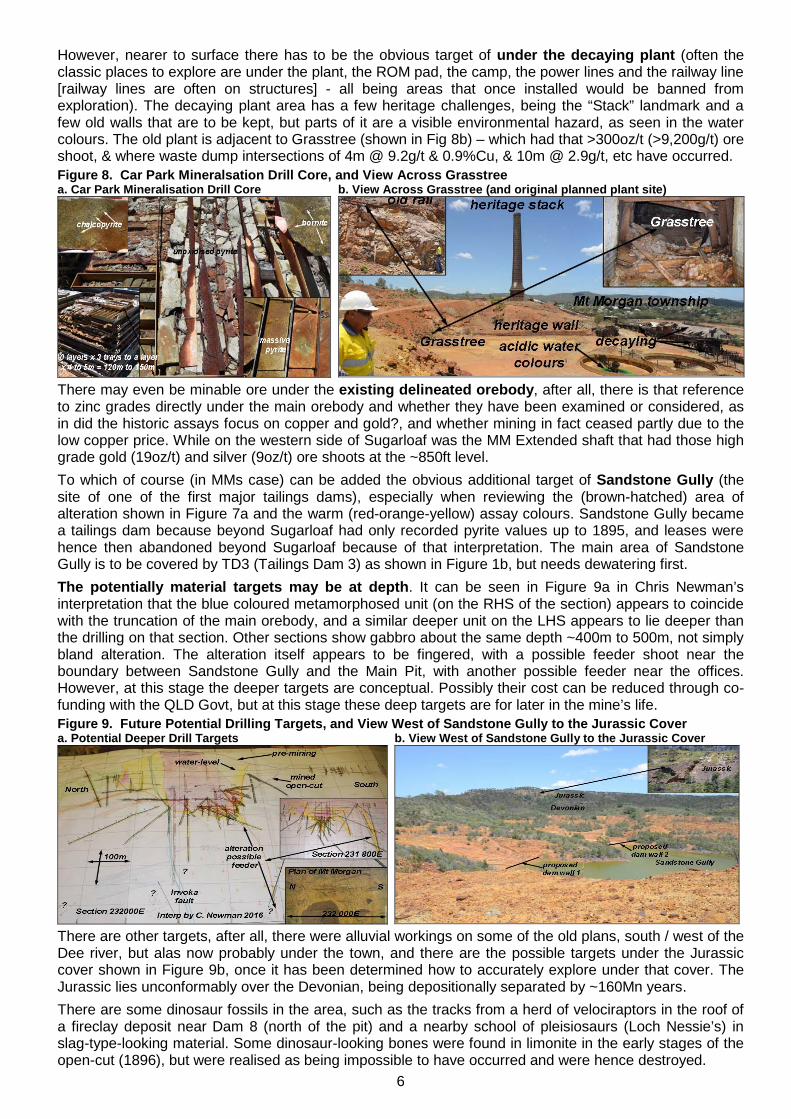
The main orebody has been described as resembling brecciated pyrite intersected by siliceous/quartz veins as shown inset historically in Figure 6a, with a swarm of dykes (of varying composition, but some of which appear to have enhanced the grade of the orebody next to them). Even in rock specimen size (from two parts of stone walls), similar textures can be seen. However, what is surprising is that the pyrite appears to be freshly broken, ie unoxidised/broken down despite exposure for ~20 to 30 years’ or more – possibly because it is siliceous, which perhaps is a characteristic of its premium grade quality.
Figure 6. Mount Morgan’s Main Orebody Pyrite Mineralisation, and Unoxidised and Oxidised Pyrite a. Mount Morgan’s Main Orebody Pyrite Mineralisation
b. Unoxidised and Oxidised Pyrite
MM appears to have relatively large quantities of the unoxidised greyish-looking siliceous pyrite scattered throughout the dumps in the property, ranging through to oxidised pyrite as shown in Figure 6b. While pyrite was clearly a major component of the mineralisation, there were clearly areas of more conventional sulphide minerals such as chalcopyrite (Cu) etc as shown by the ore specimens in the town’s museum.
Exploration Upside Potential Because MM has such an extensive history and little else appears to have been discovered apart from the renowned Car Park discovery shown in Figure 7a (by Perilya at depth under the “car park” with low gold and copper values mostly in a massive pyrite), and apparently low grade regional VMS deposits of zinc and copper (also in the Devonian), it has been widely assumed that little else can remain to be found.
Figure 7. Perilya 1998 Geological Plan of MM, and Sections through the Car Park Mineralisation a. Perilya 1998 Geological Plan of MM
b. Sections through the Car Park Mineralisation
The Car Park discovery and the slag heap mineralisation discoveries by Perilya go along with Geopeko’s deep sulphide, as shown in Figures 7a and 7b. As shown in Figure 8a, the Car Park mineralisation is predominantly pyrite and was classified as a disappointment because it did not have historic high MM grades. However, some of the July 1995 intersections were reasonable, such as 30m @ 2.8%Cu, 0.8g/tAu & 0.7%Zn from 357m in PD31 (drilled SW); 54m @ 0.35%Cu, 0.35g/tAu & 4%Zn in PD30; and 6.9m @ 1.4%Cu, 6.8g/tAu & 19%Zn, all of which would be acceptable in a porphyry copper deposit.
The discovery does look sizeable in plan and long-section, but the cross-section shows the thickness as possibly closer to ~100m. The pyrite may not have been considered as a saleable product, so theoretically, depending on what pyrite grade may be produced, the Car Park mineralisation may have long-term bulk-mining potential. The pyrite does appear to be ~150m or so downhole based on the number of damaged trays in the core yard in Figure 8a, possibly again with the pyrite relatively unoxidised, although the Car Park’s pyrite does not have the quartz appearing to be mostly a massive pyrite at ~42%S (being 80% to 90% pyrite). That infers a potential resource of ~30mt (ERA estimate : [500m x 100m x 150m x an SG of 4] – the SG could possibly be ~ 4 to 4.5. The Car Park mineralised pyrite actually may even qualify as DSO, together with possible copper and gold credits.
6
However, nearer to surface there has to be the obvious target of under the decaying plant (often the classic places to explore are under the plant, the ROM pad, the camp, the power lines and the railway line [railway lines are often on structures] - all being areas that once installed would be banned from exploration). The decaying plant area has a few heritage challenges, being the “Stack” landmark and a few old walls that are to be kept, but parts of it are a visible environmental hazard, as seen in the water colours. The old plant is adjacent to Grasstree (shown in Fig 8b) – which had that >300oz/t (>9,200g/t) ore shoot, & where waste dump intersections of 4m @ 9.2g/t & 0.9%Cu, & 10m @ 2.9g/t, etc have occurred.
Figure 8. Car Park Mineralsation Drill Core, and View Across Grasstree a. Car Park Mineralisation Drill Core
b. View Across Grasstree (and original planned plant site)
There may even be minable ore under the existing delineated orebody, after all, there is that reference to zinc grades directly under the main orebody and whether they have been examined or considered, as in did the historic assays focus on copper and gold?, and whether mining in fact ceased partly due to the low copper price. While on the western side of Sugarloaf was the MM Extended shaft that had those high grade gold (19oz/t) and silver (9oz/t) ore shoots at the ~850ft level.
To which of course (in MMs case) can be added the obvious additional target of Sandstone Gully (the site of one of the first major tailings dams), especially when reviewing the (brown-hatched) area of alteration shown in Figure 7a and the warm (red-orange-yellow) assay colours. Sandstone Gully became a tailings dam because beyond Sugarloaf had only recorded pyrite values up to 1895, and leases were hence then abandoned beyond Sugarloaf because of that interpretation. The main area of Sandstone Gully is to be covered by TD3 (Tailings Dam 3) as shown in Figure 1b, but needs dewatering first.
The potentially material targets may be at depth. It can be seen in Figure 9a in Chris Newman’s interpretation that the blue coloured metamorphosed unit (on the RHS of the section) appears to coincide with the truncation of the main orebody, and a similar deeper unit on the LHS appears to lie deeper than the drilling on that section. Other sections show gabbro about the same depth ~400m to 500m, not simply bland alteration. The alteration itself appears to be fingered, with a possible feeder shoot near the boundary between Sandstone Gully and the Main Pit, with another possible feeder near the offices. However, at this stage the deeper targets are conceptual. Possibly their cost can be reduced through co-funding with the QLD Govt, but at this stage these deep targets are for later in the mine’s life.
Figure 9. Future Potential Drilling Targets, and View West of Sandstone Gully to the Jurassic Cover a. Potential Deeper Drill Targets
b. View West of Sandstone Gully to the Jurassic Cover
There are other targets, after all, there were alluvial workings on some of the old plans, south / west of the Dee river, but alas now probably under the town, and there are the possible targets under the Jurassic cover shown in Figure 9b, once it has been determined how to accurately explore under that cover. The Jurassic lies unconformably over the Devonian, being depositionally separated by ~160Mn years.
There are some dinosaur fossils in the area, such as the tracks from a herd of velociraptors in the roof of a fireclay deposit near Dam 8 (north of the pit) and a nearby school of pleisiosaurs (Loch Nessie’s) in slag-type-looking material. Some dinosaur-looking bones were found in limonite in the early stages of the open-cut (1896), but were realised as being impossible to have occurred and were hence destroyed.
7
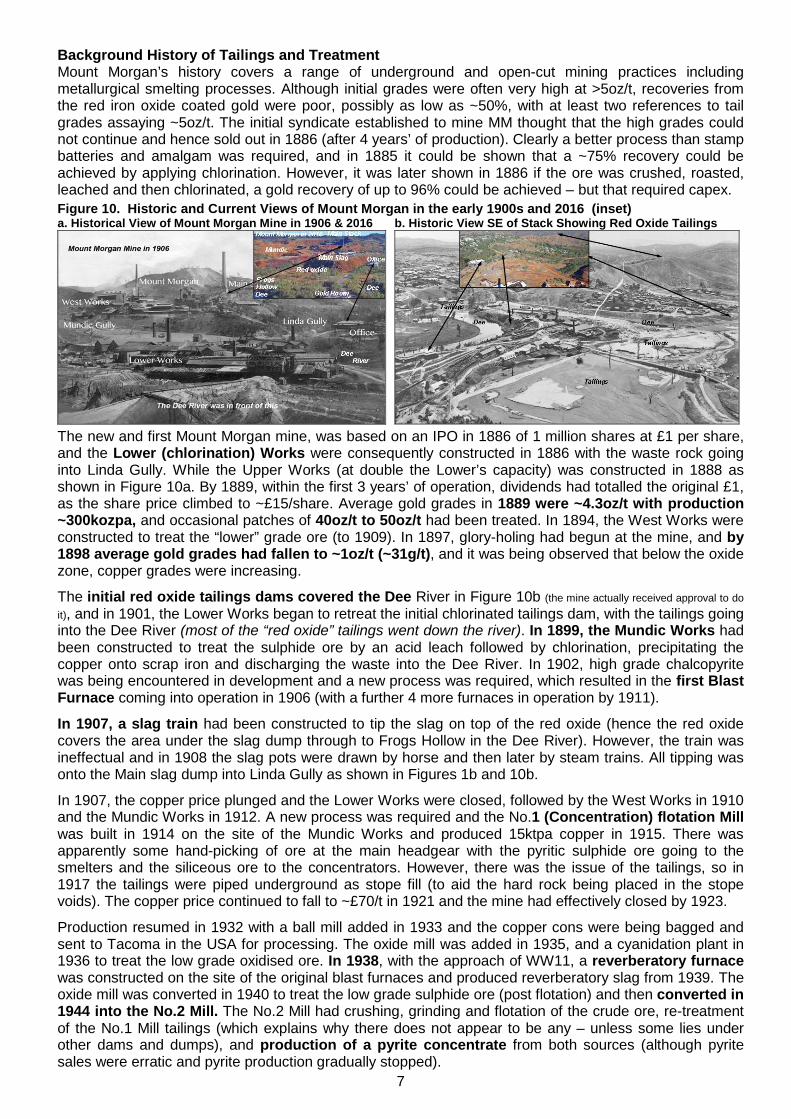
Background History of Tailings and Treatment Mount Morgan’s history covers a range of underground and open-cut mining practices including metallurgical smelting processes. Although initial grades were often very high at >5oz/t, recoveries from the red iron oxide coated gold were poor, possibly as low as ~50%, with at least two references to tail grades assaying ~5oz/t. The initial syndicate established to mine MM thought that the high grades could not continue and hence sold out in 1886 (after 4 years’ of production). Clearly a better process than stamp batteries and amalgam was required, and in 1885 it could be shown that a ~75% recovery could be achieved by applying chlorination. However, it was later shown in 1886 if the ore was crushed, roasted, leached and then chlorinated, a gold recovery of up to 96% could be achieved – but that required capex.
Figure 10. Historic and Current Views of Mount Morgan in the early 1900s and 2016 (inset) a. Historical View of Mount Morgan Mine in 1906 & 2016
b. Historic View SE of Stack Showing Red Oxide Tailings
The new and first Mount Morgan mine, was based on an IPO in 1886 of 1 million shares at £1 per share, and the Lower (chlorination) Works were consequently constructed in 1886 with the waste rock going into Linda Gully. While the Upper Works (at double the Lower’s capacity) was constructed in 1888 as shown in Figure 10a. By 1889, within the first 3 years’ of operation, dividends had totalled the original £1, as the share price climbed to ~£15/share. Average gold grades in 1889 were ~4.3oz/t with production ~300kozpa, and occasional patches of 40oz/t to 50oz/t had been treated. In 1894, the West Works were constructed to treat the “lower” grade ore (to 1909). In 1897, glory-holing had begun at the mine, and by 1898 average gold grades had fallen to ~1oz/t (~31g/t), and it was being observed that below the oxide zone, copper grades were increasing.
The initial red oxide tailings dams covered the Dee River in Figure 10b (the mine actually received approval to do it), and in 1901, the Lower Works began to retreat the initial chlorinated tailings dam, with the tailings going into the Dee River (most of the “red oxide” tailings went down the river). In 1899, the Mundic Works had been constructed to treat the sulphide ore by an acid leach followed by chlorination, precipitating the copper onto scrap iron and discharging the waste into the Dee River. In 1902, high grade chalcopyrite was being encountered in development and a new process was required, which resulted in the first Blast Furnace coming into operation in 1906 (with a further 4 more furnaces in operation by 1911).
In 1907, a slag train had been constructed to tip the slag on top of the red oxide (hence the red oxide covers the area under the slag dump through to Frogs Hollow in the Dee River). However, the train was ineffectual and in 1908 the slag pots were drawn by horse and then later by steam trains. All tipping was onto the Main slag dump into Linda Gully as shown in Figures 1b and 10b.
In 1907, the copper price plunged and the Lower Works were closed, followed by the West Works in 1910 and the Mundic Works in 1912. A new process was required and the No.1 (Concentration) flotation Mill was built in 1914 on the site of the Mundic Works and produced 15ktpa copper in 1915. There was apparently some hand-picking of ore at the main headgear with the pyritic sulphide ore going to the smelters and the siliceous ore to the concentrators. However, there was the issue of the tailings, so in 1917 the tailings were piped underground as stope fill (to aid the hard rock being placed in the stope voids). The copper price continued to fall to ~£70/t in 1921 and the mine had effectively closed by 1923.
Production resumed in 1932 with a ball mill added in 1933 and the copper cons were being bagged and sent to Tacoma in the USA for processing. The oxide mill was added in 1935, and a cyanidation plant in 1936 to treat the low grade oxidised ore. In 1938, with the approach of WW11, a reverberatory furnace was constructed on the site of the original blast furnaces and produced reverberatory slag from 1939. The oxide mill was converted in 1940 to treat the low grade sulphide ore (post flotation) and then converted in 1944 into the No.2 Mill. The No.2 Mill had crushing, grinding and flotation of the crude ore, re-treatment of the No.1 Mill tailings (which explains why there does not appear to be any – unless some lies under other dams and dumps), and production of a pyrite concentrate from both sources (although pyrite sales were erratic and pyrite production gradually stopped).
8
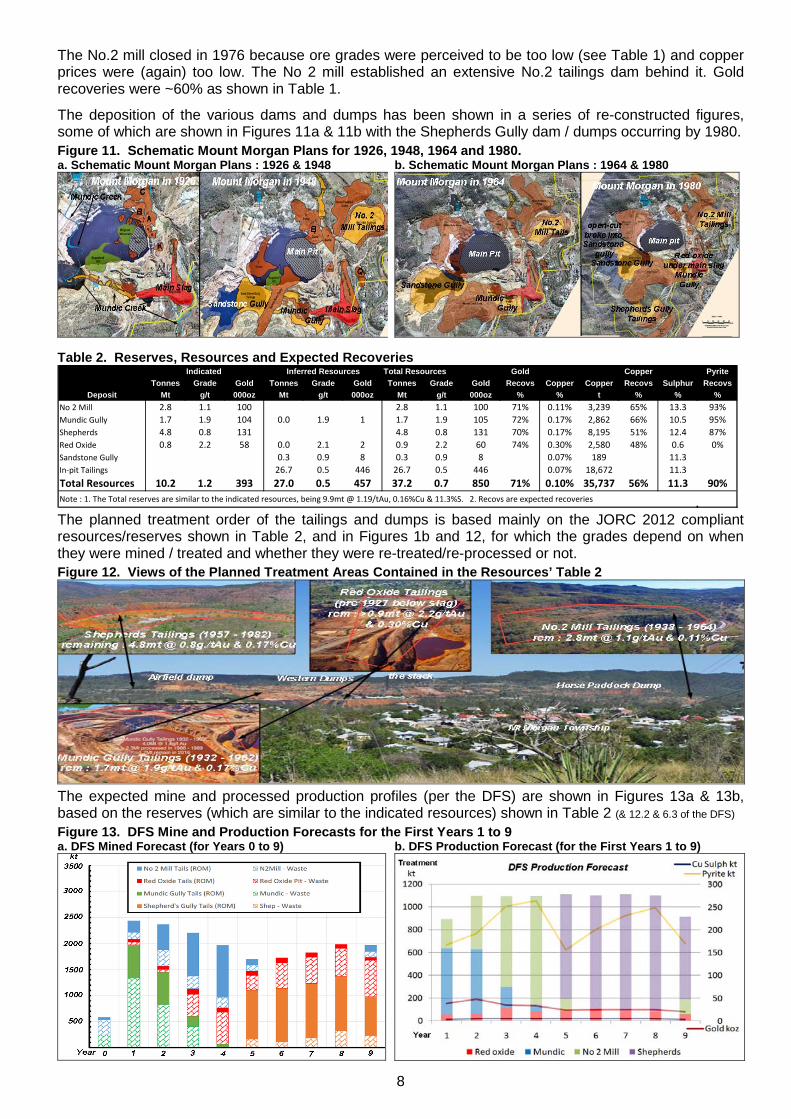
The No.2 mill closed in 1976 because ore grades were perceived to be too low (see Table 1) and copper prices were (again) too low. The No 2 mill established an extensive No.2 tailings dam behind it. Gold recoveries were ~60% as shown in Table 1.
The deposition of the various dams and dumps has been shown in a series of re-constructed figures, some of which are shown in Figures 11a & 11b with the Shepherds Gully dam / dumps occurring by 1980.
Figure 11. Schematic Mount Morgan Plans for 1926, 1948, 1964 and 1980. a. Schematic Mount Morgan Plans : 1926 & 1948
b. Schematic Mount Morgan Plans : 1964 & 1980
Table 2. Reserves, Resources and Expected Recoveries
Indicated Inferred Resources Total Resources Gold Copper PyriteTonnes Grade Gold Tonnes Grade Gold Tonnes Grade Gold Recovs Copper Copper Recovs Sulphur Recovs
Deposit Mt g/t 000oz Mt g/t 000oz Mt g/t 000oz % % t % % %No 2 Mill 2.8 1.1 100 2.8 1.1 100 71% 0.11% 3,239 65% 13.3 93%Mundic Gully 1.7 1.9 104 0.0 1.9 1 1.7 1.9 105 72% 0.17% 2,862 66% 10.5 95%Shepherds 4.8 0.8 131 4.8 0.8 131 70% 0.17% 8,195 51% 12.4 87%Red Oxide 0.8 2.2 58 0.0 2.1 2 0.9 2.2 60 74% 0.30% 2,580 48% 0.6 0%Sandstone Gully 0.3 0.9 8 0.3 0.9 8 0.07% 189 11.3In-pit Tailings 26.7 0.5 446 26.7 0.5 446 0.07% 18,672 11.3Total Resources 10.2 1.2 393 27.0 0.5 457 37.2 0.7 850 71% 0.10% 35,737 56% 11.3 90%Note : 1. The Total reserves are similar to the indicated resources, being 9.9mt @ 1.19/tAu, 0.16%Cu & 11.3%S. 2. Recovs are expected recoveries
The planned treatment order of the tailings and dumps is based mainly on the JORC 2012 compliant resources/reserves shown in Table 2, and in Figures 1b and 12, for which the grades depend on when they were mined / treated and whether they were re-treated/re-processed or not.
Figure 12. Views of the Planned Treatment Areas Contained in the Resources’ Table 2
The expected mine and processed production profiles (per the DFS) are shown in Figures 13a & 13b, based on the reserves (which are similar to the indicated resources) shown in Table 2 (& 12.2 & 6.3 of the DFS)
Figure 13. DFS Mine and Production Forecasts for the First Years 1 to 9 a. DFS Mined Forecast (for Years 0 to 9)
b. DFS Production Forecast (for the First Years 1 to 9)
9
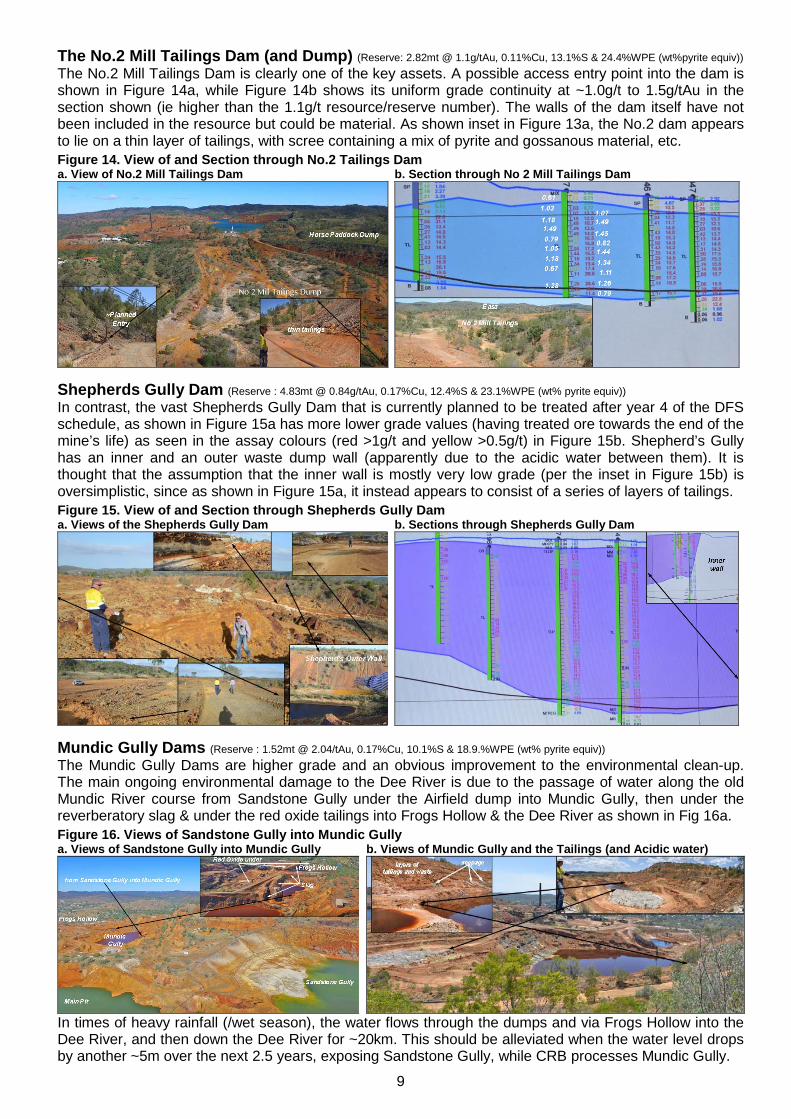
The No.2 Mill Tailings Dam (and Dump) (Reserve: 2.82mt @ 1.1g/tAu, 0.11%Cu, 13.1%S & 24.4%WPE (wt%pyrite equiv)) The No.2 Mill Tailings Dam is clearly one of the key assets. A possible access entry point into the dam is shown in Figure 14a, while Figure 14b shows its uniform grade continuity at ~1.0g/t to 1.5g/tAu in the section shown (ie higher than the 1.1g/t resource/reserve number). The walls of the dam itself have not been included in the resource but could be material. As shown inset in Figure 13a, the No.2 dam appears to lie on a thin layer of tailings, with scree containing a mix of pyrite and gossanous material, etc.
Figure 14. View of and Section through No.2 Tailings Dam a. View of No.2 Mill Tailings Dam
b. Section through No 2 Mill Tailings Dam
Shepherds Gully Dam (Reserve : 4.83mt @ 0.84g/tAu, 0.17%Cu, 12.4%S & 23.1%WPE (wt% pyrite equiv)) In contrast, the vast Shepherds Gully Dam that is currently planned to be treated after year 4 of the DFS schedule, as shown in Figure 15a has more lower grade values (having treated ore towards the end of the mine’s life) as seen in the assay colours (red >1g/t and yellow >0.5g/t) in Figure 15b. Shepherd’s Gully has an inner and an outer waste dump wall (apparently due to the acidic water between them). It is thought that the assumption that the inner wall is mostly very low grade (per the inset in Figure 15b) is oversimplistic, since as shown in Figure 15a, it instead appears to consist of a series of layers of tailings.
Figure 15. View of and Section through Shepherds Gully Dam a. Views of the Shepherds Gully Dam
b. Sections through Shepherds Gully Dam
Mundic Gully Dams (Reserve : 1.52mt @ 2.04/tAu, 0.17%Cu, 10.1%S & 18.9.%WPE (wt% pyrite equiv)) The Mundic Gully Dams are higher grade and an obvious improvement to the environmental clean-up. The main ongoing environmental damage to the Dee River is due to the passage of water along the old Mundic River course from Sandstone Gully under the Airfield dump into Mundic Gully, then under the reverberatory slag & under the red oxide tailings into Frogs Hollow & the Dee River as shown in Fig 16a.
Figure 16. Views of Sandstone Gully into Mundic Gully a. Views of Sandstone Gully into Mundic Gully
b. Views of Mundic Gully and the Tailings (and Acidic water)
In times of heavy rainfall (/wet season), the water flows through the dumps and via Frogs Hollow into the Dee River, and then down the Dee River for ~20km. This should be alleviated when the water level drops by another ~5m over the next 2.5 years, exposing Sandstone Gully, while CRB processes Mundic Gully.
10
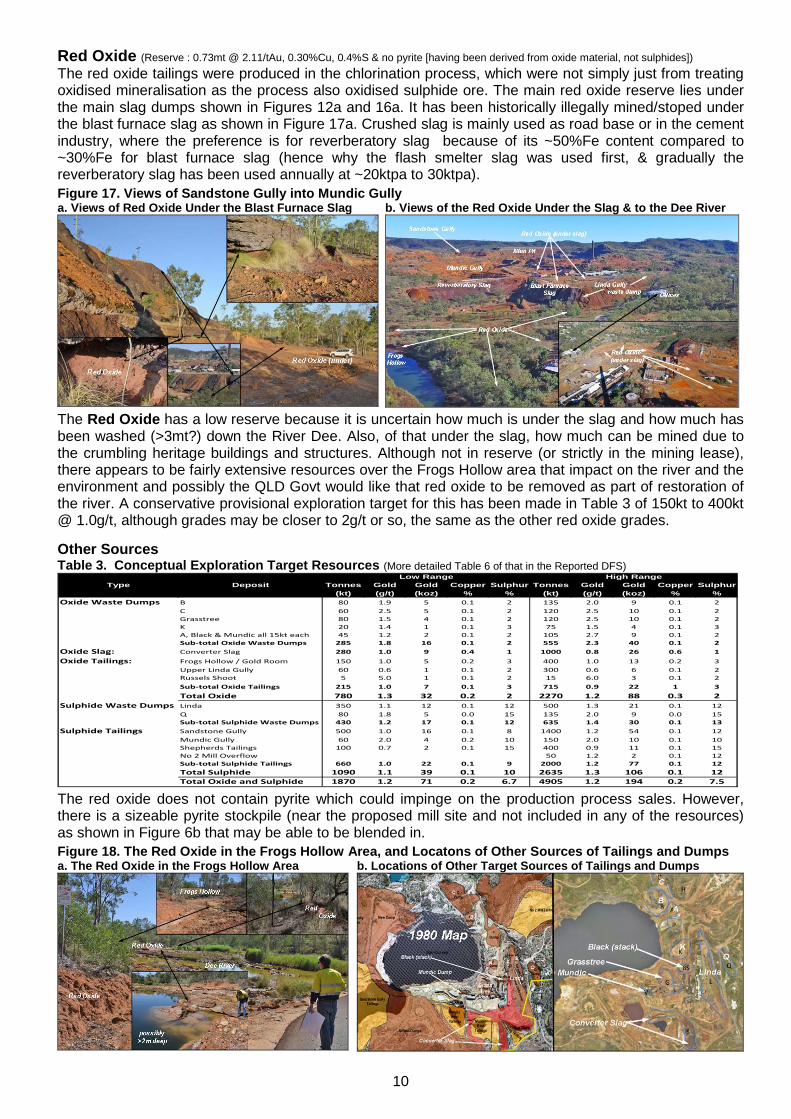
Red Oxide (Reserve : 0.73mt @ 2.11/tAu, 0.30%Cu, 0.4%S & no pyrite [having been derived from oxide material, not sulphides]) The red oxide tailings were produced in the chlorination process, which were not simply just from treating oxidised mineralisation as the process also oxidised sulphide ore. The main red oxide reserve lies under the main slag dumps shown in Figures 12a and 16a. It has been historically illegally mined/stoped under the blast furnace slag as shown in Figure 17a. Crushed slag is mainly used as road base or in the cement industry, where the preference is for reverberatory slag because of its ~50%Fe content compared to ~30%Fe for blast furnace slag (hence why the flash smelter slag was used first, & gradually the reverberatory slag has been used annually at ~20ktpa to 30ktpa).
Figure 17. Views of Sandstone Gully into Mundic Gully a. Views of Red Oxide Under the Blast Furnace Slag
b. Views of the Red Oxide Under the Slag & to the Dee River
The Red Oxide has a low reserve because it is uncertain how much is under the slag and how much has been washed (>3mt?) down the River Dee. Also, of that under the slag, how much can be mined due to the crumbling heritage buildings and structures. Although not in reserve (or strictly in the mining lease), there appears to be fairly extensive resources over the Frogs Hollow area that impact on the river and the environment and possibly the QLD Govt would like that red oxide to be removed as part of restoration of the river. A conservative provisional exploration target for this has been made in Table 3 of 150kt to 400kt @ 1.0g/t, although grades may be closer to 2g/t or so, the same as the other red oxide grades. Other Sources Table 3. Conceptual Exploration Target Resources (More detailed Table 6 of that in the Reported DFS)
Low Range High RangeType Deposit Tonnes Gold Gold Copper Sulphur Tonnes Gold Gold Copper Sulphur
(kt) (g/t) (koz) % % (kt) (g/t) (koz) % %Oxide Waste Dumps B 80 1.9 5 0.1 2 135 2.0 9 0.1 2
C 60 2.5 5 0.1 2 120 2.5 10 0.1 2Grasstree 80 1.5 4 0.1 2 120 2.5 10 0.1 2K 20 1.4 1 0.1 3 75 1.5 4 0.1 3A, Black & Mundic all 15kt each 45 1.2 2 0.1 2 105 2.7 9 0.1 2Sub-total Oxide Waste Dumps 285 1.8 16 0.1 2 555 2.3 40 0.1 2
Oxide Slag: Converter Slag 280 1.0 9 0.4 1 1000 0.8 26 0.6 1Oxide Tailings: Frogs Hollow / Gold Room 150 1.0 5 0.2 3 400 1.0 13 0.2 3
Upper Linda Gully 60 0.6 1 0.1 2 300 0.6 6 0.1 2Russels Shoot 5 5.0 1 0.1 2 15 6.0 3 0.1 2Sub-total Oxide Tailings 215 1.0 7 0.1 3 715 0.9 22 1 3Total Oxide 780 1.3 32 0.2 2 2270 1.2 88 0.3 2
Sulphide Waste Dumps Linda 350 1.1 12 0.1 12 500 1.3 21 0.1 12Q 80 1.8 5 0.0 15 135 2.0 9 0.0 15Sub-total Sulphide Waste Dumps 430 1.2 17 0.1 12 635 1.4 30 0.1 13
Sulphide Tailings Sandstone Gully 500 1.0 16 0.1 8 1400 1.2 54 0.1 12Mundic Gully 60 2.0 4 0.2 10 150 2.0 10 0.1 10Shepherds Tailings 100 0.7 2 0.1 15 400 0.9 11 0.1 15No 2 Mill Overflow 50 1.2 2 0.1 12Sub-total Sulphide Tailings 660 1.0 22 0.1 9 2000 1.2 77 0.1 12Total Sulphide 1090 1.1 39 0.1 10 2635 1.3 106 0.1 12Total Oxide and Sulphide 1870 1.2 71 0.2 6.7 4905 1.2 194 0.2 7.5
The red oxide does not contain pyrite which could impinge on the production process sales. However, there is a sizeable pyrite stockpile (near the proposed mill site and not included in any of the resources) as shown in Figure 6b that may be able to be blended in.
Figure 18. The Red Oxide in the Frogs Hollow Area, and Locatons of Other Sources of Tailings and Dumps a. The Red Oxide in the Frogs Hollow Area
b. Locations of Other Target Sources of Tailings and Dumps
11
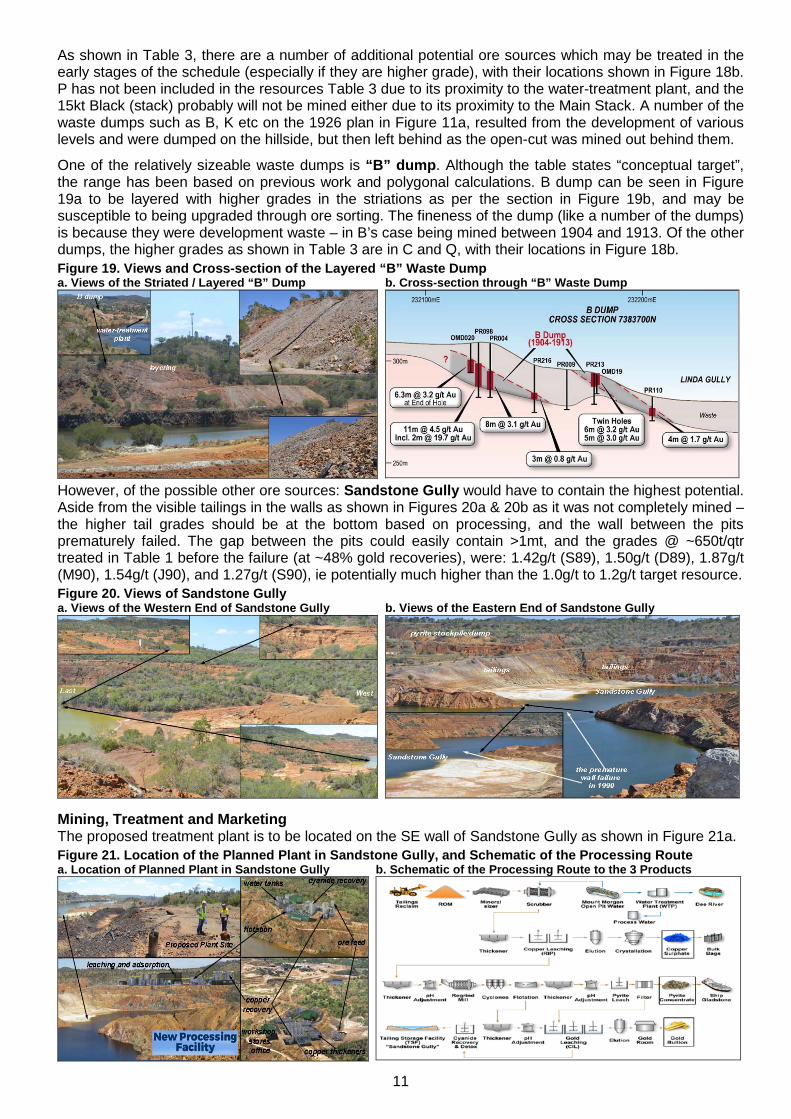
As shown in Table 3, there are a number of additional potential ore sources which may be treated in the early stages of the schedule (especially if they are higher grade), with their locations shown in Figure 18b. P has not been included in the resources Table 3 due to its proximity to the water-treatment plant, and the 15kt Black (stack) probably will not be mined either due to its proximity to the Main Stack. A number of the waste dumps such as B, K etc on the 1926 plan in Figure 11a, resulted from the development of various levels and were dumped on the hillside, but then left behind as the open-cut was mined out behind them.
One of the relatively sizeable waste dumps is “B” dump. Although the table states “conceptual target”, the range has been based on previous work and polygonal calculations. B dump can be seen in Figure 19a to be layered with higher grades in the striations as per the section in Figure 19b, and may be susceptible to being upgraded through ore sorting. The fineness of the dump (like a number of the dumps) is because they were development waste – in B’s case being mined between 1904 and 1913. Of the other dumps, the higher grades as shown in Table 3 are in C and Q, with their locations in Figure 18b.
Figure 19. Views and Cross-section of the Layered “B” Waste Dump a. Views of the Striated / Layered “B” Dump
b. Cross-section through “B” Waste Dump
However, of the possible other ore sources: Sandstone Gully would have to contain the highest potential. Aside from the visible tailings in the walls as shown in Figures 20a & 20b as it was not completely mined – the higher tail grades should be at the bottom based on processing, and the wall between the pits prematurely failed. The gap between the pits could easily contain >1mt, and the grades @ ~650t/qtr treated in Table 1 before the failure (at ~48% gold recoveries), were: 1.42g/t (S89), 1.50g/t (D89), 1.87g/t (M90), 1.54g/t (J90), and 1.27g/t (S90), ie potentially much higher than the 1.0g/t to 1.2g/t target resource.
Figure 20. Views of Sandstone Gully a. Views of the Western End of Sandstone Gully
b. Views of the Eastern End of Sandstone Gully
Mining, Treatment and Marketing The proposed treatment plant is to be located on the SE wall of Sandstone Gully as shown in Figure 21a.
Figure 21. Location of the Planned Plant in Sandstone Gully, and Schematic of the Processing Route a. Location of Planned Plant in Sandstone Gully
b. Schematic of the Processing Route to the 3 Products
12
The original location for the plant was to be over the Grasstree area of the old plant, however, it was soon recognised that it would take time to obtain the required heritage clearances and the heritage areas could restrict the footprint chosen. Consequently the site currently chosen is that in Figure 21a (in Sandstone Gully), which has a number of benefits in addition to not being visual from the town viewpoints, with any operating noise deflected by the natural bund of the Airfield waste dump.
Other companies have considered treating MM, but have usually come unstuck over how to handle the copper and consequent high cyanide consumption, whereas CRB’s process extracts it up front. The planned treatment route shown in Figure 21b, generates three saleable products, namely copper sulphate, pyrite and gold dore. Basically the ore/tailings below a specific size is repulped with water from the open-cut before scrubbing and entry into the processing circuit. Copper is extracted first using leaching followed by a resin-in-pulp process with the solution then passing through a copper stripping circuit with the copper solution reporting to the copper crystallizer to produce copper sulphate. After the copper circuit the material is reground in a ball mill and then passes via cyclones into the flotation circuit.
The flotation circuit separates the sulphides and the silicates, with the silicates (post thickening) going directly to the gold circuit. The sulphides go through concentrate leaching prior to filtration into unroasted pyrite cons. The sulphide leach and silicate leach then report to standard gold CIL for gold leaching, elution and production of gold(-silver) dore bars.
The copper sulphate (of ~3 to 4ktpa) is expected to be sold locally (for fertilizer), typically selling for ~A$500/t above the spot price of copper. The sale of gold dore is obviously straightforward, however it is the pyrite market that appears to hold the most upside potential, because MM’s pyrite appears to be capable of being sold as “premium pyrite”.
While the main use of pyrite (53.4%S, 46.6%Fe) is in the production of sulphuric acid for fertiliser (~50%), metal processing (~10%), and phosphates (~6%), its pricing depends on the content of what deleterious impurities it has, such as mercury, arsenic etc, and whether its sulphur content is >49.5% (pure pyrite being 53.4%S). However, the premium pyrite category has >49.5%S and low deleterious impurities for industrial applications : such as lithium batteries, stainless steel and grinding wheels.
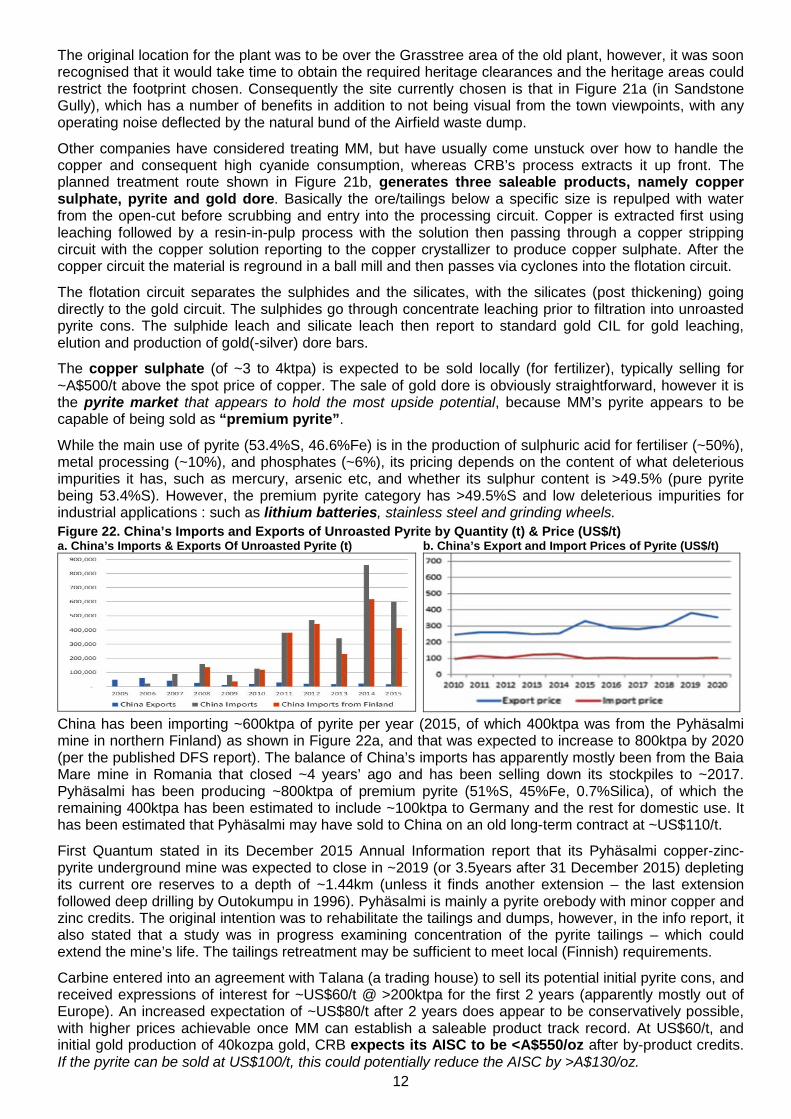
Figure 22. China’s Imports and Exports of Unroasted Pyrite by Quantity (t) & Price (US$/t) a. China’s Imports & Exports Of Unroasted Pyrite (t)
b. China’s Export and Import Prices of Pyrite (US$/t)
China has been importing ~600ktpa of pyrite per year (2015, of which 400ktpa was from the Pyhäsalmi mine in northern Finland) as shown in Figure 22a, and that was expected to increase to 800ktpa by 2020 (per the published DFS report). The balance of China’s imports has apparently mostly been from the Baia Mare mine in Romania that closed ~4 years’ ago and has been selling down its stockpiles to ~2017. Pyhäsalmi has been producing ~800ktpa of premium pyrite (51%S, 45%Fe, 0.7%Silica), of which the remaining 400ktpa has been estimated to include ~100ktpa to Germany and the rest for domestic use. It has been estimated that Pyhäsalmi may have sold to China on an old long-term contract at ~US$110/t.
First Quantum stated in its December 2015 Annual Information report that its Pyhäsalmi copper-zinc-pyrite underground mine was expected to close in ~2019 (or 3.5years after 31 December 2015) depleting its current ore reserves to a depth of ~1.44km (unless it finds another extension – the last extension followed deep drilling by Outokumpu in 1996). Pyhäsalmi is mainly a pyrite orebody with minor copper and zinc credits. The original intention was to rehabilitate the tailings and dumps, however, in the info report, it also stated that a study was in progress examining concentration of the pyrite tailings – which could extend the mine’s life. The tailings retreatment may be sufficient to meet local (Finnish) requirements.
Carbine entered into an agreement with Talana (a trading house) to sell its potential initial pyrite cons, and received expressions of interest for ~US$60/t @ >200ktpa for the first 2 years (apparently mostly out of Europe). An increased expectation of ~US$80/t after 2 years does appear to be conservatively possible, with higher prices achievable once MM can establish a saleable product track record. At US$60/t, and initial gold production of 40kozpa gold, CRB expects its AISC to be <A$550/oz after by-product credits. If the pyrite can be sold at US$100/t, this could potentially reduce the AISC by >A$130/oz.
13
Upside Potential Although the key area to CRB’s upside potential appears to be the pyrite market, Carbine may appeal to a larger audience of investor funds as it would be improving the environment, and hence may qualify for inclusion in the suite of investments for ethical/environmental/green funds.
One would have thought that the geology of Mount Morgan would have been detailed from day one, but it wasn’t. It seems that MM was regarded as all defined ore and the geos were only brought in when the orebody appeared to peter out, with the first grade control being in the 1970s. However by the late 1970s, it was too late, the copper price was falling again, and zinc mineralisation was being encountered. The mine closed the first time in the mid-1920s due to low copper prices (not due to the fire in 1925), having effectively closed in 1923 (two years after the copper price collapse in 1921) with ongoing wage strikes after that - some against the planned open-cut (before the fire) that was initially determined as uneconomic. The Linda inclined shaft was developed on the basis that it was above an inclined fault which sealed the mine’s profile. Yes the fire and consequent flooding did close the mine in 1925.
The Sugarloaf mine was known (it even had an old shaft sunk through it) but was not mined because it had a high copper content, and the mineralisation lay under low-grade pyrite alteration. Which makes Sandstone Gully all the more interesting, as it was initially ignored because it only had low grade pyrite mineralisation (see Figure 7a) and was effectively sterilised from 1948 by the tailings being deposited into it. The “boot-shaped” link between the Main orebody and Sugarloaf only occurred after drilling in 1949 and its subsequent mining from 1963 (after the overburden had gradually been removed).
The second time the mine temporarily closed was again due to low copper prices and possibly because the open-cut breached into Sandstone Gully – there is a picture that shows Sandstone Gully’s tailings exposed and leaking in the wall of the open-cut (and also inferable from the 1980 (Figure 11b) plan of the open-cut), plus encountering zinc mineralisation. The failure may have also been due to the fact that the original Mundic Gully river course passes through that position (as shown in the 1926 plan of Figure 11a).
That caused the switch to tailings retreatment of Sandstone Gully, with the tailings going into the Main pit. The tailings retreatment operated fairly well with reasonable grades and low-ish cash costs as shown in Table 1 and was expected to continue for a number of years when the July 1988 photo (Figure 4a) was taken (with ore reserves in 1987 of 25.3mt @ 1.7g/tAu). Although Peko Wallsend was then taken over by North Broken Hill (NBH) to form NBH Peko with the 60% holding in Mount Morgan sold to Elders (ELD).
Whether the pillar/wall between the pits was subsequently mined too narrowly by the new ELD/PGO (Poseidon Gold [Normandy]) JV is not known, but in ~July 1990 it failed, possibly at the same position as the earlier failure and either due to that or the original river course. And hence the mine prematurely closed, with the QLD Government assuming responsibility for the environmental clean-up from 1993.
Consequently there actually appears to be a number of potential near surface exploration targets (in addition to the significantly deeper targets), such as :
• Under the old plant (there’s that adit/drive going into the Grasstree workings [of Figure 8b]) but probably limited by potential damage to some of the heritage assets.
• Under/within the main orebody – it is not clear that the orebody was mined to its boundaries (especially based on the sections on which the subsequent open-cut was mined such as Figure 3a), and there are those references to zinc mineralisation being encountered at depth. There are also references to the mine being ~300m deep but that includes from the top of the original ~100m high hill that was removed, so hence the old mine should currently be closer to ~200m deep.
• Under Sandstone Gully – effectively sterilised by the tailings since 1948, and subsequent surface water – expected to be dewatered within 3 years, with tailings exposed at the western end too.
Added to which there has to be the pyrite possibilities such as that pyrite dump stockpile (Figure 6b) next to the planned plant and whether the “Car Park” mineralisation can be bulk mined in the future, and how the other dump stockpiles (such as B, K and Q) are going to “fit” into the production process and whether they are to be upgraded through ore-sorting.
CRB’s DFS shows a conservative base case for production that appears to be easily achievable, and consequently should have plenty of room for material upside from a range of sources, in grade, throughput and life. Financial Considerations Carbine has projected an initial mine life of 9 years, based on treating the ~10mt ore reserve at ~1.1mtpa, with (according to the DFS), initial production over the first 4 years of ~38kozpaAu, ~4ktpaCu sulphate and ~218ktpa of premium pyrite cons. From years 5 to 9 production averages ~23kozpaAu, ~4ktpa Cu sulphate and ~200ktpa premium pyrite cons. However, that has been based on the 4 ore reserve sources.
14
In the construction period, the non-JORC 2012 tailings at the western end of Sandstone Gully seem likely to be mined and stockpiled. It has been estimated that to dewater Sandstone Gully could take ~2.5 years, after which Sandstone Gully’s tailings could begin to come into the production schedule (and probably at higher grades than 1g/tAu, based on those being mined in Table 1 and with quarterly detail above Figure 20; ahead of the wall failure). Just what quantity of tailings may be involved could be anything up to ~3mt. Table 3 on page 10 of this report has a conceptual target range of 0.5mt to 1.4mt.
The scheduling could also change if there is any exploration success under Sandstone Gully as it seems to have initially been ignored after 1895, but there are those assay results and richly coloured clustering, inset in Figure 7a.
The dewatering of the remainder of the pit has been estimated to take possibly ~ 7years (a clearer picture should emerge after Sandstone Gully has been dewatered). This consequently provides one of the expanded case scenarios, resulting in a ~20-year mine life, based on treating the then surface/top (theoretically higher grade) of the exposed tailings in the original open-cut for a further ~10 years. An alternative scenario utilises a mix of the inferred resources and conceptual exploration target discoveries.
It should be recognised that the DFS is really a base case scenario that appears likely to change as different higher grade ore resources are identified and at some stage mined and treated. There is also the case of what the QLD Govt wants to do with the Red oxide in the Frogs Hollow area (see Figure 18a) on the edge of / slightly outside of the expected ML. The QLD Govt took environmental responsibility for the MM mine site in 1993, and constructed the water treatment plant. Apparently a larger water treatment plant was planned, however, with rising capital costs, its size was reduced. The annual cost to the QLD Govt is apparently ~$2m to ~$3mpa, with reputedly over $70m spent since 1993 to-date, on the plant, its annual cost, and other areas pumping peripheral acidic water back into the old open-cut.
The mining plan includes mining Mundic Gully, currently designed with a ~50m wide pillar between Mundic Gully and the old open-pit. Whether this is sufficient or not is to be the study of a geotech evaluation in 1 years’ time to assess whether a suitable engineered wall may be required.
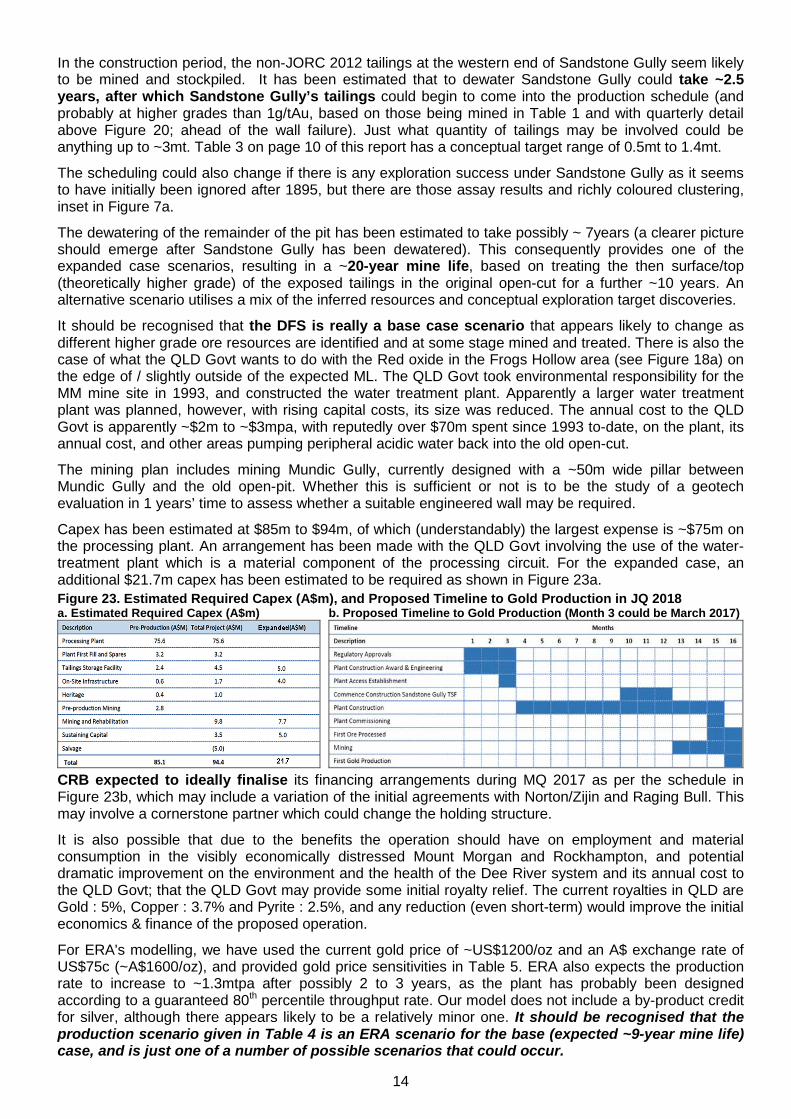
Capex has been estimated at $85m to $94m, of which (understandably) the largest expense is ~$75m on the processing plant. An arrangement has been made with the QLD Govt involving the use of the water-treatment plant which is a material component of the processing circuit. For the expanded case, an additional $21.7m capex has been estimated to be required as shown in Figure 23a.
Figure 23. Estimated Required Capex (A$m), and Proposed Timeline to Gold Production in JQ 2018 a. Estimated Required Capex (A$m)
b. Proposed Timeline to Gold Production (Month 3 could be March 2017)
CRB expected to ideally finalise its financing arrangements during MQ 2017 as per the schedule in Figure 23b, which may include a variation of the initial agreements with Norton/Zijin and Raging Bull. This may involve a cornerstone partner which could change the holding structure.
It is also possible that due to the benefits the operation should have on employment and material consumption in the visibly economically distressed Mount Morgan and Rockhampton, and potential dramatic improvement on the environment and the health of the Dee River system and its annual cost to the QLD Govt; that the QLD Govt may provide some initial royalty relief. The current royalties in QLD are Gold : 5%, Copper : 3.7% and Pyrite : 2.5%, and any reduction (even short-term) would improve the initial economics & finance of the proposed operation.
For ERA's modelling, we have used the current gold price of ~US$1200/oz and an A$ exchange rate of US$75c (~A$1600/oz), and provided gold price sensitivities in Table 5. ERA also expects the production rate to increase to ~1.3mtpa after possibly 2 to 3 years, as the plant has probably been designed according to a guaranteed 80th percentile throughput rate. Our model does not include a by-product credit for silver, although there appears likely to be a relatively minor one. It should be recognised that the production scenario given in Table 4 is an ERA scenario for the base (expected ~9-year mine life) case, and is just one of a number of possible scenarios that could occur.
15
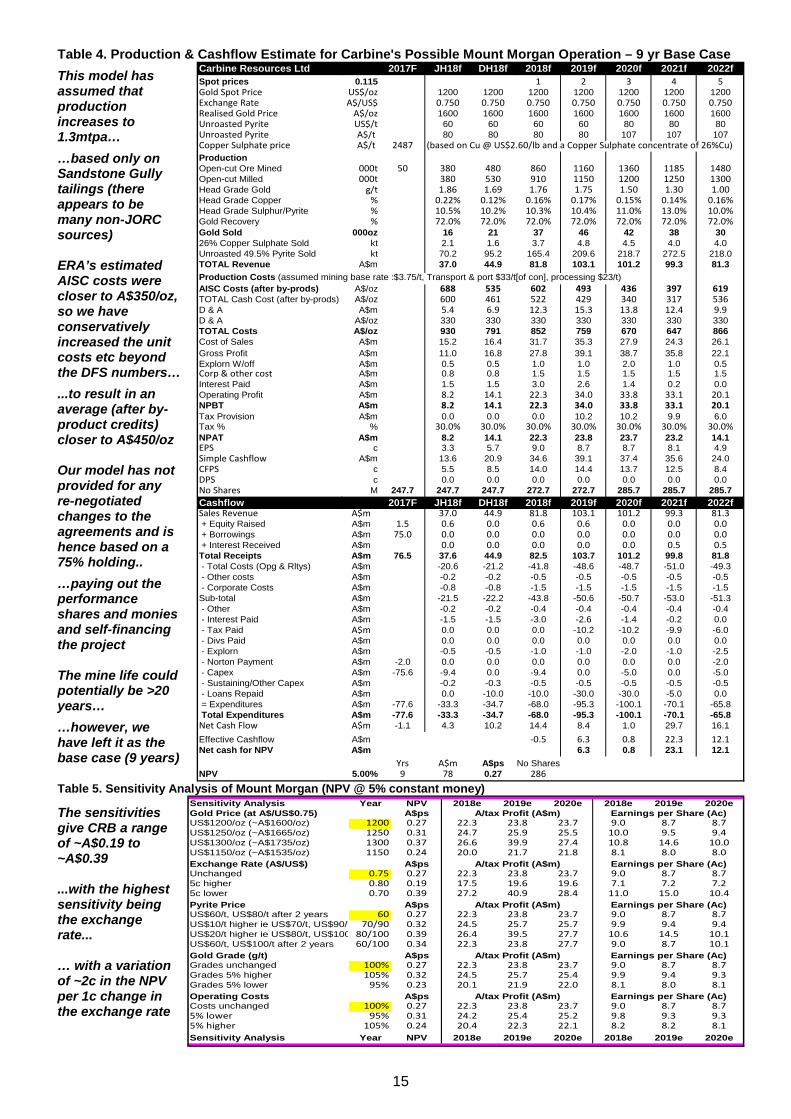
Table 4. Production & Cashflow Estimate for Carbine's Possible Mount Morgan Operation – 9 yr Base Case
This model has assumed that production increases to 1.3mtpa…
…based only on Sandstone Gully tailings (there appears to be many non-JORC sources) ERA’s estimated AISC costs were closer to A$350/oz, so we have conservatively increased the unit costs etc beyond the DFS numbers…
...to result in an average (after by-product credits) closer to A$450/oz Our model has not provided for any re-negotiated changes to the agreements and is hence based on a 75% holding..
…paying out the performance shares and monies and self-financing the project The mine life could potentially be >20 years…
…however, we have left it as the base case (9 years)
Carbine Resources Ltd 2017F JH18f DH18f 2018f 2019f 2020f 2021f 2022fSpot prices 0.115 1 2 3 4 5Gold Spot Price US$/oz 1200 1200 1200 1200 1200 1200 1200Exchange Rate A$/US$ 0.750 0.750 0.750 0.750 0.750 0.750 0.750Realised Gold Price A$/oz 1600 1600 1600 1600 1600 1600 1600Unroasted Pyrite US$/t 60 60 60 60 80 80 80Unroasted Pyrite A$/t 80 80 80 80 107 107 107Copper Sulphate price A$/t 2487 (based on Cu @ US$2.60/lb and a Copper Sulphate concentrate of 26%Cu)ProductionOpen-cut Ore Mined 000t 50 380 480 860 1160 1360 1185 1480Open-cut Milled 000t 380 530 910 1150 1200 1250 1300Head Grade Gold g/t 1.86 1.69 1.76 1.75 1.50 1.30 1.00Head Grade Copper % 0.22% 0.12% 0.16% 0.17% 0.15% 0.14% 0.16%Head Grade Sulphur/Pyrite % 10.5% 10.2% 10.3% 10.4% 11.0% 13.0% 10.0%Gold Recovery % 72.0% 72.0% 72.0% 72.0% 72.0% 72.0% 72.0%Gold Sold 000oz 16 21 37 46 42 38 3026% Copper Sulphate Sold kt 2.1 1.6 3.7 4.8 4.5 4.0 4.0Unroasted 49.5% Pyrite Sold kt 70.2 95.2 165.4 209.6 218.7 272.5 218.0TOTAL Revenue A$m 37.0 44.9 81.8 103.1 101.2 99.3 81.3Production Costs (assumed mining base rate :$3.75/t, Transport & port $33/t[of con], processing $23/t)AISC Costs (after by-prods) A$/oz 688 535 602 493 436 397 619TOTAL Cash Cost (after by-prods) A$/oz 600 461 522 429 340 317 536D & A A$m 5.4 6.9 12.3 15.3 13.8 12.4 9.9D & A A$/oz 330 330 330 330 330 330 330TOTAL Costs A$/oz 930 791 852 759 670 647 866Cost of Sales A$m 15.2 16.4 31.7 35.3 27.9 24.3 26.1Gross Profit A$m 11.0 16.8 27.8 39.1 38.7 35.8 22.1Explorn W/off A$m 0.5 0.5 1.0 1.0 2.0 1.0 0.5Corp & other cost A$m 0.8 0.8 1.5 1.5 1.5 1.5 1.5Interest Paid A$m 1.5 1.5 3.0 2.6 1.4 0.2 0.0Operating Profit A$m 8.2 14.1 22.3 34.0 33.8 33.1 20.1NPBT A$m 8.2 14.1 22.3 34.0 33.8 33.1 20.1Tax Provision A$m 0.0 0.0 0.0 10.2 10.2 9.9 6.0Tax % % 30.0% 30.0% 30.0% 30.0% 30.0% 30.0% 30.0%NPAT A$m 8.2 14.1 22.3 23.8 23.7 23.2 14.1EPS c 3.3 5.7 9.0 8.7 8.7 8.1 4.9Simple Cashflow A$m 13.6 20.9 34.6 39.1 37.4 35.6 24.0CFPS c 5.5 8.5 14.0 14.4 13.7 12.5 8.4DPS c 0.0 0.0 0.0 0.0 0.0 0.0 0.0No Shares M 247.7 247.7 247.7 272.7 272.7 285.7 285.7 285.7Cashflow 2017F JH18f DH18f 2018f 2019f 2020f 2021f 2022fSales Revenue A$m 37.0 44.9 81.8 103.1 101.2 99.3 81.3 + Equity Raised A$m 1.5 0.6 0.0 0.6 0.6 0.0 0.0 0.0 + Borrowings A$m 75.0 0.0 0.0 0.0 0.0 0.0 0.0 0.0 + Interest Received A$m 0.0 0.0 0.0 0.0 0.0 0.5 0.5Total Receipts A$m 76.5 37.6 44.9 82.5 103.7 101.2 99.8 81.8 - Total Costs (Opg & Rltys) A$m -20.6 -21.2 -41.8 -48.6 -48.7 -51.0 -49.3 - Other costs A$m -0.2 -0.2 -0.5 -0.5 -0.5 -0.5 -0.5 - Corporate Costs A$m -0.8 -0.8 -1.5 -1.5 -1.5 -1.5 -1.5Sub-total A$m -21.5 -22.2 -43.8 -50.6 -50.7 -53.0 -51.3 - Other A$m -0.2 -0.2 -0.4 -0.4 -0.4 -0.4 -0.4 - Interest Paid A$m -1.5 -1.5 -3.0 -2.6 -1.4 -0.2 0.0 - Tax Paid A$m 0.0 0.0 0.0 -10.2 -10.2 -9.9 -6.0 - Divs Paid A$m 0.0 0.0 0.0 0.0 0.0 0.0 0.0 - Explorn A$m -0.5 -0.5 -1.0 -1.0 -2.0 -1.0 -2.5 - Norton Payment A$m -2.0 0.0 0.0 0.0 0.0 0.0 0.0 -2.0 - Capex A$m -75.6 -9.4 0.0 -9.4 0.0 -5.0 0.0 -5.0 - Sustaining/Other Capex A$m -0.2 -0.3 -0.5 -0.5 -0.5 -0.5 -0.5 - Loans Repaid A$m 0.0 -10.0 -10.0 -30.0 -30.0 -5.0 0.0 = Expenditures A$m -77.6 -33.3 -34.7 -68.0 -95.3 -100.1 -70.1 -65.8 Total Expenditures A$m -77.6 -33.3 -34.7 -68.0 -95.3 -100.1 -70.1 -65.8Net Cash Flow A$m -1.1 4.3 10.2 14.4 8.4 1.0 29.7 16.1Effective Cashflow A$m -0.5 6.3 0.8 22.3 12.1Net cash for NPV A$m 6.3 0.8 23.1 12.1
Yrs A$m A$ps No SharesNPV 5.00% 9 78 0.27 286
Table 5. Sensitivity Analysis of Mount Morgan (NPV @ 5% constant money)
The sensitivities give CRB a range of ~A$0.19 to ~A$0.39 ...with the highest sensitivity being the exchange rate... … with a variation of ~2c in the NPV per 1c change in the exchange rate
Sensitivity Analysis Year NPV 2018e 2019e 2020e 2018e 2019e 2020eGold Price (at A$/US$0.75) A$ps A/tax Profit (A$m) Earnings per Share (Ac)US$1200/oz (~A$1600/oz) 1200 0.27 22.3 23.8 23.7 9.0 8.7 8.7US$1250/oz (~A$1665/oz) 1250 0.31 24.7 25.9 25.5 10.0 9.5 9.4US$1300/oz (~A$1735/oz) 1300 0.37 26.6 39.9 27.4 10.8 14.6 10.0US$1150/oz (~A$1535/oz) 1150 0.24 20.0 21.7 21.8 8.1 8.0 8.0Exchange Rate (A$/US$) A$ps A/tax Profit (A$m) Earnings per Share (Ac)Unchanged 0.75 0.27 22.3 23.8 23.7 9.0 8.7 8.75c higher 0.80 0.19 17.5 19.6 19.6 7.1 7.2 7.25c lower 0.70 0.39 27.2 40.9 28.4 11.0 15.0 10.4Pyrite Price A$ps A/tax Profit (A$m) Earnings per Share (Ac)US$60/t, US$80/t after 2 years 60 0.27 22.3 23.8 23.7 9.0 8.7 8.7US$10/t higher ie US$70/t, US$90/t 70/90 0.32 24.5 25.7 25.7 9.9 9.4 9.4US$20/t higher ie US$80/t, US$100 80/100 0.39 26.4 39.5 27.7 10.6 14.5 10.1US$60/t, US$100/t after 2 years 60/100 0.34 22.3 23.8 27.7 9.0 8.7 10.1Gold Grade (g/t) A$ps A/tax Profit (A$m) Earnings per Share (Ac)Grades unchanged 100% 0.27 22.3 23.8 23.7 9.0 8.7 8.7Grades 5% higher 105% 0.32 24.5 25.7 25.4 9.9 9.4 9.3Grades 5% lower 95% 0.23 20.1 21.9 22.0 8.1 8.0 8.1Operating Costs A$ps A/tax Profit (A$m) Earnings per Share (Ac)Costs unchanged 100% 0.27 22.3 23.8 23.7 9.0 8.7 8.75% lower 95% 0.31 24.2 25.4 25.2 9.8 9.3 9.35% higher 105% 0.24 20.4 22.3 22.1 8.2 8.2 8.1Sensitivity Analysis Year NPV 2018e 2019e 2020e 2018e 2019e 2020e
16
Management
Board of Directors John Fitzgerald – Non-Executive Chairman since 2016. John has over 25 years’ experience as a mining and finance executive, having held a number of senior positions with NM Rothschild, Investec, CBA & HSBC Precious Metals. John holds and has held other directorship positions in listed ASX companies. Tony James – Managing Director since 2016. Tony is a Mining Engineer with over 25 years’ experience in gold and nickel in WA, mostly underground. Tony was previously MMU at Kanowna Belle, and GMU at Black Swan, and brought Avoca’s Higginsville gold mine into production. More recently, Tony turned around Atherton’s Mungana (ATE) which was taken over by Auctus Minerals, and Mutiny’s Deflector copper-gold mine taken over by Doray (DRM). Graham Brock – Non-Executive Director since 2016. Graham is a metallurgist with over 40 years’ experience in the mining industry, mostly in gold and base metal operations. Graham has been involved in the successful development of a number of Australian and international mines. Evan Cranston - Non-Executive Director since 2010. Evan is a lawyer with over 10 years’ experience, specialising in corporate and mining law, with consequent extensive experience in corporate finance and M & A. Evan holds and has held other directorship positions in listed ASX companies. Company Secretary – Ms Oonagh Malone
Senior Management Terry Moylan – COO since 2015. Terry is a mechanical engineer with 48 years’ experience as an engineer, operations manager and project manager in several metal commodities in Australia and overseas. Terry was previously the GM Projects & Business Development at Norton Goldfields which included the Mount Morgan project. Chris Newman – Geology Manager since 2016. Chris is a geologist with over 25 years’ experience mainly in WA. Chris was Senior Mine Geologist at the Victory Gold Complex and St Ives. Chris is credited with having recognised and discovered the Trident gold mine at Higginsville that led to the success of Avoca and Alacer. Gus Phillips – Site Manager since 2016. Gus is a metallurgist with over 20 years’ experience in the gold and tungsten industry having commissioned several gold processing facilities within Australia and overseas. Gus has held a number of senior positions in Process, Project & General Management, recently being a CEO in 2 producers. Russell Dann – Project Specialist since 2015. Russell is a geologist with over 40 years’ experience in Australia and overseas in exploration and senior management roles, which included 10 years with the QLD Government, managing the Abandoned Mine Land Program and a period as Regional Director for Mines, in Central Queensland.
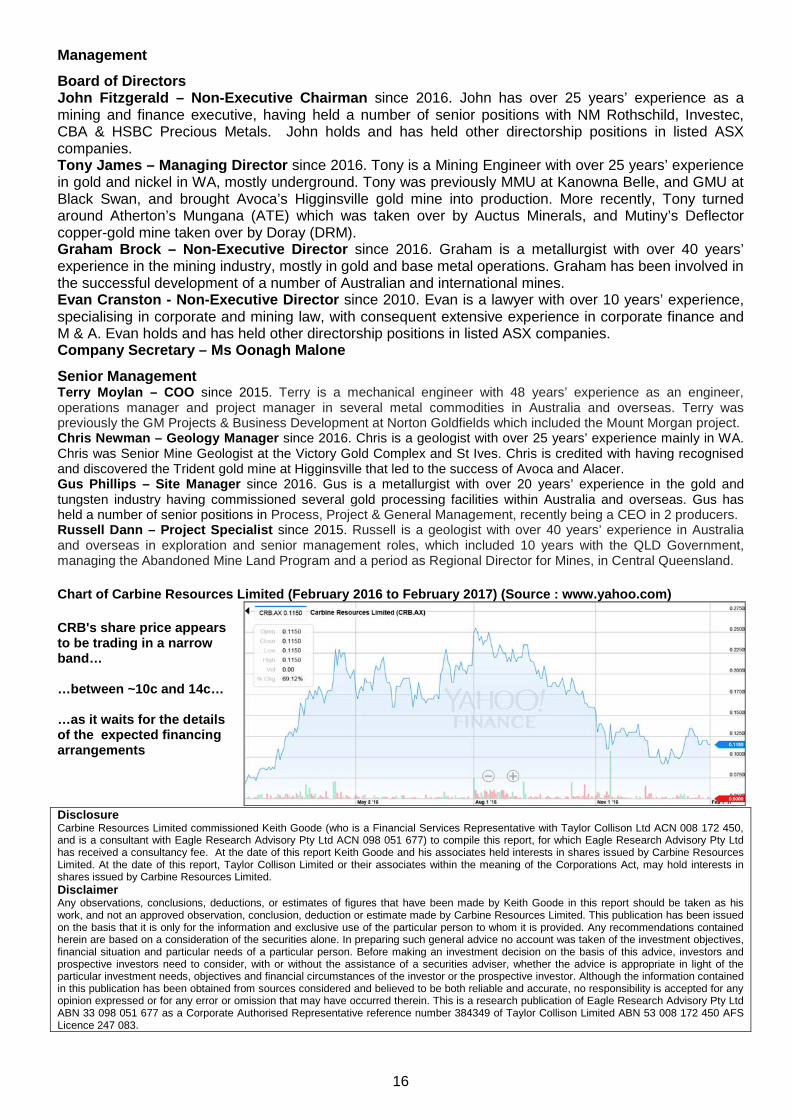
Chart of Carbine Resources Limited (February 2016 to February 2017) (Source : www.yahoo.com)
CRB's share price appears to be trading in a narrow band… …between ~10c and 14c… …as it waits for the details of the expected financing arrangements
Disclosure Carbine Resources Limited commissioned Keith Goode (who is a Financial Services Representative with Taylor Collison Ltd ACN 008 172 450, and is a consultant with Eagle Research Advisory Pty Ltd ACN 098 051 677) to compile this report, for which Eagle Research Advisory Pty Ltd has received a consultancy fee. At the date of this report Keith Goode and his associates held interests in shares issued by Carbine Resources Limited. At the date of this report, Taylor Collison Limited or their associates within the meaning of the Corporations Act, may hold interests in shares issued by Carbine Resources Limited. Disclaimer Any observations, conclusions, deductions, or estimates of figures that have been made by Keith Goode in this report should be taken as his work, and not an approved observation, conclusion, deduction or estimate made by Carbine Resources Limited. This publication has been issued on the basis that it is only for the information and exclusive use of the particular person to whom it is provided. Any recommendations contained herein are based on a consideration of the securities alone. In preparing such general advice no account was taken of the investment objectives, financial situation and particular needs of a particular person. Before making an investment decision on the basis of this advice, investors and prospective investors need to consider, with or without the assistance of a securities adviser, whether the advice is appropriate in light of the particular investment needs, objectives and financial circumstances of the investor or the prospective investor. Although the information contained in this publication has been obtained from sources considered and believed to be both reliable and accurate, no responsibility is accepted for any opinion expressed or for any error or omission that may have occurred therein. This is a research publication of Eagle Research Advisory Pty Ltd ABN 33 098 051 677 as a Corporate Authorised Representative reference number 384349 of Taylor Collison Limited ABN 53 008 172 450 AFS Licence 247 083.