Embed Size (px)
Citation preview
Projects & Engineering
UK & Ireland Operated Projects
Decommissioning Strategy
Page 1 of 126
Goldeneye Decommissioning
Environmental Appraisal Report Project Goldeneye Decommissioning
Client Shell UK
Shell Document Number GDP-PT-S-HE-0702-00003
Originating Company
Document Number N/A
Security Classification Unrestricted
ECCN EAR 99
Revision History is shown next page
Goldeneye Decommissioning Environmental Appraisal Report Revision: A02
Page 2 of 126
Doc. no. GDP-PT-S-HE-0702-00003
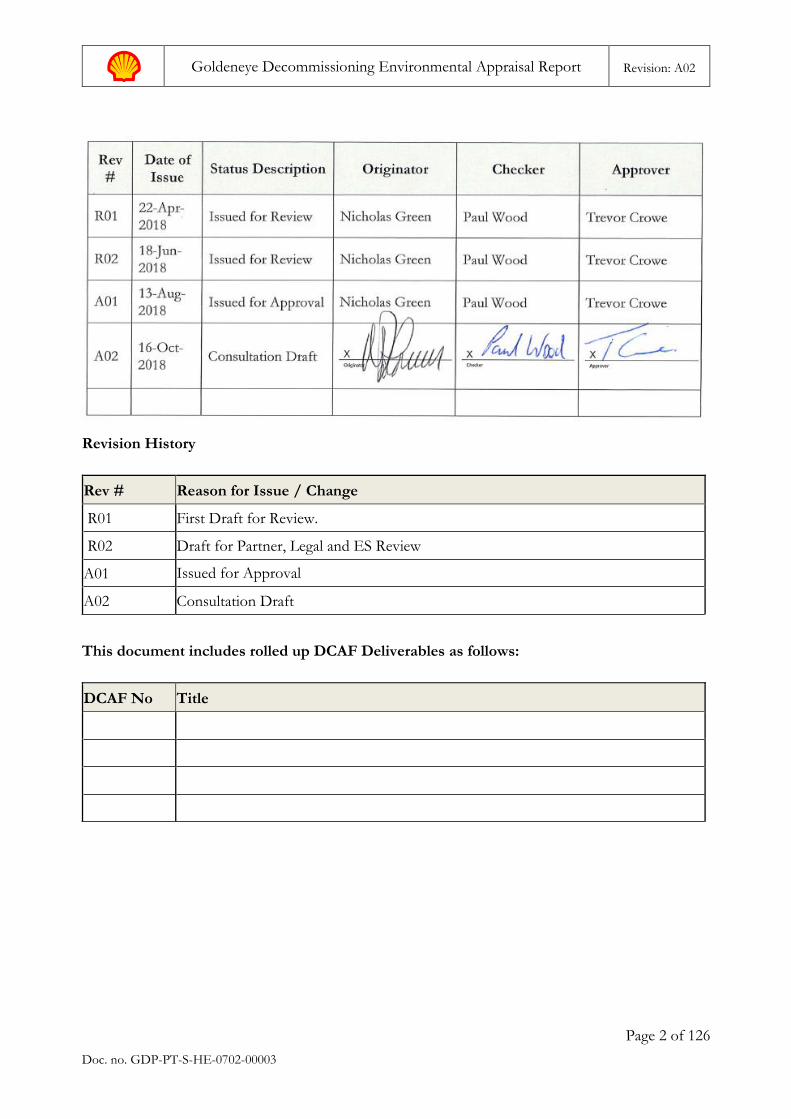
Revision History
Rev # Reason for Issue / Change
R01 First Draft for Review.
R02 Draft for Partner, Legal and ES Review
A01 Issued for Approval
A02 Consultation Draft
This document includes rolled up DCAF Deliverables as follows:
DCAF No Title
Goldeneye Decommissioning Environmental Appraisal Report Revision: A02
Page 3 of 126
Doc. no. GDP-PT-S-HE-0702-00003
Non-Technical Summary
Introduction
This Environmental Appraisal (EA) documents the environment and societal impacts assessment
carried out in support of the Goldeneye Decommissioning Programmes (DP). The DP
documentation contains full details of Shell’s plans to decommission the Goldeneye offshore
facilities, although some information has been repeated in this report to aid the understanding of
the context for assessing the significance of potential environmental and societal impact.
The Goldeneye field is a gas condensate field in Block 14/29 of the central North Sea in 120 m
water depth. The field is located approximately 100 km east-northeast of the St Fergus Gas Plant
near Peterhead, Scotland.
Facilities in the Goldeneye field consist of a platform comprising a topsides and a steel framed
jacket installed in 2004. The platform was designed and operated as a normally unattended
installation with control from the St Fergus Gas Plant. Production was between 2004 and 2011
from five wells, with wellheads located on the platform topsides. In addition to the wellheads, the
topsides provided fiscal metering, basic supporting utilities and facilities for short stay
accommodation of up to 12 persons.
Produced fluids from the platform were transported to the St Fergus Gas Plant for processing
through a dedicated 102 km, 20″ diameter export pipeline made of concrete-coated steel. The
pipeline is buried to a depth of at least 1 m for the 610 m from the intertidal zone to the fenceline
of the gas plant. The pipeline is also buried to a distance of 20 km offshore, and thereafter surface
laid for 82 km to the platform location. A 102 km, 4″ diameter supply line, made of bonded epoxy
coated steel, fed hydrate inhibitor to the wellheads from the St Fergus plant onshore. The 4″ line
is piggy backed to the export pipeline up to a transition point at a distance of 20 km offshore,
where it diverges on its own route to the platform. The 4″ pipeline is buried along its entire length.
Both pipelines were flushed of hydrocarbons and chemicals in 2013 and flooded with freshwater
and corrosion inhibitor in readiness for final decommissioning.
A subsea isolation valve is situated on the pipeline within 100 m of the platform.
Following the cessation of production, the topsides piping and equipment were vented, flushed
and left isolated in 2012. The five wells were plugged and made safe in 2018 and all remaining
fluids, such as diesel, hydraulic oils and lubes, were removed from the platform topsides at this
time. The platform will remain as a permanently unattended installation from October 2018 until
the final platform removal works begin.
The DP, and this supporting EA, covers the decommissioning works for the offshore facilities. It
does not include decommissioning of onshore infrastructure which is permitted by Aberdeenshire
Council under the Town & Country Planning Regulations.
Summary of Planned Decommissioning Works
It is acknowledged that the decommissioning works are subject to an approved DP, but the
recommendations in the DP include the following activities, on which the EA has been based:
• The platform topsides and jacket will be removed from their location and recovered to a
shore yard for dismantling and recycling;
• The subsea infrastructure, including isolation valve and connection spools, will be
removed and recovered to a shore yard for dismantling;
Goldeneye Decommissioning Environmental Appraisal Report Revision: A02
Page 4 of 126
Doc. no. GDP-PT-S-HE-0702-00003
• The 20″ export pipeline will be decommissioned in situ. The pipeline end offshore will be
capped and the surface laid section buried below the seabed except at locations where
the line is crossed by other pipelines used by third parties, and at the transition point
where the 20″ export pipeline and 4″ supply pipeline diverge;
• The 4″ supply pipeline will be decommissioned in situ;
• Exposed pipeline stabilisation features (concrete mattresses and grout bags) will be
removed. Those required for ongoing stabilisation of the pipelines, e.g. for the protection
of pipeline crossings, are currently covered with rock and will remain in situ;
• Steel piles that attach the platform jacket and the subsea isolation valve unit to the seabed
will be cut below seabed level to enable their removal;
• Following pipeline burial, a depth survey will determine any area of the pipelines that are
buried to a depth of less than 0.6 m. These areas will be assessed for potential risk of
snagging of fishing gear. Some sections may require additional rock cover to mitigate this
risk;
• Depressions caused by activities from the drilling of the wells, production at the field and
its decommissioning that could potentially cause a risk to other users of the sea will be
made safe by use of rock cover. This may include e.g. spud cans and anchor scars; and
• Any oil and gas operations related debris on the seabed within the 500 m safety zone
around the platform, and along the pipeline corridor will be removed where feasible.
The decommissioning activities will utilise a variety of vessels, with an anticipated aggregate of 300
vessel-days’ service. A guard vessel will be stationed at the platform location from the time when
Navigational Aids have been removed until the seabed is safe for other users of the sea.
Following completion of the decommissioning, surveys and overtrawl trials will be conducted to
demonstrate that the seabed has been left clear and safe.
It is possible that all works will be carried out in a single campaign. Shell will however consider
options from decommissioning contractors for phasing the removal activities over an extended
period of time if this flexibility provides more optimum delivery and cost savings.
Environmental Baseline Summary
The seabed sediment in the area around the Goldeneye platform is largely homogeneous
comprising poorly sorted silty fines, with the underlying layers of sediment comprising very soft
sandy clay and soft to firm clay. The platform area habitat is assigned to the EUNIS biotope
‘Circalittoral fine sand’ and is considered to support elements of the habitat for ‘Seapen and
burrowing megafauna communities’ that has been classed as a threatened and/or declining habitat
by OSPAR. This habitat type covers large areas of the central North Sea and has been degraded
through historical activities such as fish trawling. Juvenile stages of the long-lived bivalve Ocean
Quahog are present at the platform location but no adult examples of this species were identified
by environmental survey.
No oil based mud (OBM) was discharged during the drilling of the five wells and consequently
there are no OBM-contaminated cuttings piles at Goldeneye. Discharges of cuttings drilled with
water based mud (WBM) were likely to have taken place and bathymetry data shows evidence of
sediment disturbance under the platform which could be interpreted as being WBM cuttings.
Environmental survey has shown that the sediments around the platform show no sign of
hydrocarbon contamination.
Goldeneye Decommissioning Environmental Appraisal Report Revision: A02
Page 5 of 126
Doc. no. GDP-PT-S-HE-0702-00003
The seabed along the pipeline corridor includes sediment types typical of the wider central North
Sea. These comprise mainly ‘circalittoral mixed sediment’ out to approximately 45 km from shore.
The sandy areas exhibited low biodiversity, while areas which featured fragmented shells, gravel,
pebbles and cobbles exhibited relatively high biodiversity. Several depressions were observed,
most of which contained possible boulders of up to 1.2 m height. The reef-forming tube worm
species Sabellaria spinulosa has been observed at near shore sample locations (i.e. within 12 nautical
miles of the coast) along the Goldeneye pipeline route but at no point has a contiguous reef formed
along the surveyed route.
There are no designated areas of conservation interest in close proximity to the Goldeneye field.
The export and supply pipelines pass through the south-eastern section of the Southern Trench
proposed Marine Protected Area (pMPA) which has been proposed for the following features:
minke whale, ocean fronts, shelf deeps and burrowed mud habitat; and Submarine mass movement
– slide scars; Quaternary of Scotland sub-glacial tunnel valleys and moraine.
The pipeline landfall location is not a designated area of conservation interest. The nearest
conservation areas to the Goldeneye landfall include the Loch of Strathbeg Special Protection Area
(SPA) and Ramsar site 4.5 km to the north and the Buchan Ness to Collieston Coast SPA 10 km
to the south.
The Goldeneye platform is located on the edge of an area of Annex 1 habitat of submarine
structures that are formed by leaking gases, although active bubble streams were not evident in the
numerous pockmarks in the area. No Methane-Derived Authigenic Carbonate reefs have been
identified through survey near to the platform.
Moderate densities of harbour porpoise, white-beaked dolphin, Atlantic white-sided dolphin and
minke whale may be expected in the part of the central North Sea where the Goldeneye platform
and pipelines are located. Grey seals are also likely to occur here, in increasing numbers closer to
shore.
A large number of seabirds, of various species, inhabit the area of the decommissioning activities
at different seasons throughout the year, with high densities of combined species in July and
August. Vulnerability of seabirds to oil spills varies across the area and at different seasons,
reaching a level of Extremely High sensitivity nearshore in April and in October.
The Goldeneye installation and pipelines lie within spawning grounds for a number of fish species
of commercial and/or conservation importance. Of these, herring and sandeels spawn at the
seabed and would be vulnerable to seabed disturbance.
The nearshore area of the pipeline corridor is an important fishing ground for smaller vessels
while, for areas further offshore, fishing intensity from larger vessels is considered to be moderate
relative to activity throughout the rest of the UKCS.
Stakeholder Engagement
Shell has actively engaged with key external stakeholders to inform them of our intention to
decommission Goldeneye, discuss options and listen to stakeholder opinion and issues raised to
consider in the development of our decommissioning plans. Many of the issues raised relate to the
need to demonstrate an in depth understanding of the baseline environment and ensure protection
of sensitive features. These points have been addressed throughout the EA report.
In addition, Shell received requests to:
• Consider the retention of infrastructure that could be beneficial for future developments;
• Give due consideration to the size of rock selected for rock placement, where required,
as large rock sizes may present increased risks to the snagging of fishing equipment; and
Goldeneye Decommissioning Environmental Appraisal Report Revision: A02
Page 6 of 126
Doc. no. GDP-PT-S-HE-0702-00003
• Ensure that adequate care and attention is given to the lifting and transportation of the
major structures being removed and avoid loss at sea, to minimise the risk of structures
being lost at sea and the consequent impact to navigation or the environment.
Each of these requests was considered during planning and have been provided for:
• The pipelines will be capped and decommissioned in situ, protected from corrosion by
corrosion inhibitor added at the time of pipeline flushing and cleaning (covered in
Section 1.5.4).
• Shell will undertake to leave a clear and safe seabed following decommissioning in
accordance with the approved DP. This will be demonstrated through seabed surveys
and overtrawl trials. Where rock placement is required, the safety of other users of the
sea will be considered along with the goal of minimising disturbance of seabed habitats.
Both concerns are heightened where scallop fishing occurs within the waters of the
Southern Trench pMPA. Shell will develop a plan for rock cover on the basis of data
collected from post-decommissioning pipeline burial surveys and will liaise with the
relevant stakeholders to agree details of location, type and extent of rock cover required
(covered in Section 4.2.3 and 4.8.2.3).
• Shell will award the contract for the removal of the Goldeneye platform topsides and
jacket to a competent lifting contractor. A requirement of the contract award is that the
contractor provides and implements a comprehensive Lift Plan and Transit Plan which
will address the points more particularly set out in Section 4.7.2.
ENVID
Potential environmental and societal risks arising from the DP were determined through
Environmental Impact Identification (ENVID) workshop. The ENVID uses standard definitions
for rating the magnitude of impact based on the sensitivity of the receptor and the scale and
duration of the activities.
The ENVID, along with additional evaluation of options and subsequent analysis and study,
concluded that the decommissioning of Goldeneye would give rise to no impacts categorised as
“major” or “moderate”. Identified risks can be mitigated using standard control measures and
procedures due to the relatively small scale of the facilities to be decommissioned, the nature of
the activities to be carried out and the relatively short duration of these activities.
This EA report provides a robust justification for this conclusion by presenting the science,
reasoning and professional judgement that was used in drawing these conclusions. The following
summarises the key findings and mitigations planned for the DP. Further details are included in
the main body of the report.
Summary of Key Findings of the EA
The assessment considered potential impacts of planned activities and the risk of impacts from
unplanned events.
Planned Activities
Disturbance to Other Users of the Sea There will be a number of vessels active at sea during the planned decommissioning activities.
Vessels will be required for relatively short durations and will cause minimal interference to other
Goldeneye Decommissioning Environmental Appraisal Report Revision: A02
Page 7 of 126
Doc. no. GDP-PT-S-HE-0702-00003
users of the sea as most sea surface activity will be within the 500 m safety zone around the
platform from which other shipping is excluded.
Fishing activity along the pipeline route will not be permitted while pipeline decommissioning
activities from vessels are underway. These activities will be for limited short durations and will
be communicated through notices to Mariners and the Kingfisher Bulletin which will allow fishing
vessels to plan avoidance of these areas during periods of sea surface activity.
Adoption of the OSPAR goal of achieving a clear and safe seabed will minimise any potential risk
of snagging of fishing gear. Post decommissioning surveys and overtrawl trials will ensure potential
snagging points are identified and remedied.
Air Quality Emissions to air from the vessels and equipment required for execution of the DP constitute a
very minor addition to the overall emissions from routine shipping in the area and will have a
negligible impact on air quality and on greenhouse gas emissions.
Discharges to Sea The decommissioning works will require minimal discharges to sea. Discharges associated with
wastewaters generated on vessels are controlled by standard requirements of vessels operating in
the North Sea for compliance with the International Convention for the Prevention of Pollution
from Ships (MARPOL).
Discharges during disconnection of the pipelines, removal of the subsea isolation valve, connecting
spools and risers will be limited to the inhibited water that remains in these systems following
cleaning to below 5 ppm oil content in 2013. If the pipelines are not re-used by third parties
inhibited water within the pipelines will ultimately be released in the future as the pipeline
deteriorates over time.
If the jacket is removed in more than one section there will be a release of approximately 20 litres
of hydraulic fluid from control lines on the subsea isolation valve. This release will be agreed under
permit from BEIS.
Seabed Disturbance Disturbance of the seabed will occur during:
• the activities to bury the 82 km section of the 20″ export pipeline that is currently laid on
the seabed;
• removal of subsea infrastructure within the 500 m safety zone around the platform;
• overtrawl trials to demonstrate a clear and safe seabed; and
• in areas where rock additional cover is required.
The nature of the seabed, the habitats that it provides, and the ecological communities that it
supports are found throughout the central North Sea. Even though these have been considered as
being of moderate sensitivity, the area of the seabed affected is very small in the context of the
overall coverage of these widespread habitats in the central North Sea. Recovery of the seabed
communities following disturbance is anticipated to be around 1 – 3 years, except in the areas
where rock cover is required as rock cover results in a change to the seabed from its natural type.
This harder substrate will support a different community, with fewer sediment-resident animals
but increased species of brittle star, star fish and crabs. Although this is a change from the natural
baseline habitat, the activity will result in an increase in biodiversity in these areas.
Goldeneye Decommissioning Environmental Appraisal Report Revision: A02
Page 8 of 126
Doc. no. GDP-PT-S-HE-0702-00003
The activity with potential for most widespread disturbance of the seabed is the overtrawl trials
and fishermen contracted to undertake these trials will be advised of the spawning periods for
herring and sandeels.
Underwater Noise There is no requirement for major noise sources during the planned decommissioning activities,
however the activities will contribute to the general levels of anthropogenic underwater noise due
to vessel engine noise and the use of cutting tools and other equipment. The activities will take
place within an area of moderate to high shipping intensity and the cumulative impact of the
Goldeneye decommissioning programme on the baseline noise levels will be minimal.
Measurement of pipeline burial depth relies on sound-wave penetration of the top few meters of
the seabed. Sub-bottom profiling equipment used for depth of burial surveys utilise
electromagnetic techniques for sound generation and are of a much lower amplitude than that
generated by equipment such as air gun arrays used during seismic acquisition surveys. Sub-bottom
profile surveys are commonly undertaken throughout the North Sea and, although the sound
generated is within the audible range of most cetacean species, a previous survey of this type in
nearshore waters off St. Fergus demonstrated that there would be negligible potential for injury,
and minor potential for disturbance.
Waste
A total of approximately 6,800 tonnes of materials will be recovered to the shore yard.
Approximately 74% of the total is steel, 16% is marine growth, 7% concrete and grout and 2%
non-ferrous metals. With the exception of marine growth, in excess of 97% of the recovered
material is anticipated to be recycled.
In preparation for decommissioning the platform has been stripped of residual hazardous materials
offshore where feasible, although some (such as paint work containing lead or chromium) remains
and will be safely treated for disposal at the onshore yard. A full inventory of materials has been
compiled and the fate of all materials will be tracked through an active waste management plan
using waste consignment notes, up to the point of materials re-entering the supply system
following recycling or, where necessary, to the point of disposal.
Unplanned events
Fuel spills The assessment considered the impacts that may result following an accidental loss of fuel from a
vessel whilst operating either at the platform or close to shore during the decommissioning
programme. The hypothetical spill scenario, at both locations, considered the release of the largest
potential diesel fuel inventory of a vessel operating in these areas. Past records of all spill events in
the UKCS available from the Advisory Committee on Protection of the Sea indicate that a loss of
vessel fuel inventory is highly unlikely, although such a spill is considered to be a worst case
scenario for the Goldeneye decommissioning programme.
Oil spill modelling carried out for the loss of a ship’s diesel fuel inventory to sea at the Goldeneye
platform location concluded that, more than half of the diesel would evaporate within 24 hours
with negligible amounts of diesel remaining on the sea surface after 16 days. Modelling predicted
that approximately one quarter of the diesel spilled would end up in seabed sediments over a wide
area at low concentrations not expected to cause any measurable impact to the environment. The
remainder of the diesel would disperse within the water column where it would biodegrade, leaving
around 1 % of the volume within 30 days. As such the environmental impact of such an event at
the platform location would be localised and short-term.
Goldeneye Decommissioning Environmental Appraisal Report Revision: A02
Page 9 of 126
Doc. no. GDP-PT-S-HE-0702-00003
Modelling a loss of diesel inventory from a vessel operating in the nearshore area predicted a higher
potential for negative impact due to the proximity to sensitive coastal areas and the reduced
currents that would limit spill dispersion. The modelling study concluded that, were such an event
to occur, there would be a moderate impact to seabirds, marine mammals, protected sites,
commercial fisheries, shipping and tourism. To ensure the risks of fuel spills from all vessels
commissioned for the decommissioning works are as low as is practically possible, vessels will be
subject to review using Shell’s Group Maritime Assurance System. Assurance will include detailed
evaluation of the vessels fuel integrity system, spill prevention measures and spill response
arrangements before the vessel can mobilise for the offshore decommissioning campaign.
Dropped large object An additional worst case scenario for the decommissioning programme would be the loss of
control and dropping of the platform topsides or jacket during lifting operations or in transit to
the shore yard. The lifting of such structures at sea and in port, and the transportation of these
facilities to shore, are recognised as high risk activities and are consequently subject to extensive
and detailed planning, including the preparation of a robust Lift Plan and Marine Transport Plan
prior to commencing the activities.
Mitigation Measures
During the development of the decommissioning programme, the control and mitigation measures
identified in this EA to avoid or minimise impacts to the prevailing environment, minimise the
risk of unplanned events and respond to stakeholder concerns have been documented. These are
summarised in the table on the following pages. These commitments will be carried through the
contracting process for contract award and will be tracked to ensure the commissioned contractors
have sufficient mechanisms, processes, procedures and competent resources in place to implement
the measures required. Shell’s assurance procedures will monitor implementation.
Conclusion
The baseline environment in the affected area is well understood and this EA has identified
environmental and societal risks associated with the planned decommissioning activities at the
Goldeneye field and the potential for impacts. With implementation of Shell’s robust, well
established control measures and procedures including careful planning to eliminate many of the
potential risks and avoid adverse impacts to the environment or to other users of the sea. Where
potential for impact during the programme is unavoidable, mitigation measures can be readily
adopted to reduce impacts to the minimum.
The conclusion of the assessment indicates that with careful management, including effective
management of contractors, the DP can be executed with minimal impact on the environment and
minimal disturbance to other users of the sea.
Goldeneye Decommissioning Environmental Appraisal Report Revision: A02
Page 10 of 126
Doc. no. GDP-PT-S-HE-0702-00003
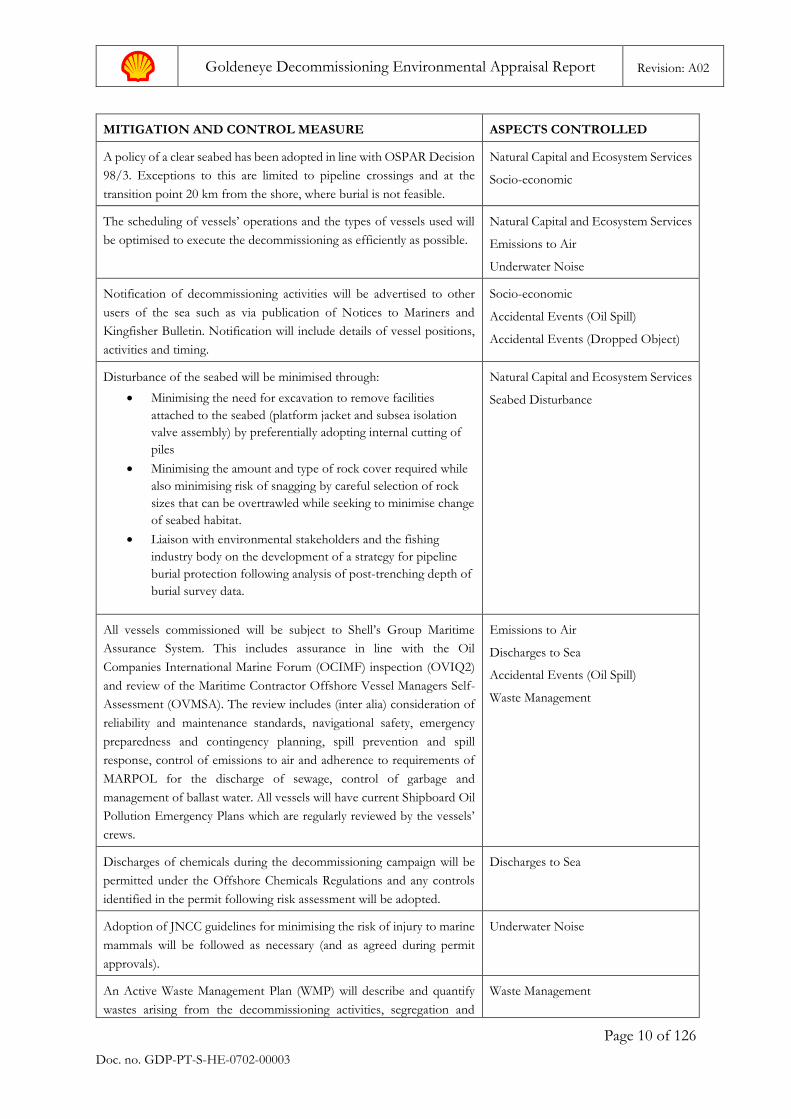
MITIGATION AND CONTROL MEASURE ASPECTS CONTROLLED
A policy of a clear seabed has been adopted in line with OSPAR Decision
98/3. Exceptions to this are limited to pipeline crossings and at the
transition point 20 km from the shore, where burial is not feasible.
Natural Capital and Ecosystem Services
Socio-economic
The scheduling of vessels’ operations and the types of vessels used will
be optimised to execute the decommissioning as efficiently as possible.
Natural Capital and Ecosystem Services
Emissions to Air
Underwater Noise
Notification of decommissioning activities will be advertised to other
users of the sea such as via publication of Notices to Mariners and
Kingfisher Bulletin. Notification will include details of vessel positions,
activities and timing.
Socio-economic
Accidental Events (Oil Spill)
Accidental Events (Dropped Object)
Disturbance of the seabed will be minimised through:
• Minimising the need for excavation to remove facilities
attached to the seabed (platform jacket and subsea isolation
valve assembly) by preferentially adopting internal cutting of
piles
• Minimising the amount and type of rock cover required while
also minimising risk of snagging by careful selection of rock
sizes that can be overtrawled while seeking to minimise change
of seabed habitat.
• Liaison with environmental stakeholders and the fishing
industry body on the development of a strategy for pipeline
burial protection following analysis of post-trenching depth of
burial survey data.
Natural Capital and Ecosystem Services
Seabed Disturbance
All vessels commissioned will be subject to Shell’s Group Maritime
Assurance System. This includes assurance in line with the Oil
Companies International Marine Forum (OCIMF) inspection (OVIQ2)
and review of the Maritime Contractor Offshore Vessel Managers Self-
Assessment (OVMSA). The review includes (inter alia) consideration of
reliability and maintenance standards, navigational safety, emergency
preparedness and contingency planning, spill prevention and spill
response, control of emissions to air and adherence to requirements of
MARPOL for the discharge of sewage, control of garbage and
management of ballast water. All vessels will have current Shipboard Oil
Pollution Emergency Plans which are regularly reviewed by the vessels’
crews.
Emissions to Air
Discharges to Sea
Accidental Events (Oil Spill)
Waste Management
Discharges of chemicals during the decommissioning campaign will be
permitted under the Offshore Chemicals Regulations and any controls
identified in the permit following risk assessment will be adopted.
Discharges to Sea
Adoption of JNCC guidelines for minimising the risk of injury to marine
mammals will be followed as necessary (and as agreed during permit
approvals).
Underwater Noise
An Active Waste Management Plan (WMP) will describe and quantify
wastes arising from the decommissioning activities, segregation and
Waste Management
Goldeneye Decommissioning Environmental Appraisal Report Revision: A02
Page 11 of 126
Doc. no. GDP-PT-S-HE-0702-00003
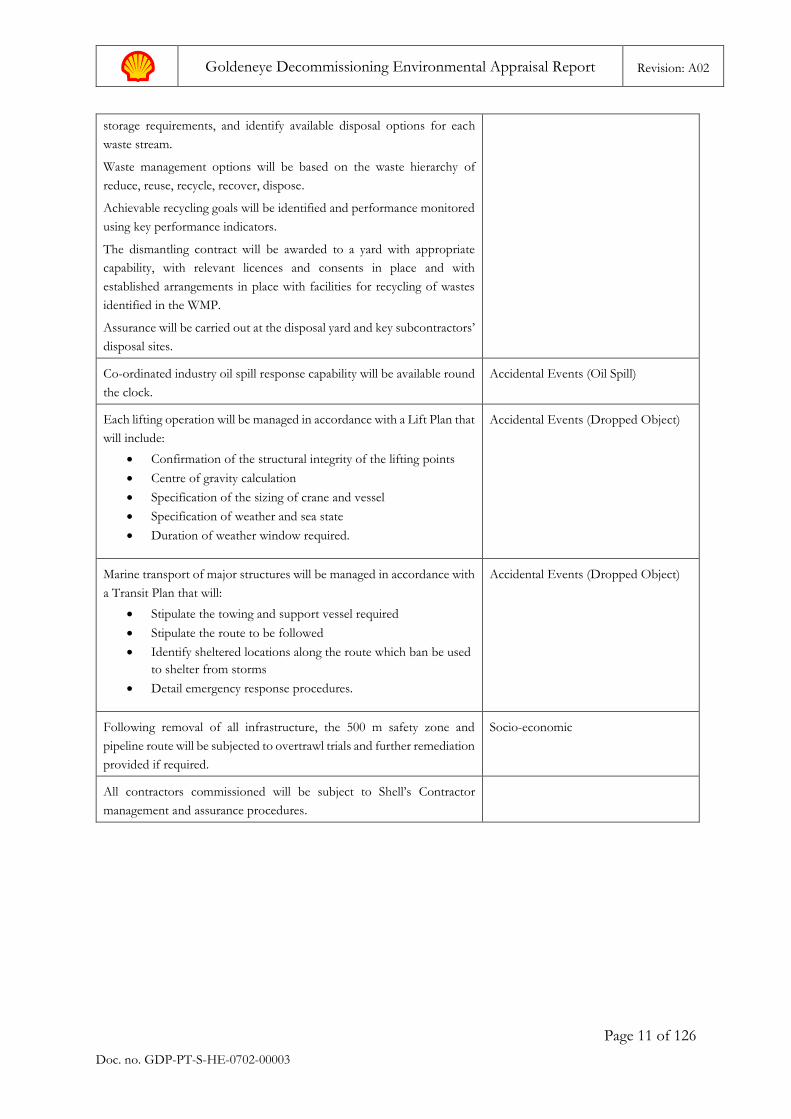
storage requirements, and identify available disposal options for each
waste stream.
Waste management options will be based on the waste hierarchy of
reduce, reuse, recycle, recover, dispose.
Achievable recycling goals will be identified and performance monitored
using key performance indicators.
The dismantling contract will be awarded to a yard with appropriate
capability, with relevant licences and consents in place and with
established arrangements in place with facilities for recycling of wastes
identified in the WMP.
Assurance will be carried out at the disposal yard and key subcontractors’
disposal sites.
Co-ordinated industry oil spill response capability will be available round
the clock.
Accidental Events (Oil Spill)
Each lifting operation will be managed in accordance with a Lift Plan that
will include:
• Confirmation of the structural integrity of the lifting points
• Centre of gravity calculation
• Specification of the sizing of crane and vessel
• Specification of weather and sea state
• Duration of weather window required.
Accidental Events (Dropped Object)
Marine transport of major structures will be managed in accordance with
a Transit Plan that will:
• Stipulate the towing and support vessel required
• Stipulate the route to be followed
• Identify sheltered locations along the route which ban be used
to shelter from storms
• Detail emergency response procedures.
Accidental Events (Dropped Object)
Following removal of all infrastructure, the 500 m safety zone and
pipeline route will be subjected to overtrawl trials and further remediation
provided if required.
Socio-economic
All contractors commissioned will be subject to Shell’s Contractor
management and assurance procedures.

Goldeneye Decommissioning Environmental Appraisal Report Revision: A02
Page 12 of 126
Doc. no. GDP-PT-S-HE-0702-00003
This page intentionally left blank
Goldeneye Decommissioning Environmental Appraisal Report Revision: A02
Page 13 of 126
Doc. no. GDP-PT-S-HE-0702-00003
Table of Contents 1. Introduction ............................................................................................ 19
1.1. Location of the Goldeneye Field ............................................................................ 19
1.2. Production History ................................................................................................... 19
1.3. Goldeneye Installation Facilities and Infrastructure ............................................ 19
1.3.1. Goldeneye Platform ................................................................................................. 20
1.3.2. Pipelines ..................................................................................................................... 21
1.3.3. Subsea Infrastructure................................................................................................ 21
1.3.4. Inter-connections with Other Fields...................................................................... 22
1.4. Current Status ............................................................................................................ 22
1.5. Outline of Decommissioning Activities ................................................................ 22
1.5.1. Topsides Removal .................................................................................................... 23
1.5.2. Jacket Removal .......................................................................................................... 23
1.5.3. Subsea Infrastructure Removal ............................................................................... 23
1.5.4. Pipelines ..................................................................................................................... 23
1.5.5. Pipeline Burial Survey .............................................................................................. 24
1.5.6. Over trawl Trials ....................................................................................................... 24
1.5.7. Post-Decommissioning Survey ............................................................................... 25
1.5.8. Onshore Dismantling ............................................................................................... 25
1.5.9. Vessel Usage .............................................................................................................. 25
1.6. Environmental Appraisal Process .......................................................................... 26
1.6.1. Scope of the EA Report .......................................................................................... 26
1.7. Stakeholder Consultation ......................................................................................... 27
2. Environmental Baseline .......................................................................... 29
2.1. Introduction ............................................................................................................... 29
2.2. Surveys ........................................................................................................................ 29
2.3. Physical Environment .............................................................................................. 31
2.3.1. Bathymetry ................................................................................................................. 31
2.3.2. Water Currents and Waves ...................................................................................... 31
2.3.3. Sea Temperature and Salinity .................................................................................. 32
2.3.4. Sediments ................................................................................................................... 32
2.3.5. Cuttings Piles ............................................................................................................. 36
2.3.6. Sediment Contaminants ........................................................................................... 37
2.4. Designated Sites ........................................................................................................ 38
2.4.1. Southern Trench pMPA .......................................................................................... 39
2.5. Designated Species ................................................................................................... 42
2.6. Areas / Species of Potential Conservation Significance (out with designated sites) ....................................................................................................................... 44
2.6.1. Submarine Structures Made by Leaking Gases .................................................... 44
2.6.2. Biogenic Reefs ........................................................................................................... 45
2.6.3. Sea Pens and Burrowing Megafauna Communities ............................................. 46
Goldeneye Decommissioning Environmental Appraisal Report Revision: A02
Page 14 of 126
Doc. no. GDP-PT-S-HE-0702-00003
2.7. Marine Flora and Fauna ........................................................................................... 48
2.7.1. Plankton ..................................................................................................................... 48
2.7.2. Benthos ...................................................................................................................... 48
2.7.3. Fish.............................................................................................................................. 50
2.7.4. Seabirds ...................................................................................................................... 52
2.7.5. Marine Mammals ...................................................................................................... 57
2.7.6. Fishing Activity ......................................................................................................... 59
2.7.7. Shipping...................................................................................................................... 65
2.7.8. Surrounding Oil and Gas Infrastructure ............................................................... 65
2.7.9. Other Industries ........................................................................................................ 67
2.7.10. Submarine Cables ................................................................................................ 67
2.7.11. Shipwrecks ............................................................................................................ 67
2.7.12. Military Exercise Areas ....................................................................................... 67
3. Identification of Impacts ........................................................................ 69
3.1. ENVID ...................................................................................................................... 69
3.1.1. ENVID Approach .................................................................................................... 69
3.1.2. ENVID Conclusions ................................................................................................ 69
3.2. Impact Assessment Scoping .................................................................................... 70
4. Environmental Assessment .................................................................... 71
4.1. Natural Capital and Ecosystem Services ............................................................... 71
4.1.1. Physical presence of vessels .................................................................................... 71
4.1.2. Disturbance of the seabed ....................................................................................... 71
4.1.3. Goldeneye safety zone ............................................................................................. 71
4.1.4. Materials use .............................................................................................................. 72
4.1.5. Controls for the Management of Impacts to NCES ........................................... 72
4.2. Seabed Disturbance .................................................................................................. 72
4.2.1. Trenching and infill .................................................................................................. 73
4.2.2. Removal of subsea infrastructure ........................................................................... 75
4.2.3. Rock Cover Along Pipelines ................................................................................... 76
4.2.4. Anchor Scars and Spud Cans .................................................................................. 76
4.2.5. Overtrawl trials .......................................................................................................... 77
4.2.6. Impacts to OSPAR habitat ‘Sea-pens and burrowing megafauna communities’ ................................................................................................................................ 77
4.2.7. Controls for the Management of Impacts to Seabed Disturbance ................... 78
4.3. Emissions to Air ....................................................................................................... 78
4.3.1. Offshore emissions ................................................................................................... 78
4.3.2. Onshore emissions ................................................................................................... 79
4.3.3. Controls for the Management of Impacts from Atmospheric Emissions ....... 79
4.4. Discharges to Sea ...................................................................................................... 80
4.4.1. Vessels’ discharges .................................................................................................... 80
4.4.2. Abrasive cutting compounds .................................................................................. 80
Goldeneye Decommissioning Environmental Appraisal Report Revision: A02
Page 15 of 126
Doc. no. GDP-PT-S-HE-0702-00003
4.4.3. Discharge from spools and risers ........................................................................... 80
4.4.4. Future discharge from pipelines ............................................................................. 81
4.4.5. Contingency discharge of hydraulic fluid .............................................................. 81
4.4.6. Controls for the Management of Impacts from Discharges to Sea .................. 81
4.5. Underwater Noise ..................................................................................................... 81
4.5.1. Sources of Underwater Noise ................................................................................. 82
4.5.2. Sensitivity of Receptors to Underwater Noise ..................................................... 85
4.5.3. Potential for Impacts from Underwater Noise .................................................... 88
4.5.4. Controls for the Management of Impacts from Underwater Noise ................. 90
4.6. Waste Management .................................................................................................. 90
4.6.1. Removed Wastes ....................................................................................................... 90
4.6.2. Materials Left in situ .................................................................................................. 91
4.6.3. Controls for the Management of Impacts from Waste ....................................... 92
4.7. Accidental Events ..................................................................................................... 93
4.7.1. Loss of fuel ................................................................................................................ 93
4.7.2. Dropped objects ....................................................................................................... 95
4.7.3. Liquid discharges ...................................................................................................... 96
4.8. Socio-economic Effects ........................................................................................... 97
4.8.1. Pipeline integrity ....................................................................................................... 97
4.8.2. Impact on fishing industry ...................................................................................... 97
4.9. Transboundary Impacts ........................................................................................... 98
4.10. Cumulative Impacts .................................................................................................. 98
5. Conclusions ............................................................................................ 101
6. References ............................................................................................. 103
Appendix A: ENVID Methodology .................................................................... 111
Appendix B: ENVID Output .............................................................................. 117
Appendix C: Seabed Photographs Along Pipeline ............................................. 122
ABBREVIATIONS ............................................................................................ 123
Goldeneye Decommissioning Environmental Appraisal Report Revision: A02
Page 16 of 126
Doc. no. GDP-PT-S-HE-0702-00003
Tables Table 1-1: Estimated vessel use for Goldeneye Decommissioning Programme (days) . 25
Table 2-1 Surveys reports used to support baseline description........................................ 29
Table 2-2 Seabed sediments along Goldeneye pipeline route (Fugro, 2001) ................... 35
Table 2-3 Concentrations of hydrocarbons and metals in sediments at Goldeneye (Fugro, 2010) and at background sites (>5 km from an oil and gas installation) in the central North Sea (UKOOA, 2001). All concentrations in mg/kg. .................. 37
Table 2-4 SPAs/pSPAs in closest proximity to the proposed project (JNCC, 2018c)... 39
Table 2-5 Designation of fish species potentially occurring in the vicinity of the Goldeneye field. ........................................................................................................ 42
Table 2-6 Table of PMF species potentially occurring in the Goldeneye region (Tyler-Walters, 2016). ........................................................................................................... 43
Table 2-7 Spawning and nursery areas of some commercial fish species in the Goldeneye area (Coull et al., 19981 and Ellis et al., 20122). ...................................................... 51
Table 2-8 Predicted seabird surface density in the area (maximum number of individuals per km2) (Kober et al., 2010). ................................................................................... 53
Table 2-9 SOSI and indirect assessment for Block 14/29 and adjacent blocks and along the pipeline route (JNCC, 2018d). .......................................................................... 55
Table 2-10 Cetacean abundance in SCANS-III survey blocks “R” and “T” (Hammond et al., 20171; IAMMWG, 20152). ................................................................................. 59
Table 4-1 Materials left on or below the seabed following decommissioning ................. 92
Table 4-2: Summary of worst case stranding following nearshore diesel spill scenarios 94
Goldeneye Decommissioning Environmental Appraisal Report Revision: A02
Page 17 of 126
Doc. no. GDP-PT-S-HE-0702-00003
Figures Figure 1-1 Location of Goldeneye within the UKCS .......................................................... 20
Figure 1-2 Goldeneye Platform .............................................................................................. 21
Figure 1-3 Illustration of jet trenching of a pipeline ............................................................ 24
Figure 2-1 Map showing indicative location of surveys identified in Table 2-1. ............. 30
Figure 2-2 Nearshore route of Goldeneye pipelines in relation to other O&G pipelines ..................................................................................................................................... 31
Figure 2-3 North Sea sediment distribution (Marine Strategy Framework Directive predominant habitat type classification) (EMODnet accessed, 2017). ............. 33
Figure 2-4 Camera still showing the silty fine sand seabed sediments in the area of the Goldeneye platform (Fugro, 2010)......................................................................... 33
Figure 2-5 Protected areas in the CNS region. ..................................................................... 38
Figure 2-6 Protected features within the Southern Trench pMPA. .................................. 40
Figure 2-7 Location of burrowed mud habitat within the Southern Trench pMPA in relation to Goldeneye pipelines (Shapefiles from SNH website) ...................... 41
Figure 2-8 Extent of minke whale biodiversity feature within the Southern Trench pMPA (reproduced from SNH, 2014a) .............................................................................. 41
Figure 2-9 Possible locations of ‘submarine structures made by leaking gas’. ................. 44
Figure 2-10 Location of pockmarks in the vicinity of Goldeneye ..................................... 45
Figure 2-11 Known OSPAR threatened or declining habitat ‘sea-pen and burrowing megafauna communities’ in the central North Sea (EMODnet, 2017). ........... 47
Figure 2-12 Examples of visible epifauna species from seabed imagery (Fugro, 2010). 49
Figure 2-13 a) Numbers of taxa by major group (note others include; Cnidaria, Nemertea, Pogonophora, Chelicerata, Phoronida, Hemichordata and Chordata) and b) Number of individuals by major group (note colonial organisms such as Bryozoa not included) (Fugro, 2010). .................................................................... 50
Figure 2-14 Spawning and nursery grounds of some commercial fish species in the Goldeneye area (Coull et al., 1998; Ellis et al., 2012). ........................................... 52
Figure 2-15 SOSI and indirect assessment for Block 14/29 and adjacent blocks (JNCC, 2018d). ........................................................................................................................ 56
Figure 2-16 SOSI and indirect assessment along the Goldeneye pipeline route (JNCC, 2018d). ........................................................................................................................ 56
Figure 2-17 Harbour and grey seal distribution in the North Sea (SMRU, 2012; Jones et al., 2013). .................................................................................................................... 57
Figure 2-18 Distribution of North Sea cetacean species (Reid et al., 2003). ..................... 58
Figure 2-19 SCANS-III survey areas in relation to Block 14/29 and the Goldeneye pipelines ...................................................................................................................... 59
Figure 2-20 Mean UK annual fishing effort 2012-2016 in the vicinity of the proposed project (Scottish Government, 2017). ................................................................... 61
Figure 2-21 UK reported landings by quantity (te) within the region of the proposed project (2012 – 2016) (Scottish Government, 2017). .......................................... 62
Figure 2-22 VMS combined data from 2009-2013 showing the fishing intensity of fishing
vessels ≥15m in length off the north-east coast of Scotland using a) demersal
Goldeneye Decommissioning Environmental Appraisal Report Revision: A02
Page 18 of 126
Doc. no. GDP-PT-S-HE-0702-00003
mobile gears, b) pelagic gears, c) Nephrops mobile gears and d) scallop gears (Kafas et al., 2012). .................................................................................................... 63
Figure 2-23 Fishing intensity by Scottish vessels ≤ 15 m (ScotMap: 2007 – 2011: vessels / cell) (Kafas et al., 2012). ........................................................................................ 64
Figure 2-24 Landings value (£ / cell) by Scottish vessels ≤ 15 m (ScotMap: 2017 – 2011: vessels / cell) (Kafas et al., 2012). ........................................................................... 64
Figure 2-25 Shipping density as categorised by OGA (OGA, 2017). ............................... 65
Figure 2-26 Existing oil and gas installations in relation to Goldeneye. ........................... 66
Figure 2-27 Windfarm and aquaculture sites (NMPi, 2018). .............................................. 67
Figure 4-1 Schematic time series diagram showing a colonisation succession in a marine environment............................................................................................................... 74
Figure 4-2: Marine mammal audiograms for species occurring in the DP area. ............. 85
Figure 4-3: Relevant fish audiograms and representative sound sources from the DP. 87
Goldeneye Decommissioning Environmental Appraisal Report Revision: A02
Page 19 of 126
Doc. no. GDP-PT-S-HE-0702-00003
1. Introduction In accordance with the Petroleum Act 1998, the Section 29 notice holders of the Goldeneye
installations/fields are applying to the Department for Business, Energy and Industrial Strategy
(BEIS) to obtain approval for decommissioning the Goldeneye installation and associated subsea
elements.
Under the Petroleum Act 1998 there is a requirement to provide an assessment of the impact of
the decommissioning activities on the marine environment. In accordance with BEIS guidelines,
the environmental assessment shall be documented in an Environmental Appraisal report. The
Environmental Appraisal report is submitted along with the Decommissioning Programme and
Comparative Assessment1 in draft form for consideration at the Public Consultation stage, and in
final form when the Decommissioning Programme is submitted for approval.
The Goldeneye Environmental Appraisal (EA) report has been prepared by Shell U.K. Limited
(hereinafter Shell), on behalf of the Section 29 Notice Holders, to satisfy the regulatory
requirement for environmental assessment and to inform the planning and execution of the
activities required to fulfil the Goldeneye Decommissioning Programmes (DP).
This EA report is intended to be read in conjunction with the DP, to which it refers for certain
details although some information from the DP is repeated here, or further elaborated on, to
enhance understanding of the assessment of impacts on the environment.
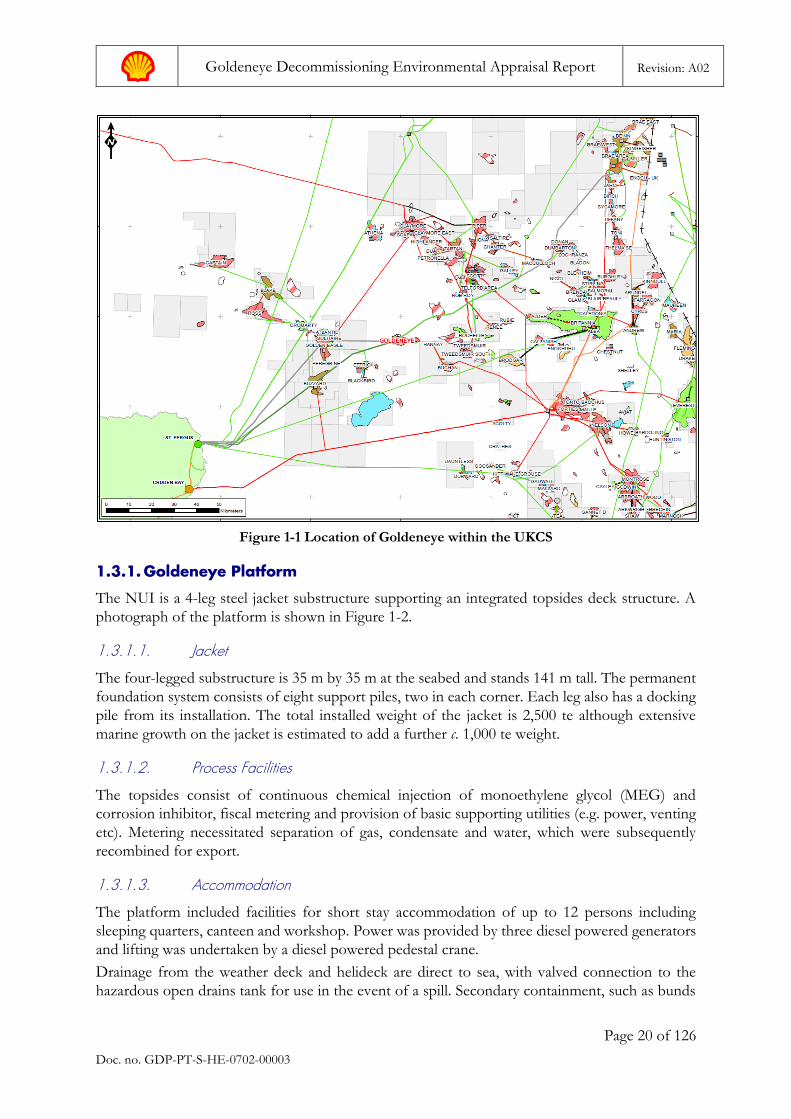
1.1. Location of the Goldeneye Field
The Goldeneye Field is located in blocks 14/28b, 14/29a, 20/3b and 20/4b of the United
Kingdom Continental Shelf (UKCS) in the central North Sea (CNS). The platform is located in
Block 14/29, approximately 100 km North-East of St. Fergus and approximately 110 km from the
UK/Norway median line in water depths ranging between 118 m and 122 m below Lowest
Astronomical Tide (LAT) (Figure 1-1).
Two pipelines connect the platform with St. Fergus Gas Plant, PL1978 and PL1979. The pipelines
traverse blocks 19/9, 19/10, 19/12, 19/13, 19/14, 20/1, 20/2 and 20/3.
1.2. Production History
Goldeneye is a normal pressure, normal temperature gas condensate field which was produced
from 2004 via five production wells that were all drilled in that year. The wells were shut-in in 2011
and Cessation of Production (CoP) was approved by the Department of Energy and Climate
Change (DECC, now BEIS) in 2011.
1.3. Goldeneye Installation Facilities and Infrastructure
The Goldeneye facilities comprise a normally unattended installation (NUI) which housed the five
wellheads and fiscal metering. Produced fluids were exported to the St. Fergus Gas Plant from
where production was controlled, and from where hydrate inhibitor and corrosion inhibitor were
supplied. Inhibitor supply and hydrocarbon export was via dedicated pipelines between St. Fergus
and Goldeneye.
1 The process and conclusions of the Comparative Assessment are documented in an Emerging Recommendations report
Goldeneye Decommissioning Environmental Appraisal Report Revision: A02
Page 20 of 126
Doc. no. GDP-PT-S-HE-0702-00003
Figure 1-1 Location of Goldeneye within the UKCS
1.3.1. Goldeneye Platform
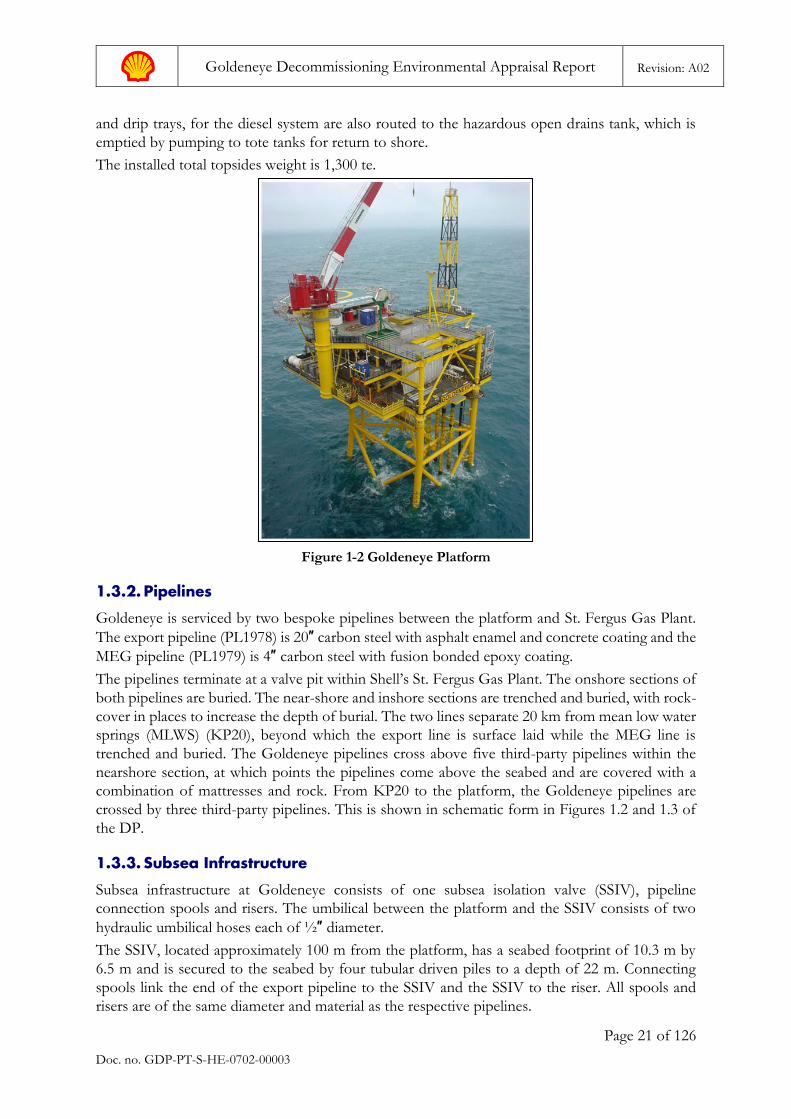
The NUI is a 4-leg steel jacket substructure supporting an integrated topsides deck structure. A
photograph of the platform is shown in Figure 1-2.
1.3.1.1. Jacket
The four-legged substructure is 35 m by 35 m at the seabed and stands 141 m tall. The permanent
foundation system consists of eight support piles, two in each corner. Each leg also has a docking
pile from its installation. The total installed weight of the jacket is 2,500 te although extensive
marine growth on the jacket is estimated to add a further c. 1,000 te weight.
1.3.1.2. Process Facilities
The topsides consist of continuous chemical injection of monoethylene glycol (MEG) and
corrosion inhibitor, fiscal metering and provision of basic supporting utilities (e.g. power, venting
etc). Metering necessitated separation of gas, condensate and water, which were subsequently
recombined for export.
1.3.1.3. Accommodation
The platform included facilities for short stay accommodation of up to 12 persons including
sleeping quarters, canteen and workshop. Power was provided by three diesel powered generators
and lifting was undertaken by a diesel powered pedestal crane.
Drainage from the weather deck and helideck are direct to sea, with valved connection to the
hazardous open drains tank for use in the event of a spill. Secondary containment, such as bunds
Goldeneye Decommissioning Environmental Appraisal Report Revision: A02
Page 21 of 126
Doc. no. GDP-PT-S-HE-0702-00003
and drip trays, for the diesel system are also routed to the hazardous open drains tank, which is
emptied by pumping to tote tanks for return to shore.
The installed total topsides weight is 1,300 te.
Figure 1-2 Goldeneye Platform
1.3.2. Pipelines
Goldeneye is serviced by two bespoke pipelines between the platform and St. Fergus Gas Plant.
The export pipeline (PL1978) is 20″ carbon steel with asphalt enamel and concrete coating and the
MEG pipeline (PL1979) is 4″ carbon steel with fusion bonded epoxy coating.
The pipelines terminate at a valve pit within Shell’s St. Fergus Gas Plant. The onshore sections of
both pipelines are buried. The near-shore and inshore sections are trenched and buried, with rock-
cover in places to increase the depth of burial. The two lines separate 20 km from mean low water
springs (MLWS) (KP20), beyond which the export line is surface laid while the MEG line is
trenched and buried. The Goldeneye pipelines cross above five third-party pipelines within the
nearshore section, at which points the pipelines come above the seabed and are covered with a
combination of mattresses and rock. From KP20 to the platform, the Goldeneye pipelines are
crossed by three third-party pipelines. This is shown in schematic form in Figures 1.2 and 1.3 of
the DP.
1.3.3. Subsea Infrastructure
Subsea infrastructure at Goldeneye consists of one subsea isolation valve (SSIV), pipeline
connection spools and risers. The umbilical between the platform and the SSIV consists of two
hydraulic umbilical hoses each of ½″ diameter.
The SSIV, located approximately 100 m from the platform, has a seabed footprint of 10.3 m by
6.5 m and is secured to the seabed by four tubular driven piles to a depth of 22 m. Connecting
spools link the end of the export pipeline to the SSIV and the SSIV to the riser. All spools and
risers are of the same diameter and material as the respective pipelines.
Goldeneye Decommissioning Environmental Appraisal Report Revision: A02
Page 22 of 126
Doc. no. GDP-PT-S-HE-0702-00003
Pipeline stabilisation features consist of approximately 100 concrete mattresses (of 5 te each) and
700 grout bags (of 25 kg each).
1.3.4. Inter-connections with Other Fields
Atlantic and Cromarty (A&C), a third-party field, was controlled via the Goldeneye platform by
means of an umbilical and associated equipment, also located on Goldeneye. The A&C field ceased
production in 2011 and all equipment (including umbilicals and pipelines) connecting Goldeneye
with A&C are outside the scope of the Goldeneye decommissioning programmes.
1.4. Current Status
The five wells were plugged and made safe in 2018 and the conductor casings removed. The
topsides piping and process equipment were flushed and vented in 2012.
The pipelines, SSIV, spools and risers were flushed and cleaned to <5 ppm oil in water (OIW) and
filled with inhibited river water in 2013. The pipelines remain shut-in by valves at the St. Fergus
Gas Plant and at the platform.
The power generators have been disconnected, drained down and electrically isolated. The
accommodation facilities’ potable water and sewage systems have been drained. Fire protection
systems have been drained and/or discharged.
It is intended that the platform will next be boarded when the decommissioning contractor arrives
to remove the topsides to shore for dismantling. To avoid any potential for contamination of the
topsides or fluid releases to sea to occur, either prior to removal or during the subsequent lifting
of the topsides, all residual liquids, such as unused fuel, machinery lubricants, hydraulic fluids and
rig wash chemicals, were drained and removed from the platform topsides in 2018.
The hazardous open drains tank was drained and isolated.
All items of equipment on the installation Fluorinated Greenhouse Gas (F-gas) register have been
drained in accordance with the F-gas regulations.
Batteries providing emergency power back-up, and with the potential to corrode and leak acid,
were also removed from the platform.
Since CoP the subsea infrastructure has been preserved for potential future use.
The umbilical lines could not be flushed in 2018 and remain filled with hydraulic fluid.
1.5. Outline of Decommissioning Activities
The topsides and jacket will be recovered to shore. The risers and connection spools of both
pipelines will also be recovered, along with SSIV, umbilical control lines and any debris identified
within the 500 m safety zone or along a 100 m wide corridor along the pipelines.
The offshore ends of both pipelines will be capped with blind flanges and decommissioned in situ.
The MEG supply pipeline (PL1979) is already buried along its entire length. The export pipeline
(PL1978) is buried from the onshore valve pit up to the pipeline transition point at KP20 (the
point 20 km along the pipeline from MLWS). The surface laid section of PL1978 (i.e. from KP20
to KP102) will be buried as part of the decommissioning works.
All material recovered during the decommissioning activities will be returned to shore for re-use,
processing and recycling or disposal.
Offshore activities will be finalised with trawler sweeps and as-left surveys as required.
Much of the detail of how the works will be undertaken has not been determined at this stage and
will be subject to offers received from the market. However, certain aspects including those
Goldeneye Decommissioning Environmental Appraisal Report Revision: A02
Page 23 of 126
Doc. no. GDP-PT-S-HE-0702-00003
required by regulation or regulatory guidance, will be built in to the scope of works for the
decommissioning contractor. Further detail about the decommissioning activities in as much as
they have been established to date, and in as much as it significantly influences the potential for
environmental impact is presented in the following subsections.
1.5.1. Topsides Removal
It is anticipated that the topsides will be cut and lifted as a single lift and transported to shore either
on the vessel used for the lift or on an independent barge. Cutting of jacket members and both
pipeline risers will be required. In order to maintain the integrity of the pipelines, a blind flange
will be fitted to each prior to cutting of the risers. The umbilical lines will be disconnected and
removed in anticipation of the topsides lift.
The scale of the platform is such that a heavy lift vessel (HLV) is not essential for removal of the
topsides, although an HLV may prove to be the preferred option. The type of vessel to be used
for the lift will be determined by market availability and commercial suitability to the wider
decommissioning activities.
1.5.2. Jacket Removal
To enable removal of the jacket, its piles will be cut below the seabed and both pipeline risers will
be cut at the seabed. Cutting of the piles is anticipated to be by way of internal cutting equipment.
However, if this proves unfeasible it would be necessary to excavate the seabed around the piles
to enable external cutting.
The jacket may be removed as a single lift or cut in sections. Removed jacket structures will be
transported to shore either on the lift vessel or on an independent barge.
There may be a period of time between removal of the topsides and removal of the jacket.
1.5.3. Subsea Infrastructure Removal
To enable removal of the SSIV, its piles will be cut below the seabed. As with the jacket piles, it is
anticipated that these will be cut internally, although excavation for external cutting may be
required if internal cutting proves unfeasible.
Connecting spools will be cut into manageable sections and removed.
Approximately 50 of the mattresses and 600 of the grout bags are exposed and will be removed
during decommissioning. The remainder, for instance at pipeline crossings, and will remain in situ.
NAVAids are currently installed on the topsides. When the topsides are removed, NAVAids may
be installed on the jacket or a guard vessel will be stationed on site. If no NAVAids are in use, a
guard vessel will be stationed on site until the seabed is safe for other users of the sea.
1.5.4. Pipelines
Both pipelines will be decommissioned in situ and made available for potential future re-use.
The MEG pipeline is buried along its length except at nearshore pipeline crossings, the pipeline
transition point (KP20) and at its end. The transition point and nearshore crossings are protected
and made safe with rock cover and this will remain following decommissioning. The blank-flanged
offshore end will be covered with rock to protect it and other users of the sea.
The Export pipeline is buried from the onshore valve pit to KP20 and surface laid thereafter. The
section between KP20 and KP102 will be trenched and buried, including the blank-flanged end.
Third party pipelines crossing over the Goldeneye export pipeline are currently protected with a
Goldeneye Decommissioning Environmental Appraisal Report Revision: A02
Page 24 of 126
Doc. no. GDP-PT-S-HE-0702-00003
combination of concrete mattresses and rock cover. Trenching of the export line will not be
feasible at these locations and the protective covering will remain in place and will need to be
enhanced with additional rock cover.
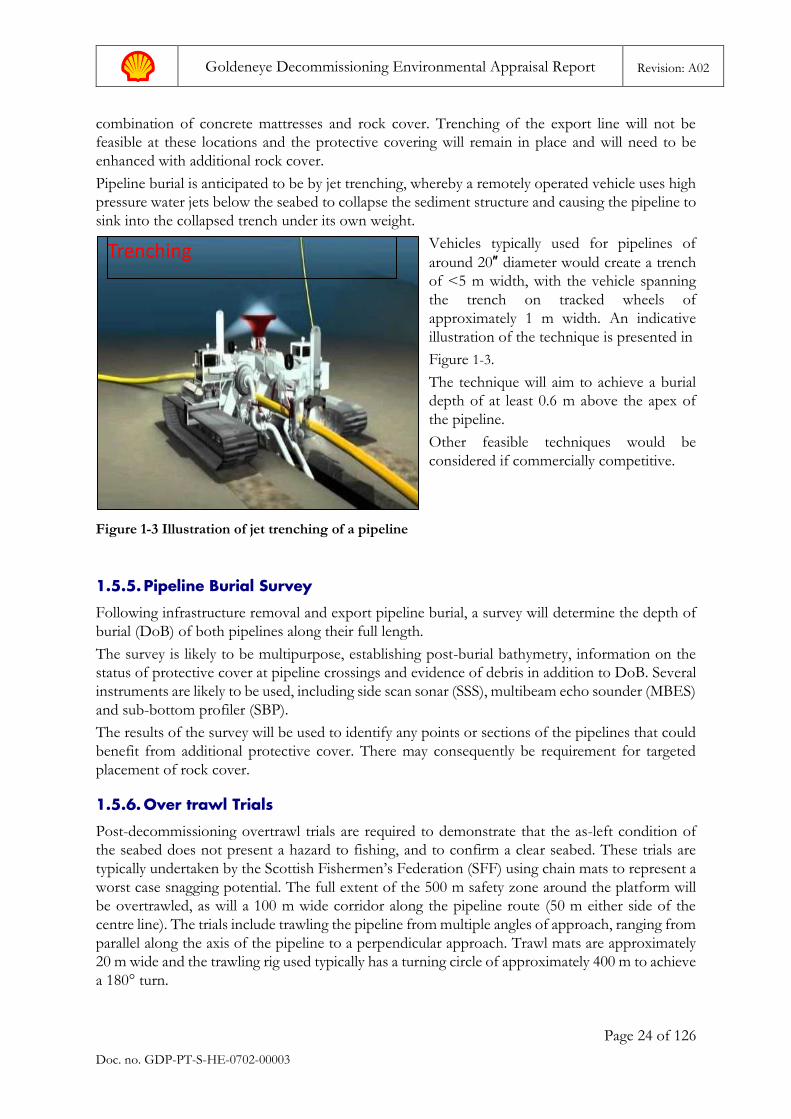
Pipeline burial is anticipated to be by jet trenching, whereby a remotely operated vehicle uses high
pressure water jets below the seabed to collapse the sediment structure and causing the pipeline to
sink into the collapsed trench under its own weight.
Vehicles typically used for pipelines of
around 20″ diameter would create a trench
of <5 m width, with the vehicle spanning
the trench on tracked wheels of
approximately 1 m width. An indicative
illustration of the technique is presented in
Figure 1-3.
The technique will aim to achieve a burial
depth of at least 0.6 m above the apex of
the pipeline.
Other feasible techniques would be
considered if commercially competitive.
Figure 1-3 Illustration of jet trenching of a pipeline
1.5.5. Pipeline Burial Survey
Following infrastructure removal and export pipeline burial, a survey will determine the depth of
burial (DoB) of both pipelines along their full length.
The survey is likely to be multipurpose, establishing post-burial bathymetry, information on the
status of protective cover at pipeline crossings and evidence of debris in addition to DoB. Several
instruments are likely to be used, including side scan sonar (SSS), multibeam echo sounder (MBES)
and sub-bottom profiler (SBP).
The results of the survey will be used to identify any points or sections of the pipelines that could
benefit from additional protective cover. There may consequently be requirement for targeted
placement of rock cover.
1.5.6. Over trawl Trials
Post-decommissioning overtrawl trials are required to demonstrate that the as-left condition of
the seabed does not present a hazard to fishing, and to confirm a clear seabed. These trials are
typically undertaken by the Scottish Fishermen’s Federation (SFF) using chain mats to represent a
worst case snagging potential. The full extent of the 500 m safety zone around the platform will
be overtrawled, as will a 100 m wide corridor along the pipeline route (50 m either side of the
centre line). The trials include trawling the pipeline from multiple angles of approach, ranging from
parallel along the axis of the pipeline to a perpendicular approach. Trawl mats are approximately
20 m wide and the trawling rig used typically has a turning circle of approximately 400 m to achieve
a 180° turn.
Trenching
Goldeneye Decommissioning Environmental Appraisal Report Revision: A02
Page 25 of 126
Doc. no. GDP-PT-S-HE-0702-00003
1.5.7. Post-Decommissioning Survey
An as-left survey of the seabed and environment will be undertaken. The scope of the
environmental survey will be proportionate to the scale of impact caused by the production of the
field, as determined from surveys undertaken in 2009, three years before CoP.
1.5.8. Onshore Dismantling
The onshore decommissioning yard will strip the topsides of materials and either process each
waste type on site (if suitably authorised) or transfer them to appropriate processing facilities. Steel
structures will be cut and packaged for transport to be recycled. There may be a requirement to
clean parts of the recovered equipment (e.g. of marine growth, paints or residual contamination)
prior to dismantling.
The port facilities and waste processing facilities to be used will be determined through competitive
tender, but at the time of writing have not been selected. Aspects such as onshore transport of
materials either from port to dismantling/recycling yard, or final destination of materials are
consequently not known.
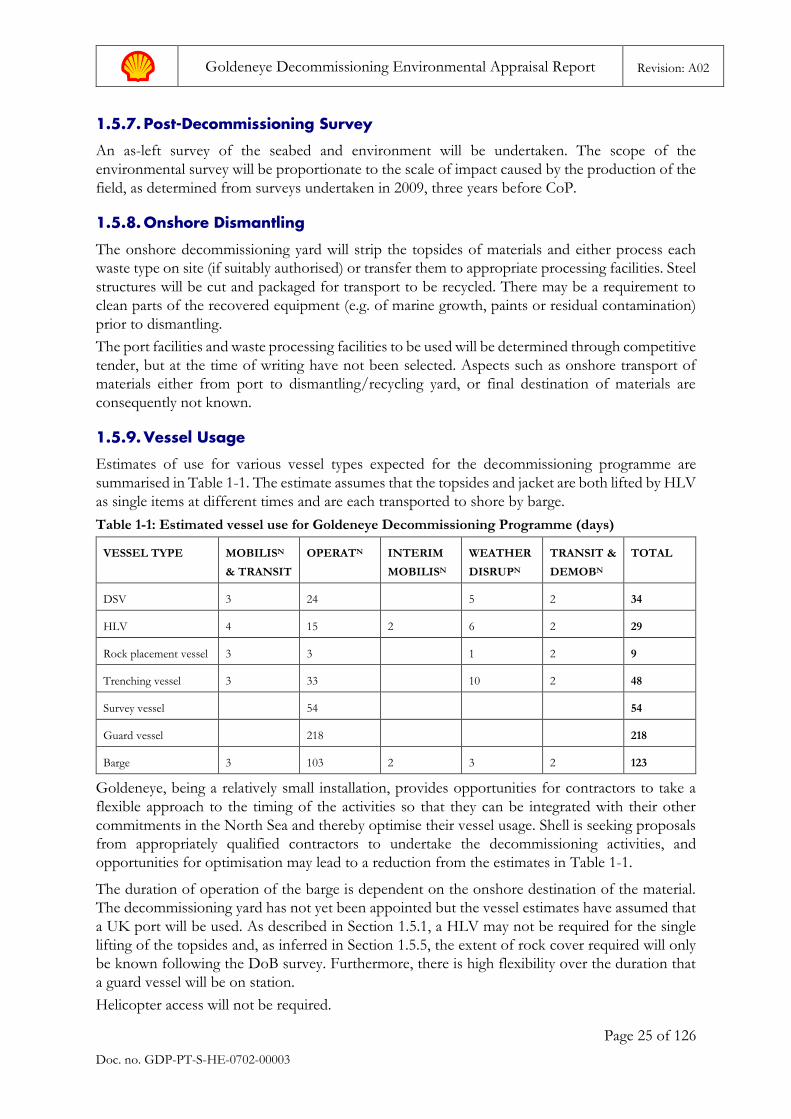
1.5.9. Vessel Usage
Estimates of use for various vessel types expected for the decommissioning programme are
summarised in Table 1-1. The estimate assumes that the topsides and jacket are both lifted by HLV
as single items at different times and are each transported to shore by barge.
Table 1-1: Estimated vessel use for Goldeneye Decommissioning Programme (days)
VESSEL TYPE MOBILISN
& TRANSIT
OPERATN INTERIM
MOBILISN
WEATHER
DISRUPN
TRANSIT &
DEMOBN
TOTAL
DSV 3 24 5 2 34
HLV 4 15 2 6 2 29
Rock placement vessel 3 3 1 2 9
Trenching vessel 3 33 10 2 48
Survey vessel 54 54
Guard vessel 218 218
Barge 3 103 2 3 2 123
Goldeneye, being a relatively small installation, provides opportunities for contractors to take a
flexible approach to the timing of the activities so that they can be integrated with their other
commitments in the North Sea and thereby optimise their vessel usage. Shell is seeking proposals
from appropriately qualified contractors to undertake the decommissioning activities, and
opportunities for optimisation may lead to a reduction from the estimates in Table 1-1.
The duration of operation of the barge is dependent on the onshore destination of the material.
The decommissioning yard has not yet been appointed but the vessel estimates have assumed that
a UK port will be used. As described in Section 1.5.1, a HLV may not be required for the single
lifting of the topsides and, as inferred in Section 1.5.5, the extent of rock cover required will only
be known following the DoB survey. Furthermore, there is high flexibility over the duration that
a guard vessel will be on station.
Helicopter access will not be required.
Goldeneye Decommissioning Environmental Appraisal Report Revision: A02
Page 26 of 126
Doc. no. GDP-PT-S-HE-0702-00003
1.6. Environmental Appraisal Process
The Petroleum Act 1998 (as amended by the Energy Act 2008) requires approval of a
decommissioning programme by the Secretary of State (BEIS), subject to statutory and public
consultations, before the Section 29 notice holders proceed with decommissioning. BEIS has
published (BEIS, 2017) a draft update to the Guidance Notes on the Decommissioning of
Offshore Oil and Gas Installations and Pipelines (DECC, 2011) which describes the processes
introduced into UK regulations to implement OSPAR Decision 98/3 and the Petroleum Act 1998.
Both the extant guidance notes and the revised draft require a decommissioning programme to be
supported by a report that documents the assessment of the potential for environmental impact
to result from the decommissioning programme activities. The environmental assessment is
required to be evidence based and be proportionate to the scale of activities proposed, providing
a more robust level of assessment where environmental sensitivities are higher.
Environmental appraisal of the Goldeneye DP is an ongoing process that has informed the
development of the Goldeneye Comparative Assessment (CA) and DP, and will continue to
inform the delivery of the programme, including risk assessments required for the application of
activity-specific permits and consents, monitoring the management of wastes and establishing the
as-left environmental status of the seabed.
This EA report records the status of appraisal at the time of the submission of the draft DP for
public consultation.
1.6.1. Scope of the EA Report
The scope of the Goldeneye DP is limited to offshore installations, offshore pipelines and
umbilicals. Installation of the onshore pipelines was permitted by Aberdeenshire Council under
the Town and Country Planning Regulations and are not covered by the Section 29 notice. The
onshore section of the pipelines will be decommissioned in situ in their current, buried state and
are outside the scope of this EA. Facilities used for processing Goldeneye fluids within St. Fergus
Gas Plant may be re-used and will ultimately be decommissioned as part of the Gas Plant
decommissioning. These onshore facilities are therefore outside the scope of this EA.
The DP has been informed by the conclusions of the CA, as recorded in the Emerging
Recommendations report, and the EA does not evaluate environmental impacts of options that
were rejected through the CA process.
To inform the scope of this EA Report and identify aspects requiring a higher level of assessment,
an Environmental Impacts Identification (ENVID) workshop was held.
The ENVID followed a standard approach, with a multidisciplinary group applying their particular
expertise to provide a high level assessment of the impacts of activities in the context of established
definitions for receptor sensitivity and impact magnitude. These definitions are provided in
Appendix A and the workshop output is provided in Appendix B. The output is necessarily a very
succinct and compressed record of the full discussion and rationale. This EA Report expands on
the ENVID output, citing published data to provide justification for the conclusions reached.
The ENVID identified that none of the planned activities for the execution of the Goldeneye
decommissioning programme would give rise to High environmental impact while four activities
were conservatively assigned impact ratings of Moderate. In addition, one Moderate risk was
identified for the unplanned accidental loss of vessel fuel.
All other impact scenarios were consequently scoped out from requiring further impact
assessment.
Goldeneye Decommissioning Environmental Appraisal Report Revision: A02
Page 27 of 126
Doc. no. GDP-PT-S-HE-0702-00003
This is not to say that execution of the DP will have no environmental impact, rather that the
sensitivities of the receiving environment are well understood, the scale of the impacts of the
activities are minor and that the controls for ensuring all potential impacts are minimised are
identified and will be implemented.
This EA report consequently documents the rationale for the scoping conclusions reached and
provides further consideration to the aspects identified as having the potential for Moderate
impact. The report also provides a list of impact minimisation and mitigation measures that will
be implemented.
1.7. Stakeholder Consultation
To ensure all environmental issues associated with the Goldeneye decommissioning could be
identified, Shell has held a number of sessions to inform stakeholders of decommissioning plans
and to seek feedback on any issues of concern to interested parties.
In December 2017 Shell held a stakeholder engagement event covering a portfolio of current and
upcoming decommissioning programmes, including Goldeneye. Invitations to the event were
extended to a wide array of stakeholders including statutory consultees, non-governmental
organisations, engineering companies and Carbon Capture and Storage developers.
A Comparative Assessment workshop was attended by statutory consultees in December 2017 to
determine the optimal decommissioning options for the Goldeneye pipelines.
Following preliminary environmental assessment, Shell presented and discussed the proposed
scope of this EA with statutory consultees in March 2018. Consultees expressed agreement with
the proposed approach and scope of the EA with some specific points raised for inclusion.
The following points were noted from these workshops and from other correspondences with
individual organisations:
• The EA should demonstrate an adequate understanding of the environmental baseline from survey data and other sources;
• Consideration should be given to the potential for re-use of the Goldeneye pipelines for the sequestration and storage of carbon dioxide (CO2);
• Consideration should be given to the potential for underwater noise generated from nearshore activities to impact on minke whales (Balaenoptera acutorostrata) in the proposed Southern Trench Marine Protected Area, and bottle-nose dolphins (Tursiops truncatus) accessing the Moray Firth Special Area of Conservation. The assessment should consider the potential cumulative impacts with shipping from and around the port of Peterhead and with any other concurrent development activities;
• Where provision of rock cover is proposed, the rock size and extent of coverage should not present a risk of snagging to scallop dredging and should be balanced with the nature conservation interests of the seabed;
• Consideration should be given to the seasonal sensitivities of seabed spawning fish species when considering the impact and timing of activities disruptive to the seabed;
• Consideration should be given to the cumulative impact of the decommissioning of multiple pipelines approaching St. Fergus; and
• Consideration should be given to the impact of dropping a large structure during lifting operations if this were to be undertaken within a designated area of conservation or within a shipping lane.

Goldeneye Decommissioning Environmental Appraisal Report Revision: A02
Page 28 of 126
Doc. no. GDP-PT-S-HE-0702-00003
This page intentionally left blank
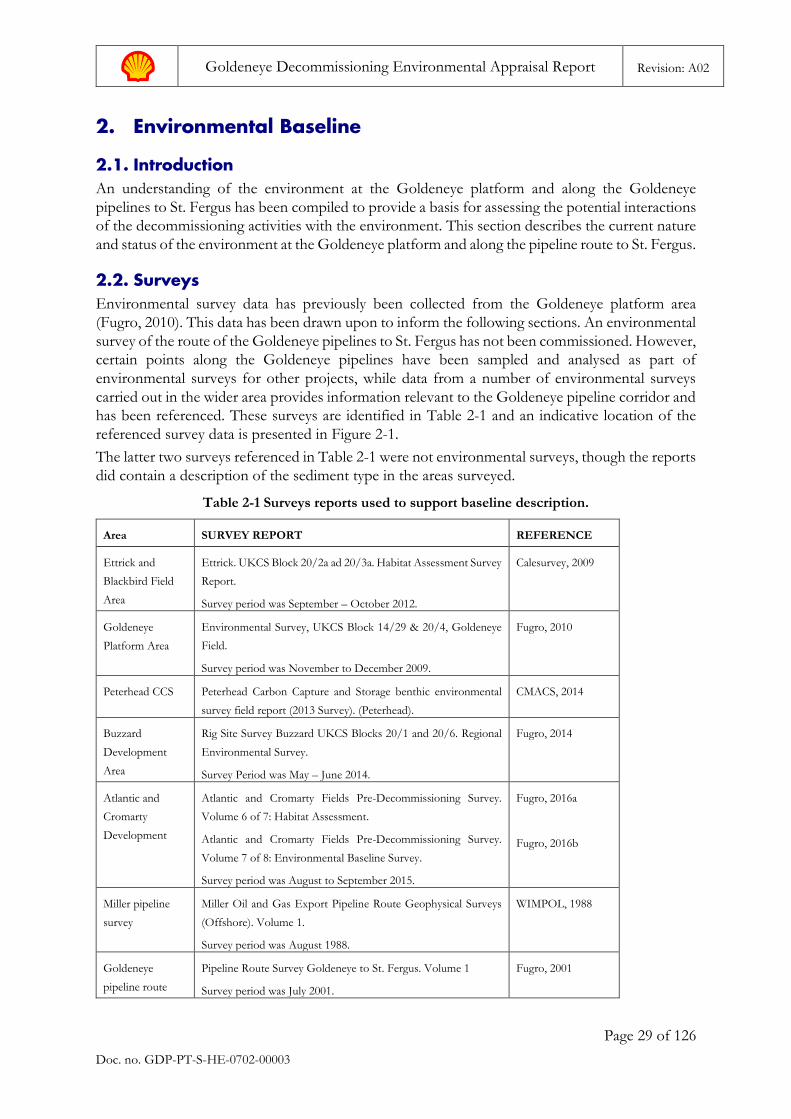
Goldeneye Decommissioning Environmental Appraisal Report Revision: A02
Page 29 of 126
Doc. no. GDP-PT-S-HE-0702-00003
2. Environmental Baseline
2.1. Introduction An understanding of the environment at the Goldeneye platform and along the Goldeneye
pipelines to St. Fergus has been compiled to provide a basis for assessing the potential interactions
of the decommissioning activities with the environment. This section describes the current nature
and status of the environment at the Goldeneye platform and along the pipeline route to St. Fergus.
2.2. Surveys Environmental survey data has previously been collected from the Goldeneye platform area
(Fugro, 2010). This data has been drawn upon to inform the following sections. An environmental
survey of the route of the Goldeneye pipelines to St. Fergus has not been commissioned. However,
certain points along the Goldeneye pipelines have been sampled and analysed as part of
environmental surveys for other projects, while data from a number of environmental surveys
carried out in the wider area provides information relevant to the Goldeneye pipeline corridor and
has been referenced. These surveys are identified in Table 2-1 and an indicative location of the
referenced survey data is presented in Figure 2-1.
The latter two surveys referenced in Table 2-1 were not environmental surveys, though the reports
did contain a description of the sediment type in the areas surveyed.
Table 2-1 Surveys reports used to support baseline description.
Area SURVEY REPORT REFERENCE
Ettrick and
Blackbird Field
Area
Ettrick. UKCS Block 20/2a ad 20/3a. Habitat Assessment Survey
Report.
Survey period was September – October 2012.
Calesurvey, 2009
Goldeneye
Platform Area
Environmental Survey, UKCS Block 14/29 & 20/4, Goldeneye
Field.
Survey period was November to December 2009.
Fugro, 2010
Peterhead CCS Peterhead Carbon Capture and Storage benthic environmental
survey field report (2013 Survey). (Peterhead).
CMACS, 2014
Buzzard
Development
Area
Rig Site Survey Buzzard UKCS Blocks 20/1 and 20/6. Regional
Environmental Survey.
Survey Period was May – June 2014.
Fugro, 2014
Atlantic and
Cromarty
Development
Atlantic and Cromarty Fields Pre-Decommissioning Survey.
Volume 6 of 7: Habitat Assessment.
Atlantic and Cromarty Fields Pre-Decommissioning Survey.
Volume 7 of 8: Environmental Baseline Survey.
Survey period was August to September 2015.
Fugro, 2016a
Fugro, 2016b
Miller pipeline
survey
Miller Oil and Gas Export Pipeline Route Geophysical Surveys
(Offshore). Volume 1.
Survey period was August 1988.
WIMPOL, 1988
Goldeneye
pipeline route
Pipeline Route Survey Goldeneye to St. Fergus. Volume 1
Survey period was July 2001.
Fugro, 2001
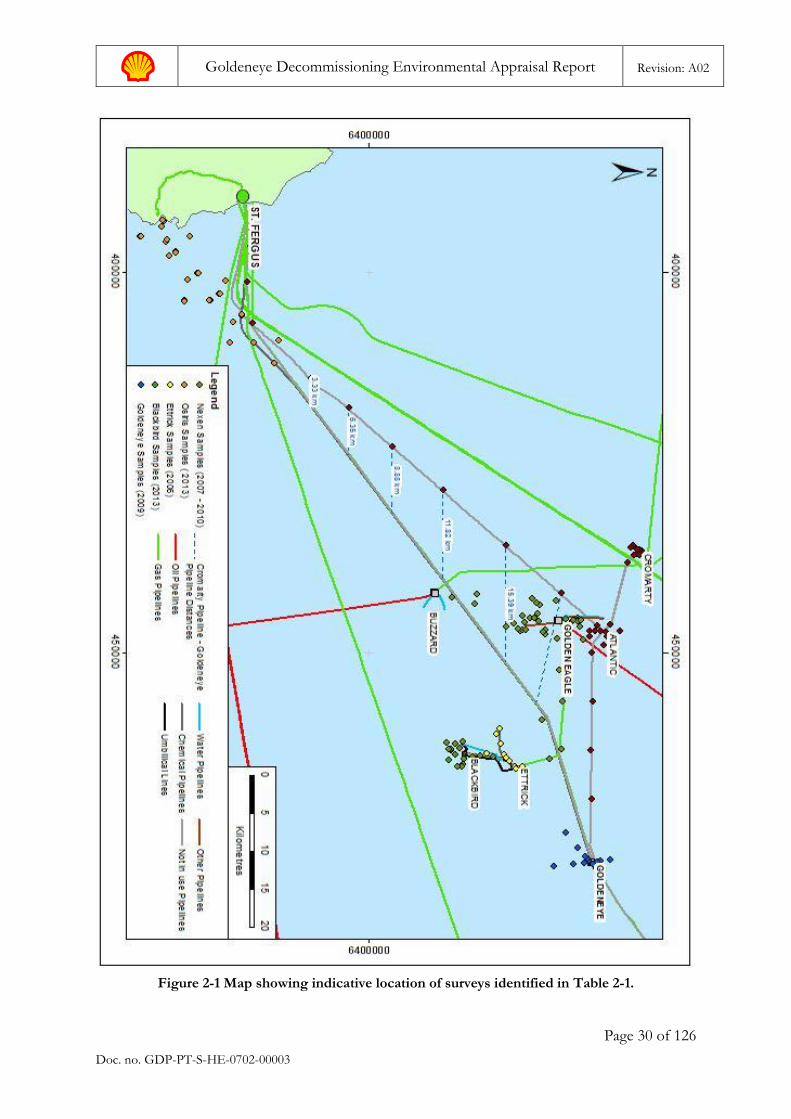
Goldeneye Decommissioning Environmental Appraisal Report Revision: A02
Page 30 of 126
Doc. no. GDP-PT-S-HE-0702-00003
Figure 2-1 Map showing indicative location of surveys identified in Table 2-1.
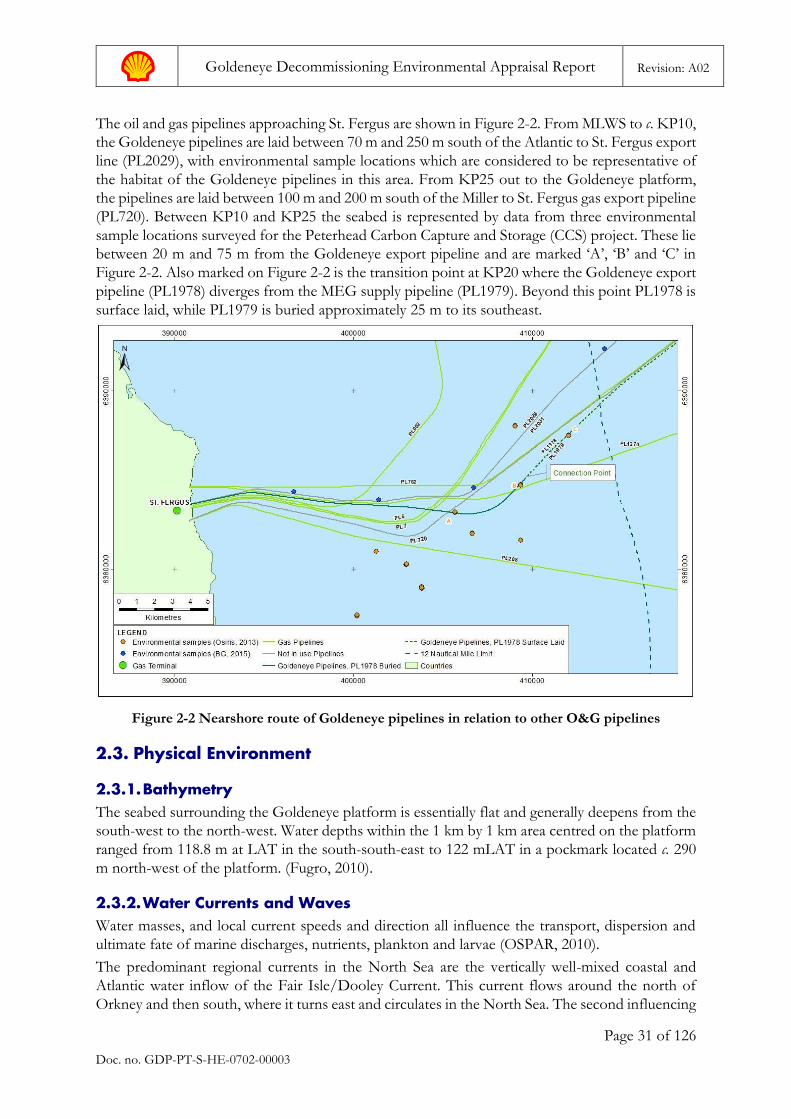
Goldeneye Decommissioning Environmental Appraisal Report Revision: A02
Page 31 of 126
Doc. no. GDP-PT-S-HE-0702-00003
The oil and gas pipelines approaching St. Fergus are shown in Figure 2-2. From MLWS to c. KP10,
the Goldeneye pipelines are laid between 70 m and 250 m south of the Atlantic to St. Fergus export
line (PL2029), with environmental sample locations which are considered to be representative of
the habitat of the Goldeneye pipelines in this area. From KP25 out to the Goldeneye platform,
the pipelines are laid between 100 m and 200 m south of the Miller to St. Fergus gas export pipeline
(PL720). Between KP10 and KP25 the seabed is represented by data from three environmental
sample locations surveyed for the Peterhead Carbon Capture and Storage (CCS) project. These lie
between 20 m and 75 m from the Goldeneye export pipeline and are marked ‘A’, ‘B’ and ‘C’ in
Figure 2-2. Also marked on Figure 2-2 is the transition point at KP20 where the Goldeneye export
pipeline (PL1978) diverges from the MEG supply pipeline (PL1979). Beyond this point PL1978 is
surface laid, while PL1979 is buried approximately 25 m to its southeast.
Figure 2-2 Nearshore route of Goldeneye pipelines in relation to other O&G pipelines
2.3. Physical Environment
2.3.1. Bathymetry The seabed surrounding the Goldeneye platform is essentially flat and generally deepens from the
south-west to the north-west. Water depths within the 1 km by 1 km area centred on the platform
ranged from 118.8 m at LAT in the south-south-east to 122 mLAT in a pockmark located c. 290
m north-west of the platform. (Fugro, 2010).
2.3.2. Water Currents and Waves Water masses, and local current speeds and direction all influence the transport, dispersion and
ultimate fate of marine discharges, nutrients, plankton and larvae (OSPAR, 2010).
The predominant regional currents in the North Sea are the vertically well-mixed coastal and
Atlantic water inflow of the Fair Isle/Dooley Current. This current flows around the north of
Orkney and then south, where it turns east and circulates in the North Sea. The second influencing
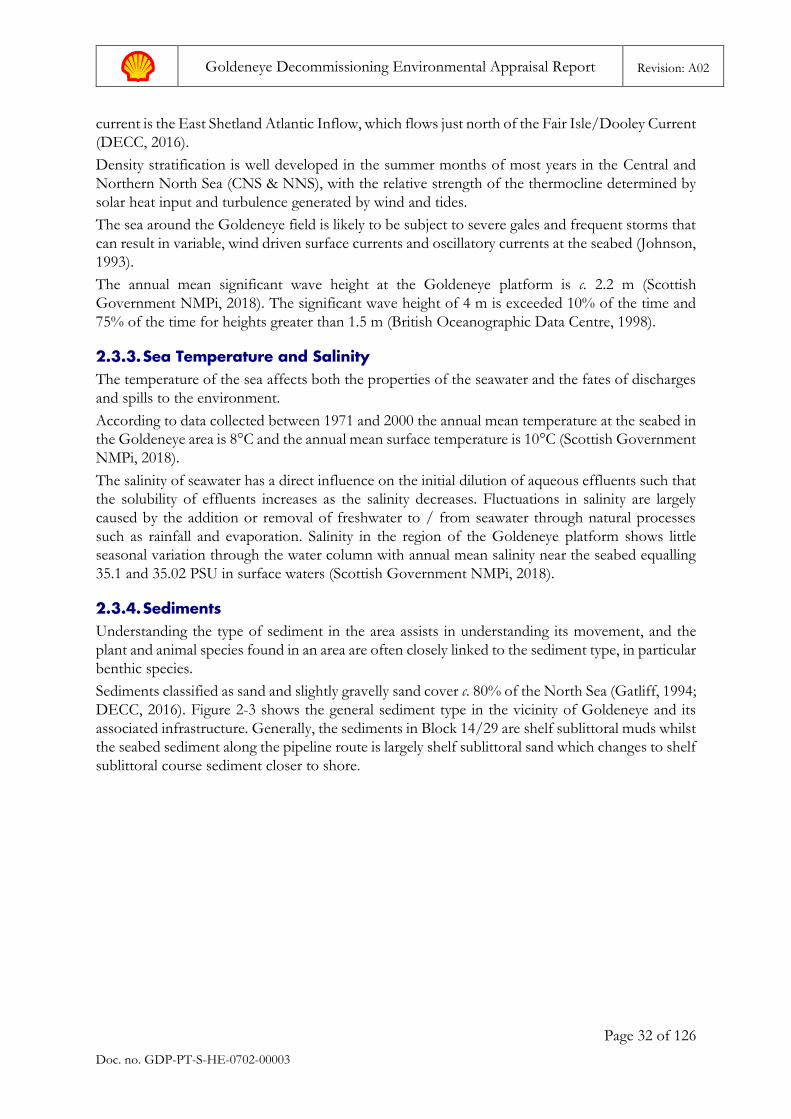
Goldeneye Decommissioning Environmental Appraisal Report Revision: A02
Page 32 of 126
Doc. no. GDP-PT-S-HE-0702-00003
current is the East Shetland Atlantic Inflow, which flows just north of the Fair Isle/Dooley Current
(DECC, 2016).
Density stratification is well developed in the summer months of most years in the Central and
Northern North Sea (CNS & NNS), with the relative strength of the thermocline determined by
solar heat input and turbulence generated by wind and tides.
The sea around the Goldeneye field is likely to be subject to severe gales and frequent storms that
can result in variable, wind driven surface currents and oscillatory currents at the seabed (Johnson,
1993).
The annual mean significant wave height at the Goldeneye platform is c. 2.2 m (Scottish
Government NMPi, 2018). The significant wave height of 4 m is exceeded 10% of the time and
75% of the time for heights greater than 1.5 m (British Oceanographic Data Centre, 1998).
2.3.3. Sea Temperature and Salinity The temperature of the sea affects both the properties of the seawater and the fates of discharges
and spills to the environment.
According to data collected between 1971 and 2000 the annual mean temperature at the seabed in
the Goldeneye area is 8°C and the annual mean surface temperature is 10°C (Scottish Government
NMPi, 2018).
The salinity of seawater has a direct influence on the initial dilution of aqueous effluents such that
the solubility of effluents increases as the salinity decreases. Fluctuations in salinity are largely
caused by the addition or removal of freshwater to / from seawater through natural processes
such as rainfall and evaporation. Salinity in the region of the Goldeneye platform shows little
seasonal variation through the water column with annual mean salinity near the seabed equalling
35.1 and 35.02 PSU in surface waters (Scottish Government NMPi, 2018).
2.3.4. Sediments Understanding the type of sediment in the area assists in understanding its movement, and the
plant and animal species found in an area are often closely linked to the sediment type, in particular
benthic species.
Sediments classified as sand and slightly gravelly sand cover c. 80% of the North Sea (Gatliff, 1994;
DECC, 2016). Figure 2-3 shows the general sediment type in the vicinity of Goldeneye and its
associated infrastructure. Generally, the sediments in Block 14/29 are shelf sublittoral muds whilst
the seabed sediment along the pipeline route is largely shelf sublittoral sand which changes to shelf
sublittoral course sediment closer to shore.
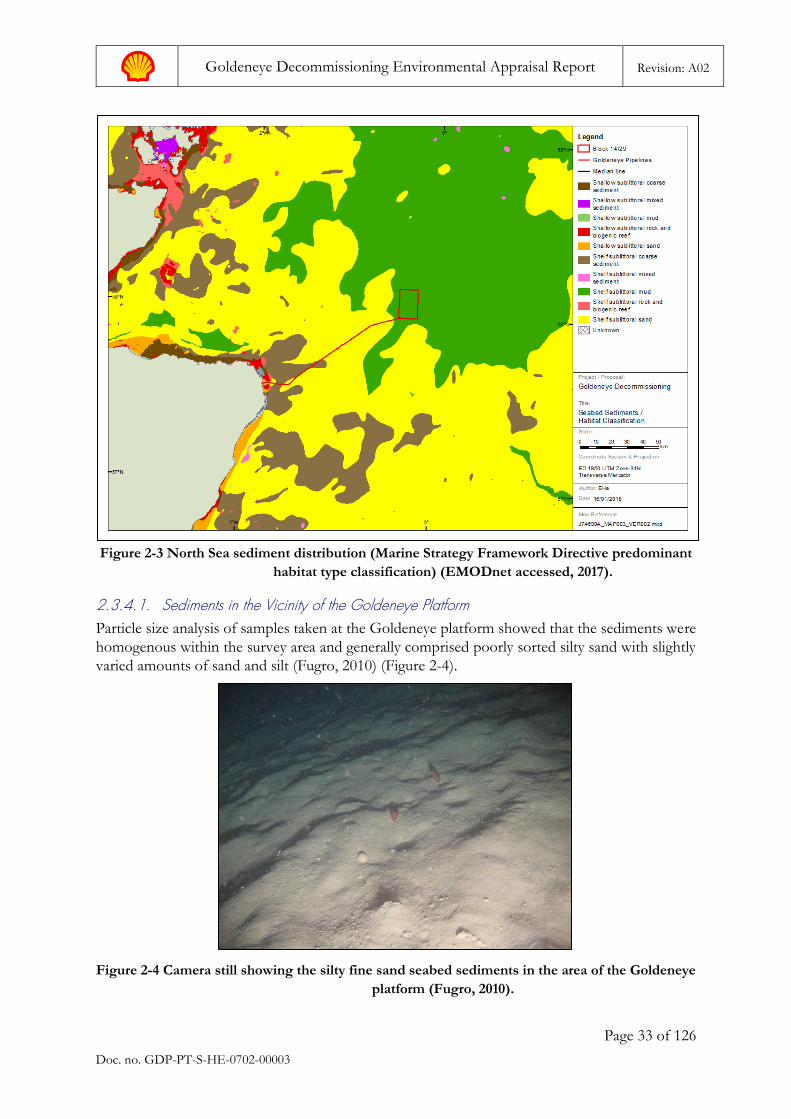
Goldeneye Decommissioning Environmental Appraisal Report Revision: A02
Page 33 of 126
Doc. no. GDP-PT-S-HE-0702-00003
Figure 2-3 North Sea sediment distribution (Marine Strategy Framework Directive predominant
habitat type classification) (EMODnet accessed, 2017).
2.3.4.1. Sediments in the Vicinity of the Goldeneye Platform Particle size analysis of samples taken at the Goldeneye platform showed that the sediments were
homogenous within the survey area and generally comprised poorly sorted silty sand with slightly
varied amounts of sand and silt (Fugro, 2010) (Figure 2-4).
Figure 2-4 Camera still showing the silty fine sand seabed sediments in the area of the Goldeneye
platform (Fugro, 2010).
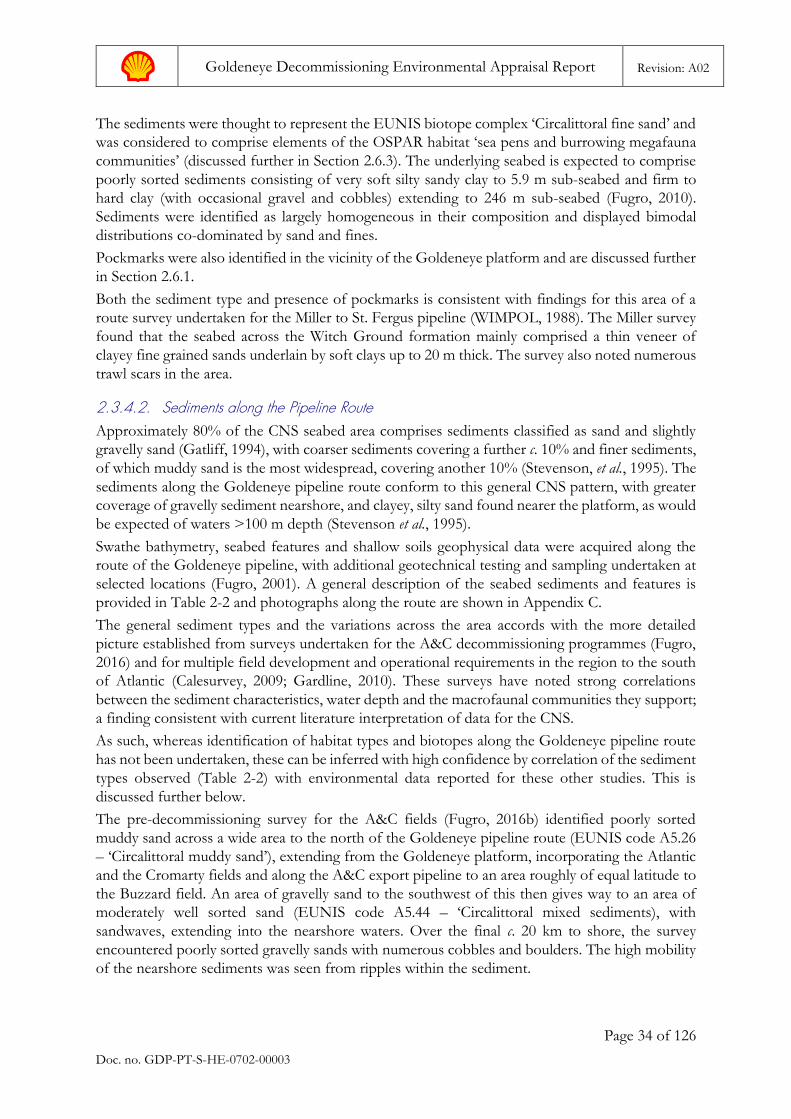
Goldeneye Decommissioning Environmental Appraisal Report Revision: A02
Page 34 of 126
Doc. no. GDP-PT-S-HE-0702-00003
The sediments were thought to represent the EUNIS biotope complex ‘Circalittoral fine sand’ and
was considered to comprise elements of the OSPAR habitat ‘sea pens and burrowing megafauna
communities’ (discussed further in Section 2.6.3). The underlying seabed is expected to comprise
poorly sorted sediments consisting of very soft silty sandy clay to 5.9 m sub-seabed and firm to
hard clay (with occasional gravel and cobbles) extending to 246 m sub-seabed (Fugro, 2010).
Sediments were identified as largely homogeneous in their composition and displayed bimodal
distributions co-dominated by sand and fines.
Pockmarks were also identified in the vicinity of the Goldeneye platform and are discussed further
in Section 2.6.1.
Both the sediment type and presence of pockmarks is consistent with findings for this area of a
route survey undertaken for the Miller to St. Fergus pipeline (WIMPOL, 1988). The Miller survey
found that the seabed across the Witch Ground formation mainly comprised a thin veneer of
clayey fine grained sands underlain by soft clays up to 20 m thick. The survey also noted numerous
trawl scars in the area.
2.3.4.2. Sediments along the Pipeline Route Approximately 80% of the CNS seabed area comprises sediments classified as sand and slightly
gravelly sand (Gatliff, 1994), with coarser sediments covering a further c. 10% and finer sediments,
of which muddy sand is the most widespread, covering another 10% (Stevenson, et al., 1995). The
sediments along the Goldeneye pipeline route conform to this general CNS pattern, with greater
coverage of gravelly sediment nearshore, and clayey, silty sand found nearer the platform, as would
be expected of waters >100 m depth (Stevenson et al., 1995).
Swathe bathymetry, seabed features and shallow soils geophysical data were acquired along the
route of the Goldeneye pipeline, with additional geotechnical testing and sampling undertaken at
selected locations (Fugro, 2001). A general description of the seabed sediments and features is
provided in Table 2-2 and photographs along the route are shown in Appendix C.
The general sediment types and the variations across the area accords with the more detailed
picture established from surveys undertaken for the A&C decommissioning programmes (Fugro,
2016) and for multiple field development and operational requirements in the region to the south
of Atlantic (Calesurvey, 2009; Gardline, 2010). These surveys have noted strong correlations
between the sediment characteristics, water depth and the macrofaunal communities they support;
a finding consistent with current literature interpretation of data for the CNS.
As such, whereas identification of habitat types and biotopes along the Goldeneye pipeline route
has not been undertaken, these can be inferred with high confidence by correlation of the sediment
types observed (Table 2-2) with environmental data reported for these other studies. This is
discussed further below.
The pre-decommissioning survey for the A&C fields (Fugro, 2016b) identified poorly sorted
muddy sand across a wide area to the north of the Goldeneye pipeline route (EUNIS code A5.26
– ‘Circalittoral muddy sand’), extending from the Goldeneye platform, incorporating the Atlantic
and the Cromarty fields and along the A&C export pipeline to an area roughly of equal latitude to
the Buzzard field. An area of gravelly sand to the southwest of this then gives way to an area of
moderately well sorted sand (EUNIS code A5.44 – ‘Circalittoral mixed sediments), with
sandwaves, extending into the nearshore waters. Over the final c. 20 km to shore, the survey
encountered poorly sorted gravelly sands with numerous cobbles and boulders. The high mobility
of the nearshore sediments was seen from ripples within the sediment.
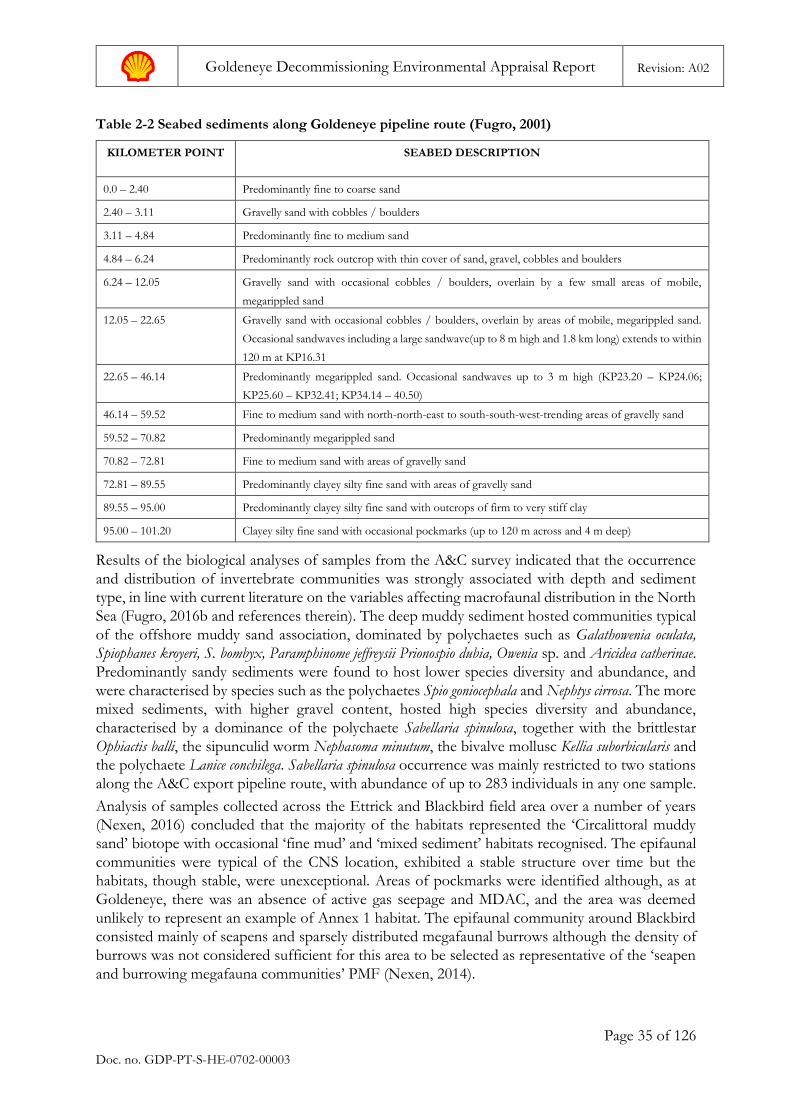
Goldeneye Decommissioning Environmental Appraisal Report Revision: A02
Page 35 of 126
Doc. no. GDP-PT-S-HE-0702-00003
Table 2-2 Seabed sediments along Goldeneye pipeline route (Fugro, 2001)
KILOMETER POINT SEABED DESCRIPTION
0.0 – 2.40 Predominantly fine to coarse sand
2.40 – 3.11 Gravelly sand with cobbles / boulders
3.11 – 4.84 Predominantly fine to medium sand
4.84 – 6.24 Predominantly rock outcrop with thin cover of sand, gravel, cobbles and boulders
6.24 – 12.05 Gravelly sand with occasional cobbles / boulders, overlain by a few small areas of mobile,
megarippled sand
12.05 – 22.65 Gravelly sand with occasional cobbles / boulders, overlain by areas of mobile, megarippled sand.
Occasional sandwaves including a large sandwave(up to 8 m high and 1.8 km long) extends to within
120 m at KP16.31
22.65 – 46.14 Predominantly megarippled sand. Occasional sandwaves up to 3 m high (KP23.20 – KP24.06;
KP25.60 – KP32.41; KP34.14 – 40.50)
46.14 – 59.52 Fine to medium sand with north-north-east to south-south-west-trending areas of gravelly sand
59.52 – 70.82 Predominantly megarippled sand
70.82 – 72.81 Fine to medium sand with areas of gravelly sand
72.81 – 89.55 Predominantly clayey silty fine sand with areas of gravelly sand
89.55 – 95.00 Predominantly clayey silty fine sand with outcrops of firm to very stiff clay
95.00 – 101.20 Clayey silty fine sand with occasional pockmarks (up to 120 m across and 4 m deep)
Results of the biological analyses of samples from the A&C survey indicated that the occurrence
and distribution of invertebrate communities was strongly associated with depth and sediment
type, in line with current literature on the variables affecting macrofaunal distribution in the North
Sea (Fugro, 2016b and references therein). The deep muddy sediment hosted communities typical
of the offshore muddy sand association, dominated by polychaetes such as Galathowenia oculata,
Spiophanes kroyeri, S. bombyx, Paramphinome jeffreysii Prionospio dubia, Owenia sp. and Aricidea catherinae.
Predominantly sandy sediments were found to host lower species diversity and abundance, and
were characterised by species such as the polychaetes Spio goniocephala and Nephtys cirrosa. The more
mixed sediments, with higher gravel content, hosted high species diversity and abundance,
characterised by a dominance of the polychaete Sabellaria spinulosa, together with the brittlestar
Ophiactis balli, the sipunculid worm Nephasoma minutum, the bivalve mollusc Kellia suborbicularis and
the polychaete Lanice conchilega. Sabellaria spinulosa occurrence was mainly restricted to two stations
along the A&C export pipeline route, with abundance of up to 283 individuals in any one sample.
Analysis of samples collected across the Ettrick and Blackbird field area over a number of years
(Nexen, 2016) concluded that the majority of the habitats represented the ‘Circalittoral muddy
sand’ biotope with occasional ‘fine mud’ and ‘mixed sediment’ habitats recognised. The epifaunal
communities were typical of the CNS location, exhibited a stable structure over time but the
habitats, though stable, were unexceptional. Areas of pockmarks were identified although, as at
Goldeneye, there was an absence of active gas seepage and MDAC, and the area was deemed
unlikely to represent an example of Annex 1 habitat. The epifaunal community around Blackbird
consisted mainly of seapens and sparsely distributed megafaunal burrows although the density of
burrows was not considered sufficient for this area to be selected as representative of the ‘seapen
and burrowing megafauna communities’ PMF (Nexen, 2014).
Goldeneye Decommissioning Environmental Appraisal Report Revision: A02
Page 36 of 126
Doc. no. GDP-PT-S-HE-0702-00003
A review of information from multiple surveys covering the Golden Eagle, Ettrick, Blackbird and
Buzzard fields (Gardline, 2010) concluded that the sediments across the majority of this wide were
consistently silty fine sand except at the southwestern part of the area around Buzzard. Samples
collected between Golden Eagle and Buzzard (crossing the Goldeneye pipeline route) identified a
transition from silty fine sand to the north becoming medium sands to the south. Megaripples in
the mid-section mark the boundary between the two types. Pockmarks were identified at the north
of Golden Eagle and at Blackbird, associated with the Witch Ground Formation which can be
seen from Figure 2-3 to extend to both locations. Numerous clay, or dense clay, outcrops occurred
throughout the reviewed area in between these two. Analysis of macrofauna communities
indicated that the conditions across the area varied naturally with the sediment conditions and
depth (Gardline, 2010).
Environmental samples collected in the vicinity of the Goldeneye pipeline for the Peterhead CCS
project (CMACS, 2014), centred around the pipeline connection point (KP20) showed a consistent
sediment type of gravelly sand or slightly gravelly sand. Faunal analysis showed the area to host a
very rich and a diverse fauna which corresponded to the biotope of ‘polychaete-rich deep Venus
community in offshore mixed sediment’ (SS.SMx.OMx.PoVen).
From these combined sources of information it can be inferred that the Goldeneye pipeline will
traverse habitats of the following type:
• KP2 – KP25: Sandy gravel supporting fauna of the biotope Polychaete-rich deep Venus community in offshore mixed sediment, consistent with information from the Peterhead CCS surveys;
• KP25 – KP45: Predominantly megarippled medium sand (Circalittoral mixed sediment) supporting fauna of low diversity and low abundance, consistent with data from the A&C pre-decommissioning surveys;
• KP45 – KP60: Areas of poorly sorted gravelly sand supporting fauna of high diversity and high abundance among areas of medium sand supporting fauna of low diversity and low abundance, consistent with data from the A&C pre-decommissioning surveys and with a band of shelf sublittoral coarse sediment identified in Figure 2-3;
• KP60 – KP70: Predominantly megarippled medium sand (Circalittoral mixed sediment) supporting fauna of low diversity and low abundance, consistent with data from surveys of the Buzzard field; and
• KP70 – KP102: Predominantly clayey silty fine sand with outcrops of firm to very stiff clay (Circalittoral muddy sand), consistent with information from A&C pre-decommissioning surveys and from surveys across the Golden Eagle, Ettrick and Blackbird region.
This interpretation has provided sufficient information on the Goldeneye pipeline route to enable
assessment of the environmental impacts of decommissioning.
2.3.5. Cuttings Piles The five Goldeneye wells were drilled in 2004, after the ban on discharges of oil based mud (OBM).
Use of OBM was consequently contained and OBM contaminated cuttings were returned to shore
for processing and disposal. Discharges of cuttings drilled with water based mud (WBM) were
likely to have taken place and bathymetry data from a survey of the Goldeneye area in 2009 (Fugro,
2010) shows evidence of sediment disturbance under the platform which could be interpreted as
being WBM cuttings.
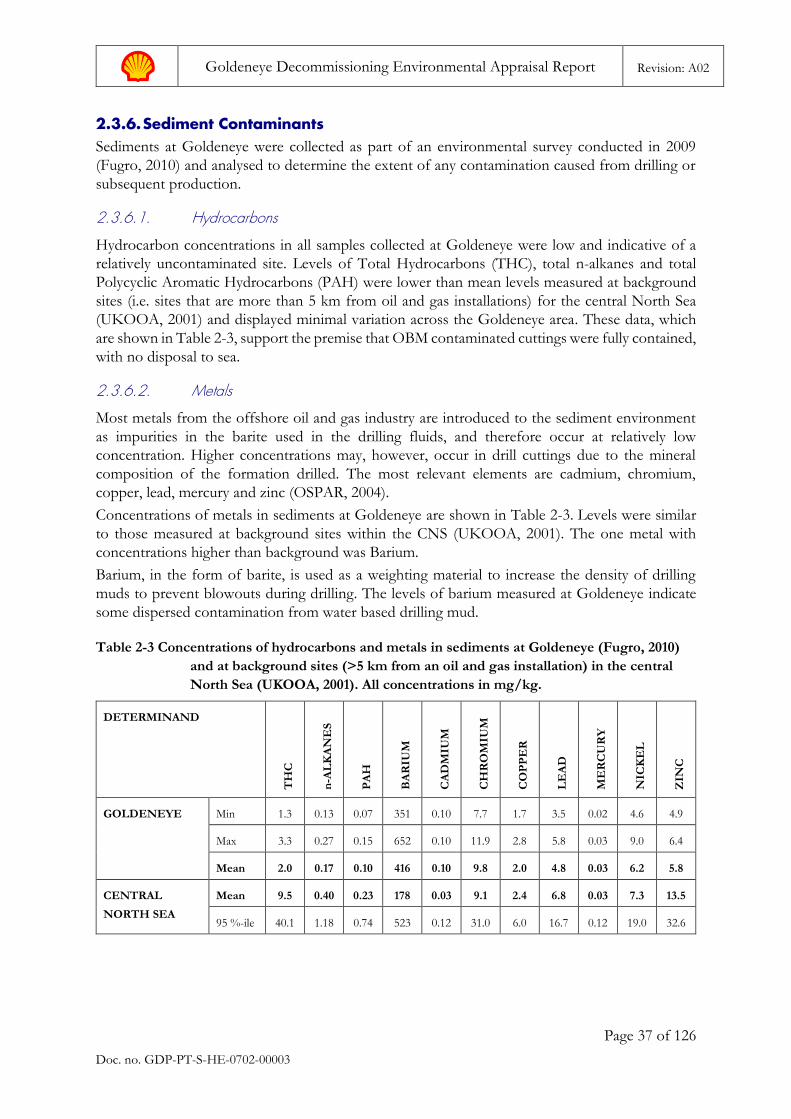
Goldeneye Decommissioning Environmental Appraisal Report Revision: A02
Page 37 of 126
Doc. no. GDP-PT-S-HE-0702-00003
2.3.6. Sediment Contaminants Sediments at Goldeneye were collected as part of an environmental survey conducted in 2009
(Fugro, 2010) and analysed to determine the extent of any contamination caused from drilling or
subsequent production.
2.3.6.1. Hydrocarbons
Hydrocarbon concentrations in all samples collected at Goldeneye were low and indicative of a
relatively uncontaminated site. Levels of Total Hydrocarbons (THC), total n-alkanes and total
Polycyclic Aromatic Hydrocarbons (PAH) were lower than mean levels measured at background
sites (i.e. sites that are more than 5 km from oil and gas installations) for the central North Sea
(UKOOA, 2001) and displayed minimal variation across the Goldeneye area. These data, which
are shown in Table 2-3, support the premise that OBM contaminated cuttings were fully contained,
with no disposal to sea.
2.3.6.2. Metals
Most metals from the offshore oil and gas industry are introduced to the sediment environment
as impurities in the barite used in the drilling fluids, and therefore occur at relatively low
concentration. Higher concentrations may, however, occur in drill cuttings due to the mineral
composition of the formation drilled. The most relevant elements are cadmium, chromium,
copper, lead, mercury and zinc (OSPAR, 2004).
Concentrations of metals in sediments at Goldeneye are shown in Table 2-3. Levels were similar
to those measured at background sites within the CNS (UKOOA, 2001). The one metal with
concentrations higher than background was Barium.
Barium, in the form of barite, is used as a weighting material to increase the density of drilling
muds to prevent blowouts during drilling. The levels of barium measured at Goldeneye indicate
some dispersed contamination from water based drilling mud.
Table 2-3 Concentrations of hydrocarbons and metals in sediments at Goldeneye (Fugro, 2010)
and at background sites (>5 km from an oil and gas installation) in the central
North Sea (UKOOA, 2001). All concentrations in mg/kg.
DETERMINAND
TH
C
n-A
LK
AN
ES
PA
H
BA
RIU
M
CA
DM
IUM
CH
RO
MIU
M
CO
PP
ER
LE
AD
ME
RC
UR
Y
NIC
KE
L
ZIN
C
GOLDENEYE Min 1.3 0.13 0.07 351 0.10 7.7 1.7 3.5 0.02 4.6 4.9
Max 3.3 0.27 0.15 652 0.10 11.9 2.8 5.8 0.03 9.0 6.4
Mean 2.0 0.17 0.10 416 0.10 9.8 2.0 4.8 0.03 6.2 5.8
CENTRAL
NORTH SEA
Mean 9.5 0.40 0.23 178 0.03 9.1 2.4 6.8 0.03 7.3 13.5
95 %-ile 40.1 1.18 0.74 523 0.12 31.0 6.0 16.7 0.12 19.0 32.6
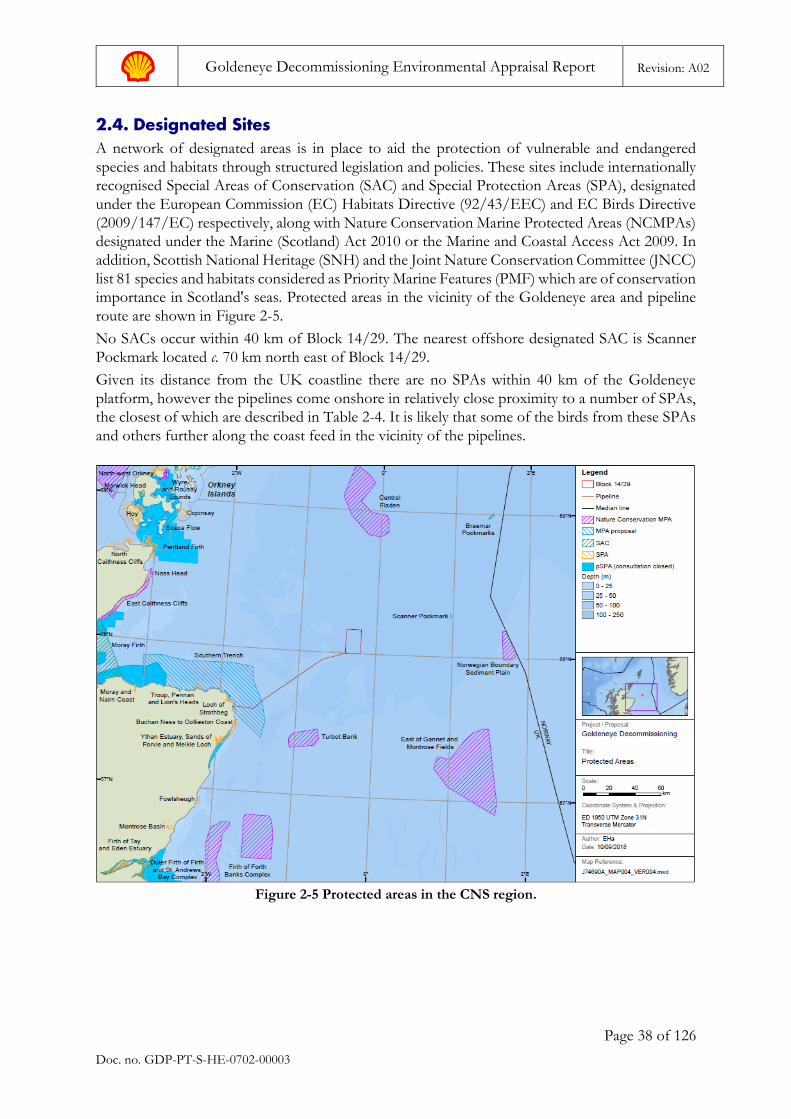
Goldeneye Decommissioning Environmental Appraisal Report Revision: A02
Page 38 of 126
Doc. no. GDP-PT-S-HE-0702-00003
2.4. Designated Sites A network of designated areas is in place to aid the protection of vulnerable and endangered
species and habitats through structured legislation and policies. These sites include internationally
recognised Special Areas of Conservation (SAC) and Special Protection Areas (SPA), designated
under the European Commission (EC) Habitats Directive (92/43/EEC) and EC Birds Directive
(2009/147/EC) respectively, along with Nature Conservation Marine Protected Areas (NCMPAs)
designated under the Marine (Scotland) Act 2010 or the Marine and Coastal Access Act 2009. In
addition, Scottish National Heritage (SNH) and the Joint Nature Conservation Committee (JNCC)
list 81 species and habitats considered as Priority Marine Features (PMF) which are of conservation
importance in Scotland's seas. Protected areas in the vicinity of the Goldeneye area and pipeline
route are shown in Figure 2-5. No SACs occur within 40 km of Block 14/29. The nearest offshore designated SAC is Scanner
Pockmark located c. 70 km north east of Block 14/29.
Given its distance from the UK coastline there are no SPAs within 40 km of the Goldeneye
platform, however the pipelines come onshore in relatively close proximity to a number of SPAs,
the closest of which are described in Table 2-4. It is likely that some of the birds from these SPAs
and others further along the coast feed in the vicinity of the pipelines.
Figure 2-5 Protected areas in the CNS region.
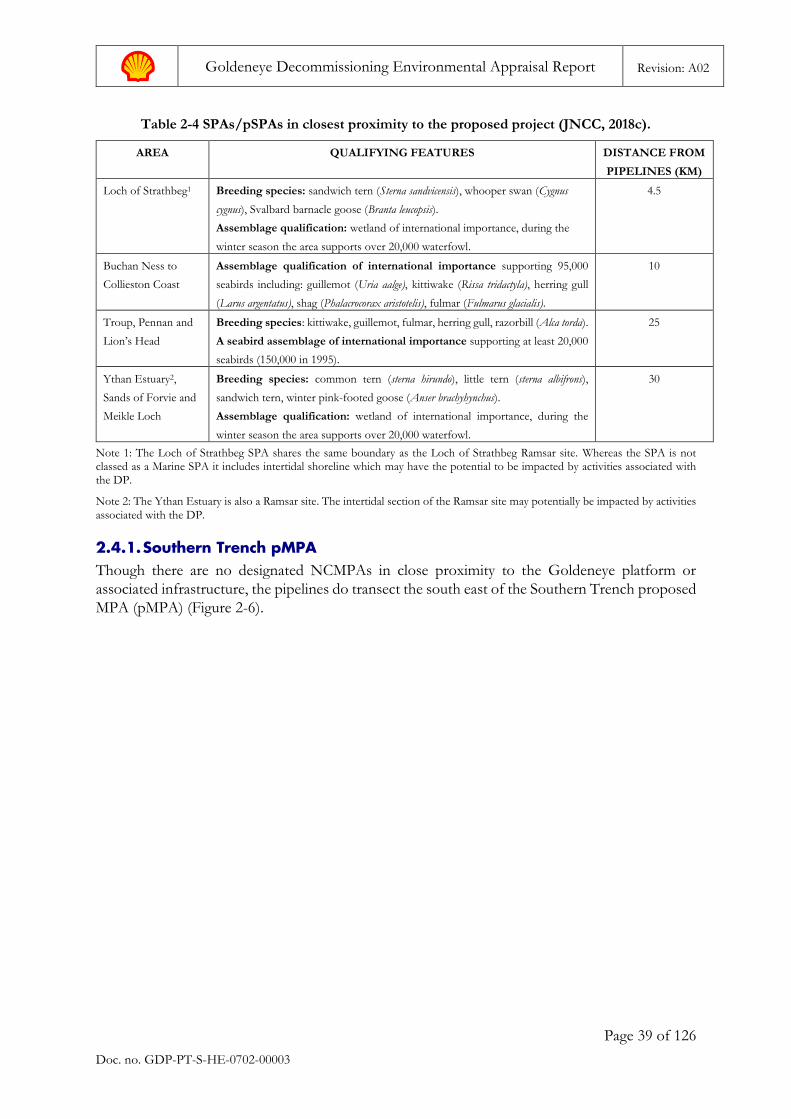
Goldeneye Decommissioning Environmental Appraisal Report Revision: A02
Page 39 of 126
Doc. no. GDP-PT-S-HE-0702-00003
Table 2-4 SPAs/pSPAs in closest proximity to the proposed project (JNCC, 2018c).
AREA QUALIFYING FEATURES DISTANCE FROM
PIPELINES (KM)
Loch of Strathbeg1 Breeding species: sandwich tern (Sterna sandvicensis), whooper swan (Cygnus
cygnus), Svalbard barnacle goose (Branta leucopsis).
Assemblage qualification: wetland of international importance, during the
winter season the area supports over 20,000 waterfowl.
4.5
Buchan Ness to
Collieston Coast
Assemblage qualification of international importance supporting 95,000
seabirds including: guillemot (Uria aalge), kittiwake (Rissa tridactyla), herring gull
(Larus argentatus), shag (Phalacrocorax aristotelis), fulmar (Fulmarus glacialis).
10
Troup, Pennan and
Lion’s Head
Breeding species: kittiwake, guillemot, fulmar, herring gull, razorbill (Alca torda).
A seabird assemblage of international importance supporting at least 20,000
seabirds (150,000 in 1995).
25
Ythan Estuary2,
Sands of Forvie and
Meikle Loch
Breeding species: common tern (sterna hirundo), little tern (sterna albifrons),
sandwich tern, winter pink-footed goose (Anser brachyhynchus).
Assemblage qualification: wetland of international importance, during the
winter season the area supports over 20,000 waterfowl.
30
Note 1: The Loch of Strathbeg SPA shares the same boundary as the Loch of Strathbeg Ramsar site. Whereas the SPA is not classed as a Marine SPA it includes intertidal shoreline which may have the potential to be impacted by activities associated with the DP.
Note 2: The Ythan Estuary is also a Ramsar site. The intertidal section of the Ramsar site may potentially be impacted by activities
associated with the DP.
2.4.1. Southern Trench pMPA Though there are no designated NCMPAs in close proximity to the Goldeneye platform or
associated infrastructure, the pipelines do transect the south east of the Southern Trench proposed
MPA (pMPA) (Figure 2-6).
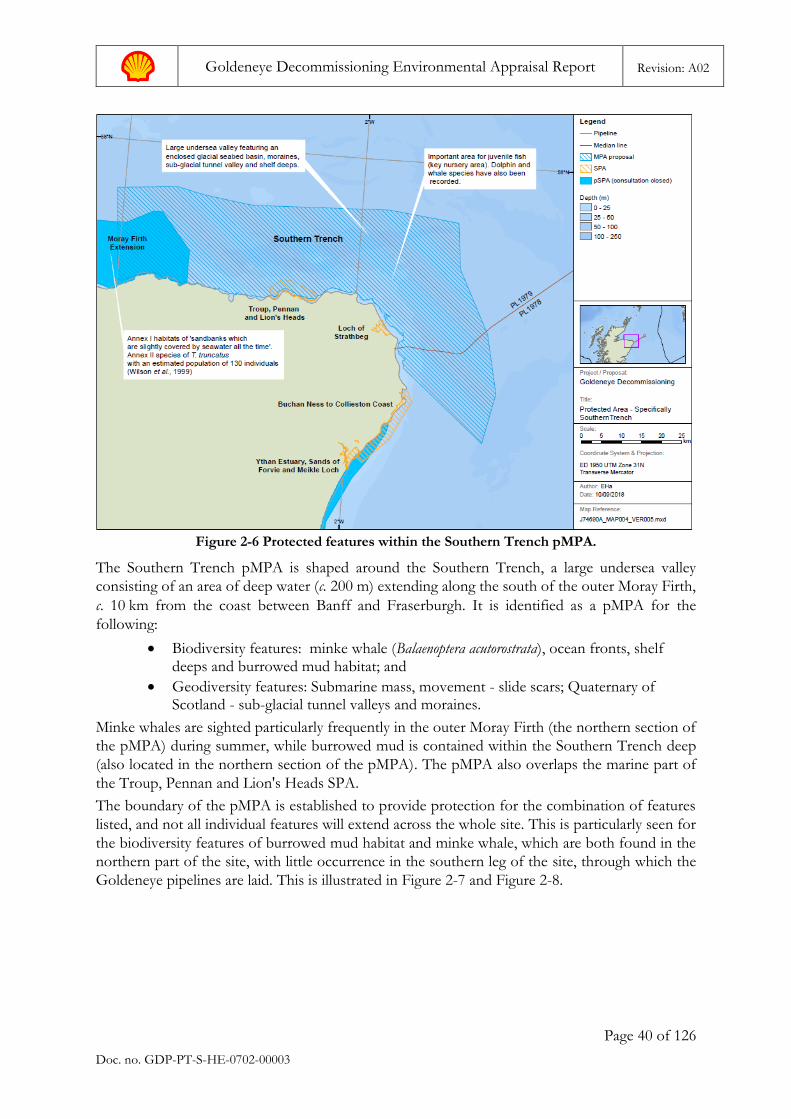
Goldeneye Decommissioning Environmental Appraisal Report Revision: A02
Page 40 of 126
Doc. no. GDP-PT-S-HE-0702-00003
Figure 2-6 Protected features within the Southern Trench pMPA.
The Southern Trench pMPA is shaped around the Southern Trench, a large undersea valley
consisting of an area of deep water (c. 200 m) extending along the south of the outer Moray Firth,
c. 10 km from the coast between Banff and Fraserburgh. It is identified as a pMPA for the
following:
• Biodiversity features: minke whale (Balaenoptera acutorostrata), ocean fronts, shelf deeps and burrowed mud habitat; and
• Geodiversity features: Submarine mass, movement - slide scars; Quaternary of Scotland - sub-glacial tunnel valleys and moraines.
Minke whales are sighted particularly frequently in the outer Moray Firth (the northern section of
the pMPA) during summer, while burrowed mud is contained within the Southern Trench deep
(also located in the northern section of the pMPA). The pMPA also overlaps the marine part of
the Troup, Pennan and Lion's Heads SPA.
The boundary of the pMPA is established to provide protection for the combination of features
listed, and not all individual features will extend across the whole site. This is particularly seen for
the biodiversity features of burrowed mud habitat and minke whale, which are both found in the
northern part of the site, with little occurrence in the southern leg of the site, through which the
Goldeneye pipelines are laid. This is illustrated in Figure 2-7 and Figure 2-8.
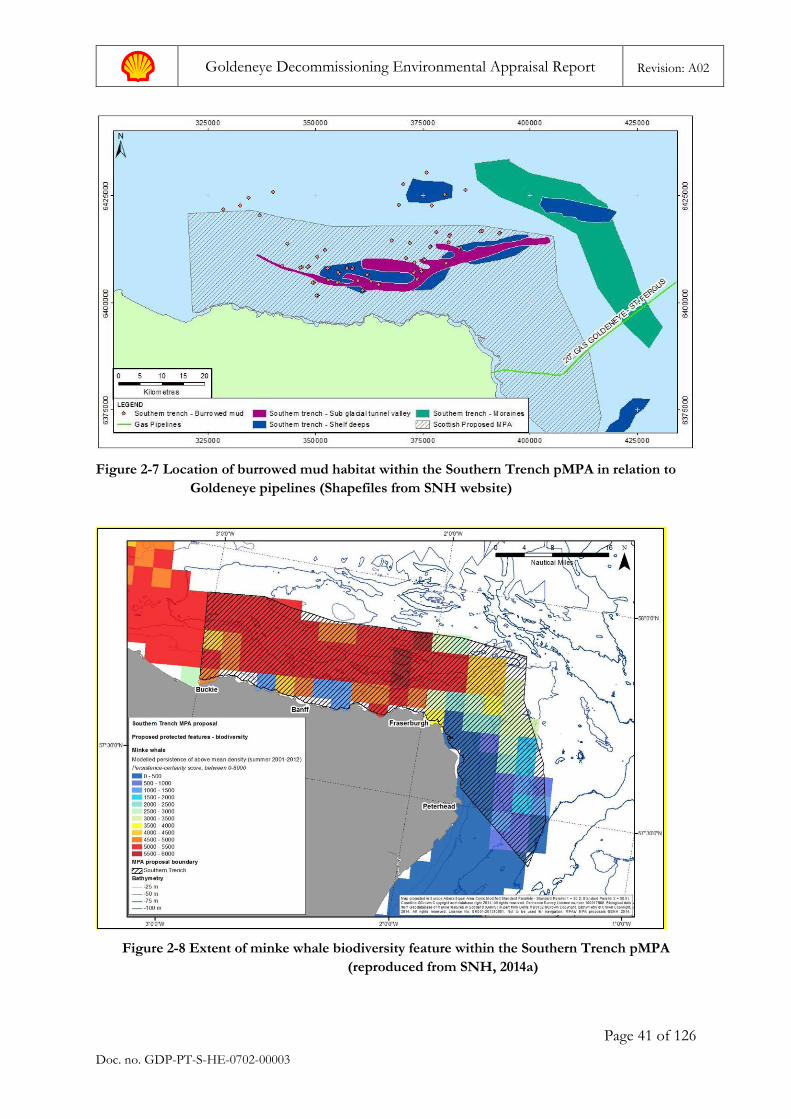
Goldeneye Decommissioning Environmental Appraisal Report Revision: A02
Page 41 of 126
Doc. no. GDP-PT-S-HE-0702-00003
Figure 2-7 Location of burrowed mud habitat within the Southern Trench pMPA in relation to
Goldeneye pipelines (Shapefiles from SNH website)
Figure 2-8 Extent of minke whale biodiversity feature within the Southern Trench pMPA
(reproduced from SNH, 2014a)
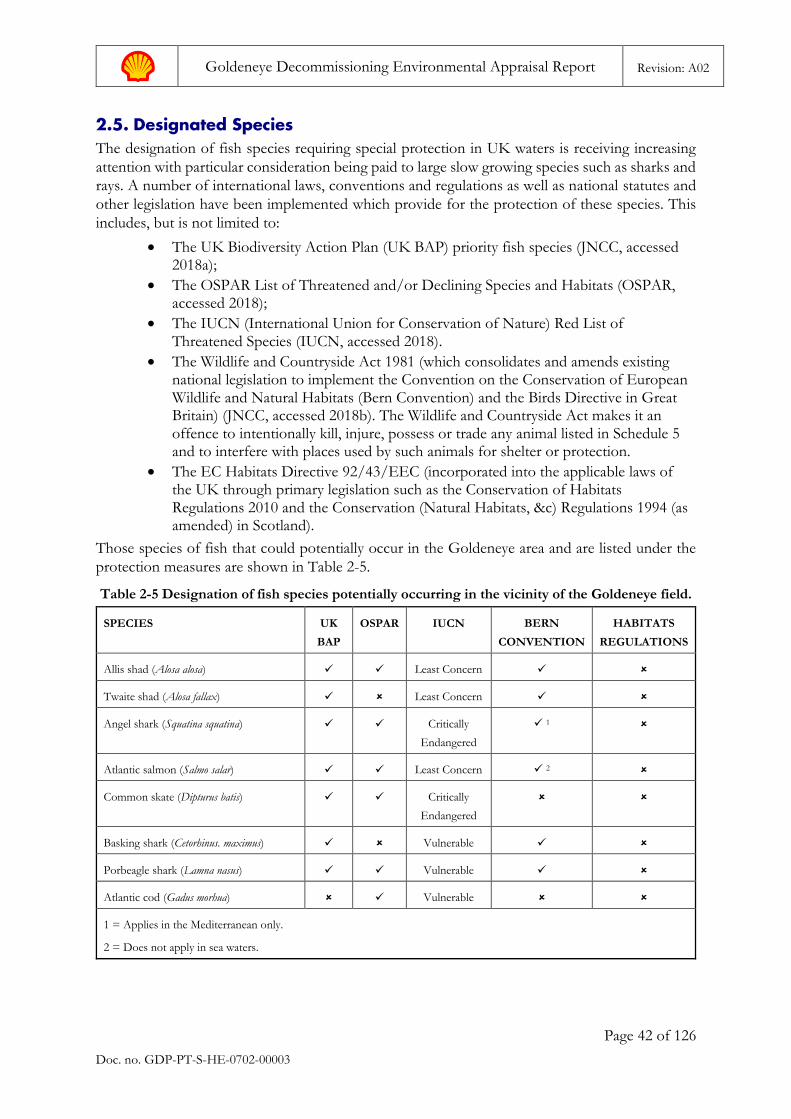
Goldeneye Decommissioning Environmental Appraisal Report Revision: A02
Page 42 of 126
Doc. no. GDP-PT-S-HE-0702-00003
2.5. Designated Species The designation of fish species requiring special protection in UK waters is receiving increasing
attention with particular consideration being paid to large slow growing species such as sharks and
rays. A number of international laws, conventions and regulations as well as national statutes and
other legislation have been implemented which provide for the protection of these species. This
includes, but is not limited to:
• The UK Biodiversity Action Plan (UK BAP) priority fish species (JNCC, accessed 2018a);
• The OSPAR List of Threatened and/or Declining Species and Habitats (OSPAR, accessed 2018);
• The IUCN (International Union for Conservation of Nature) Red List of Threatened Species (IUCN, accessed 2018).
• The Wildlife and Countryside Act 1981 (which consolidates and amends existing national legislation to implement the Convention on the Conservation of European Wildlife and Natural Habitats (Bern Convention) and the Birds Directive in Great Britain) (JNCC, accessed 2018b). The Wildlife and Countryside Act makes it an offence to intentionally kill, injure, possess or trade any animal listed in Schedule 5 and to interfere with places used by such animals for shelter or protection.
• The EC Habitats Directive 92/43/EEC (incorporated into the applicable laws of the UK through primary legislation such as the Conservation of Habitats Regulations 2010 and the Conservation (Natural Habitats, &c) Regulations 1994 (as amended) in Scotland).
Those species of fish that could potentially occur in the Goldeneye area and are listed under the
protection measures are shown in Table 2-5.
Table 2-5 Designation of fish species potentially occurring in the vicinity of the Goldeneye field.
SPECIES UK
BAP
OSPAR IUCN BERN
CONVENTION
HABITATS
REGULATIONS
Allis shad (Alosa alosa) ✓ ✓ Least Concern ✓
Twaite shad (Alosa fallax) ✓ Least Concern ✓
Angel shark (Squatina squatina) ✓ ✓ Critically
Endangered
✓ 1
Atlantic salmon (Salmo salar) ✓ ✓ Least Concern ✓ 2
Common skate (Dipturus batis) ✓ ✓ Critically
Endangered
Basking shark (Cetorhinus. maximus) ✓ Vulnerable ✓
Porbeagle shark (Lamna nasus) ✓ ✓ Vulnerable ✓
Atlantic cod (Gadus morhua) ✓ Vulnerable
1 = Applies in the Mediterranean only.
2 = Does not apply in sea waters.
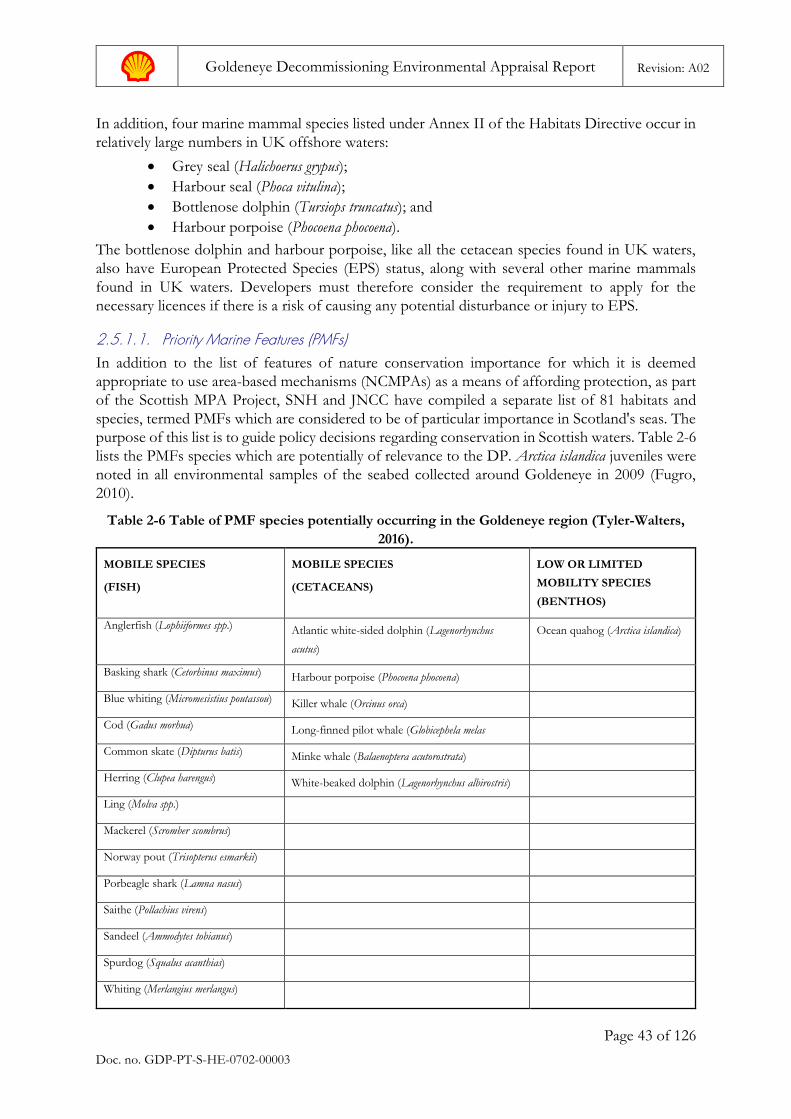
Goldeneye Decommissioning Environmental Appraisal Report Revision: A02
Page 43 of 126
Doc. no. GDP-PT-S-HE-0702-00003
In addition, four marine mammal species listed under Annex II of the Habitats Directive occur in
relatively large numbers in UK offshore waters:
• Grey seal (Halichoerus grypus);
• Harbour seal (Phoca vitulina);
• Bottlenose dolphin (Tursiops truncatus); and
• Harbour porpoise (Phocoena phocoena).
The bottlenose dolphin and harbour porpoise, like all the cetacean species found in UK waters,
also have European Protected Species (EPS) status, along with several other marine mammals
found in UK waters. Developers must therefore consider the requirement to apply for the
necessary licences if there is a risk of causing any potential disturbance or injury to EPS.
2.5.1.1. Priority Marine Features (PMFs) In addition to the list of features of nature conservation importance for which it is deemed
appropriate to use area-based mechanisms (NCMPAs) as a means of affording protection, as part
of the Scottish MPA Project, SNH and JNCC have compiled a separate list of 81 habitats and
species, termed PMFs which are considered to be of particular importance in Scotland's seas. The
purpose of this list is to guide policy decisions regarding conservation in Scottish waters. Table 2-6
lists the PMFs species which are potentially of relevance to the DP. Arctica islandica juveniles were
noted in all environmental samples of the seabed collected around Goldeneye in 2009 (Fugro,
2010).
Table 2-6 Table of PMF species potentially occurring in the Goldeneye region (Tyler-Walters,
2016).
MOBILE SPECIES
(FISH)
MOBILE SPECIES
(CETACEANS)
LOW OR LIMITED
MOBILITY SPECIES
(BENTHOS)
Anglerfish (Lophiiformes spp.)
Atlantic white-sided dolphin (Lagenorhynchus
acutus)
Ocean quahog (Arctica islandica)
Basking shark (Cetorhinus maximus) Harbour porpoise (Phocoena phocoena)
Blue whiting (Micromesistius poutassou)
Killer whale (Orcinus orca)
Cod (Gadus morhua)
Long-finned pilot whale (Globicephela melas
Common skate (Dipturus batis)
Minke whale (Balaenoptera acutorostrata)
Herring (Clupea harengus)
White-beaked dolphin (Lagenorhynchus albirostris)
Ling (Molva spp.)
Mackerel (Scromber scombrus)
Norway pout (Trisopterus esmarkii)
Porbeagle shark (Lamna nasus)
Saithe (Pollachius virens)
Sandeel (Ammodytes tobianus)
Spurdog (Squalus acanthias)
Whiting (Merlangius merlangus)
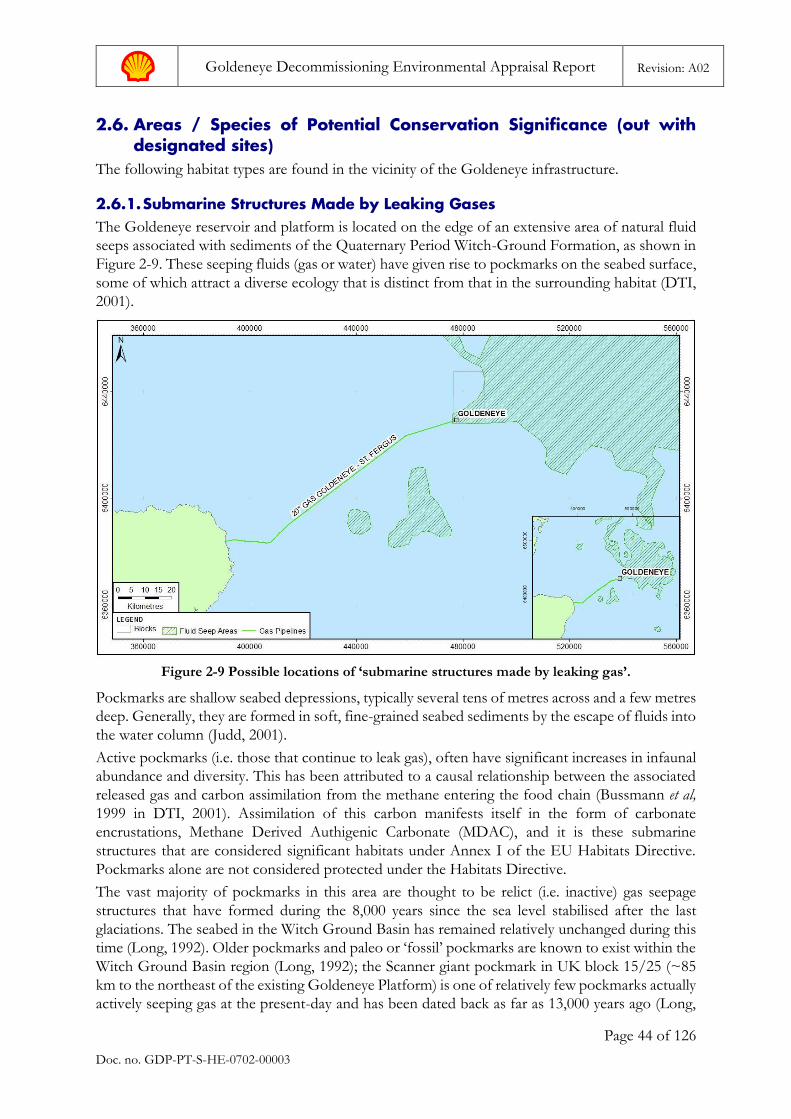
Goldeneye Decommissioning Environmental Appraisal Report Revision: A02
Page 44 of 126
Doc. no. GDP-PT-S-HE-0702-00003
2.6. Areas / Species of Potential Conservation Significance (out with designated sites)
The following habitat types are found in the vicinity of the Goldeneye infrastructure.
2.6.1. Submarine Structures Made by Leaking Gases The Goldeneye reservoir and platform is located on the edge of an extensive area of natural fluid
seeps associated with sediments of the Quaternary Period Witch-Ground Formation, as shown in
Figure 2-9. These seeping fluids (gas or water) have given rise to pockmarks on the seabed surface,
some of which attract a diverse ecology that is distinct from that in the surrounding habitat (DTI,
2001).
Figure 2-9 Possible locations of ‘submarine structures made by leaking gas’.
Pockmarks are shallow seabed depressions, typically several tens of metres across and a few metres
deep. Generally, they are formed in soft, fine-grained seabed sediments by the escape of fluids into
the water column (Judd, 2001).
Active pockmarks (i.e. those that continue to leak gas), often have significant increases in infaunal
abundance and diversity. This has been attributed to a causal relationship between the associated
released gas and carbon assimilation from the methane entering the food chain (Bussmann et al,
1999 in DTI, 2001). Assimilation of this carbon manifests itself in the form of carbonate
encrustations, Methane Derived Authigenic Carbonate (MDAC), and it is these submarine
structures that are considered significant habitats under Annex I of the EU Habitats Directive.
Pockmarks alone are not considered protected under the Habitats Directive.
The vast majority of pockmarks in this area are thought to be relict (i.e. inactive) gas seepage
structures that have formed during the 8,000 years since the sea level stabilised after the last
glaciations. The seabed in the Witch Ground Basin has remained relatively unchanged during this
time (Long, 1992). Older pockmarks and paleo or ‘fossil’ pockmarks are known to exist within the
Witch Ground Basin region (Long, 1992); the Scanner giant pockmark in UK block 15/25 (~85
km to the northeast of the existing Goldeneye Platform) is one of relatively few pockmarks actually
actively seeping gas at the present-day and has been dated back as far as 13,000 years ago (Long,
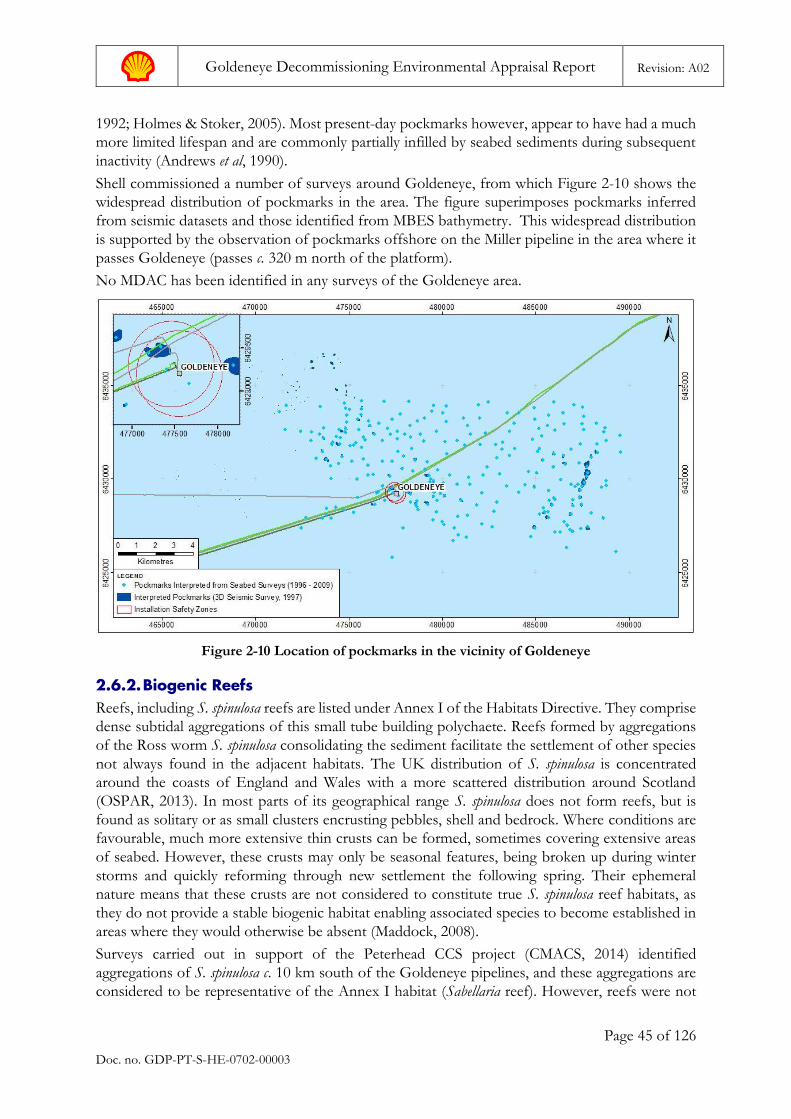
Goldeneye Decommissioning Environmental Appraisal Report Revision: A02
Page 45 of 126
Doc. no. GDP-PT-S-HE-0702-00003
1992; Holmes & Stoker, 2005). Most present-day pockmarks however, appear to have had a much
more limited lifespan and are commonly partially infilled by seabed sediments during subsequent
inactivity (Andrews et al, 1990).
Shell commissioned a number of surveys around Goldeneye, from which Figure 2-10 shows the
widespread distribution of pockmarks in the area. The figure superimposes pockmarks inferred
from seismic datasets and those identified from MBES bathymetry. This widespread distribution
is supported by the observation of pockmarks offshore on the Miller pipeline in the area where it
passes Goldeneye (passes c. 320 m north of the platform).
No MDAC has been identified in any surveys of the Goldeneye area.
Figure 2-10 Location of pockmarks in the vicinity of Goldeneye
2.6.2. Biogenic Reefs Reefs, including S. spinulosa reefs are listed under Annex I of the Habitats Directive. They comprise
dense subtidal aggregations of this small tube building polychaete. Reefs formed by aggregations
of the Ross worm S. spinulosa consolidating the sediment facilitate the settlement of other species
not always found in the adjacent habitats. The UK distribution of S. spinulosa is concentrated
around the coasts of England and Wales with a more scattered distribution around Scotland
(OSPAR, 2013). In most parts of its geographical range S. spinulosa does not form reefs, but is
found as solitary or as small clusters encrusting pebbles, shell and bedrock. Where conditions are
favourable, much more extensive thin crusts can be formed, sometimes covering extensive areas
of seabed. However, these crusts may only be seasonal features, being broken up during winter
storms and quickly reforming through new settlement the following spring. Their ephemeral
nature means that these crusts are not considered to constitute true S. spinulosa reef habitats, as
they do not provide a stable biogenic habitat enabling associated species to become established in
areas where they would otherwise be absent (Maddock, 2008).
Surveys carried out in support of the Peterhead CCS project (CMACS, 2014) identified
aggregations of S. spinulosa c. 10 km south of the Goldeneye pipelines, and these aggregations are
considered to be representative of the Annex I habitat (Sabellaria reef). However, reefs were not
Goldeneye Decommissioning Environmental Appraisal Report Revision: A02
Page 46 of 126
Doc. no. GDP-PT-S-HE-0702-00003
found in the sample locations along the Goldeneye pipeline route marked ‘A’, ‘B’ and ‘C’ in Figure
2-2
Discontinuous non-reef forming S. spinulosa aggregations have been observed at the nearshore end
(between KP6 and KP15) of the Atlantic to St. Fergus pipeline route (Fugro, 2016b). At these KP
points water depths range from 50 m to 88 m. The S. spinulosa appeared to be of poor quality and
heavily degraded whilst aggregations were not observed continuously. Absences were noticed for
stretches of seabed up to 61 m whilst other areas had low densities of S. Spinulosa that were
classified as not a reef. However, across the same extent (i.e. KP6 to KP15) areas showing ‘high’
percentage reef cover (up to 80%) were also identified. The extent of the patches could not be
determined though there was no evidence that the aggregations observed form contiguous reef
across the ‘area of numerous boulders’ and as such the area was not considered a S. spinulosa reef.
It is possible these discontinuous aggregations extend to encompass the nearshore area traversed
by the Goldeneye pipelines. It is expected that any aggregations present will be discontinuous given
the presence of boulders across the wider area.
2.6.3. Sea Pens and Burrowing Megafauna Communities As discussed in Section 2.3.4.1, the sediments in the vicinity of the Goldeneye platform were
determined to represent the EUNIS biotope complex ‘circalittoral fine sand’ and are considered
to comprise elements of the OSPAR habitat ‘sea pens and burrowing megafauna communities’
based on the JNCC guidelines for classification (JNCC, 2014b).
The burrowing activity of megafauna creates a complex habitat, providing deep oxygen penetration
of the seabed sediment, giving rise to increased biodiversity. The habitat occurs extensively in sea
lochs, voes and fjords and also in the deeper waters of the central North Sea and elsewhere. Point
sample locations identified as representing the OSPAR burrowing megafauna communities habitat
in the CNS are shown in Figure 2-11.
Although found extensively, the habitat type is listed by OSPAR as declining and threatened due
to widespread seabed disturbance from fishing activities (OSPAR, 2010). Environmental surveys
frequently identify evidence of burrows in areas of the CNS associated with deep mud sediments
(e.g. corresponding to shelf-sublittoral mud shown in Figure 2-3) and it is likely that all such
sediments have the potential to support sea-pen and burrowing megafauna communities, even
where the surveys do not actually observe examples of such megafauna. Absence or low numbers
of megafauna may merely be an indication of the degraded state of the habitat (JNCC, 2014b).
The UK Habitat Action Plan (UKHAP) for mud habitats in deep water (JNCC, 1999) establishes
the UK approach to protection of deep water muds, including those that support sea-pens and
burrowing megafauna communities. A network of MPAs has been established with burrowed mud
a designated interest feature in order to implement measures to protect this habitat. One of these
is the Southern Trench pMPA discussed in Section 2.4.1. Additional actions and advice proposed
in the UKHAP focus on reducing impacts from fishing as the primary threat.
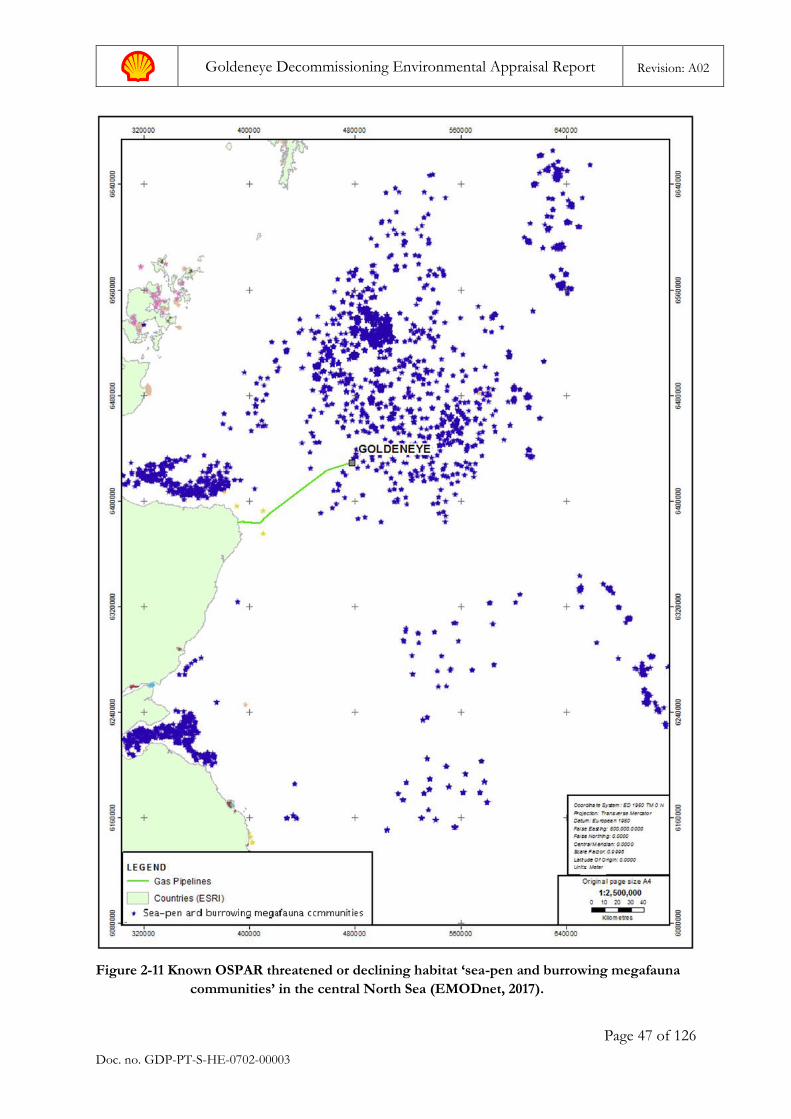
Goldeneye Decommissioning Environmental Appraisal Report Revision: A02
Page 47 of 126
Doc. no. GDP-PT-S-HE-0702-00003
Figure 2-11 Known OSPAR threatened or declining habitat ‘sea-pen and burrowing megafauna
communities’ in the central North Sea (EMODnet, 2017).
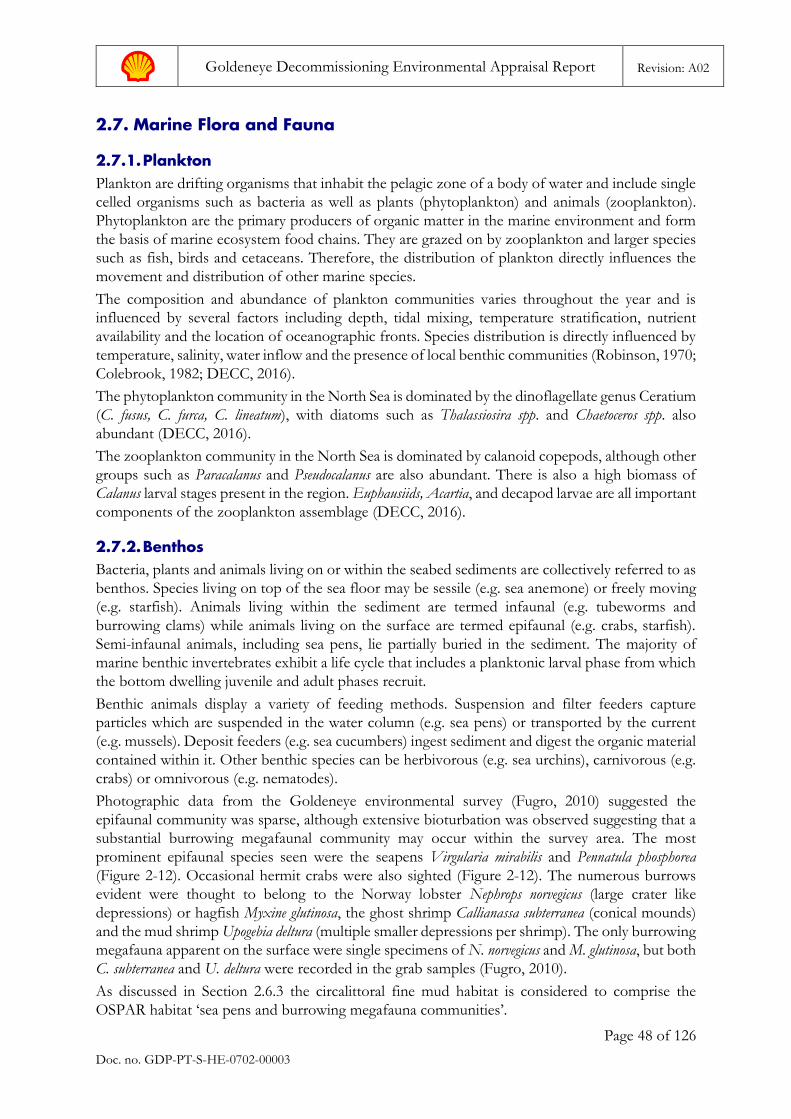
Goldeneye Decommissioning Environmental Appraisal Report Revision: A02
Page 48 of 126
Doc. no. GDP-PT-S-HE-0702-00003
2.7. Marine Flora and Fauna
2.7.1. Plankton Plankton are drifting organisms that inhabit the pelagic zone of a body of water and include single
celled organisms such as bacteria as well as plants (phytoplankton) and animals (zooplankton).
Phytoplankton are the primary producers of organic matter in the marine environment and form
the basis of marine ecosystem food chains. They are grazed on by zooplankton and larger species
such as fish, birds and cetaceans. Therefore, the distribution of plankton directly influences the
movement and distribution of other marine species.
The composition and abundance of plankton communities varies throughout the year and is
influenced by several factors including depth, tidal mixing, temperature stratification, nutrient
availability and the location of oceanographic fronts. Species distribution is directly influenced by
temperature, salinity, water inflow and the presence of local benthic communities (Robinson, 1970;
Colebrook, 1982; DECC, 2016).
The phytoplankton community in the North Sea is dominated by the dinoflagellate genus Ceratium
(C. fusus, C. furca, C. lineatum), with diatoms such as Thalassiosira spp. and Chaetoceros spp. also
abundant (DECC, 2016).
The zooplankton community in the North Sea is dominated by calanoid copepods, although other
groups such as Paracalanus and Pseudocalanus are also abundant. There is also a high biomass of
Calanus larval stages present in the region. Euphausiids, Acartia, and decapod larvae are all important
components of the zooplankton assemblage (DECC, 2016).
2.7.2. Benthos Bacteria, plants and animals living on or within the seabed sediments are collectively referred to as
benthos. Species living on top of the sea floor may be sessile (e.g. sea anemone) or freely moving
(e.g. starfish). Animals living within the sediment are termed infaunal (e.g. tubeworms and
burrowing clams) while animals living on the surface are termed epifaunal (e.g. crabs, starfish).
Semi-infaunal animals, including sea pens, lie partially buried in the sediment. The majority of
marine benthic invertebrates exhibit a life cycle that includes a planktonic larval phase from which
the bottom dwelling juvenile and adult phases recruit.
Benthic animals display a variety of feeding methods. Suspension and filter feeders capture
particles which are suspended in the water column (e.g. sea pens) or transported by the current
(e.g. mussels). Deposit feeders (e.g. sea cucumbers) ingest sediment and digest the organic material
contained within it. Other benthic species can be herbivorous (e.g. sea urchins), carnivorous (e.g.
crabs) or omnivorous (e.g. nematodes).
Photographic data from the Goldeneye environmental survey (Fugro, 2010) suggested the
epifaunal community was sparse, although extensive bioturbation was observed suggesting that a
substantial burrowing megafaunal community may occur within the survey area. The most
prominent epifaunal species seen were the seapens Virgularia mirabilis and Pennatula phosphorea
(Figure 2-12). Occasional hermit crabs were also sighted (Figure 2-12). The numerous burrows
evident were thought to belong to the Norway lobster Nephrops norvegicus (large crater like
depressions) or hagfish Myxine glutinosa, the ghost shrimp Callianassa subterranea (conical mounds)
and the mud shrimp Upogebia deltura (multiple smaller depressions per shrimp). The only burrowing
megafauna apparent on the surface were single specimens of N. norvegicus and M. glutinosa, but both
C. subterranea and U. deltura were recorded in the grab samples (Fugro, 2010).
As discussed in Section 2.6.3 the circalittoral fine mud habitat is considered to comprise the
OSPAR habitat ‘sea pens and burrowing megafauna communities’.
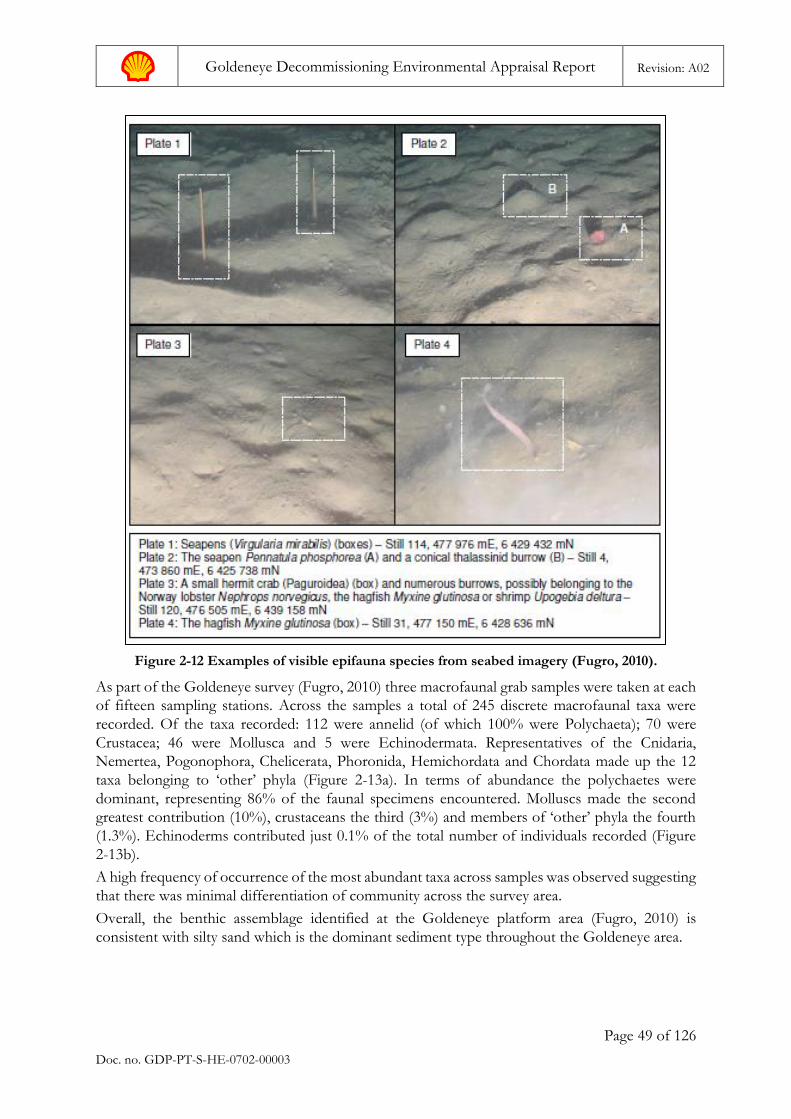
Goldeneye Decommissioning Environmental Appraisal Report Revision: A02
Page 49 of 126
Doc. no. GDP-PT-S-HE-0702-00003
Figure 2-12 Examples of visible epifauna species from seabed imagery (Fugro, 2010).
As part of the Goldeneye survey (Fugro, 2010) three macrofaunal grab samples were taken at each
of fifteen sampling stations. Across the samples a total of 245 discrete macrofaunal taxa were
recorded. Of the taxa recorded: 112 were annelid (of which 100% were Polychaeta); 70 were
Crustacea; 46 were Mollusca and 5 were Echinodermata. Representatives of the Cnidaria,
Nemertea, Pogonophora, Chelicerata, Phoronida, Hemichordata and Chordata made up the 12
taxa belonging to ‘other’ phyla (Figure 2-13a). In terms of abundance the polychaetes were
dominant, representing 86% of the faunal specimens encountered. Molluscs made the second
greatest contribution (10%), crustaceans the third (3%) and members of ‘other’ phyla the fourth
(1.3%). Echinoderms contributed just 0.1% of the total number of individuals recorded (Figure
2-13b).
A high frequency of occurrence of the most abundant taxa across samples was observed suggesting
that there was minimal differentiation of community across the survey area.
Overall, the benthic assemblage identified at the Goldeneye platform area (Fugro, 2010) is
consistent with silty sand which is the dominant sediment type throughout the Goldeneye area.
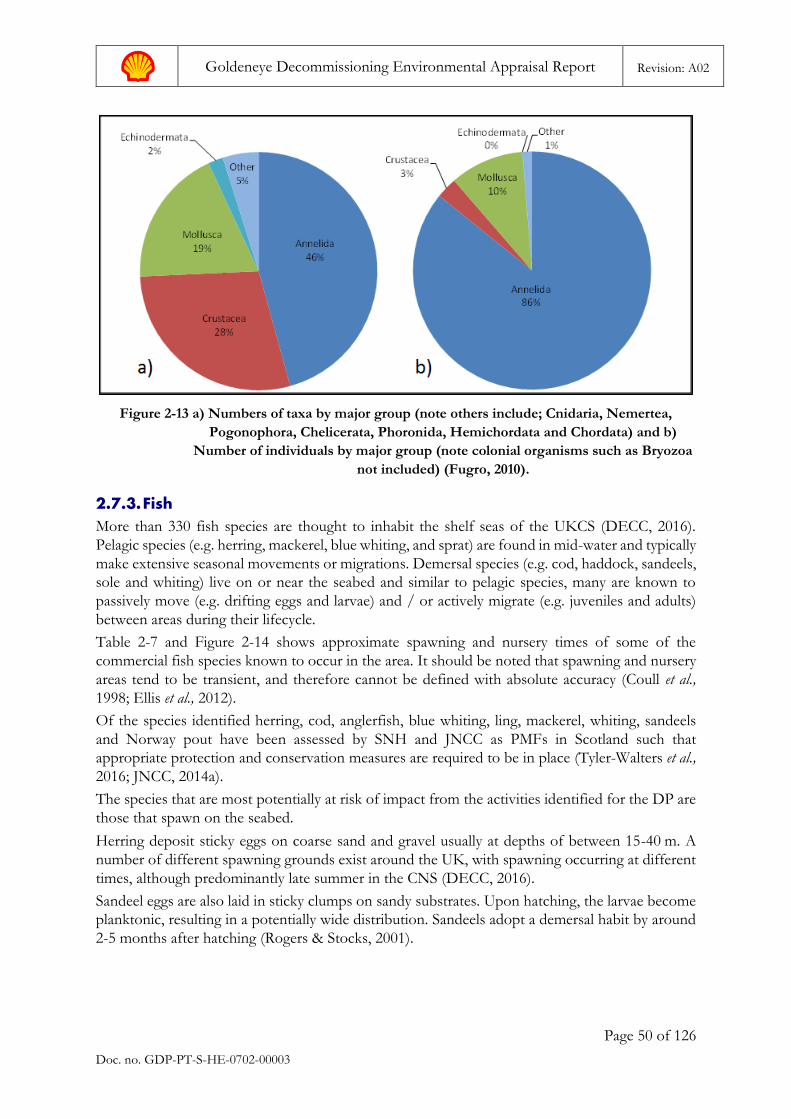
Goldeneye Decommissioning Environmental Appraisal Report Revision: A02
Page 50 of 126
Doc. no. GDP-PT-S-HE-0702-00003
Figure 2-13 a) Numbers of taxa by major group (note others include; Cnidaria, Nemertea,
Pogonophora, Chelicerata, Phoronida, Hemichordata and Chordata) and b)
Number of individuals by major group (note colonial organisms such as Bryozoa
not included) (Fugro, 2010).
2.7.3. Fish More than 330 fish species are thought to inhabit the shelf seas of the UKCS (DECC, 2016).
Pelagic species (e.g. herring, mackerel, blue whiting, and sprat) are found in mid-water and typically
make extensive seasonal movements or migrations. Demersal species (e.g. cod, haddock, sandeels,
sole and whiting) live on or near the seabed and similar to pelagic species, many are known to
passively move (e.g. drifting eggs and larvae) and / or actively migrate (e.g. juveniles and adults)
between areas during their lifecycle.
Table 2-7 and Figure 2-14 shows approximate spawning and nursery times of some of the
commercial fish species known to occur in the area. It should be noted that spawning and nursery
areas tend to be transient, and therefore cannot be defined with absolute accuracy (Coull et al.,
1998; Ellis et al., 2012).
Of the species identified herring, cod, anglerfish, blue whiting, ling, mackerel, whiting, sandeels
and Norway pout have been assessed by SNH and JNCC as PMFs in Scotland such that
appropriate protection and conservation measures are required to be in place (Tyler-Walters et al.,
2016; JNCC, 2014a).
The species that are most potentially at risk of impact from the activities identified for the DP are
those that spawn on the seabed.
Herring deposit sticky eggs on coarse sand and gravel usually at depths of between 15-40 m. A
number of different spawning grounds exist around the UK, with spawning occurring at different
times, although predominantly late summer in the CNS (DECC, 2016).
Sandeel eggs are also laid in sticky clumps on sandy substrates. Upon hatching, the larvae become
planktonic, resulting in a potentially wide distribution. Sandeels adopt a demersal habit by around
2-5 months after hatching (Rogers & Stocks, 2001).
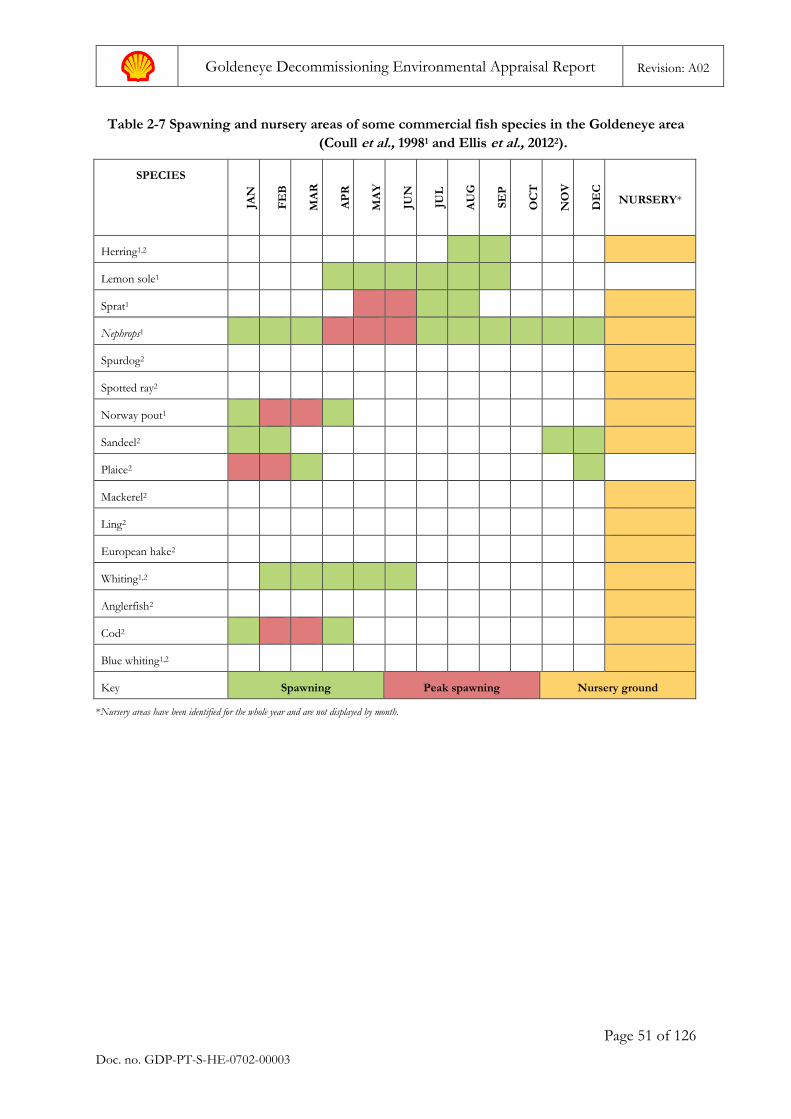
Goldeneye Decommissioning Environmental Appraisal Report Revision: A02
Page 51 of 126
Doc. no. GDP-PT-S-HE-0702-00003
Table 2-7 Spawning and nursery areas of some commercial fish species in the Goldeneye area
(Coull et al., 19981 and Ellis et al., 20122).
SPECIES
JAN
FE
B
MA
R
AP
R
MA
Y
JUN
JUL
AU
G
SE
P
OC
T
NO
V
DE
C
NURSERY*
Herring1,2
Lemon sole1
Sprat1
Nephrops1
Spurdog2
Spotted ray2
Norway pout1
Sandeel2
Plaice2
Mackerel2
Ling2
European hake2
Whiting1,2
Anglerfish2
Cod2
Blue whiting1,2
Key Spawning Peak spawning Nursery ground
*Nursery areas have been identified for the whole year and are not displayed by month.
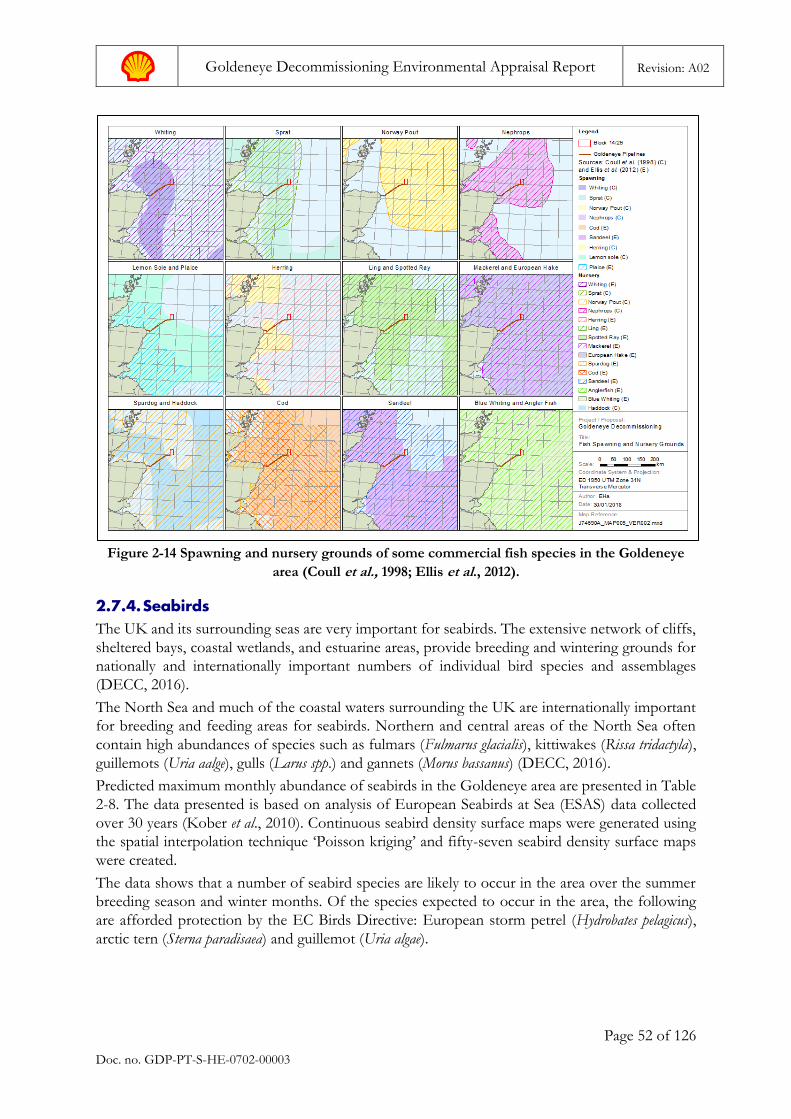
Goldeneye Decommissioning Environmental Appraisal Report Revision: A02
Page 52 of 126
Doc. no. GDP-PT-S-HE-0702-00003
Figure 2-14 Spawning and nursery grounds of some commercial fish species in the Goldeneye
area (Coull et al., 1998; Ellis et al., 2012).
2.7.4. Seabirds The UK and its surrounding seas are very important for seabirds. The extensive network of cliffs,
sheltered bays, coastal wetlands, and estuarine areas, provide breeding and wintering grounds for
nationally and internationally important numbers of individual bird species and assemblages
(DECC, 2016).
The North Sea and much of the coastal waters surrounding the UK are internationally important
for breeding and feeding areas for seabirds. Northern and central areas of the North Sea often
contain high abundances of species such as fulmars (Fulmarus glacialis), kittiwakes (Rissa tridactyla),
guillemots (Uria aalge), gulls (Larus spp.) and gannets (Morus bassanus) (DECC, 2016).
Predicted maximum monthly abundance of seabirds in the Goldeneye area are presented in Table
2-8. The data presented is based on analysis of European Seabirds at Sea (ESAS) data collected
over 30 years (Kober et al., 2010). Continuous seabird density surface maps were generated using
the spatial interpolation technique ‘Poisson kriging’ and fifty-seven seabird density surface maps
were created.
The data shows that a number of seabird species are likely to occur in the area over the summer
breeding season and winter months. Of the species expected to occur in the area, the following
are afforded protection by the EC Birds Directive: European storm petrel (Hydrobates pelagicus),
arctic tern (Sterna paradisaea) and guillemot (Uria algae).
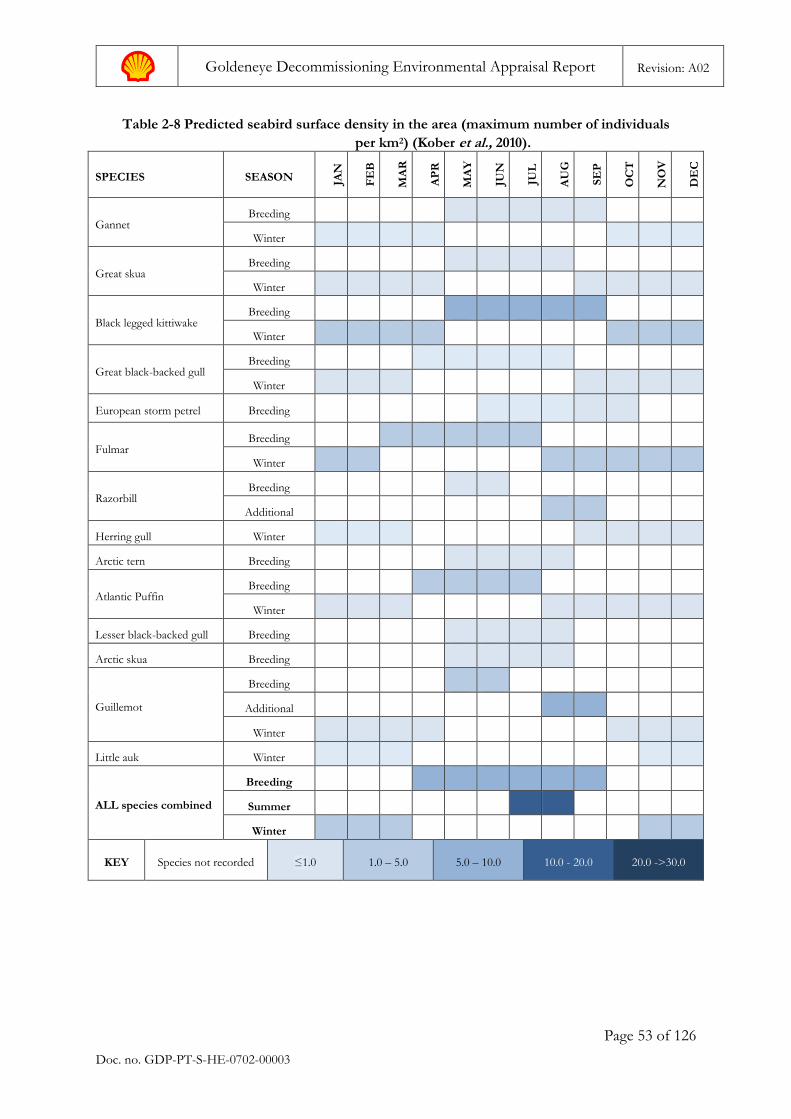
Goldeneye Decommissioning Environmental Appraisal Report Revision: A02
Page 53 of 126
Doc. no. GDP-PT-S-HE-0702-00003
Table 2-8 Predicted seabird surface density in the area (maximum number of individuals
per km2) (Kober et al., 2010).
SPECIES SEASON JAN
FE
B
MA
R
AP
R
MA
Y
JUN
JUL
AU
G
SE
P
OC
T
NO
V
DE
C
Gannet Breeding
Winter
Great skua Breeding
Winter
Black legged kittiwake Breeding
Winter
Great black-backed gull Breeding
Winter
European storm petrel Breeding
Fulmar Breeding
Winter
Razorbill Breeding
Additional
Herring gull Winter
Arctic tern Breeding
Atlantic Puffin Breeding
Winter
Lesser black-backed gull Breeding
Arctic skua Breeding
Guillemot
Breeding
Additional
Winter
Little auk Winter
ALL species combined
Breeding
Summer
Winter
KEY Species not recorded ≤1.0 1.0 – 5.0 5.0 – 10.0 10.0 - 20.0 20.0 ->30.0
Goldeneye Decommissioning Environmental Appraisal Report Revision: A02
Page 54 of 126
Doc. no. GDP-PT-S-HE-0702-00003
The sensitivity of seabirds to oil pollution in Block 14/29 and surrounding areas has been assessed
according to the JNCC Seabird Oil Sensitivity Index (SOSI). Oil and Gas UK commissioned
HiDef (a digital aerial video and image specialist consultancy) to develop the SOSI tool and the
results are available on the JNCC website (JNCC, 2018d). The purpose of this index is to identify
areas where seabirds are likely to be most sensitive to oil pollution by considering factors that make
a species more or less sensitive to oil‐related impacts.
The SOSI combines the seabird survey data with individual seabird species sensitivity index values.
These values are based on a number of factors which are considered to contribute towards the
sensitivity of seabirds to oil pollution, and include:
• Habitat flexibility (the ability of a species to locate to alternative feeding grounds),
• Adult survival rate,
• Potential annual productivity, and
• The proportion of the biogeographical population in the UK (classified following the methods developed by Certain et al., (2015).
The combined seabird data and species sensitivity index values were then subsequently summed
at each location to create a single measure of seabird sensitivity to oil pollution. The mean
sensitivity SOSI data for the area is shown in Table 2-9. For blocks with ‘no data’, an indirect
assessment has been made (where possible) using JNCC guidance (JNCC, 2018d). The sensitivity
of birds to surface oil pollution ranges between low and medium levels throughout the year within
Block 14/29 (Figure 2-15). Adjacent Blocks 14/30 and 20/5 feature extremely high levels of
seabird sensitivity in January. Seabird sensitivity along the pipeline (Figure 2-16) ranges between
low to extremely high, with higher vulnerability being observed closer to the coast.
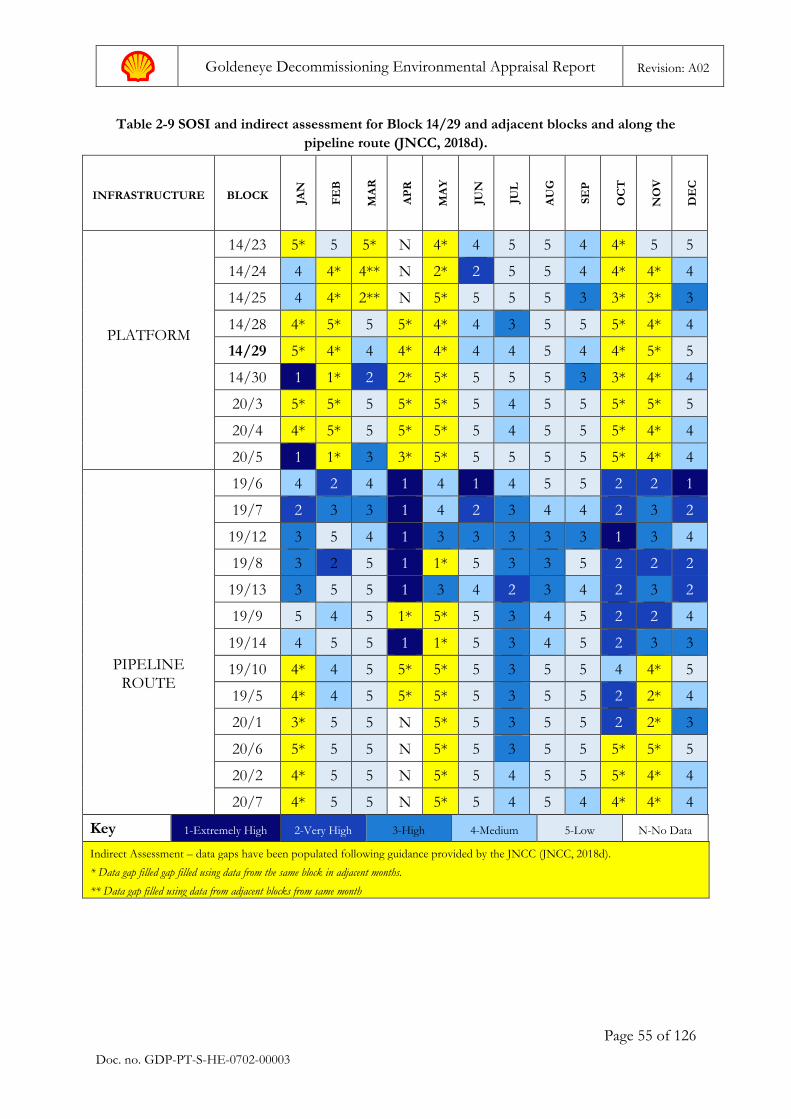
Goldeneye Decommissioning Environmental Appraisal Report Revision: A02
Page 55 of 126
Doc. no. GDP-PT-S-HE-0702-00003
Table 2-9 SOSI and indirect assessment for Block 14/29 and adjacent blocks and along the
pipeline route (JNCC, 2018d).
INFRASTRUCTURE BLOCK JAN
FE
B
MA
R
AP
R
MA
Y
JUN
JUL
AU
G
SE
P
OC
T
NO
V
DE
C
PLATFORM
14/23 5* 5 5* N 4* 4 5 5 4 4* 5 5
14/24 4 4* 4** N 2* 2 5 5 4 4* 4* 4
14/25 4 4* 2** N 5* 5 5 5 3 3* 3* 3
14/28 4* 5* 5 5* 4* 4 3 5 5 5* 4* 4
14/29 5* 4* 4 4* 4* 4 4 5 4 4* 5* 5
14/30 1 1* 2 2* 5* 5 5 5 3 3* 4* 4
20/3 5* 5* 5 5* 5* 5 4 5 5 5* 5* 5
20/4 4* 5* 5 5* 5* 5 4 5 5 5* 4* 4
20/5 1 1* 3 3* 5* 5 5 5 5 5* 4* 4
PIPELINE
ROUTE
19/6 4 2 4 1 4 1 4 5 5 2 2 1
19/7 2 3 3 1 4 2 3 4 4 2 3 2
19/12 3 5 4 1 3 3 3 3 3 1 3 4
19/8 3 2 5 1 1* 5 3 3 5 2 2 2
19/13 3 5 5 1 3 4 2 3 4 2 3 2
19/9 5 4 5 1* 5* 5 3 4 5 2 2 4
19/14 4 5 5 1 1* 5 3 4 5 2 3 3
19/10 4* 4 5 5* 5* 5 3 5 5 4 4* 5
19/5 4* 4 5 5* 5* 5 3 5 5 2 2* 4
20/1 3* 5 5 N 5* 5 3 5 5 2 2* 3
20/6 5* 5 5 N 5* 5 3 5 5 5* 5* 5
20/2 4* 5 5 N 5* 5 4 5 5 5* 4* 4
20/7 4* 5 5 N 5* 5 4 5 4 4* 4* 4
Key 1-Extremely High 2-Very High 3-High 4-Medium 5-Low N-No Data
Indirect Assessment – data gaps have been populated following guidance provided by the JNCC (JNCC, 2018d).
* Data gap filled gap filled using data from the same block in adjacent months.
** Data gap filled using data from adjacent blocks from same month
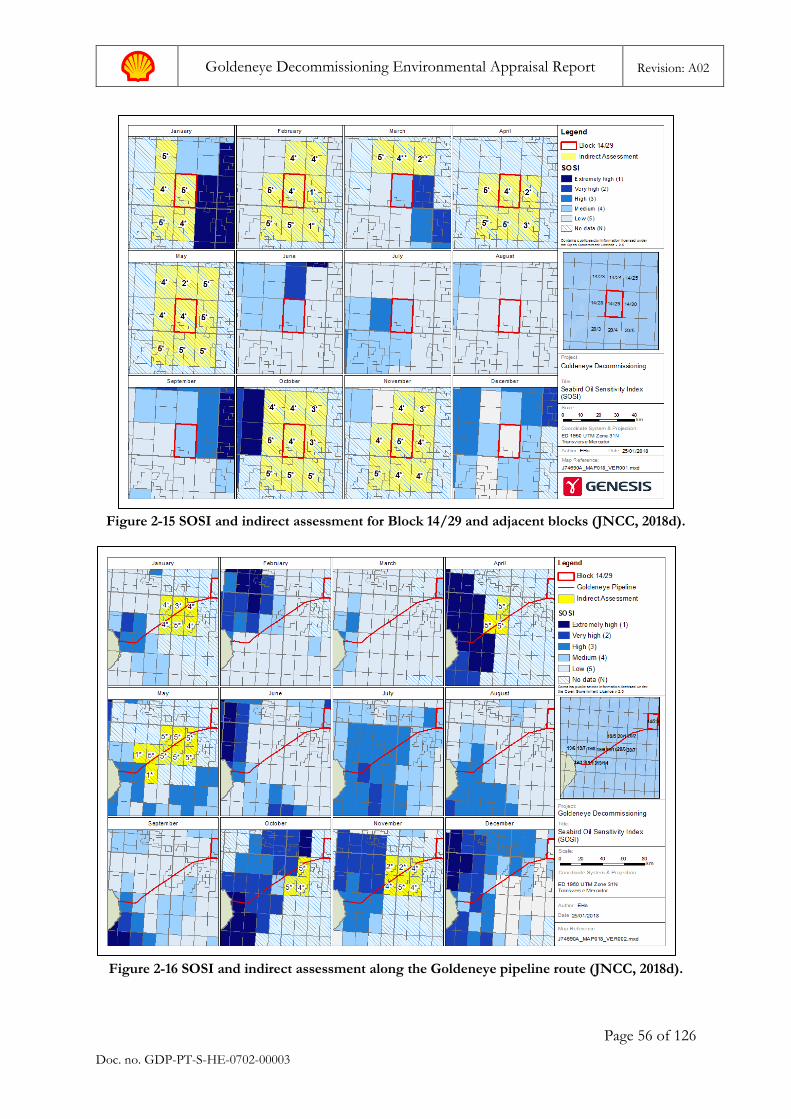
Goldeneye Decommissioning Environmental Appraisal Report Revision: A02
Page 56 of 126
Doc. no. GDP-PT-S-HE-0702-00003
Figure 2-15 SOSI and indirect assessment for Block 14/29 and adjacent blocks (JNCC, 2018d).
Figure 2-16 SOSI and indirect assessment along the Goldeneye pipeline route (JNCC, 2018d).
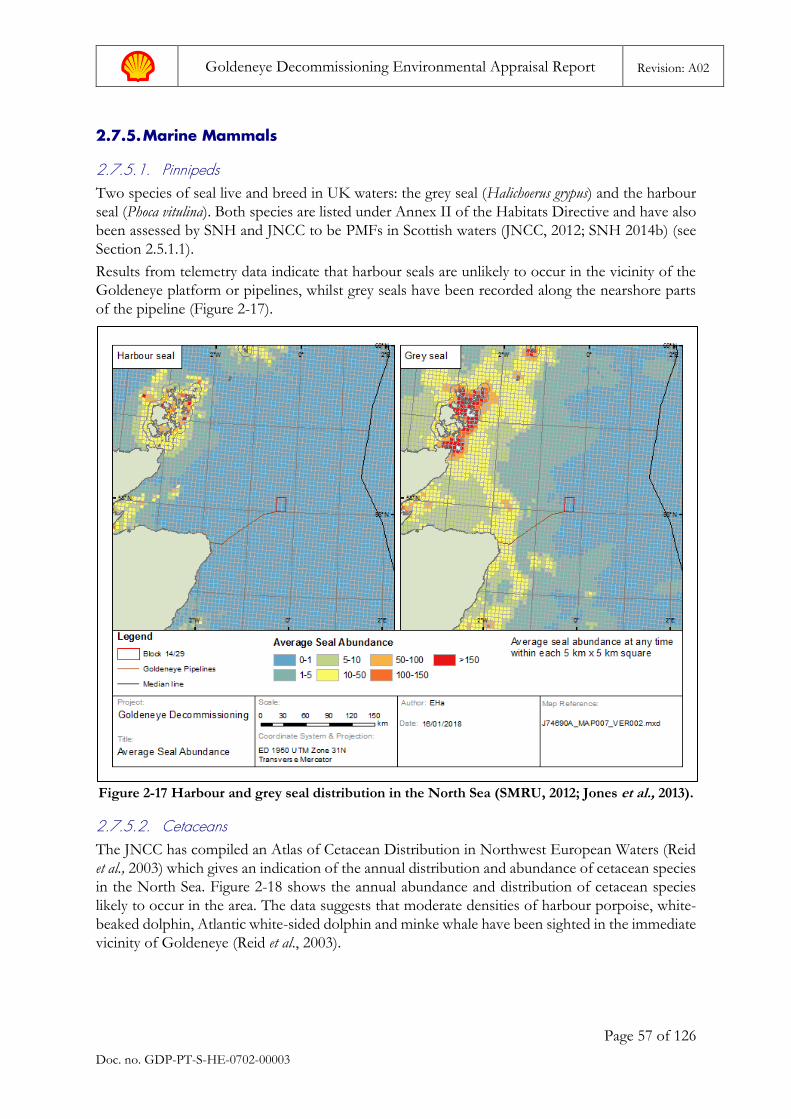
Goldeneye Decommissioning Environmental Appraisal Report Revision: A02
Page 57 of 126
Doc. no. GDP-PT-S-HE-0702-00003
2.7.5. Marine Mammals
2.7.5.1. Pinnipeds Two species of seal live and breed in UK waters: the grey seal (Halichoerus grypus) and the harbour
seal (Phoca vitulina). Both species are listed under Annex II of the Habitats Directive and have also
been assessed by SNH and JNCC to be PMFs in Scottish waters (JNCC, 2012; SNH 2014b) (see
Section 2.5.1.1).
Results from telemetry data indicate that harbour seals are unlikely to occur in the vicinity of the
Goldeneye platform or pipelines, whilst grey seals have been recorded along the nearshore parts
of the pipeline (Figure 2-17).
Figure 2-17 Harbour and grey seal distribution in the North Sea (SMRU, 2012; Jones et al., 2013).
2.7.5.2. Cetaceans The JNCC has compiled an Atlas of Cetacean Distribution in Northwest European Waters (Reid
et al., 2003) which gives an indication of the annual distribution and abundance of cetacean species
in the North Sea. Figure 2-18 shows the annual abundance and distribution of cetacean species
likely to occur in the area. The data suggests that moderate densities of harbour porpoise, white-
beaked dolphin, Atlantic white-sided dolphin and minke whale have been sighted in the immediate
vicinity of Goldeneye (Reid et al., 2003).
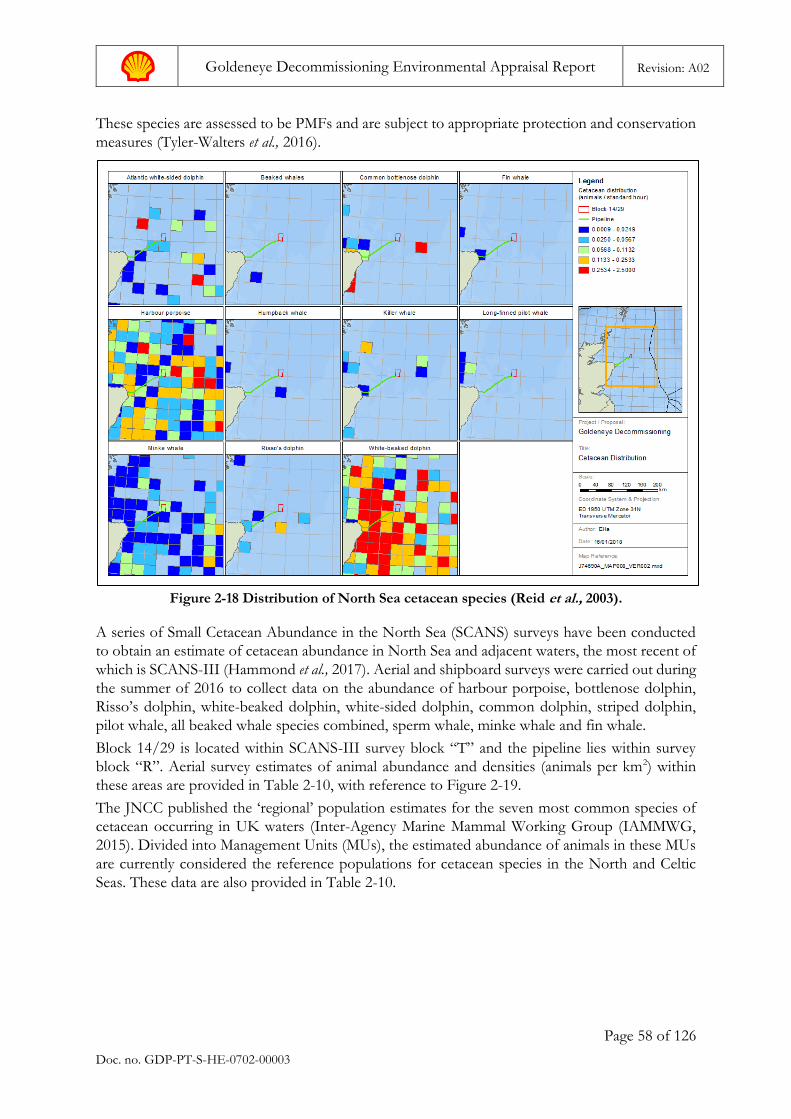
Goldeneye Decommissioning Environmental Appraisal Report Revision: A02
Page 58 of 126
Doc. no. GDP-PT-S-HE-0702-00003
These species are assessed to be PMFs and are subject to appropriate protection and conservation
measures (Tyler-Walters et al., 2016).
Figure 2-18 Distribution of North Sea cetacean species (Reid et al., 2003).
A series of Small Cetacean Abundance in the North Sea (SCANS) surveys have been conducted
to obtain an estimate of cetacean abundance in North Sea and adjacent waters, the most recent of
which is SCANS-III (Hammond et al., 2017). Aerial and shipboard surveys were carried out during
the summer of 2016 to collect data on the abundance of harbour porpoise, bottlenose dolphin,
Risso’s dolphin, white-beaked dolphin, white-sided dolphin, common dolphin, striped dolphin,
pilot whale, all beaked whale species combined, sperm whale, minke whale and fin whale.
Block 14/29 is located within SCANS-III survey block “T” and the pipeline lies within survey
block “R”. Aerial survey estimates of animal abundance and densities (animals per km2) within
these areas are provided in Table 2-10, with reference to Figure 2-19.
The JNCC published the ‘regional’ population estimates for the seven most common species of
cetacean occurring in UK waters (Inter-Agency Marine Mammal Working Group (IAMMWG,
2015). Divided into Management Units (MUs), the estimated abundance of animals in these MUs
are currently considered the reference populations for cetacean species in the North and Celtic
Seas. These data are also provided in Table 2-10.
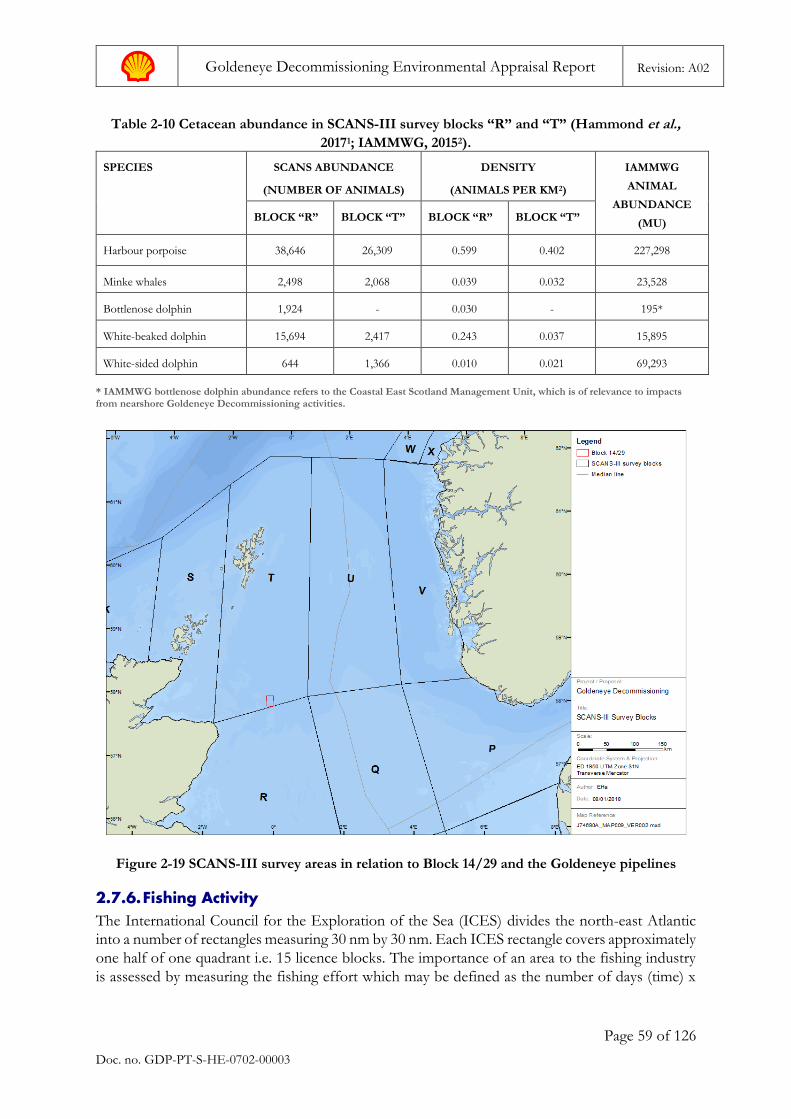
Goldeneye Decommissioning Environmental Appraisal Report Revision: A02
Page 59 of 126
Doc. no. GDP-PT-S-HE-0702-00003
Table 2-10 Cetacean abundance in SCANS-III survey blocks “R” and “T” (Hammond et al.,
20171; IAMMWG, 20152).
SPECIES SCANS ABUNDANCE
(NUMBER OF ANIMALS)
DENSITY
(ANIMALS PER KM2)
IAMMWG
ANIMAL
ABUNDANCE
(MU) BLOCK “R” BLOCK “T” BLOCK “R” BLOCK “T”
Harbour porpoise 38,646 26,309 0.599 0.402 227,298
Minke whales 2,498 2,068 0.039 0.032 23,528
Bottlenose dolphin 1,924 - 0.030 - 195*
White-beaked dolphin 15,694 2,417 0.243 0.037 15,895
White-sided dolphin 644 1,366 0.010 0.021 69,293
* IAMMWG bottlenose dolphin abundance refers to the Coastal East Scotland Management Unit, which is of relevance to impacts from nearshore Goldeneye Decommissioning activities.
Figure 2-19 SCANS-III survey areas in relation to Block 14/29 and the Goldeneye pipelines
2.7.6. Fishing Activity The International Council for the Exploration of the Sea (ICES) divides the north-east Atlantic
into a number of rectangles measuring 30 nm by 30 nm. Each ICES rectangle covers approximately
one half of one quadrant i.e. 15 licence blocks. The importance of an area to the fishing industry
is assessed by measuring the fishing effort which may be defined as the number of days (time) x
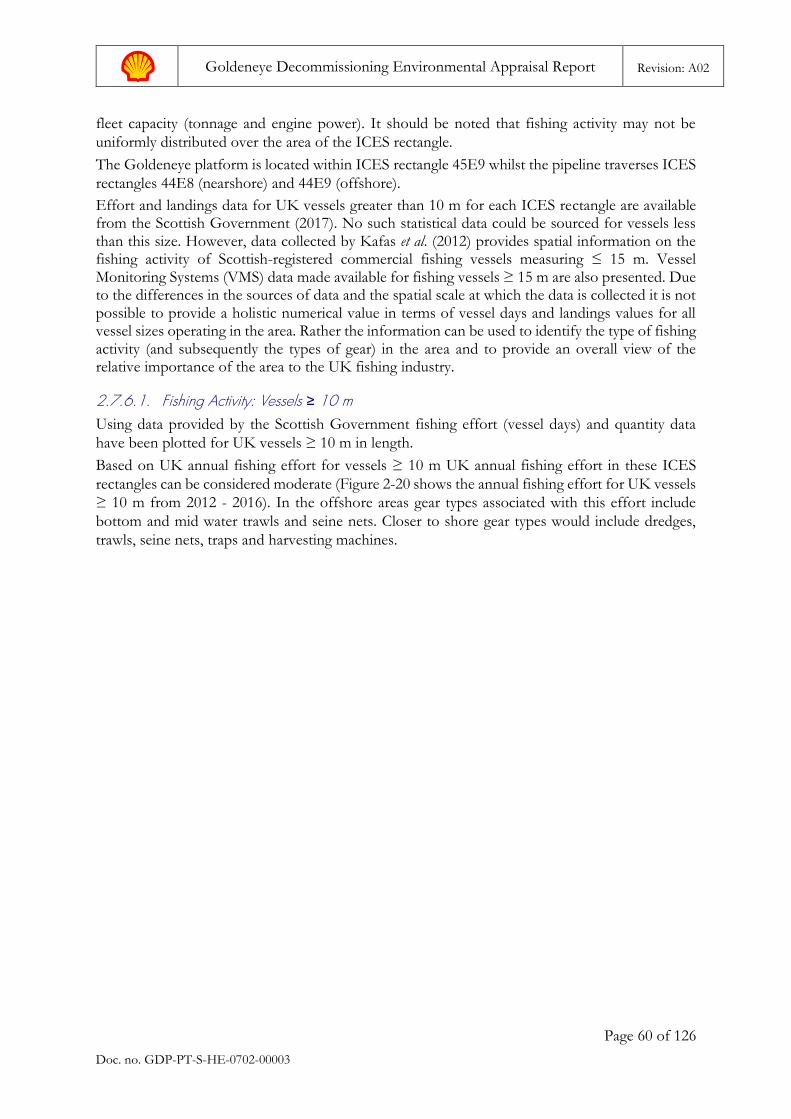
Goldeneye Decommissioning Environmental Appraisal Report Revision: A02
Page 60 of 126
Doc. no. GDP-PT-S-HE-0702-00003
fleet capacity (tonnage and engine power). It should be noted that fishing activity may not be
uniformly distributed over the area of the ICES rectangle.
The Goldeneye platform is located within ICES rectangle 45E9 whilst the pipeline traverses ICES
rectangles 44E8 (nearshore) and 44E9 (offshore).
Effort and landings data for UK vessels greater than 10 m for each ICES rectangle are available from the Scottish Government (2017). No such statistical data could be sourced for vessels less than this size. However, data collected by Kafas et al. (2012) provides spatial information on the fishing activity of Scottish-registered commercial fishing vessels measuring ≤ 15 m. Vessel Monitoring Systems (VMS) data made available for fishing vessels ≥ 15 m are also presented. Due to the differences in the sources of data and the spatial scale at which the data is collected it is not possible to provide a holistic numerical value in terms of vessel days and landings values for all vessel sizes operating in the area. Rather the information can be used to identify the type of fishing activity (and subsequently the types of gear) in the area and to provide an overall view of the relative importance of the area to the UK fishing industry.
2.7.6.1. Fishing Activity: Vessels ≥ 10 m Using data provided by the Scottish Government fishing effort (vessel days) and quantity data
have been plotted for UK vessels ≥ 10 m in length.
Based on UK annual fishing effort for vessels ≥ 10 m UK annual fishing effort in these ICES
rectangles can be considered moderate (Figure 2-20 shows the annual fishing effort for UK vessels
≥ 10 m from 2012 - 2016). In the offshore areas gear types associated with this effort include
bottom and mid water trawls and seine nets. Closer to shore gear types would include dredges,
trawls, seine nets, traps and harvesting machines.
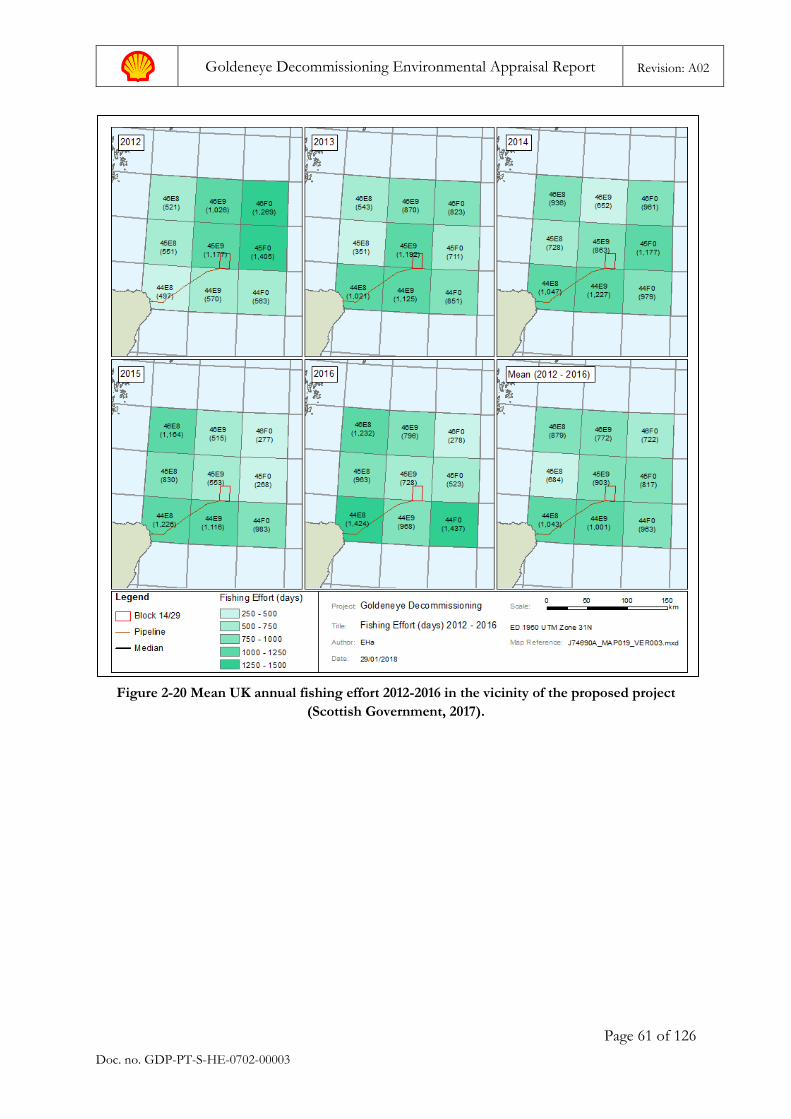
Goldeneye Decommissioning Environmental Appraisal Report Revision: A02
Page 61 of 126
Doc. no. GDP-PT-S-HE-0702-00003
Figure 2-20 Mean UK annual fishing effort 2012-2016 in the vicinity of the proposed project
(Scottish Government, 2017).
Goldeneye Decommissioning Environmental Appraisal Report Revision: A02
Page 62 of 126
Doc. no. GDP-PT-S-HE-0702-00003
Figure 2-21 shows the annual landings between 2012 – 2016 of demersal, pelagic and shellfish
species is ICES rectangle 45E9 and those ICES rectangles through which the Goldeneye pipelines
are routed.
Figure 2-21 UK reported landings by quantity (te) within the region of the proposed project (2012
– 2016) (Scottish Government, 2017).
Amalgamated Vessel Monitoring Systems (VMS) data (2009 – 2013) for vessels ≥ 15 m within the
Scottish zone of the UK Fishing limits (200 nm) has been combined with landings data to develop
Geographical Information Systems (GIS) layers describing the spatial patterns of landings by the
Scottish fleet. The data shows the position, time at a position, and course and speed of fishing
vessels (Kafas et al., 2012).
Figure 2-22 shows the fishing intensity by fishing vessels ≥15 m in length using different types of
fishing gear (therefore targeting different species) in the North Sea using VMS data. It can be seen
that the most intense fishing effort is concentrated in different areas dependent on the fishing gear
used. All three types of fishing gear were used within 45E9, with Nephrops fishing being the most
intense within Block 14/29.
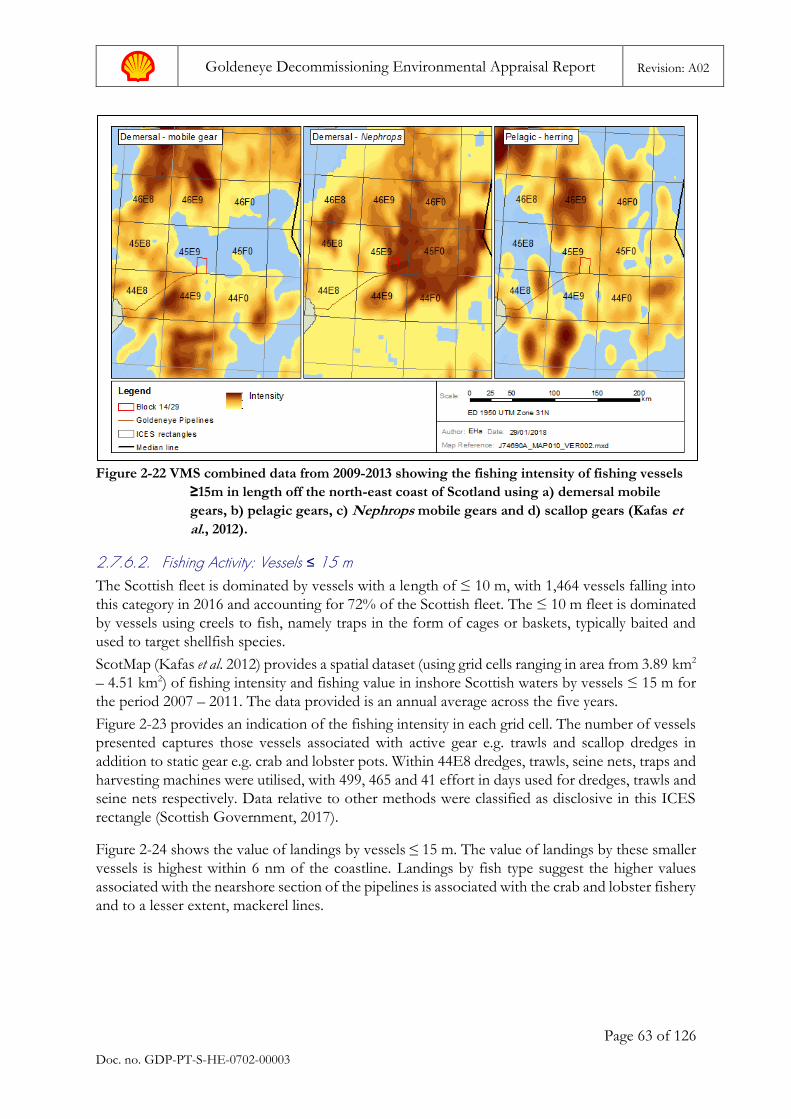
Goldeneye Decommissioning Environmental Appraisal Report Revision: A02
Page 63 of 126
Doc. no. GDP-PT-S-HE-0702-00003
Figure 2-22 VMS combined data from 2009-2013 showing the fishing intensity of fishing vessels
≥15m in length off the north-east coast of Scotland using a) demersal mobile
gears, b) pelagic gears, c) Nephrops mobile gears and d) scallop gears (Kafas et
al., 2012).
2.7.6.2. Fishing Activity: Vessels ≤ 15 m The Scottish fleet is dominated by vessels with a length of ≤ 10 m, with 1,464 vessels falling into
this category in 2016 and accounting for 72% of the Scottish fleet. The ≤ 10 m fleet is dominated
by vessels using creels to fish, namely traps in the form of cages or baskets, typically baited and
used to target shellfish species.
ScotMap (Kafas et al. 2012) provides a spatial dataset (using grid cells ranging in area from 3.89 km2
– 4.51 km2) of fishing intensity and fishing value in inshore Scottish waters by vessels ≤ 15 m for
the period 2007 – 2011. The data provided is an annual average across the five years.
Figure 2-23 provides an indication of the fishing intensity in each grid cell. The number of vessels
presented captures those vessels associated with active gear e.g. trawls and scallop dredges in
addition to static gear e.g. crab and lobster pots. Within 44E8 dredges, trawls, seine nets, traps and
harvesting machines were utilised, with 499, 465 and 41 effort in days used for dredges, trawls and
seine nets respectively. Data relative to other methods were classified as disclosive in this ICES
rectangle (Scottish Government, 2017).
Figure 2-24 shows the value of landings by vessels ≤ 15 m. The value of landings by these smaller
vessels is highest within 6 nm of the coastline. Landings by fish type suggest the higher values
associated with the nearshore section of the pipelines is associated with the crab and lobster fishery
and to a lesser extent, mackerel lines.
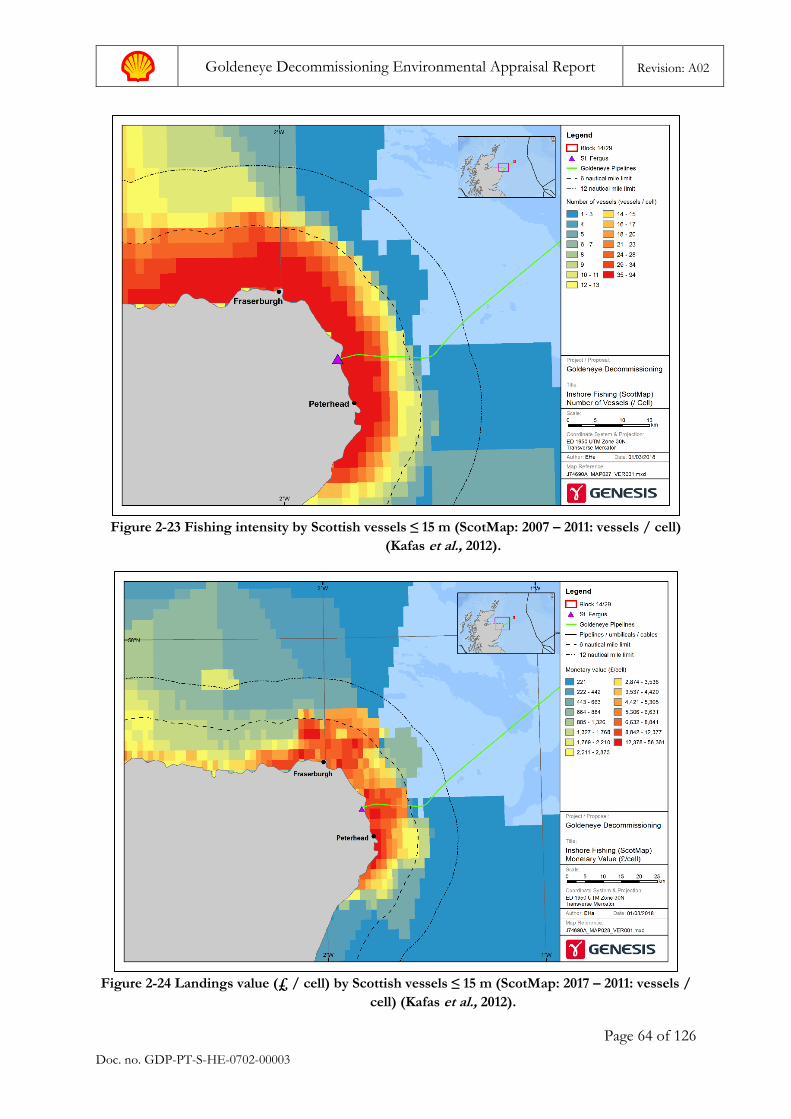
Goldeneye Decommissioning Environmental Appraisal Report Revision: A02
Page 64 of 126
Doc. no. GDP-PT-S-HE-0702-00003
Figure 2-23 Fishing intensity by Scottish vessels ≤ 15 m (ScotMap: 2007 – 2011: vessels / cell)
(Kafas et al., 2012).
Figure 2-24 Landings value (£ / cell) by Scottish vessels ≤ 15 m (ScotMap: 2017 – 2011: vessels /
cell) (Kafas et al., 2012).
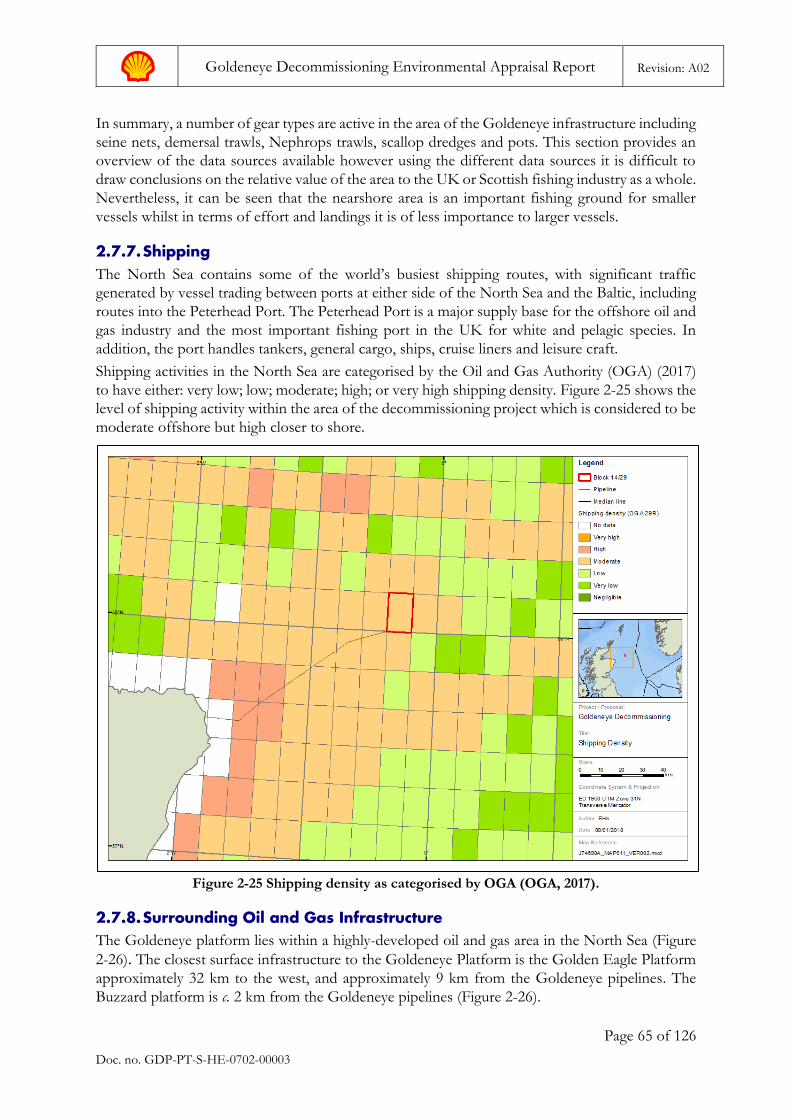
Goldeneye Decommissioning Environmental Appraisal Report Revision: A02
Page 65 of 126
Doc. no. GDP-PT-S-HE-0702-00003
In summary, a number of gear types are active in the area of the Goldeneye infrastructure including
seine nets, demersal trawls, Nephrops trawls, scallop dredges and pots. This section provides an
overview of the data sources available however using the different data sources it is difficult to
draw conclusions on the relative value of the area to the UK or Scottish fishing industry as a whole.
Nevertheless, it can be seen that the nearshore area is an important fishing ground for smaller
vessels whilst in terms of effort and landings it is of less importance to larger vessels.
2.7.7. Shipping The North Sea contains some of the world’s busiest shipping routes, with significant traffic
generated by vessel trading between ports at either side of the North Sea and the Baltic, including
routes into the Peterhead Port. The Peterhead Port is a major supply base for the offshore oil and
gas industry and the most important fishing port in the UK for white and pelagic species. In
addition, the port handles tankers, general cargo, ships, cruise liners and leisure craft.
Shipping activities in the North Sea are categorised by the Oil and Gas Authority (OGA) (2017)
to have either: very low; low; moderate; high; or very high shipping density. Figure 2-25 shows the
level of shipping activity within the area of the decommissioning project which is considered to be
moderate offshore but high closer to shore.
Figure 2-25 Shipping density as categorised by OGA (OGA, 2017).
2.7.8. Surrounding Oil and Gas Infrastructure The Goldeneye platform lies within a highly-developed oil and gas area in the North Sea (Figure
2-26). The closest surface infrastructure to the Goldeneye Platform is the Golden Eagle Platform
approximately 32 km to the west, and approximately 9 km from the Goldeneye pipelines. The
Buzzard platform is c. 2 km from the Goldeneye pipelines (Figure 2-26).
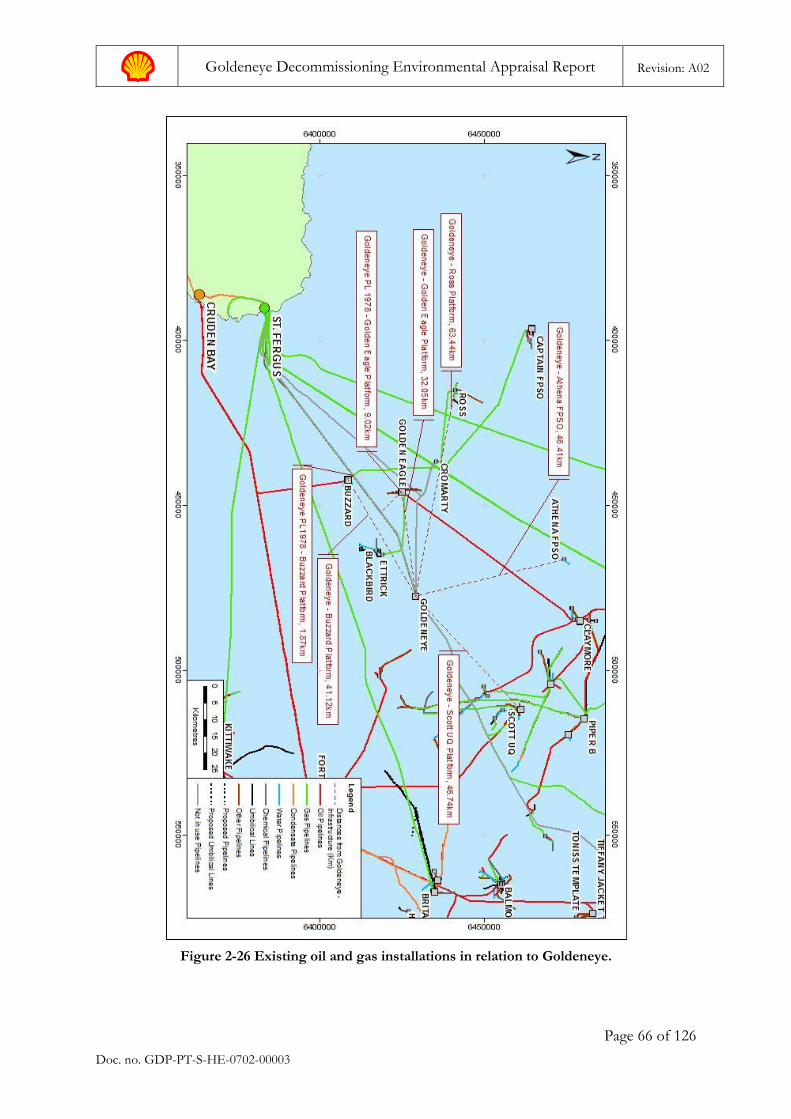
Goldeneye Decommissioning Environmental Appraisal Report Revision: A02
Page 66 of 126
Doc. no. GDP-PT-S-HE-0702-00003
Figure 2-26 Existing oil and gas installations in relation to Goldeneye.
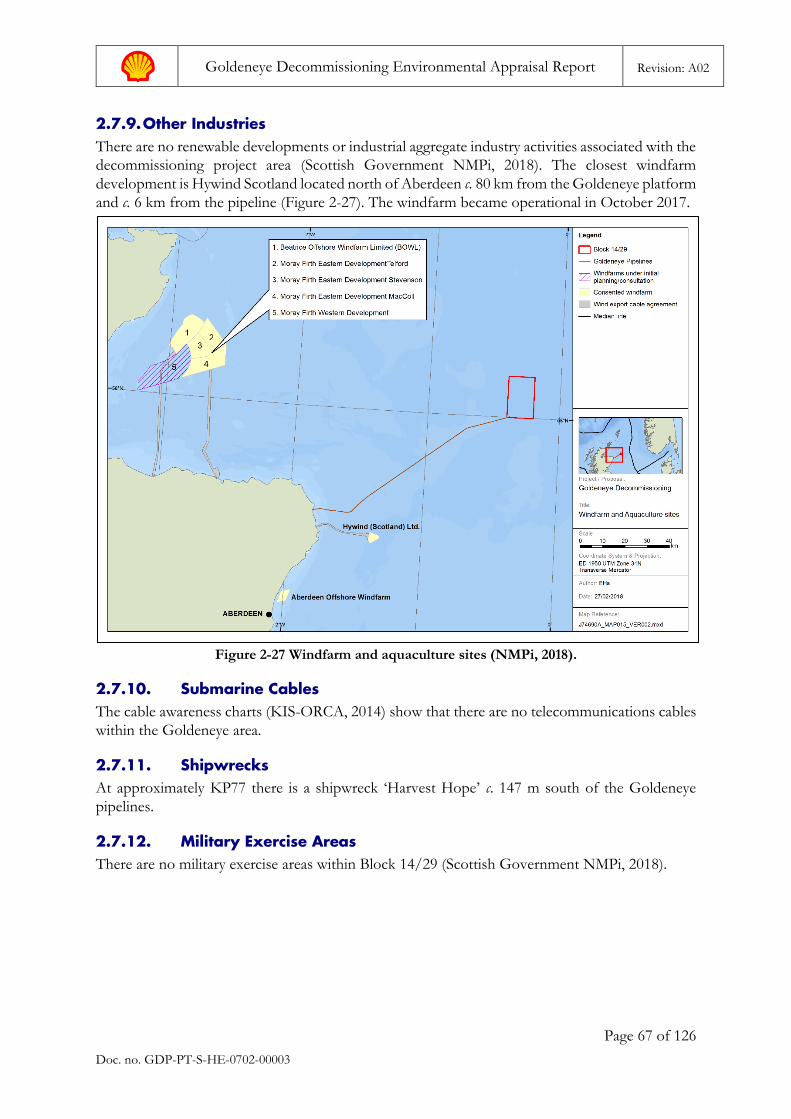
Goldeneye Decommissioning Environmental Appraisal Report Revision: A02
Page 67 of 126
Doc. no. GDP-PT-S-HE-0702-00003
2.7.9. Other Industries There are no renewable developments or industrial aggregate industry activities associated with the
decommissioning project area (Scottish Government NMPi, 2018). The closest windfarm
development is Hywind Scotland located north of Aberdeen c. 80 km from the Goldeneye platform
and c. 6 km from the pipeline (Figure 2-27). The windfarm became operational in October 2017.
Figure 2-27 Windfarm and aquaculture sites (NMPi, 2018).
2.7.10. Submarine Cables The cable awareness charts (KIS-ORCA, 2014) show that there are no telecommunications cables
within the Goldeneye area.
2.7.11. Shipwrecks At approximately KP77 there is a shipwreck ‘Harvest Hope’ c. 147 m south of the Goldeneye
pipelines.
2.7.12. Military Exercise Areas There are no military exercise areas within Block 14/29 (Scottish Government NMPi, 2018).

Goldeneye Decommissioning Environmental Appraisal Report Revision: A02
Page 68 of 126
Doc. no. GDP-PT-S-HE-0702-00003
This page intentionally left blank
Goldeneye Decommissioning Environmental Appraisal Report Revision: A02
Page 69 of 126
Doc. no. GDP-PT-S-HE-0702-00003
3. Identification of Impacts
3.1. ENVID Potential environmental impacts of the DP were identified through an ENVID workshop.
Attendees to the workshop covered all relevant engineering disciplines and included
environmental specialists, the decommissioning manager, operating installation manager and risk
management consultant. The workshop was chaired by an environmental specialist with
experience of multiple field development and decommissioning environmental assessments in the
North Sea.
3.1.1. ENVID Approach Shell ENVID protocol utilises a standard series of guidewords that has been adapted specifically
to the consideration of activities encountered for decommissioning projects. The guidewords are
used to prompt a thorough discussion about the specific aspects for the present decommissioning
project from which the potential for all environmental impacts are identified and noted.
The severity of each impact is scored through a qualitative risk-based approach utilising matrices
which consider the sensitivity of the receptor, the scale of the activity and magnitude of impact.
For unplanned or accidental aspects, the likelihood of the event occurring is also incorporated into
the overall impact evaluation. The impact ratings were determined on the basis that standard
mitigation measures required to meet regulatory permitting requirements, Shell Group practices,
Industry best practice and regulatory guidance were implemented. These mitigation measures are
included through Section 4 of this report and have been recorded as commitments in the project
Environment, Social and Health Management Plan.
The methodology used is presented in Appendix A and the outcome of the workshop is presented
in Appendix B.
3.1.2. ENVID Conclusions
3.1.2.1. Planned Activities The ENVID concluded that the planned decommissioning activities would give rise to no impacts
of Major significance.
The ENVID identified the potential for Moderate impact to the seabed within the Southern
Trench pMPA due to the following activities:
• Trenching and burial of the export pipeline between the transition point at KP20 and the edge of the pMPA at the limit of nearshore waters, 12 nautical miles from shore, which corresponds approximately to KP25 of the pipeline;
• Overtrawl trials conducted along the pipeline route within the pMPA; and
• If there is a requirement for placement of rock cover within the pMPA over sections of the pipelines where burial is deemed insufficiently deep to prevent risks of snagging.
The Moderate impact rating afforded to these activities reflected the High sensitivity rating of the
seabed due to it being within a designated area of conservation.
The ENVID also identified the potential for Moderate impact of underwater noise from vessels
using dynamic positioning systems on the minke whale biodiversity feature of the Southern Trench
pMPA
Goldeneye Decommissioning Environmental Appraisal Report Revision: A02
Page 70 of 126
Doc. no. GDP-PT-S-HE-0702-00003
All other planned activities were determined to have minor, slight or no impact on the environment
or other users of the sea.
3.1.2.2. Unplanned Events The DP includes no activities that have High risk to the environment.
Certain scenarios for the accidental loss of fuel from vessels were identified as posing a Moderate
environmental risk.
The greatest potential for environmental impact from an unplanned event relates to the loss of the
full fuel inventory of a vessel while operating close to shore. This was assumed to give rise to a
Major impact although the likelihood of such an event was considered to be remote, based on past
statistics.
All other accidental events considered in the ENVID had risk ratings of Minor or Negligible.
Following feedback from Stakeholders, further consideration has been given to the risk of either
the topsides or jacket being dropped during transit or while being lifted at, or en-route to, the
decommissioning yard. This is addressed in Section 4.7.2.
3.2. Impact Assessment Scoping The output of the ENVID has been used as a scoping tool to identify any aspects for which further
environmental impact assessment would be informative and proportionate.
All Minor impacts and risks, or lower, were scoped out from requiring further environmental
impact assessment on the grounds that the magnitude of impact does not warrant more
quantitative or semi-quantitative study, and that the control measures identified are well established
and accepted as means of minimising impacts.
The potential for Moderate impacts within the Southern Trench pMPA is given further
consideration in Section 4.2 and Section 4.5, while the risk of impact from fuel spills is discussed
in Section 4.7.1. These noted sections draw on existing information to demonstrate that these
aspects also do not require further environmental impact assessment.
Consequently, due to the particular characteristics of the Goldeneye decommissioning, no aspects
or impacts have been scoped for more detailed assessment. This is shown in the right hand column
of the ENVID output tables provided in Appendix B.
The scoping conclusions were presented to statutory consultees and feedback received as
described in Section 1.7.
Goldeneye Decommissioning Environmental Appraisal Report Revision: A02
Page 71 of 126
Doc. no. GDP-PT-S-HE-0702-00003
4. Environmental Assessment The evaluation of impacts during the ENVID workshop relied on the expert knowledge of the
attendees, based on their understanding of the issues and of relevant published sources of
information.
For many aspects considered in the ENVID, the type of activity, mechanism of impact, scale and
duration of impact are such that the conclusion reached is clear and can be made with a high degree
of confidence. For some other aspects, it is recognised that the ENVID output could be overly
concise and may not adequately capture the full justification for the conclusions reached. Further
detail is provided in this section in support of the ENVID conclusions for these aspects.
The information is organised under standard headings of receptors or sources of impact, rather
than the activity nodes used for the ENVID process. The headings used are:
• Natural Capital and Ecosystem Services (NCES)
• Emissions to Air
• Discharges to Sea
• Seabed disturbance
• Underwater Sound
• Waste Management
• Accidental Events
• Socio-economic Effects
• Designated Sites, Protected & Endangered Species
4.1. Natural Capital and Ecosystem Services The ENVID identified a number of activities that have the potential to affect the productivity of
the area either in terms of fishing activity or in terms of ecological abundance. These were due to:
• The physical presence of vessels and obstacles;
• Changes to the seabed substrate type following disturbance of the seabed; and
• Return of the area around the platform for fishing.
Natural capital will also be expended through use of hydrocarbon resource for fuel and quarried
material for rock cover.
4.1.1. Physical presence of vessels Most of the vessel activity will be within the 500 m safety zone for the Goldeneye platform and,
as such, their presence will be unlikely to cause an impact on other users of the sea. However,
certain activities will be outwith the 500 m safety zone including trenching of the export pipeline
and subsequent pipeline depth surveys. These activities have the potential to cause a short term
interruption of fishing activities along the pipeline route but are expected to have negligible impact
on fishing productivity as a whole due to their short duration and very limited extent.
4.1.2. Disturbance of the seabed The disturbance of the seabed is assessed under Section 4.2.
4.1.3. Goldeneye safety zone Following decommissioning, the 500 m safety zone around the Goldeneye platform will no longer
exist and the area will be once more available for fishing. This will offset any lost fishing
productivity due to rock cover laid during decommissioning.
Goldeneye Decommissioning Environmental Appraisal Report Revision: A02
Page 72 of 126
Doc. no. GDP-PT-S-HE-0702-00003
Prior to surrender of the safety zone, the area will be subject to overtrawl trials to demonstrate a
safe seabed. This will cause some temporary disturbance of the seabed.
4.1.4. Materials use The two natural resources to be consumed in the decommissioning activities cover fuel and rock.
While both of these resources are finite, and incur a financial cost, they are extensively abundant
and their use in the decommissioning works will not impact their availability.
4.1.5. Controls for the Management of Impacts to NCES The following mitigation measures, safeguards and controls are proposed to minimise the potential
for the Goldeneye decommissioning to erode natural capital and interrupt ecosystem services.
MITIGATION MEASURES, SAFEGUARDS AND CONTROLS
▪ Adoption of a clear seabed policy in line with OSPAR Decision 98/3*;
▪ Optimisation of vessel use to minimise disturbance to other users of the sea;
▪ Minimise disturbance to the seabed (see Section 4.2.7).
*Except at pipeline crossings and the transition point, where burial is not feasible.
The appraisal of impacts on NCES due to the decommissioning activities supports the conclusion
that impacts will be minimal, and constrained to a level that is as low as reasonably and safely
practical by adoption of the control measures specified.
4.2. Seabed Disturbance The following activities will cause disturbance of the seabed:
• Trenching and burial of the export pipeline;
• Removal of subsea infrastructure;
• Positioning of vessels/jack-up;
• Laying additional rock cover; and
• Overtrawl trials.
Some of these activities would cause temporary impacts, while others (such as rock cover) would
result in lasting localised effects. These are discussed below in the following subsections.
The seabed at Goldeneye and along the export pipeline is described in Section 2.3.4 as being
generally typical of the wider CNS area, and with sensitive marine features (pockmarks and A.
islandica) present.
Along the pipeline, the seabed is of relatively low environmental sensitivity, but with the possibility
that there may be isolated, sporadic examples of more sensitive features, and the sensitivity of the
seabed as a receptor to disturbance activities has consequently been assumed to be moderate.
The export pipeline is surface laid for approximately 5 km within the Southern Trench pMPA, the
offshore bound of which corresponds to KP25 on the Goldeneye pipeline. Three of the sample
stations used in the Peterhead CCS environmental survey (CMACS, 2014) lie along the Goldeneye
pipeline at approximately KP15, KP19 and KP23. These stations were classified as ‘polychaete-
rich deep [Venus] community in offshore mixed sediments (EUNIS type A5.451). S. spinulosa were
identified in these samples although, as was also found in the wider area, the majority were
juveniles, only a few millimetres in length and did not constitute Annex I habitat. The Burrowed
mud biodiversity feature of the pMPA is not present in this part of the site.
Goldeneye Decommissioning Environmental Appraisal Report Revision: A02
Page 73 of 126
Doc. no. GDP-PT-S-HE-0702-00003
4.2.1. Trenching and infill The trenching of the export pipeline will disturb the seabed over a narrow corridor along 82 km
of its length. The width of the corridor depends on the trenching method deployed. The
disturbance zone for the jetting technique likely to be preferred for Goldeneye is typically about
5 m wide along the full length of the pipeline to be buried, although some fine-grained silt and clay
suspended by the works will disperse further (Carter, 2010). A trencher with a back hoe may result
in a worst-case disturbance zone of up to 10 m width.
Jet trenching uses a remotely operated vehicle to apply high pressure water jets below the seabed
to collapse the sediment structure, causing the pipeline to sink into the collapsed trench under its
own weight, with the disturbed sediment falling in on top of the pipeline.
A back hoe trencher is fixed in position with spud legs which penetrate the seabed to keep it in
position. Once the dredger is set up in position the bucket excavates the trench. The backhoe
dredger would be spudded approximately every 10 m. Back hoe trenching of a pipeline disturbs
the seabed, both along the line of the pipe to create the necessary stable excavation and where the
spud legs contact the seabed. The energy to move the sediment is imparted by the dredger bucket
and through the bulk mass of the sediment. Although the sediment is sheared and fluidised in the
process, little additional water is introduced and upward velocities are very low. The method
displaces some sediment into the water column, much of which agglomerates quickly and becomes
redeposited in clumps, creating a berm alongside the trench. Finer material creates a plume of
suspended solids in the water column which is subsequently re-deposited over a wider area,
dependent on current and tidal dispersion.
Either method of trenching physically disturbs the benthic communities and their habitat within
the area impacted (<0.82 km2) and may cause some smothering of the wider region due to
redeposition of disturbed material. Trenching is expected to cause the injury or fatality of some
organisms present at the time (mainly epifaunal), while others are likely to be displaced.
The mixing of the surface and shallow sediments caused by the process may leave a modified
sediment structure, with potential to affect the subsequent colonisation and productivity of the
impacted area. The effect is a change to the baseline but does not necessarily result in a diminishing
of productivity nor of biodiversity. The species and habitats determined to be present in the area
of the trenching activity (KP 20 – KP 102) are widespread through the CNS, and the area to be
impacted represents a very small percentage of that available habitat.
As well as benthic species, the eggs and larvae of fish species (herring and sandeels) which spawn
at the seabed are vulnerable to seabed disturbance. The pipeline route traverses the spawning
grounds of both these species, although the platform is out with these areas. Sandeels spawn from
November to February, while Herring spawn in August and September in this part of the CNS.
Marine Scotland has registered a ‘period of concern’ for seismic activities for blocks traversed by
the western half of the pipeline during both these periods (OGA, 2016).
Although impacts on demersal spawning fish would be brought to an absolute minimum were
trenching of the pipeline to be undertaken outside of these months (i.e. between March – July or
in October), the spawning areas of both species (and of all those shown in Figure 2-14) are
extensive in the CNS and the area of the seabed that would be impacted by trenching is a very
small fraction of this. The difference in impact to these species from trenching during or outwith
the spawning season is not significant and does not warrant restriction of the market to provide
the lowest cost decommissioning option.
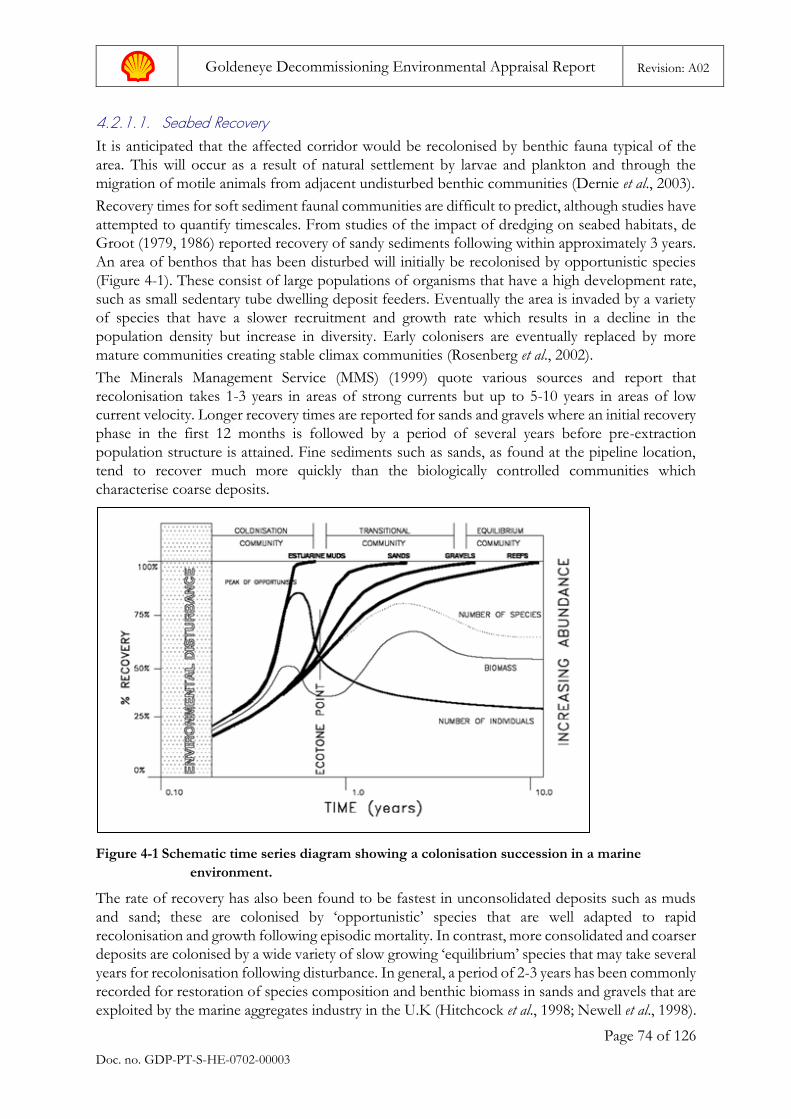
Goldeneye Decommissioning Environmental Appraisal Report Revision: A02
Page 74 of 126
Doc. no. GDP-PT-S-HE-0702-00003
4.2.1.1. Seabed Recovery It is anticipated that the affected corridor would be recolonised by benthic fauna typical of the
area. This will occur as a result of natural settlement by larvae and plankton and through the
migration of motile animals from adjacent undisturbed benthic communities (Dernie et al., 2003).
Recovery times for soft sediment faunal communities are difficult to predict, although studies have
attempted to quantify timescales. From studies of the impact of dredging on seabed habitats, de
Groot (1979, 1986) reported recovery of sandy sediments following within approximately 3 years.
An area of benthos that has been disturbed will initially be recolonised by opportunistic species
(Figure 4-1). These consist of large populations of organisms that have a high development rate,
such as small sedentary tube dwelling deposit feeders. Eventually the area is invaded by a variety
of species that have a slower recruitment and growth rate which results in a decline in the
population density but increase in diversity. Early colonisers are eventually replaced by more
mature communities creating stable climax communities (Rosenberg et al., 2002).
The Minerals Management Service (MMS) (1999) quote various sources and report that
recolonisation takes 1-3 years in areas of strong currents but up to 5-10 years in areas of low
current velocity. Longer recovery times are reported for sands and gravels where an initial recovery
phase in the first 12 months is followed by a period of several years before pre-extraction
population structure is attained. Fine sediments such as sands, as found at the pipeline location,
tend to recover much more quickly than the biologically controlled communities which
characterise coarse deposits.
Figure 4-1 Schematic time series diagram showing a colonisation succession in a marine
environment.
The rate of recovery has also been found to be fastest in unconsolidated deposits such as muds
and sand; these are colonised by ‘opportunistic’ species that are well adapted to rapid
recolonisation and growth following episodic mortality. In contrast, more consolidated and coarser
deposits are colonised by a wide variety of slow growing ‘equilibrium’ species that may take several
years for recolonisation following disturbance. In general, a period of 2-3 years has been commonly
recorded for restoration of species composition and benthic biomass in sands and gravels that are
exploited by the marine aggregates industry in the U.K (Hitchcock et al., 1998; Newell et al., 1998).
Goldeneye Decommissioning Environmental Appraisal Report Revision: A02
Page 75 of 126
Doc. no. GDP-PT-S-HE-0702-00003
At Goldeneye, and along most of the length of the pipeline, the substrate is of circalittoral mud or
circalittoral sand and there is evidence of moderate substrate mobility. For these conditions all
information appears to indicate an ecological recovery period of between 1 and 3 years could be
expected. Smaller patches of more gravelly substrate along the pipeline may take a little longer for
the recolonisation sequence to complete.
4.2.1.2. Impact within the Southern Trench pMPA Trenching within the pMPA was identified in the ENVID as one of the activities that could result
in a Moderate impact, on account of the higher sensitivity status given to the seabed in this
proposed designated site. The area impacted by the trenching (<0.05 km2) represents a small
fraction (0.002 %) of the overall area of the site (2,487 km2) and does not contain the seabed habitat
feature for which the MPA is proposed (see Section 2.4.1). As such, and recognising that the
impact will be short term, the Moderate rating is seen as an over-estimate of the actual impact.
4.2.1.3. Impact of Suspended Sediments from Trenching The other mechanism of impact from trenching is from suspension of trenched material into the
water column. Suspended sediment has the potential to cause clogging and abrasion of feeding
and respiratory apparatus, particularly of sessile epifaunal species (Nicholls et al., 2003). Larger,
more mobile animals, such as crabs and fish, are expected to be able to avoid any adverse
suspended solid concentrations and areas of deposition. In the case of filter feeders, such as Arctica
islandica, an increased suspended sediment concentration could impact the ability to feed. The
suspension of some sediment is inevitable during trenching but the impacts will be localised and
short term, with minimal lasting impact on fauna populations.
4.2.2. Removal of subsea infrastructure
4.2.2.1. Jacket and SSIV Some localised disturbance of sediments will occur as a result of the extraction of the cut piles of
the Goldeneye jacket and SSIV. These are expected to be cut internally and sediments will be
disturbed over a small area as the upper, cut section of the piles are pulled out during lifting of the
SSIV and jacket. The amount would be larger if internal cutting is not feasible and excavation of
the piles is necessary to provide access for external cutting.
While mobilised, the suspended sediments will cause impacts as described for trenching. The
sediments will disperse due to the action of currents before resettling over the nearby surrounding
seabed, with the potential to cause the burial of benthic fauna.
The scale of these activities and the area of impacted is significantly less than that impacted by
trenching, and the magnitude of the impact is accordingly lower.
4.2.2.2. Connection Spools and Stabilisation Features Surface laid connection spools of both pipelines (approximately 200 m in total) and approximately
50 exposed concrete mattresses and approximately 600 grout bags will be removed which will also
result in small scale, short duration disturbance of the sediments. The mechanism of impact from
this disturbance is similar to that for the removal of the jacket and SSIV piles, leading to
disturbance and possible mortality of fauna that have colonised these features during field
operation. Their removal will re-expose the natural substrate beneath them which will be quickly
recolonised by the surrounding benthic communities.
Impacts from removal of mattresses and grout bags is small scale, localised and of small effect.
Goldeneye Decommissioning Environmental Appraisal Report Revision: A02
Page 76 of 126
Doc. no. GDP-PT-S-HE-0702-00003
4.2.3. Rock Cover Along Pipelines Rock cover has previously been laid at pipeline crossing points, the transition point (at KP20) and
along some sections of the export pipeline to increase burial depth. These will remain in place and
may need to be added to to ensure long term protection against snagging.
Decommissioning the pipelines in situ will necessitate the placement of additional rock cover at
the upstream termination points and along some additional sections of the export pipeline,
depending on the outcome of post-decommissioning surveys and subsequent consultations.
The area of the offshore seabed crossed by the pipelines has been noted to have mobile sediments
and it is likely that relatively coarse rock material may be needed to provide effective long-term
cover. Coarse rock cover can increase the risk of trawl gear snagging, to avoid which it may be
necessary to profile the coarser rock with smaller material, increasing the overall area impacted.
Rock cover causes a significant change to the substrate which in turn alters the habitat and ecology,
creating preferential areas for benthic organisms that live on hard substrates. This can result in
artificially increased local diversity of habitat and fauna.
Areas of rock cover required for the DP will not be fully known until after analysis of the post-
decommissioning survey but is expected to be limited to localised points or stretches that,
combined, would represent an insignificant proportion of a widespread region of fairly uniform
seabed habitat. The scale of the activity will be optimised to leave a seabed that is safe for other
marine users, notably fisheries, while minimising the amount of rock used.
Where rock cover is required, the rock mass will be carefully placed over the designated areas of
the pipelines and seabed by ROV and/or a controlled fall pipe, equipped with cameras, profilers,
pipe tracker and other sensors as required. This will control the profile of the rock covering, thus
ensuring rock is only placed within the planned footprint with minimal spread over adjacent
sediment, minimising seabed disturbance.
4.2.3.1. Impact within the Southern Trench pMPA Placement of rock cover within the pMPA was identified in the ENVID as one of the activities
that could result in a Moderate impact, on account of the higher sensitivity status given to the
seabed in this proposed designated site. Some rock cover will be required at the transition point
(KP20) where the two pipelines separate and the trencher is initiated. Other than for this short
length, rock cover is not planned to be required within the pMPA, but may be required following
consultation with BEIS, MS, SNH and SFF if pipeline depth of burial surveys identify particular
sections that are regarded as posing a risk of snagging. The area of the pMPA that would be
affected cannot be estimated until after this process, but as the area is currently open to fishing it
is not expected that substantial areas will be identified as being a risk. If the surveys show otherwise
this will inform the strategy to be agreed with stakeholders.
4.2.4. Anchor Scars and Spud Cans If overtrawl trials find that depressions within the 500 m safety zone (such as anchor scars or spud
cans) present a risk to trawl gear, attempts will first be made to smooth out the profile of these
features with the dragged chain matts used for the overtrawl trials. If this approach does not
adequately reduce the risk of future snagging, rock cover will be applied to make the seabed safe.
Where feasible, any such rock cover will infill the depressions to a level approximately 0.5 m below
the surrounding seabed level. This will allow subsequent natural infill with fine sediments over
time, thereby recreating a more natural habitat than if rock were filled to seabed level.
Goldeneye Decommissioning Environmental Appraisal Report Revision: A02
Page 77 of 126
Doc. no. GDP-PT-S-HE-0702-00003
If external cutting of the jacket or SSIV piles proves to be required the seabed topography left
following excavation may require an element of remediation to leave a safe environment to other
marine users. This is likely to be achieved through strategic deposition of rock.
As noted in Section 4.2.3, rock cover has a lasting impact on the habitat and ecology of the seabed
where it is laid. The affected area is of very limited extent and the severity of the impact assessed
to be slight.
4.2.5. Overtrawl trials Following recovery of subsea infrastructure and debris, and following trenching and, where
necessary, placement of remedial rock cover, the seabed will be subjected to debris sweeps and
overtrawl trials to confirm that the seabed is clear and safe for fishing.
Debris clearance trials are conducted running along, and up to 50 m either side of, the pipeline.
Snagging trials are conducted utilising various angles of approach resulting in an overall swept path
of the trawl gear that extends up to 400 m either side of the pipeline along its length. Overtrawling
would be required along the entire pipeline length of 102 km, giving a maximum impacted area of
approximately 80 km2. The area of the Goldeneye platform safety zone will also be trawled, and
this will be performed in both an east/west direction and a north/south direction. Together with
the area required for turning the trawl rig covers a rectangular area of 1,800 m x 1,000 m in each
direction, requiring a total swept path that covers approximately 2.6 km2.
Disturbance of the seabed is also inherent in ongoing seabed fishing activities and temporary
disturbance to the seabed sediments will occur during these operations. Collie et al. (2000)
examined impacts on benthic communities from bottom towed fishing gear and concluded that,
in general, sandy sediment communities were able to recover rapidly, although this was dependent
upon the spatial scale of the impact. It was estimated that recovery from a small scale impact, such
as a fishing trawl, could occur within about 100 days.
Fishermen contracted to undertake the overtrawl trials will be advised that impacts to herring and sandeel spawning would be minimised by undertaking the trawls outside of the spawning seasons of January - February for sandeels and August - September for herring.
4.2.5.1. Impact within the Southern Trench pMPA Seabed disturbance due to overtrawl trials within the pMPA was identified in the ENVID as one
of the activities that could result in a Moderate impact, on account of the higher sensitivity status
given to the seabed in this proposed designated site. The trawls would cover up to 1% of the
overall area of the site, although the seabed biodiversity feature of the pMPA (burrowed mud
habitat) does not extend into this part of the site and consequently there would be no impact to
this feature.
4.2.6. Impacts to OSPAR habitat ‘Sea-pens and burrowing megafauna communities’
The goldeneye platform is located in habitat classed as having the potential to host sea-pens and
burrowing megafauna communities. It is also possible that this habitat could be encountered within
areas of clayey silty fine sand along the pipeline route (i.e. from KP 70 to the platform; see Section
2.3.4.2). Consequently, small areas of sea-pen and burrowing megafauna communities habitat will
be lost where placement of rock cover is required – e.g. for infill of spud cans, pipeline ends and
burial depth top-up. As described in Section 4.2.4, the method of application of rock cover for
spud cans may alleviate some habitat loss. Temporary impacts from the overtrawl trials could
potentially impact up to 28.2 km2.
Goldeneye Decommissioning Environmental Appraisal Report Revision: A02
Page 78 of 126
Doc. no. GDP-PT-S-HE-0702-00003
This area of impact is considered to be a relatively small when compared to the known widespread
distribution, and potential habitat availability, of the sea-pen and burrowing megafauna
communities in the CNS (as shown in Figure 2-11). The impact of the Goldeneye
decommissioning activities is therefore not considered to have a significant impact on the
distribution and viability of this OSPAR priority habitat.
4.2.7. Controls for the Management of Impacts to Seabed Disturbance The following mitigation measures, safeguards and controls are proposed to minimise the
disturbance of the seabed from the Goldeneye decommissioning.
MITIGATION MEASURES, SAFEGUARDS AND CONTROLS
▪ Preference for internal cutting of piles to minimise excavation;
▪ The extent of rock cover to be deployed will be minimised while ensuring the seabed is left safe for other users of the sea;
▪ Any requirement for rock cover along the pipeline, particularly within the Southern Trench pMPA, will be determined in liaison with BEIS, SNH, MS and SFF following review of pipeline depth survey and overtrawl trials.
The appraisal of the disturbance of the seabed due to the decommissioning activities supports the
conclusion that impacts will be minor, and that adoption of the control measures specified will
ensure disturbance will be as low as reasonably and safely practical.
4.3. Emissions to Air
4.3.1. Offshore emissions The decommissioning activities will give rise to emissions of a range of gaseous combustion
products including carbon dioxide (CO2), sulphur dioxide (SO2), and oxides of nitrogen (NOx) as
well as trace quantities of unburned hydrocarbons, including methane (CH4), and others
collectively classed as volatile organic carbons (VOC). Emissions of SO2, NOx, CH4 and VOC
reduce air quality locally, including through contributing to low level ozone concentrations.
Emissions of SO2 and NOx lead to formation of respective acids, contributing to acid rain on a
regional scale. Emissions of CO2 and CH4 both contribute to global greenhouse gas (GHG)
emissions, and ultimately to climate change.
Offshore emissions to air will be due to vessels’ propulsion, their onboard services demand, and
from driving of trenching, cutting and lifting equipment. There will be no requirement for flaring
as the pipelines are flushed, and the topsides process equipment is flushed, drained and vented.
The DP is estimated to require in the order of 300 vessel days, plus any time a guard vessel may
be required on station, and will make small incremental addition to this baseline density. The
majority of vessel activity will be at the Goldeneye platform. As noted in Section 2.7.7, vessel
density in the area around the Goldeneye platform was categorised as Moderate in 2016 by the
OGA, and as High for a substantial length of the pipeline route, including the nearshore sections.
Emissions of SO2, NOx and VOC will contribute to reduced air quality in the vicinity of the
vessels’ location. The activities will be of localised extent, of relatively short duration and will take
place a significant distance (c. 100 km) from the nearest coastline. In general, prevailing metocean
conditions would be expected to lead to the rapid dispersion and dilution of the emissions resulting
in localised and short term impacts on air quality, typical of general shipping.
Goldeneye Decommissioning Environmental Appraisal Report Revision: A02
Page 79 of 126
Doc. no. GDP-PT-S-HE-0702-00003
Contribution to global GHG emissions is independent of the location of emissions. Experience
to date has shown that even for very substantive field-wide decommissioning programmes (e.g.
Murchison, CNR International 2013), the principal atmospheric emissions by mass of CO2
associated with the DP is very small (<1%) relative to the total annual CO2 emissions from
operational and production related emissions on the UKCS. For smaller scale decommissioning
programmes, more similar to that for Goldeneye, GHG emissions are substantially smaller, with
estimates of 0.08 – 0.2 % contribution to annual UKCS domestic shipping commonly reported
for the duration of the programme (e.g. Ettrick & Blackbird, Nexen 2016; Janice, James & Afflick,
Maersk 2016; Atlantic & Cromarty, BG 2016; Annabel & Audrey, Centrica 2017). In all precedent
decommissioning projects referenced, the impact of emissions to air was assessed to be low.
4.3.2. Onshore emissions Onshore emissions are principally a result of the recycling of recovered steel from the Goldeneye
platform. The quantity of CO2 used in the recycling of steel is estimated to be 0.96 te CO2 per te
steel recycled (Institute of Petroleum, 2000). Recycling of the steel effectively reduces the demand
for virgin steel to be produced, which is estimated to require 1.9 te CO2 per te steel (Institute of
Petroleum, 2000). The recycling of the platform therefore represents a net saving of CO2
emissions.
The emission of other atmospheric contaminants from the recycling process will be at an as yet
undetermined on-shore recycling facility and will be controlled by the relevant regulatory regime
operating in that country (e.g. PPC in Scotland) and will be captured under the operating emissions
of the facility.
4.3.3. Controls for the Management of Impacts from Atmospheric Emissions
The following mitigation measures, safeguards and controls are proposed to minimise the
emissions to air associated with the Goldeneye decommissioning.
MITIGATION MEASURES, SAFEGUARDS AND CONTROLS
▪ All vessels employed for the decommissioning will meet the requirements of Shell’s Group Marine Assurance System (GMAS)1; and
▪ The scheduling of vessels’ operations and types of vessels used will be optimised to execute the decommissioning as efficiently as possible.
Note 1: Shell’s GMAS adopts and expands on the Oil Companies International Marine Forum (OCIMF) vessel inspection (OVIQ2) and review of the Maritime Contractor Offshore Vessel Managers Self-Assessment (OVMSA). The review includes (inter alia) consideration of reliability and maintenance standards, navigational safety, emergency preparedness and contingency planning and compliance with the International Convention for the Prevention of Pollution from Ships (MARPOL) and International Maritime
Organization (IMO) standards for sewage discharge, garbage management, ballast water management and emissions controls.
Shell is adopting a flexible approach to the timing of different phases of the works to allow
decommissioning contractors the opportunity to maximise efficient utilisation of vessels. Shell is
also investigating the potential to bundle elements of the decommissioning of Goldeneye with that
of other assets to achieve additional vessel efficiencies. These measures have the potential to
further minimise the emissions resulting from the decommissioning activities.
The appraisal of the atmospheric emissions from the decommissioning activities supports the
conclusion that emissions will have a minor impact, while adoption of the control measures
specified will ensure emissions are kept as low as reasonably practical.
Goldeneye Decommissioning Environmental Appraisal Report Revision: A02
Page 80 of 126
Doc. no. GDP-PT-S-HE-0702-00003
4.4. Discharges to Sea The DP activities will result in a small number of minor sources of planned discharges to sea.
These are:
• Vessels’ sanitary drainage;
• Vessels’ ballast water;
• Abrasive cutting compounds;
• Inhibited freshwater within spools and risers; and
• Inhibited freshwater following ultimate degradation of the pipelines.
In addition, there will be a subsea discharge of approximately 20 L of hydraulic fluid if the jacket
is recovered in more than one section.
The potential impact from unplanned losses of liquids to water is covered under Accidental Events
in Section 4.7.
4.4.1. Vessels’ discharges Discharges of vessels’ sanitary waters and ballast water are subject to specific requirements under
MARPOL (Annex IV) and the International Convention on the Control and Management of
Ship’s Ballast Water and Sediments. These minimise the potential impact on the water column
from shipping activities. All vessels contracted for the DP activities will comply with these
requirements, confirmation of which forms part of Shell’s GMAS (see Section 4.3.3).
4.4.2. Abrasive cutting compounds Cutting to remove the topsides and to release the jacket legs and SSIV from their piles will involve
the release of ground garnet (a natural mineral) used as an abrasive agent, and of metal shavings.
These discharges will be released above sea level in the former activity, and will be contained within
the jacket piles, below the seabed, for cutting piles. Cutting of connection spools into sections for
recovery may also utilise abrasive compounds which would be discharged at the seabed. The
discharges will result in suspended solids in the water column which will eventually settle out.
Suspended solids have the potential to cause physical stress to organisms within the water column.
The activities, and any associated impact, will be short lived and localised.
4.4.3. Discharge from spools and risers Flushing and cleaning of the two pipelines (PL1978 and PL1979) in 2012 achieved an OiW
concentration of <5 ppm. Following which they were filled with freshwater dosed with corrosion
inhibitor and oxygen scavenger.
Both pipelines will be fitted with blind flange plates following their disconnection from the spools
connecting them to the risers. The contents of the spools and risers (c. 15 m3) will be discharged
during their recovery. The discharge is expected to have negligible impact on the water column,
partly on account of the small quantities involved and also because the inhibitors originally dosed
will have reacted as intended and there is expected to be little active compound still present. This
activity will be carried out under licence under the Offshore Chemicals Regulations 2002 (as
amended) for which a Chemical Risk Assessment will consider the potential impact via Osborne
Adams modelling.
Goldeneye Decommissioning Environmental Appraisal Report Revision: A02
Page 81 of 126
Doc. no. GDP-PT-S-HE-0702-00003
4.4.4. Future discharge from pipelines Both pipelines will remain buried following decommissioning in situ. They will remain available for
use as part of a CCS scheme and the disposal of the pipeline contents would be managed under
that scheme.
If no CCS opportunities utilise the pipelines, they will remain buried and at some point in the
future the steel will degrade and the protective coatings will crack. At this point the contents of
the pipelines will start to be released into the sediments, through which there will be migration to
the water column. The eventual discharge is expected to have negligible impact on the sediments
or water column. This is ostensibly because the OiW content of the water is low (<5 ppm) and
the inhibitors originally dosed will have reacted as intended and there would be little if any trace
of the active compounds still present.
4.4.5. Discharge of hydraulic fluid The umbilical consists of two control lines connecting the topsides and SSIV, which were used
only for commissioning purposes in 2003. The lines are currently filled with hydraulic fluid and
will be recovered and transported to shore for processing. The intention is to recover the subsea
section without the release of hydraulic fluid. The riser section will also be recovered without
release of hydraulic fluid if the jacket is removed as a single lift. However, should the jacket be cut
for recovery in sections, approximately 20 L of hydraulic oil in the riser section would be released.
Should this method of jacket recovery be adopted, the release of hydraulic oil will be permitted as
appropriate through BEIS.
4.4.6. Controls for the Management of Impacts from Discharges to Sea The following mitigation measures, safeguards and controls are proposed to minimise the impact
of discharges to sea associated with the Goldeneye decommissioning.
MITIGATION MEASURES, SAFEGUARDS AND CONTROLS
▪ All vessels employed for the decommissioning will meet the requirements of Shell’s Group Marine Assurance System (GMAS)1; and
▪ Adoption of any controls identified following risk assessment under the Offshore Chemicals Regulations.
Note 1: Shell’s GMAS adopts and expands on the Oil Companies International Marine Forum (OCIMF) inspection (OVIQ2) and review of the Maritime Contractor Offshore Vessel Managers Self-Assessment (OVMSA). The review includes (inter alia) consideration of reliability and maintenance standards, navigational safety, emergency preparedness and contingency planning, and compliance with MARPOL and IMO standards for sewage discharge, garbage management, ballast water management and
emissions controls.
The appraisal of the discharges from the decommissioning activities supports the conclusion that
these will have a minimal impact, while adoption of the control measures specified will ensure
emissions are kept as low as reasonably practical.
4.5. Underwater Noise Ambient noise in the ocean is background sound generated by natural (e.g. wind, waves, tectonic activity, rain and marine organisms) and human (e.g. background shipping traffic and onshore and offshore construction) sources (e.g. Hildebrand, 2009; Richardson et al., 1995). The characteristics of the sound produced, in terms of the amplitude, range of frequencies and temporal features, varies with the type of activity and equipment.
Goldeneye Decommissioning Environmental Appraisal Report Revision: A02
Page 82 of 126
Doc. no. GDP-PT-S-HE-0702-00003
Marine fauna use sound for navigation, communication and prey detection (see e.g. reviews in
NMFS, 2016; Southall et al., 2007; Richardson et al., 1995). Therefore, the introduction of
anthropogenic underwater sound has the potential to impact on marine animals if it interferes with
the animal’s ability to use and receive sound (see e.g. OSPAR, 2009). Particularly loud sound can
disturb marine animals, triggering avoidance response or, in extreme cases, has the potential to
cause temporary, or even permanent, auditory threshold shifts (TTS and PTS respectively). In fish,
the effects of “excessive” sound include avoidance reactions and changes in shoaling behaviour.
Avoidance of an area may interfere with feeding or reproduction or cause stress-induced reduction
in growth and reproductive output (Slabbekoorn et al., 2010).
As reported in Section 2.7, a range of fish species use the area for nursery and/or spawning grounds at different times of the year including cod, herring, lemon sole, mackerel, sprat and whiting (Coull et al., 1998). Harbour porpoise, bottlenose dolphin, white-beaked dolphin, minke whale and grey seals are among the marine mammals that have been observed or identified as likely to be present in the Goldeneye area and/or pipeline route. While minke whale is also a listed feature of the Southern Trench pMPA and bottlenose dolphin associated with the nearby Moray Firth SAC are known to traverse the nearshore waters off Peterhead and Aberdeen.
The Conservation of Offshore Marine Habitats and Species Regulations 2017 make it an offence
to injure or disturb European Protected Species (EPS), the list of which includes many marine
mammals. The Regulation defines ‘injury’ as a permanent threshold shift and ‘disturbance’ as the
likelihood of impairing their ability to survive, to breed or reproduce, or to rear or nurture their
young, or migrate. It also includes a likelihood of significantly affecting the local distribution or
abundance of the species. New developments must assess if their activity, either alone or in
combination with other activities, is likely to cause an offence involving an EPS.
The potential for injury or disturbance depends on the amplitude and frequencies of the sound
source, the sensitivity of a receptor animal to sounds of the source frequencies, as well as the
distance and propagation of sound between the source and the receptor. This section of the report
considers the sources of underwater noise associated with the Goldeneye decommissioning
activities, the sensitivity of the receptors in the vicinity of those activities and the potential for
disturbance and injury due to underwater noise.
4.5.1. Sources of Underwater Noise
Decommissioning will give rise to sources of noise related to:
• Vessels of various types;
• Cutting tools;
• Pipeline trenching;
• Placement of rock cover; and
• Seabed surveys.
The noise associated with these sources are discussed below.
No high energy noise sources such as the use of explosives, piling or deep sediment penetration seismic equipment will be required for the Goldeneye decommissioning.
4.5.1.1. Vessels
The Goldeneye decommissioning will mobilise a variety of vessels (e.g. HLVs, ROVSVs, survey vessels etc.) that are typical of routine oil and gas industry operations, some of which will use dynamic positioning systems to maintain and adjust their position when working.
Goldeneye Decommissioning Environmental Appraisal Report Revision: A02
Page 83 of 126
Doc. no. GDP-PT-S-HE-0702-00003
The primary sources of sound from vessels are propellers, propulsion and other machinery (Ross,
1976; Wales and Heitmeyer., 2002), with an estimated 85% of vessel noise resulting from propeller
cavitations (Barlow and Gentry 2004), which are particularly prominent for dynamic positioning
systems.
In general, vessel sound is continuous and results from narrowband tonal sounds at specific
frequencies as well as broadband sounds. Acoustic energy is strongest at frequencies below 1 kHz
and is the dominant noise source in deeper water between 20 – 500 Hz (Ulrick 1983). Acoustic
broadband source levels typically increase with increasing vessel size, with smaller vessels (<50 m)
having a source root mean square (rms) sound pressure level (SPL) of 160-175 dB re 1 μPa at 1 m,
medium size vessels (50-100 m) 165-180 dB re 1μPa at 1 m and large vessels (> 100 m) 180-190
dB re 1 μPa at 1 m (Richardson et al., 1995), although sound levels depend on the operating status
of the vessel and can vary considerably in time.
Kyhn et al., (2014) identified noise generation from various activities of a drillship (the Stena Forth)
equipped with six dynamic positioning thrusters and determined that the dynamic positioning
control system generated noise at around 100 dB re 1 µPa (rms) at frequencies between
20 – 35 kHz.
4.5.1.2. Underwater Cutting
Underwater cutting will be required to cut the jacket and SSIV piles and to cut connection spools into sections for lifting.
Mechanical methods of cutting underwater structures use hard cutting tools that produce a sawing or machining action. Examples include hydraulic shears, diamond wire and abrasive water jet cutters. Any or all of these may be employed at Goldeneye.
A recent paper reported that the noise from underwater diamond wire cutting, during the severance of a 0.76 m (30″) diameter conductor at a platform in the North Sea, was barely discernible above background noise levels including the noise of associated vessel presence (Pangerc et al., 2016). The cutting noise, an increase of 4 – 15 dB above background levels, was more discernible at higher frequencies, i.e. > 5 kHz, than at low frequencies, and was identifiable in recordings made 800 m from source. Anthony et al. (2009) present a review of published underwater noise measurements for various types of diver-operated tools. Several of these are underwater cutting tools, including a high-pressure water jet lance, chainsaw, grinder and oxy-arc cutter. Reported source sound pressure levels were 148-170.5 dB re 1µPa (it was not indicated whether these are rms or zero-peak). It is possible that larger, Remotely Operated Vessel (ROV) operated cutting tools could generate louder sound levels but no published data are available.
4.5.1.3. Pipeline Trenching
Little information was found to be available on the sound levels generated by a seabed plough or other trenching methods, but it is predicted that sound levels are likely to be comparable to that generated by dredging activities, and that this in turn is dominated by the noise of the vessel itself (Genesis, 2011).
Underwater sound caused be dredging activities is typically low frequency, with strongest sound below 1 kHz (de Jong et al., 2010), although Robinson et al. (2011) found higher source frequencies at similar levels. Sound source levels typically range 168 – 186 dB (rms) 1µPa at 1 m (reviews by WODA, 2013; Genesis, 2011). The levels and frequencies generated depend on the type of dredger, operational status and sediment type, for example Robinson et al., (2011) found that source levels were approximately 5 dB higher during dredging of gravel compared with sand.
Goldeneye Decommissioning Environmental Appraisal Report Revision: A02
Page 84 of 126
Doc. no. GDP-PT-S-HE-0702-00003
4.5.1.4. Rock Cover
Rock cover will be required at the pipeline ends and pipeline crossings. Additional rock cover may be required should the trench and bury operation not be able to achieve an adequate depth of cover. In addition, it may be necessary to use rock cover to mitigate snagging risks at spud cans, anchor chain scars and at the site of the removed jacket footings.
Nedwell and Edwards (2004) reported the sound from a fall pipe vessel Rollingstone, a vessel that has a specialised underwater chute to position rock on the seabed. The vessel used dynamic positioning and was powered by two main pitch propellers, two bow thrusters and two Azimuth thrusters. It was concluded that the sound levels were dominated by the vessel and not the rock placement activities.
4.5.1.5. Acoustic Surveying Equipment
Shell routinely carries out surveys and inspections of all their pipelines within the UKCS on a rolling basis. These surveys employ a combination of acoustic surveying devices, including side-scan sonar (SSS) and multibeam echo sounders (MBES) to generate images of the seabed, and sub-bottom profilers (SBP) to determine the burial depth of the pipelines. All of these instruments use electromagnetic sources rather than air guns. The surveys required for the Goldeneye decommissioning will be similar to those routinely undertaken and are anticipated to use the same equipment type.
SSS devices use an acoustic beam to generate an accurate image of a narrow area of seabed to either side of the instrument by measuring the amplitude of back-scattered return signals. The instrument can either be towed behind a ship at a specified depth or mounted on to a remotely operated vehicle. Source levels of side-scan sonars are typically in the range of 200 to 230 dB re 1 µPa-m, although available information and measurements is limited. In order to provide higher resolution imaging of the seabed the frequencies used by side-scan sonar systems are relatively high (100 – 600 kHz).
MBES use multiple transducers to send out a swath of sound covering a large, fan-shaped area of the seabed either side of the vessel track. The width of individual beams transmitted by a multi-beam echosounder are typically in the range of 0.5°-2°. The swath width is typically in the order of two to four times the water depth, but can be up to ten times the water depth in high-performance systems (Danson, 2005). Maximum peak source levels for the most powerful, deep-water systems are 236 – 238 dB re 1 µPa-m. However, systems used in shallower water such as the proposed pipeline inspection survey route are higher frequency and lower power (SCAR, 2005). Similar to side-scan sonar devices, the frequencies used by multi-beam echosounders (particularly in shallow waters) are relatively high (100 – 500 kHz).
Sub-bottom profiling is used to determine the stratification of soils beneath the sea floor. Various types of SBP instrument may be used depending on the required resolution and seabed penetration (King, 2013; Danson, 2005). For pipeline burial depth surveys a Pinger type SBP provides adequate penetration at high resolution. Typical SBP Pingers used by Shell have a peak sound pressure level (SPL) of 220 dB re 1 µPa-m, and a rms SPL of 217 dB re 1 µPa-m, with the sound energy generated being at a peak frequency of 3 kHz. The pulse length is approximately 50 ms and the pulse interval 0.2 s, giving a pulse frequency of 4 Hz i.e. 4 pulses will be transmitted every second. Based on the rms SPL and the pulse length, the sub-bottom profiler is estimated to have a single pulse sound exposure level (SEL) of 204 dB re 1 µPa2s-m, and a source SEL over a 1 second exposure of 210 dB re 1 µPa2s-m. The majority of sound energy from SBPs is directed vertically downwards and the pulse duration is short (tens to hundreds of milliseconds).
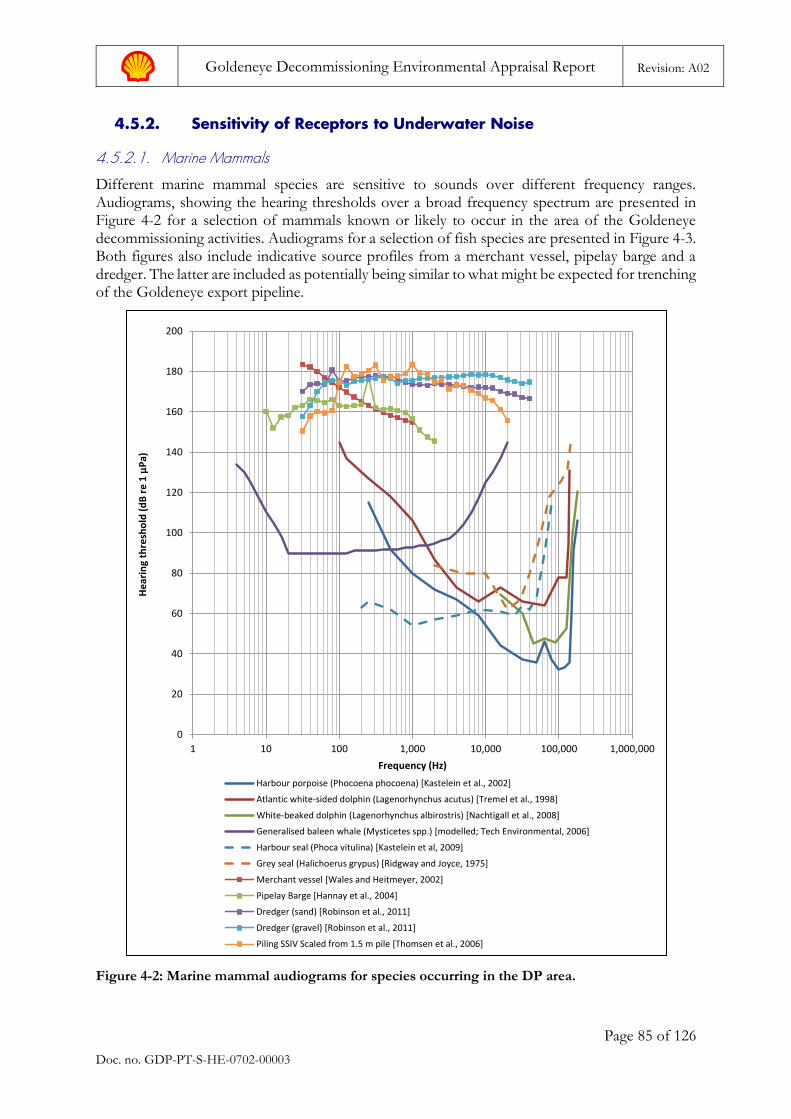
Goldeneye Decommissioning Environmental Appraisal Report Revision: A02
Page 85 of 126
Doc. no. GDP-PT-S-HE-0702-00003
4.5.2. Sensitivity of Receptors to Underwater Noise
4.5.2.1. Marine Mammals
Different marine mammal species are sensitive to sounds over different frequency ranges. Audiograms, showing the hearing thresholds over a broad frequency spectrum are presented in Figure 4-2 for a selection of mammals known or likely to occur in the area of the Goldeneye decommissioning activities. Audiograms for a selection of fish species are presented in Figure 4-3. Both figures also include indicative source profiles from a merchant vessel, pipelay barge and a dredger. The latter are included as potentially being similar to what might be expected for trenching of the Goldeneye export pipeline.
Figure 4-2: Marine mammal audiograms for species occurring in the DP area.
0
20
40
60
80
100
120
140
160
180
200
1 10 100 1,000 10,000 100,000 1,000,000
He
arin
g th
resh
old
(d
B r
e 1
µP
a)
Frequency (Hz)
Harbour porpoise (Phocoena phocoena) [Kastelein et al., 2002]
Atlantic white-sided dolphin (Lagenorhynchus acutus) [Tremel et al., 1998]
White-beaked dolphin (Lagenorhynchus albirostris) [Nachtigall et al., 2008]
Generalised baleen whale (Mysticetes spp.) [modelled; Tech Environmental, 2006]
Harbour seal (Phoca vitulina) [Kastelein et al, 2009]
Grey seal (Halichoerus grypus) [Ridgway and Joyce, 1975]
Merchant vessel [Wales and Heitmeyer, 2002]
Pipelay Barge [Hannay et al., 2004]
Dredger (sand) [Robinson et al., 2011]
Dredger (gravel) [Robinson et al., 2011]
Piling SSIV Scaled from 1.5 m pile [Thomsen et al., 2006]
Goldeneye Decommissioning Environmental Appraisal Report Revision: A02
Page 86 of 126
Doc. no. GDP-PT-S-HE-0702-00003
Baleen whales (including the minke whale) are low-frequency hearing cetaceans; the white-beaked dolphin is representative of mid-frequency hearing cetaceans; and the harbour porpoise is representative of high-frequency hearing cetacean species.
The figure indicates that noise from vessels, and activities of a similar nature to trenching, covers frequency ranges that are audible to all marine mammals and that the source noise levels are above the hearing thresholds. It is also evident from Figure 4-2 that noise from SSS and MBES (>100 kHz) is outside the main hearing range of all marine species, as acknowledged by JNCC (JNCC, 2017). SBP pingers, with a peak source frequency of around 3 kHz are within the audible range of many marine mammal species, although at the high frequency end for the baleen whales’ spectrum, and outside the hearing range of the white-beaked dolphin.
The accepted method (Marine Scotland, 2014) for determining whether activities cause injury to marine mammals is based on the potential to cause a permanent elevation of the hearing threshold (i.e. a degree of loss of hearing). Southall et al. (2007) established thresholds, that has subsequently become widely adopted, for the onset of a permanent threshold shift (PTS) for four groups of marine mammals (Phocid pinnipeds and three groups of cetaceans: those with low-, mid- and high-frequency hearing). Thresholds have been determined for two metrics, peak SPL and M-weighted SEL, which capture different aspects of a sound field. Peak SPL is a measure of the loudest instantaneous sound likely to be generated during an activity. SEL is a measure of the total energy in a sound pulse over a period of time. To apply the SEL thresholds, the SEL is calculated over a 24 hour period and is weighted according to marine mammal hearing sensitivities.
Subsequently published research suggests that marine mammals may be more sensitive to noise than suggested by Southall et al. (2007) and a revised set of thresholds has been proposed (NMFS, 2016). These revised thresholds have been adopted by the National Oceanic and Atmospheric Administration (NOAA) in the United States, although to date there has been no official guidance as to whether or not they will be adopted in the UK. Thresholds for the onset of PTS from peak SPL range between 202 and 230 dB re 1 µPa (NMFS, 2016).
4.5.2.2. Fish
There is limited data available on hearing frequencies for fish species, but those included in Figure 4-3 cover either the species found in the area of DP activities or are representative of most of those species (e.g. yellow sting-ray (for which data is available) is an elasmobranch species, as is the basking shark, which may be present in the area).
The frequency ranges of some of the noise sources identified with the Goldeneye
decommissioning activities overlap with the audible ranges of fish, and the source noise levels
exceed the hearing thresholds at these frequencies.
Fish are mobile animals that would be expected to be able to move away from a noise source that
had the potential to cause them harm. If fish are disturbed by a noise, evidence suggests they will
return to an area once it has ceased (Slabbekoorn et al., 2010).
Turnpenny and Nedwell (1994) reviewed published observations of injury to fish eggs and larvae
from high-energy sounds. The results of the studies were variable, but no injury effects were
observed beyond approximately 10 m of the source or at levels below an SPL of 220 dB re 1 µPa.
Experiments exposing caged fish of various species to mid-frequency (2.8-3.5 kHz) sonar at a received sound pressure levels (SPL) of 210 dB re 1µPa rms found evidence of temporary hearing damage in fish with hearing sensitivity in the frequency range generated by the source but not those with lower frequency hearing. Hearing damage recovered within 24 hours and no evidence of pathology or mortality was found (Halvorsen et al., 2012).
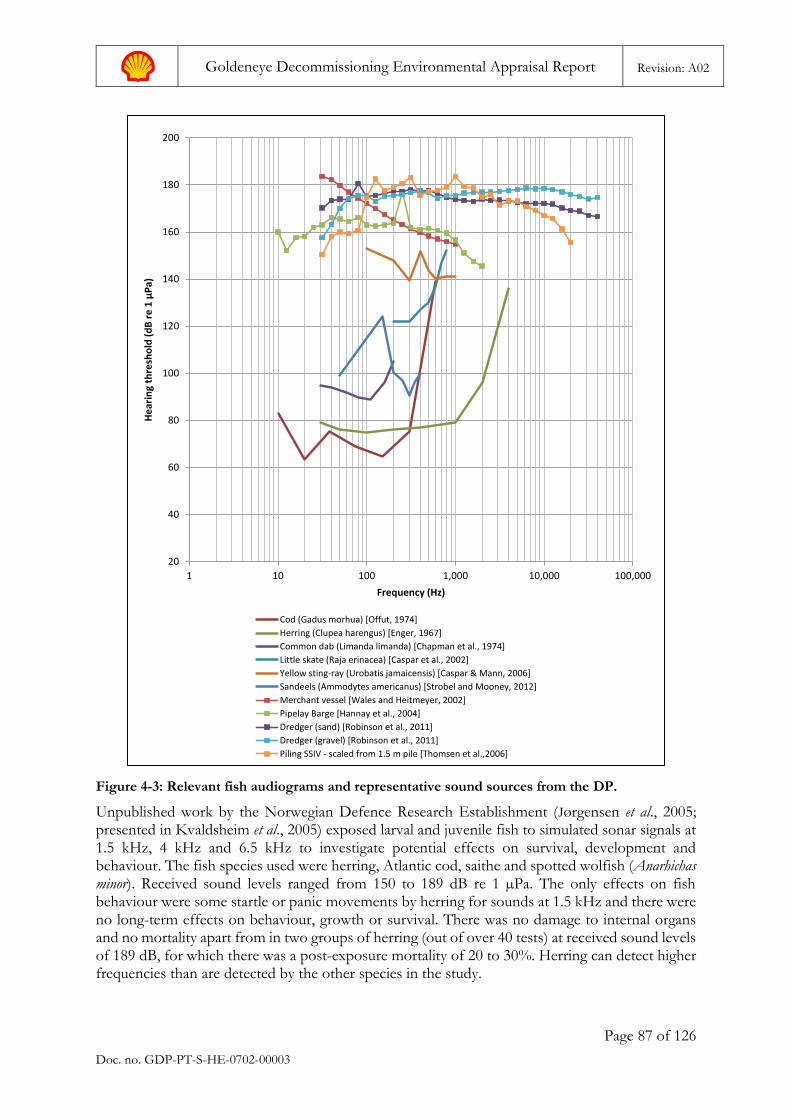
Goldeneye Decommissioning Environmental Appraisal Report Revision: A02
Page 87 of 126
Doc. no. GDP-PT-S-HE-0702-00003
Figure 4-3: Relevant fish audiograms and representative sound sources from the DP.
Unpublished work by the Norwegian Defence Research Establishment (Jørgensen et al., 2005; presented in Kvaldsheim et al., 2005) exposed larval and juvenile fish to simulated sonar signals at 1.5 kHz, 4 kHz and 6.5 kHz to investigate potential effects on survival, development and behaviour. The fish species used were herring, Atlantic cod, saithe and spotted wolfish (Anarhichas minor). Received sound levels ranged from 150 to 189 dB re 1 µPa. The only effects on fish behaviour were some startle or panic movements by herring for sounds at 1.5 kHz and there were no long-term effects on behaviour, growth or survival. There was no damage to internal organs and no mortality apart from in two groups of herring (out of over 40 tests) at received sound levels of 189 dB, for which there was a post-exposure mortality of 20 to 30%. Herring can detect higher frequencies than are detected by the other species in the study.
20
40
60
80
100
120
140
160
180
200
1 10 100 1,000 10,000 100,000
He
arin
g th
resh
old
(d
B r
e 1
µP
a)
Frequency (Hz)
Cod (Gadus morhua) [Offut, 1974]
Herring (Clupea harengus) [Enger, 1967]
Common dab (Limanda limanda) [Chapman et al., 1974]
Little skate (Raja erinacea) [Caspar et al., 2002]
Yellow sting-ray (Urobatis jamaicensis) [Caspar & Mann, 2006]
Sandeels (Ammodytes americanus) [Strobel and Mooney, 2012]
Merchant vessel [Wales and Heitmeyer, 2002]
Pipelay Barge [Hannay et al., 2004]
Dredger (sand) [Robinson et al., 2011]
Dredger (gravel) [Robinson et al., 2011]
Piling SSIV - scaled from 1.5 m pile [Thomsen et al.,2006]
Goldeneye Decommissioning Environmental Appraisal Report Revision: A02
Page 88 of 126
Doc. no. GDP-PT-S-HE-0702-00003
Popper et al. (2014) have defined criteria for injury to fish based on a review of impacts to fish,
fish eggs, and larvae from various high-energy sources. The most sensitive species are those with
a swim bladder that is also used for hearing, for which Popper et al. (2014) determined a threshold
for mortality, or potential mortal injury, of a peak SPL of 207 dB re 1 µPa.
4.5.3. Potential for Impacts from Underwater Noise
4.5.3.1. Potential for Impacts from Vessel Noise The DP will require in the order of 300 vessel days to complete, plus any time that a guard vessel
is required to be positioned on station. This will make a small addition to the background vessel
density around the Goldeneye platform and along the pipeline corridor, where baseline shipping
levels are moderate and high, respectively (see Section 2.7.7). JNCC considers that temporary
vessel traffic is unlikely to cause more than trivial disturbance to marine mammals (JNCC, 2010).
The increase in underwater sound from vessels mobilised for the Goldeneye decommissioning will
therefore be slight and the impact on the environment minor.
4.5.3.2. Underwater Cutting
There is no published information on the response of marine mammals or fish to sound generated by underwater cutting. However, reported source levels are low compared with those generated by vessels (see Section 4.5.1) and any noise generated from cutting operations is not likely to cause significant disturbance to marine fauna. This is consistent with JNCC guidance which states that non-explosive cutting technology produces relatively little noise (JNCC, 2008).
4.5.3.3. Pipeline Trenching No sound source information is available for the trenching of surface-laid pipelines. Noise from
dredging activities, taken as a proxy from trenching, generates peak levels similar to that from
vessels, for which no significant impact is predicted to marine mammals.
Based on a comparison of the levels on noise thought capable of causing injury to fish and the
levels of noise produced by underwater dredging, it is not likely that exposure to dredging noise
would injure fish but it may be loud enough to cause a behavioural reaction such as avoidance or
a startle response (CEDA, 2011).
4.5.3.4. Placement of Rock Cover
Where rock cover is required it will be placed on the seabed using a down pipe or similar low-noise method. No noise source levels have been reported for rock cover, but the only available information suggests that levels are lower than that generated by the vessel used. Furthermore, given the short duration of individual rock cover activities, there is only likely to be a low impact on marine mammals or fish associated with the noise generated (JNCC, 2008).
4.5.3.5. Acoustic Surveying Equipment
A review of the impact of acoustic surveying techniques on marine fauna in the Antarctic concluded that acoustic instruments such as SSS and many echo sounders are of sufficiently low power and high frequency as to pose only a minor risk to the environment. This concurs with a review by Richardson et al., (1995), which found no obvious response to pingers, echo sounders and other pulsed sound at higher frequencies unless the received levels were very high.
Goldeneye Decommissioning Environmental Appraisal Report Revision: A02
Page 89 of 126
Doc. no. GDP-PT-S-HE-0702-00003
The high frequency sound produced by SSS and MBES in relatively shallow waters (<200 m) is outside the hearing range of marine mammals and attenuates rapidly. The risk of injury or disturbance from operation of this type of equipment is considered negligible and no mitigation is required (JNCC, 2017).
Little information is available on the potential effects of SSS and echo sounders on fish (Popper, 2008 and ICES, 2005), but since the sound generated by SSS and MBES are outside the hearing threshold of fish, no effect would be anticipated.
Sound generated be SBP pingers is within the audible range of most marine mammals and sound source levels are at or around the peak SPL threshold for the onset of PTS in some marine mammal species. This raises the potential for disturbance and/or injury.
SBP surveys undertaken in relation to licences issued under the Petroleum Act 1998 (and the Energy Act 2008) require consent under the Offshore Petroleum Activities (Conservation of Habitats) Regulations 2001. Applications require consideration of the potential impact of noise from the SBP on the marine environment and such assessments are frequently informed by noise modelling studies. Shell frequently undertakes pipeline surveys using acoustic equipment for its assets throughout the North Sea. Shell’s experience is that all modelling studies in support of applications for consents for these surveys identify a near negligible potential for impact on marine mammals and fish from the use of SBP.
An example of particular relevance to the Goldeneye decommissioning is the modelling study undertaken in support of an application for pipeline surveys in nearshore waters off St. Fergus. The survey used a combination of SSS, MBES and SBP pingers and concluded that the maximum distance at which the NOAA (NMFS, 2016) dual metric threshold for the onset of PTS would be exceeded was 1 m for pinnipeds, 18 m for high-frequency hearing cetaceans (such as harbour porpoise), 2 m for low-frequency hearing cetaceans (such as minke whale), while the threshold for mid-frequency hearing cetaceans (such as bottlenose dolphin) would not be exceeded at any distance. The maximum distance at which the threshold (Popper et al., 2014) for fish mortality would be exceeded was 2 m, including for fish eggs and larvae.
The maximum area in which the threshold for disturbance of marine mammals would be exceeded was modelled to be 9.5 km2. The density of minke whale in zone R of the SCANS-III surveys was reported as 0.039 animals per km2. As an average, the noise from the SBP would therefore disturb (0.37) less than one minke whale. Bottlenose dolphins are of the medium frequency cetacean group and have a lower threshold for disturbance than minke whale.
4.5.3.6. Impacts on the Southern Trench pMPA The minke whale is a proposed feature of the Southern Trench pMPA although, as seen in Section
2.4.1, the activities of the Goldeneye decommissioning do not coincide with areas of high minke
whale presence. Data from the Southern Trench MPA proposal Data Confidence Assessment
(SNH, 2014a) shows densities are generally in the range 0 – 0.1 animals per km2 within 10 km of
the pipeline where it crosses the pMPA, but with some patches of higher average densities, up to
the range 0.2 – 0.5 animals per km2. Using these data rather than that from the SCANS-III
programme, the use of SBP pingers for the pipeline burial surveys would be expected to cause
disturbance to <1 minke whales, with a worst case of 5 animals, for the short duration required to
survey the nearshore 25 km of the pipeline route.
The first 5 km (6%) of the trenching of the export pipeline will take place within the Southern
Trench pMPA, and is planned to take approximately 3 days. As seen in the preceding sections, the
impact of noise from trenching and the presence of vessels for this short period of time will result
in a very small increase to the baseline noise levels from the high levels of shipping noted for this
Goldeneye Decommissioning Environmental Appraisal Report Revision: A02
Page 90 of 126
Doc. no. GDP-PT-S-HE-0702-00003
area. For context, a shipping activity survey undertaken in 2013 identified an average of 62 vessels
per day passing through the nearshore area off Peterhead in summer and 67 vessels per day in
winter (Anartec, 2013).
4.5.3.7. Impacts on bottlenose dolphins
The area of disturbance for medium frequency cetaceans (which includes the bottlenose dolphin) was not modelled for the previous pipeline surveys and, even had it been, the number of bottlenose dolphins potentially affected by the associated underwater noise could not be determined from applying the SCANS III density estimate for zone R to the area of disturbance. The population of bottlenose dolphins around the northeast coast of Scotland are primarily associated with the waters of the Moray Firth, although they are known to move around the coast, past St. Fergus, and are frequently observed off Aberdeen and further south. During surveying of the nearshore section of the pipeline, there is potential for some disturbance to those bottlenose dolphins transiting this part of the coast but given the short duration of this activity, the effect of the disturbance is anticipated to be minimal.
4.5.4. Controls for the Management of Impacts from Underwater Noise Cetaceans, pinnipeds and fish are present in the area around the Goldeneye Field and export
pipeline route, and these receptors have been identified to be sensitive to underwater noise.
Disturbance of these receptors from noise resulting from the proposed decommissioning activities
is expected to be low, and the likelihood of injury from underwater noise is negligible.
The following mitigation measures, safeguards and controls are proposed to minimise the impact
of underwater noise associated with the Goldeneye decommissioning.
MITIGATION MEASURES, SAFEGUARDS AND CONTROLS
▪ The scheduling of vessels’ operations and types of vessels used will be optimised to execute the decommissioning as efficiently as possible.
▪ JNCC guidelines for minimising the risk of injury to marine mammals will be followed in as much as they relate to the use of SBP for geophysical surveys.
4.6. Waste Management
4.6.1. Removed Wastes A number of controlled wastes, including hazardous wastes, will be returned to shore for treatment
and disposal at licensed dismantling yards in keeping with relevant legislative provisions in the
country of destination (e.g. the Environmental Protection Act 1990 (as amended), The Waste
(Scotland) Regulations 2011 and 2012 (as amended)). A total of approximately 6,800 te of waste
materials has been identified, approximately 74% of which is steel, 16% marine growth, 7%
concrete and grout and 2% non-ferrous metals.
The eventual fate of materials will in part be controlled by the type of waste and how it is regulated,
and also the potential for material reuse and recycling. All waste will be documented in a waste
management plan (WMP), which will be used to record the types, quantities and fate of all waste.
An audit trail will be maintained for waste materials from all vessels, through to the onshore
decommissioning yard, and on to the recycling facility or disposal site. The onshore yard contractor
will keep an inventory of the types, quantities and dates of waste received and the quantities and
dates of dispatch from the site. The recycling facilities and disposal sites will certify the type,
Goldeneye Decommissioning Environmental Appraisal Report Revision: A02
Page 91 of 126
Doc. no. GDP-PT-S-HE-0702-00003
quantity and date the material is received and processed. The onshore yard contractor will report
waste quantities by type to Shell.
To limit the quantity of waste requiring eventual landfill disposal, Shell will ensure appropriate
waste segregation and treatment is undertaken, and will consider a waste hierarchy whereby
opportunities for the reuse or recycling of equipment and materials will be maximised. Should the
destination of any part of the facilities be a non-UK yard, Shell will ensure that waste is exported
in a manner consistent with relevant waste shipment Regulations (e.g. The Transfrontier Shipment
of Waste Regulations 2007 (as amended)).
A hazardous material inspection for Goldeneye identified minimal sources of hazardous waste.
The WMP lists each hazardous waste stream identified (e.g. PFOS in insulation, low-level ionising
radiation sources in smoke detectors) along with the relevant controlling regulations and special
handling requirements. No evidence of asbestos was identified by the hazardous material
inspection and there has been no indication of Naturally Occurring Radioactive Material (NORM)
at Goldeneye during the operating life of the field. Notwithstanding, the dismantling contractor
will have processes in place to aid the identification of asbestos and NORM, and for the treatment
of any such materials that are found.
In excess of 97% of the inorganic waste is anticipated to be recycled or repurposed.
Marine growth is typically between 70 – 90% water by weight and is therefore expected to lose a
substantial proportion of its weight as it dries out in transit to the dismantling yard. Shell will
encourage the dismantling contractor to explore uses for marine growth removed from the
structures onshore but it is recognised that there is a shortage of capacity for alternatives to landfill
(e.g. composting) for marine growth (BMT Cordah, 2011). Marine growth that is not removed
from the structures will become incinerated as part of the steel recycling process.
The risk of the transfer of non-native species of marine growth is considered to be low if the
receiving yard is located within the North Sea because no evidence has been found to date that
non-native species occur on platforms in the North Sea (BMT Cordah, 2011). If the jacket is to
be taken to a yard outwith the North Sea, further assessment of the risk of transfer will be
undertaken as part of the vessel transit plan.
Odour from decaying marine growth is a potential source of nuisance and will be managed by the
dismantling yard in accordance with their site regulatory requirements.
4.6.2. Materials Left in situ All materials, and their approximate quantities, that will remain on or below the seabed following
decommissioning removal activities are listed in Table 4-1.
The ultimate fate of metals will be degradation by oxidation. The ultimate fate of plastic coatings
is discussed below.
The external corrosion of coated pipelines is normally restricted to those localised areas where
there are defects or damage in the coating, or where the coating has become disbonded from the
pipe. Disbondment of the coating may be the result of damage during installation, impacts from
trawl boards and dropped objects, abrasion, etc. Corrosion can be expected to be almost negligible
in areas, where the coating integrity is intact. Pipeline corrosion is therefore expected in most cases
to occur as localised pits, which will eventually result in random perforations throughout the
pipeline length.
Structural degradation of the Goldeneye pipelines will be a long-term process caused by corrosion
and the eventual collapse of the structures under their own weight and that of any overlying
sediment. During this process, degradation products derived from the exterior and interior of the
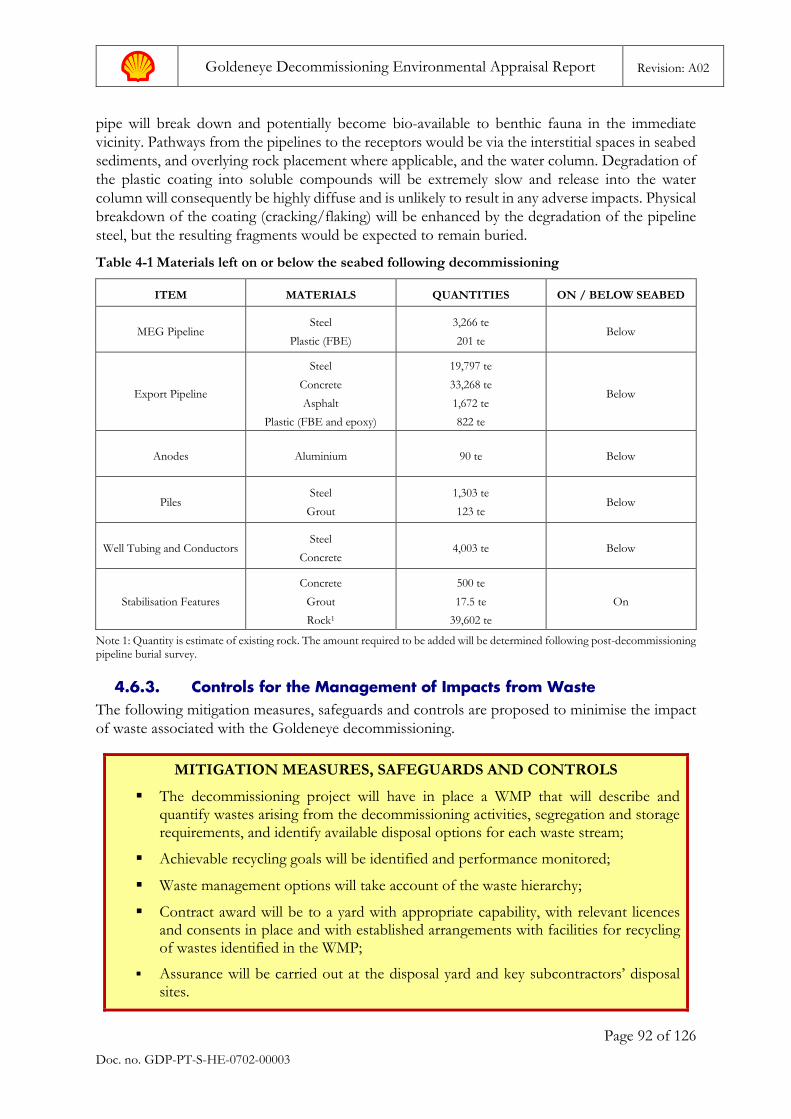
Goldeneye Decommissioning Environmental Appraisal Report Revision: A02
Page 92 of 126
Doc. no. GDP-PT-S-HE-0702-00003
pipe will break down and potentially become bio-available to benthic fauna in the immediate
vicinity. Pathways from the pipelines to the receptors would be via the interstitial spaces in seabed
sediments, and overlying rock placement where applicable, and the water column. Degradation of
the plastic coating into soluble compounds will be extremely slow and release into the water
column will consequently be highly diffuse and is unlikely to result in any adverse impacts. Physical
breakdown of the coating (cracking/flaking) will be enhanced by the degradation of the pipeline
steel, but the resulting fragments would be expected to remain buried.
Table 4-1 Materials left on or below the seabed following decommissioning
ITEM MATERIALS QUANTITIES ON / BELOW SEABED
MEG Pipeline Steel
Plastic (FBE)
3,266 te
201 te Below
Export Pipeline
Steel
Concrete
Asphalt
Plastic (FBE and epoxy)
19,797 te
33,268 te
1,672 te
822 te
Below
Anodes Aluminium 90 te Below
Piles Steel
Grout
1,303 te
123 te Below
Well Tubing and Conductors Steel
Concrete 4,003 te Below
Stabilisation Features
Concrete
Grout
Rock1
500 te
17.5 te
39,602 te
On
Note 1: Quantity is estimate of existing rock. The amount required to be added will be determined following post-decommissioning pipeline burial survey.
4.6.3. Controls for the Management of Impacts from Waste The following mitigation measures, safeguards and controls are proposed to minimise the impact
of waste associated with the Goldeneye decommissioning.
MITIGATION MEASURES, SAFEGUARDS AND CONTROLS
▪ The decommissioning project will have in place a WMP that will describe and quantify wastes arising from the decommissioning activities, segregation and storage requirements, and identify available disposal options for each waste stream;
▪ Achievable recycling goals will be identified and performance monitored;
▪ Waste management options will take account of the waste hierarchy;
▪ Contract award will be to a yard with appropriate capability, with relevant licences and consents in place and with established arrangements with facilities for recycling of wastes identified in the WMP;
▪ Assurance will be carried out at the disposal yard and key subcontractors’ disposal sites.
Goldeneye Decommissioning Environmental Appraisal Report Revision: A02
Page 93 of 126
Doc. no. GDP-PT-S-HE-0702-00003
Decommissioning activities generate large quantities of waste that has the potential to place a
significant pressure on finite landfill resource and result in a loss of valuable natural resources.
With the management measures identified, the overwhelming majority of resources will be
recycled, reducing the overall waste burden from c. 6,800 te to <170 te of inorganic waste and
approximately 200 te of marine growth.
4.7. Accidental Events Risk assessment of accidental events involves the identification of credible accident scenarios,
evaluation of the probability of incidents and assessment of their ecological and socio-economic
consequences. Given the nature of the activities which could take place as a result of
decommissioning, the following potential sources of accidental risk have been identified:
• Loss of ship’s fuel;
• Dropped objects; and
• Liquid discharges.
The potential for impact from these events are considered in the following subsections to the
extent feasible based on existing information.
4.7.1. Loss of fuel A variety of vessels will be mobilised for the Goldeneye decommissioning activities, concentrated
mainly around the location of the platform, but with trenching and survey work also being
undertaken along the length of the pipeline.
4.7.1.1. In Field The impact from a major loss of fuel in the vicinity of the Goldeneye platform has been assessed
as part of the facility Oil Pollution Emergency Plan (OPEP). Spill modelling undertaken in support
of the OPEP (last updated 01/02/2018) considered a spill of 2,695 m3 of diesel from a diesel
supply vessel, considered to be the worst case, as this is the largest diesel inventory onboard any
infield vessels under contract with Shell. The spill was concluded to have 0% probability of
beaching or of reaching the UK – Norway meridian. The properties of diesel are such that the
only response options deemed applicable to such a spill within the Goldeneye field would be to
monitor and evaluate, and rely on evaporation and natural dispersion to remediate the
contamination.
Shell has also undertaken spill risk assessment for the loss of 1,000 m3 of diesel at the Goldeneye
platform as part of an Environmental Impact Assessment (EIA) undertaken to inform the
Peterhead CCS project (Shell, 2014; Scenario E.2.3.3). This was deemed to be a conservative worst
case diesel spill from a jack-up rig during plugging and making wells safe. The assessment was
based on results of spill modelling using the OSCAR modelling package developed by SINTEF.
The modelling results confirmed that, in the very unlikely event of such a spill occurring, more
than half of the diesel would evaporate within 24 hours and the amount of diesel on the surface
would be negligible after 16 days. Approximately one quarter of the diesel spilt was predicted to
end up in seabed sediments over a very wide area at concentrations that are not expected to cause
a significant impact. The remainder of the spill would disperse within the water column where it
readily biodegrades, leaving around 1 % of the volume within 30 days.
4.7.1.2. Nearshore Vessels will also operate for short periods along the pipeline route, closer to shore. There is no
reason to suggest that the activities undertaken by these vessels would render them any more prone

Goldeneye Decommissioning Environmental Appraisal Report Revision: A02
Page 94 of 126
Doc. no. GDP-PT-S-HE-0702-00003
to accident than any other shipping, fishing and service vessels operating off this coastline, but a
spill from this part of the decommissioning would cause a higher incidence of beaching, would
affect a larger strand area and have a higher potential for impact on a larger number of receptors
than an equivalent spill at Goldeneye.
Such a spill was also considered for the Peterhead CCS EIA (Shell, 2014; Scenario E.2.3.1), with
spills of around 2,200 te diesel from three locations assessed independently. The spill locations
included the closest to shore that a pipe-lay vessel could operate (minimum depth of 12 m,
Location 1) and the point where the proposed near-shore CCS pipeline would tie into the
Goldeneye export pipeline, 26 km from shore (Location 3). An intermediate point (Location 2)
was also modelled.
The model predicted that the diesel would initially be predominantly retained on the sea surface,
where it would spread out, with significant proportions evaporating.
Prevailing winds and currents would take the diesel away from shore. However, under
unfavourable current and wind conditions from the east, a nearshore spill could give rise to a large
quantity of diesel stranding.
Under these unfavourable conditions, the quantity of stranded diesel would peak after
approximately two weeks, following which the diesel would gradually become washed off the shore
by wave action, where it would continue to evaporate and biodegrade.
A summary of the worst case fate of diesel strandings from each location is provided in Table 4-2.
Table 4-2: Summary of worst case stranding following nearshore diesel spill scenarios
SPILL SCENARIO LOCATION 1 LOCATION 2 LOCATION 3
Max. mass onshore (tonnes) 1,599 1,523 1,073
Min. arrival time (days) 0.1 4.6 4.6
Max length of coastline affected (km) 120 150 40
In each scenario, after 30 days approximately half of the diesel was predicted to have evaporated
and a further 15% to have degraded. These two mechanisms would continue to dominate the fate
of the spill, with low proportions being dispersed within the water column or on sediments.
The spill would give rise to a surface oil layer which could potentially be found up to 250 km from
the spill at some point in time and would give rise to parts of the sea being subject to diesel
concentrations of >50 ppb – the threshold below which there is no expectation of significant acute
toxic effects.
In the Peterhead CCS EIA, the model results for the extent, duration and magnitudes of diesel in
the water column, as a surface layer and from stranding were used to assess the potential for impact
to receptors from a nearshore spill. The assessment concluded that, were such an event to occur,
there would be a moderate impact to seabirds, marine mammals, protected sites, commercial
fisheries, shipping and tourism. Impacts to plankton and fish were identified as being slight, and
as being insignificant on other oil and gas operations.
Whereas the spill scenario would result in a significant impact to many of the receptors, it should
be stressed that it would be very rare for such an event to occur, and that this is an intrinsic risk
that relates to any vessel activity near the coast.
The Advisory Committee on Protection of the Sea (ACOPS) collates spill data for all of the North
Sea by region and separates out statistics for the UKCS. Spills from installations are reported
separately from spills from vessels within the UKCS. Between 2002 and 2014 (the last year for
which data is currently available, ACOPS 2002 to 2014 surveys) there has been a total of 292
Goldeneye Decommissioning Environmental Appraisal Report Revision: A02
Page 95 of 126
Doc. no. GDP-PT-S-HE-0702-00003
mineral oil spills from vessels in the UKCS, varying from zero in 2014 to 37 in 2012. Mineral oil
includes crude, bunker, diesel, fuel, lubrication and other oil types. Only 16 of these spills fall into
the bunker/diesel and fuel oil category. All of these spills were below 50 te with the exception of
one (a spillage of 605 te by an unidentified vessel reported by the Tartan installation). The
likelihood of a full loss of diesel inventory from a vessel during decommissioning activities is
therefore considered remote, fitting the descriptor of ‘similar event has occurred elsewhere but is
unlikely to occur with current practices’ in Table B-5 (Likelihood Category B).
For the short time that trenching and survey vessels will be operating near to shore for the
Goldeneye decommissioning programmes they will present a small incremental addition to the
existing level of risk of spills from baseline shipping activity in the area.
4.7.1.3. Prevention and mitigation measures for spill impact minimisation This level of potential impact and risk is widely recognised and is the basis for the adoption of a
suite of prevention and mitigation measures having become routine in the oil and gas industry.
Shell will include the following measures for the Goldeneye decommissioning programme.
4.7.1.4. Ship to ship fuel transfer No offshore refuelling will be undertaken for any vessels engaged in the recovery of Goldeneye
installation and infrastructure, the burying of the pipeline, or for the seabed remediation and
surveying activities.
MITIGATION MEASURES, SAFEGUARDS AND CONTROLS
▪ Avoidance of collision:
Notification of decommissioning activities via publication of Notices to Mariners detailing rig and vessel positions, activities and timing and by full navigation lighting on the vessels.
▪ Sea worthiness of vessels:
All vessels to be used will be subject to Shell’s Maritime Assurance System. This includes assurance in line with the Oil Companies International Marine Forum (OCIMF) inspection (OVIQ2) and review of the Maritime Contractor Offshore Vessel Managers Self-Assessment (OVMSA). The review includes (inter alia) consideration of reliability and maintenance standards, navigational safety and emergency preparedness and contingency planning.
▪ Spill Response:
All vessels will have relevant and current Shipboard Oil Pollution Emergency Plans (SOPEP) which are regularly reviewed with vessel crew.
Co-ordinated industry oil spill response capability will be available round the clock.
4.7.2. Dropped objects The potential for impacts from dropped objects during lifting were considered for examples of
small objects, such as grout bags, and large, such as the topsides or jacket.
Small objects would cause disturbance to a very small area of the seabed and would be recovered.
If the topsides or jacket dropped during lifting or from the lift vessel or barge while in transit,
there would be an immediate impact on the seabed and could also present a source of
Goldeneye Decommissioning Environmental Appraisal Report Revision: A02
Page 96 of 126
Doc. no. GDP-PT-S-HE-0702-00003
contamination. Although, it is anticipated that the object would be recovered, depending on the
reason for the original lifting failure, recovery may not be feasible and the dropped object would
then present a risk to other users of the sea.
The significance of the hazard caused would in part depend on the location of the incident. This
may be during the initial lift at the Goldeneye location, during transit or at the receiving port.
Depending on the port selected, there may also be a need for transferring the structures onto a
shallow water vessel at a nearshore location close to the port.
At Goldeneye, the impact of disturbance of the seabed would not be significant, and as the topsides
has been drained of all liquids there would be minimal potential for contamination. Any part of
the structure needing to be left where it fell would present a hazard for snagging of fishing gear
and would likely require a safety zone to be established as for derogated installation footings.
The scale of impact would be higher if the incident were to occur within a designated conservation
area, in a shipping lane, at the receiving port or in an area of high fishing activity.
Shell will minimise the likelihood of a lifting failure through inclusion of the following measures.
MITIGATION MEASURES, SAFEGUARDS AND CONTROLS
▪ Each lifting operation will be managed in accordance with a lift plan that will include:
• confirmation of the structural integrity of structure and its lifting points;
• centre of gravity calculation;
• specification of the sizing of crane and vessel;
• specification of weather and sea state; and
• the duration of the weather window required.
▪ Marine transport of major structures will be managed in accordance with a transit plan that will:
• stipulate the towing and support vessels required;
• stipulate the route to be followed;
• identify sheltered locations along the route which can be used to shelter from storms; and
• detail emergency response procedures.
4.7.3. Liquid discharges
4.7.3.1. Trapped liquids The production facilities on Goldeneye were limited, and these have been flushed and cleaned. All
residual fluids on the topsides (such as hydraulic and lubrication fluids) were drained down prior
to the installation achieving PUI mode in 2018.
However, Shell understands that there is a precedent decommissioning project where unexpected
discharges of liquids occurred when lifting the topsides from the jacket. It is understood that this
was due to entrained liquids in piping deadlegs which proved to have been inaccessible to the
flushing and cleaning programme. The level of impact that this would cause on Goldeneye would
be dependent on the nature of any such liquids.
Goldeneye Decommissioning Environmental Appraisal Report Revision: A02
Page 97 of 126
Doc. no. GDP-PT-S-HE-0702-00003
To minimise the potential for such a discharge, the pipework on Goldeneye will be reviewed to
identify any potential deadlegs and ensure they are cleaned (potentially including cutting of
pipework) before lifting of the topsides.
4.7.3.2. Hose rupture There is the potential for accidental releases of hydraulic fluids, particularly from ROVs and lifting
equipment, in the event of a hydraulic hose rupture. The risk of hydraulic fluid releases is managed
through standard maintenance and inspection of hoses on all relevant vessels and for the efficacy
of the maintenance regime to be tested during vessel audits. These measures will be included within
the Environment, Social and Health Management Plan.
4.8. Socio-economic Effects The socio-economic effects considered in the ENVID related to impacts on the fishing industry
and the potential re-use of the export pipeline for a future CCS project.
4.8.1. Pipeline integrity The re-use of the pipelines would provide a socioeconomic benefit, which would be compromised
if the pipeline was damaged during execution of the DP activities. The principal risk identified was
from damage to the pipeline upstream end from dropped objects, and only the jacket itself would
have sufficient mass to risk the integrity of the pipeline. The junction between the pipeline and
connecting spools lies approximately 100 m from the platform, and therefore could potentially be
impacted by the jacket if it were to topple in that direction. Measures presented in Section 4.7.2
will minimise the likelihood of damage to the pipeline.
4.8.2. Impact on fishing industry The Goldeneye decommissioning has the potential to impact on fishing through the following
mechanisms:
• Restriction of activity;
• Loss of productivity; and
• Risk of snagging.
These have been discussed in the preceding sub-sections under Natural Capital and under
Accidental Events and a summary only is presented here.
4.8.2.1. Restriction of activity Most of the decommissioning activity will take place within the Goldeneye 500 m safety zone and
will therefore not impede fishing. The number of vessels transiting to/from the zone has been
seen to be less than 2% of the baseline vessel density at the platform, and considerably less than
this closer to shore. Mitigation measures are registered for addressing the extended period
(estimated 48 days) that the trenching support vessel will be operating along the pipeline route.
4.8.2.2. Loss of productivity Areas of rock cover will have lower potential to support commercial fish species resulting in a
minor negative impact. Conversely, decommissioning will result in the re-opening of the
Goldeneye 500 m safety zone to fishing, resulting in a minor positive impact. Overall this is
expected to result in a small net increase in fishing productivity.
Goldeneye Decommissioning Environmental Appraisal Report Revision: A02
Page 98 of 126
Doc. no. GDP-PT-S-HE-0702-00003
4.8.2.3. Risk of snagging The decommissioning will result in a clear seabed, with only the buried pipelines remaining in situ.
The majority of the pipeline will be buried to a depth of 0.6 m with natural fill enhanced as
necessary with additional rock cover. The area traversed by the pipeline has a dynamic seabed, as
evidenced by mega-ripples observed in surveys along various pipeline routes. Shell will remain
responsible for maintaining the safe status of the pipeline, and future remedial action will be
informed by surveys of pipeline depth. Remediation planning will include liaison with SFF, SNH,
MS and BEIS and will balance risk of snagging with a desire to maintain the seabed in as natural a
state as possible.
This will be first evaluated following trenching and burial of the export pipeline by the post-
decommissioning survey.
4.9. Transboundary Impacts The main potential for transboundary impacts into Norwegian waters would arise from
atmospheric emissions and accidental events leading to an offshore spill during vessel activities.
The UK/Norway median line is c. 110 km east of Goldeneye and therefore any emissions resulting
from the decommissioning activities would not be measurable at the median line. Similarly, the
inventory of fuels carried by any of the vessels during operations would not create a spill sufficient
to reach the UK/Norway boundary, even in the unlikely event that the entire inventory is lost to
sea.
If the recovered materials were to be sent to a decommissioning yard outside the UK, Shell will
require equivalent standards of waste handling and disposal as for UK yards and will ensure that
any contracted yard has appropriate experience, capability and holds all relevant licences and
permits required of the local regulatory regime.
4.10. Cumulative Impacts The outer Moray Firth is a mature oil and gas exploration and production area, with a number of
facilities in late life operations and scheduled for decommissioning in the coming decade.
The nearest developments to Goldeneye are the subsea infrastructure of the Ettrick and the A&C
fields. At 15 km from Goldeneye, these are too distant to directly affect the habitat and ecology in
the Goldeneye Fields. Given the very limited environmental impact associated with the Goldeneye
decommissioning, there is little potential for these to provide an increase to the impacts identified
for decommissioning of these neighbouring fields, even if they were undertaken concurrently.
Numerous pipelines from offshore installations are routed to the St. Fergus facility. Some run
close together and cross each other. Leaving the nearshore section of the Goldeneye pipelines
buried in the seabed avoids the need to work over third party oil and gas pipelines in this area and
also minimises the potential cumulative impact of repeatedly disturbing the ‘circalittoral mixed
sediment’ habitat.
The scale of North Sea decommissioning activity envisaged over the coming decade will create a
demand for onshore decommissioning yards. This will create employment to construct and
operate coastal facilities where structures and materials from offshore assets can be dismantled.
The Goldeneye decommissioning project is not large enough to influence the development or
location of a new onshore decommissioning yard. Operators of onshore decommissioning yards
rightly consider the structures and materials from Goldeneye would make only a small contribution
to their operation.

Goldeneye Decommissioning Environmental Appraisal Report Revision: A02
Page 99 of 126
Doc. no. GDP-PT-S-HE-0702-00003
The Goldeneye decommissioning project will contribute temporarily to the onshore
decommissioning contractor’s operational issues around noise, traffic and light pollution, but the
scale and duration of this contribution will be very limited.

Goldeneye Decommissioning Environmental Appraisal Report Revision: A02
Page 100 of 126
Doc. no. GDP-PT-S-HE-0702-00003
This page intentionally left blank
Goldeneye Decommissioning Environmental Appraisal Report Revision: A02
Page 101 of 126
Doc. no. GDP-PT-S-HE-0702-00003
5. Conclusions This EA confirms that the DP can be executed with minimal impact on the environment. The
baseline environment in the affected area is well understood, the potential for impact from the
decommissioning activities are known and Shell procedures include robust, well established
control measures to reduce the potential for impacts to develop and mitigation of those that are
unavoidable.
The development of the decommissioning programmes for the Goldeneye field has been informed
by ongoing appraisal of the environmental impacts and risks posed by options under consideration.
The environmental appraisal has been based on an understanding of the baseline environment
established from multiple web-based sources and seabed surveys. Comparative Assessment
established that the most appropriate decommissioning option for the two Goldeneye pipelines
was for both to be decommissioned in situ below the seabed. This requires the trenching and burial
of the export pipeline where it is currently laid on the seabed, approximately 5 km of which lies
within the Southern Trench pMPA.
Comprehensive identification of potential impacts from the proposed DP was achieved through
ENVID, the output of which was used to scope the requirements for further detailed impact
assessment.
The ENVID identified no planned activities that would give rise to impacts of High significance
rating. Four aspects were provisionally assigned conservative ratings of Moderate impact, due to
the potential for impacts within the Southern Trench pMPA. On further examination, the impact
of each of these aspects was re-evaluated as being Minor. Justification for the revised assessments
are provided within this report and are summarised as:
• Sources of underwater noise generated within the Southern Trench pMPA would not give rise to injury of minke whale or bottlenose dolphin. Any disturbance to these cetaceans would be limited to very few individuals, would continue for less than 5 days, on two separate occasions, and may result in their temporary movement to alternative grounds for these durations.
• Disturbance of the seabed within the pMPA, from trenching or rock cover, would not impact areas of burrowed mud habitat for which the conservation area is proposed, nor to the Annex I habitat of biogenic reefs. Neither of these features occur within the part of the pMPA effected by the decommissioning works.
It was recognised that there is a remote possibility for a major impact to result from an accidental
release of fuel from a vessel operating near shore.
Activity-specific mitigation measures will be planned and managed to avoid adverse environmental
and social impacts and, where avoidance is not possible, ensure potential impacts are minimised
to a level that is as low as reasonably practicable. This includes management of contractors
commissioned to carry out the decommissioning activities, and monitoring and auditing contractor
performance during the execution of the work. Agreed mitigation controls, regulatory
requirements as well as Shell’s standard requirements will be included as terms and conditions in
the contract and the measures to be adopted. Monitoring measures required to ensure compliance
will form part of the contractors’ decommissioning plans and procedures to be approved by Shell
prior to mobilisation. Shell will carry out pre-mobilisation audits to assure that effective planning
and operational procedures are in place and that all vessels comply with International Maritime
Organisation requirements, including MARPOL requirements with regard to emissions,
discharges, waste management and collision avoidance.
Goldeneye Decommissioning Environmental Appraisal Report Revision: A02
Page 102 of 126
Doc. no. GDP-PT-S-HE-0702-00003
Mitigation controls have been identified for implementation to ensure that risks to other users of
the sea have been reduced to as low as reasonably practicable by implementing routine ship
navigation and notification measures. Where rock cover is placed on the seabed, grades will be
used that avoid hazards to fishing gear and over-trawl trials will assure that the rock cover does
not present a hazard to fishing.
Goldeneye Decommissioning Environmental Appraisal Report Revision: A02
Page 103 of 126
Doc. no. GDP-PT-S-HE-0702-00003
6. References Anatec. (2013). Peterhead Power Station Carbon Capture and Storage Project. Marine Risk
Comparative Assessment of Pipeline Route Options. s.l.: Anatec Ref A3073-SH-CCS-TN-1.
Andrews, I. J., Long, D., Richards, P. C., Thomson, A. R., Brown, S., Chesher, J. A., and
McCormac, M. (1990). United Kingdom Offshore Regional Report: the Geology of the Moray
Firth. London, HMSO, for the British Geological Survey.
Anthony, T.G., Wright, N.A. and Evans, M.A. (2009). Review of diver noise exposure.
Barlow, J. and Gentry, R. (2004). Report of the NOAA Workshop on Anthropogenic Sound and
Marine Mammals. 26, National Oceanic and Atmospheric Administration.
BEIS (2017). Guidance Notes (Draft): Decommissioning of Offshore Oil and Gas Installations
and Pipelines. (Section 12 on Environment Considerations published for consultation in 2018).
BG (2016). Atlantic and Cromarty Decommissioning Environmental Impact Assessment.
Document number AC-ACD-HS-RE-3018
BMTCordah (2011). Management of Marine Growth During Decommissioning. Published within
Oil & Gas UK (2013) Management of Marine Growth During Decommissioning. ISBN 1 903 004
15 2
British Oceanographic Data Centre (BODC) (1998). United Kingdom Digital Marine Atlas. (Third
Edition). Birkenhead.
Bussmann, I., Dando, P.R., Niven S.J. and Suess, E., (1999). Groundwater Seepage in the Marine
Environment: Role for Mass Flux and Bacterial Activity. Marine Ecology Progress Series, 178,
169-177.
Calesurvey (2009). Ettrick. UKCS Block 20/2a ad 20/3a. Habitat Assessment Survey (HAS)
Report.
Carter, L. (2010). Submarine Cables and the Oceans: Connecting the World. UNEP-WCMC
Biodiversity Series.
Caspar, B. M. and Mann, D. A. (2006). Evoked potential audiograms of the nurse shark
(Ginglymostoma cirratum) and the yellow stingray (Urobatis jamaicensis). Environmental Biology of
Fishes 76: 101-108
Casper, B. M., Lobel, P. S. and Yan, H. Y. (2002). The hearing sensitivity of the little skate, Raja
erinacea: A comparison of two methods. Environmental Biology of Fishes. 68: 371-379
Central Dredging Association (CEDA). (2011). CEDA Position Paper: Underwater Sound in
Relation to Dredging. Available at: http://www.dredging.org/
documents/ceda/html_page/2011-11_ceda_positionpaper_underwatersound_v2.pdf
Centrica (2017). A-Fields Decommissioning Saturn (Annabel) and Audrey Fields Environmental
Impact Assessment. Document number CEU-DCM-SNS0096-REP-0009
Certain, G., Jørgensen, L.L., Christel, I., Planque, B. and Bretagnolle, V. (2015). Mapping the
vulnerability of animal community to pressure in marine systems: disentangling pressure types and
integrating their impact from the individual to the community level. ICES Journal of Marine
Science 75: 1470-1482.
Chapman, C. J. and Sand, O. (1974). Field studies of hearing in two species of flatfish Pleuronectes
Platessa (L.) and Limanda limanda (L.) (family Pleuronectidae). Comparative Biochemistry
Physiology. 47: 371-385.
Goldeneye Decommissioning Environmental Appraisal Report Revision: A02
Page 104 of 126
Doc. no. GDP-PT-S-HE-0702-00003
CMACS (Conservation of Marine and Coastal Studies) (2014). Peterhead Carbon Capture and
Storage benthic environmental survey field report (2013 Survey). Report to OSIRIS Projects, s.l.:
CMACS Ref: J3240 Osiris (Peterhead).
CNR International (2013). Murchison Facilities Decommissioning Environmental Statement.
MURDECOM-BMT-EN-REP-00198.
Colebrook, J.M. (1982). Continuous Plankton Records seasonal variations in the distribution and
abundance of plankton in the North Atlantic Ocean and the North Sea. Journal of Plankton
Research 4: 435-462.
Collie, J.S., Hall, S.J., Kaiser, M.J., and Poiner, I.R. (2000). A quantitative analysis of fishing impacts
on shelf-sea benthos. Journal of Animal Ecology. 69: 785-799.
Coull, K.A., Johnstone, R. and Rogers, S.I. (1998). Fisheries Sensitivity Maps in British Waters.
UKOOA Ltd.
Danson, E. (2005). Geotechnical and geophysical investigations for offshore and nearshore
developments. Written and produced by Technical Committee 1, International Society for Soil
Mechanics and Geotechnical Engineering, September 2005.
DECC (Department of Energy and Climate Change) (2011). Guidance Notes: Decommissioning
of Offshore Oil and Gas Installations and Pipelines under the Petroleum Act 1998. S.l. Version 6.
DECC (now BEIS) (2016). Offshore Energy Strategic Environmental Assessment 3 (OESEA3).
Available at: https://www.gov.uk/government/consultations/ukoffshore‐energy‐strategic‐environmental‐assessment‐3‐oesea3 [Accessed Jan 2018]
de Groot, S. J. (1979). An assessment of the potential environmental impact of large -scale sand-
dredging for the building of artificial islands in the North Sea. Ocean Management, 5: 211-32.
de Groot, S. J. (1986). Marine sand and gravel extraction in the North Atlantic and its potential
environmental impact, with emphasis on the North Sea. Ocean Management, 10: 21-36.
de Jong, C. A. F., Ainslie, M. A., Dreschler, J., Jansen, E., Heemskerk, E. and Groen, W. (2010).
Underwater noise of Trailing Suction Hopper Dredgers at Maasvlakte 2: Analysis of source levels
and background noise – TNO-DV 2010 C335.
Dernie, K.M., Kaiser, M.J. and Warwick, R.M. (2003). Recovery rates of benthic communities
following physical disturbance. Journal of Animal Ecology 72(6):1043-1056
DTI (UK Department of Trade and Industry) (2001). Technical Report (TR 001) produced for
Strategic Environmental Assessment – SEA2. A Review of Pockmarks in the UK Part of the
North Sea, With Particular Respect to Their Biology (P.R. Dando).
Ellis, J., Milligan S., Readdy, L., Taylor, N. and Brown, M. (2012). Spawning and nursery grounds
of selected fish Species in UK water. CEFAS Technical Report 147.
EMODnet (accessed 2017). European Seabed Habitat Maps. Available at: http://www.emodnet-
seabedhabitats.eu.
Enger, P. (1967). Hearing in herring. Comparative Biochemistry Physiology. 22:527-538
Fugro (2001). Pipeline Route Survey Goldeneye to St. Fergus. Shell Expro Report No.
GOL/25/SH/0014
Fugro (2010). Environmental Survey, UKCS Block 14/29 & 20/4, Goldeneye Field. Fugro
Reference Number 0076.8V1.1.
Fugro (2014). Rig Site Survey Buzzard UKCS Blocks 20/1 and 20/6. DC Option 1 and 2 Buzzard.
Fugro Reference Number 140398.1V4.1. Regional Environmental Survey.
Goldeneye Decommissioning Environmental Appraisal Report Revision: A02
Page 105 of 126
Doc. no. GDP-PT-S-HE-0702-00003
Fugro (2016a). Environmental Survey, UKCS Block 14/29 & 20/4, Goldeneye Field. Fugro
Reference Number 0076.8V1.1. Volume 6 of 7 Habitat Assessment.
Fugro (2016b). Atlantic and Cromarty Fields Pre-Decommissioning Survey. Fugro Reference
Number 150021V7.1. Volume 7 of 8 Environmental Baseline Survey.
Gardline (2010). Regional Mapping Project Over Golden Eagle, Blackbird, Ettrick and Buzzard
Fields April 2010 Environmental Baseline Report. Report Reference Number 8364.3
Gatliff, R.R. (1994). United Kingdon Offshore Regional Report: The Geology of the Central
North Sea. British Geographical Survey. HMSO.
Genesis. (2011). Review and Assessment of Underwater Sound Produced from Oil and Gas Sound
Activities and Potential Reporting Requirements under the Marine Strategy Framework Directive.
2011. Genesis Oil and Gas Consultants report for the Department of Energy and Climate Change.
Halvorsen, M.B., Zeddies, D.G., Ellison, W.T. Chicoine, D.R. and Popper, A.N. (2012). Effects
of mid-frequency active sonar on hearing in fish. Journal of the Acoustical Society of America,
vol. 131, no. 1, pp. 599 – 607.
Hammond, P. S., Lacey, C., Gilles, A., Viquerat, S., Börjesson, P., Herr, H., Macleod, K., Ridoux,
V., Santos, M. B., Scheidat, M., Teilmann, J., Vingada, J., Øien, N. (2017). Estimates of cetacean
abundance in European Atlantic waters in summer 2016 from the SCAN‐III aerial and shipboard
surveys. Available at: https://synergy.st‐ andrews.ac.uk/scans3/category/researchoutput/
[Accessed 02/18]
Hannay D., MacGillivray, A., Laurinolli, M. and Racca, R. (2004). Source level measurements from
2004 acoustics programme. Sakhalin Energy.
Hildebrand, J. A. (2009). Anthropogenic and natural sources of ambient noise in the ocean. Marine
Ecology Progress Series 395: 5-20.
Hitchcock, D.R., Newell, R.C. and Seiderer, L.J. (1998). Investigation of benthic and surface
plumes associated with marine aggregate mining in the United Kingdom – Final Report. Contract
Report for the U.S. Department of the Interior, Minerals Management Service. Contract Number
14-35-0001-30763. Coastline Surveys Ltd Ref. 98-555-03 (Final). 168pp.
Holmes, R. and Stoker, S. J. (2005). Investigation of the origin of shallow gas in Outer Moray Firth
open blocks 15/20c and 15/25d, Continental Shelf and Margins Programme British Geological
Survey; Report to DTI No. GC04/22.
IAMMWG (Inter‐Agency Marine Mammal Working Group) (2015). Management Units for
Cetaceans in UK Waters JNCC Report No. 547, Peterborough. Available at:
http://jncc.defra.gov.uk/pdf/Report_547_webv2.pdf [Accessed 02/18]
(ICES) International Council for the Exploration of the Seas (2005). Report of the ad-hoc group
on the impacts of sonar on cetaceans and fish (AGISC) (2nd Edition). ICES Advisory Committee
on Ecosystems. ICES CM 2005/ACE:06.
Institute of Petroleum (2000). Guidelines for the calculation of estimates of energy use and
gaseous emissions in the decommissioning of offshore structures. Institute of Petroleum.
London.
International Union for Conservation of Nature (IUCN) (accessed 2018). Red List of Threatened
Species. Available at: https://www.iucn.org/theme/species/our-work/iucn-red-list-threatened-
species [Accessed 02/18]
JNCC (1999). Habitat Action Plan for ‘Mud Habitats in Deep Water’ published in Volume 5
‘Maritime Species and Habitats’ of the UK Biodiversity Action Plan Tranche 2 Action Plans.
Available at http://jncc.defra.gov.uk/PDF/UKBAP_Tranche2-ActionPlans-Vol5-1999.pdf
Goldeneye Decommissioning Environmental Appraisal Report Revision: A02
Page 106 of 126
Doc. no. GDP-PT-S-HE-0702-00003
JNCC (2008). The deliberate disturbance of Marine European Species; Guidance for English and
Welsh territorial waters and the UK offshore marine area. JNCC.
JNCC (2010). The protection of marine EPS from injury and disturbance; Guidance for the marine
area in England and Wales and the UK offshore marine area. Advance final draft March 2010.
Report by the Joint Nature Conservation Committee, Countryside Council for Wales and Natural
England.
JNCC (2012). Priority Marine Features in Scottish offshore waters. Joint Nature Conservation
Committee
JNCC (2014a). Annex I Habitats Occurring in UK Offshore Waters. Available at:
http://jncc.defra.gov.uk/page‐ 1447 [Accessed 02/18]
JNCC (2014b). JNCC Clarifications on the habitat definitions of two habitat features of
conservation importance: mud habitats in deep water and sea pen and burrowing megafauna
communities. Available at:
http://jncc.defra.gov.uk/pdf/Advice_Document_MudHabitats_FOCIdefinitions_v1.0.pdf
[Accessed 02/18]
JNCC (2017). Guidelines for minimising the risk of injury to marine mammals from geophysical
surveys. Available at: http://jncc.defra.gov.uk/page‐ 1534 [Accessed 02/18]
JNCC (2018a). The UK Biodiversity Action Plan (BAP) Priority Fish Species. Available at:
http://jncc.defra.gov.uk/page‐ 1377 [Accessed 02/18]
JNCC (accessed 2018b). The Wildlife and Countryside Act 1981 Available at:
http://jncc.defra.gov.uk/page‐ 1377 [Accessed 02/18]
JNCC (2018c). Special Protected Areas (SPA) – UK. Available at: http://jncc.defra.gov.uk/page-
1400 [Accessed 02/18]
JNCC (2018d). Using the seabird Oil Sensitivity Index to inform contingency planning. Available
at: http://jncc.defra.gov.uk/page-7373 [Accessed 02/18]
Johnson, H.R. (1993). United Kingdom Offshore Regional Report: The geology of the Northern
North Sea. London: HMSO for British Geological Survey.
Jones, E., McConnell, B., Sparling, C. & Matthiopoulos, J. (2013). Grey and Harbour Seal Density
Maps. Sea Mammal Research Unit Report to Scottish Government. Marine Mammal Scientific
Support Research Programme MMSS.001/11.
Jørgensen R, Olsen KK, Falk-Pettersen I-B and Kanapthippilai P (2005). Investigation of potential
effects of low frequency sonar signals on survival, development and behaviour of fish larvae and
juveniles. Report from Norwegian College of Fishery Science.
Judd, A.G. (2001). Pockmarks in the UK sector of the North Sea, Technical report TR_002,
Technical report produced for Strategic Environmental Assessment – SEA2, DTI. University of
Sunderland.
Kafas, A., Jones, G., Watret, R., Davies, I. and Scott, B. (2012). Representation of the use of marine
space by commercial fisheries in marine spatial planning. ICES CM I:23.
Kastelein R. A., Bunskoek, P., Hagedoorn, M., Au, W. W. L. and de Haan, D. (2002). Audiogram
of a harbour porpoise (Phocoena phocoena) measured with a narrow-band frequency-modulated sign.
Journal of the Acoustical Society of America 112: 334
Kastelein, R. A., Wensveen, P., Hoek, L. and Terhune, J. M. (2009). Underwater hearing sensitivity
of harbour seals (Phoca vitulina) for narrow noise bands between 0.2 and 80 kHz. Journal of the
Acoustical Society of America.126: 476-483.
Goldeneye Decommissioning Environmental Appraisal Report Revision: A02
Page 107 of 126
Doc. no. GDP-PT-S-HE-0702-00003
King, S. L. (2013). Seismic survey licensing: sub-bottom profile surveys. SMRU Marine Ltd report
number SMRUL-DEC-2013-024. September 2013 (unpublished).
KIS-ORCA (2014). Offshore Renewable and Cables Awareness. [online] Available at:
http://www.kis-orca.eu/
Kober, K., Webb, A., Win, I., Lewis, M., O'Brien, S, Wilson, L.J, Reid, J.B. (2010), An analysis of
the numbers and distribution of seabirds within the British Fishery Limit aimed at identifying areas
that qualify as possible marine SPAs, JNCC Report 431, ISSN 0963‐8091. Available at:
http://jncc.defra.gov.uk/page‐ 5622 [Accessed 02/18]
Kvaldsheim, P.H. and E. M. Sevaldsen (2005). The potential impact of 1-8 kHz active sonar on
stocks of juvenile fish during sonar exercises. Forsvarets Forskningsinstitutt (Norwegian Defence
Research Establishment). FFA/RAPPORT-2005/01027.
Kyhn, L.A., Sveegaard, S. and Tougaard, J. (2014). Underwater noise emissions from a drillship in
the Arctic. Marine Pollution Bulletin, 86(1), pp.424-433.
Long, D. (1992) Devensian Late-glacial gas escape in the central North Sea. Continental Shelf
Research 12:1097–1110.
Maddock, A. (2008). UK Biodiversity Action Plan Priority Habitat Description UK Biodiversity Action Plan Priority Habitat descriptions. BRIG (ed. Ant Maddock) 2008 (updated 2011). Available from: http://jncc.defra.gov.uk/PDF/UKBAP_PriorityHabitatDesc-Rev2011.pdf
Maersk (2016). Janice, James and Affleck Fields Decommissioning EIA. Document number
COPD-JAN-000-EV-RE-0001
Marine Scotland (2014). The Protection of marine European Protected Species from injury and
disturbance. Guidance for Scottish Inshore Waters. Guidance prepared by the Scottish
Government in partnership with SNH. March 2014.
MMS (1999). Minerals Management Service. Marine Aggregate Mining Benthic & Surface Plume
Study. Final Report to the United States Department of the Interior, Minerals Management
Service & Plume Research Group.
Nachtigall, P. E., Mooney, T. A., Taylor, K. A., Miller, L. A., Rasmussen, M. H., Akamatsus, T.,
Teilmann, J., Linnenschmidt, M. and Vikingsson, G. A. (2008). Shipboard measurements of the
hearing of the white-beaked dolphin Lagenorhynchus albiostris. Journal of Experimental Biology.
211:642-647.
Nedwell, J. R. and Edwards, B. (2004). A review of measurements of underwater man-made noise
carried out by Subacoustech Ltd, 1993-2003. Subacoustech Report ref: 534R0109. 29 September
2004.
Newell, R.C., Seiderer, L.J. and Hitchcock, D.R. (1998). The impact of dredging works in coastal
waters: a review of the sensitivity to disturbance and subsequent recovery of biological resources
on the sea bed. Oceanography and Marine Biology: an Annual Review, 36: 127-178.
Nexen (2014). Etrick & Blackbird Decommissioning Project – Environmental Baseline Survey
Strategy. Document reference ETRK0001-GE-O000-LC-STR-0005
Nexen (2016). Ettrick and Blackbird Decommissioning EIA. Document number ETRK0001-GE-
O000-LC-RPT-0006
NMFS (2016). Technical guidance for assessing the effects of anthropogenic sound on marine
mammal hearing: underwater acoustic thresholds for onset of permanent and temporary
threshold shifts. U.S. Dept. of Commer.,NOAA. NOAA Technical Memorandum NMFS-OPR-
55, 178 pp.
Goldeneye Decommissioning Environmental Appraisal Report Revision: A02
Page 108 of 126
Doc. no. GDP-PT-S-HE-0702-00003
Nicholls, P., Hewitt, J. and Haliday, J. (2003). Effects of Suspended Sediment Concentrations on
suspension and Deposit Feeding Marine Macrofauna. NIWA Client Report ARC03267.
Offutt, G. C. (1974). Structures for the detection of acoustic stimuli in the Atlantic codfish, Gadus
morhua. Journal of the Acoustical Society of America 56: 665-671.
Oil & Gas Authority (OGA). (2016). Other Regulatory Issues, version at 23rd August 2016.
Available at: https://www.ogauthority.co.uk/media/2213/other_regulatory_issues-230816.pdf
OGA (2017). Information on levels of shipping activity. Available from:
https://www.gov.uk/government/uploads/system/uploads/attachment_data/file/540506/29R
_Shipping_Density_Table.pdf.
OSPAR. (2004). OSPAR Guidelines for Monitoring the Environmental Impact of Offshore Oil
and Gas Activities. Reference Number 2004-11.
OSPAR. (2009). Overview of the impacts of anthropogenic underwater sound in the marine
environment. OSPAR Biodiversity Series.
OSPAR. (2010). The Quality Status Report 2010. OSPAR Commission. Available at:
http://qsr2010.ospar.org/en/ch01.html.
OSPAR (2013). Background document on Sabellaria spinulosa reefs. Accessed online at:
http://www.ospar.org/documents/dbase/publications/p00614/p00614_sabellaria.pdf on
30/06/14
OSPAR (accessed 2018). List of Threatened and/or Declining Species and Habitats. Online.
Available at: https://www.ospar.org/work‐ areas/bdc/species‐ habitats/list‐ of‐ threatened‐declining‐ specieshabitats [Accessed 02/18]
Pangerc, T., Robinson, S., Theobald, P. and Galley, L. (2016). Underwater sound measurement
data during diamond wire cutting: First description of radiated noise. In Proceedings of Meetings
on Acoustics 4ENAL (Vol. 27, No. 1, p.040012). ASA.
Popper, A.N. (2008). Effects of mid- and high-frequency sonars on fish. Environmental
BioAcoustics. Contract N66604-07M-6056. Naval Undersea Warfare Centre Division.
Popper, A. N., Hawkins, A. D., Fay, R. R., Mann, D., Bartol, S., Carlson, T., Coombs, S., Ellison,
W. T., Gentry, R., Halvorsen, M. B., Lokkeborg, S., Rogers, P., Southall, B. L., Zeddies, D. G.,
Tavolga, W. N. (2014). Sound Exposure Guidelines for Fishes and Sea Turtles: A Technical Report
by ANSI-Accredited Standards Committee S3/SCI and registered with ANSI. Springer Briefs in
Oceanography.
Reid, J.B., Evans, P.G and Northridge, S.P. (2003). Atlas of Cetacean distribution in north-west
European waters. JNCC.
Richardson, W.J., Greene, C.R., Jr, Malme, C.I. and Thomson, D.H. (1995). Marine Mammals and
Noise. Academic Press, San Diego. 576pp.
Ridgway, S. H. and Joyce, P. L. (1975). Studies on seal brain by radiotelemetry. ICES. 169: 81-91.
Robinson, G. (1970). Continuous Plankton Records: Variations in the Seasonal Cycle of
Phytoplankton in the North Atlantic. Bulletin of Marine Ecology. 6: 33-345.
Robinson, S. P., Theobald, P. D., Hayman, G., Wang, L. S., Lepper, P. A., Humphrey, V. and
Mumford, S. (2011). Measurement of noise arising from marine aggregate dredging operations.
Marine Aggregate Levy Sustainability Fund. Marine Environment Protection Fund Ref No MEPF
09/P108.
Rogers, S. & Stocks, R. (2001). North Sea Fish and Fisheries, Technical Report produced for
Streatgeic Environmental Assessment - SEA2: CEFAS.
Goldeneye Decommissioning Environmental Appraisal Report Revision: A02
Page 109 of 126
Doc. no. GDP-PT-S-HE-0702-00003
Rosenberg, R., S. Agrenius, B. Hellman, H. C. Nilsson, and K. Norling. (2002). Recovery of marine
benthic habitats and fauna in a Swedish fjord following improved oxygen conditions. Marine
Ecology Progress Series 234: 43-53.
Ross, D. (1976). Mechanics of underwater noise. Pergamon, New York. 375 pp.
SCAR (Scientific Committee on Antarctic Research) (2005) Risks posed to the Antarctic marine
environment by acoustic instruments: a structured analysis. Antarctic Science 17 (4). Antarctic
Science Ltd. 533-540.
Scottish Government National Marine Plan Interactive (NMPi) (2018). Available at:
https://marinescotland.atkinsgeospatial.com/nmpi/ [Accessed 02/18]
Scottish Government (2017). Fishing Effort and Quantity and Value of Landings by ICES
Rectangle. Available online at: http://www.gov.scot/Topics/Statistics/Browse/Agriculture‐
Fisheries/RectangleData [Accessed 02/18]
Shell (2014). Appendix E in Peterhead Carbon Capture and Storage Project Offshore
Environmental Statement. Document Reference D/4174/2014.
Slabbekoorn, H., Bouton, N., van Opzeeland, I., Coers, A., ten Cate, C. and Popper, A. N. (2010).
A noisy spring: the impact of globally rising underwater sound levels on fish. Trends in Ecology
and Evolution. 25(7): 419-427.
SMRU (Sea Mammal Research Unit) (2012). Grey and Harbour Seal Distribution Data. Sea
Mammal Research Unit 2012.
SNH (2014a). Scottish MPA Project Data Confidence Assessment Southern Trench MPA
Proposal. Available at:
https://www.nature.scot/sites/default/files/2017-11/Marine%20Protected%20Area%20-
%20Data%20confidence%20assessment%20-
%20Southern%20Trench%20MPA%20proposal.pdf
SNH (2014b). Priority Marine Features in Scotland’s Seas. Available at:
http://www.snh.gov.uk/docs/A1327320.pdf
Southall, B., Bowles, A., Ellison, W., Finneran, J., Gentry, R., Greene Jr., C., Kastak, D., Ketten,
D., Miller, J., Nachtigall, P., Richardson, W., Thomas, J. and Tyack, P. (2007). Marine Mammal
Noise Exposure Criteria: Initial Scientific recommendations. Aquatic Mammals. 33(4): 411-521.
Stevenson, A.G., Tait, B.A.R., Richardson, A.E., Smith, R.T., Nicholason, R.A. and Stewart, H.R.
(1995). The Geochemistry of Seabed Sediments of the United Kingdom Continental Shelf, The
North Sea, Hebrides and West Shetland Shelvesand the Malin-Hebrides Sea Area. British
Geological Surcey Technical Report WB/95, 28C.
Strobel, S. M. and Mooney, T. A. (2012). Detection of low-frequency tones and whale predator
sounds by the American sand lance Ammodytes americanus. Journal of Fish Biology.
doi:10.1111/j.1095-8649.2012.03423.x.
Tech Environmental. (2006). Final EIR underwater noise analysis. Report 5.3.2‐2. Cape Wind
Energy Project. Nantucket Sound. November 2006. Appendix 3.13‐B.
Thomsen, F., Lüdemann, K., Kafemann, R. and Piper, W. (2006). Effects of offshore wind farm
noise on marine mammals and fish. biola, Hamburg, Germany on behalf of COWRIE Ltd.
Tremel, D. P., Thomas, J. A., Ramirez, K. T., Dye, G. S., Bachman, W. A., Orban, A. N. and
Grimm, K. K. (1998). Underwater hearing sensitivity of a Pacific white-sided dolphin,
Lagenorhynchus obliquidens. Aquatic Mammals. 24: 63-69.
Goldeneye Decommissioning Environmental Appraisal Report Revision: A02
Page 110 of 126
Doc. no. GDP-PT-S-HE-0702-00003
Turnpenny, A. W. H. and Nedwell, J. R. (1994). The effects on marine fish, diving mammals and
birds of underwater sound generated by seismic surveys. Fawley Aquatic Research Laboratories
Ltd. Report Number: FCR 089/94. October 1994.
Tyler‐Walters, H., James, B., Carruthers, M. (eds.), Wilding, C., Durkin, O., Lacey, C., Philpott, E.,
Adams, L., Chaniotis, P.D., Wilkes, P.T.V., Seeley, R., Neilly, M., Dargie, J. & Crawford‐Avis, O.T.
(2016). Descriptions of Scottish Priority Marine Features (PMFs). Scottish Natural Heritage
Commissioned Report No. 406.
UKOOA. (2001). An analysis of U.K. offshore oil & gas environmental surveys. Study carried out
by Heriot-Watt University at the request of the UK Offshore Operators Association. September
2001.
Ulrick, R.J. (1983). Principles of Underwater Sound, 3rd Edition. New York: McGraw-Hill, 423pp.
Wales, S. C. and Heitmeyer, R. M. (2002). An ensemble source spectra model for merchant ship-
radiated noise. Journal of the Acoustical Society of America. 111: 1211-1231.
WIMPOL (1988). Miller Oil and gas Export Pipeline Route Geophysical Surveys (Offshore).
Volume 1. Date of survey August 1988.
World Organisation of Dredging Associations (WODA). (2013). Technical Guidance. Underwater
sound in relation to dredging.
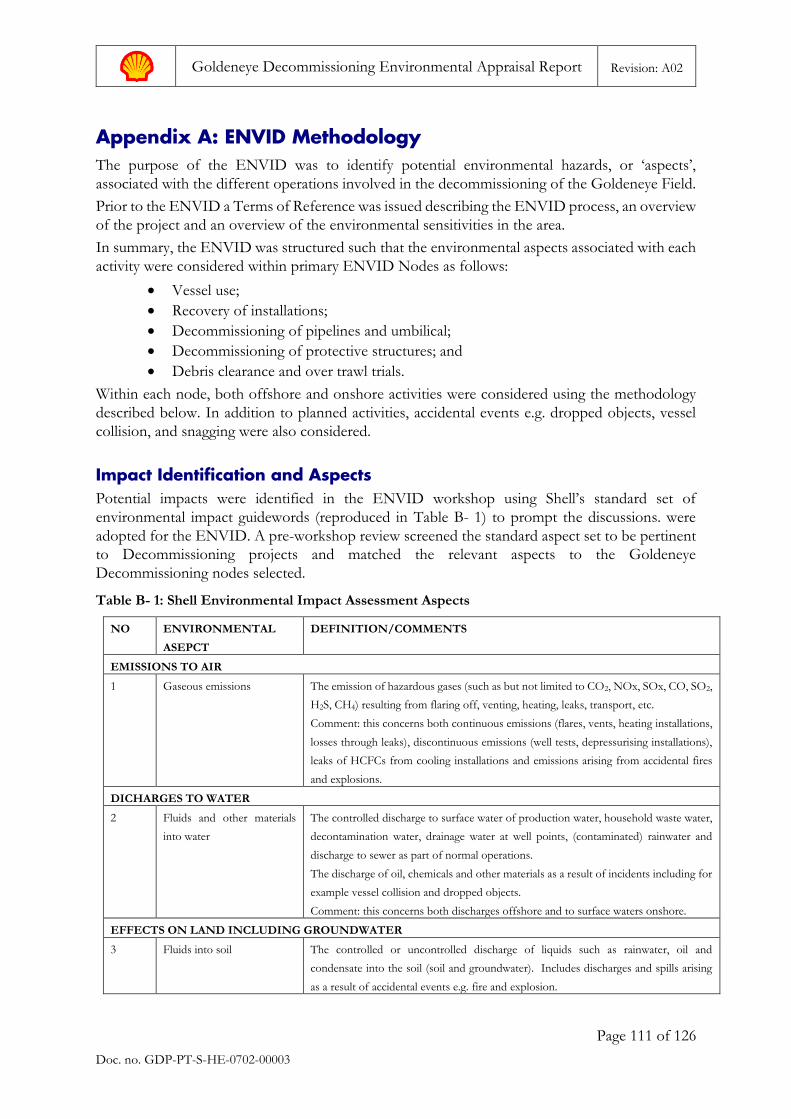
Goldeneye Decommissioning Environmental Appraisal Report Revision: A02
Page 111 of 126
Doc. no. GDP-PT-S-HE-0702-00003
Appendix A: ENVID Methodology The purpose of the ENVID was to identify potential environmental hazards, or ‘aspects’,
associated with the different operations involved in the decommissioning of the Goldeneye Field.
Prior to the ENVID a Terms of Reference was issued describing the ENVID process, an overview
of the project and an overview of the environmental sensitivities in the area.
In summary, the ENVID was structured such that the environmental aspects associated with each
activity were considered within primary ENVID Nodes as follows:
• Vessel use;
• Recovery of installations;
• Decommissioning of pipelines and umbilical;
• Decommissioning of protective structures; and
• Debris clearance and over trawl trials.
Within each node, both offshore and onshore activities were considered using the methodology
described below. In addition to planned activities, accidental events e.g. dropped objects, vessel
collision, and snagging were also considered.
Impact Identification and Aspects Potential impacts were identified in the ENVID workshop using Shell’s standard set of
environmental impact guidewords (reproduced in Table B- 1) to prompt the discussions. were
adopted for the ENVID. A pre-workshop review screened the standard aspect set to be pertinent
to Decommissioning projects and matched the relevant aspects to the Goldeneye
Decommissioning nodes selected.
Table B- 1: Shell Environmental Impact Assessment Aspects
NO ENVIRONMENTAL
ASEPCT
DEFINITION/COMMENTS
EMISSIONS TO AIR
1 Gaseous emissions The emission of hazardous gases (such as but not limited to CO2, NOx, SOx, CO, SO2,
H2S, CH4) resulting from flaring off, venting, heating, leaks, transport, etc.
Comment: this concerns both continuous emissions (flares, vents, heating installations,
losses through leaks), discontinuous emissions (well tests, depressurising installations),
leaks of HCFCs from cooling installations and emissions arising from accidental fires
and explosions.
DICHARGES TO WATER
2 Fluids and other materials
into water
The controlled discharge to surface water of production water, household waste water,
decontamination water, drainage water at well points, (contaminated) rainwater and
discharge to sewer as part of normal operations.
The discharge of oil, chemicals and other materials as a result of incidents including for
example vessel collision and dropped objects.
Comment: this concerns both discharges offshore and to surface waters onshore.
EFFECTS ON LAND INCLUDING GROUNDWATER
3 Fluids into soil The controlled or uncontrolled discharge of liquids such as rainwater, oil and
condensate into the soil (soil and groundwater). Includes discharges and spills arising
as a result of accidental events e.g. fire and explosion.
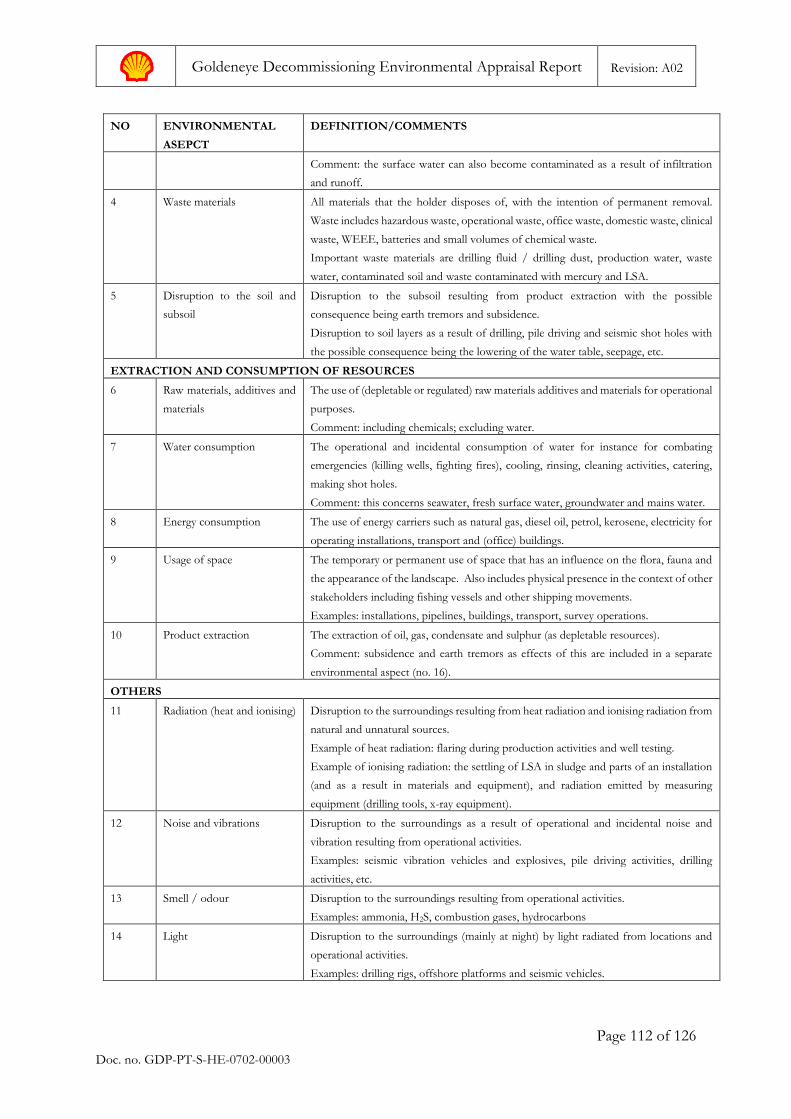
Goldeneye Decommissioning Environmental Appraisal Report Revision: A02
Page 112 of 126
Doc. no. GDP-PT-S-HE-0702-00003
NO ENVIRONMENTAL
ASEPCT
DEFINITION/COMMENTS
Comment: the surface water can also become contaminated as a result of infiltration
and runoff.
4 Waste materials All materials that the holder disposes of, with the intention of permanent removal.
Waste includes hazardous waste, operational waste, office waste, domestic waste, clinical
waste, WEEE, batteries and small volumes of chemical waste.
Important waste materials are drilling fluid / drilling dust, production water, waste
water, contaminated soil and waste contaminated with mercury and LSA.
5 Disruption to the soil and
subsoil
Disruption to the subsoil resulting from product extraction with the possible
consequence being earth tremors and subsidence.
Disruption to soil layers as a result of drilling, pile driving and seismic shot holes with
the possible consequence being the lowering of the water table, seepage, etc.
EXTRACTION AND CONSUMPTION OF RESOURCES
6 Raw materials, additives and
materials
The use of (depletable or regulated) raw materials additives and materials for operational
purposes.
Comment: including chemicals; excluding water.
7 Water consumption The operational and incidental consumption of water for instance for combating
emergencies (killing wells, fighting fires), cooling, rinsing, cleaning activities, catering,
making shot holes.
Comment: this concerns seawater, fresh surface water, groundwater and mains water.
8 Energy consumption The use of energy carriers such as natural gas, diesel oil, petrol, kerosene, electricity for
operating installations, transport and (office) buildings.
9 Usage of space The temporary or permanent use of space that has an influence on the flora, fauna and
the appearance of the landscape. Also includes physical presence in the context of other
stakeholders including fishing vessels and other shipping movements.
Examples: installations, pipelines, buildings, transport, survey operations.
10 Product extraction The extraction of oil, gas, condensate and sulphur (as depletable resources).
Comment: subsidence and earth tremors as effects of this are included in a separate
environmental aspect (no. 16).
OTHERS
11 Radiation (heat and ionising) Disruption to the surroundings resulting from heat radiation and ionising radiation from
natural and unnatural sources.
Example of heat radiation: flaring during production activities and well testing.
Example of ionising radiation: the settling of LSA in sludge and parts of an installation
(and as a result in materials and equipment), and radiation emitted by measuring
equipment (drilling tools, x-ray equipment).
12 Noise and vibrations Disruption to the surroundings as a result of operational and incidental noise and
vibration resulting from operational activities.
Examples: seismic vibration vehicles and explosives, pile driving activities, drilling
activities, etc.
13 Smell / odour Disruption to the surroundings resulting from operational activities.
Examples: ammonia, H2S, combustion gases, hydrocarbons
14 Light Disruption to the surroundings (mainly at night) by light radiated from locations and
operational activities.
Examples: drilling rigs, offshore platforms and seismic vehicles.
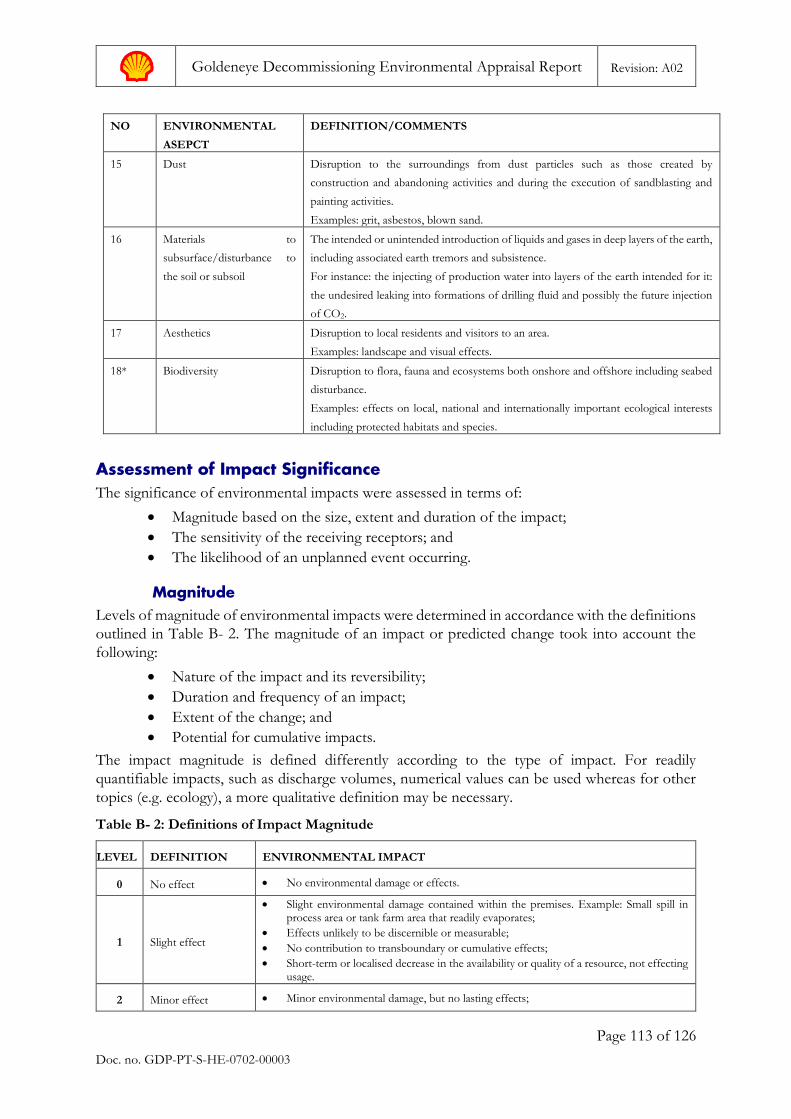
Goldeneye Decommissioning Environmental Appraisal Report Revision: A02
Page 113 of 126
Doc. no. GDP-PT-S-HE-0702-00003
NO ENVIRONMENTAL
ASEPCT
DEFINITION/COMMENTS
15 Dust Disruption to the surroundings from dust particles such as those created by
construction and abandoning activities and during the execution of sandblasting and
painting activities.
Examples: grit, asbestos, blown sand.
16 Materials to
subsurface/disturbance to
the soil or subsoil
The intended or unintended introduction of liquids and gases in deep layers of the earth,
including associated earth tremors and subsistence.
For instance: the injecting of production water into layers of the earth intended for it:
the undesired leaking into formations of drilling fluid and possibly the future injection
of CO2.
17 Aesthetics Disruption to local residents and visitors to an area.
Examples: landscape and visual effects.
18* Biodiversity Disruption to flora, fauna and ecosystems both onshore and offshore including seabed
disturbance.
Examples: effects on local, national and internationally important ecological interests
including protected habitats and species.
Assessment of Impact Significance The significance of environmental impacts were assessed in terms of:
• Magnitude based on the size, extent and duration of the impact;
• The sensitivity of the receiving receptors; and
• The likelihood of an unplanned event occurring.
Magnitude
Levels of magnitude of environmental impacts were determined in accordance with the definitions
outlined in Table B- 2. The magnitude of an impact or predicted change took into account the
following:
• Nature of the impact and its reversibility;
• Duration and frequency of an impact;
• Extent of the change; and
• Potential for cumulative impacts.
The impact magnitude is defined differently according to the type of impact. For readily
quantifiable impacts, such as discharge volumes, numerical values can be used whereas for other
topics (e.g. ecology), a more qualitative definition may be necessary.
Table B- 2: Definitions of Impact Magnitude
LEVEL DEFINITION ENVIRONMENTAL IMPACT
0 No effect • No environmental damage or effects.
1 Slight effect
• Slight environmental damage contained within the premises. Example: Small spill in process area or tank farm area that readily evaporates;
• Effects unlikely to be discernible or measurable;
• No contribution to transboundary or cumulative effects;
• Short-term or localised decrease in the availability or quality of a resource, not effecting usage.
2 Minor effect • Minor environmental damage, but no lasting effects;
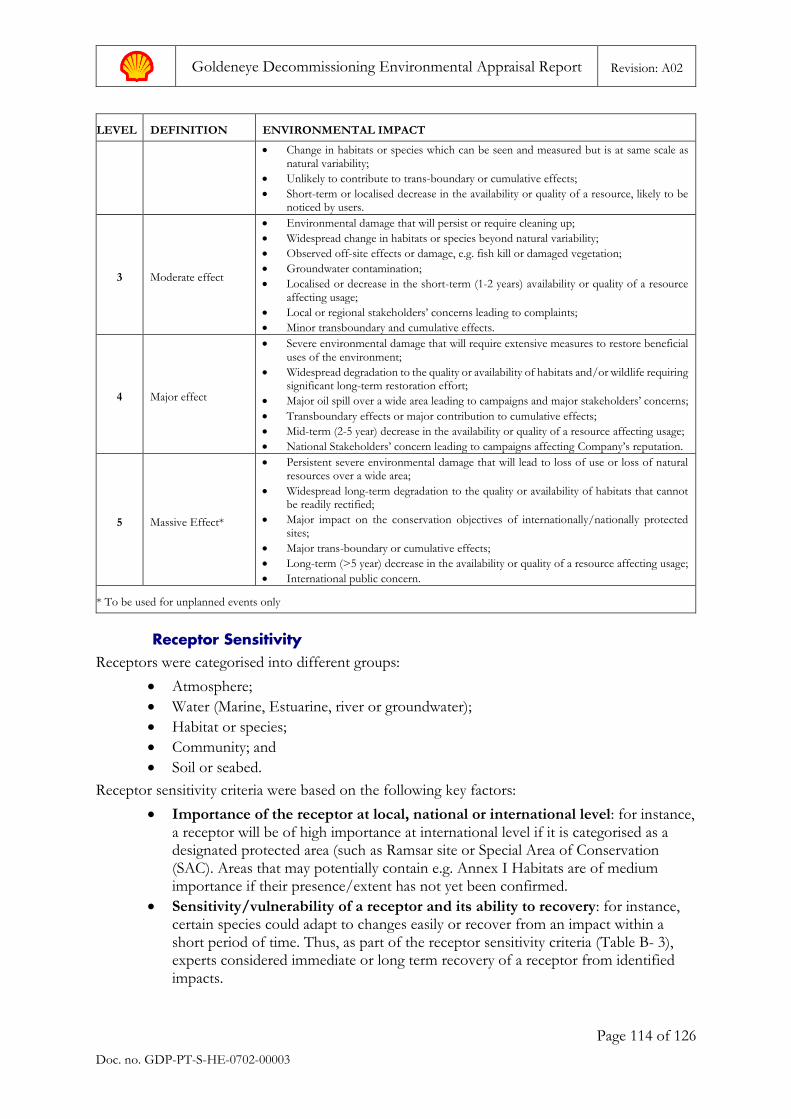
Goldeneye Decommissioning Environmental Appraisal Report Revision: A02
Page 114 of 126
Doc. no. GDP-PT-S-HE-0702-00003
LEVEL DEFINITION ENVIRONMENTAL IMPACT
• Change in habitats or species which can be seen and measured but is at same scale as natural variability;
• Unlikely to contribute to trans-boundary or cumulative effects;
• Short-term or localised decrease in the availability or quality of a resource, likely to be noticed by users.
3 Moderate effect
• Environmental damage that will persist or require cleaning up;
• Widespread change in habitats or species beyond natural variability;
• Observed off-site effects or damage, e.g. fish kill or damaged vegetation;
• Groundwater contamination;
• Localised or decrease in the short-term (1-2 years) availability or quality of a resource affecting usage;
• Local or regional stakeholders’ concerns leading to complaints;
• Minor transboundary and cumulative effects.
4 Major effect
• Severe environmental damage that will require extensive measures to restore beneficial uses of the environment;
• Widespread degradation to the quality or availability of habitats and/or wildlife requiring significant long-term restoration effort;
• Major oil spill over a wide area leading to campaigns and major stakeholders’ concerns;
• Transboundary effects or major contribution to cumulative effects;
• Mid-term (2-5 year) decrease in the availability or quality of a resource affecting usage;
• National Stakeholders’ concern leading to campaigns affecting Company’s reputation.
5 Massive Effect*
• Persistent severe environmental damage that will lead to loss of use or loss of natural resources over a wide area;
• Widespread long-term degradation to the quality or availability of habitats that cannot be readily rectified;
• Major impact on the conservation objectives of internationally/nationally protected sites;
• Major trans-boundary or cumulative effects;
• Long-term (>5 year) decrease in the availability or quality of a resource affecting usage;
• International public concern.
* To be used for unplanned events only
Receptor Sensitivity Receptors were categorised into different groups:
• Atmosphere;
• Water (Marine, Estuarine, river or groundwater);
• Habitat or species;
• Community; and
• Soil or seabed.
Receptor sensitivity criteria were based on the following key factors:
• Importance of the receptor at local, national or international level: for instance, a receptor will be of high importance at international level if it is categorised as a designated protected area (such as Ramsar site or Special Area of Conservation (SAC). Areas that may potentially contain e.g. Annex I Habitats are of medium importance if their presence/extent has not yet been confirmed.
• Sensitivity/vulnerability of a receptor and its ability to recovery: for instance, certain species could adapt to changes easily or recover from an impact within a short period of time. Thus, as part of the receptor sensitivity criteria (Table B- 3), experts considered immediate or long term recovery of a receptor from identified impacts.
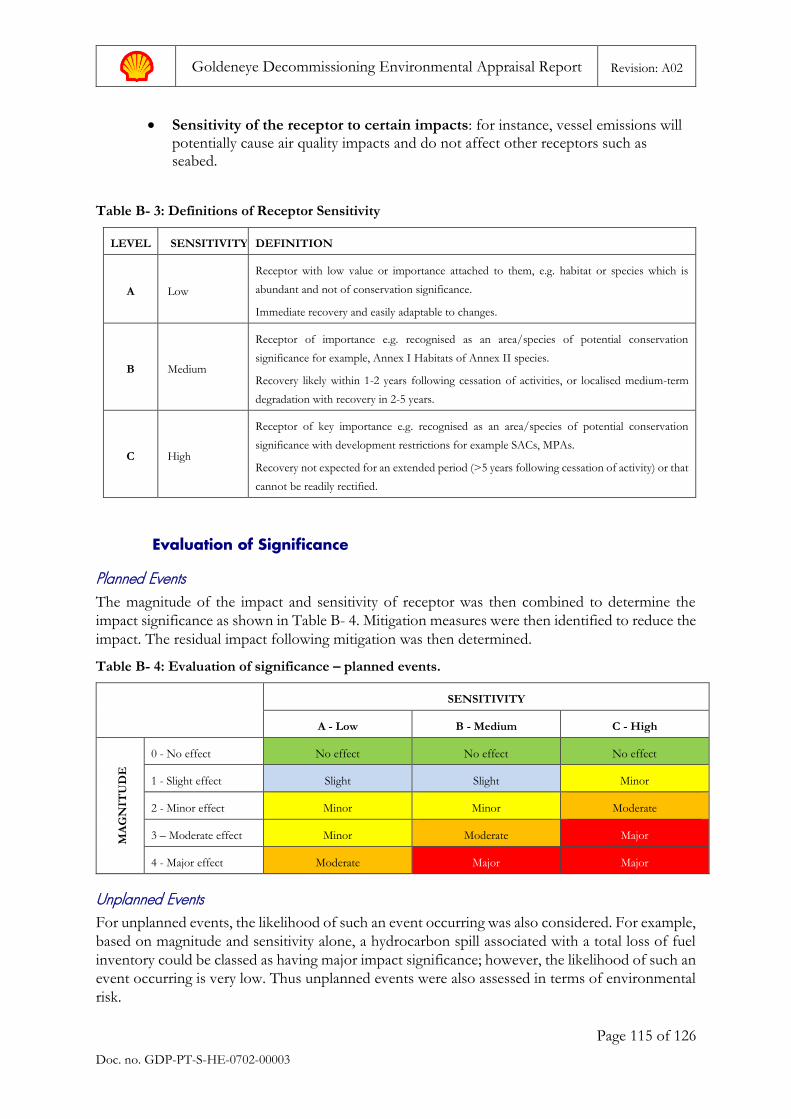
Goldeneye Decommissioning Environmental Appraisal Report Revision: A02
Page 115 of 126
Doc. no. GDP-PT-S-HE-0702-00003
• Sensitivity of the receptor to certain impacts: for instance, vessel emissions will potentially cause air quality impacts and do not affect other receptors such as seabed.
Table B- 3: Definitions of Receptor Sensitivity
LEVEL SENSITIVITY DEFINITION
A Low
Receptor with low value or importance attached to them, e.g. habitat or species which is
abundant and not of conservation significance.
Immediate recovery and easily adaptable to changes.
B Medium
Receptor of importance e.g. recognised as an area/species of potential conservation
significance for example, Annex I Habitats of Annex II species.
Recovery likely within 1-2 years following cessation of activities, or localised medium-term
degradation with recovery in 2-5 years.
C High
Receptor of key importance e.g. recognised as an area/species of potential conservation
significance with development restrictions for example SACs, MPAs.
Recovery not expected for an extended period (>5 years following cessation of activity) or that
cannot be readily rectified.
Evaluation of Significance
Planned Events The magnitude of the impact and sensitivity of receptor was then combined to determine the
impact significance as shown in Table B- 4. Mitigation measures were then identified to reduce the
impact. The residual impact following mitigation was then determined.
Table B- 4: Evaluation of significance – planned events.
SENSITIVITY
A - Low B - Medium C - High
MA
GN
ITU
DE
0 - No effect No effect No effect No effect
1 - Slight effect Slight Slight Minor
2 - Minor effect Minor Minor Moderate
3 – Moderate effect Minor Moderate Major
4 - Major effect Moderate Major Major
Unplanned Events For unplanned events, the likelihood of such an event occurring was also considered. For example,
based on magnitude and sensitivity alone, a hydrocarbon spill associated with a total loss of fuel
inventory could be classed as having major impact significance; however, the likelihood of such an
event occurring is very low. Thus unplanned events were also assessed in terms of environmental
risk.
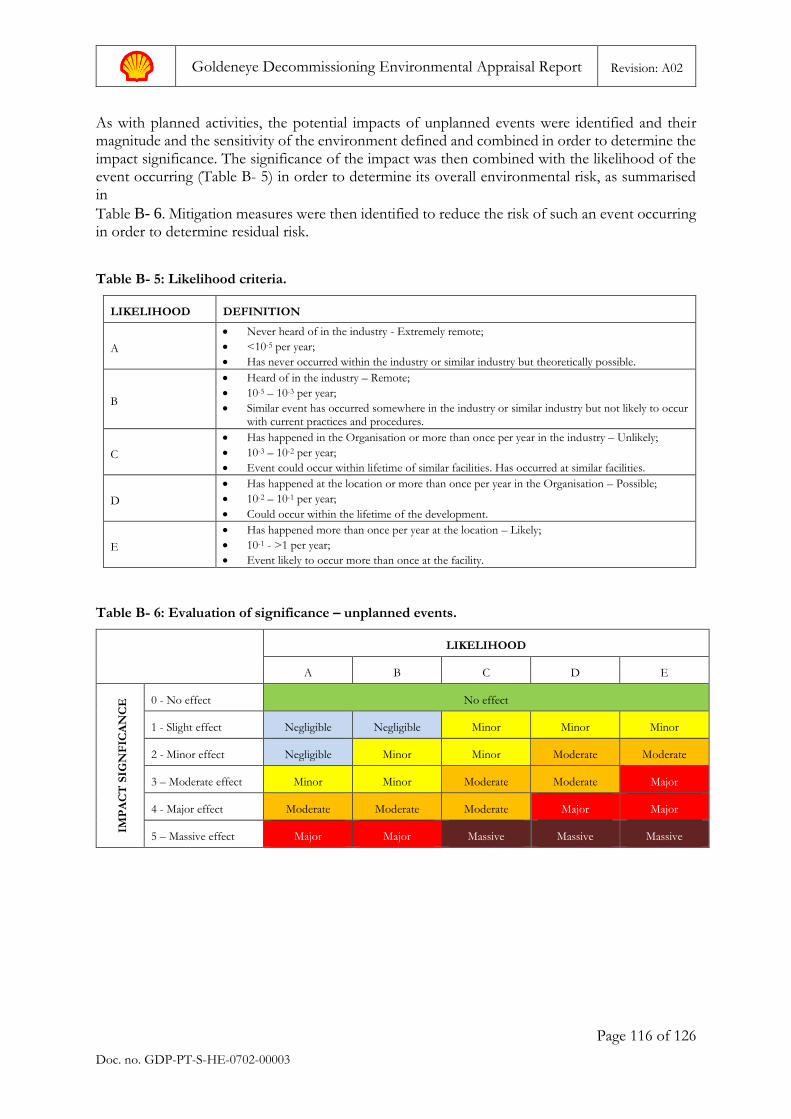
Goldeneye Decommissioning Environmental Appraisal Report Revision: A02
Page 116 of 126
Doc. no. GDP-PT-S-HE-0702-00003
As with planned activities, the potential impacts of unplanned events were identified and their magnitude and the sensitivity of the environment defined and combined in order to determine the impact significance. The significance of the impact was then combined with the likelihood of the event occurring (Table B- 5) in order to determine its overall environmental risk, as summarised in
Table B- 6. Mitigation measures were then identified to reduce the risk of such an event occurring in order to determine residual risk.
Table B- 5: Likelihood criteria.
LIKELIHOOD DEFINITION
A
• Never heard of in the industry - Extremely remote;
• <10-5 per year;
• Has never occurred within the industry or similar industry but theoretically possible.
B
• Heard of in the industry – Remote;
• 10-5 – 10-3 per year;
• Similar event has occurred somewhere in the industry or similar industry but not likely to occur with current practices and procedures.
C
• Has happened in the Organisation or more than once per year in the industry – Unlikely;
• 10-3 – 10-2 per year;
• Event could occur within lifetime of similar facilities. Has occurred at similar facilities.
D
• Has happened at the location or more than once per year in the Organisation – Possible;
• 10-2 – 10-1 per year;
• Could occur within the lifetime of the development.
E
• Has happened more than once per year at the location – Likely;
• 10-1 - >1 per year;
• Event likely to occur more than once at the facility.
Table B- 6: Evaluation of significance – unplanned events.
LIKELIHOOD
A B C D E
IMP
AC
T S
IGN
FIC
AN
CE
0 - No effect No effect
1 - Slight effect Negligible Negligible Minor Minor Minor
2 - Minor effect Negligible Minor Minor Moderate Moderate
3 – Moderate effect Minor Minor Moderate Moderate Major
4 - Major effect Moderate Moderate Moderate Major Major
5 – Massive effect Major Major Massive Massive Massive
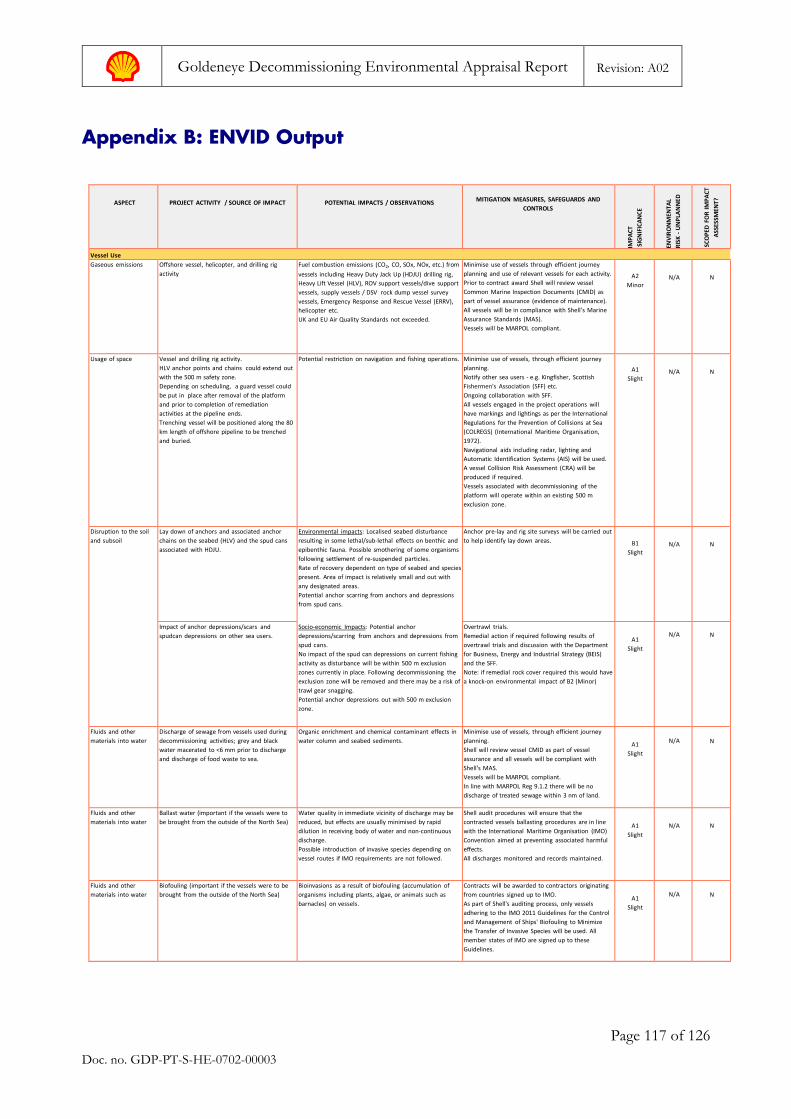
Goldeneye Decommissioning Environmental Appraisal Report Revision: A02
Page 117 of 126
Doc. no. GDP-PT-S-HE-0702-00003
Appendix B: ENVID Output
ASPECT
PROJECT ACTIVITY / SOURCE OF IMPACT
POTENTIAL IMPACTS / OBSERVATIONS
MITIGATION MEASURES, SAFEGUARDS AND
CONTROLS
IMP
AC
T
SIG
NIF
ICA
NC
E
ENV
IRO
NM
ENT
AL
RIS
K -
UN
PLA
NN
ED
SCO
PED
FO
R I
MP
AC
T
ASS
ESSM
ENT
?
Vessel Use Gaseous emissions Offshore vessel, helicopter, and drilling rig
activity Fuel combustion emissions (CO2, CO, SOx, NOx, etc.) from
vessels including Heavy Duty Jack Up (HDJU) drilling rig,
Heavy Lift Vessel (HLV), ROV support vessels/dive support
vessels, supply vessels / DSV rock dump vessel survey
vessels, Emergency Response and Rescue Vessel (ERRV),
helicopter etc.
UK and EU Air Quality Standards not exceeded.
Minimise use of vessels through efficient journey
planning and use of relevant vessels for each activity.
Prior to contract award Shell will review vessel
Common Marine Inspection Documents (CMID) as
part of vessel assurance (evidence of maintenance).
All vessels will be in compliance with Shell’s Marine
Assurance Standards (MAS).
Vessels will be MARPOL compliant.
A2
Minor
N/A
N
Usage of space Vessel and drilling rig activity.
HLV anchor points and chains could extend out
with the 500 m safety zone.
Depending on scheduling, a guard vessel could
be put in place after removal of the platform
and prior to completion of remediation
activities at the pipeline ends.
Trenching vessel will be positioned along the 80
km length of offshore pipeline to be trenched
and buried.
Potential restriction on navigation and fishing operations. Minimise use of vessels, through efficient journey
planning.
Notify other sea users - e.g. Kingfisher, Scottish
Fishermen's Association (SFF) etc.
Ongoing collaboration with SFF.
All vessels engaged in the project operations will
have markings and lightings as per the International
Regulations for the Prevention of Collisions at Sea
(COLREGS) (International Maritime Organisation,
1972).
Navigational aids including radar, lighting and
Automatic Identification Systems (AIS) will be used.
A vessel Collision Risk Assessment (CRA) will be
produced if required.
Vessels associated with decommissioning of the
platform will operate within an existing 500 m
exclusion zone.
A1
Slight
N/A
N
Disruption to the soil
and subsoil Lay down of anchors and associated anchor
chains on the seabed (HLV) and the spud cans
associated with HDJU.
Environmental impacts: Localised seabed disturbance
resulting in some lethal/sub-lethal effects on benthic and
epibenthic fauna. Possible smothering of some organisms
following settlement of re-suspended particles.
Rate of recovery dependent on type of seabed and species
present. Area of impact is relatively small and out with
any designated areas.
Potential anchor scarring from anchors and depressions
from spud cans.
Socio-economic Impacts: Potential anchor
depressions/scarring from anchors and depressions from
spud cans.
No impact of the spud can depressions on current fishing
activity as disturbance will be within 500 m exclusion
zones currently in place. Following decommissioning the
exclusion zone will be removed and there may be a risk of
trawl gear snagging.
Potential anchor depressions out with 500 m exclusion
zone.
Anchor pre-lay and rig site surveys will be carried out
to help identify lay down areas. B1
Slight
N/A
N
Impact of anchor depressions/scars and
spudcan depressions on other sea users. Overtrawl trials.
Remedial action if required following results of
overtrawl trials and discussion with the Department
for Business, Energy and Industrial Strategy (BEIS)
and the SFF.
Note: if remedial rock cover required this would have
a knock-on environmental impact of B2 (Minor)
A1
Slight
N/A
N
Fluids and other
materials into water Discharge of sewage from vessels used during
decommissioning activities; grey and black
water macerated to <6 mm prior to discharge
and discharge of food waste to sea.
Organic enrichment and chemical contaminant effects in
water column and seabed sediments. Minimise use of vessels, through efficient journey
planning.
Shell will review vessel CMID as part of vessel
assurance and all vessels will be compliant with
Shell's MAS.
Vessels will be MARPOL compliant.
In line with MARPOL Reg 9.1.2 there will be no
discharge of treated sewage within 3 nm of land.
A1
Slight
N/A
N
Fluids and other
materials into water Ballast water (important if the vessels were to
be brought from the outside of the North Sea) Water quality in immediate vicinity of discharge may be
reduced, but effects are usually minimised by rapid
dilution in receiving body of water and non-continuous
discharge.
Possible introduction of invasive species depending on
vessel routes if IMO requirements are not followed.
Shell audit procedures will ensure that the
contracted vessels ballasting procedures are in line
with the International Maritime Organisation (IMO)
Convention aimed at preventing associated harmful
effects.
All discharges monitored and records maintained.
A1
Slight
N/A
N
Fluids and other
materials into water Biofouling (important if the vessels were to be
brought from the outside of the North Sea) Bioinvasions as a result of biofouling (accumulation of
organisms including plants, algae, or animals such as
barnacles) on vessels.
Contracts will be awarded to contractors originating
from countries signed up to IMO.
As part of Shell's auditing process, only vessels
adhering to the IMO 2011 Guidelines for the Control
and Management of Ships' Biofouling to Minimize
the Transfer of Invasive Species will be used. All
member states of IMO are signed up to these
Guidelines.
A1
Slight
N/A
N
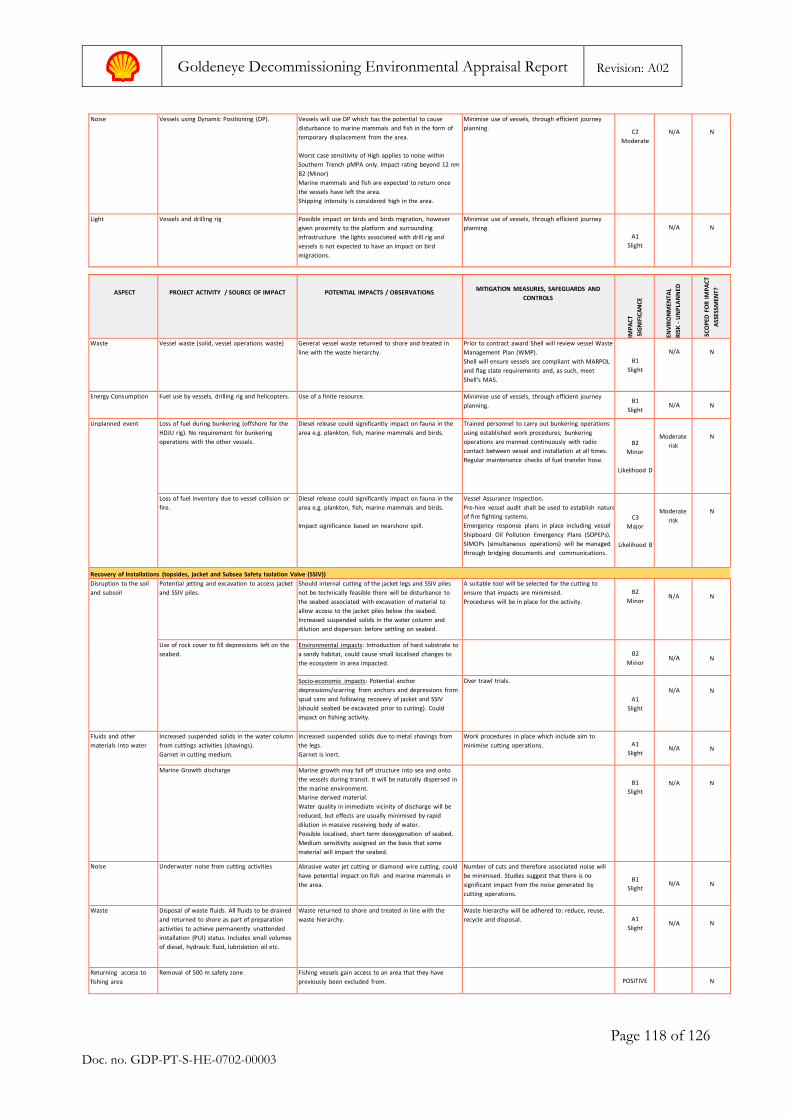
Goldeneye Decommissioning Environmental Appraisal Report Revision: A02
Page 118 of 126
Doc. no. GDP-PT-S-HE-0702-00003
Noise Vessels using Dynamic Positioning (DP). Vessels will use DP which has the potential to cause
disturbance to marine mammals and fish in the form of
temporary displacement from the area.
Worst case sensitivity of High applies to noise within
Southern Trench pMPA only. Impact rating beyond 12 nm
B2 (Minor)
Marine mammals and fish are expected to return once
the vessels have left the area.
Shipping intensity is considered high in the area.
Minimise use of vessels, through efficient journey
planning. C2
Moderate
N/A
N
Light Vessels and drilling rig Possible impact on birds and birds migration, however
given proximity to the platform and surrounding
infrastructure the lights associated with drill rig and
vessels is not expected to have an impact on bird
migrations.
Minimise use of vessels, through efficient journey
planning. A1
Slight
N/A
N
ASPECT
PROJECT ACTIVITY / SOURCE OF IMPACT
POTENTIAL IMPACTS / OBSERVATIONS
MITIGATION MEASURES, SAFEGUARDS AND
CONTROLS
IMP
AC
T
SIG
NIF
ICA
NC
E
ENV
IRO
NM
ENT
AL
RIS
K -
UN
PLA
NN
ED
SCO
PED
FO
R I
MP
AC
T
ASS
ESSM
ENT
?
Waste Vessel waste (solid, vessel operations waste) General vessel waste returned to shore and treated in
line with the waste hierarchy. Prior to contract award Shell will review vessel Waste
Management Plan (WMP).
Shell will ensure vessels are compliant with MARPOL
and flag state requirements and, as such, meet
Shell's MAS.
B1
Slight
N/A
N
Energy Consumption Fuel use by vessels, drilling rig and helicopters. Use of a finite resource. Minimise use of vessels, through efficient journey
planning. B1
Slight
N/A
N
Unplanned event Loss of fuel during bunkering (offshore for the
HDJU rig). No requirement for bunkering
operations with the other vessels.
Diesel release could significantly impact on fauna in the
area e.g. plankton, fish, marine mammals and birds. Trained personnel to carry out bunkering operations
using established work procedures; bunkering
operations are manned continuously with radio
contact between vessel and installation at all times.
Regular maintenance checks of fuel transfer hose.
B2
Minor
Likelihood D
Moderate
risk
N
Loss of fuel inventory due to vessel collision or
fire. Diesel release could significantly impact on fauna in the
area e.g. plankton, fish, marine mammals and birds.
Impact significance based on nearshore spill.
Vessel Assurance Inspection.
Pre-hire vessel audit shall be used to establish nature
of fire fighting systems.
Emergency response plans in place including vessel
Shipboard Oil Pollution Emergency Plans (SOPEPs).
SIMOPs (simultaneous operations) will be managed
through bridging documents and communications.
C3
Major
Likelihood B
Moderate
risk
N
Recovery of Installations (topsides, jacket and Subsea Safety Isolation Valve (SSIV)) Disruption to the soil
and subsoil Potential jetting and excavation to access jacket
and SSIV piles. Should internal cutting of the jacket legs and SSIV piles
not be technically feasible there will be disturbance to
the seabed associated with excavation of material to
allow access to the jacket piles below the seabed.
Increased suspended solids in the water column and
dilution and dispersion before settling on seabed.
A suitable tool will be selected for the cutting to
ensure that impacts are minimised.
Procedures will be in place for the activity.
B2
Minor
N/A
N
Use of rock cover to fill depressions left on the
seabed. Environmental impacts: Introduction of hard substrate to
a sandy habitat, could cause small localised changes to
the ecosystem in area impacted.
B2
Minor
N/A
N
Socio-economic impacts: Potential anchor
depressions/scarring from anchors and depressions from
spud cans and following recovery of jacket and SSIV
(should seabed be excavated prior to cutting). Could
impact on fishing activity.
Over trawl trials. A1
Slight
N/A
N
Fluids and other
materials into water Increased suspended solids in the water column
from cuttings activities (shavings).
Garnet in cutting medium.
Increased suspended solids due to metal shavings from
the legs.
Garnet is inert.
Work procedures in place which include aim to
minimise cutting operations.
A1
Slight
N/A
N
Marine Growth discharge Marine growth may fall off structure into sea and onto
the vessels during transit. It will be naturally dispersed in
the marine environment.
Marine derived material.
Water quality in immediate vicinity of discharge will be
reduced, but effects are usually minimised by rapid
dilution in massive receiving body of water.
Possible localised, short term deoxygenation of seabed.
Medium sensitivity assigned on the basis that some
material will impact the seabed.
B1
Slight
N/A
N
Noise Underwater noise from cutting activities Abrasive water jet cutting or diamond wire cutting, could
have potential impact on fish and marine mammals in
the area.
Number of cuts and therefore associated noise will
be minimised. Studies suggest that there is no
significant impact from the noise generated by
cutting operations.
B1
Slight
N/A
N
Waste Disposal of waste fluids. All fluids to be drained
and returned to shore as part of preparation
activities to achieve permanently unattended
installation (PUI) status. Includes small volumes
of diesel, hydraulc fluid, lubridation oil etc.
Waste returned to shore and treated in line with the
waste hierarchy. Waste hierarchy will be adhered to: reduce, reuse,
recycle and disposal.
A1
Slight
N/A
N
Returning access to
fishing area Removal of 500 m safety zone Fishing vessels gain access to an area that they have
previously been excluded from.
POSITIVE
N
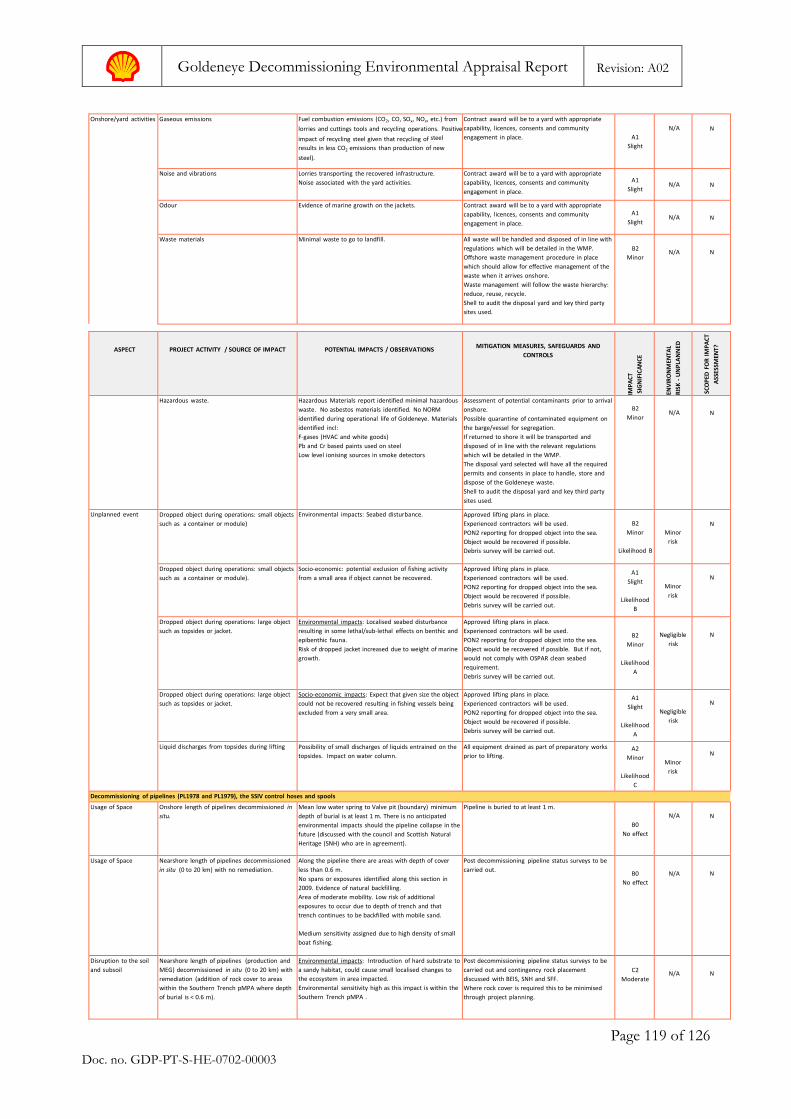
Goldeneye Decommissioning Environmental Appraisal Report Revision: A02
Page 119 of 126
Doc. no. GDP-PT-S-HE-0702-00003
Onshore/yard activities Gaseous emissions Fuel combustion emissions (CO2, CO, SOx, NOx, etc.) from
lorries and cuttings tools and recycling operations. Positive
impact of recycling steel given that recycling of steel
results in less CO2 emissions than production of new
steel).
Contract award will be to a yard with appropriate
capability, licences, consents and community
engagement in place.
A1
Slight
N/A
N
Noise and vibrations Lorries transporting the recovered infrastructure.
Noise associated with the yard activities. Contract award will be to a yard with appropriate
capability, licences, consents and community
engagement in place.
A1
Slight
N/A
N
Odour Evidence of marine growth on the jackets. Contract award will be to a yard with appropriate
capability, licences, consents and community
engagement in place.
A1
Slight
N/A
N
Waste materials Minimal waste to go to landfill. All waste will be handled and disposed of in line with
regulations which will be detailed in the WMP.
Offshore waste management procedure in place
which should allow for effective management of the
waste when it arrives onshore.
Waste management will follow the waste hierarchy:
reduce, reuse, recycle.
Shell to audit the disposal yard and key third party
sites used.
B2
Minor
N/A
N
ASPECT
PROJECT ACTIVITY / SOURCE OF IMPACT
POTENTIAL IMPACTS / OBSERVATIONS
MITIGATION MEASURES, SAFEGUARDS AND
CONTROLS
IMP
AC
T
SIG
NIF
ICA
NC
E
ENV
IRO
NM
ENT
AL
RIS
K -
UN
PLA
NN
ED
SCO
PED
FO
R I
MP
AC
T
ASS
ESSM
ENT?
Hazardous waste. Hazardous Materials report identified minimal hazardous
waste. No asbestos materials identified. No NORM
identified during operational life of Goldeneye. Materials
identified incl:
F-gases (HVAC and white goods)
Pb and Cr based paints used on steel
Low level ionising sources in smoke detectors
Assessment of potential contaminants prior to arrival
onshore.
Possible quarantine of contaminated equipment on
the barge/vessel for segregation.
If returned to shore it will be transported and
disposed of in line with the relevant regulations
which will be detailed in the WMP.
The disposal yard selected will have all the required
permits and consents in place to handle, store and
dispose of the Goldeneye waste.
Shell to audit the disposal yard and key third party
sites used.
B2
Minor
N/A
N
Unplanned event Dropped object during operations: small objects
such as a container or module) Environmental impacts: Seabed disturbance. Approved lifting plans in place.
Experienced contractors will be used.
PON2 reporting for dropped object into the sea.
Object would be recovered if possible.
Debris survey will be carried out.
B2
Minor
Likelihood B
Minor
risk
N
Dropped object during operations: small objects
such as a container or module). Socio-economic: potential exclusion of fishing activity
from a small area if object cannot be recovered. Approved lifting plans in place.
Experienced contractors will be used.
PON2 reporting for dropped object into the sea.
Object would be recovered if possible.
Debris survey will be carried out.
A1
Slight
Likelihood
B
Minor
risk
N
Dropped object during operations: large object
such as topsides or jacket. Environmental impacts: Localised seabed disturbance
resulting in some lethal/sub-lethal effects on benthic and
epibenthic fauna.
Risk of dropped jacket increased due to weight of marine
growth.
Approved lifting plans in place.
Experienced contractors will be used.
PON2 reporting for dropped object into the sea.
Object would be recovered if possible. But if not,
would not comply with OSPAR clean seabed
requirement.
Debris survey will be carried out.
B2
Minor
Likelihood
A
Negligible
risk
N
Dropped object during operations: large object
such as topsides or jacket. Socio-economic impacts: Expect that given size the object
could not be recovered resulting in fishing vessels being
excluded from a very small area.
Approved lifting plans in place.
Experienced contractors will be used.
PON2 reporting for dropped object into the sea.
Object would be recovered if possible.
Debris survey will be carried out.
A1
Slight
Likelihood
A
Negligible
risk
N
Liquid discharges from topsides during lifting Possibility of small discharges of liquids entrained on the
topsides. Impact on water column. All equipment drained as part of preparatory works
prior to lifting. A2
Minor
Likelihood
C
Minor
risk
N
Decommissioning of pipelines (PL1978 and PL1979), the SSIV control hoses and spools Usage of Space Onshore length of pipelines decommissioned in
situ. Mean low water spring to Valve pit (boundary) minimum
depth of burial is at least 1 m. There is no anticipated
environmental impacts should the pipeline collapse in the
future (discussed with the council and Scottish Natural
Heritage (SNH) who are in agreement).
Pipeline is buried to at least 1 m. B0
No effect
N/A
N
Usage of Space Nearshore length of pipelines decommissioned
in situ (0 to 20 km) with no remediation. Along the pipeline there are areas with depth of cover
less than 0.6 m.
No spans or exposures identified along this section in
2009. Evidence of natural backfilling.
Area of moderate mobility. Low risk of additional
exposures to occur due to depth of trench and that
trench continues to be backfilled with mobile sand.
Medium sensitivity assigned due to high density of small
boat fishing.
Post decommissioning pipeline status surveys to be
carried out. B0
No effect
N/A
N
Disruption to the soil
and subsoil Nearshore length of pipelines (production and
MEG) decommissioned in situ (0 to 20 km) with
remediation (addition of rock cover to areas
within the Southern Trench pMPA where depth
of burial is < 0.6 m).
Environmental impacts: Introduction of hard substrate to
a sandy habitat, could cause small localised changes to
the ecosystem in area impacted.
Environmental sensitivity high as this impact is within the
Southern Trench pMPA .
Post decommissioning pipeline status surveys to be
carried out and contingency rock placement
discussed with BEIS, SNH and SFF.
Where rock cover is required this to be minimised
through project planning.
C2
Moderate
N/A
N
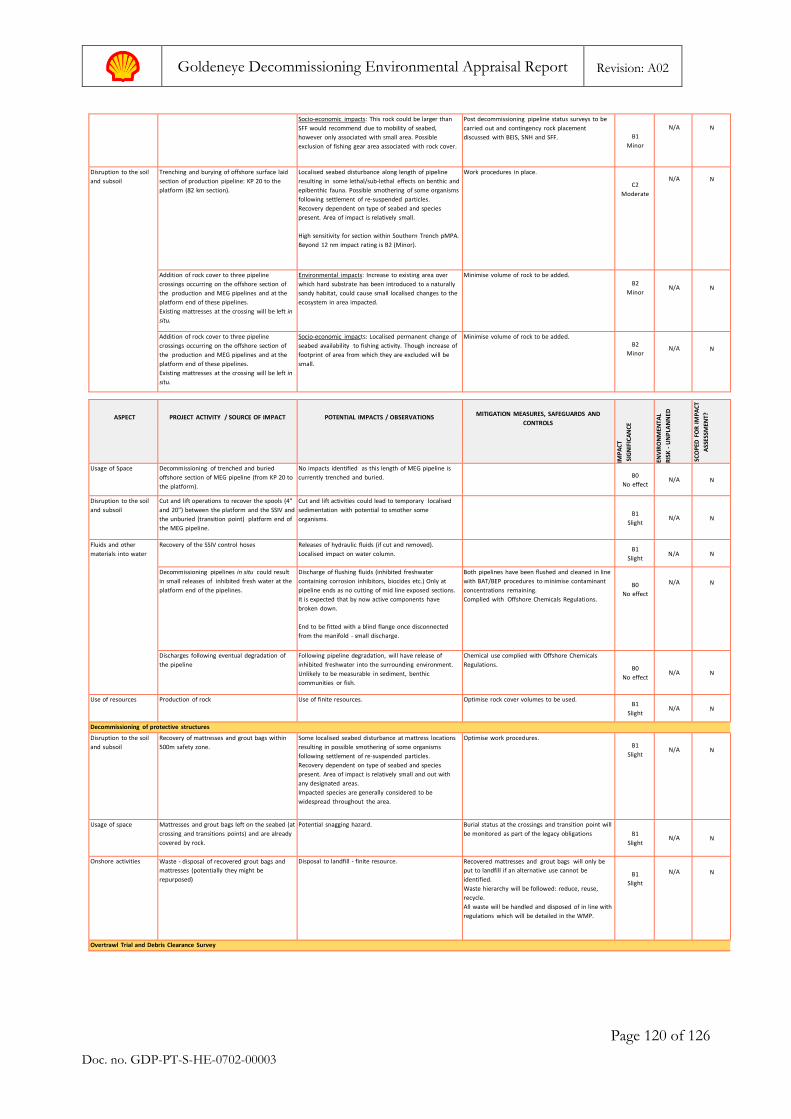
Goldeneye Decommissioning Environmental Appraisal Report Revision: A02
Page 120 of 126
Doc. no. GDP-PT-S-HE-0702-00003
Socio-economic impacts: This rock could be larger than
SFF would recommend due to mobility of seabed,
however only associated with small area. Possible
exclusion of fishing gear area associated with rock cover.
Post decommissioning pipeline status surveys to be
carried out and contingency rock placement
discussed with BEIS, SNH and SFF.
B1
Minor
N/A
N
Disruption to the soil
and subsoil Trenching and burying of offshore surface laid
section of production pipeline: KP 20 to the
platform (82 km section).
Localised seabed disturbance along length of pipeline
resulting in some lethal/sub-lethal effects on benthic and
epibenthic fauna. Possible smothering of some organisms
following settlement of re-suspended particles.
Recovery dependent on type of seabed and species
present. Area of impact is relatively small.
High sensitivity for section within Southern Trench pMPA.
Beyond 12 nm impact rating is B2 (Minor).
Work procedures in place. C2
Moderate
N/A
N
Addition of rock cover to three pipeline
crossings occurring on the offshore section of
the production and MEG pipelines and at the
platform end of these pipelines.
Existing mattresses at the crossing will be left in
situ.
Environmental impacts: Increase to existing area over
which hard substrate has been introduced to a naturally
sandy habitat, could cause small localised changes to the
ecosystem in area impacted.
Minimise volume of rock to be added. B2
Minor
N/A
N
Addition of rock cover to three pipeline
crossings occurring on the offshore section of
the production and MEG pipelines and at the
platform end of these pipelines.
Existing mattresses at the crossing will be left in
situ.
Socio-economic impacts: Localised permanent change of
seabed availability to fishing activity. Though increase of
footprint of area from which they are excluded will be
small.
Minimise volume of rock to be added. B2
Minor
N/A
N
ASPECT
PROJECT ACTIVITY / SOURCE OF IMPACT
POTENTIAL IMPACTS / OBSERVATIONS
MITIGATION MEASURES, SAFEGUARDS AND
CONTROLS
IMP
AC
T
SIG
NIF
ICA
NC
E
ENV
IRO
NM
ENTA
L
RIS
K -
UN
PLA
NN
ED
SCO
PED
FO
R I
MP
AC
T
ASS
ESSM
ENT
?
Usage of Space Decommissioning of trenched and buried
offshore section of MEG pipeline (from KP 20 to
the platform).
No impacts identified as this length of MEG pipeline is
currently trenched and buried.
B0
No effect
N/A
N
Disruption to the soil
and subsoil Cut and lift operations to recover the spools (4"
and 20") between the platform and the SSIV and
the unburied (transition point) platform end of
the MEG pipeline.
Cut and lift activities could lead to temporary localised
sedimentation with potential to smother some
organisms.
B1
Slight
N/A
N
Fluids and other
materials into water Recovery of the SSIV control hoses Releases of hydraulic fluids (if cut and removed).
Localised impact on water column. B1
Slight
N/A
N
Decommissioning pipelines in situ could result
in small releases of inhibited fresh water at the
platform end of the pipelines.
Discharge of flushing fluids (inhibited freshwater
containing corrosion inhibitors, biocides etc.) Only at
pipeline ends as no cutting of mid line exposed sections.
It is expected that by now active components have
broken down.
End to be fitted with a blind flange once disconnected
from the manifold - small discharge.
Both pipelines have been flushed and cleaned in line
with BAT/BEP procedures to minimise contaminant
concentrations remaining.
Complied with Offshore Chemicals Regulations.
B0
No effect
N/A
N
Discharges following eventual degradation of
the pipeline Following pipeline degradation, will have release of
inhibited freshwater into the surrounding environment.
Unlikely to be measurable in sediment, benthic
communities or fish.
Chemical use complied with Offshore Chemicals
Regulations. B0
No effect
N/A
N
Use of resources Production of rock Use of finite resources. Optimise rock cover volumes to be used. B1
Slight
N/A
N
Decommissioning of protective structures Disruption to the soil
and subsoil Recovery of mattresses and grout bags within
500m safety zone. Some localised seabed disturbance at mattress locations
resulting in possible smothering of some organisms
following settlement of re-suspended particles.
Recovery dependent on type of seabed and species
present. Area of impact is relatively small and out with
any designated areas.
Impacted species are generally considered to be
widespread throughout the area.
Optimise work procedures. B1
Slight
N/A
N
Usage of space Mattresses and grout bags left on the seabed (at
crossing and transitions points) and are already
covered by rock.
Potential snagging hazard. Burial status at the crossings and transition point will
be monitored as part of the legacy obligations
B1
Slight
N/A
N
Onshore activities Waste - disposal of recovered grout bags and
mattresses (potentially they might be
repurposed)
Disposal to landfill - finite resource. Recovered mattresses and grout bags will only be
put to landfill if an alternative use cannot be
identified.
Waste hierarchy will be followed: reduce, reuse,
recycle.
All waste will be handled and disposed of in line with
regulations which will be detailed in the WMP.
B1
Slight
N/A
N
Overtrawl Trial and Debris Clearance Survey

Goldeneye Decommissioning Environmental Appraisal Report Revision: A02
Page 121 of 126
Doc. no. GDP-PT-S-HE-0702-00003
Disruption to the soil
and subsoil Debris clearance surveys (chain mats) and
overtrawl trials at 500 m exclusion zone. Area
impacted will likely extend outside the 500 m
zone to allow for turning of fishing vessel (and
gear) and also to capture area impacted by HLV
anchors which are expected to be positioned
out with the 500 m zone.
Seabed disturbance, increased suspended sediment,
impact on benthic species, their disturbance and loss. B2
Minor
N/A
N
Debris clearance surveys (chain mats) and
overtrawl trials along the pipeline routes
(whole length).
Impact rating based on High sensitivity seabed
within the Southern trench pMPA. Beyond 12
nm impact rating is B2 (Minor)
Seabed disturbance, increased suspended sediment,
impact on benthic species, their disturbance and loss. C2
Moderate
N/A
N
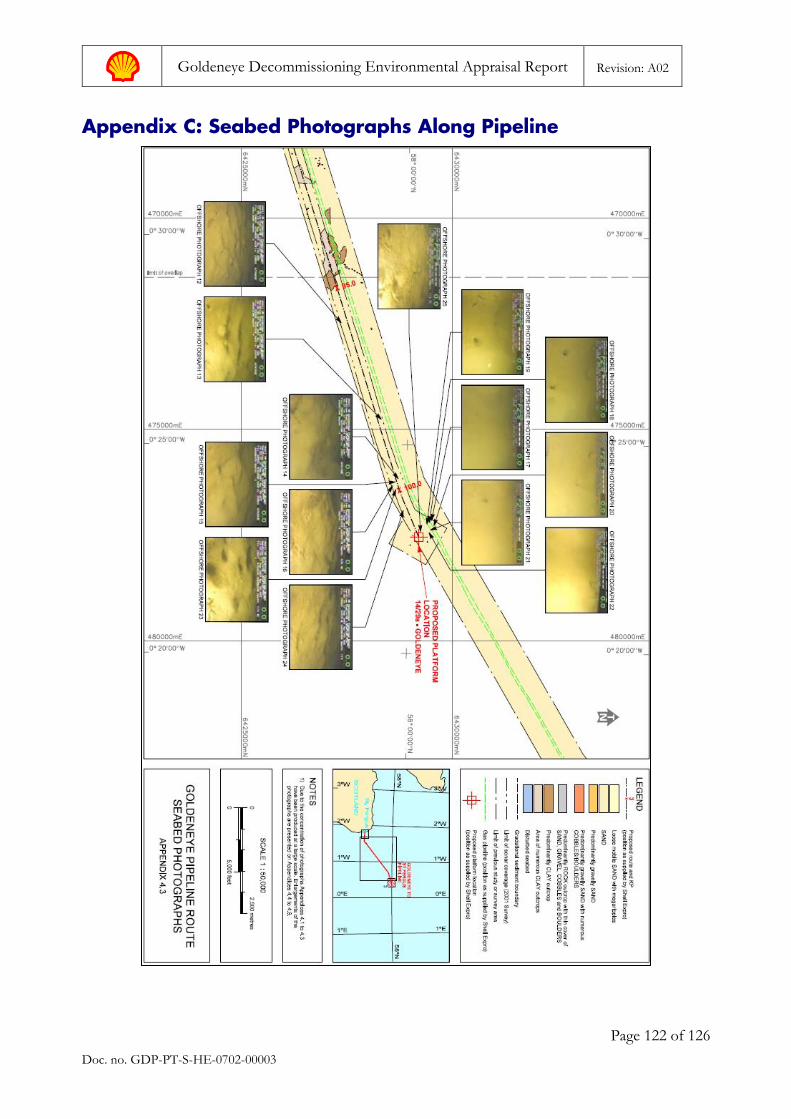
Goldeneye Decommissioning Environmental Appraisal Report Revision: A02
Page 122 of 126
Doc. no. GDP-PT-S-HE-0702-00003
Appendix C: Seabed Photographs Along Pipeline
Goldeneye Decommissioning Environmental Appraisal Report Revision: A02
Page 123 of 126
Doc. no. GDP-PT-S-HE-0702-00003
ABBREVIATIONS
A&C Atlantic and Cromarty
ACOPS Advisory Committee On Protection of the Sea
BAP Biodiversity Action Plan
BEIS Department for Business, Energy and Industrial Strategy
CA (Goldeneye) Comparative Assessment
CCS Carbon Capture and Storage
CH4 Methane
CNS Central North Sea
CoP Cessation of Production
CO2 Carbon Dioxide
dB Decibell
DECC Department of Energy and Climate Change
DoB Depth of Burial
DP (Goldeneye) Decommissioning Programmes
DSV Dive Support Vessel
EA (Goldeneye) Environmental Appraisal
EC European Commission
EIA Environmental Impact Assessment
ENVID ENVironmental Impact iDentification
EPS European Protected Species
ESAS European Seabirds At Sea
EUNIS European Nature Information System
F-gas Fluorinated Greenhouse Gas
FPSO Floating Production, Storage and Offloading
GHG Greenhouse Gases
GIS Geographical Information Systems
GMAS (Shell’s) Global Marine Assurance System
HLV Heavy Lift Vessel
HSSE Health, Safety, Security and Environment
Hz Hertz
ICES International Council for the Exploration of the Sea
Goldeneye Decommissioning Environmental Appraisal Report Revision: A02
Page 124 of 126
Doc. no. GDP-PT-S-HE-0702-00003
IMO International Maritime Organization
IUCN International Union for Conservation of Nature
JNCC Joint Nature Conservation Committee
Kg Kilograms
kHz Kilo Hertz
km Kilometres
KP Kilometre Point
LAT Lowest Astronomical Tide
m Metres
MARPOL International Convention for the Prevention of Pollution from Ships
MBES Multi Beam Echo Sounder
MDAC Methane Derived Authigenic Carbonate
MEG MonoEthylene Glycol
MLWS Mean Low Water Springs
MMS Minerals Management Service
MPA Marine Protected Area
MS Marine Scotland
NCES Natural Capital and Ecosystem Services
NCMPA Nature Conservation MPA
nm Nautical Miles
NNS Northern North Sea
NOAA National Oceanic and Atmospheric Administration
NOx Nitrogen Oxides
NORM Naturally Occurring Radioactive Material
NS North Sea
NUI Normally Unattended Installation
OBM Oil Based Mud
OCIMF Oil Companies International Marine Forum
OGA Oil and Gas Authority
OGUK Oil and Gas UK
OiW Oil in Water
OPEP Oil Pollution Emergency Plan
Goldeneye Decommissioning Environmental Appraisal Report Revision: A02
Page 125 of 126
Doc. no. GDP-PT-S-HE-0702-00003
OSPAR Oslo/Paris Convention
OVIQ OCIMF Vessel Inspection Questionnaire
OVMSA Offshore Vessel Managers Self Assessment
PAH Polynuclear Aromatic Hydrocarbon
PFOS PerFluoroOctyl Sulphonate
PL Prefix for OGA pipeline numbering system
PMF Priority Marine Features
pMPA Proposed MPA
PPC Pollution Prevention and Control
ppm Parts Per Million
PSU Practical Salinity Unit
PTS Permanent Threshold Shift
PUI Permanently Unattended Installation
rms Root Mean Square
ROV Remotely Operated Vessel
ROVSV ROV Support Vessel
SAC Special Area of Conservation
SBP Sub Bottom Profiler
SCANS Small Cetacean Abundance in the North Sea
SEL Sound Exposure Level
SFF Scottish Fishermen’ies Federation
SNH Scottish Natural Heritage
SOPEP Shipboard Oil Pollution Emergency Plan
SOSI Seabird Oil Sensitivity Index
SO2 Sulphur Dioxide
spp. Non-determined species
SPA Special Protection Area
SPL Sound Pressure Level
SSIV Sub Sea Isolation Valve
SSS Side Scan Sonar
te tonnes
THC Total Hydrocarbon
Goldeneye Decommissioning Environmental Appraisal Report Revision: A02
Page 126 of 126
Doc. no. GDP-PT-S-HE-0702-00003
TTS Temporary Threshold Shift
UK United Kingdom
UKCS UK Continental Shelf
UKHAP UK Habitats Action Plan
UKOOA UK Offshore Operators Association
VMS Vessel Monitoring System
VOC Volatile Organic Compounds
WBM Water Based Mud
WMP Waste Management Plan
WONS Well Operations Notification System
μPa Micro Pascal