Embed Size (px)
Citation preview
Goldman SachsAnnual Power & Utility ConferenceNew York, New YorkMay 10, 2007
Goldman Sachs Annual Power & Utility Conference New York, New York • May 10, 2007
Safe Harbor Statement under thePrivate Securities Litigation Reform Act of 1995Forward-looking Statements. This presentation includes forward-looking statements based on information currently available to management. Such statements are subject to certain risks and uncertainties. These statements typically contain, but are not limited to, the terms “anticipate,” “potential,” “expect,” “believe,” “estimate” and similar words. Actual results may differ materially due to the speed and nature of increased competition and deregulation in the electric utility industry, economic or weather conditions affecting future sales and margins, changes in markets for energy services, changing energy and commodity market prices, replacement power costs being higher than anticipated or inadequately hedged, the continued ability of FirstEnergy’s regulated utilities to collect transition and other charges orto recover increased transmission costs, maintenance costs being higher than anticipated, legislative and regulatory changes (including revised environmental requirements), and the legal and regulatory changes resulting from the implementation of the EPACT (including, but not limited to, the repeal of the PUHCA), the uncertainty of the timing and amounts of the capital expenditures needed to, among other things, implement the Air Quality Compliance Plan (including that such amounts could be higher than anticipated) or levels of emission reductions related to the Consent Decree resolving the New Source Review litigation, adverse regulatory or legal decisions and outcomes (including, but not limited to, the revocation of necessary licenses or operating permits and oversight) by the NRC and the various state public utility commissions as disclosed in the registrants’ SEC filings, the timing and outcome of various proceedings before the PUCO (including, but not limited to, the Distribution Rate Cases for the Ohio Companies and the successful resolution of the issues remanded to the PUCO by the Ohio Supreme Court regarding the Rate Stabilization Plan) and the PPUC (including the transition rate plan filings for Met-Ed and Penelec and Penn’s Default Service Plan filing), the continuing availability and operation of generating units, the ability of generating units to continue to operate at, or near full capacity, the inability to accomplish or realize anticipated benefits from strategic goals (including employee workforce initiatives), the anticipated benefits from voluntary pension plan contributions, the ability to improve electric commodity margins and to experience growth in the distribution business, the ability to access the public securities and other capital markets and the cost of such capital, the outcome, cost and other effects of present and potential legal and administrative proceedings and claims related to the August 14, 2003 regional power outage, the successful structuring and completion of a potential sale and leaseback transaction for Bruce Mansfield Unit 1 currently under consideration by management, any purchase price adjustment under the accelerated share repurchase program announced March 2, 2007, the risks and other factors discussed from time to time in the registrants’ SEC filings, and other similar factors. Dividends declared from time to time on FirstEnergy's common stock during any annual period may in aggregate vary from the indicated amounts due to circumstances considered by FirstEnergy's Board of Directors at the time of the actual declarations. Also, a security rating is not a recommendation to buy, sell or hold securities, and it may be subject to revision or withdrawal at any time and each such rating should be evaluated independently of any other rating. The registrants expressly disclaim any current intention to update any forward-looking statements contained herein as a result of new information, future events, or otherwise.
Strategic Vision
Goldman Sachs Annual Power & Utility Conference New York, New York • May 10, 2007
Strategic Vision: 2007 and BeyondOur strategic focus continues to be on the fundamentals…
Realizing the full potential of our asset baseEfficiently achieving environmental improvementControlling commodity costs and risksPursuing continuous improvement in all aspects of the businessManaging transition to competitive marketsEnhancing financial strength and flexibility
DRIVING PERFORMANCE & DELIVERING RESULTS
2Strategic Vision
Goldman Sachs Annual Power & Utility Conference New York, New York • May 10, 2007
Financial ObjectivesMaintain Financial Strength and Flexibility
Strong and stable cash flowsBalanced capital structure Investment grade credit metrics
Deliver Consistent and Predictable Financial ResultsImproved generation marginsEfficiency enhancements and cost reductionsEffectively manage transition to competitive markets
Deploy Cash Effectively to Increase Shareholder ValueSustainable dividend growth Share repurchasesReinvestment in business
3Strategic Vision


Generation Portfolio
Goldman Sachs Annual Power & Utility Conference New York, New York • May 10, 2007
Akron
Toledo
Reading
Beaver Valley1,722 MW
Davis-Besse898 MW
Perry1,258 MW
R. E. Burger413 MW
W. H. Sammis2,233 MW
Bruce Mansfield2,460 MW
Eastlake1,262 MW
Ashtabula244 MW
Seneca443 MW
Edgewater48 MW
Richland432 MW
Stryker18 MW
Yards Creek200 MW
York Haven19 MW
Mad River60 MW
West Lorain545 MW
Lake Shore249 MW
Sumpter340 MW
Erie
Ohio
Pennsylvania
NewJersey
Harrisburg
MorristownNewark
Allenhurst
Trenton
Bay Shore648 MW
Columbus
New Castle
Cleveland
Johnstown
Forked River86 MW
Michigan
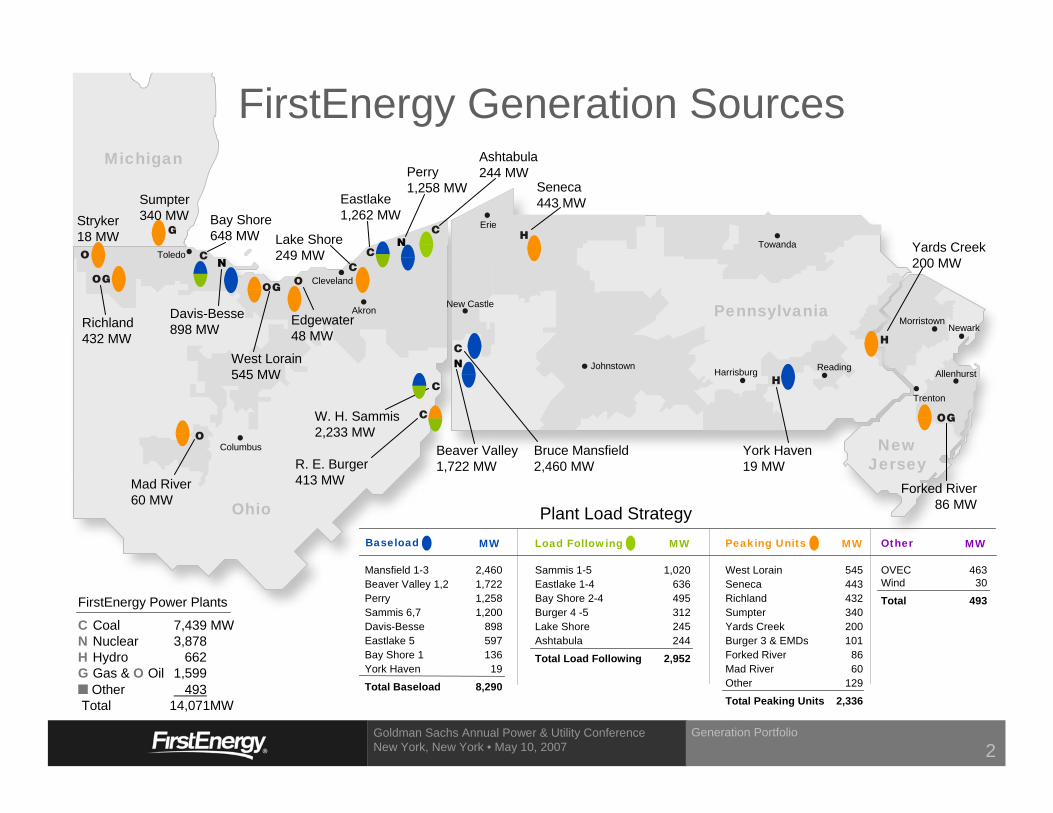
Baseload Load Following Peaking Units
Plant Load Strategy
Towanda
MW MWMW
FirstEnergy Generation Sources
West Lorain 545Seneca 443Richland 432Sumpter 340Yards Creek 200Burger 3 & EMDs 101Forked River 86Mad River 60Other 129
Total Peaking Units 2,336
Mansfield 1-3 2,460Beaver Valley 1,2 1,722Perry 1,258Sammis 6,7 1,200Davis-Besse 898Eastlake 5 597Bay Shore 1 136York Haven 19
Total Baseload 8,290
Sammis 1-5 1,020Eastlake 1-4 636Bay Shore 2-4 495Burger 4 -5 312Lake Shore 245Ashtabula 244
Total Load Following 2,952
OVEC 463Wind 30
Total 493
Other MW
FirstEnergy Power Plants
C Coal 7,439 MWN Nuclear 3,878 H Hydro 662 G Gas & O Oil 1,599
Other 493Total 14,071MW
Generation Portfolio
2
Goldman Sachs Annual Power & Utility Conference New York, New York • May 10, 2007
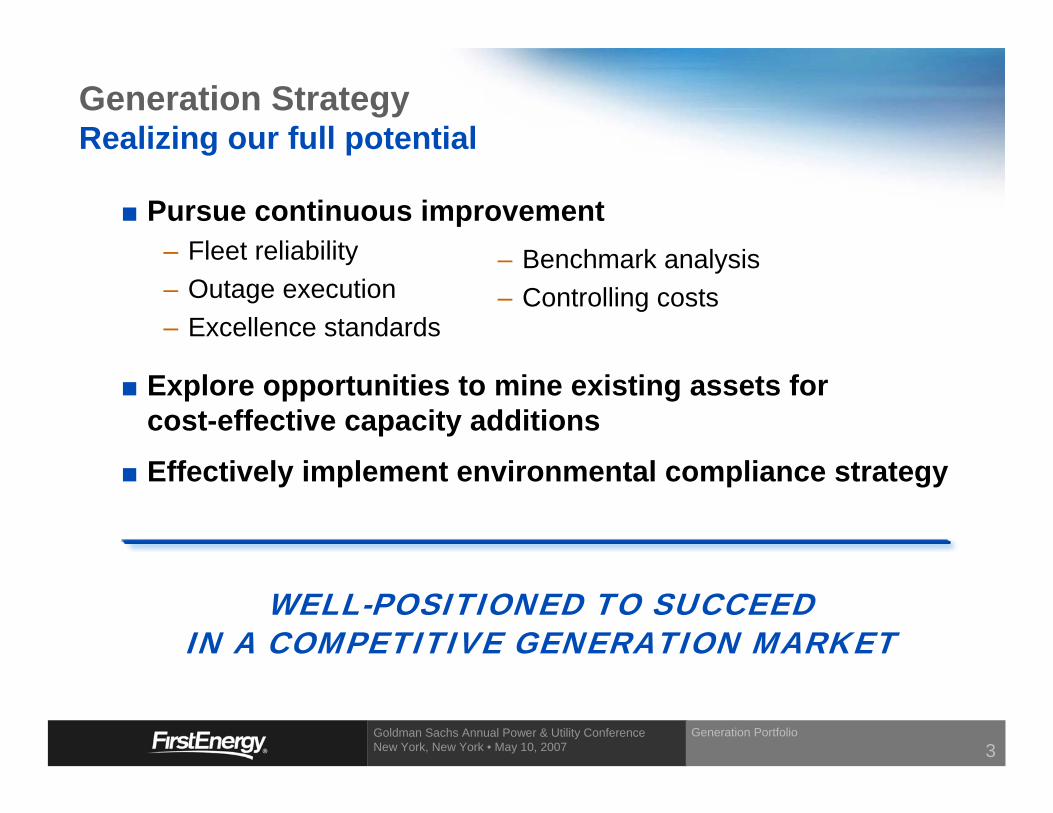
Pursue continuous improvement– Fleet reliability– Outage execution– Excellence standards
WELL-POSITIONED TO SUCCEEDIN A COMPETITIVE GENERATION MARKET
Explore opportunities to mine existing assets forcost-effective capacity additions
Effectively implement environmental compliance strategy
– Benchmark analysis– Controlling costs
Generation StrategyRealizing our full potential
Generation Portfolio
3
Goldman Sachs Annual Power & Utility Conference New York, New York • May 10, 2007
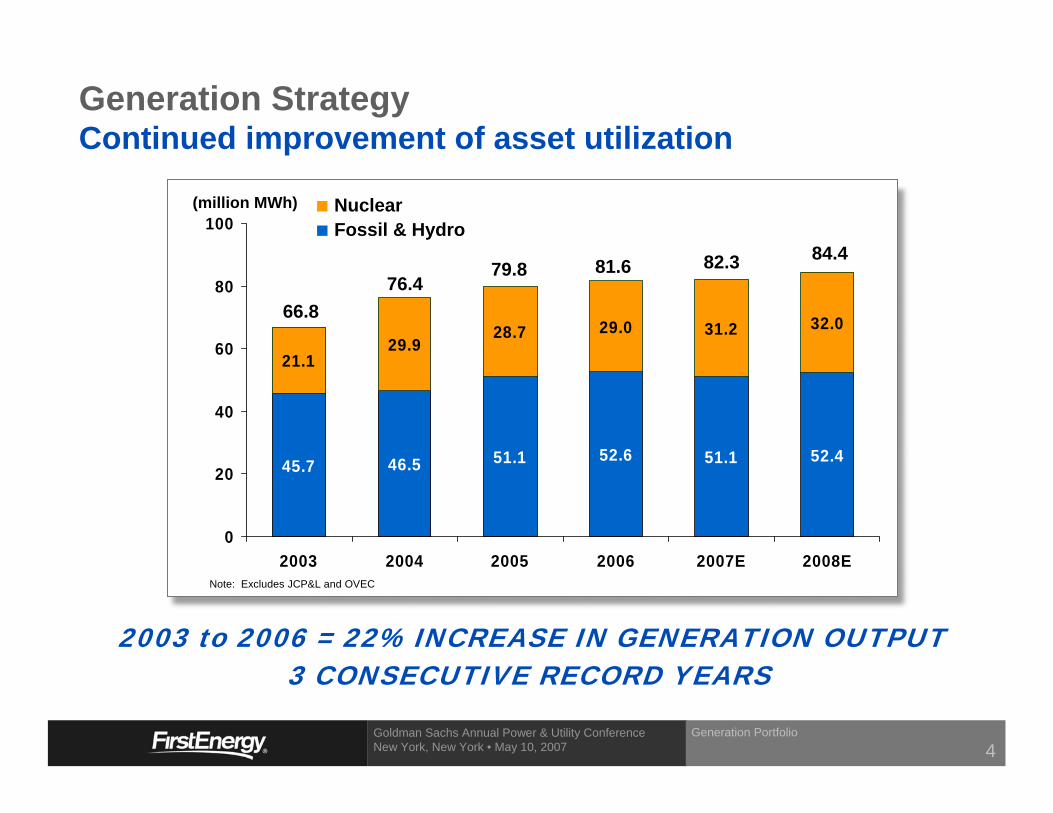
45.7 46.5 51.1 52.4
32.0
51.152.6
28.729.9
21.1
29.0 31.2
0
20
40
60
80
100
2003 2004 2005 2006 2007E 2008E
NuclearFossil & Hydro
Note: Excludes JCP&L and OVEC
(million MWh)
66.876.4
79.8 81.6 82.3 84.4
Generation StrategyContinued improvement of asset utilization
2003 to 2006 = 22% INCREASE IN GENERATION OUTPUT3 CONSECUTIVE RECORD YEARS
Generation Portfolio
4
Goldman Sachs Annual Power & Utility Conference New York, New York • May 10, 2007
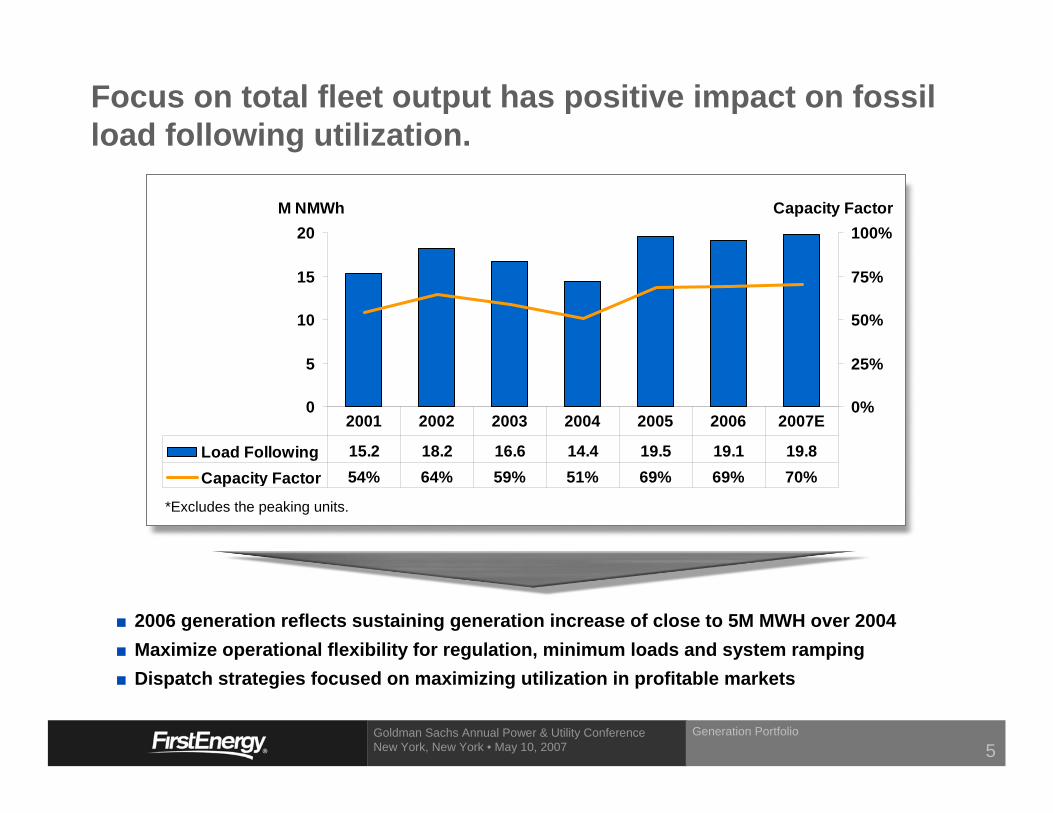
2006 generation reflects sustaining generation increase of close to 5M MWH over 2004Maximize operational flexibility for regulation, minimum loads and system rampingDispatch strategies focused on maximizing utilization in profitable markets
*Excludes the peaking units.
0
5
10
15
20M NMWh
0%
25%
50%
75%
100%Capacity Factor
Load Following 15.2 18.2 16.6 14.4 19.5 19.1 19.8Capacity Factor 54% 64% 59% 51% 69% 69% 70%
2001 2002 2003 2004 2005 2006 2007E
Focus on total fleet output has positive impact on fossil load following utilization.
Generation Portfolio
5
Goldman Sachs Annual Power & Utility Conference New York, New York • May 10, 2007
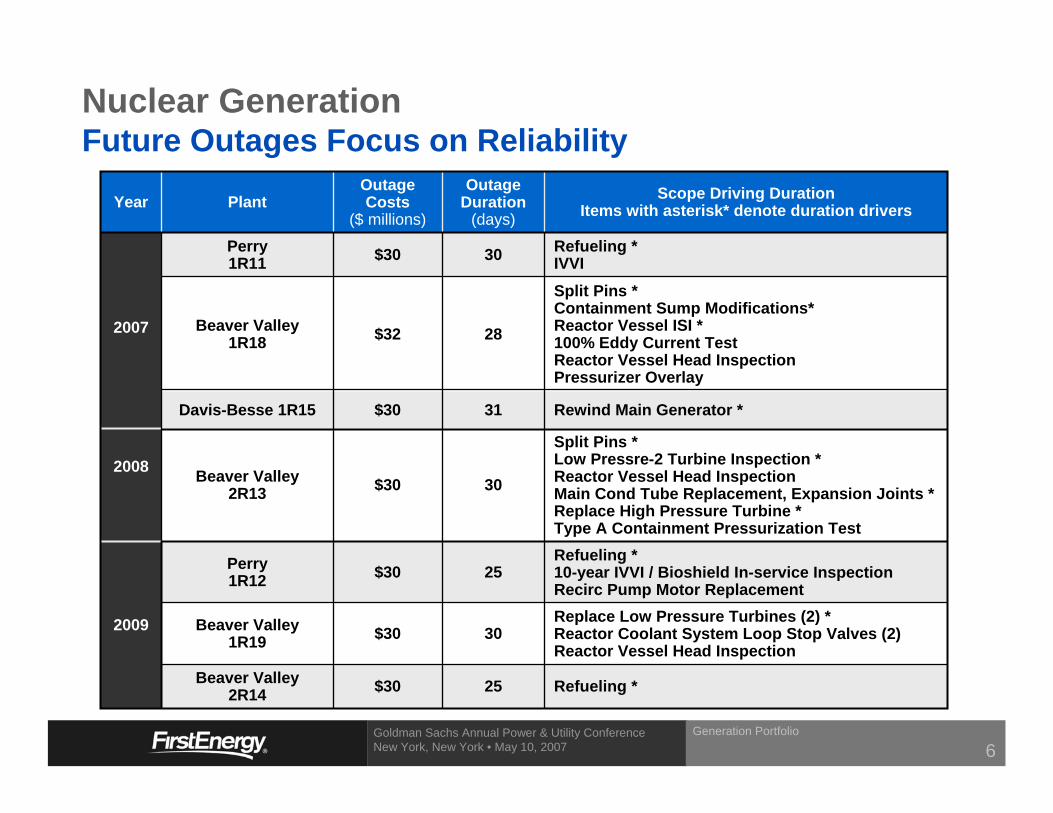
Nuclear Generation Future Outages Focus on Reliability
Refueling *25$30Beaver Valley2R14
Replace Low Pressure Turbines (2) *Reactor Coolant System Loop Stop Valves (2)Reactor Vessel Head Inspection
30$30Beaver Valley1R19
Refueling *10-year IVVI / Bioshield In-service InspectionRecirc Pump Motor Replacement
25$30Perry1R12
2009
Split Pins *Low Pressre-2 Turbine Inspection *Reactor Vessel Head InspectionMain Cond Tube Replacement, Expansion Joints *Replace High Pressure Turbine *Type A Containment Pressurization Test
30$30Beaver Valley2R13
Rewind Main Generator *31$30Davis-Besse 1R15
2008
Split Pins *Containment Sump Modifications*Reactor Vessel ISI *100% Eddy Current TestReactor Vessel Head InspectionPressurizer Overlay
28$32Beaver Valley1R18
Refueling *IVVI30$30Perry
1R11
2007
Scope Driving DurationItems with asterisk* denote duration drivers
Outage Duration
(days)
OutageCosts
($ millions)PlantYear
Generation Portfolio
6
Goldman Sachs Annual Power & Utility Conference New York, New York • May 10, 2007
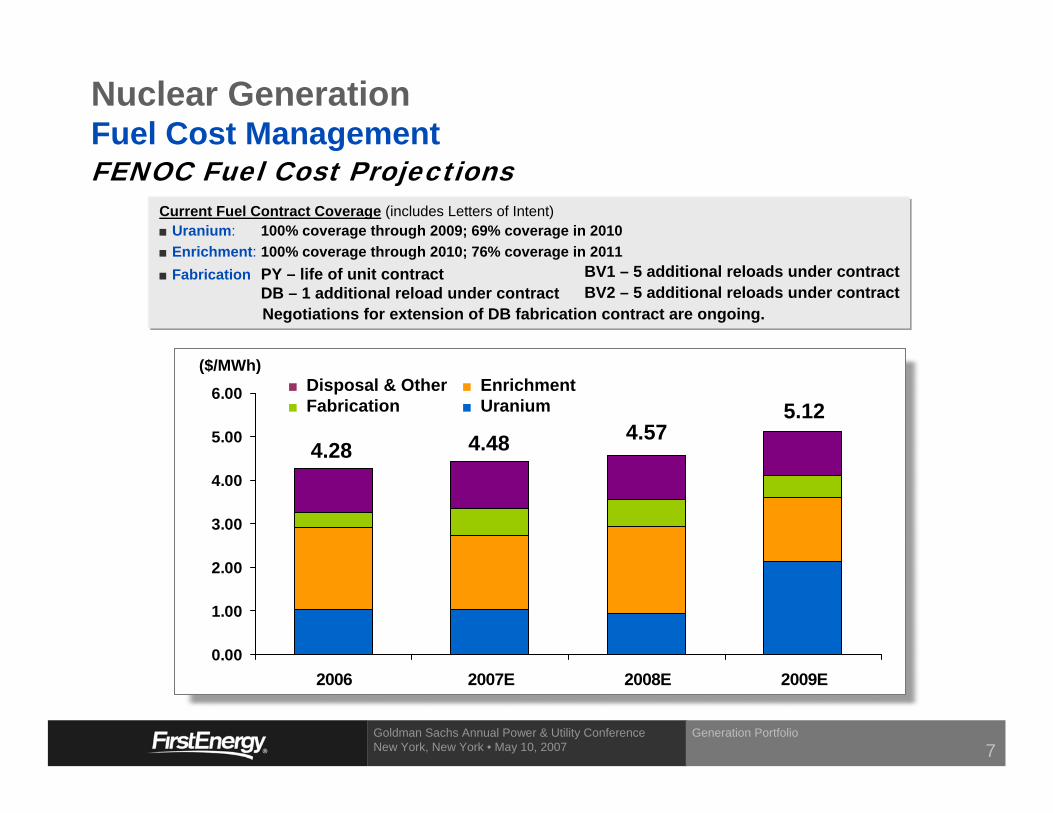
Nuclear Generation Fuel Cost ManagementFENOC Fuel Cost Projections
0.00
1.00
2.00
3.00
4.00
5.00
6.00
2006 2007E 2008E 2009E
($/MWh)
4.28 4.48 4.575.12
Current Fuel Contract Coverage (includes Letters of Intent)Uranium: 100% coverage through 2009; 69% coverage in 2010Enrichment: 100% coverage through 2010; 76% coverage in 2011Fabrication PY – life of unit contract
DB – 1 additional reload under contractBV1 – 5 additional reloads under contractBV2 – 5 additional reloads under contract
Negotiations for extension of DB fabrication contract are ongoing.
Disposal & OtherFabrication
EnrichmentUranium
Generation Portfolio
7
Goldman Sachs Annual Power & Utility Conference New York, New York • May 10, 2007
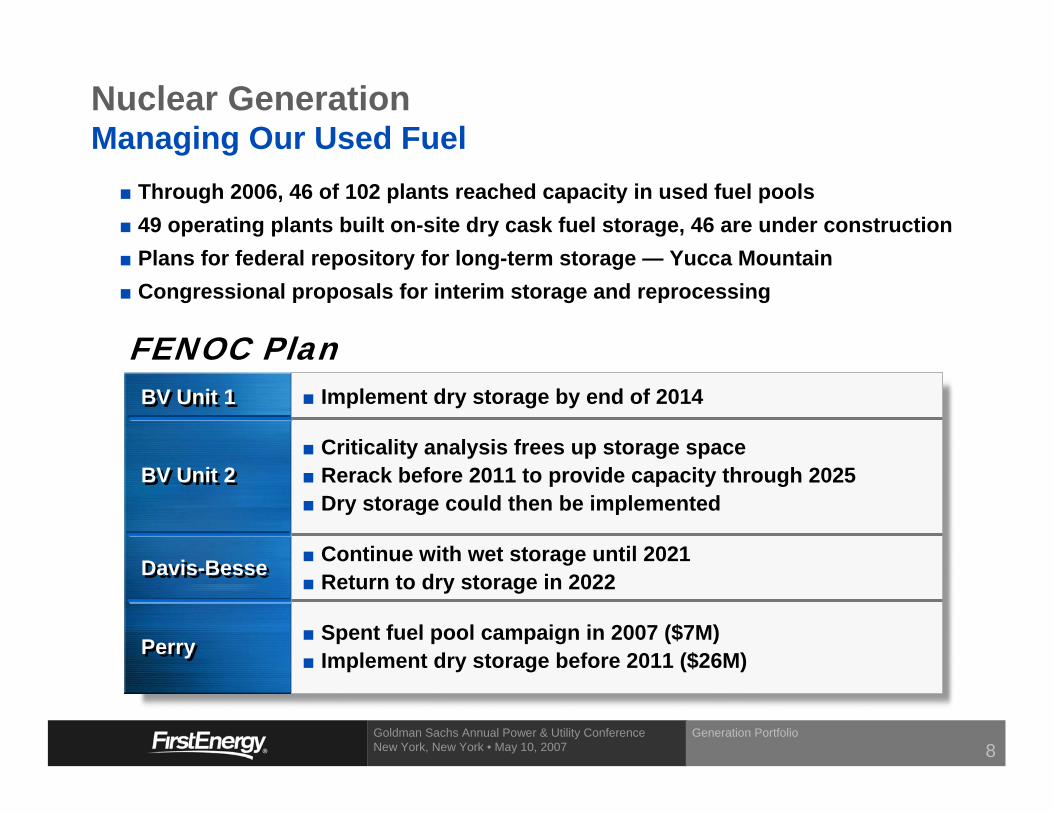
Nuclear Generation Managing Our Used Fuel
Through 2006, 46 of 102 plants reached capacity in used fuel pools49 operating plants built on-site dry cask fuel storage, 46 are under constructionPlans for federal repository for long-term storage — Yucca Mountain Congressional proposals for interim storage and reprocessing
FENOC PlanBV Unit 1BV Unit 1
BV Unit 2BV Unit 2
Davis-BesseDavis-Besse
PerryPerry
Implement dry storage by end of 2014
Criticality analysis frees up storage spaceRerack before 2011 to provide capacity through 2025Dry storage could then be implemented
Continue with wet storage until 2021Return to dry storage in 2022
Spent fuel pool campaign in 2007 ($7M)Implement dry storage before 2011 ($26M)
Generation Portfolio
8
Goldman Sachs Annual Power & Utility Conference New York, New York • May 10, 2007
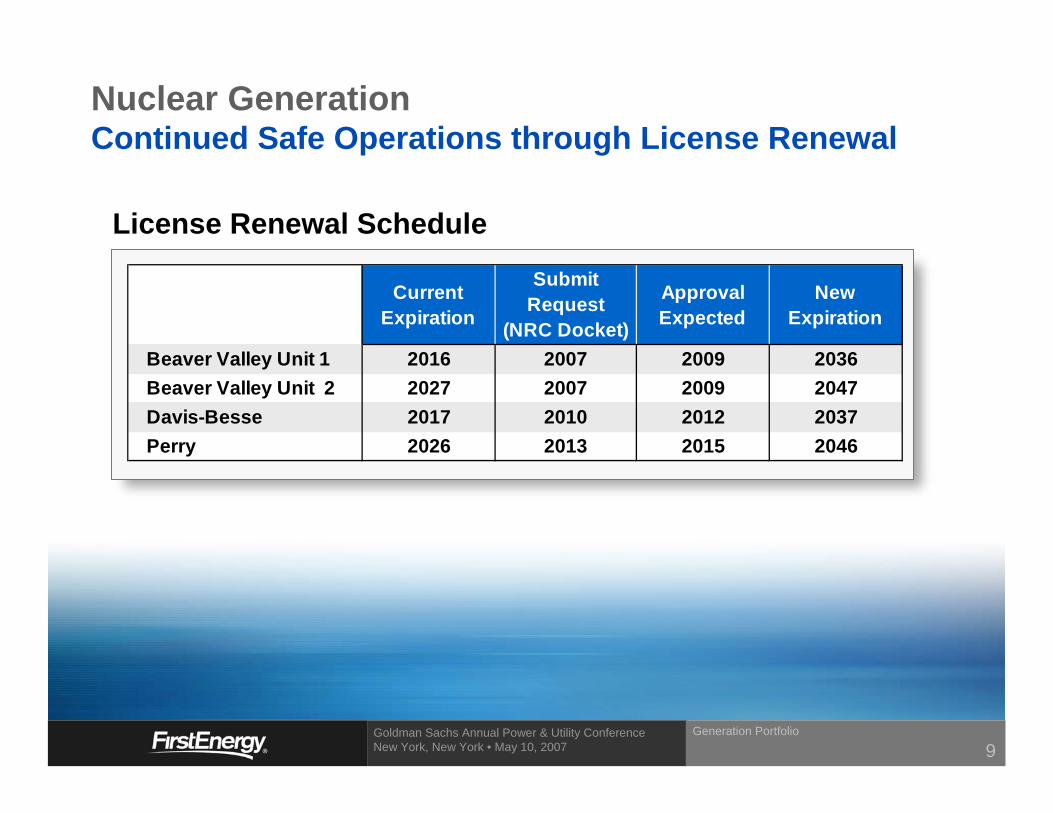
CurrentExpiration
Submit Request
(NRC Docket)
ApprovalExpected
NewExpiration
Beaver Valley Unit 1 2016 2007 2009 2036Beaver Valley Unit 2 2027 2007 2009 2047Davis-Besse 2017 2010 2012 2037Perry 2026 2013 2015 2046
Nuclear Generation Continued Safe Operations through License Renewal
License Renewal Schedule
Generation Portfolio
9
Goldman Sachs Annual Power & Utility Conference New York, New York • May 10, 2007
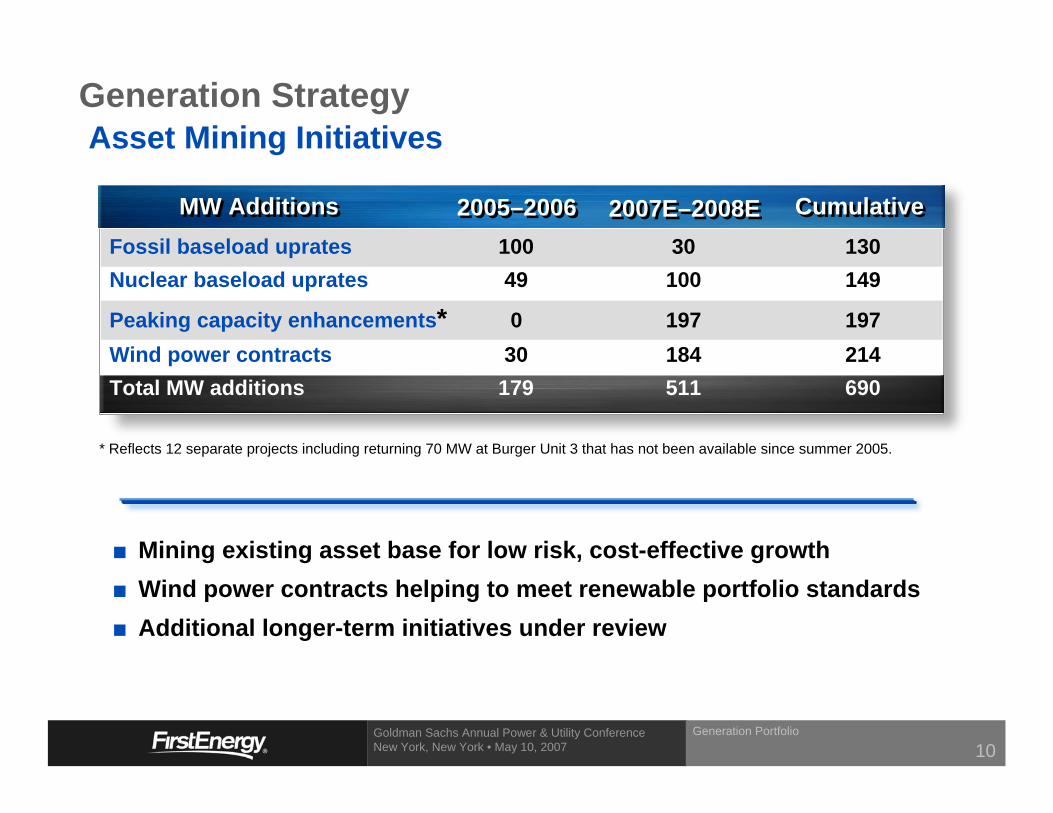
Generation StrategyAsset Mining Initiatives
Mining existing asset base for low risk, cost-effective growthWind power contracts helping to meet renewable portfolio standardsAdditional longer-term initiatives under review
* Reflects 12 separate projects including returning 70 MW at Burger Unit 3 that has not been available since summer 2005.
Fossil baseload uprates 100 30 130Nuclear baseload uprates 49 100 149
Peaking capacity enhancements* 0 197 197Wind power contracts 30 184 214Total MW additions 179 511 690
MW AdditionsMW Additions 2007E–2008E2007E–2008E2005–20062005–2006 CumulativeCumulative
Generation Portfolio
10
Goldman Sachs Annual Power & Utility Conference New York, New York • May 10, 2007
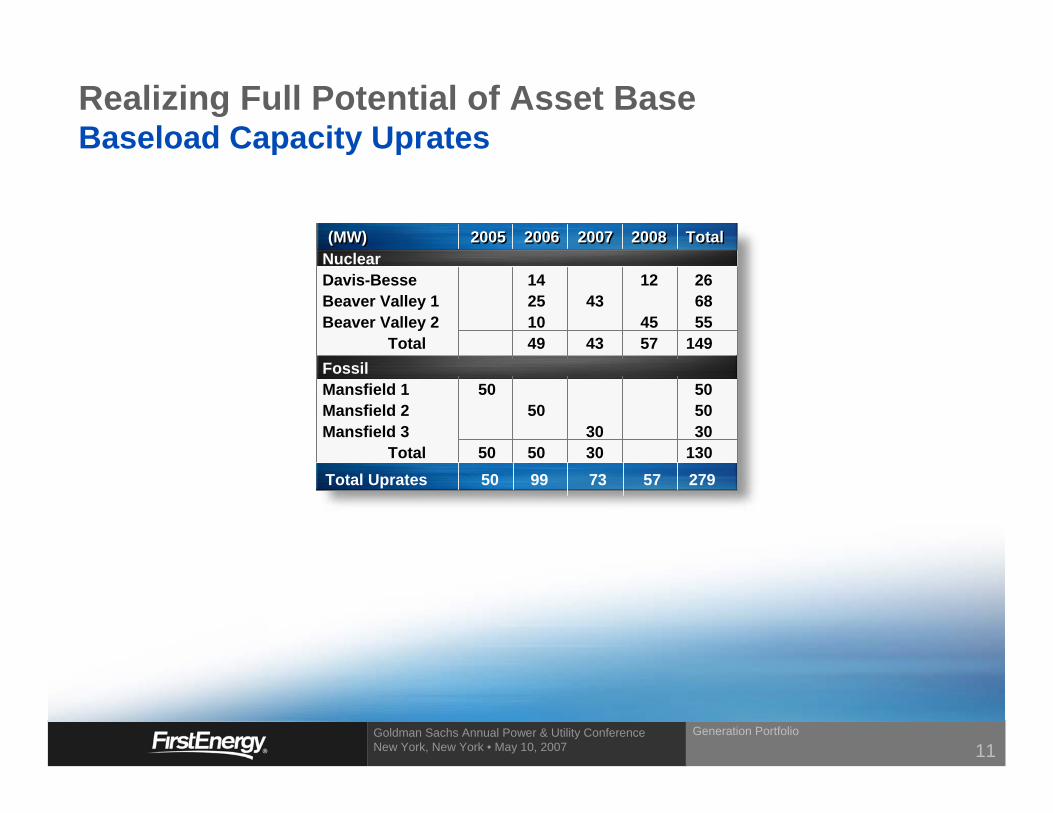
Realizing Full Potential of Asset BaseBaseload Capacity Uprates
Generation Portfolio
11
TotalTotal(MW)(MW) 20052005 20062006 20072007 20082008NuclearDavis-Besse 14 12 26Beaver Valley 1 25 43 68Beaver Valley 2 10 45 55
Total 49 43 57 149FossilMansfield 1 50 50Mansfield 2 50 50Mansfield 3 30 30
Total 50 50 30 130Total Uprates 50 99 73 57 279

Environmental Strategy
Goldman Sachs Annual Power & Utility Conference New York, New York • May 10, 2007
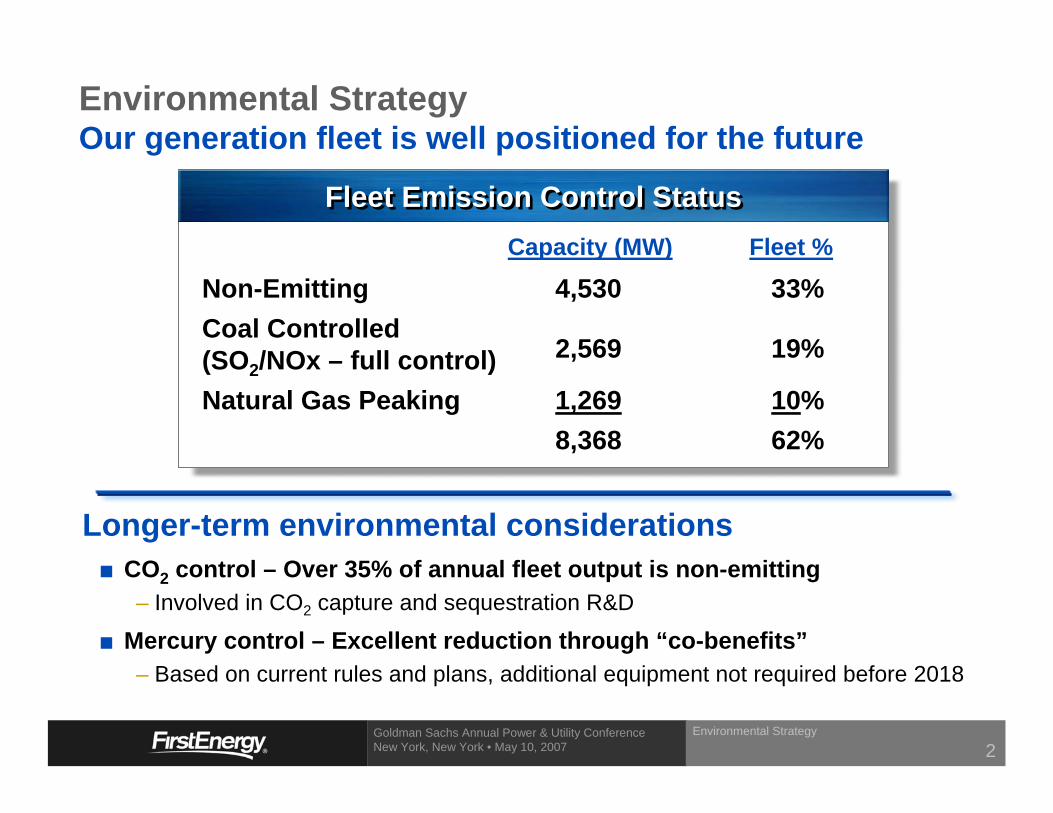
Non-Emitting 4,530 33%Coal Controlled(SO2/NOx – full control)Natural Gas Peaking 1,269 10%
8,368 62%
Capacity (MW) Fleet %
Fleet Emission Control StatusFleet Emission Control Status
2,569 19%
Environmental StrategyOur generation fleet is well positioned for the future
CO2 control – Over 35% of annual fleet output is non-emitting– Involved in CO2 capture and sequestration R&D
Mercury control – Excellent reduction through “co-benefits”– Based on current rules and plans, additional equipment not required before 2018
Longer-term environmental considerations
2Environmental Strategy
Goldman Sachs Annual Power & Utility Conference New York, New York • May 10, 2007
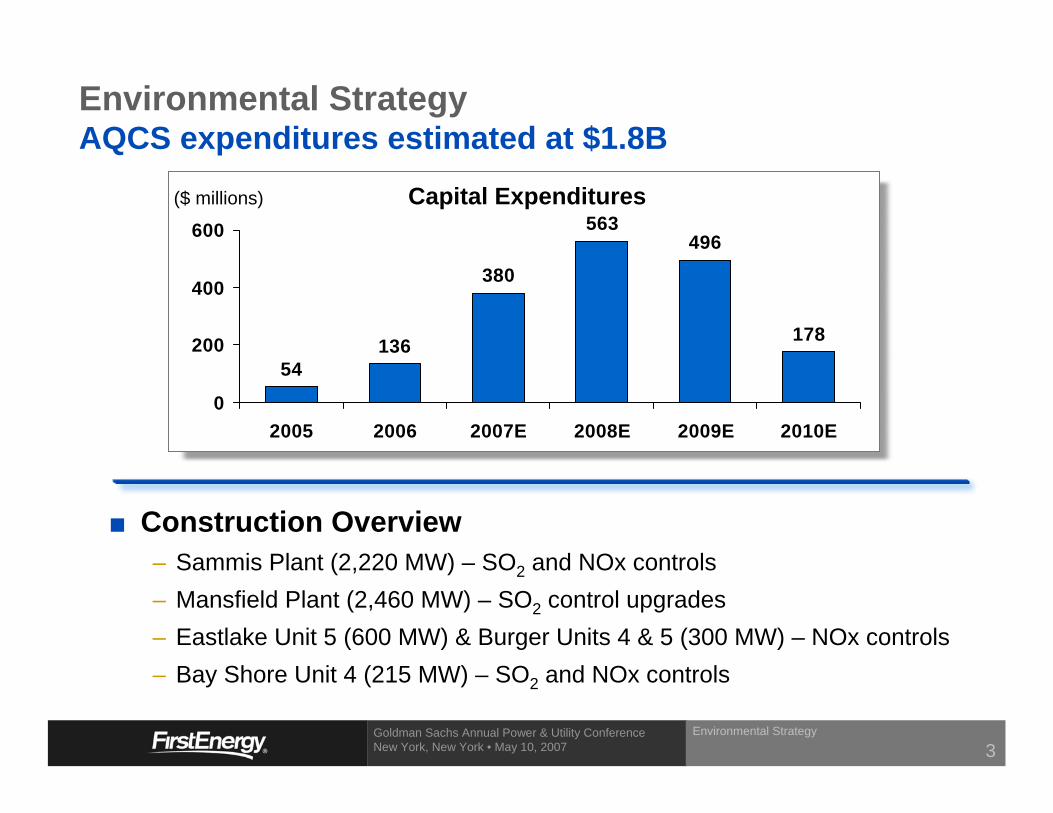
54136
380
563496
178
0
200
400
600
2005 2006 2007E 2008E 2009E 2010E
Construction Overview– Sammis Plant (2,220 MW) – SO2 and NOx controls– Mansfield Plant (2,460 MW) – SO2 control upgrades– Eastlake Unit 5 (600 MW) & Burger Units 4 & 5 (300 MW) – NOx controls– Bay Shore Unit 4 (215 MW) – SO2 and NOx controls
($ millions) Capital Expenditures
Environmental StrategyAQCS expenditures estimated at $1.8B
Environmental Strategy
3
Goldman Sachs Annual Power & Utility Conference New York, New York • May 10, 2007
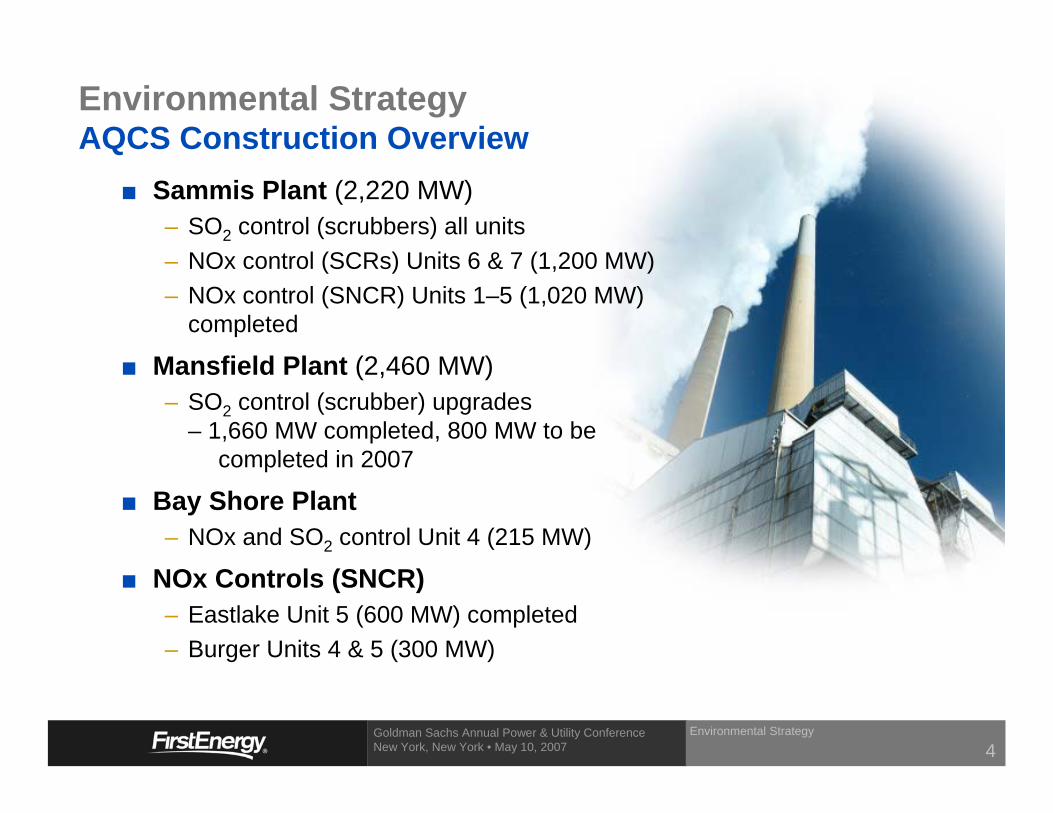
Environmental StrategyAQCS Construction Overview
Sammis Plant (2,220 MW)– SO2 control (scrubbers) all units– NOx control (SCRs) Units 6 & 7 (1,200 MW)– NOx control (SNCR) Units 1–5 (1,020 MW)
completed
Mansfield Plant (2,460 MW)– SO2 control (scrubber) upgrades
– 1,660 MW completed, 800 MW to be completed in 2007
Bay Shore Plant– NOx and SO2 control Unit 4 (215 MW)
NOx Controls (SNCR)– Eastlake Unit 5 (600 MW) completed– Burger Units 4 & 5 (300 MW)
Environmental Strategy
4
Goldman Sachs Annual Power & Utility Conference New York, New York • May 10, 2007
FirstEnergy’s Position on Global Climate Change
Climate change is a global issue requiringa global approach
Technology development is key– Energy efficiency and demand-side management– Clean coal technologies– Carbon capture and sequestration
Significant future impact on price of electricity whether states are regulated or deregulated– Be consistent over broad geographic region– Include reasonable compliance timeframes – Encourage new cost-effective technologies
Environmental Strategy
5
Goldman Sachs Annual Power & Utility Conference New York, New York • May 10, 2007
FirstEnergy’s diverse generation provides strong competitive position.
35% of generation from non-emitting nuclear unitsin 2006
Uprates will further increase nuclear generating capacity
Long-term contracts for more than 300 MW of wind capacity
Environmental Strategy 6
Goldman Sachs Annual Power & Utility Conference New York, New York • May 10, 2007
Current Greenhouse Gas Reduction Actions
$100M in investments planned 2006 – 2010– $50M on products, programs and activities to help reduce greenhouse
gas emissions– $50M to support relicensing and capacity uprates at non-emitting
generating plants; renewable energy development
Fleet modernization a key strategy:– Increased ownership of nuclear generation and decreased ownership
of coal– 1,383 MW of older coal-based boilers out of service since 1990
(estimated annual CO2 avoidance of 1.5 million tons)– 1,155 MW of new natural gas-fired peaking capacity since 1999– 300 MW of wind generation secured through long-term agreements
Overall efforts resulted in average annual reductions of 8.9 million tons of CO2 equivalent; 143 million tons since 1991
Environmental Strategy 7
Goldman Sachs Annual Power & Utility Conference New York, New York • May 10, 2007
Environmental Strategy
8
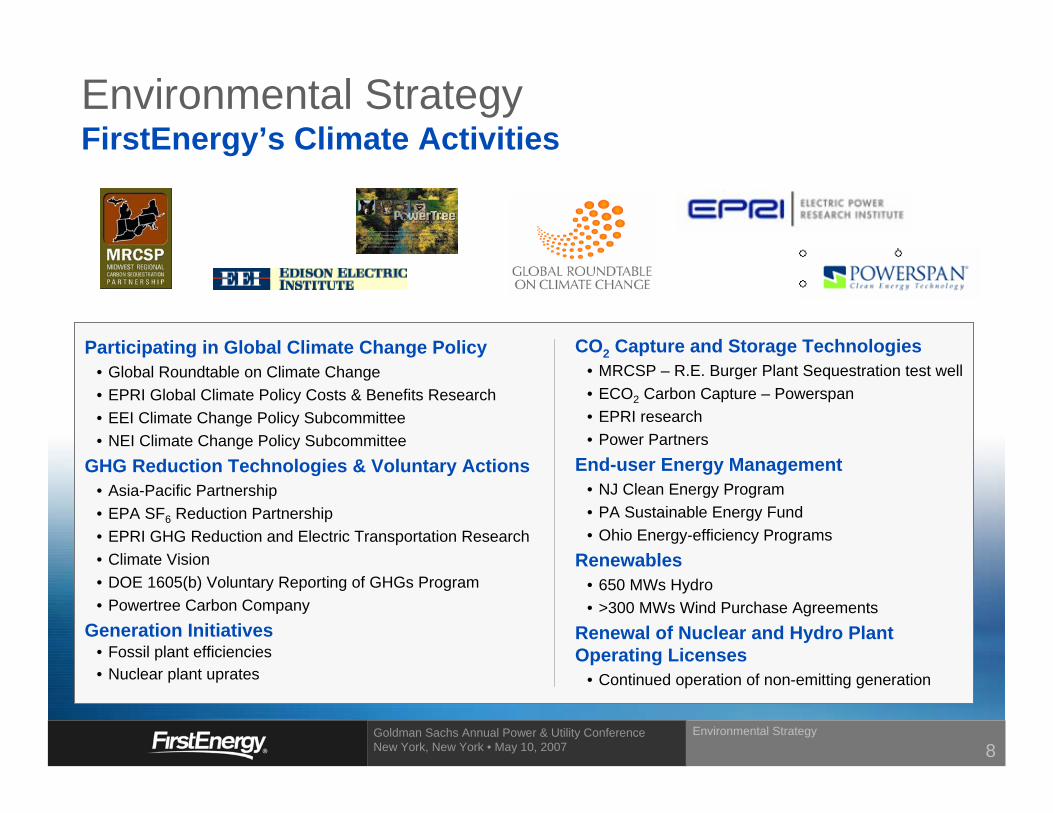
Participating in Global Climate Change Policy• Global Roundtable on Climate Change• EPRI Global Climate Policy Costs & Benefits Research• EEI Climate Change Policy Subcommittee• NEI Climate Change Policy Subcommittee
GHG Reduction Technologies & Voluntary Actions• Asia-Pacific Partnership• EPA SF6 Reduction Partnership• EPRI GHG Reduction and Electric Transportation Research• Climate Vision• DOE 1605(b) Voluntary Reporting of GHGs Program• Powertree Carbon Company
Generation Initiatives• Fossil plant efficiencies • Nuclear plant uprates
CO2 Capture and Storage Technologies• MRCSP – R.E. Burger Plant Sequestration test well• ECO2 Carbon Capture – Powerspan• EPRI research• Power Partners
End-user Energy Management• NJ Clean Energy Program• PA Sustainable Energy Fund• Ohio Energy-efficiency Programs
Renewables• 650 MWs Hydro• >300 MWs Wind Purchase Agreements
Renewal of Nuclear and Hydro Plant Operating Licenses
• Continued operation of non-emitting generation
Environmental StrategyFirstEnergy’s Climate Activities

Commodity Operations
Goldman Sachs Annual Power & Utility Conference New York, New York • May 10, 2007
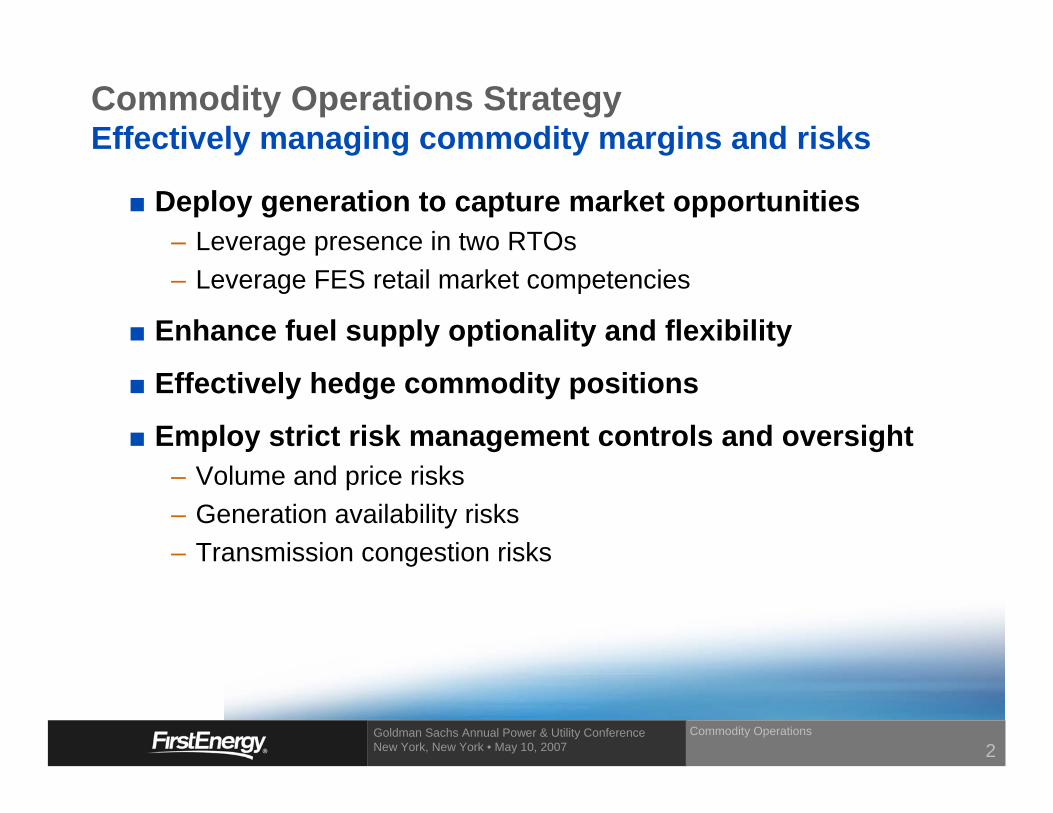
Deploy generation to capture market opportunities– Leverage presence in two RTOs– Leverage FES retail market competencies
Enhance fuel supply optionality and flexibility
Effectively hedge commodity positions
Employ strict risk management controls and oversight– Volume and price risks– Generation availability risks– Transmission congestion risks
Commodity Operations StrategyEffectively managing commodity margins and risks
Commodity Operations
2
Goldman Sachs Annual Power & Utility Conference New York, New York • May 10, 2007
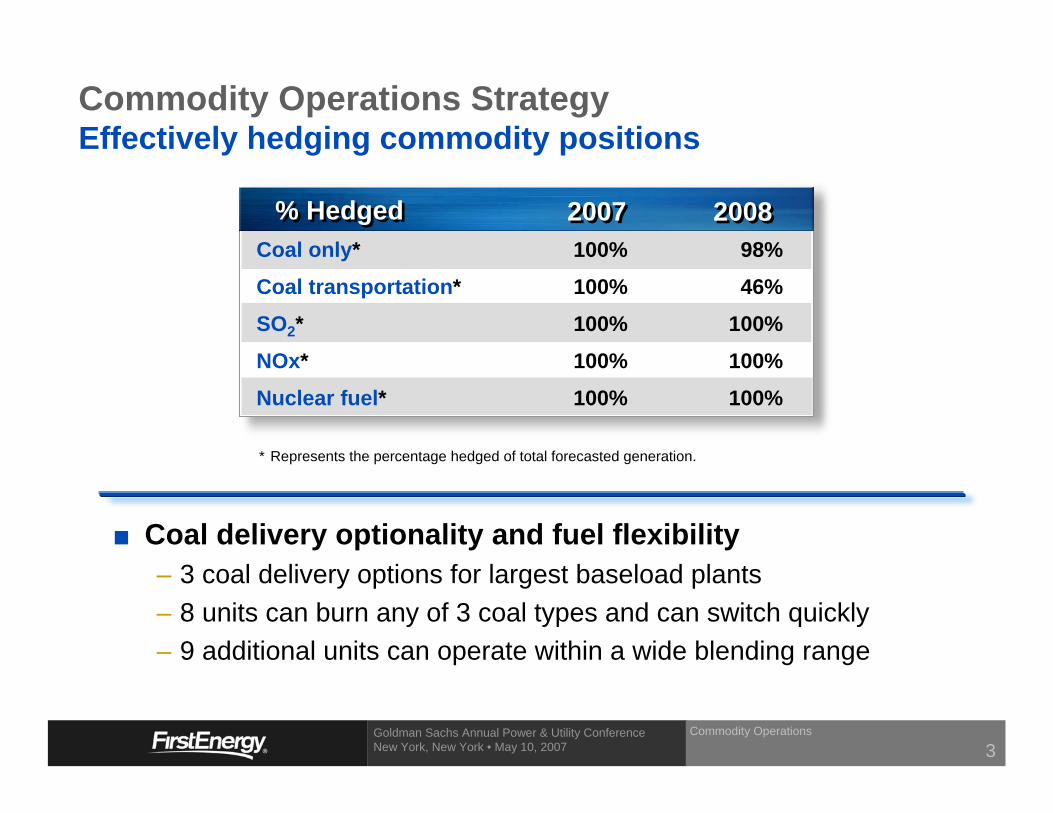
* Represents the percentage hedged of total forecasted generation.
Coal only* 100% 98%
Coal transportation* 100% 46%
SO2* 100% 100%
NOx* 100% 100%
Nuclear fuel* 100% 100%
% Hedged % Hedged 2008200820072007
Commodity Operations StrategyEffectively hedging commodity positions
Coal delivery optionality and fuel flexibility– 3 coal delivery options for largest baseload plants– 8 units can burn any of 3 coal types and can switch quickly– 9 additional units can operate within a wide blending range
Commodity Operations
3
Goldman Sachs Annual Power & Utility Conference New York, New York • May 10, 2007
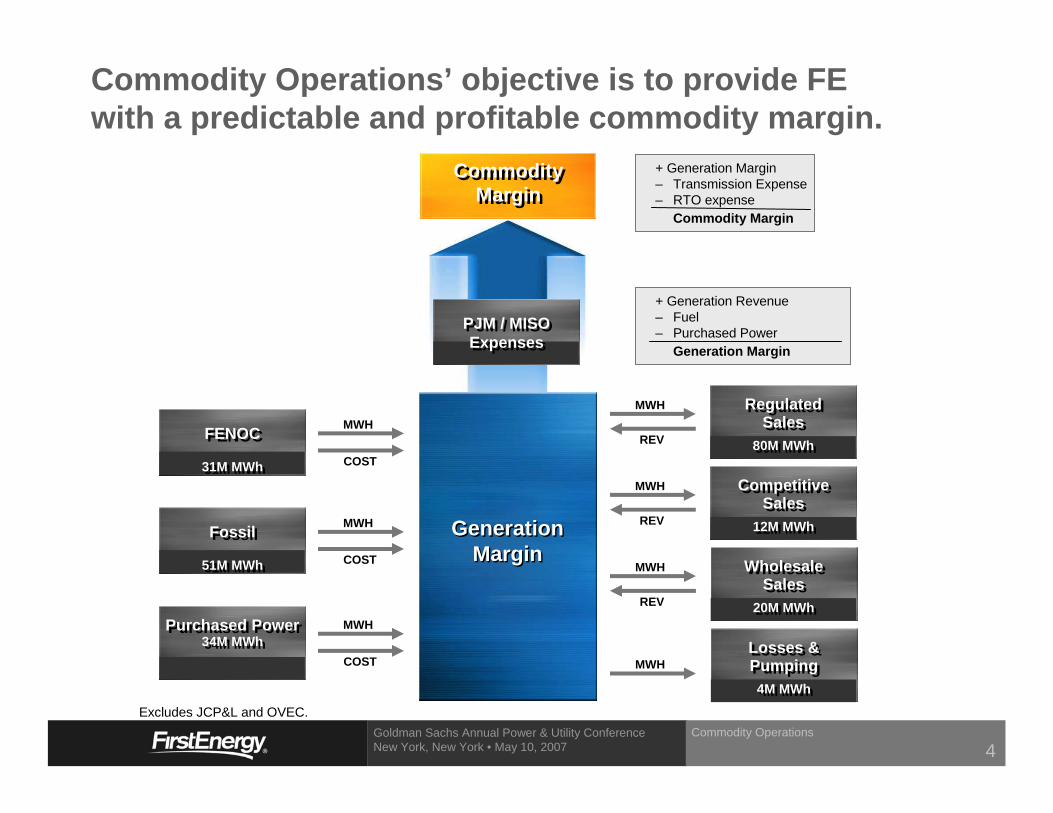
Commodity Operations’ objective is to provide FEwith a predictable and profitable commodity margin.
GenerationMargin
GenerationMargin
MWH
COST
FENOC
31M MWh
FENOC
31M MWh
MWH
COST
Fossil
51M MWh
Fossil
51M MWh
MWH
COST
Purchased Power34M MWh
Purchased Power34M MWh
MWH
REV
RegulatedSales
80M MWh
RegulatedSales
80M MWh
MWH
REV
CompetitiveSales
12M MWh
CompetitiveSales
12M MWh
MWH
REV
WholesaleSales
20M MWh
WholesaleSales
20M MWh
MWHLosses &Pumping4M MWh
Losses &Pumping4M MWh
+ Generation Revenue– Fuel– Purchased Power
Generation Margin
CommodityMargin
CommodityMargin
Excludes JCP&L and OVEC.
+ Generation Margin– Transmission Expense– RTO expense
Commodity Margin
PJM / MISO Expenses
PJM / MISO Expenses
Commodity Operations
4
Goldman Sachs Annual Power & Utility Conference New York, New York • May 10, 2007
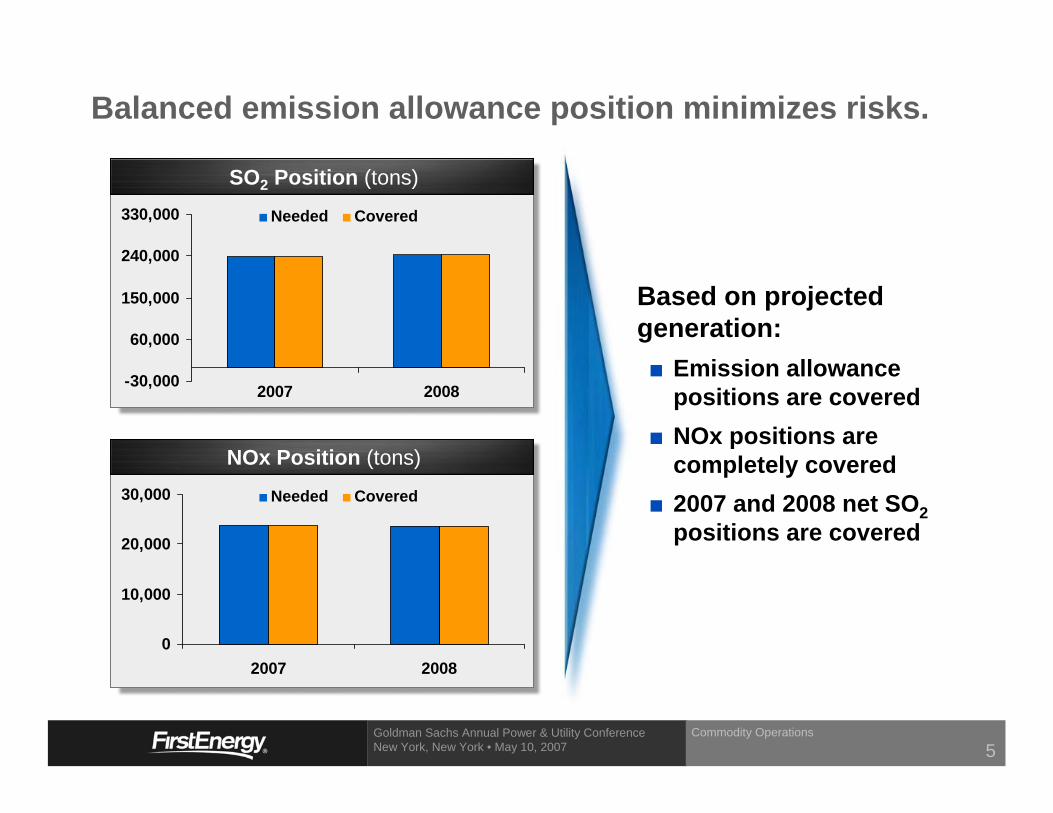
Balanced emission allowance position minimizes risks.
Based on projected generation:
Emission allowance positions are coveredNOx positions are completely covered2007 and 2008 net SO2positions are covered
SO2 Position (tons)
-30,000
60,000
150,000
240,000
330,000
2007 2008
Needed Covered
NOx Position (tons)
0
10,000
20,000
30,000
2007 2008
Needed Covered
Commodity Operations
5
Goldman Sachs Annual Power & Utility Conference New York, New York • May 10, 2007
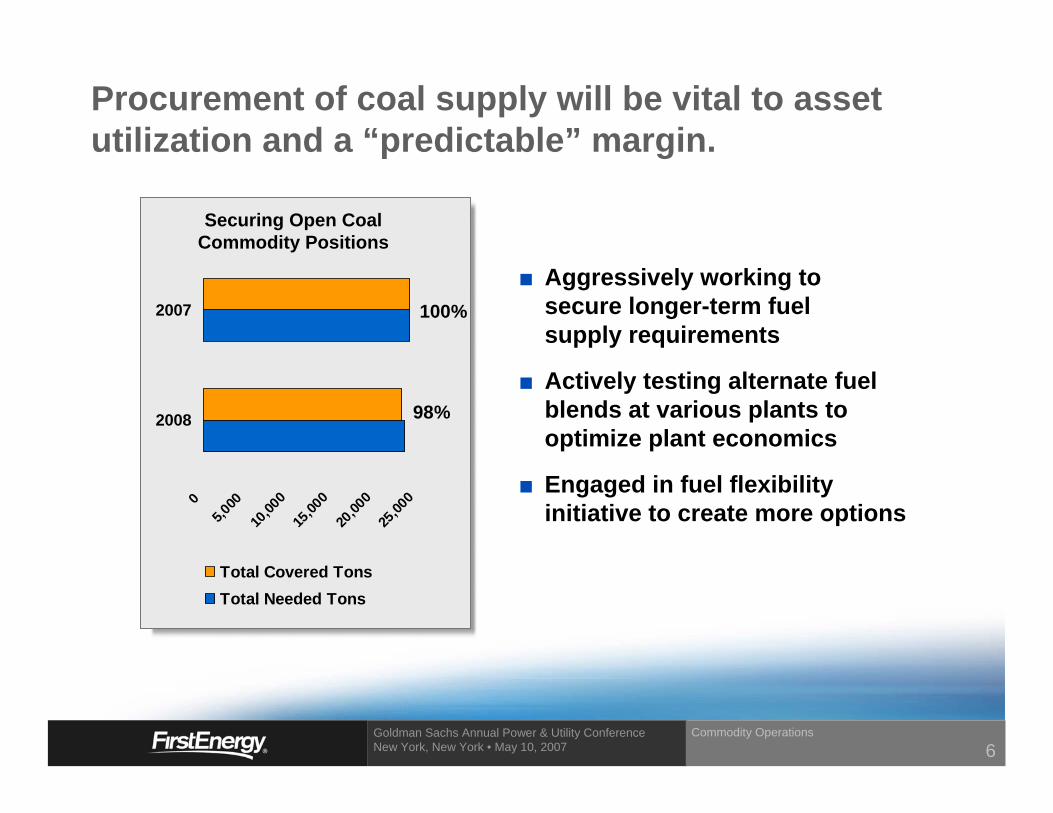
Procurement of coal supply will be vital to asset utilization and a “predictable” margin.
Aggressively working tosecure longer-term fuelsupply requirements
Actively testing alternate fuel blends at various plants to optimize plant economics
Engaged in fuel flexibility initiative to create more options
05,0
0010
,000
15,00
020
,000
25,00
0
2008
2007
Total Covered TonsTotal Needed Tons
98%
100%
Securing Open Coal Commodity Positions
Commodity Operations
6
Goldman Sachs Annual Power & Utility Conference New York, New York • May 10, 2007
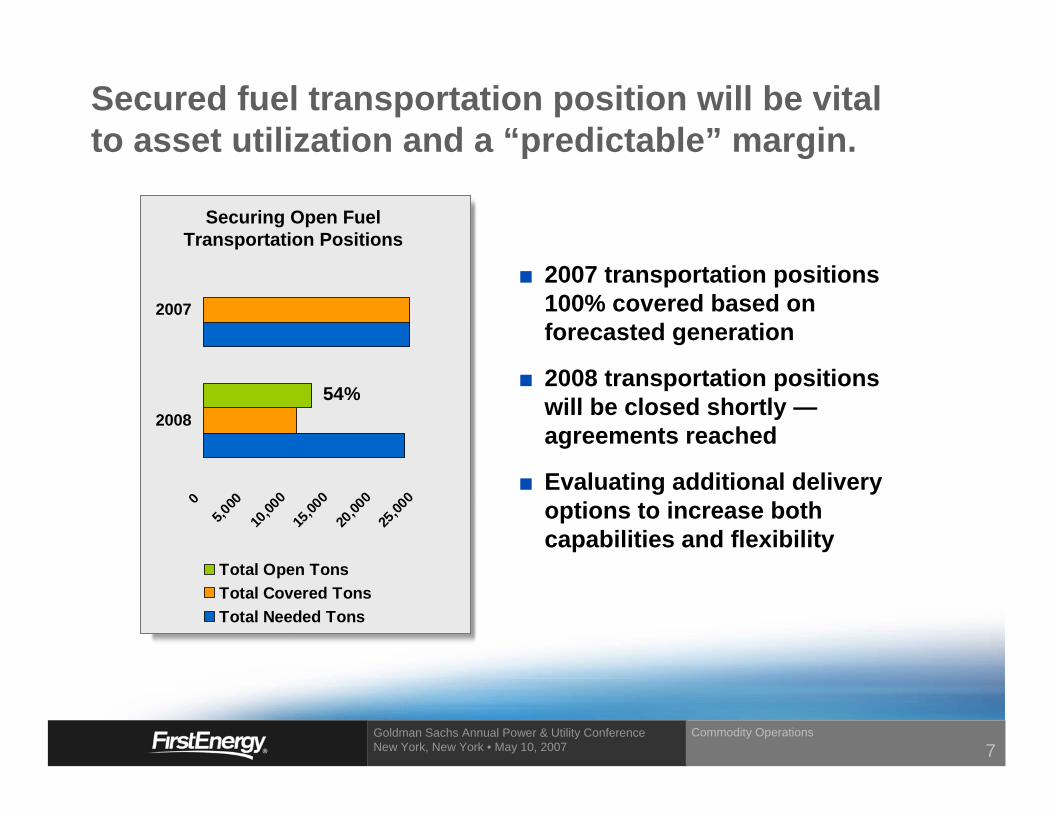
Secured fuel transportation position will be vital to asset utilization and a “predictable” margin.
2007 transportation positions100% covered based on forecasted generation
2008 transportation positions will be closed shortly —agreements reached
Evaluating additional delivery options to increase both capabilities and flexibility
54%
Securing Open Fuel Transportation Positions
05,0
0010
,000
15,00
020
,000
25,00
0
2008
2007
Total Open TonsTotal Covered TonsTotal Needed Tons
Commodity Operations
7
Goldman Sachs Annual Power & Utility Conference New York, New York • May 10, 2007
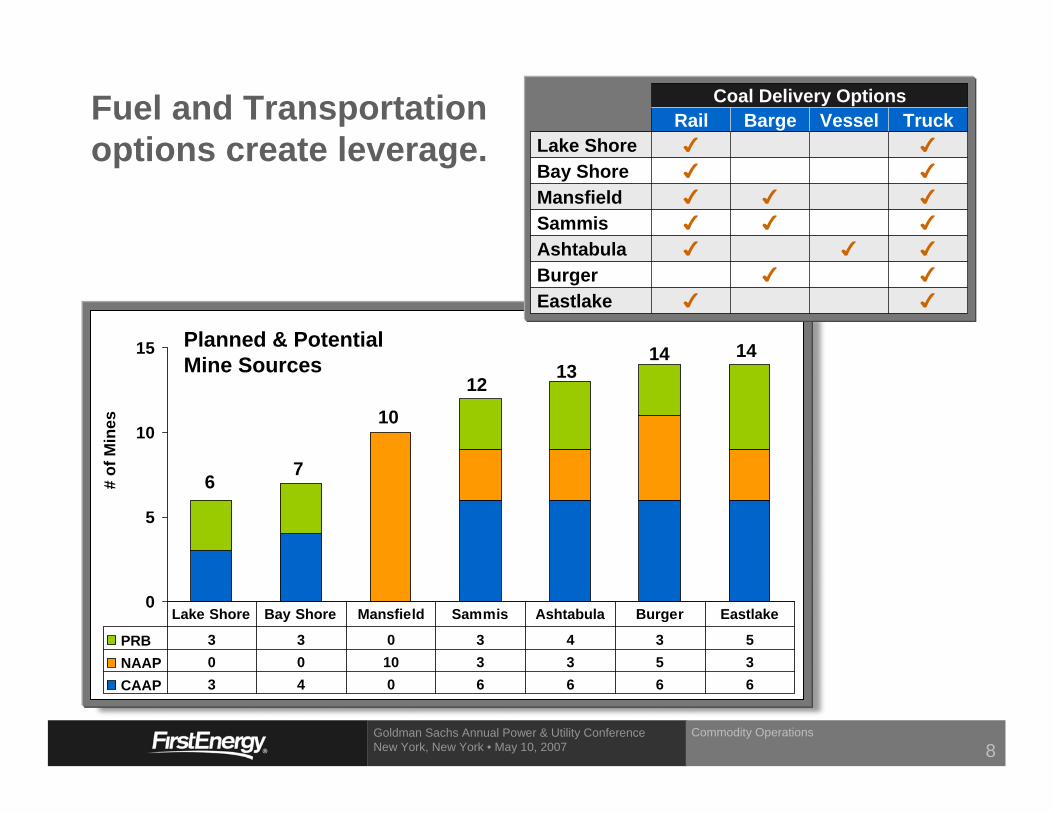
Fuel and Transportationoptions create leverage.
EastlakeBurgerAshtabulaSammisMansfieldBay ShoreLake Shore
TruckVesselBargeRailCoal Delivery Options
0
5
10
15
PRB 3 3 0 3 4 3 5NAAP 0 0 10 3 3 5 3CAAP 3 4 0 6 6 6 6
Lake Shore Bay Shore Mansfield Sammis Ashtabula Burger Eastlake
67
10
1213
14 14Planned & PotentialMine Sources
# of
Min
es
Commodity Operations
8
Goldman Sachs Annual Power & Utility Conference New York, New York • May 10, 2007
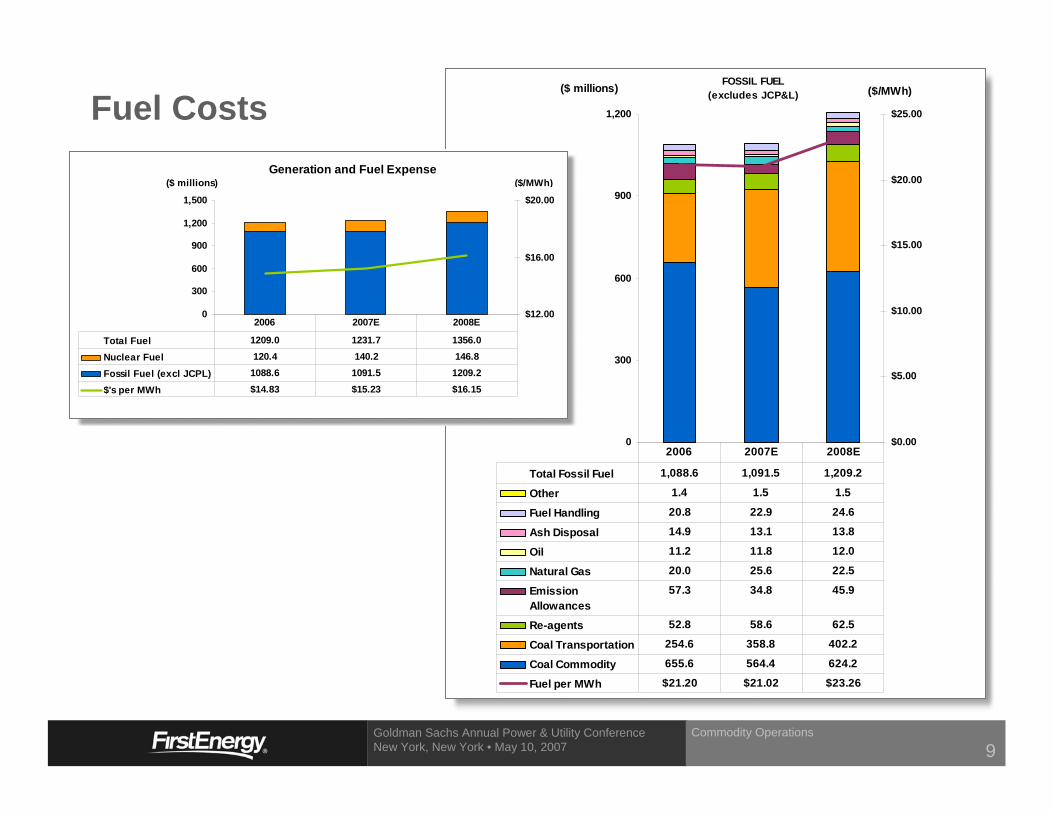
Fuel CostsGeneration and Fuel Expense
0
300
600
900
1,200
1,500
$12.00
$16.00
$20.00
Total Fuel 1209.0 1231.7 1356.0
Nuclear Fuel 120.4 140.2 146.8
Fossil Fuel (excl JCPL) 1088.6 1091.5 1209.2
$'s per MWh $14.83 $15.23 $16.15
2006 2007E 2008E
($ millions) ($/MWh)
FOSSIL FUEL (excludes JCP&L)
0
300
600
900
1,200
$0.00
$5.00
$10.00
$15.00
$20.00
$25.00
Total Fossil Fuel 1,088.6 1,091.5 1,209.2
Other 1.4 1.5 1.5
Fuel Handling 20.8 22.9 24.6
Ash Disposal 14.9 13.1 13.8
Oil 11.2 11.8 12.0
Natural Gas 20.0 25.6 22.5
EmissionAllowances
57.3 34.8 45.9
Re-agents 52.8 58.6 62.5
Coal Transportation 254.6 358.8 402.2
Coal Commodity 655.6 564.4 624.2
Fuel per MWh $21.20 $21.02 $23.26
2006 2007E 2008E
($ millions) ($/MWh)
Commodity Operations
9
Goldman Sachs Annual Power & Utility Conference New York, New York • May 10, 2007
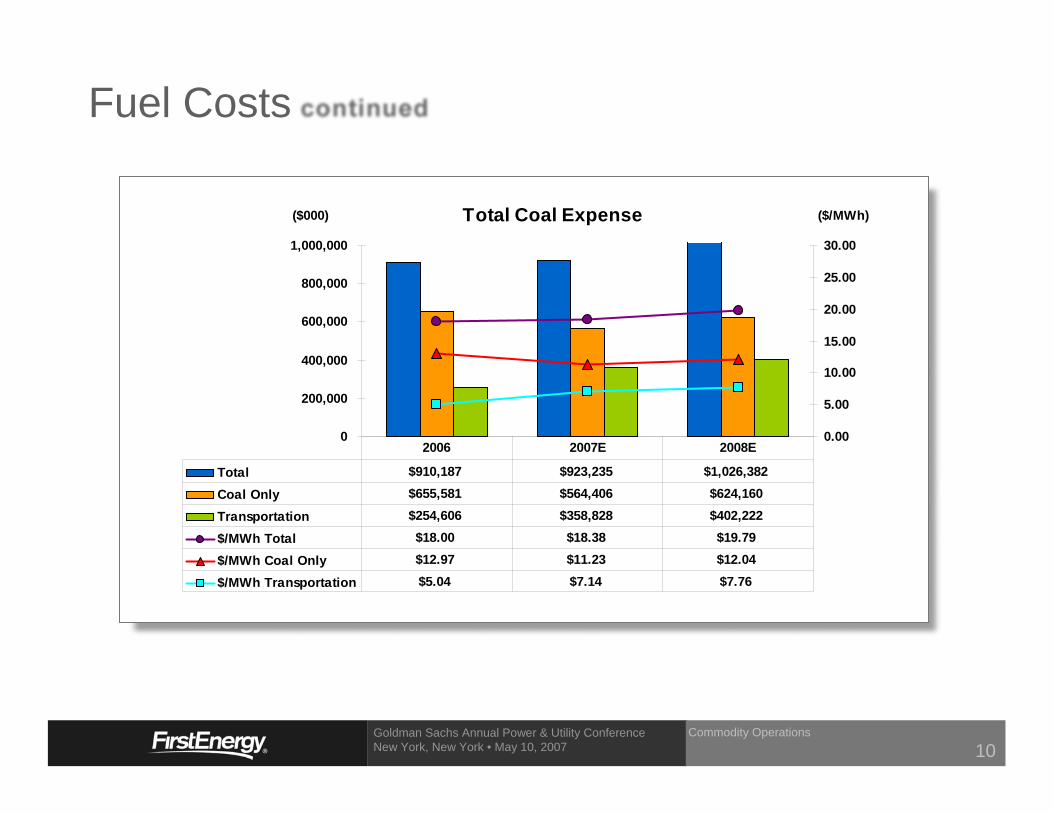
Fuel Costs
Total Coal Expense
0
200,000
400,000
600,000
800,000
1,000,000
($000)
0.00
5.00
10.00
15.00
20.00
25.00
30.00
($/MWh)
Total $910,187 $923,235 $1,026,382
Coal Only $655,581 $564,406 $624,160
Transportation $254,606 $358,828 $402,222
$/MWh Total $18.00 $18.38 $19.79
$/MWh Coal Only $12.97 $11.23 $12.04
$/MWh Transportation $5.04 $7.14 $7.76
2006 2007E 2008E
Commodity Operations
10
Goldman Sachs Annual Power & Utility Conference New York, New York • May 10, 2007
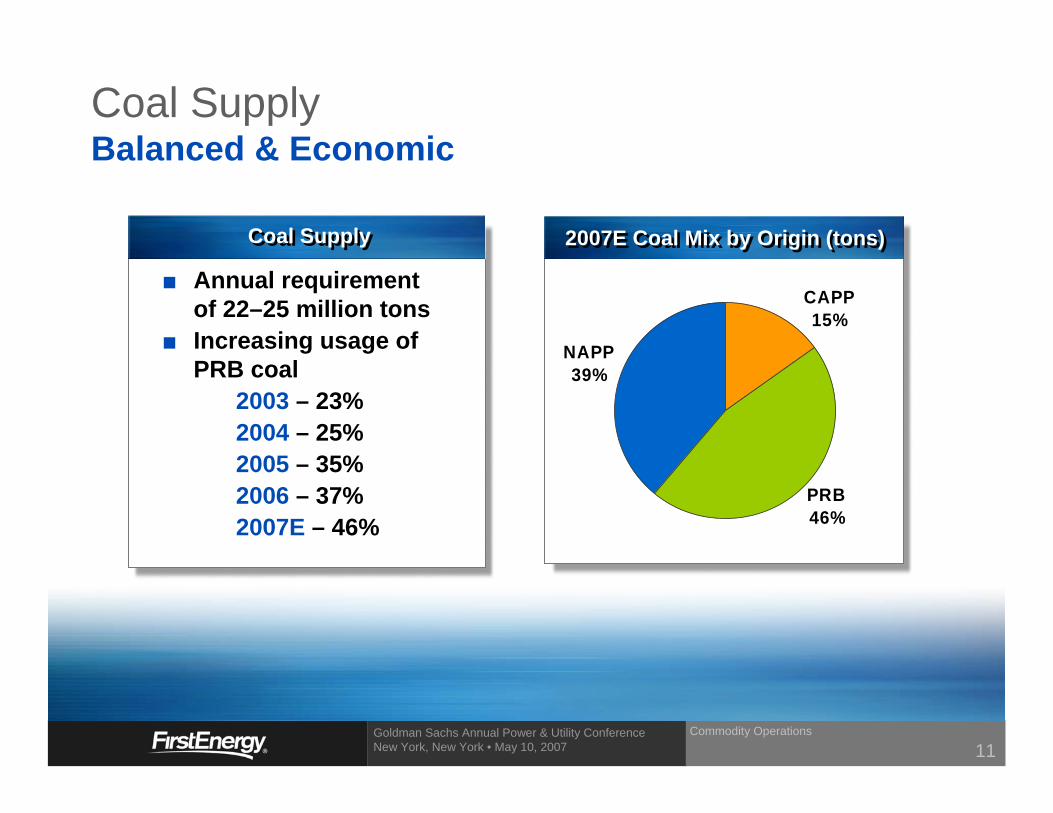
Annual requirementof 22–25 million tonsIncreasing usage ofPRB coal
2003 – 23%2004 – 25%2005 – 35%2006 – 37%2007E – 46%
Coal SupplyCoal Supply 2007E Coal Mix by Origin (tons)2007E Coal Mix by Origin (tons)
Coal SupplyBalanced & Economic
CAPP15%
PRB46%
NAPP39%
Commodity Operations
11


Energy Delivery
Goldman Sachs Annual Power & Utility Conference New York, New York • May 10, 2007
Continued focus on enhancing reliability and customer service
– Targeted reinvestment in T&D infrastructure – Leveraging technology
Implement “Energy Delivery Excellence Program”– Comprehensive review identified operational, technological,
scheduling, and financial control opportunities for improvement
Significant improvement in 2006 reliability metrics– Distribution SAIDI improved 20% – Transmission Outage Frequency per circuit is at top-decile
Energy Delivery StrategyTargeting improved operational & financial performance
Energy Delivery
2
Goldman Sachs Annual Power & Utility Conference New York, New York • May 10, 2007
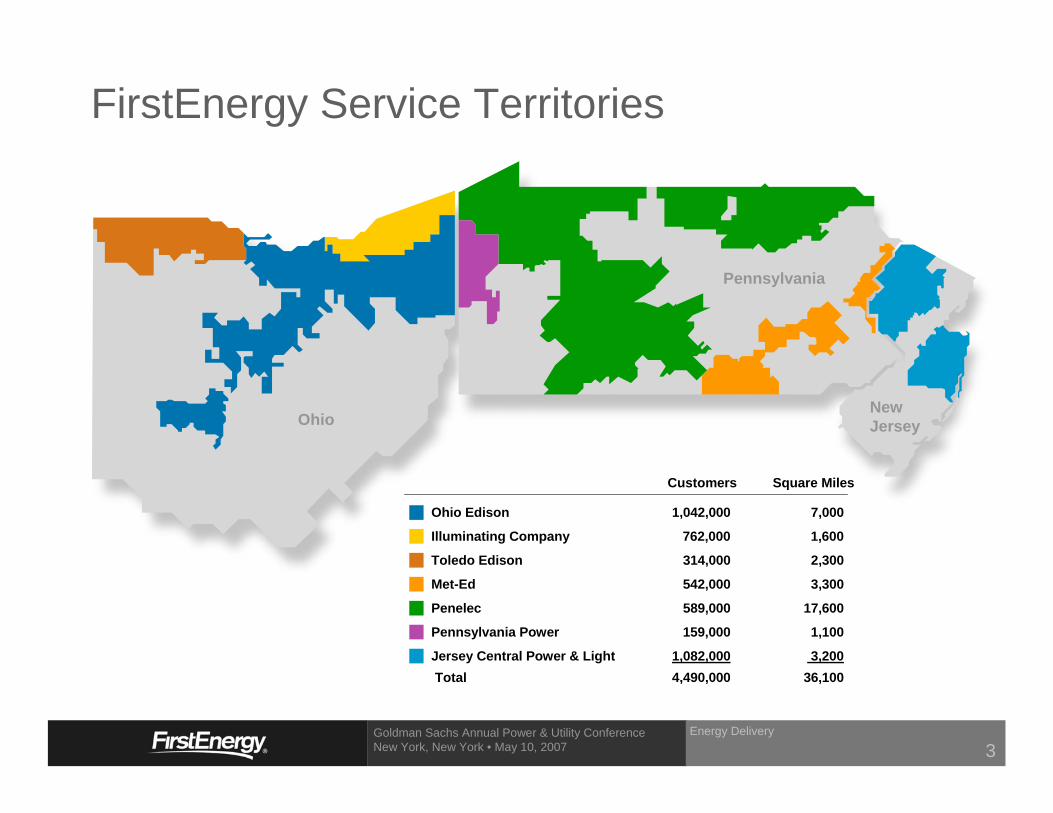
Ohio
Ohio Edison 1,042,000 7,000
Illuminating Company 762,000 1,600
Toledo Edison 314,000 2,300
Met-Ed 542,000 3,300
Penelec 589,000 17,600
Pennsylvania Power 159,000 1,100
Jersey Central Power & Light 1,082,000 3,200Total 4,490,000 36,100
Customers Square Miles
FirstEnergy Service Territories
Pennsylvania
NewJersey
Energy Delivery
3
Goldman Sachs Annual Power & Utility Conference New York, New York • May 10, 2007
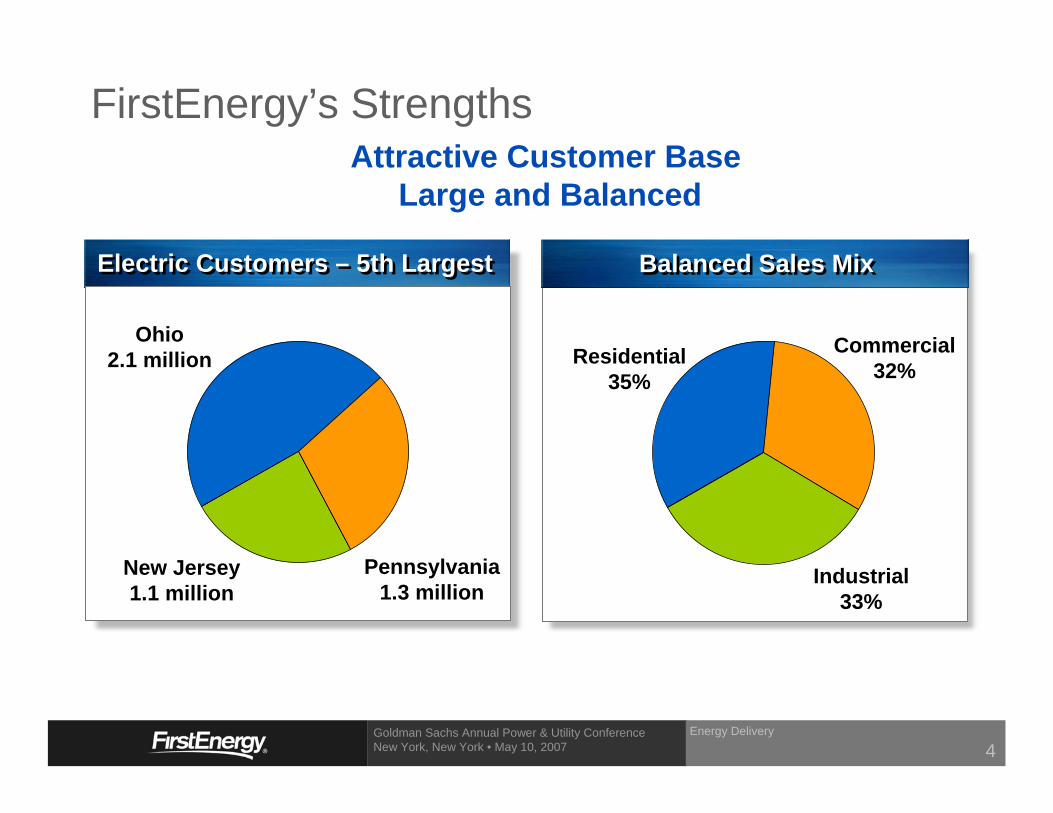
FirstEnergy’s Strengths
Electric Customers – 5th Largest Electric Customers – 5th Largest
Residential35%
Commercial32%
Ohio2.1 million
Pennsylvania1.3 million
New Jersey1.1 million
Attractive Customer BaseLarge and Balanced
Balanced Sales MixBalanced Sales Mix
Industrial33%
4Energy Delivery
Goldman Sachs Annual Power & Utility Conference New York, New York • May 10, 2007
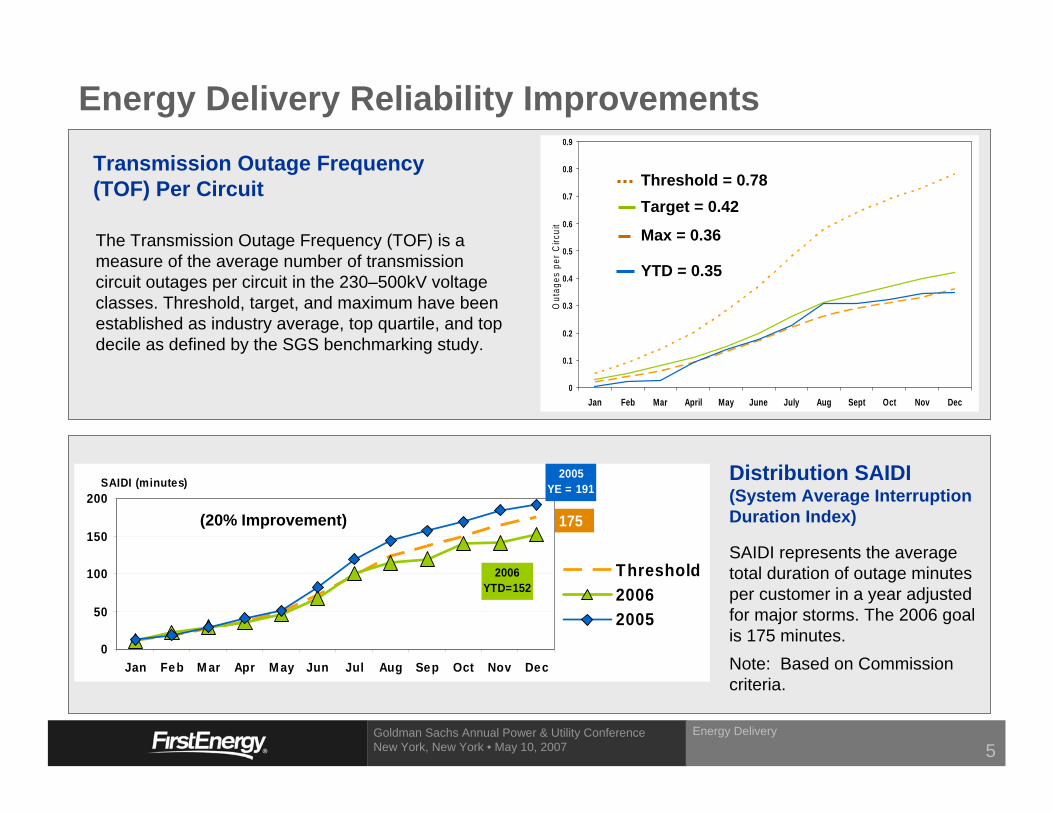
2006YTD=152
2005YE = 191
0
50
100
150
200
Jan Feb M ar Apr M ay Jun Jul Aug Sep Oct Nov Dec
SAIDI (minutes)
Threshold2006 2005
175
The Transmission Outage Frequency (TOF) is a measure of the average number of transmission circuit outages per circuit in the 230–500kV voltage classes. Threshold, target, and maximum have been established as industry average, top quartile, and top decile as defined by the SGS benchmarking study.
Transmission Outage Frequency (TOF) Per Circuit
SAIDI represents the averagetotal duration of outage minutesper customer in a year adjustedfor major storms. The 2006 goal is 175 minutes.Note: Based on Commission criteria.
Distribution SAIDI (System Average Interruption Duration Index)
Energy Delivery Reliability Improvements
Energy Delivery
(20% Improvement)
0
0.1
0.2
0.3
0.4
0.5
0.6
0.7
0.8
0.9
Jan Feb Mar April May June July Aug Sept Oct Nov Dec
Out
ages
per
Circ
uit
Threshold = 0.78Target = 0.42
Max = 0.36
YTD = 0.35
5
Goldman Sachs Annual Power & Utility Conference New York, New York • May 10, 2007
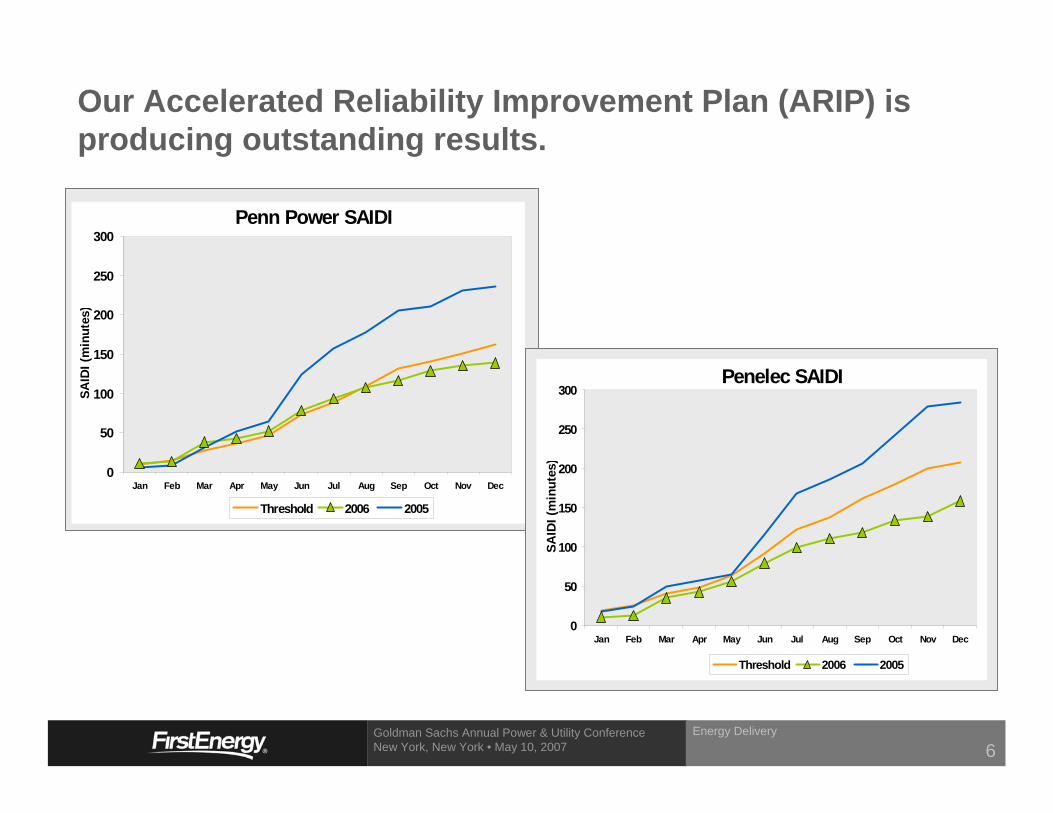
Our Accelerated Reliability Improvement Plan (ARIP) is producing outstanding results.
Energy Delivery
Penn Power SAIDI
0
50
100
150
200
250
300
Jan Feb Mar Apr May Jun Jul Aug Sep Oct Nov Dec
SAID
I (m
inut
es)
Threshold 2006 2005
6
Penelec SAIDI
0
50
100
150
200
250
300
Jan Feb Mar Apr May Jun Jul Aug Sep Oct Nov Dec
SAID
I (m
inut
es)
Threshold 2006 2005

Regulatory Matters
Goldman Sachs Annual Power & Utility Conference New York, New York • May 10, 2007
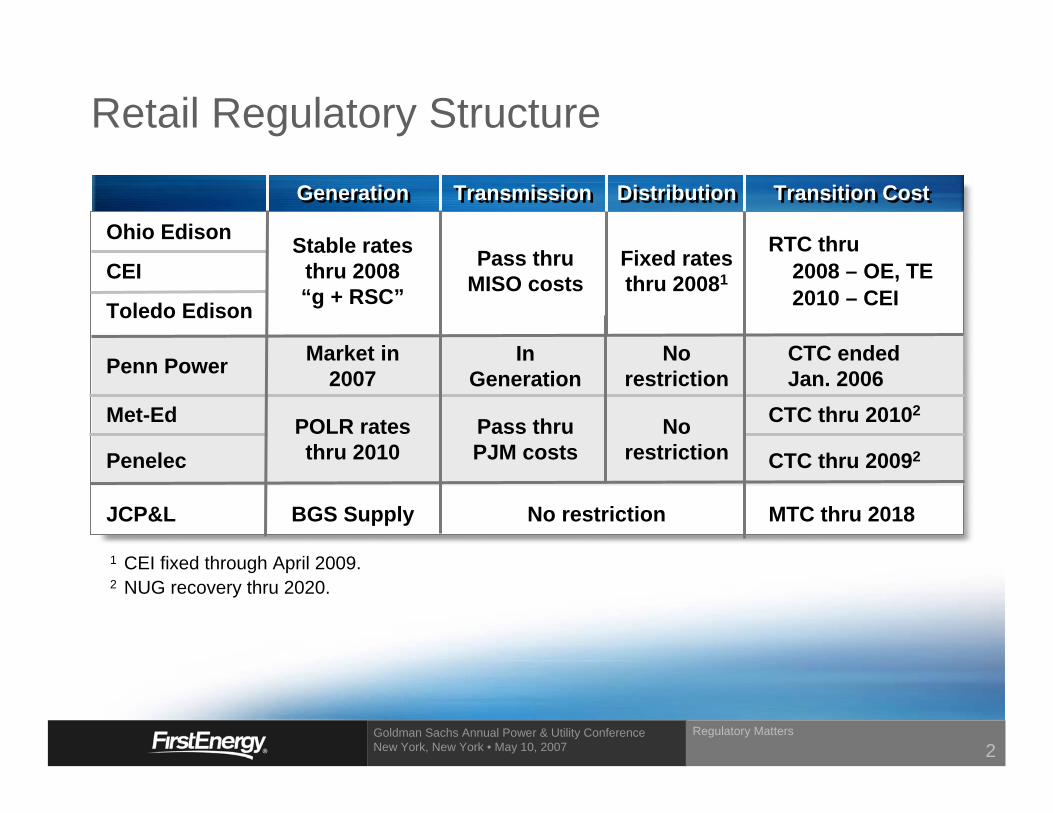
Retail Regulatory Structure
1 CEI fixed through April 2009.2 NUG recovery thru 2020.
Ohio Edison Stable ratesthru 2008“g + RSC”
RTC thru2008 – OE, TE2010 – CEI
Fixed ratesthru 20081
Pass thruMISO costs
Penn Power Market in2007
POLR ratesthru 2010
GenerationGeneration TransmissionTransmission DistributionDistribution Transition CostTransition Cost
Norestriction
JCP&L BGS Supply MTC thru 2018No restriction
Met-Ed
Penelec
Toledo Edison
CEI
CTC endedJan. 2006
CTC thru 20102
CTC thru 20092
Pass thruPJM costs
Norestriction
InGeneration
Regulatory Matters
2
Goldman Sachs Annual Power & Utility Conference New York, New York • May 10, 2007
Regulatory StrategyManaging the Transition to Competitive Markets
Successful transition to market-based generation ratesRFP process for 900 MW from Jan. 2007 – May 2008Average auction price of $85/MWh replaced $55/MWh for non-shoppersDefault Service Proposal (Phase II) filed May 2, 2007– Proposed full requirements product by class– Multiple RFPs with staggered delivery
– For default service period June 2008 - May 2011– Filing conforms with PPUC’s proposed default service rules– Three year phase-out of promotional generation rates
Penn PowerPennsylvania
Regulatory Matters
3
Goldman Sachs Annual Power & Utility Conference New York, New York • May 10, 2007
Regulatory StrategyManaging the Transition to Competitive Markets
Transition Plan Rate Case– Overall: $109M increase effective Jan. 12, 2007– Transmission recovery granted in full ($193M increase)– Generation increase of $219M denied– Distribution decrease of $84M; ROE set at 10.1%– Appeals to Commonwealth Court currently pending
– Met-Ed and Penelec have appealed PPUC’s decision on the denial of generation rate relief and on a consolidated tax adjustment
– Industrials and OCA have appealed Transmission recovery
NUG Accounting Case– ALJ Initial Decision was to deny the Companies’ request– Awaiting PPUC Final Order
Met-Ed and PenelecPennsylvania
Regulatory Matters
4
Goldman Sachs Annual Power & Utility Conference New York, New York • May 10, 2007
Regulatory Strategy Managing the Transition to Competitive Markets
Ohio Senate Bill 3 – Ohio Restructuring Legislation(July 1999)
Generation Asset Transfer completed (4Q 2005)Rate Certainty Plan approved (Jan. 2006)– Stable transition for customers/companies through 2008– Provides for synchronization of the following in 2009:
– Distribution rate increase, including recovery ofRCP deferrals
– Market-based generation rates– Elimination/reduction of transition cost recovery
Regulatory Matters
5
Goldman Sachs Annual Power & Utility Conference New York, New York • May 10, 2007
Regulatory Strategy Managing the Transition to Competitive Markets
OhioRate shock experienced in other states not likelyfor FirstEnergy
Termination/reduction of transition cost recovery(average of $15/MWh in 2008) will substantially mitigate any price increases to customers
Well positioned to participate in development of the post-2008 market structure in Ohio
Regulatory Matters
6

Financial Matters
Goldman Sachs Annual Power & Utility Conference New York, New York • May 10, 2007
Execute Mansfield Unit 1 sale and leaseback transaction
Continue to use cash to benefit shareholders– Sustainable common stock dividend growth
– 11.1% increase (March 1, 2007)
– Share repurchase – 14.4 million ASR (March 2, 2007)
– Reinvest in business to generate future earnings
Continue focus on capital structure management– Additional transfers of tax-exempt debt from operating companies– Appropriately capitalize operating companies– Obtain investment grade credit rating at FE Solutions
Deliver consistent and predictable financial results
Financial Strategy2007 Focal Points
Financial Matters
2
Goldman Sachs Annual Power & Utility Conference New York, New York • May 10, 2007
Financial StrategySale and Leaseback – Mansfield Unit 1
Retain operating control of assetCapture benefit of $785M of expiring tax capital loss carryforwardsProjected after-tax cash proceeds of $1.2B – Current use of proceeds assumptions
– $900M Share repurchase– $193M Pension contribution (after-tax)– $107M Short-term debt paydown
NPV expected to exceed $500MLow-cost source of financing Potential capital structure impact– Maximum debt leverage impact of 200 bp
Target closing in 2nd Qtr 2007
Financial Matters
3
Goldman Sachs Annual Power & Utility Conference New York, New York • May 10, 2007
Financial StrategyShare Repurchase
On March 2, FE repurchased 14.4 million shares– Represents approx. 4.5% of outstanding shares– $900M ASR at initial price of $62.63 per share– Final purchase price to be adjusted to reflect volume-weighted
average price of stock during acquisition period (up to approximately one year)
Coupled with Aug. 2006 ASR program of 10.6 million shares, total buy-backs equal approx. 7.6% of shares outstanding
Projected net earnings impact from both buy-backs is approx. $0.18 per share in 2007 vs. 2006
Financial Matters
4
Goldman Sachs Annual Power & Utility Conference New York, New York • May 10, 2007
Financial StrategyPension Contribution
Previously contributed $1B to plan during 2004–2005Pension Protection Act of 2006 changed plan funding rules$300M contribution ($193M after-tax) made in JanuaryIncreases plan funding– Improves PBO funded ratio to 105%
Financial impact of contribution equates to 15% pre-taxcash return, 9% after-tax returnAccretive to annual earnings by approx. $0.05 per shareFAS 87/106 Cost: 2006 $ 94 M
2007E (89) M$ (183) M
5Financial Matters
Goldman Sachs Annual Power & Utility Conference New York, New York • May 10, 2007
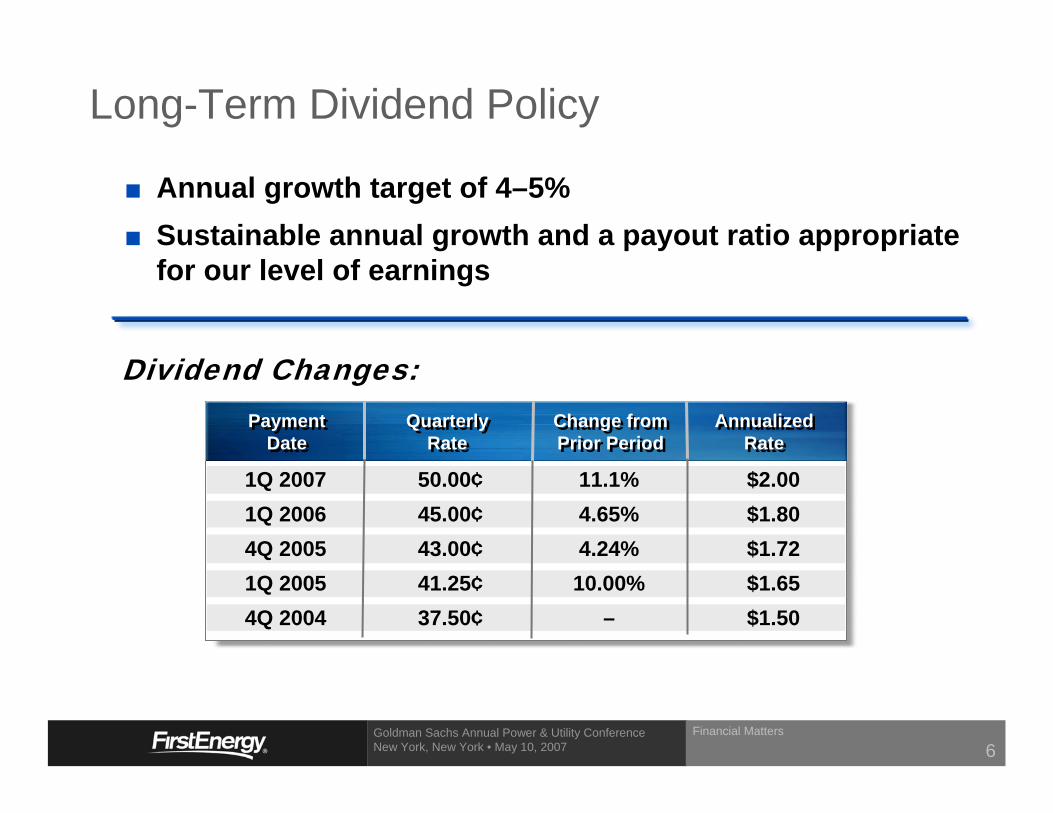
Long-Term Dividend Policy
Annual growth target of 4–5%Sustainable annual growth and a payout ratio appropriate for our level of earnings
Dividend Changes:Change fromPrior Period
Change fromPrior Period
Payment Date
Payment Date
Quarterly Rate
Quarterly Rate
AnnualizedRate
AnnualizedRate
1Q 2007 50.00¢ 11.1% $2.001Q 2006 45.00¢ 4.65% $1.804Q 2005 43.00¢ 4.24% $1.721Q 2005 41.25¢ 10.00% $1.654Q 2004 37.50¢ – $1.50
Financial Matters
6
Goldman Sachs Annual Power & Utility Conference New York, New York • May 10, 2007
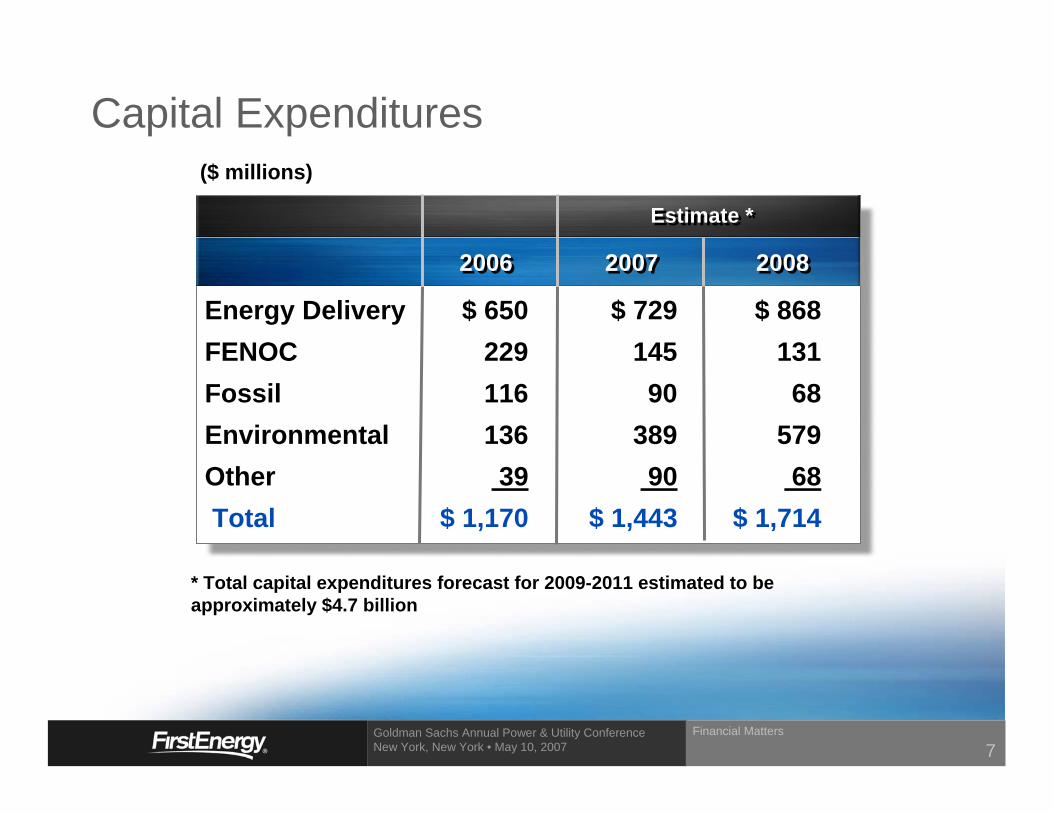
($ millions)
20062006 20072007 20082008
Energy Delivery $ 650 $ 729 $ 868FENOC 229 145 131Fossil 116 90 68Environmental 136 389 579Other 39 90 68Total $ 1,170 $ 1,443 $ 1,714
Estimate *Estimate *
Capital Expenditures
Financial Matters
7
* Total capital expenditures forecast for 2009-2011 estimated to be approximately $4.7 billion
Goldman Sachs Annual Power & Utility Conference New York, New York • May 10, 2007
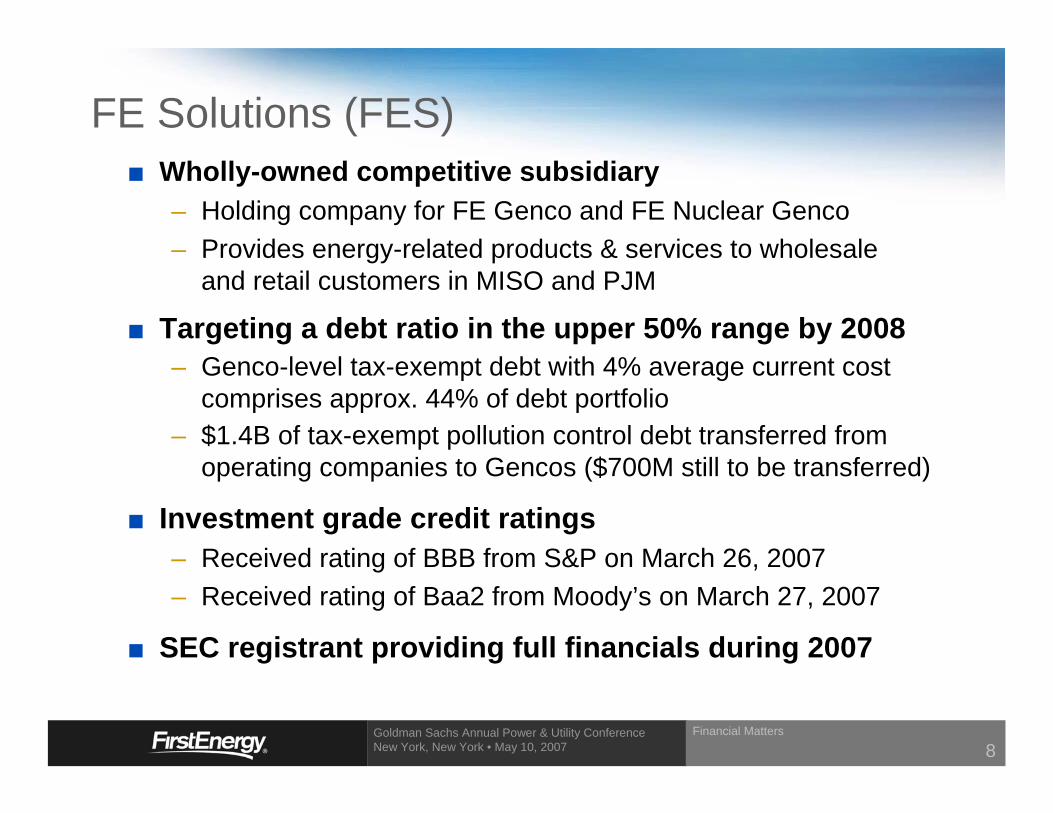
FE Solutions (FES)Wholly-owned competitive subsidiary– Holding company for FE Genco and FE Nuclear Genco– Provides energy-related products & services to wholesale
and retail customers in MISO and PJM
Targeting a debt ratio in the upper 50% range by 2008– Genco-level tax-exempt debt with 4% average current cost
comprises approx. 44% of debt portfolio– $1.4B of tax-exempt pollution control debt transferred from
operating companies to Gencos ($700M still to be transferred)
Investment grade credit ratings– Received rating of BBB from S&P on March 26, 2007– Received rating of Baa2 from Moody’s on March 27, 2007
SEC registrant providing full financials during 2007
Financial Matters
8
Goldman Sachs Annual Power & Utility Conference New York, New York • May 10, 2007
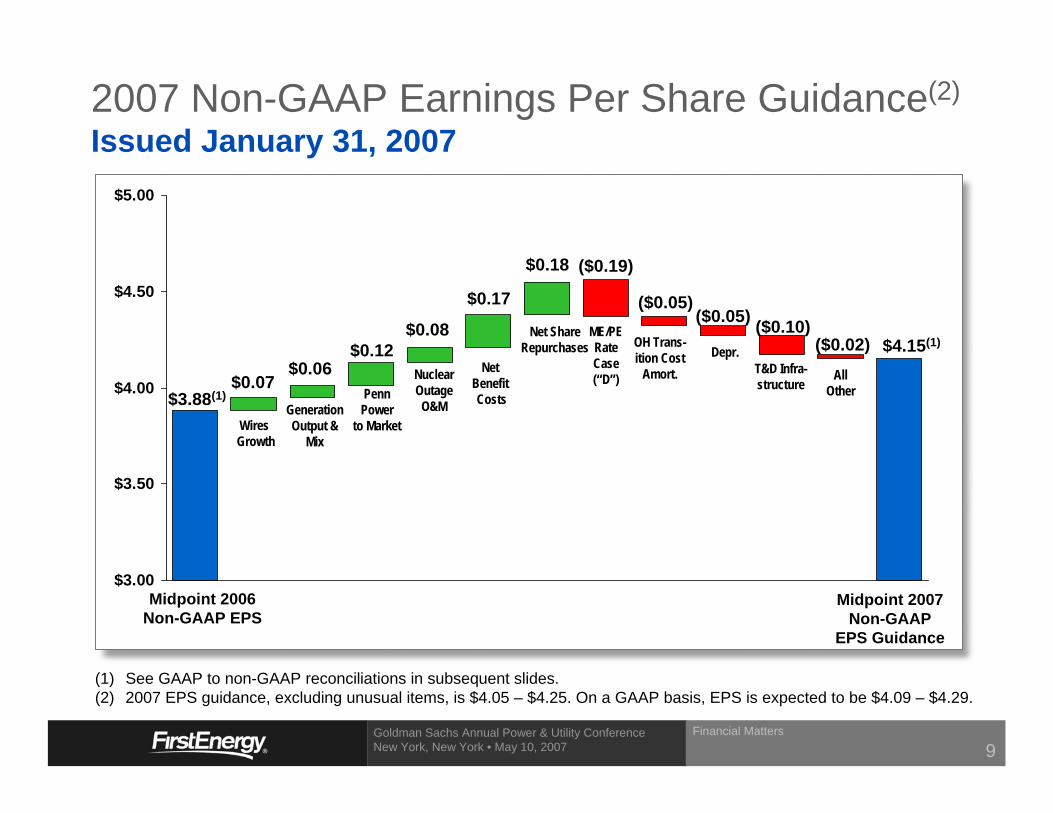
$3.00
$3.50
$4.00
$4.50
$5.00
$3.88(1)
($0.05)
$0.07
($0.05)$4.15(1)
$0.18
Midpoint 2006 Non-GAAP EPS
GenerationOutput &
MixWiresGrowth
T&D Infra-structure
Midpoint 2007 Non-GAAP
EPS Guidance
$0.06
$0.17
($0.19)
NetBenefitCosts
ME/PERate Case (“D”)
OH Trans-ition Cost
Amort.
2007 Non-GAAP Earnings Per Share Guidance(2)
Issued January 31, 2007
(1) See GAAP to non-GAAP reconciliations in subsequent slides. (2) 2007 EPS guidance, excluding unusual items, is $4.05 – $4.25. On a GAAP basis, EPS is expected to be $4.09 – $4.29.
Net Share Repurchases Depr.
($0.10)
Penn Power
to Market
$0.12All
OtherNuclear Outage O&M
$0.08($0.02)
Financial Matters
9
Goldman Sachs Annual Power & Utility Conference New York, New York • May 10, 2007
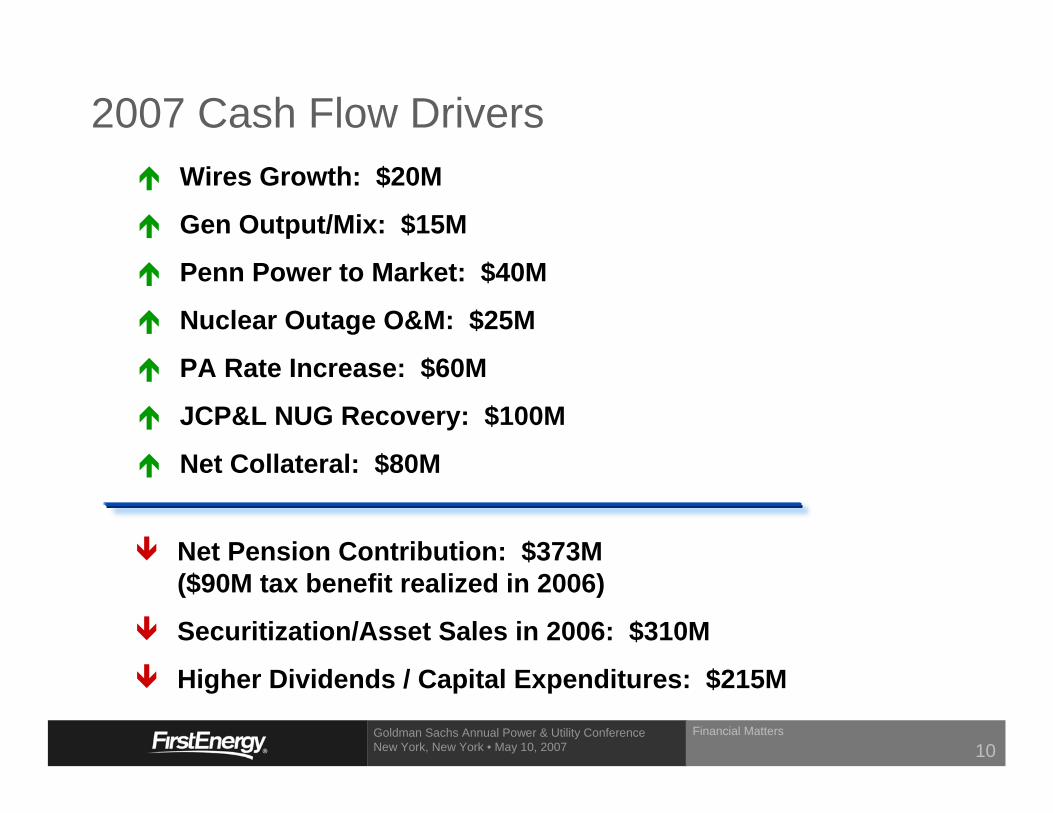
Net Pension Contribution: $373M ($90M tax benefit realized in 2006)
Securitization/Asset Sales in 2006: $310M
Higher Dividends / Capital Expenditures: $215M
Wires Growth: $20M
Gen Output/Mix: $15M
Penn Power to Market: $40M
Nuclear Outage O&M: $25M
PA Rate Increase: $60M
JCP&L NUG Recovery: $100M
Net Collateral: $80M
2007 Cash Flow Drivers
Financial Matters
10
Goldman Sachs Annual Power & Utility Conference New York, New York • May 10, 2007
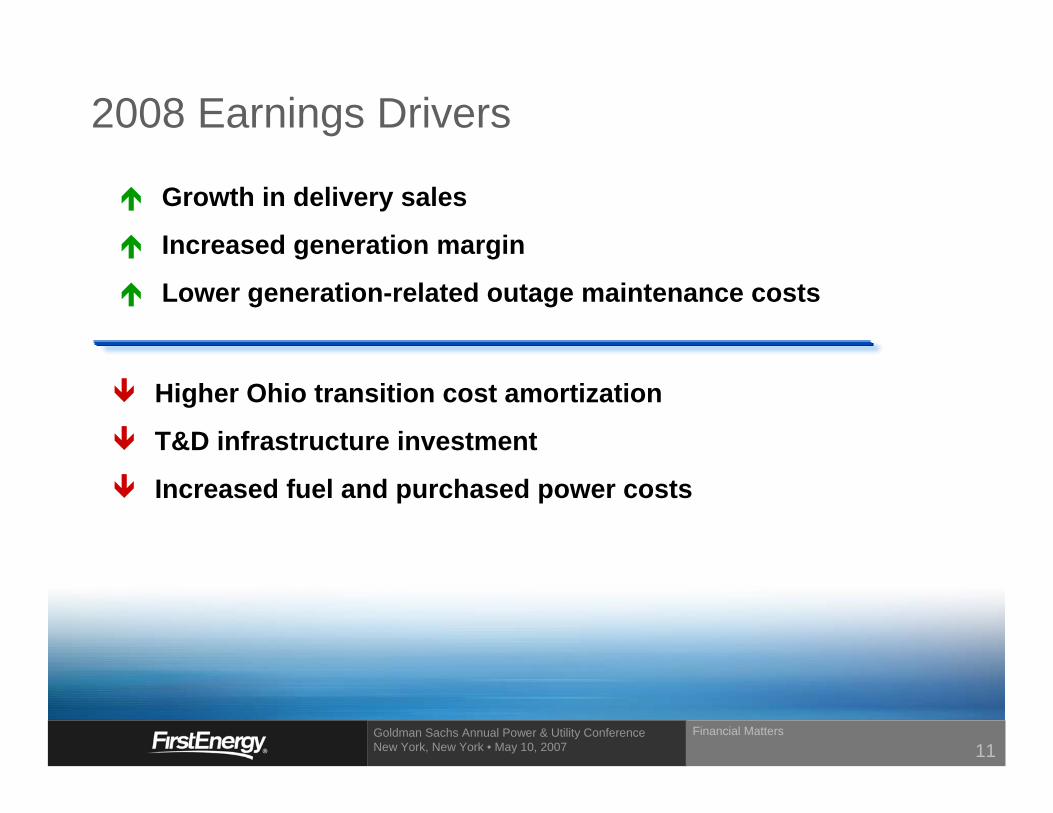
Higher Ohio transition cost amortization
T&D infrastructure investment
Increased fuel and purchased power costs
Growth in delivery sales
Increased generation margin
Lower generation-related outage maintenance costs
2008 Earnings Drivers
Financial Matters
11
Goldman Sachs Annual Power & Utility Conference New York, New York • May 10, 2007
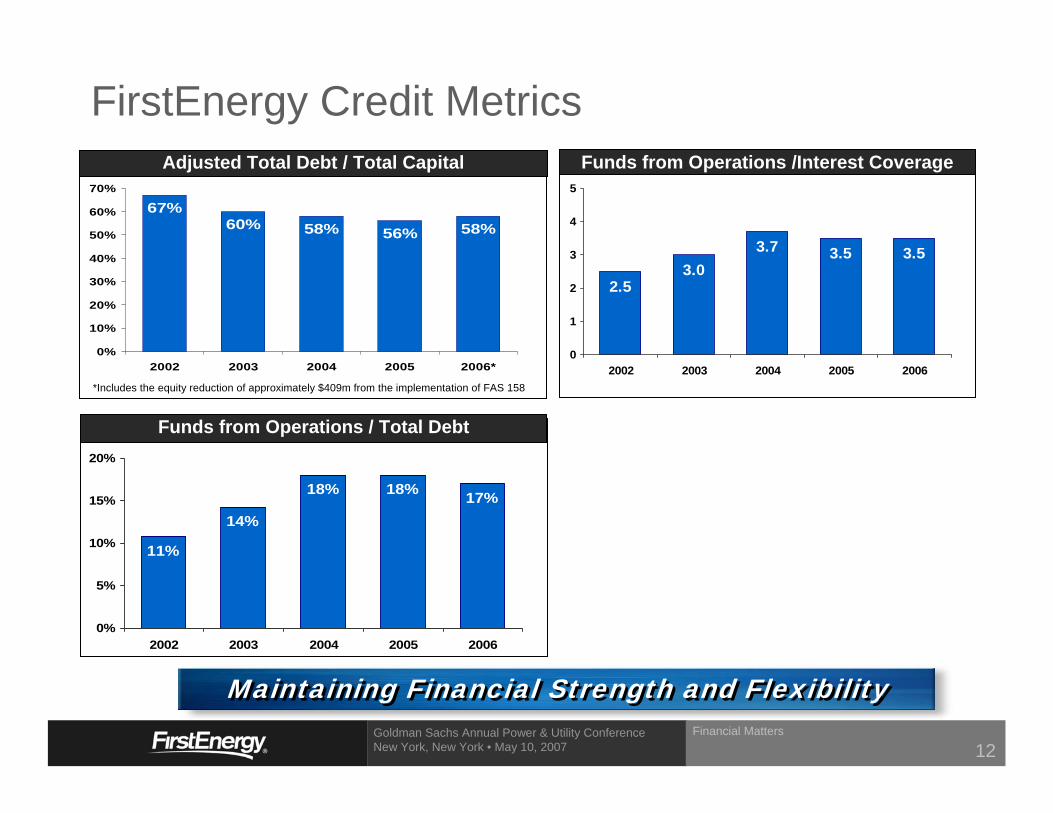
Adjusted Total Debt / Total Capital Funds from Operations /Interest Coverage
Funds from Operations / Total Debt
Maintaining Financial Strength and FlexibilityMaintaining Financial Strength and Flexibility
3.53.53.73.0
2.5
0
1
2
3
4
5
2002 2003 2004 2005 2006
17%18%18%
14%
11%
0%
5%
10%
15%
20%
2002 2003 2004 2005 2006
58%56%58%60%67%
0%
10%
20%
30%
40%
50%
60%
70%
2002 2003 2004 2005 2006*
FirstEnergy Credit Metrics
*Includes the equity reduction of approximately $409m from the implementation of FAS 158
Financial Matters
12
Goldman Sachs Annual Power & Utility Conference New York, New York • May 10, 2007
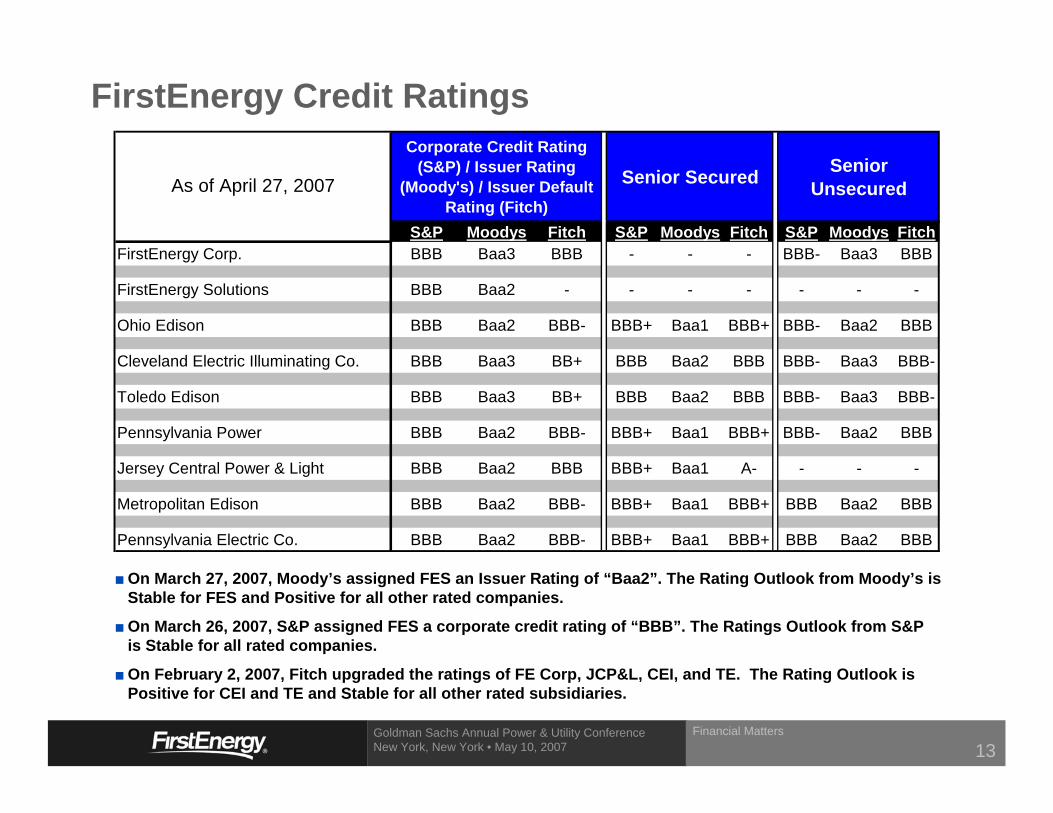
FirstEnergy Credit Ratings
On March 27, 2007, Moody’s assigned FES an Issuer Rating of “Baa2”. The Rating Outlook from Moody’s is Stable for FES and Positive for all other rated companies.
On March 26, 2007, S&P assigned FES a corporate credit rating of “BBB”. The Ratings Outlook from S&P is Stable for all rated companies.
On February 2, 2007, Fitch upgraded the ratings of FE Corp, JCP&L, CEI, and TE. The Rating Outlook is Positive for CEI and TE and Stable for all other rated subsidiaries.
Corporate Credit Rating (S&P) / Issuer Rating
(Moody's) / Issuer Default Rating (Fitch)
Senior Secured Senior Unsecured
S&P Moodys Fitch S&P Moodys Fitch S&P Moodys FitchFirstEnergy Corp. BBB Baa3 BBB - - - BBB- Baa3 BBB
FirstEnergy Solutions BBB Baa2 - - - - - - -
Ohio Edison BBB Baa2 BBB- BBB+ Baa1 BBB+ BBB- Baa2 BBB
Cleveland Electric Illuminating Co. BBB Baa3 BB+ BBB Baa2 BBB BBB- Baa3 BBB-
Toledo Edison BBB Baa3 BB+ BBB Baa2 BBB BBB- Baa3 BBB-
Pennsylvania Power BBB Baa2 BBB- BBB+ Baa1 BBB+ BBB- Baa2 BBB
Jersey Central Power & Light BBB Baa2 BBB BBB+ Baa1 A- - - -
Metropolitan Edison BBB Baa2 BBB- BBB+ Baa1 BBB+ BBB Baa2 BBB
Pennsylvania Electric Co. BBB Baa2 BBB- BBB+ Baa1 BBB+ BBB Baa2 BBB
As of April 27, 2007
Financial Matters
13
Goldman Sachs Annual Power & Utility Conference New York, New York • May 10, 2007
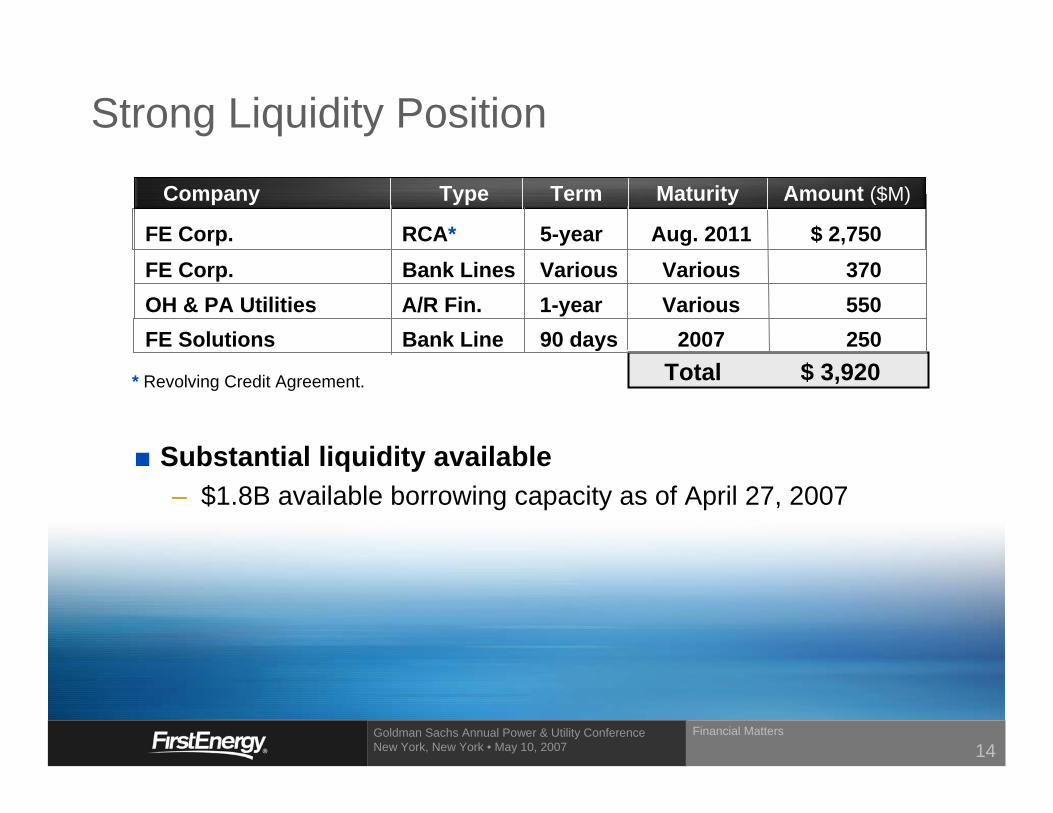
Strong Liquidity Position
Substantial liquidity available– $1.8B available borrowing capacity as of April 27, 2007
Company Type Term Maturity Amount ($M)FE Corp. RCA* 5-year Aug. 2011 $ 2,750FE Corp. Bank Lines Various Various 370OH & PA Utilities A/R Fin. 1-year Various 550FE Solutions Bank Line 90 days 2007 250
Company Type Term Maturity Amount ($M)
Total $ 3,920* Revolving Credit Agreement.
Financial Matters
14
Goldman Sachs Annual Power & Utility Conference New York, New York • May 10, 2007
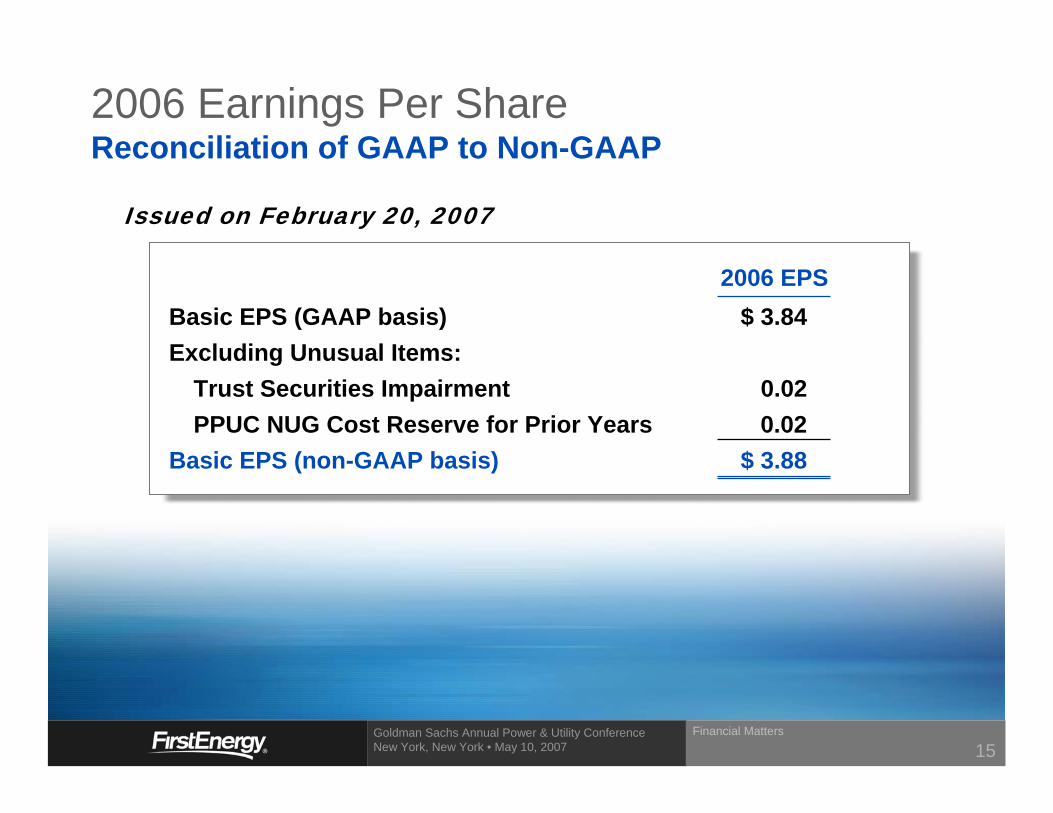
Issued on February 20, 2007
2006 Earnings Per Share Reconciliation of GAAP to Non-GAAP
2006 EPSBasic EPS (GAAP basis) $ 3.84Excluding Unusual Items:
Trust Securities Impairment 0.02PPUC NUG Cost Reserve for Prior Years 0.02
Basic EPS (non-GAAP basis) $ 3.88
Financial Matters
15
Goldman Sachs Annual Power & Utility Conference New York, New York • May 10, 2007
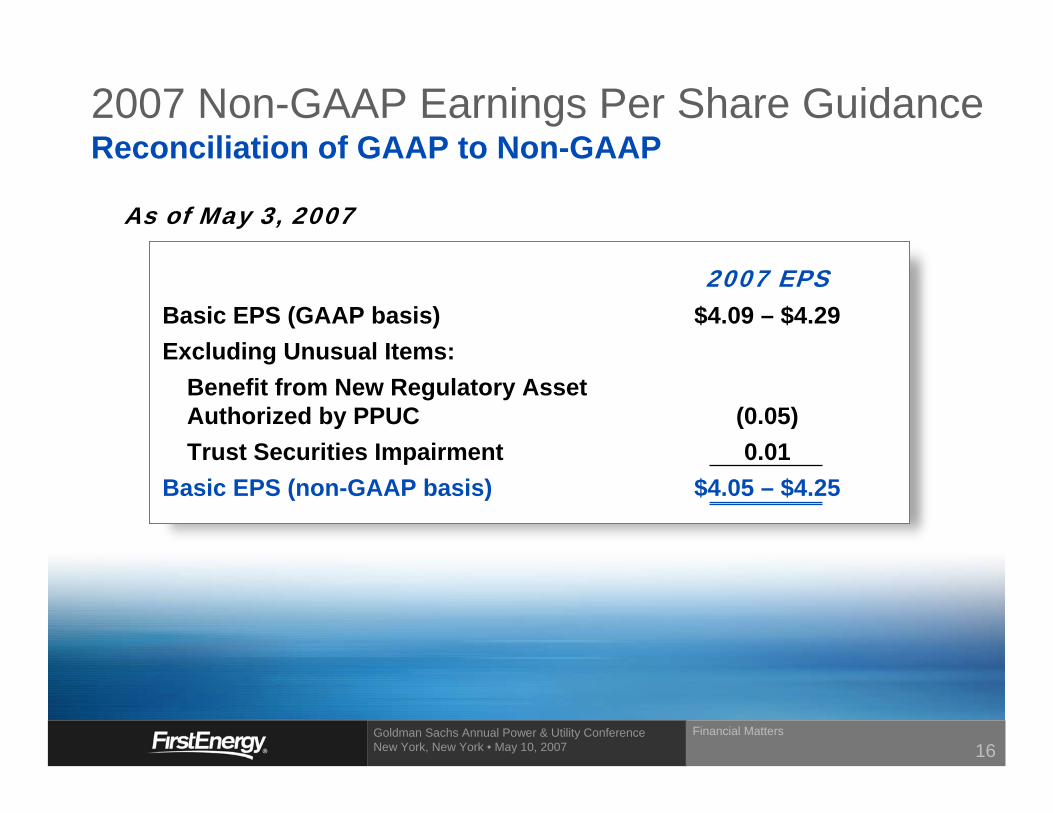
As of May 3, 2007
2007 Non-GAAP Earnings Per Share GuidanceReconciliation of GAAP to Non-GAAP
2007 EPSBasic EPS (GAAP basis) $4.09 – $4.29Excluding Unusual Items:
Benefit from New Regulatory AssetAuthorized by PPUC (0.05)Trust Securities Impairment 0.01
Basic EPS (non-GAAP basis) $4.05 – $4.25
Financial Matters
16
Investment Highlights
Goldman Sachs Annual Power & Utility Conference New York, New York • May 10, 2007
FirstEnergy’s Financial Accomplishments since 2004:Achieved 3-year annualized total shareholder return of 24%Increased market capitalization by $7.6B (66%)Voluntarily contributed $1.3B to pension planInvested over $3B in capital expendituresReduced outstanding debt and preferred stock by over $1.2BRestored investment grade credit ratingsReturned over $3B to shareholders in the form of share repurchases and common stock dividends– Increased common stock dividend 33%– Repurchased 25 million shares of common stock (7.6%)
Financial AccomplishmentsImproved operations & strategic execution
Investment Highlights
2
Goldman Sachs Annual Power & Utility Conference New York, New York • May 10, 2007
Corporate GovernanceExcellent ISS Corporate Governance Scores
Investment Highlights
3
FirstEnergy’s ISS Corporate Governance Quotient*– Outperformed 88.9% of the companies in the S&P 500– Outperformed 92.7% of the companies in the Utilities Group
Key ISS Corporate Governance Features Met by FirstEnergy– Board independence > 90%– Full Board elected annually– Independent Chairman / Separate CEO– Limit on outside Board membership– No poison pill in place– Director stock ownership guidelines– ISS Director Education Program
* As of May 1, 2007
Goldman Sachs Annual Power & Utility Conference New York, New York • May 10, 2007
Stock Ownership*– CEO = approx. 477,000 shares– Executive Officers = approx. 1,754,000 shares
CEO Compensation– 80% of 2006 target total compensation was variable and delivered
through annual incentives and equity-based opportunities
Management Incentive Plan– Includes both short-term and long-term incentives– Tied to EPS, cash generation, safety, operational performance,
and long-term stock performance
Financial Strategy Aligning management and shareholder interests
* Includes shares beneficially owned and common stock equivalents
4Investment Highlights
Goldman Sachs Annual Power & Utility Conference New York, New York • May 10, 2007
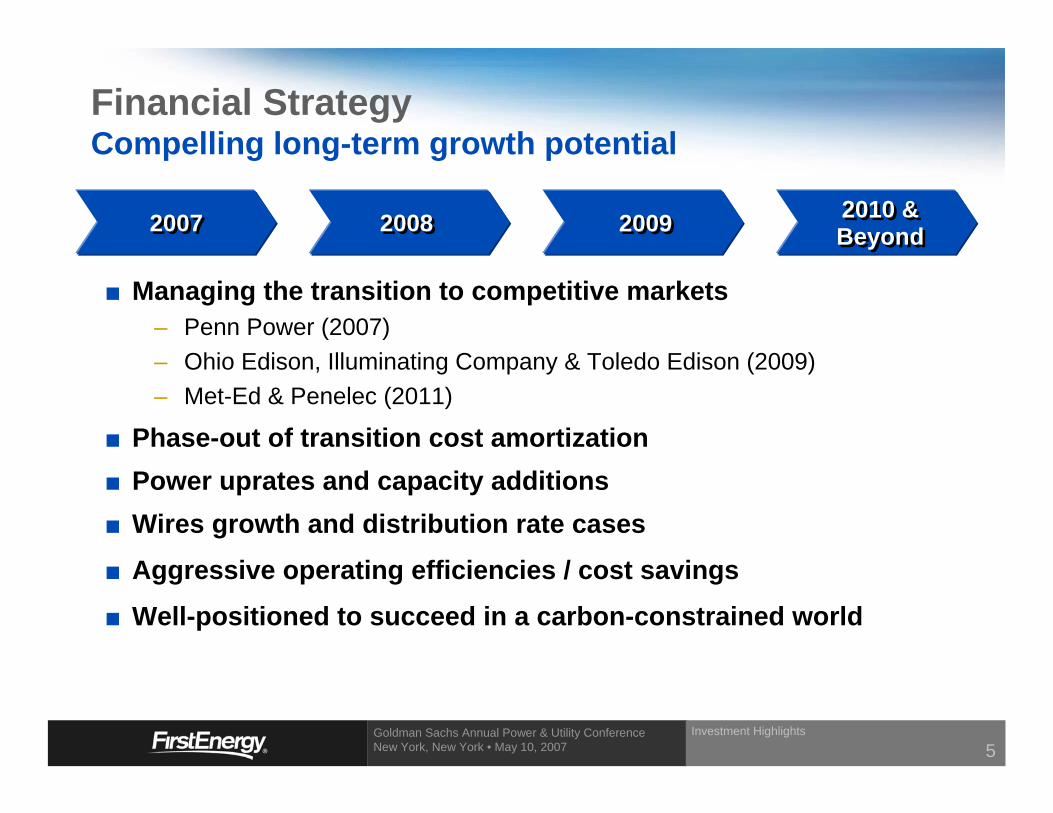
Managing the transition to competitive markets– Penn Power (2007)– Ohio Edison, Illuminating Company & Toledo Edison (2009)– Met-Ed & Penelec (2011)
Phase-out of transition cost amortizationPower uprates and capacity additionsWires growth and distribution rate cases
Aggressive operating efficiencies / cost savings
Well-positioned to succeed in a carbon-constrained world
20072007 20082008 20092009 2010 &Beyond2010 &Beyond
5Investment Highlights
Financial Strategy Compelling long-term growth potential
Goldman Sachs Annual Power & Utility Conference New York, New York • May 10, 2007
Effectively managing transitionto competitive markets
Mining full potential of efficient, low-cost generation fleet
Reinvesting for future growth
Pursuing continuous improvement
Disciplined risk-management approach
Maintaining financial strength and flexibility
Significant Earnings Growth
Potential
Significant Earnings Growth
Potential
WELL-PREPARED FOR THE FUTURE
FirstEnergy – Driving Performance & Delivering ResultsFirstEnergy – Driving Performance & Delivering Results
Investment Highlights
6