Embed Size (px)
Citation preview

2
Good News – Access!
• Record enrollment• More African American
students• More Hispanic students• More low income students• More first generation student

Too few graduate.
12.6%2-year college within 3 years
44.7%4-year university within 6 years
(non-flagship)
67.8% 4-year flagship within 6 years
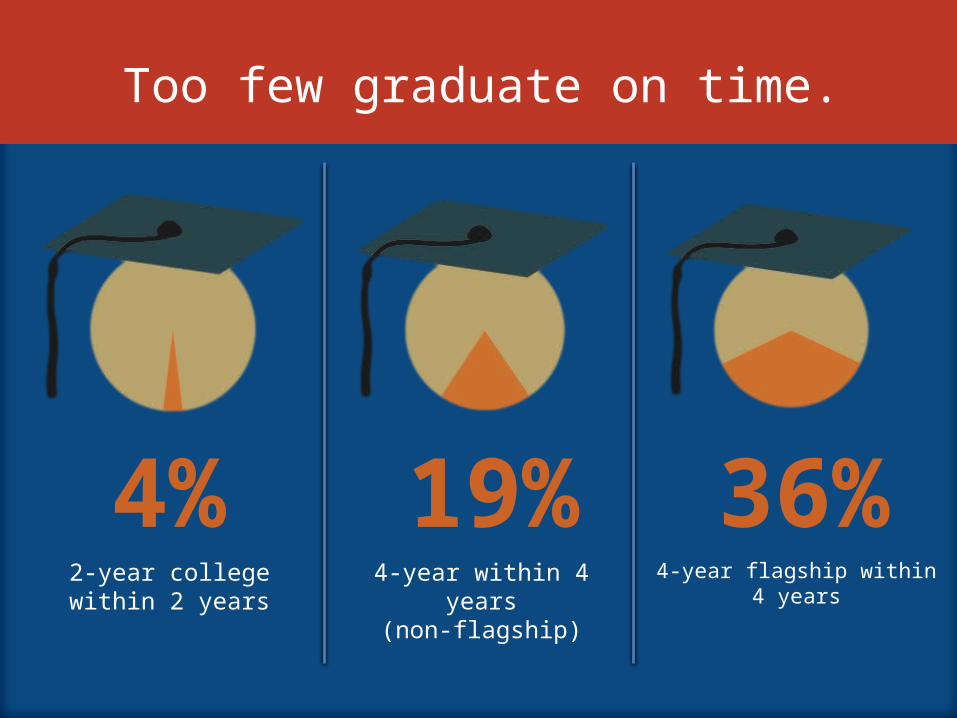
Too few graduate on time.
4%2-year college within 2 years
19%4-year within 4 years
(non-flagship)
36%4-year flagship within 4 years
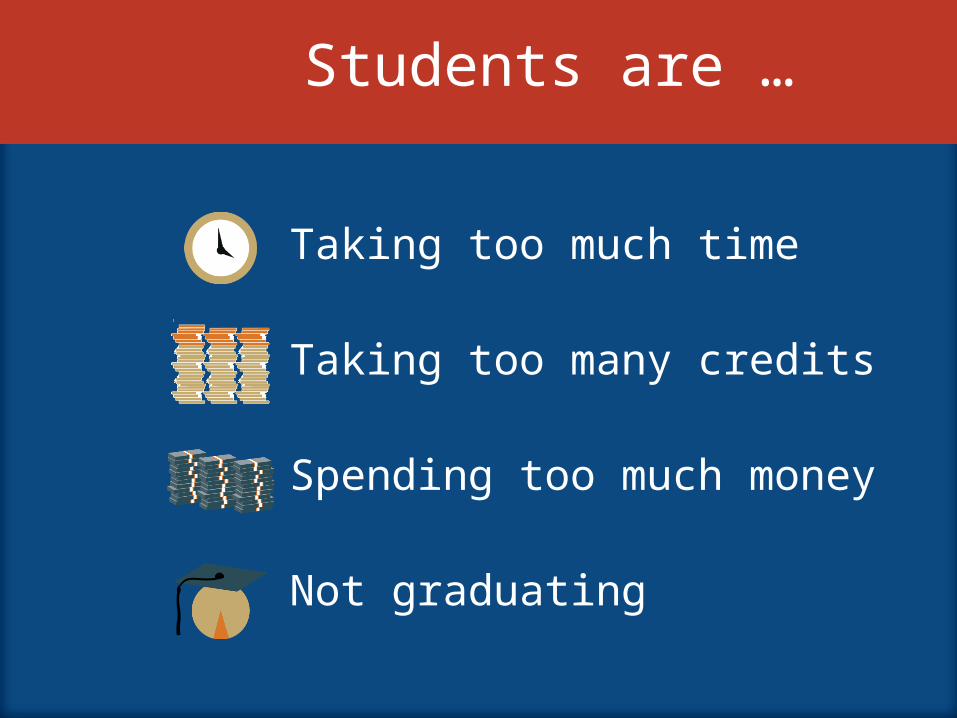
Students are …
Taking too much time
Taking too many credits
Spending too much money
Not graduating

THE COST OF DROPOUTSTaxpayers lose more than $9 billion at 4-year universities alone.
$1.5 In federal student grants
billion
$7.6 In total state appropriations and student grants
billion
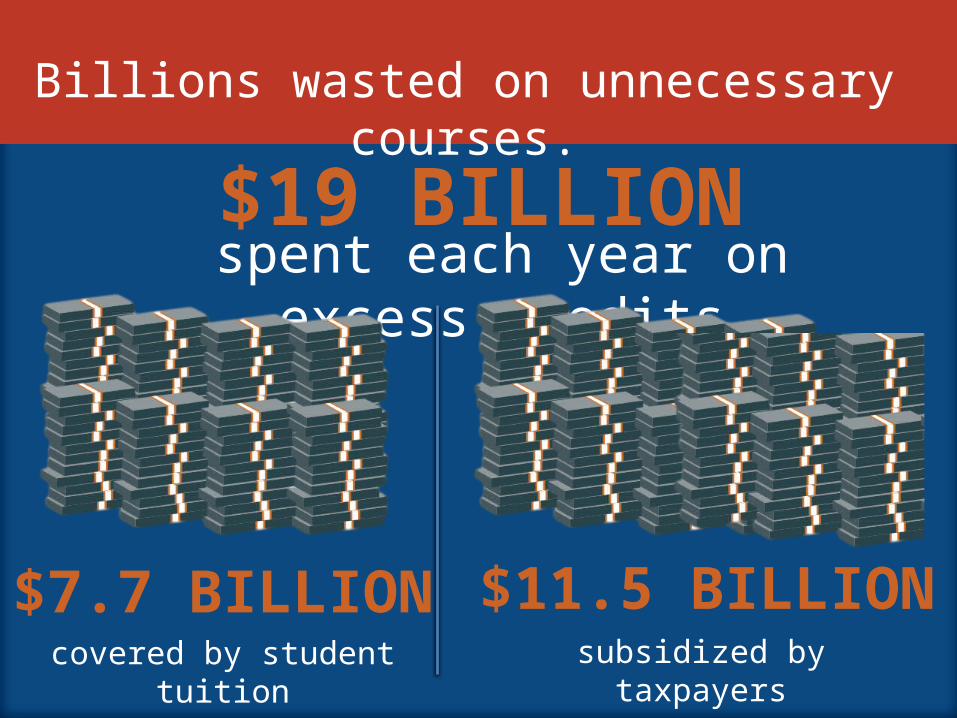
Billions wasted on unnecessary courses.
$19 BILLIONspent each year on excess credits
$7.7 BILLIONcovered by student tuition
$11.5 BILLIONsubsidized by taxpayers
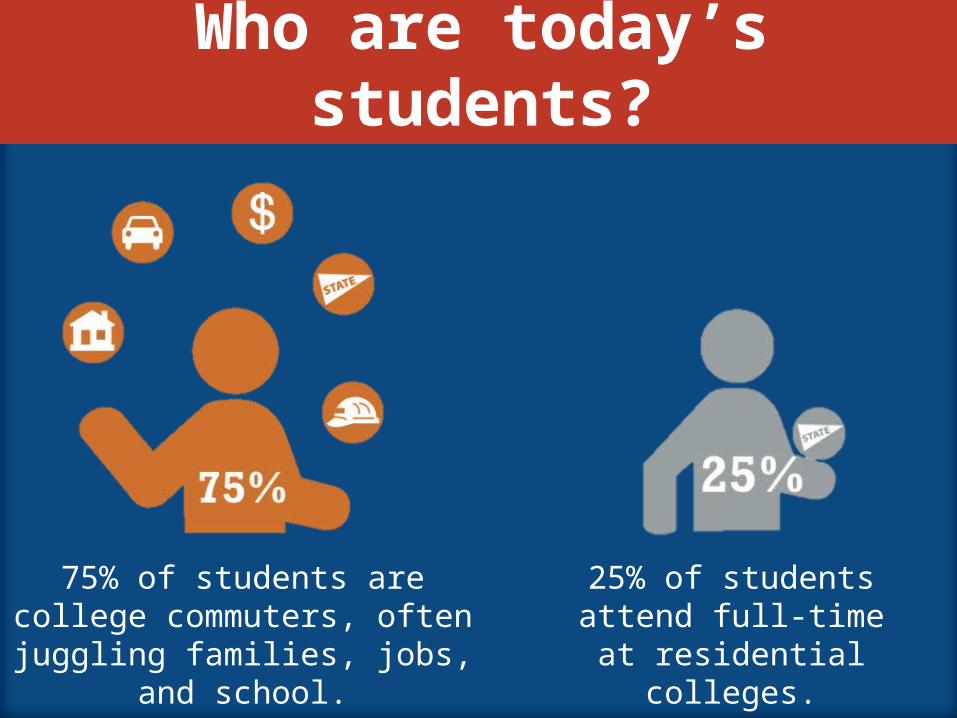
Who are today’s students?
75% of students are college commuters, often juggling families, jobs, and school.
25% of students attend full-time at
residential colleges.
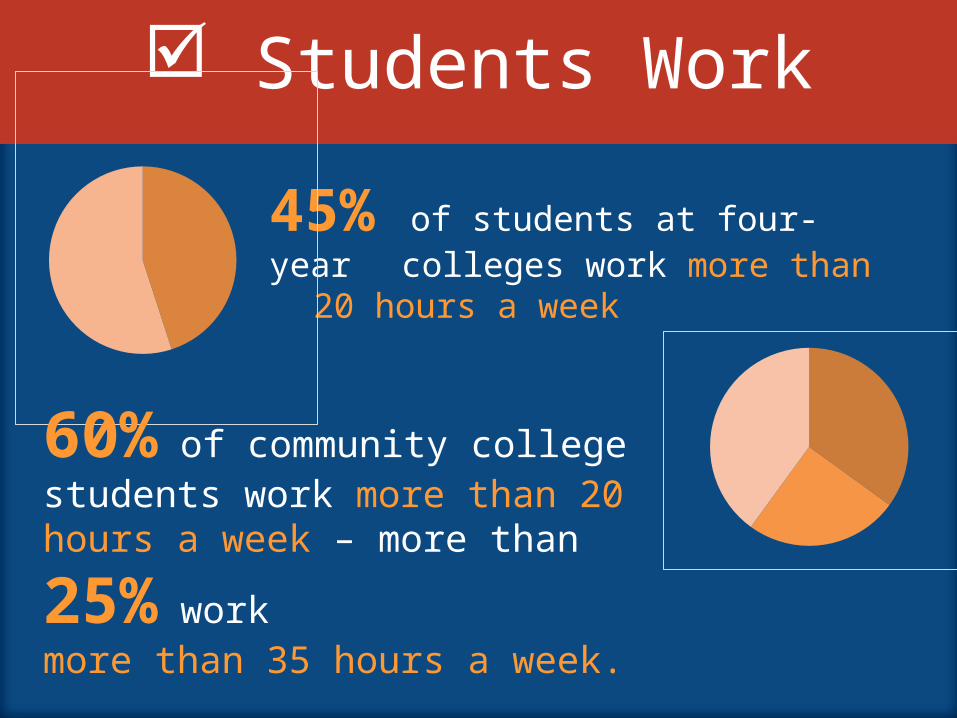
Students Work
45% of students at four-year colleges work more than 20 hours a week
60% of community college students work more than 20 hours a week – more than
25% work more than 35 hours a week.
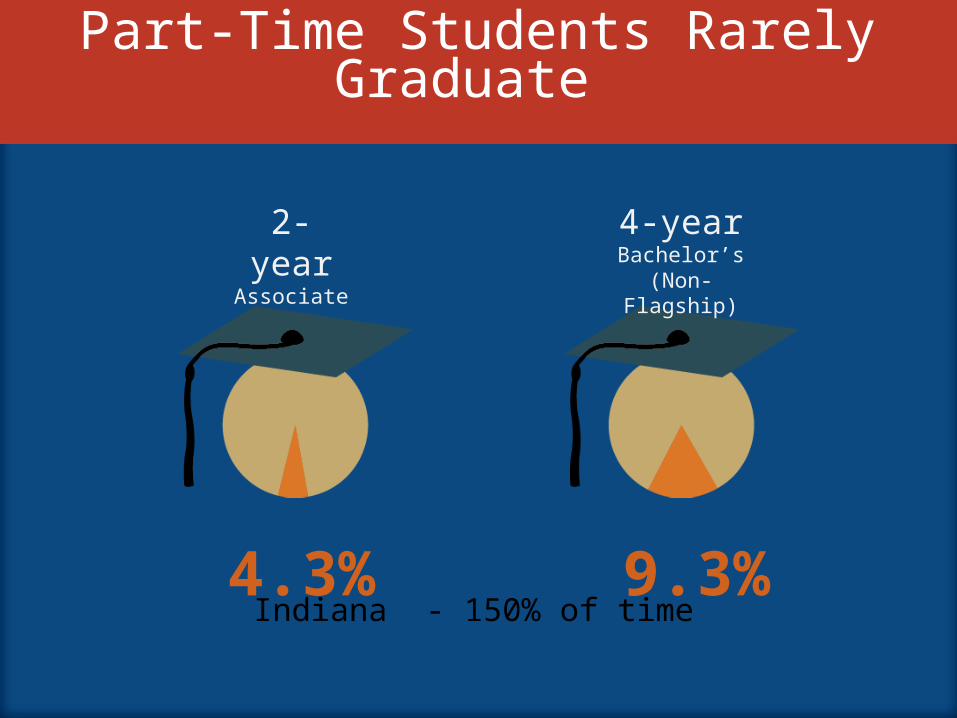
Part-Time Students Rarely Graduate
4.3% 9.3%Indiana - 150% of time
2-year Associate
4-year Bachelor’s
(Non-Flagship)


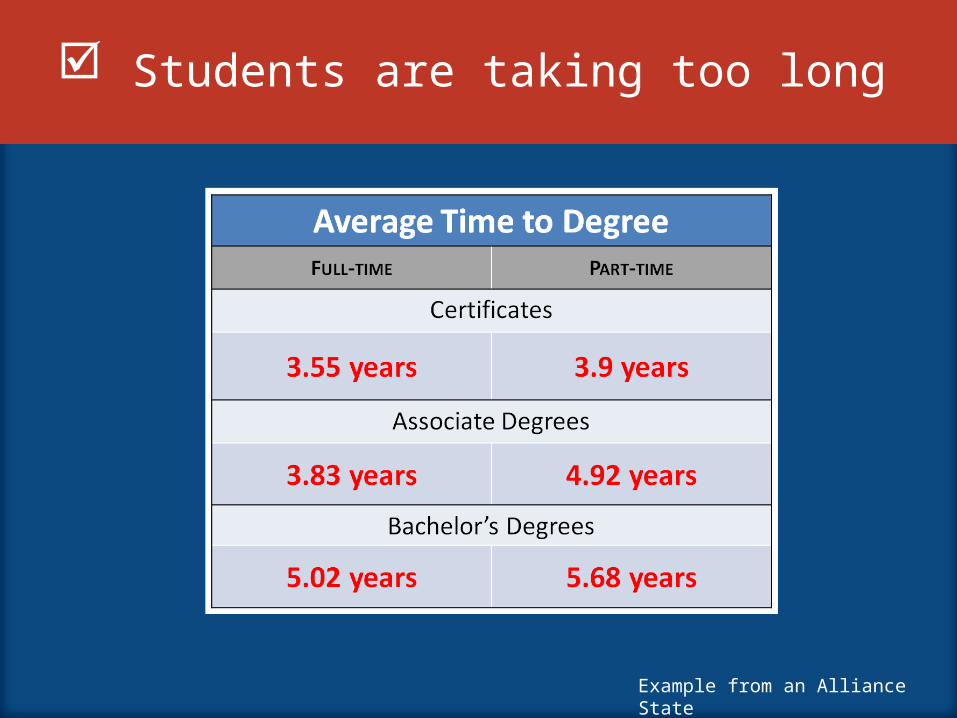
Students are taking too long
Example from an Alliance State

Not taking credit hours necessary to graduate on time.
“Full-time” Students Taking 15+ Credits Per Semester
At 2-year At 4-year
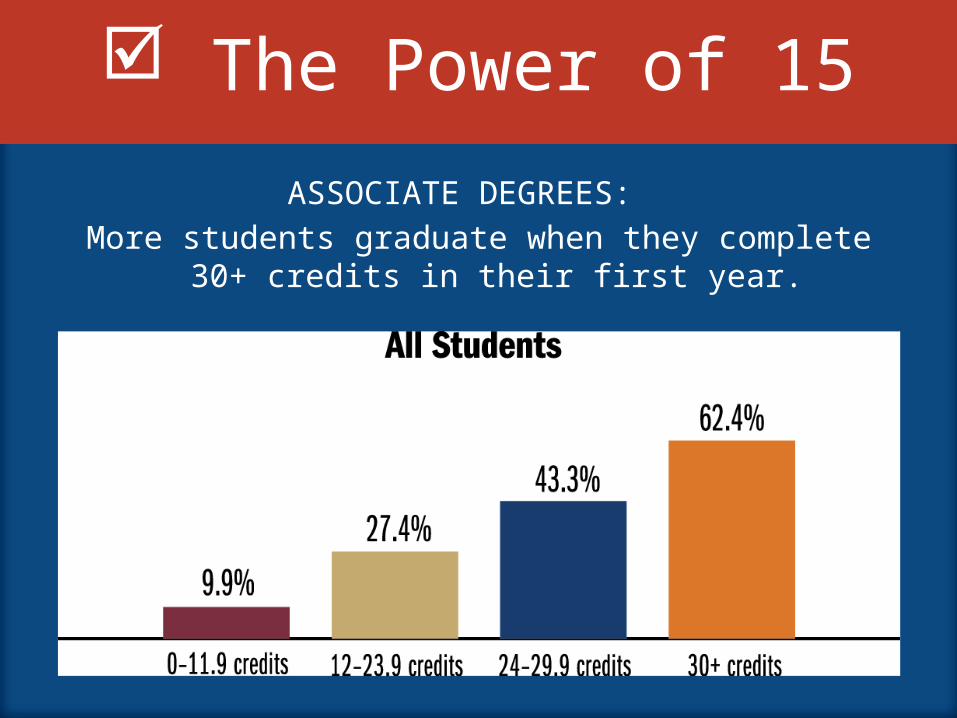
The Power of 15
ASSOCIATE DEGREES: More students graduate when they complete 30+
credits in their first year.
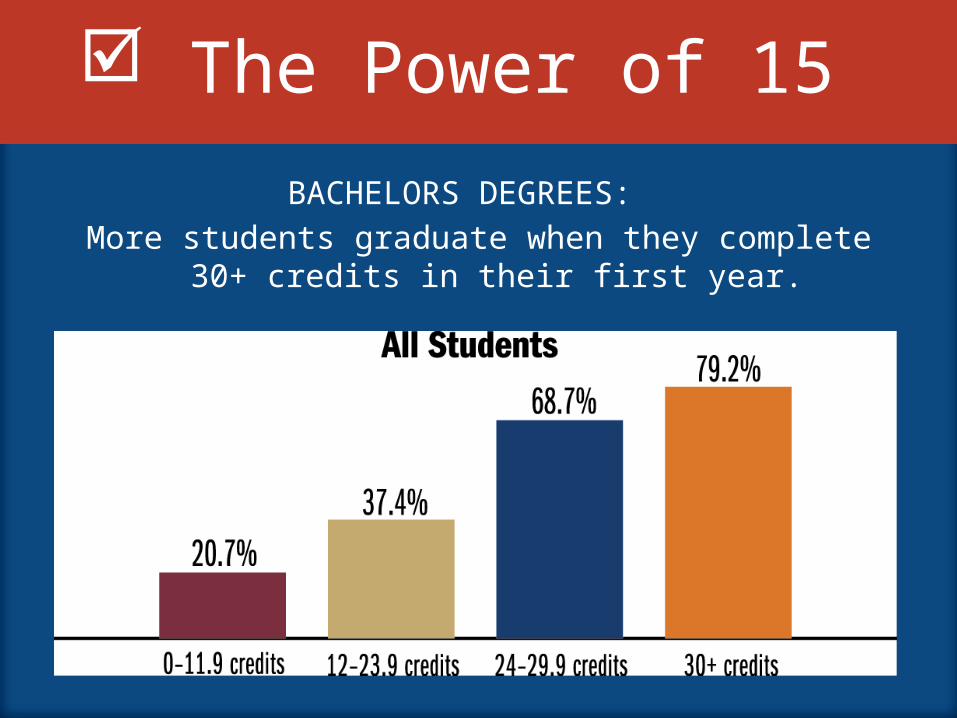
The Power of 15
BACHELORS DEGREES: More students graduate when they complete 30+
credits in their first year.
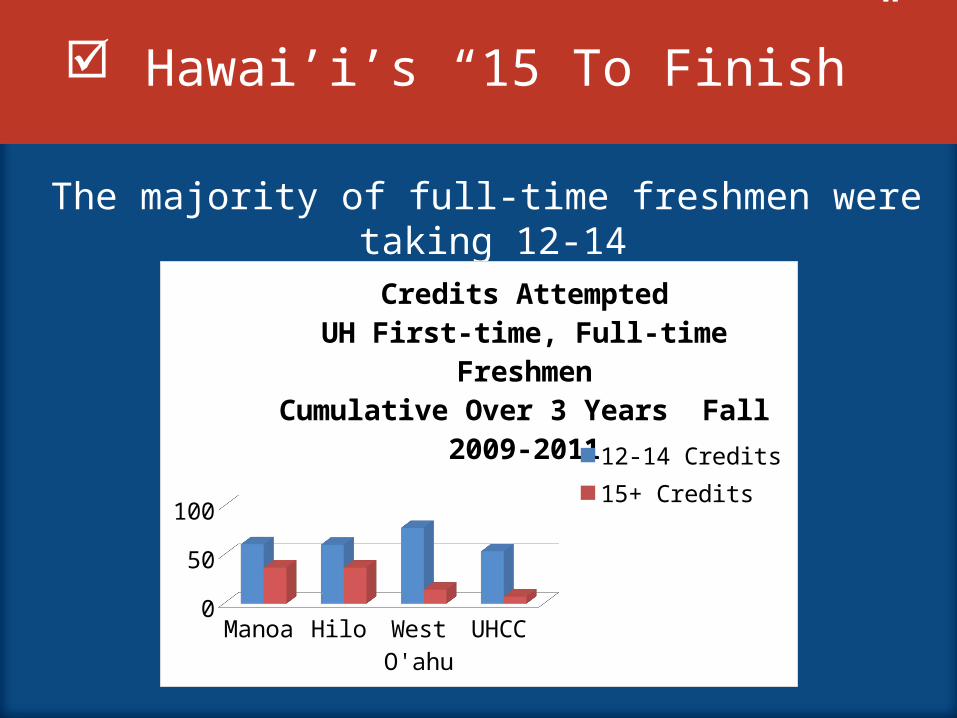
Hawai’i’s “15 To Finish”
The majority of full-time freshmen were taking 12-14
Manoa Hilo West O'ahu
UHCC0
1020304050607080
Credits AttemptedUH First-time, Full-time Freshmen
Cumulative Over 3 Years Fall 2009-2011
12-14 Credits15+ Credits
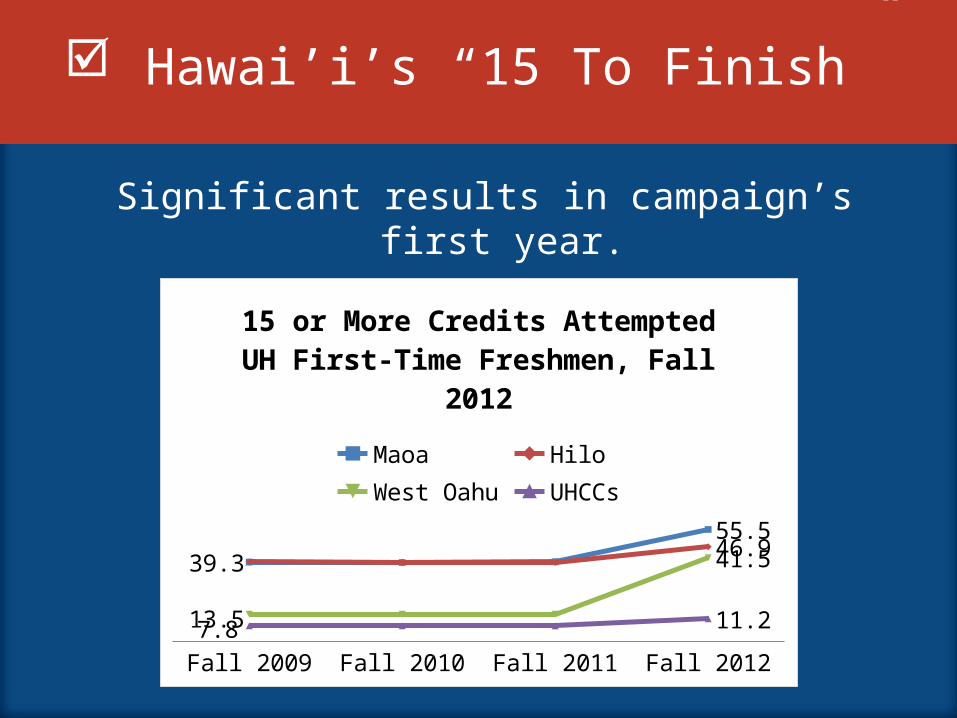
Hawai’i’s “15 To Finish”
Significant results in campaign’s first year.
Fall 2009 Fall 2010 Fall 2011 Fall 2012
39.3
55.546.9
13.5
41.5
7.8 11.2
15 or More Credits AttemptedUH First-Time Freshmen, Fall 2012
Maoa HiloWest Oahu UHCCs

20
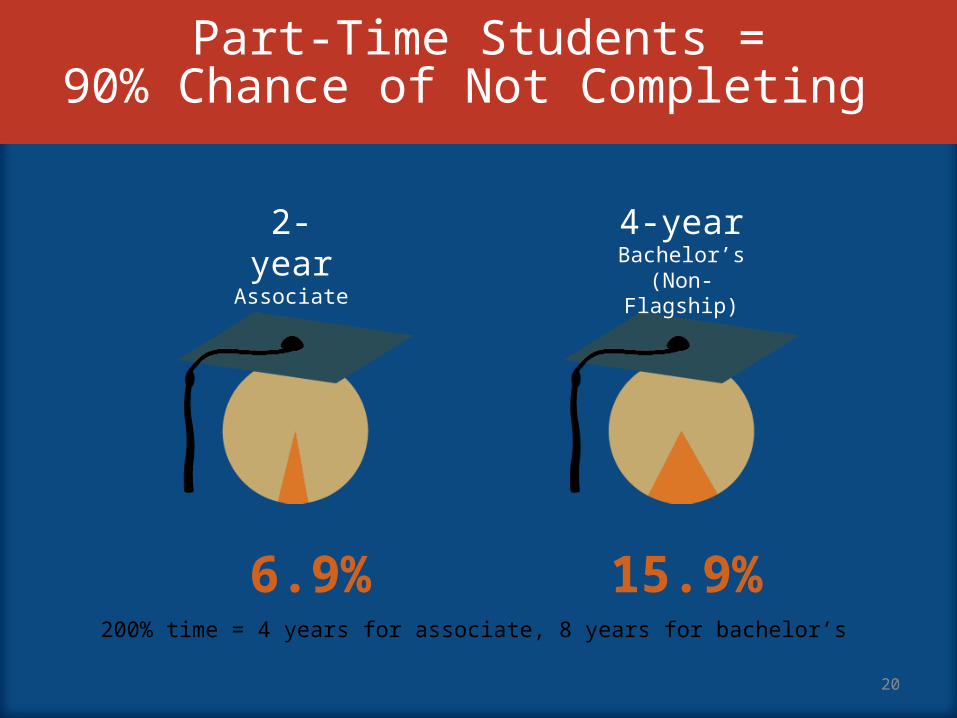
Part-Time Students =90% Chance of Not Completing
6.9% 15.9%200% time = 4 years for associate, 8 years for bachelor’s
2-year Associate
4-year Bachelor’s
(Non-Flagship)

GAME CHANGER
Block SchedulingTo encourage more full-time enrollment and significantly boost completion, add predictability to the lives of working students who are balancing jobs and school
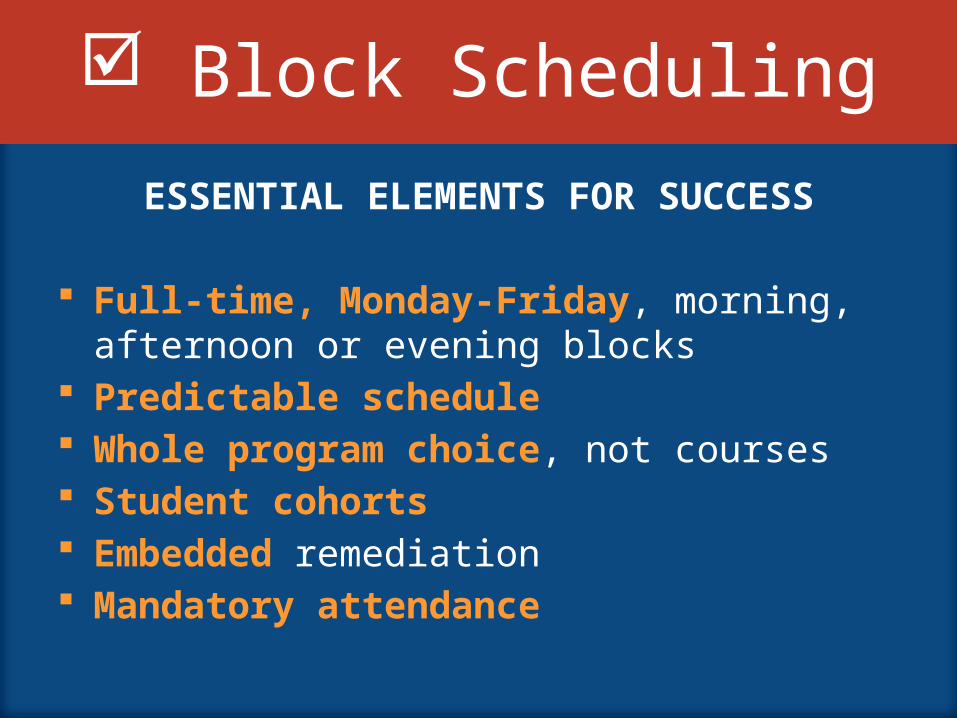
Block Scheduling
ESSENTIAL ELEMENTS FOR SUCCESS
Full-time, Monday-Friday, morning, afternoon or evening blocks
Predictable schedule Whole program choice, not courses Student cohorts Embedded remediation Mandatory attendance
23
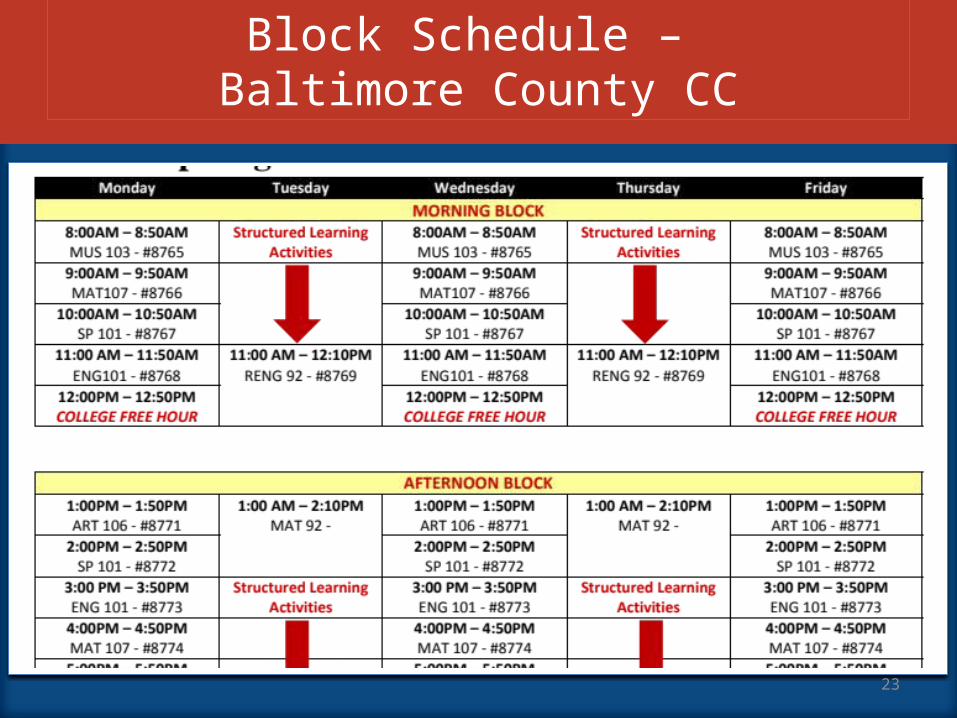
Block Schedule – Baltimore County CC
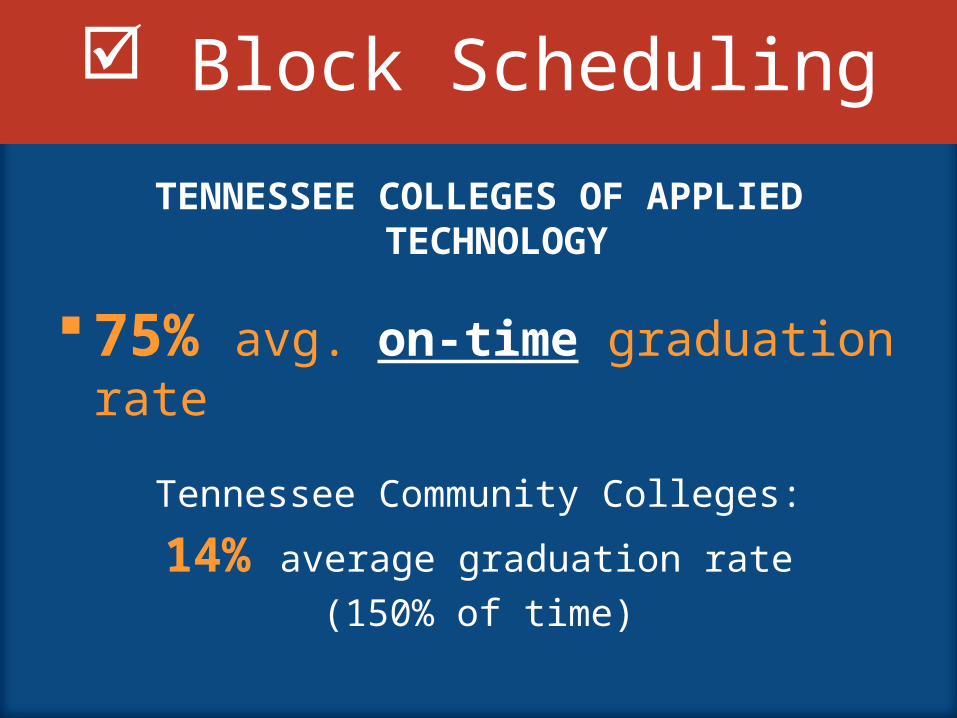
Block Scheduling
TENNESSEE COLLEGES OF APPLIED TECHNOLOGY
75% avg. on-time graduation rate
Tennessee Community Colleges:
14% average graduation rate
(150% of time)
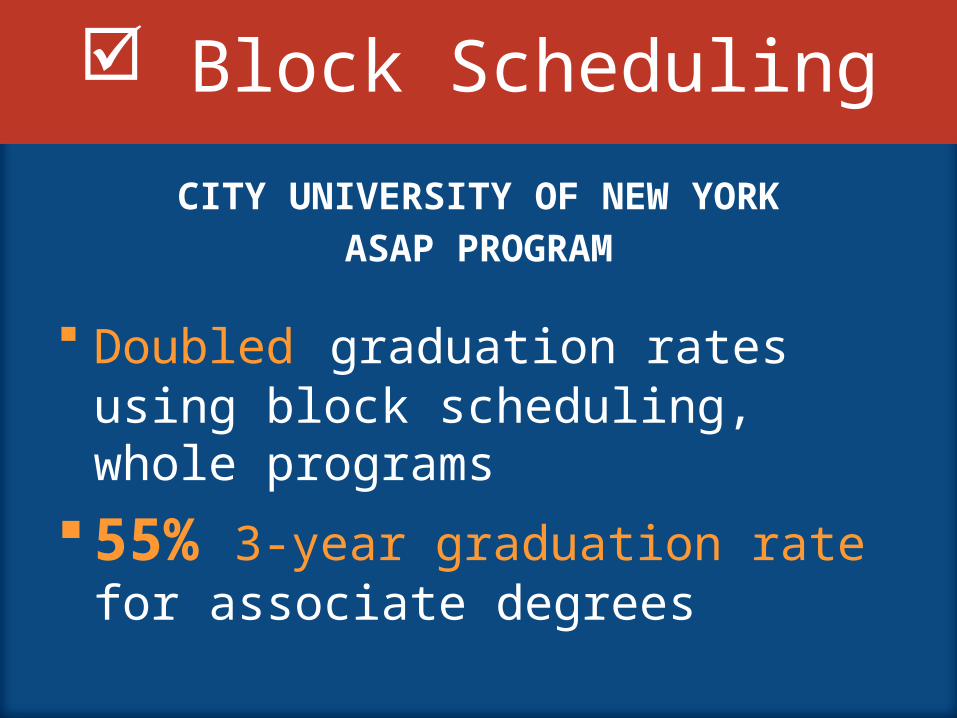
Block Scheduling
CITY UNIVERSITY OF NEW YORKASAP PROGRAM
Doubled graduation rates using block scheduling, whole programs
55% 3-year graduation rate for associate degrees
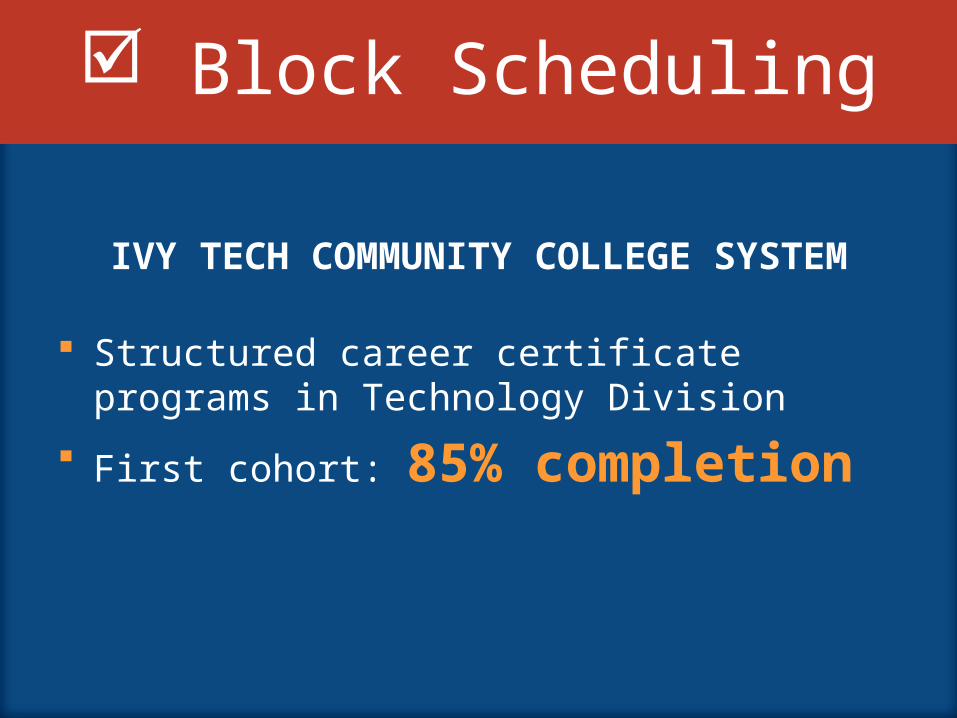
Block Scheduling
IVY TECH COMMUNITY COLLEGE SYSTEM
Structured career certificate programs in Technology Division
First cohort: 85% completion
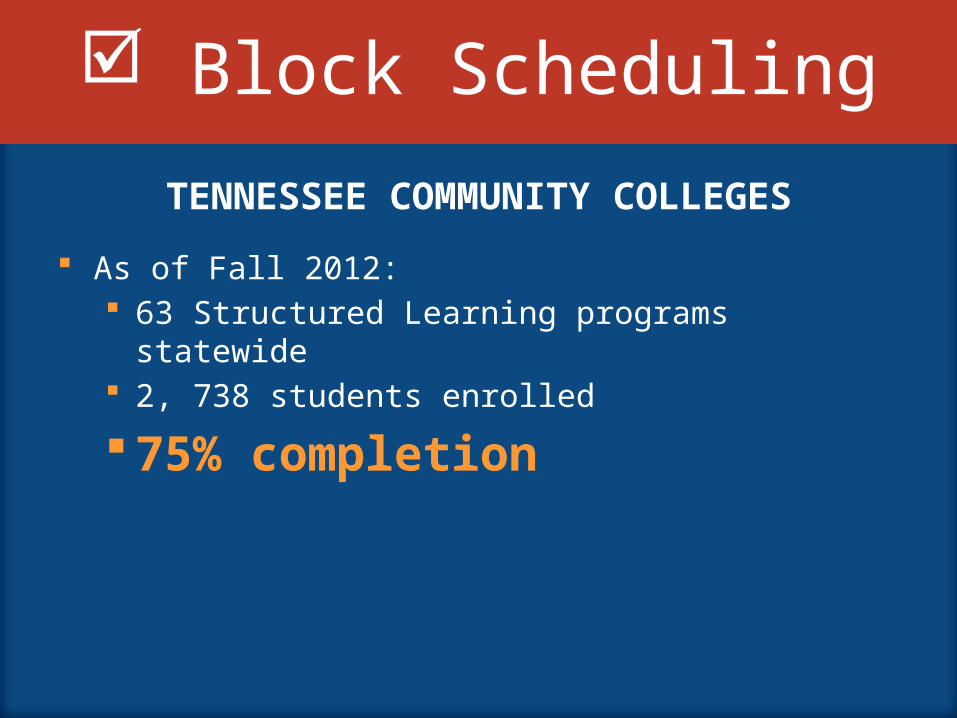
Block Scheduling
TENNESSEE COMMUNITY COLLEGES
As of Fall 2012: 63 Structured Learning programs statewide 2, 738 students enrolled
75% completion

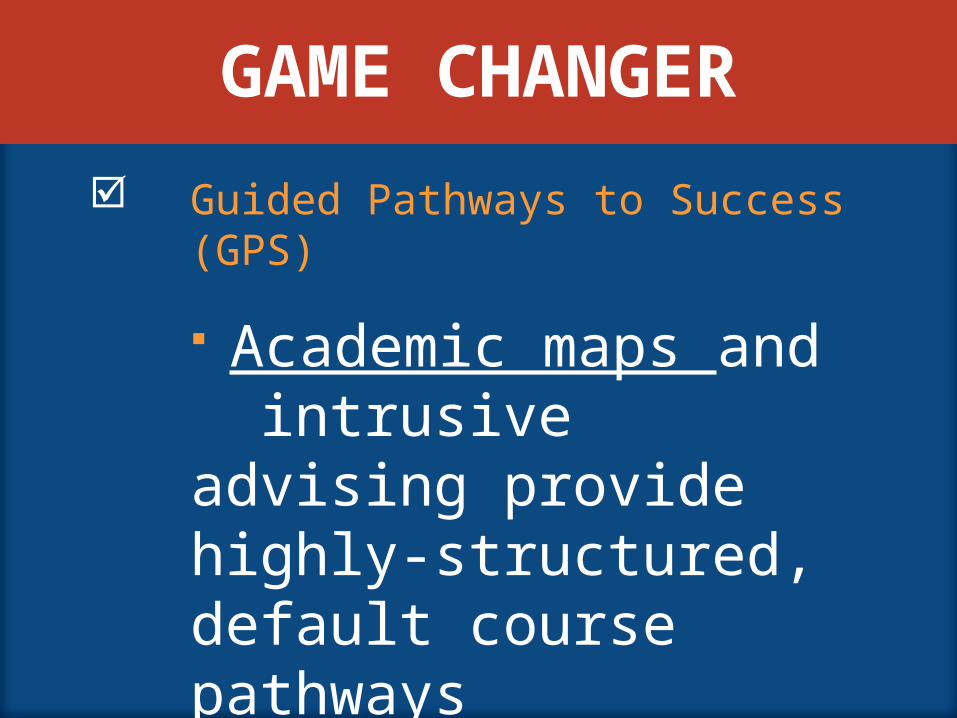
GAME CHANGER
Guided Pathways to Success (GPS)
Academic maps and intrusive advising provide highly-structured, default course pathways
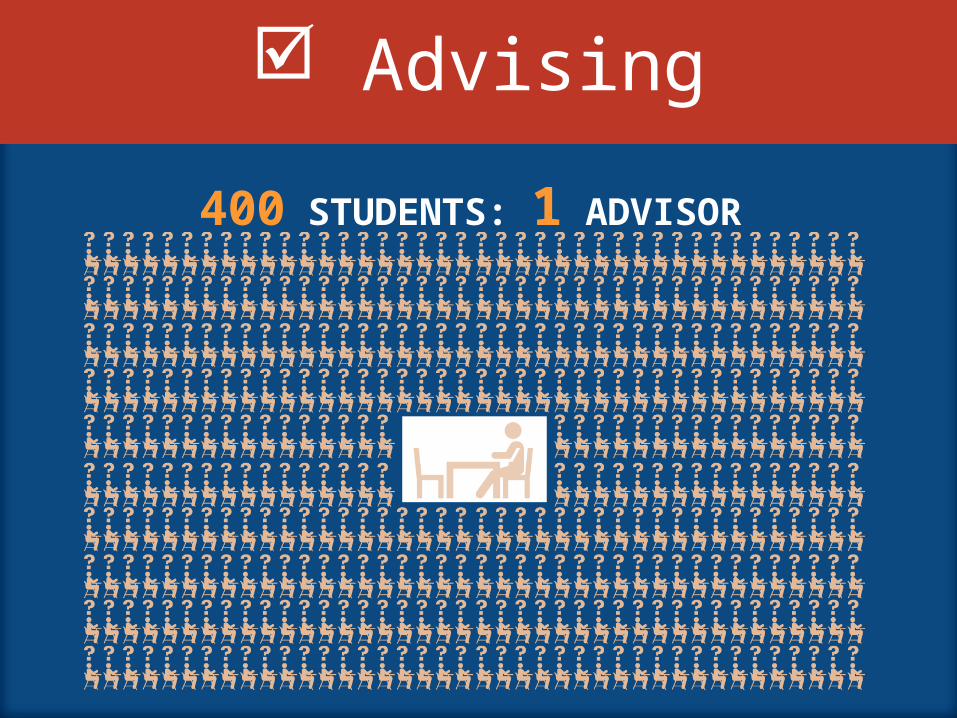
Advising
400 STUDENTS: 1 ADVISOR
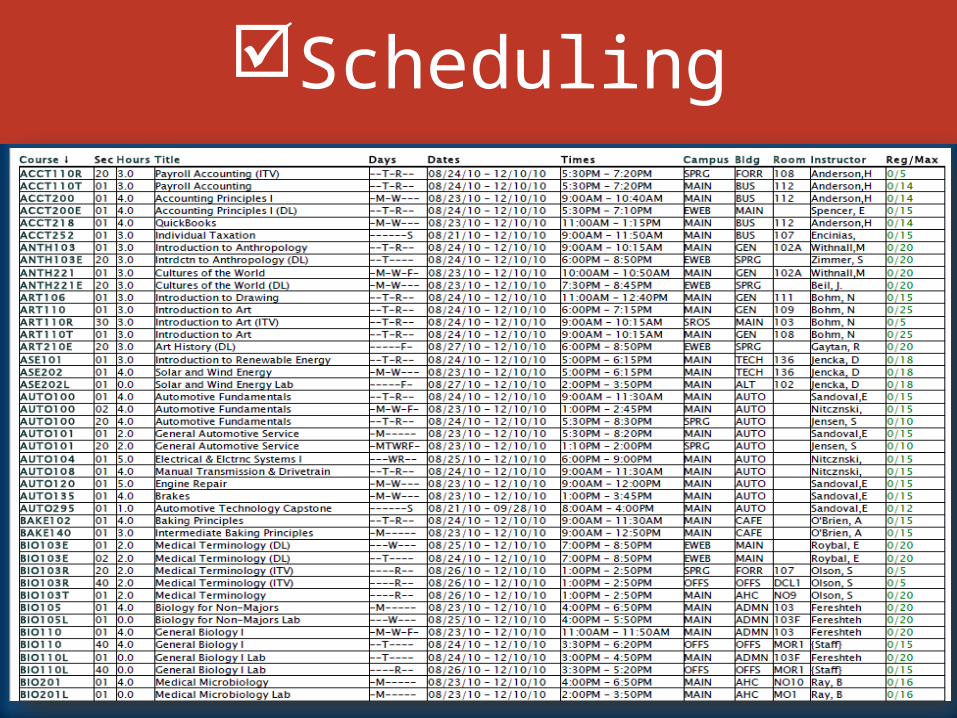
Scheduling
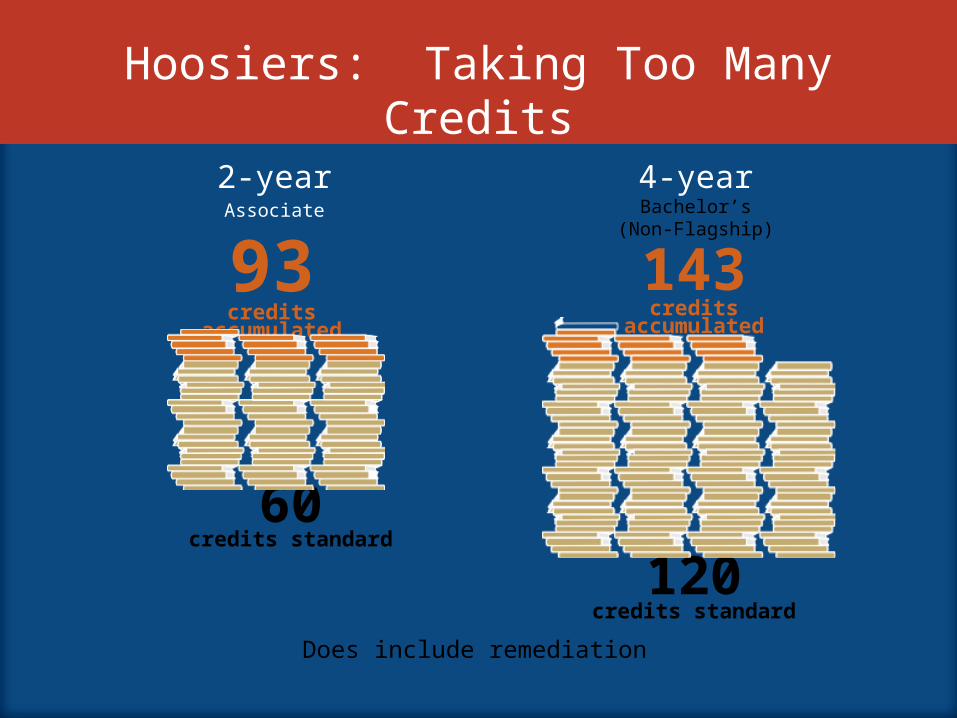
Hoosiers: Taking Too Many Credits
93credits
accumulated
143credits
accumulated
Does include remediation
60credits standard
120credits standard
2-yearAssociate
4-yearBachelor’s
(Non-Flagship)
Academic/Degree Maps
• A semester-by-semester academic map is the sequential, prescriptive schedule of classes for the meta-major and the major
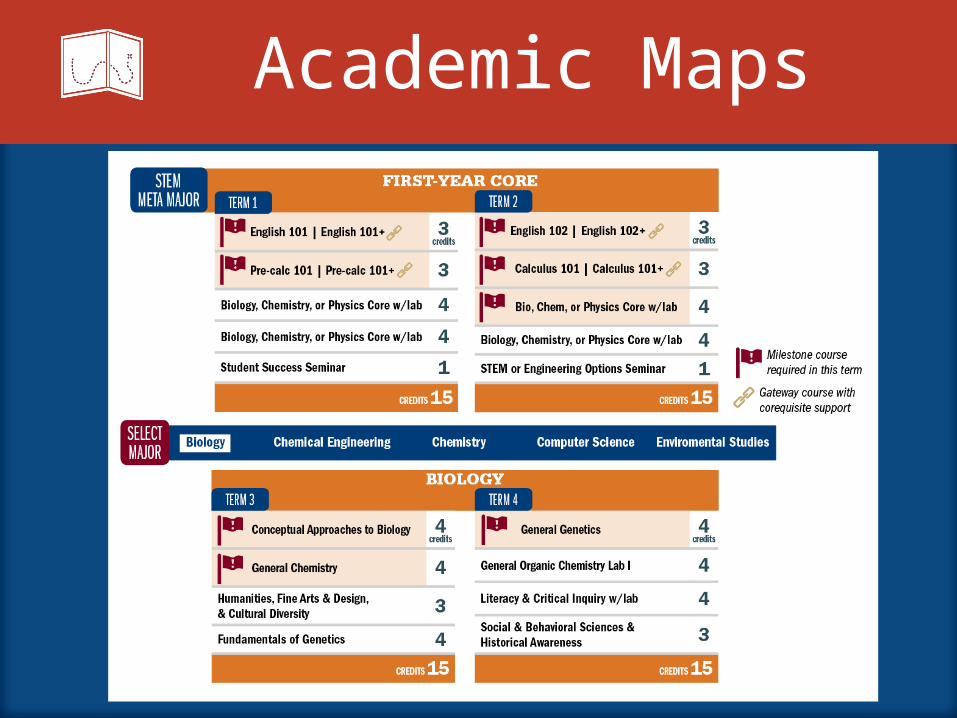
Academic Maps
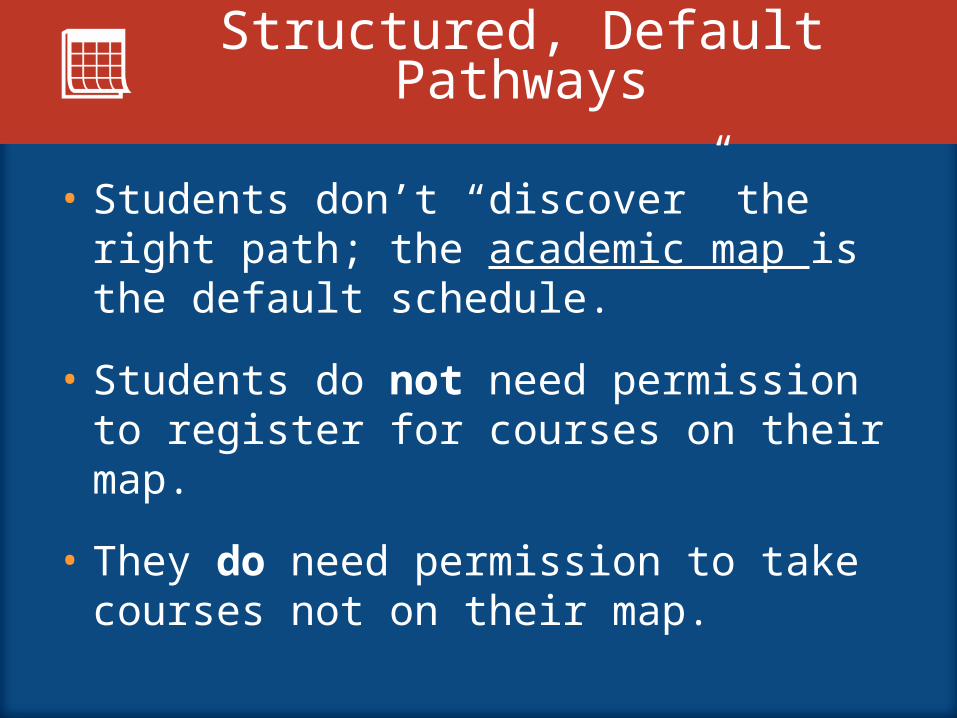
Structured, Default Pathways
• Students don’t “discover” the right path; the academic map is the default schedule.
• Students do not need permission to register for courses on their map.
• They do need permission to take courses not on their map.
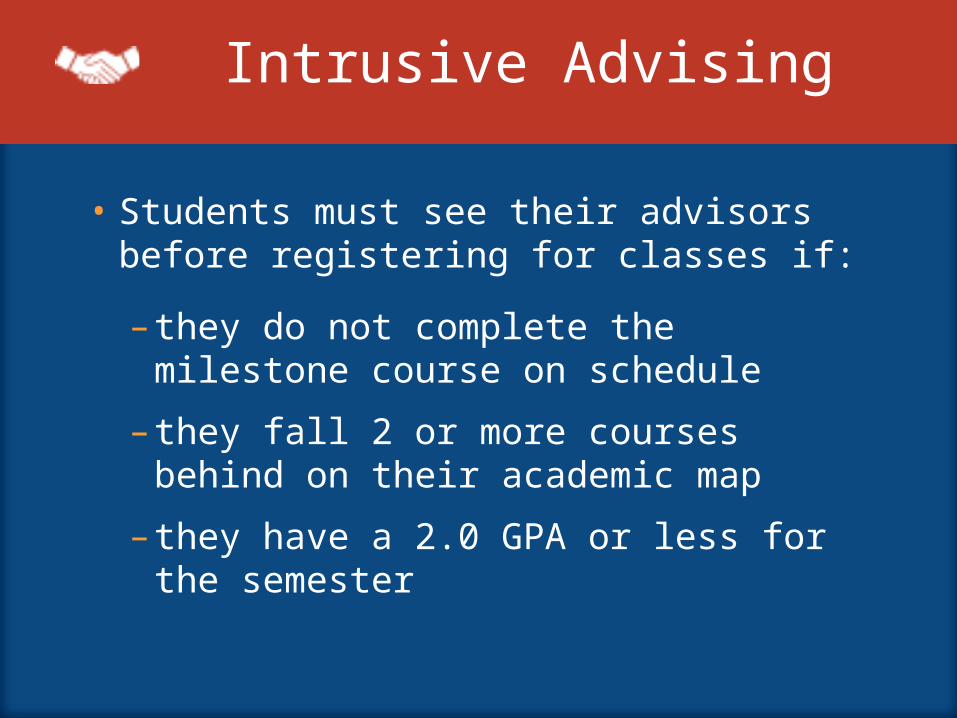
Intrusive Advising
• Students must see their advisors before registering for classes if:
– they do not complete the milestone course on schedule
– they fall 2 or more courses behind on their academic map
– they have a 2.0 GPA or less for the semester

37
Georgia State University
• Degree maps and intrusive advising
• Graduation rates up 20% in past 10 years
• Graduation rates higher for:– Pell students: 52.5%– African American students: 57.4%– Hispanic students: 66.4%
• More bachelor’s degrees to African-Americans than any other U.S. university

38
Florida State University
• Since starting degree maps, FSU has cut the number of students graduating with excess credits in half
• Graduation rate increased to 74%– African Americans to 77%– First-generation Pell students to 72%– Hispanic students to more than 70%
39
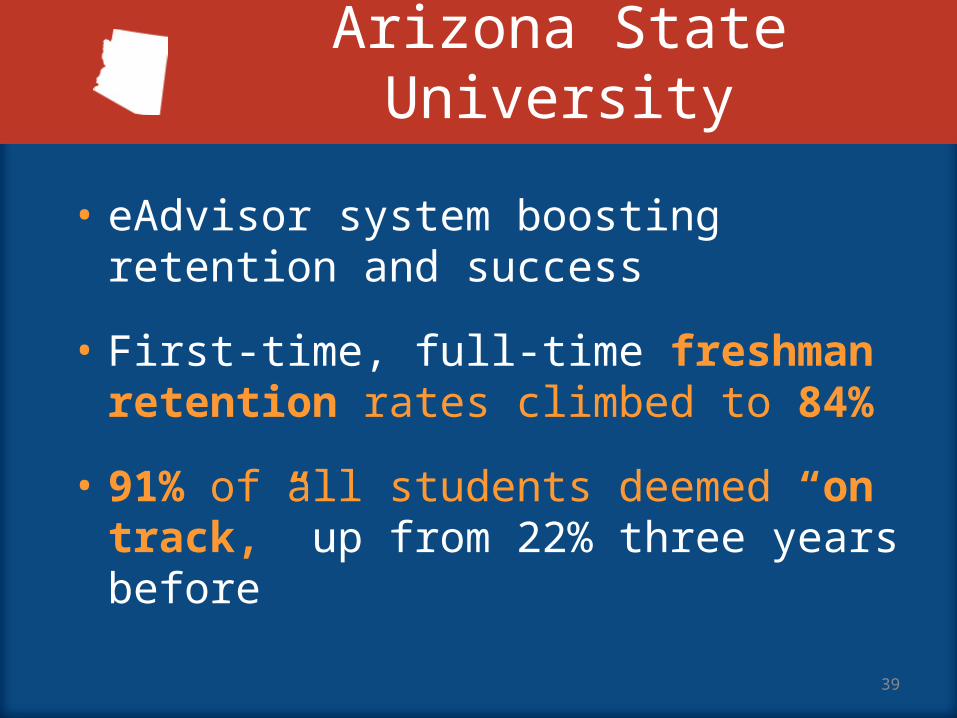
Arizona State University
• eAdvisor system boosting retention and success
• First-time, full-time freshman retention rates climbed to 84%
• 91% of all students deemed “on track,” up from 22% three years before
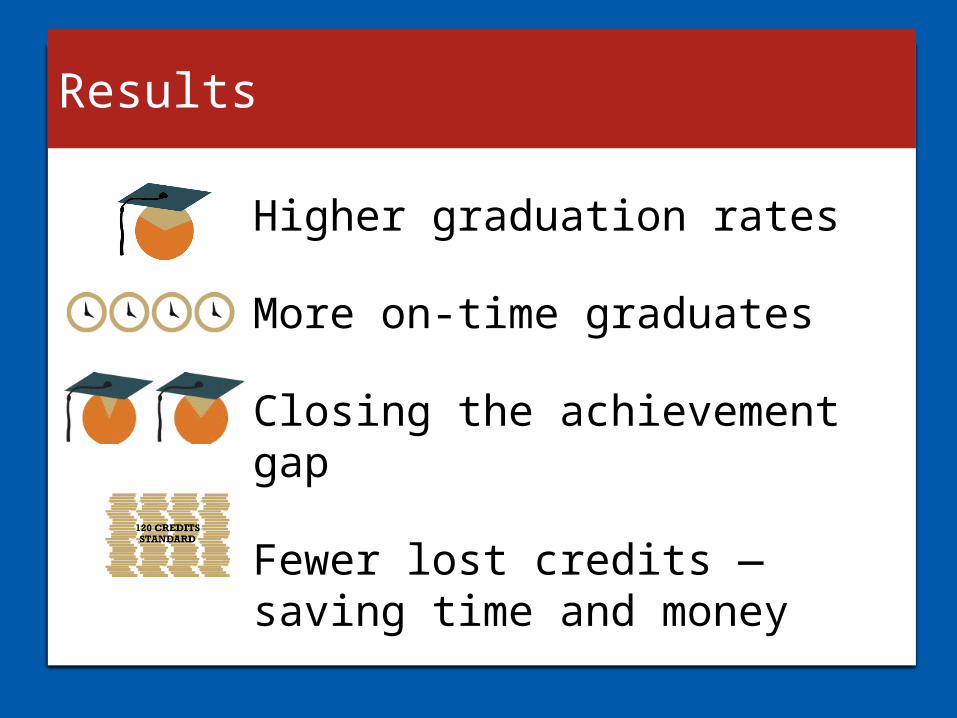
Results
Higher graduation rates
More on-time graduates
Closing the achievement gap
Fewer lost credits — saving time and money
Focus on the Gamechangers
Power of 15 Full-time is 15
Block Scheduling Enable more to go Full-Time
Degree MapsGuided Pathways to Success (GPS)