Embed Size (px)
Citation preview

International Business Research; Vol. 7, No. 11; 2014
ISSN 1913-9004 E-ISSN 1913-9012
Published by Canadian Center of Science and Education
35
Goodwill Reduction: The Competitive Analysis of
Enterprise Value (A Note)
Andrea Beretta Zanoni1 & Silvia Vernizzi
1
1 Department of Business Administration, University of Verona, Verona, Italy
Correspondence: Silvia Vernizzi, Department of Business Administration, University of Verona, Verona, Italy.
Tel: 39-045-809-8168. E-mail: [email protected]
Received: September 4, 2014 Accepted: September 28, 2014 Online Published: October 25, 2014
doi:10.5539/ibr.v7n11p35 URL: http://dx.doi.org/10.5539/ibr.v7n11p35
Abstract
The purpose of this paper is to suggest a method to open the internally generate goodwill “black box” and to give
an interpretation of its competitive meaning. The study takes a “breaking down” approach that, starting from the
goodwill value proceeds through a reduction process that traces the internally generated goodwill to the
competitive position of the firm, finding a link between the goodwill value and the competitive phenomena
related to it. Through the process of goodwill breakdown the paper contributes to shed light on the process of
goodwill creation giving a competitive interpretation of its economic meaning. Without deny the relevance of the
accounting and financial literature, the paper offers a partially different and new perspective of goodwill analysis
focusing on the relationship that internally generated goodwill has with the competitive position of the firm.
Keywords: goodwill, intangible assets, abnormal earnings, enterprise value, competitive position
1. Aims and Theoretical Framework
Goodwill is the difference between the value of a company at a particular time and its accounting asserted assets.
It‟s an intangible value that drives abnormal earnings creation. Over the last century goodwill has become more
and more relevant because the origin of the value created by firms has gradually moved towards economic
phenomena of intangible nature (OECD, 2000, 2001; Lev, 2001; Beattie & Thompson, 2005; Corrado, Hulten &
Sichel, 2006).
The purpose of this work is to suggest a method to open the internally generated goodwill “black box” and to
give an interpretation of its competitive meaning. In so doing the paper will proceed by reducing the goodwill
value and tracing its core components to the competitive position of the firm.
According to a theoretical definition, goodwill is equivalent to the capitalization of the abnormal earnings flows
expected by the firm, that have to be intended as higher than the normal remuneration of the equity capital, given
a specific configuration of an enterprise‟s risk (Schmalenbach, 1908; Zappa, 1957; Besta, 1922; Hatfield, 1927).
Since the goodwill phenomenon is directly connected to the abnormal earnings obtained by enterprises, the main
theoretical framework of this study is to be sought, first of all, in the theories focused on the abnormal earnings
definition and evaluation.
The studies on competitive positioning, mainly developed by strategic management, have greatly contributed to
the deepening of the knowledge of the phenomena underlying abnormal earnings. Two research fields have been
especially fruitful: the structural positioning, based on Industrial Organization Economics (Porter, 1980, 1985;
Caves & Porter, 1977) and the Resource Based View of the firm (Penrose, 1959; Wernerfelt, 1984; Barney, 1991;
Peteraf, 1993). Despite the two approaches interpret somehow differently the phenomena of competition and
profitability they commonly argue that abnormal earnings (or economic rents) may persist over time, differently
from the efficient market theory that under neoclassical economics consider economic rents as an anomaly that
disappears when economic equilibrium is achieved (Arrow & Hahn, 1971; Debreu, 1959).
Other important theoretical frameworks are to be found:
• As regards the analysis of the relation between abnormal earnings and enterprise value, in the Residual
Income Model (RIM) outlined by Feltham and Ohlson, (Ohlson, 1991, 1995; Feltham & Ohlson, 1995), whose
origins however trace back to the work of Preinrich (1938), Edward and Bell (1961) and Peasnell (1981, 1982);

www.ccsenet.org/ibr International Business Research Vol. 7, No. 11; 2014
36
• As regards the role played by capabilities in the generation of abnormal earnings and competitive
differentials, in the Dynamic Capabilities Theory (Nelson & Winter, 1982; Amit & Schoemaker, 1993; Teece,
1984).
Relevance is also borne by the studies on the evaluation of intangible assets based on different theoretical
sources (finance, accounting, management).
2. The Goodwill Value Subject to the Reduction Process
Prior to move on the reduction process aimed at determining some perspectives and analytical tools to identify
the economic phenomena embodied into the goodwill value, it is necessary to define the configuration of
goodwill to which we refer in carrying out the analysis‟ development.
Under the asset side approach, excess returns are calculated with reference to the operating invested capital and
the goodwill value is estimated as expressed in the following formula:
s
ss
s WACC
CWACCyG
)1(
)]([*
1*
1
0
Where:
ys: operating profit after tax in the s accounting period, i.e., operating profit multiplied by (1-t), where t is the tax
rate;
WACC*: weighted average capital cost (incorporating the tax benefits resulting from financial debt);
Cs: operating invested capital at the end of period s.
The WACC* rate can be obtained in the following way:
ED
Dtkd
DE
EkeLWACC
)1(**
with:
keL*: cost of equity with debt (levered) and incorporating the tax benefit and equal to:
E
DtkdkeUkeUkeL )1()(*
E: equity (market value);
D: debt (market value);
kd: cost of debt.
The previous formula refers to an aggregated method, based on the adjustment of the WACC rate in order to
incorporate tax benefits.
In fact, since the interest expenses are tax deductible, the flow generated by the assets increases by the
(𝑘𝑑 × 𝐷 × 𝑡) value. The discounted value of the tax shield, VTS0, can therefore be expressed in the following
way (Note 1):
1
0)1(s
s
s
kd
tDkdVTS
The usage of an aggregated method, has three limitations:
1) the broader the period of evaluation, the more various will be the approximations about the estimation of
the leverage ratio;
2) the value of equity used to determine the D/E ratio is the market value, that is a value that even the
goodwill contribute to determine;
3) the aggregate method does not allow to identify which components of the goodwill value are traceable to
the operating activity and which are traceable to the fiscal benefits, making more difficult the interpretation of
the phenomena at the goodwill‟s origin.
Alternatively, it is possible to use a disaggregated method through which:

www.ccsenet.org/ibr International Business Research Vol. 7, No. 11; 2014
37
where:
G0: goodwill value;
Gn0: goodwill value after tax benefits;
VTS0: tax benefits.
The Gn0 value is equal to:
s
ss
s keU
CkeUyGn
)1(
)]([ 1
1
0
(1)
Where keU is the cost of unlevered equity that, according to Law of the Conservation of Investment Value, in
case of no fiscal interference, corresponds to the WACC rate (Williams, 1938; Modigliani & Miller, 1958).
To conclude, let us look at the relationship existing among the goodwill value, G0, the goodwill value after tax
benefits, Gn0, and the market value of equity, VME0.
To start, let us determine the G0 value through a differential method, that is:
000 BVMEG
where:
VME0: total market equity value at time 0;
B0: equity book value at time 0.
Now, the relationship between Gn0 and G0, already mentioned before, can be improved in the following way:
00000 )( VTSSATGGn
where:
T0: value of cash-on-hand and marketable securities;
SA0: surplus assets;
VTS0: tax shield.
In fact, since:
00000 DSATVAVME
with:
VA0: total value of company assets;
D0: financial debts.
So,
000000 BDSATVAG
and
000000 )( SATBDVAG
)( 00000 SATCVAG
since D0+B0= C0 operating invested capital:
Now, since the values T0, SA0 and VTS0 do not contribute to the generation of the goodwill value determined
through the direct method (by the disaggregated methodology), hence (Note 2):
00000 )( VTSSATGGn
In differential terms, starting from the market value of equity, VME0, and reminding that VME0 = VA0 + T0 +
SA0 – D0:
000000 )( CVTSSATVMEGn
namely:
0000 )( CVTSVAGn
G0 =Gn0 +VTS0

www.ccsenet.org/ibr International Business Research Vol. 7, No. 11; 2014
38
hence, the following relationship is proved:
00000 )( VTSSATGGn
3. Assessment of Autonomously Evaluable Intangible Assets and Evaluation of Reduced Goodwill
It is now possible to proceed to the identification and evaluation of the intangible assets not recorded in
accounting system. This process allows to identify, within the overall goodwill value, some intangible assets that,
even not recognized by the accounting, have such features to make an extra-accounting evaluation possible. In
this way, goodwill value results from the sum of the value of all intangible assets autonomously evaluated (and
not accounted) and a residual value, defined reduced goodwill (Gnr0):
00 GnrIAGn
where Gn0 is, as always, the goodwill value, IA the value of intangible assets, autonomously evaluated, and Gnr0
the value of reduced goodwill, that is the goodwill value excluding IA.
The new expression can be written as follows:
s
sss
s
skeU
IACkeUyIAGn
)1(
)]([ 11
1
10
(2)
with:
ys: operating profit after tax in the s accounting period;
keU: cost of unlevered equity;
Cs-1: operating invested capital at the end of period s-1;
IAs-1 : intangible asset autonomously evaluated at the end of period s-1.
With Gnr0, reduced goodwill, equal to:
s
sss
s keU
IACkeUyGnr
)1(
)]([ 11
1
0
(3)
The formulation:
IAGnrGn 00 (4)
analytically developed
1
1
)1(
)]([
ss
ss
keU
CkeUy =
1
11
)1(
)]([
ss
sss
keU
IACkeUy+IAs-1
is verified when:
s
s
s
skeU
IAkeUIA
)1(
1
1
1
(5)
Using the keU rate, the determination of the overall goodwill value corresponds to the sum of the reduced
goodwill and the IA values, if the rate of return implicit in the intangible assets value is equal to keU.
The presence of intangible assets autonomously evaluable but not recording by the accounting depends on the
perspective adopted by the accounting standards that, generally, do not allow the evaluation and the accounting
of the internally generated intangible assets: as paragraph OB16 of the IASB Exposure Draft „An Improved
Conceptual Framework for Financial Reporting‟ (May, 2008) states “financial reports are not designed to show
the value of an entity”.
In valuation practice, three requirements are usually defined for the identification of the intangible assets to be
the object of an autonomous valuation, irrespective of the accounting needs:
• The asset must be the object of a significant and quantifiable flow of investments;
• The asset must be at the origin of differential economic benefits, and therefore also in this case specifically
identifiable;
• The asset must be transferable, i.e., sellable and assignable to third economies.
www.ccsenet.org/ibr International Business Research Vol. 7, No. 11; 2014
39
Together, the first two requirements indicate that the intangible asset must be at the origin of costs with a
deferred utility, while the criterion of transferability on a conceptual level is totally similar to the criterion of
separability /transferability used by accounting principles, and can be applied in a more or less rigid way.
In order to reach full understanding of the nature of the asset, it is necessary to develop the following steps.
• First of all, to valuate if the use of the asset depends on an intellectual property, a right afforded by
contracts or on non-contractual relations (for example, relations with customers or with employees).
• Furthermore, an effort should be made to understand the role played in the use of the asset by formalized
processes of a structural/organizational kind and the people that operate in the organization (Harris & Helfat,
1997; Castanias & Helfat, 2001; Stone, 2002).
• Finally, the criterion of dominance should be verified, whereby it is appropriate to identify and
autonomously valuate only the intangible assets that characterize in a specific way (dominate) the enterprise. If
the relation/trust aspect is predominant then the assets connected to marketing will be identifiable. If instead the
research/innovation aspect dominates, then the assets connected to technology will be identifiable. This criterion
not only allows to focus the attention actually on the assets that qualify the enterprise, leaving aside phenomena
that in the end may prove marginal, but also and foremost to avoid duplications in the valuation of strongly
interrelated assets (bundling).
The identification process alone is able to provide some useful information for the purpose of the subsequent
valuation of the subject asset. Let us take for example the fact that the asset may be protected by IP or contracts.
This and other information should be used in the adopted valuation methodologies.
Many valuation techniques are employable for intangible assets valuation. Examples of these valuation
approaches are:
• Cost approach (Historical cost, Replacement cost);
• Market approach (Sales comparison approach);
• Income approach (Relief from royalties, Premium profit method, Multi period excess earning method).
For the sake of brevity this work does not analyze the above mentioned techniques, for the elaboration and use of
which, reference should be made to specialized literature, that in accounting, finance and management studies
has been particularly fruitful.
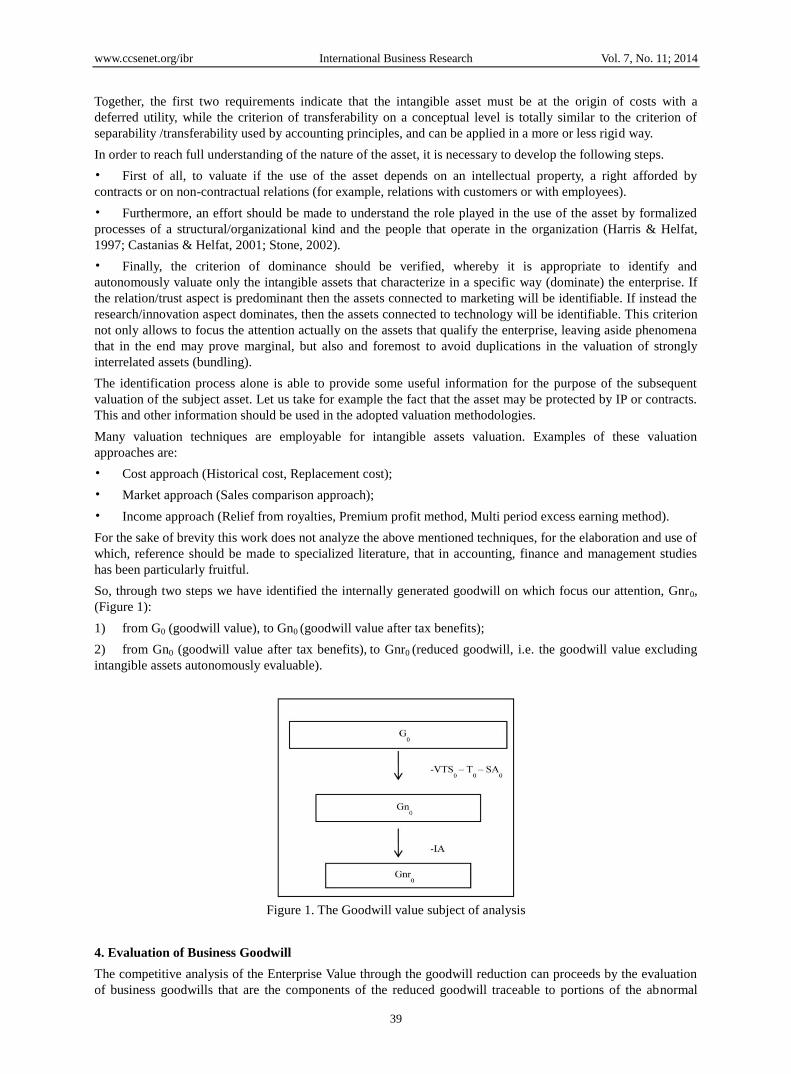
So, through two steps we have identified the internally generated goodwill on which focus our attention, Gnr0,
(Figure 1):
1) from G0 (goodwill value), to Gn0 (goodwill value after tax benefits);
2) from Gn0 (goodwill value after tax benefits), to Gnr0 (reduced goodwill, i.e. the goodwill value excluding
intangible assets autonomously evaluable).
Figure 1. The Goodwill value subject of analysis
4. Evaluation of Business Goodwill
The competitive analysis of the Enterprise Value through the goodwill reduction can proceeds by the evaluation
of business goodwills that are the components of the reduced goodwill traceable to portions of the abnormal

www.ccsenet.org/ibr International Business Research Vol. 7, No. 11; 2014
40
earnings and invested capital obtained and used by a business (Abell, 1980; Porter, 1993; Chrisman et al., 1988).
The phenomena of profitability and abnormal earning, in fact, may reveal characteristics and dimensions that
greatly differ within the same company depending on the competitive environment from which they originate
(Teece, 1984).
Even if the identification of business areas may rely on segment-reporting information, as provided for by the
accounting principles IASB (IFRS 8, Operating segments) and FASB (SFAS 131, Disclosures about segments of
an enterprise and related information), the criteria formally used to identify the businesses must necessarily be
fully consistent with the substantial strategic choices. Once the various business areas have been identified, we
can determine, in the following way, the reduced goodwill of each business area i:
s
siisi
s
ikeU
CbUkebybbGnr
)1(
)]([1
1
0
(6)
in which:
Gnr0bi: business goodwill of the generic business i;
ybis: operating profit of business area i after tax in the accounting period s;
kebiU: cost of unlevered equity computed in relation to business area i;
keU: cost of unlevered equity computed in relation to the enterprise as a whole;
Cbis-1: operating capital invested in business area i at end of period s-1.
Major shortcomings of formula (6) are due to the nature of the relation between the values used at a business
level (profit, capital and rates) and the same values used at a corporate level. We can assume that the sum of
operating profits obtained in each single business area, as well as the sum of the operating capital allocated in
these, is equal to the overall operating profit and the overall operating capital, respectively. Therefore, with
reference to the operating profit obtained in accounting period s and the operating capital in the s-1 period, the
following relations shall apply to an enterprise working in m business areas:
m
r
sis yby
1
m
r
sis CbC
1
11
Furthermore, with regard to the value of the unlevered rate, we can assume that the keU value of the enterprise is
equal to the weighted average of the kebiU values of each individual business, which in turn are obtained using
some industry-specific unlevered beta values. If, for weighing purposes, the amount of operating capital invested
in each business is chosen, then:
m
i
isi
C
CbUkebkeU
1
1 (7)
with:
)( RfRmURUkeb ifi
In which iU , is the industry-specific unlevered beta value applicable to business area i (Note 3).
It is now possible to study in depth the competitive analysis of Enterprise Value through the examination of some
issues strictly related to business goodwill.
Business goodwills arise from hypothesis on the enterprise‟ future profitability within the business. Hence, for
each business goodwill it is possible to go into the competitive meaning of each relevant variable. Notably:
1) Considering the different expected earnings and the level of risk of each business area is it possible to
measure the efficiency of capital allocation within the different businesses?
2) How the analytical prediction, over a definite period of time, and the terminal component weigh in the
overall business goodwill value? Moreover, which is the role played by the expected growth in the goodwill
determination?
www.ccsenet.org/ibr International Business Research Vol. 7, No. 11; 2014
41
3) Is it possible to distinguish the part of the abnormal earnings traceable to a specific advantageous position
of the firm from the part traceable to structural conditions?
4) Is it possible to attribute a specific role to the corporate?
5. The Risk Compensating Effect
The first issue to deepen within the competitive analysis of business goodwill considers the different expected
earnings and the level of risk of each business area in order to clarify whether it is possible to measure the
efficiency of capital allocation within the different businesses. To do so, it can be useful to start focusing the
attention on the rates used to capitalize abnormal earnings.
It should be noted that the rate used in the denominator of formula (6), that is, the rate by which abnormal
earning flows are capitalized for each business area, corresponds to the overall rate, obtained from the weighted
average (7). The reason is that if the rate used in the numerator were used in the denominator when calculating
business goodwill values (that is kebiU and not keU), then the overall abnormal earnings, which do not vary,
would be basically capitalized at a different rate with respect to the company rate and, as a result, the sum of
economic profits obtained in the areas would be equal to the total economic profit, while the sum of goodwill
values would not be equal to the overall goodwill. As a consequence, an interesting effect can be observed,
which we will define as Risk Compensating Effect (RCE), (Author, 2009), whereby if the abnormal earnings
flows obtained in each business area were capitalized at the rate of each area, then the sum of the business
goodwill values would be different from the overall goodwill, namely either greater (negative RCE) or lower
(positive RCE).
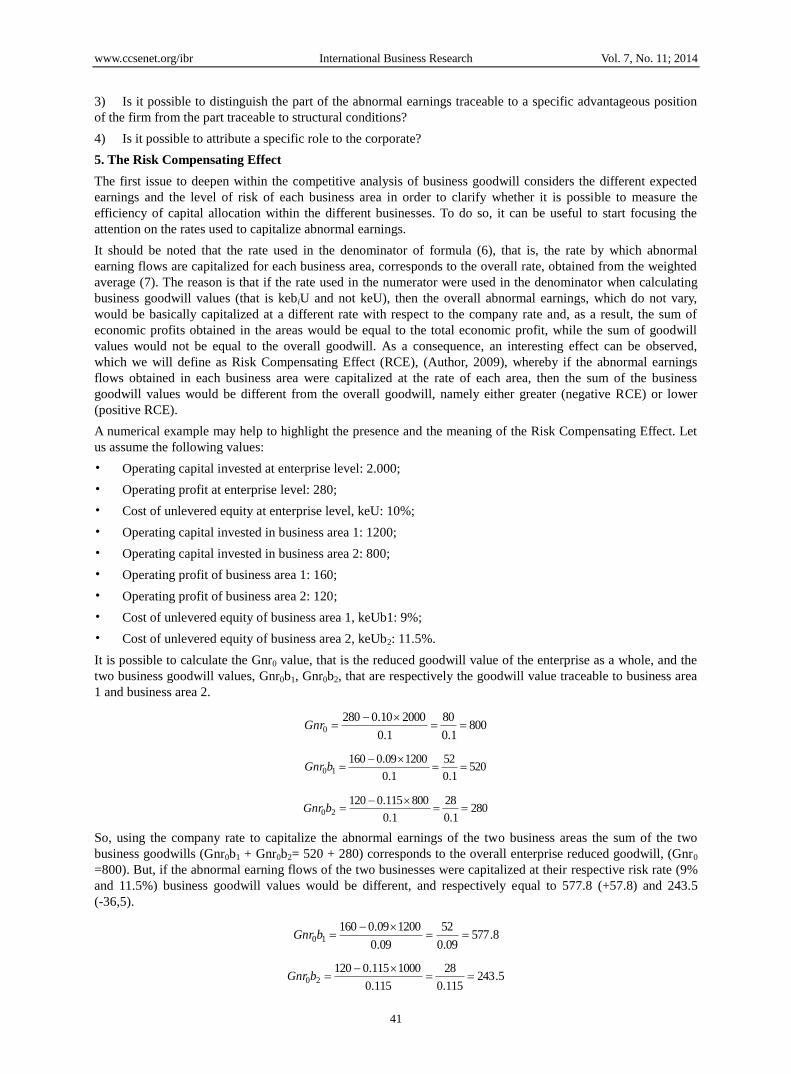
A numerical example may help to highlight the presence and the meaning of the Risk Compensating Effect. Let
us assume the following values:
• Operating capital invested at enterprise level: 2.000;
• Operating profit at enterprise level: 280;
• Cost of unlevered equity at enterprise level, keU: 10%;
• Operating capital invested in business area 1: 1200;
• Operating capital invested in business area 2: 800;
• Operating profit of business area 1: 160;
• Operating profit of business area 2: 120;
• Cost of unlevered equity of business area 1, keUb1: 9%;
• Cost of unlevered equity of business area 2, keUb2: 11.5%.
It is possible to calculate the Gnr0 value, that is the reduced goodwill value of the enterprise as a whole, and the
two business goodwill values, Gnr0b1, Gnr0b2, that are respectively the goodwill value traceable to business area
1 and business area 2.
8001.0
80
1.0
200010.02800
Gnr
5201.0
52
1.0
120009.016010
bGnr
2801.0
28
1.0
800115.012020
bGnr
So, using the company rate to capitalize the abnormal earnings of the two business areas the sum of the two
business goodwills (Gnr0b1 + Gnr0b2= 520 + 280) corresponds to the overall enterprise reduced goodwill, (Gnr0
=800). But, if the abnormal earning flows of the two businesses were capitalized at their respective risk rate (9%
and 11.5%) business goodwill values would be different, and respectively equal to 577.8 (+57.8) and 243.5
(-36,5).
8.57709.0
52
09.0
120009.016010
bGnr
5.243115.0
28
115.0
1000115.012020
bGnr

www.ccsenet.org/ibr International Business Research Vol. 7, No. 11; 2014
42
3.8215.2438.57720100 bGnrbGnrGnr
The overall enterprise reduced goodwill therefore would be higher, namely equal to 821.3 and a negative RCE
value (-21.3) emerges.
The risk compensating effect is based on the relation between the rate used for the entity as a whole and the rate
used at business level. It represents the opportunity cost associated with the various risk profiles of the business
areas and the way in which the capital is distributed among them. In other words, it measures the effectiveness of
the allocation of capital among the business areas, given their respective spreads between return on investment
and cost of capital (risk).
Let us take a closer look at the variables that cause the phenomenon. Let Sp1 be the spread between return on
investment and cost of capital in the first business area and let Sp2 be the spread in the second business area.
The RCE value can be obtained as follows:
Ukeb
CbSp
Ukeb
CbSp
keU
CbSp
keU
CbSpRCE
2
22
1
112211
)11
()11
(2
221
11UkebkeU
CbSpUkebkeU
CbSpRCE
If
UkebkeU 1
11 and
UkebkeU 2
11 are defined as compensation coefficient and denoted as COM1 and COM2,
RCE will be equal to:
)()( 222111 COMCbSpCOMCbSpRCE
in general terms, with m business areas:
m
i
ii
m
i
i iCOMCbSpRCERCE
11
in which
)( 11 UkebkeUCOM ii
The risk compensating effect at a corporate level is equal to the sum of the compensating effects calculated in
each business area. Such effects depend first of all on compensation coefficients, which can be either positive or
negative depending on whether keU at an entity level is respectively lower or higher than the rate calculated with
reference to the individual business area. In fact, when kebU > keU, (COM is positive), the abnormal earnings of
the business area are being capitalized at the more favorable rate, that is, keU. Conversely, when kebU < keU,
(COM is negative) abnormal earnings are being capitalized at the less favorable rate (keU). If the rate at the
business level is equal to the rate at a corporate level, then the coefficient is equal to 0 and the risk compensating
effect disappears at least for that specific business area. Moreover, the impact of this difference – either positive
or negative – varies to a higher or lower degree according to the abnormal earnings (spread, Spi, multiplied by
capital, Cbi,) of each business.
Hence: RCEGnrbGnr
m
i
i 1
0
in which Gnr0bi is now calculated as follows:
si
siisin
s
iUkeb
CbUkebybbGnr
)1(
)]([1
1
0

www.ccsenet.org/ibr International Business Research Vol. 7, No. 11; 2014
43
6. Real vs Terminal and Current vs Growth Business Goodwill
The second issue to deepen within the competitive analysis of business goodwill is aimed at highlighting which
part of the goodwill value results from an analytical projection of the abnormal earnings‟ flows over a definite
period of time (real business goodwill, Gnr0bR) and the part for which this projection is not realistically possible
and that comes from a synthetic value, conventionally defined terminal business reduced goodwill, (Gnr0bT).
Under our asset side and disaggregated formulations, the business goodwill value can be divided into two
components (let us assume growth equal to 0):
s
ssn
s keU
CkeUybRGnr
)1(
)]([ 1
1
0
(8)
S
SS
keUkeU
CkeUyGnrbT
)1(
)]([
(9)
with
Gnr0bR: real business goodwill;
GnrbT: terminal business goodwill.
Obviously, in the evaluation of GnrbT it is possible to use the different options of the growth factor g (steady
growth, temporary growth, multi-stages growth). For example, under the hypothesis of steady growth:
S
SS
keUgkeU
gCkeUyGnrbT
)1()(
)1()]([
S
SSS
S
SS
keUkeU
CkeUy
gkeU
keU
gCkeUy
GnrbT)1(
)([)1(
)1(1)]([
1
S
SSS
S
SS
keUgkeU
CkeUy
gkeU
keU
gCkeUy
GnrbT)1()(
)([)1(
)1(1)]([
2
1
1
1
In addition to the distinction between real and terminal business goodwill let us see a further important widening
of the analysis. Considering the business goodwill value, it could be useful to clarify which part of the value
implies a growth compared to the current profitability conditions, and which part does not implies any growth.
This analysis leads to the identification of the current business goodwill, (Gnr0bC), and of the growth business
goodwill, (Gnr0bG).
Current business goodwill (Gnr0bC) represents the goodwill value that the enterprise would obtain if the current
profitability conditions remained constant for an indefinite period of time. It is the portion of the business
goodwill sustained by the current earnings conditions. On the other hand, the growth business goodwill (Gnr0bG)
represents the part of the business goodwill value attributable to the expected growth benefits and not to the
current profitability conditions of the specific business area. Current goodwill and growth goodwill can be in
their turn broken down into their real and terminal components. In so doing, we could understand which part of
the business goodwill resulting from an analytical projection over a definite period of time (real business
goodwill) implies a growth (real growth business goodwill, Gnr0bRG) and which part is traceable to the current
profitability conditions (real current business goodwill, Gnr0bRC). The same procedure can be carried out with
reference to the terminal business goodwill analyzing which portion of it embodies the expected growth benefits
(terminal growth business goodwill, Gnr0bTG) and, on the other hand, which part of it is attributable to the
current earnings conditions (terminal current business goodwill, Gnr0bTC).
All these analysis schemes can be expressed through the following formulas:
s
sn
s keU
CkeUybRCGnr
)1(
)]([ 1
1
0
(10)

www.ccsenet.org/ibr International Business Research Vol. 7, No. 11; 2014
44
s
ssn
s keU
CkeUyybRGGnr
)1(
)]()[( 1
1
0
(11)
RCGnrkeU
ybTCGnr 00 (12)
TCGnrTGnrbTGGnr 000 (13)
with:
Gnr0bRC: real current business goodwill;
Gnr0bRG: real growth business goodwill;
Gnr0bTC: terminal current business goodwill;
Gnr0bTG: terminal growth business goodwill;
Gnr0bT: terminal business goodwill;
y : operative current profit, constant for all the period of analytic prevision.
Through the deepening aimed at identifying the real, terminal, current and growth components of the business
goodwill value it is possible to represent in a matrix the values (Table 1).
Table 1. Real, terminal, current, growth business goodwill
GnrbR0
(Real Business Goodwill)
GnrbT
(Terminal Business Goodwill)
GnrbC0
(Current Business Goodwill)
GnrbRC0
(Real Current Business Goodwill)
GnrbRT0
(Terminal Current Business Goodwill)
GnrbG0
(Growth Business Goodwill)
GnrbRG0
(Real Growth Business Goodwill)
GnrbT0
(Terminal Growth Business Goodwill)
From a competitive point of view, the comprehension of the incidence of the terminal hypothesis and of the
assumptions related to the growth on business goodwill value is very relevant.
For example, if the abnormal earnings of an enterprise are traceable to an advantageous position owned of old,
an excessive weight of the terminal value will make very weak the overall evaluation (for that specific business).
7. Evaluation of the System and Positional Business Goodwill
After the real, terminal, current and growth component of business goodwill it seems to be very interesting, in a
competitive analysis perspective, to identify which part of the business goodwill value is connected to the
competitive advantageous position of the enterprise (positional business goodwill, Gnr0bpi) and which part is
connected to the favorable profitability of the competitive system (system business goodwill, Gnr0bsi)
(Schmalensee, 1985; Rumelt, 1991; Porter, 1996).
In fact, according to the structural positioning (Porter, 1980; Caves & Porter, 1977) it is possible to trace the
abnormal earnings of an enterprise to two phenomena:
1) The attractiveness of the industry where an enterprise works (or, more specifically, attractiveness of the
selected industry segments);
2) The relative effectiveness of competitive positioning within the industry or segment.
Focusing the attention on the existence of structural conditions of abnormal earnings it is possible to extend the
concepts of profitability and risk, peculiar to enterprises, to competitive systems.
Identifying an average profitability of the enterprises that operate in a business, a benchmark value for the risk of
the competitive system (measurable even if with some approximations, with an industry β) and assuming an
average level of the capital invested by enterprises, it is possible to determine an average economic profit,
representative of the competitive system.

www.ccsenet.org/ibr International Business Research Vol. 7, No. 11; 2014
45
If we admit that this average value has economic meaning, then we can argue that it identifies a profitability
peculiar to the competitive system (i.e. structural) and not referred to the individual enterprise.
Therefore, in this sense, the enterprise abnormal earnings and, consequently, the business goodwills, are
traceable to two components: the abnormal earnings of competitive system, related to structural conditions, and
the abnormal earnings of the individual enterprise, connected to the relative position of the enterprise within the
competitive system.
So, considering the goodwill of business i of the enterprise (Gnr0bi), equal to:
s
siisi
s
ikeU
CbUkebybbGnr
)1(
)]([1
1
0
or, keeping into account the risk compensating effect:
isi
siisi
s
i RCEUkeb
CbUkebybbGnr
)1(
)]([1
1
0
in which:
ybis = operating profit of the business i after taxes in accounting period s;
kebiU= cost of unlevered equity estimated with reference to the business area i;
keU= cost of unlevered equity estimated with reference to the enterprise taken as a whole;
Cbis-1 = operating capital invested in the business area i at end of period s-1;
RCEi = Risk Compensating Effect in business area i;
the following relation therefore applies:
iii bsGnrbpGnrbGnr 000
in which ibpGnr0 and ibsGnr0 stand for, respectively, positional business goodwill in business i, i.e., the
business goodwill value connected to the advantageous position of the enterprise, and system goodwill in
business i, i.e., the business goodwill value connected to the favorable profitability of the competitive system.
The considerations previously made allow the estimation of both values. In fact, introducing the following data:
ROISis = average operating profitability of business i system, after taxes in accounting period s;
kesiU= system cost of unlevered equity of business i, calculated using the industry βUsi.
si
isisi
s
iUkes
CbUkesROISbsGnr
)1(
])[( 1
1
0
(14)
It should be noted that in the expression (14) the value of the operating capital is equal to the value of the
operating capital of the enterprise (Cbis-1). In other words, the assumption is made that the Cb value (enterprise
operating capital) is equal to the average operating capital used by the enterprises of the industry (Cs). This
assumption allows to reduce the complexity of some passages that will be shortly shown.
Without introducing any new information, we may analyzed the positional business goodwill, that is the
goodwill resulting from favorable conditions, in terms of profitability and risk, in comparison to those that
characterize the competitive system as a whole.
The positional business goodwill, Gnr0bpi, can be obtained from the difference between business goodwill and
system business goodwill, as follows:
s
i
siisi
s
iUkeb
CbUkebROIBbpGnr
)1(
])[(1
1
0
- s
i
siiis
s Ukes
CbUkesROIS
)1(
])[(1
1
(15)
The positional business goodwill can be traced to following components:
• The profitability effect, related to the fact the enterprise has favorable conditions in term of remuneration of
invested capital in respect of the ones that characterized the competitive system, and

www.ccsenet.org/ibr International Business Research Vol. 7, No. 11; 2014
46
• The riskiness effect, related to the fact the enterprise has favorable conditions in term of risk in respect of
the ones that characterized the competitive system.
Neutralizing the risk differential, that is, kesU = kebU, the income effect can be isolated and highlighted (IE)
1
1
)1(
])[(
ss
i
sisi
Ukeb
CbUkebROIBIE -
si
siisi
s Ukeb
CbUkebROIS
)1(
])[(1
1
si
siissi
s Ukeb
CbROISROIBIE
)1(
)])[(1
1
(16)
If instead we neutralize the profitability differential, that is, ROIS = ROI, the risk effect (RE) is highlighted
1
1
)1(
])[(
ss
siis
kebU
CbUkebROISRE -
1
1
)1(
])[(
ss
i
siis
Ukes
CbUkesROIS
(17)
8. Corporate Goodwill
Before we have assumed, for the sake of simplicity, that the sum of the business goodwill values corresponds to
the total reduced goodwill of the enterprise.
A final matter of high interest concerns the possibility of evaluating the corporate resources contribution in the
generation of goodwill value, where corporate resources are to be intended as those assets that, even not
allocated to the businesses, contribute to the generation of the operating profit of the enterprise (attention should
be paid, to not confusing corporate assets with surplus assets that, conversely, have already been excluded from
the goodwill evaluation).
In this way it is possible to evaluate a corporate goodwill. First of all it should be clarified that corporate
goodwill is equal to:
s
ss
s keU
ChkeUhcGnr
)1(
)]([ 1
1
0
(18)
in which:
hs: share of business earnings attributable to the corporate assets contribution;
keU= cost of unlevered equity computed in relation to the enterprise as a whole (entity);
Chs: operating capital invested in the corporate at end of period s.
It is necessary to make some considerations about the possibility to evaluate corporate goodwill, related in
particular, to its economic significance and its technical plausibility.
First of all, by analyzing the overall reduced goodwill, (Gnr0), the attempt is made to trace back the origin of
expected above normal earnings. If the resources utilized at a corporate level play in this respect a specific and
determining role, even irrespective of the business areas where an enterprise works, in the sense that by
modifying these areas the corporate resources continue in any case to give their contribution, then the corporate
goodwill is significant.
A second problem connected with the estimation of a corporate goodwill consists of the technical plausibility of
the operation, that is, the possibility to determine a portion of revenues that can be attributed to corporate
contribution.
A few meaningful indications in this respect can be drawn using some cost analysis tools, such as the Activity
Based Costing method (Jhonson & Kaplan, 1987). Activity Based costing consists of recording company costs
first of all by single activity, in relation to the level of absorption of production factors and then, by final cost
item (typically, the product but also other final items) in relation to the absorption of the activities. These two
steps are carried out using respectively resource cost drivers, or process drivers, that is, cost parameters or
determining factors that allow measurement of how each activity takes up production factors, and cost activity
drivers, or activity drivers, which are also cost determining factors that allow measurement of activity
consumption on the part of final cost items (Kaplan & Cooper, 1998).
Activity Based Costing method besides being suitable for the attribution of a few costs and assets to the business
areas, may also be useful, so to say, in an reverse way, for the determination of corporate revenues. In this way,

www.ccsenet.org/ibr International Business Research Vol. 7, No. 11; 2014
47
the determination of corporate contribution to revenues, can be developed through the following steps:
1) Identification of corporate activities (e.g. Planning, communication, governance, etc.);
2) Identification of process drivers and subsequent allocation of overhead costs and assets to specific
corporate activities;
3) Identification of activity drivers which allow the understanding of the extent of the connection between
corporate activities and businesses;
4) Identification of portions of revenues that can be attributed to corporate, using the ratio between revenues
and operating costs of each business area.
An example may clarify the above steps. Let us assume that the corporate activities whose costs are not
attributable to the business areas are corporate management and communication. The allocation of costs to the
two activities is made on the basis of the cost of human resources employed in the activities, resulting in a
distribution of 60 per cent to corporate management activity and 40 per cent to communication activity (total
corporate costs are supposed equal to 100).
The activity driver identified both for the corporate management activity and for the communication activity are
the marketing costs related to the business areas (the higher these costs, the greater the absorption of the two
activities). Based on this, the total corporate management costs, in the amount of 60 are respectively attributed to
business 1, in the amount of 35, and to business 2 in the amount of 25. As for communication, instead, the total
costs equal to 40 are attributed to business 1 in the amount of 30, and to business 2 in the amount of 10. In this
way, business 1 is overall connected to corporate costs in the amount of 65 (35 + 30) and business 2 to corporate
costs in the amount of 35 (25 + 10).
It should be reiterated that in this case the objective is not the attribution of costs but quite the contrary, i.e., the
attribution of a portion of revenues to the contribution of corporate activities. Therefore, it is more correct to
pinpoint the role that these resources play in the generation of goodwill at a corporate level rather than at
business level. Let us assume that the two business have respectively revenues in the amount of 1000 and 800
and costs in the amount of 840 and 680. Based on this, business 1, shows a relation between revenues and costs
of approximately 1.19 (1000 /840), whereas in business 2 such ratio is equal to 1.17 (800/680).
Applying the ratio between revenues and costs (1.19 for business 1 and 1.17 for business 2) to the corporate
costs contribution to each business (65 for business 1 and 35 for business 2) it is possible to determine the
portion of business revenues that can be attributed to the corporate contribution:
• Business 1 = 65 x 1.19 = 77.3
• Business 2 = 35 x 1.17 = 40.9
The amount of 77,3, in business 1, is equal to a little more than 7 per cent of overall revenues (77.3 /1000 =
0.0773). The amount of 40.9 instead is equal to a little more than 5er cent of revenues of business 2
(40.9/800=0.051).
Through an „activity based reverse logic‟, the percentages 7 and 5 per cent can be used to compute the portion of
revenues attributed to the contribution of corporate activities.
9. Conclusion
Expressing in a formula, the reduced goodwill value, including the risk compensating effect, is equal to:
m
i
i RCEcGnrbGnrGnr
1
000 (19)
m
i ss
i
isIsI
Ukeb
CbUkebybGnr
1 1
10
)1(
)]([+
1
1
)1(
)]([
ss
ss
keU
ChkeUh+
m
i
iii COMCSp
1
This paper has been aimed at suggesting a perspective of analysis of the Enterprise Value, through the
competitive evaluation of the internally generated goodwill‟s determinants.
The process has been developed through the following steps.

www.ccsenet.org/ibr International Business Research Vol. 7, No. 11; 2014
48
1) Definition of the configuration of goodwill subject of the analysis, i.e. the reduced goodwill, (Gnr0), that is
the internally generated goodwill not affected neither by the tax shield nor by the intangible assets autonomously
evaluable. This configuration of value is obtained by deducting from the internally generating goodwill (G0):
• The value of tax benefit, VTS, and
• The value of intangible assets autonomously evaluable and not recognized by the accounting (IA);
2) Reduction of the goodwill value (Gnr0), in order to highlight business goodwills (Gnr0bi) that are the
components of reduced goodwill value related to portions of the abnormal earnings and invested capital obtained
and used by each single business.
3) Identification within each business goodwill of:
• The efficiency level of the capital allocation within the different business areas, considered the different
expected earnings and risk level;
• The weight of the analytical prediction component and of the terminal component and of the role played by
the growth in the process of goodwill evaluation;
• The part of abnormal earnings traceable to an advantageous competitive position and the part traceable to
structural conditions;
• The role attributable to corporate resources in the goodwill value determination.
As one can infer, the core element of this process is represented by the business goodwill that is the part of
reduced goodwill value arising from the enterprise‟ presence within a specific business area.
In general terms, it seems to be crucial the link between the specific components of the reduced goodwill value
and the competitive phenomena related to them.
This work contributes to the literature by adding a new strategic perspective on the analysis and interpretation of
the internally generated goodwill. Traditionally, goodwill analysis is traced to accounting and financial literature
(Zhang Mei, 2013; Schultze & Weiler, 2010; Vance, 2010; Seetharaman et al. 2004, 2006) and it is focused on
the analysis of goodwill accounting process and impairment and on its impacts on financial performance. In this
paper, without deny the relevance of its accounting and financial roots, we offer a partially different perspective
of analysis focusing on the relationship that internally generated goodwill has with the competitive position of
the firm.
Through the lens of this analysis, the article contributes to shed light on the role of competitive and strategic
issues on the process of goodwill creation and, in the last analysis, on the process of abnormal earnings
generation.
Indeed, within the field of strategic management the theme of internally generated goodwill offers not only
analytical, creative and process-related potential but also significant behavioral and political value.
Further developments both in practice and through research are awaited to reveal the full potential of the analysis
suggested in this paper for the practice of strategic management. An adequate development of expressly arranged
databases could lead to an empirical verification of the informative and forecast relevance of the goodwill
reduction process.
References
Abell, D. F. (1980). Defining the Business, The starting Point of Strategic Planning. Englewood Cliffs, N.J.:
Prentice Hall.
Amit, R., & Schoemaker, P. J. H. (1993). Strategic Assets and Organizational Rent. Strategic Management
Journal, 14(1), 33–46. http://dx.doi.org/10.1002/smj.4250140105
Arrow, K., & Hahn, F. (1971). General Competitive Analysis. San Francisco, CA: Holden Day.
Barney, J. B. (1991). Firm Resources and sustained competitive advantage. Journal of Management, 17(1),
99–120. http://dx.doi.org/10.1177/014920639101700108
Beattie, V., & Thompson, S. J. (2005). Intangibles and the OFR. Financial Management, June, 29–30.
Beretta, Z. A. (2009). Accounting for Goodwill. New York: Wiley.
Besta, F. (1922). La Ragioneria. Milano:Vallardi.
Castanias, R., & Helfat, C. E. (1991). Management Resources and Rents. Journal of Management, 17(October),
155–171. http://dx.doi.org/10.1177/014920639101700110

www.ccsenet.org/ibr International Business Research Vol. 7, No. 11; 2014
49
Caves, W., & Porter, M. E. (1977). From entry barriers to mobility barriers. Quarterly Journal of Economics,
91(May), 421–441.
Chrisman, J. J., Hofer, C. W., & Boulton, W. R. (1988). Toward a System for Classifying Business Strategy.
Academy of Management Review, 13(3), 413–428. http://dx.doi.org/10.5465/AMR.1988.4306963
Cooper, I. A., & Nyborg, K. G. (2006). The value of tax shields is equal to the present value of the tax shields.
Journal of Financial Economics, 81, 215–225. http://dx.doi.org/10.1016/j.jfineco.2005.07.003
Corrado, C., Hulten, C., & Sichel, D. (2006). Intangible Capital and Economic Growth. Finance and Economics
Discussion Serier, Division of Research & Statistics and Monetary Affair, Federal Reserve Board, 24,
Washinton D.C.
Debreu, G. (1959). The Theory of Value. New York: Wiley.
Edwards, E. O., & Bell, P. W. (1961). The theory of measurement of business income. Berkeley, CA: University
of California Press.
Feltham, A. G., & Ohlson, J. A. (1995). Valuation and clean surplus accounting for operating and financial
activities. Contemporary Accounting Research, 11, 689–731.
http://dx.doi.org/10.1111/j.1911-3846.1995.tb00462.x
Fernandez, P. P. (2004). The value of tax shields is not equal to the present value of the tax shields. Journal of
Financial Economics, 73, 145–165. http://dx.doi.org/10.1016/j.jfineco.2002.10.001
Harris, D., & Helfat, C. (1997). Specificity of CEO human capital and compensation. Strategic Management
Journal, 18, 895–920.
http://dx.doi.org/10.1002/(SICI)1097-0266(199712)18:11%3C895::AID-SMJ931%3E3.0.CO;2-R
Hatfield, H. R. (1927). Accounting: its principles and problems. New York: D. Appleton and Company
Jhonson, T., & Kaplan, R. S. (1987). Relevance Lost. The Rise and Fall of Management Accounting. Boston:
Harvard Business School Press.
Kaplan, R. S., & Cooper, R. (1998). Cost & Effect. Using Integrated Cost System to drive Profitability and
Performance. Boston: Harvard Business School Press.
Lev, B. (2001). Intangibles: Management, Measurement, and Reporting. Washington D.C.: The Brookings
Institution Press.
Mei, Z. (2013). The impact of internally generated goodwill on financial performance of firms. Journal of
Applied Business Research, 29(6), 1809–1814.
Modigliani, F., & Miller, M. H. (1958). The Cost of Capital, Corporation Finance, and the Theory of Investment.
American Economic Review, 48(3), 261–297.
Nelson, R., & Winter, S. (1982). An Evolutionary theory of economic change. Cambridge, MA: Harvard
University Press.
OECD. (2000). Innovation and Economic Performance. OECD, OECD Science, Technology and Industry
Outlook 2000, Paris. http://dx.doi.org/10.1787/sti_outlook-2000-en
OECD. (2001). Economics and Finance of Lifelong Learning. Paris.
Ohlson, A. J. (1991). The theory of value and earnings, and an introduction to the Ball-Brown analysis.
Contemporary Accounting Research, 8, 1–19. http://dx.doi.org/10.1111/j.1911-3846.1991.tb00831.x
Ohlson, A. J. (1995). Earnings, book values, and dividends in equity valuation. Contemporary Accounting
Research, 11, 661–687. http://dx.doi.org/10.1111/j.1911-3846.1995.tb00461.x
Peasnell, K. V. (1981). On capital budgeting and income measurement. Abacus, June, 52–67.
http://dx.doi.org/10.1111/j.1467-6281.1981.tb00101.x
Peasnell, K. V. (1982). Some formal connections between economic values and yields and accounting numbers.
Journal of Business Finance and Accounting, 9(3), 361–381.
http://dx.doi.org/10.1111/j.1468-5957.1982.tb01001.x
Penrose, E. T. (1959). The Theory of the Growth of the Firm. London: Oxford University Press.
Peteraf, M. A. (1993). The Cornerstones of Competitive Advantage: A Resource-Based View. Strategic
Management Journal, 14(3), 179–191. http://dx.doi.org/10.1002/smj.4250140303

www.ccsenet.org/ibr International Business Research Vol. 7, No. 11; 2014
50
Porter, M. E. (1980). Competitive Strategy-Techniques for Analyzing Industries and Competitors. New York: The
Free Press.
Porter, M. E. (1996). What is Strategy? Harvard Business Review, November/December, 61–78.
Porter, M. E., & Montgomery, C. (1993). Come le Forze Competitive Modellano la Strategia. Milano: Il Sole 24
Ore.
Preinreich, G. A. D. (1938). Annual survey of economic theory: the theory of depreciation. Econometrica, 6,
219–231. http://dx.doi.org/10.2307/1907053
Rumelt, R. P. (1991). How Much Does Industry Matter? Strategic Management Journal, 12(3), 167–185.
http://dx.doi.org/10.1002/smj.4250120302
Schmalenbach, E. (1908). Die Abschreibung. Zeitschrift für handelswissenschaftliche Forschung (ZfhF), 3,
81–88.
Schmalensee, R. (1985). Do Markets differ much? American Economic Review, 75, 341–351.
Schultze, W., & Weiler, A. (2010). Goodwill accounting and performance measurement. Management Finance,
36(9), 768–784. http://dx.doi.org/10.1108/03074351011064645
Seetharaman, A., Balachandran, M., & Saravanan, A. S. (2004). Accounting treatment of goodwill: yesterday,
today and tomorrow: problems and prospects in the international perspective. Journal of Intellectual Capital,
5(1), 131–152. http://dx.doi.org/10.1108/14691930410512969
Seetharaman, A., Jayashree, S., Raju, S., Tey, Y. Y. (2006). Managing impairment of goodwill. Journal of
Intellectual Capital, 7(3), 338–353. http://dx.doi.org/10.1108/14691930610681447
Stone, K. V. W. (2002). Knowledge at work: disputes over the ownership of human capital in the changing
work-place. Connecticut Law Review, 34, 721–763.
Teece, D. (1984). Economic Analysis and Strategic Management. California Management Review, XXVI(3)
87–110. http://dx.doi.org/10.2307/41165082
Vance, D. E. (2010). Return on goodwill. Journal of Applied Business Research, 26(2), 93–103.
Wernerfelt, B. (1984). A resource–based view of the firm. Strategic Management Journal, 5(2), 171–180.
http://dx.doi.org/10.1002/smj.4250050207
Williams, J. B. (1938). The Theory of Investment Value. Boston: Harvard University Press.
Zappa, G. (1957). Le produzioni nell’economia delle imprese, I,II,III. Milano: Giuffré.
Notes
Note 1. In this formula, we assume that the rate used to discount the tax savings (the denominator rate) is equal
to kd. Then, we assume that the risk of these flows corresponds to the risk of the underlying debt, whose cost is
kd. This hypothesis is commonly accepted in the corporate finance literature, even if it should require some
deepening (Fernandez, 2004; Cooper & Nyborg, 2006).
Note 2. It is necessary to make a few consideration on the goodwill value accounted in financial statements
(goodwill resulting from a business combination) and that therefore contribute to the formation of the value of C0.
Generally speaking, we need to understand whether the recorded goodwill inside the specific asset combination
leads to the formation of normal profitability or is at the origin of abnormal earnings. In other words, we need to
clarify whether and to what extent it makes sense to calculate the normal profitability of C0 with or without the
accounted goodwill.
Note 3. A simplification is here introduced: the coincidence, at least as far as beta value is concerned, of industry
and business.
Copyrights
Copyright for this article is retained by the author(s), with first publication rights granted to the journal.
This is an open-access article distributed under the terms and conditions of the Creative Commons Attribution
license (http://creativecommons.org/licenses/by/3.0/).