Embed Size (px)
Citation preview
MEDIUM TERM BUDGETARY
FRAMEWORK (MTBF)
(2009-12)
Volume - II
Medium Term Budgetary Framework (MTBF) – Health Department(2009-12)
Government of the PunjabHealth Department

1
Table of Contents
MESSAGE FROM SECRETARY HEALTH ERROR! BOOKMARK NOT DEFINED.
ACRONYMS 5
SECTION I 7
1. Introduction and background to the Department 7 1.1. Particulars of the Department 7 1.2. Vision statement 7 1.3. Policy objectives 7 1.4. Overview of Health Sector in Punjab 8 1.5. Organizational Structure and Functions of the Department 8 1.6. Share of Health budget in provincial budget outlay 12
2. Priorities in the medium term (2009‐12) 14
3. Medium term budget estimates (2009‐12) 14 3.1 Summary of MTBF Estimates (2009‐12) 14 3.2 MTBF allocations by policy objectives 17 3.3 MTBF allocations – by object classification 19 3.4 MTBF allocations – by functional classification 22 3.5 MTBF allocations – by cross classification 24 3.6 Key inputs and outputs – Current Budget 30 3.7 Selective Outputs for Large Development Schemes 33 3.8 Recurrent impact of development projects 37
2
APPENDIX – A: ORGANOGRAM OF HEALTH DEPARTMENT 38
APPENDIX – B: EXPLANATORY NOTES TO MTBF ESTIMATES (2009‐12) 39
APPENDIX – C: MTBF AT HEALTH DEPARTMENT 43
GLOSSARY OF TERMS 46
SECTION II 48
PART – A: DETAILS OF CURRENT BUDGET ESTIMATES 2009‐12 48
PART – B: DETAILS OF DEVELOPMENT BUDGET ESTIMATES 2009‐12 218
3
MESSAGE FROM SECRETARY HEALTH DEPARTMENT
After a detailed exercise spread over several months, the Health Department has
come up with the Medium Term Budgetary Framework (MTBF) Statement 2009-12. This has been a
result of a joint effort put forth by officials of the Department, spending units and the consultants
engaged for this initiative. This Statement has been produced in two Sections: Section 1 deals with
analysis and summaries of MTBF estimates 2009-12 together with past trends in budget allocations.
It also gives a summary on cost of health policies besides a summary of a set of key ‘outputs’ that
the spending units would aim to deliver in 2009-12 along with key resources (Inputs) required.
Section 2 of the Statement gives MTBF estimates for non-devolved spending units of the
Department separately for current and development budgets for 2009-12.
Health Department delivers more complex and sensitive services than any other
Department of the Government. It controls (directly or indirectly) a number of diverse entities that
provide specialized services to the people in the Province and manages a large portfolio of
development schemes in various sub-sectors. Role of the Department keeps evolving with the
passage of time in relation to both delivery of health services and formulation and implementation of
health policies. A key policy change happened during FY 2008-09 aimed at the provision of free
treatment, strengthening of infrastructure and provision of other support facilities in tertiary care
hospitals under Chief Minister’s initiative. This policy change resulted in a bigger resource envelope
for the Department and its tertiary care hospitals.
To cater to the changing role and to address the diversity inherent in the operations
of the Department, an up-to-date information warehouse would help the Department in analyzing
cost of implementing health policies; identifying operational targets of the spending units and
correlating them with their financial requirements; and effectively tracking budget expenditure
(particularly for development schemes). It was with this view that the Department carried out a
merger of its Budget and Development Wings during FY 2008-09 to form a Financial Management
Cell (FMC). The pilot implementation of MTBF in coordination with the FMC seems to have laid a
foundation for costing the health strategies and correlating operational targets of the spending units
with their financial requirements. This essentially entails a paradigm shift in its own right and
obviously requires a high degree of diligence and commitment. Let me express my unequivocal
support for this major initiative and reiterate Department’s total support and ownership for this.
ANWAR AHMAD KHAN
4
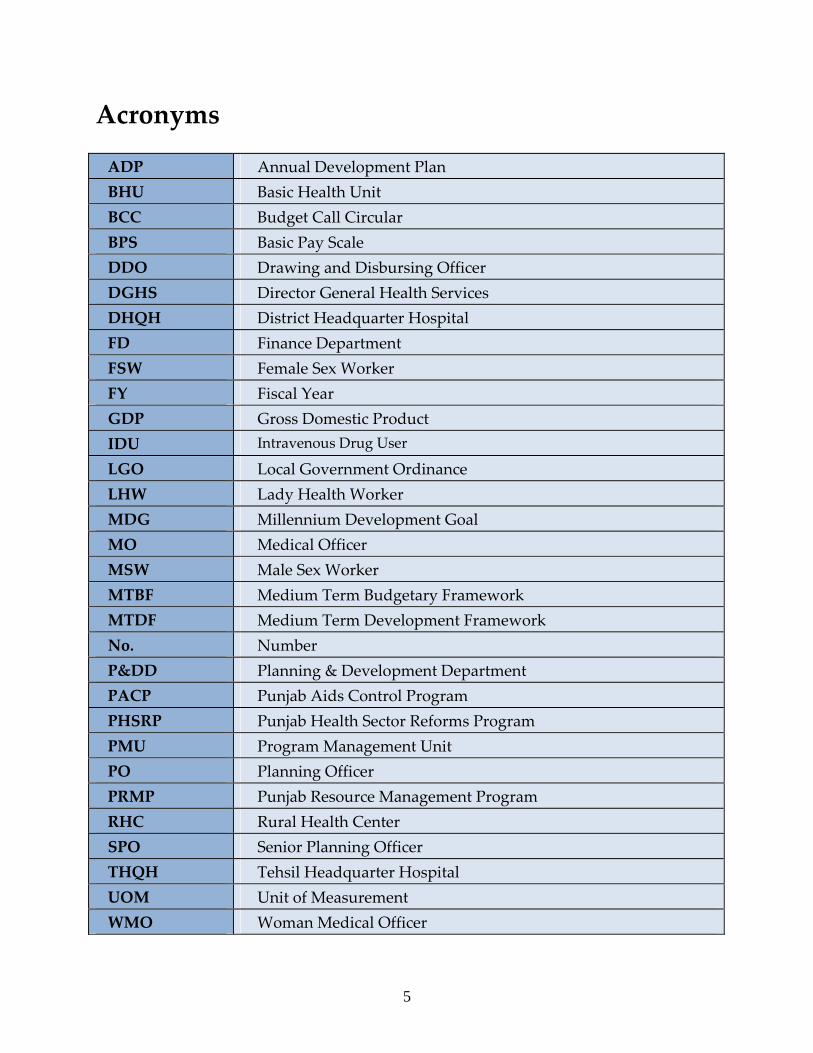
Acronyms ADP Annual Development Plan BHU Basic Health Unit BCC Budget Call Circular BPS Basic Pay Scale DDO Drawing and Disbursing Officer DGHS Director General Health Services DHQH District Headquarter Hospital FD Finance Department FSW Female Sex Worker FY Fiscal Year GDP Gross Domestic Product IDU Intravenous Drug User LGO Local Government Ordinance LHW Lady Health Worker MDG Millennium Development Goal MO Medical Officer MSW Male Sex Worker MTBF Medium Term Budgetary Framework MTDF Medium Term Development Framework No. Number P&DD Planning & Development Department PACP Punjab Aids Control Program PHSRP Punjab Health Sector Reforms Program PMU Program Management Unit PO Planning Officer PRMP Punjab Resource Management Program RHC Rural Health Center SPO Senior Planning Officer THQH Tehsil Headquarter Hospital UOM Unit of Measurement WMO Woman Medical Officer
5

Medium Term Budgetary Framework 2009-12
Section I
6
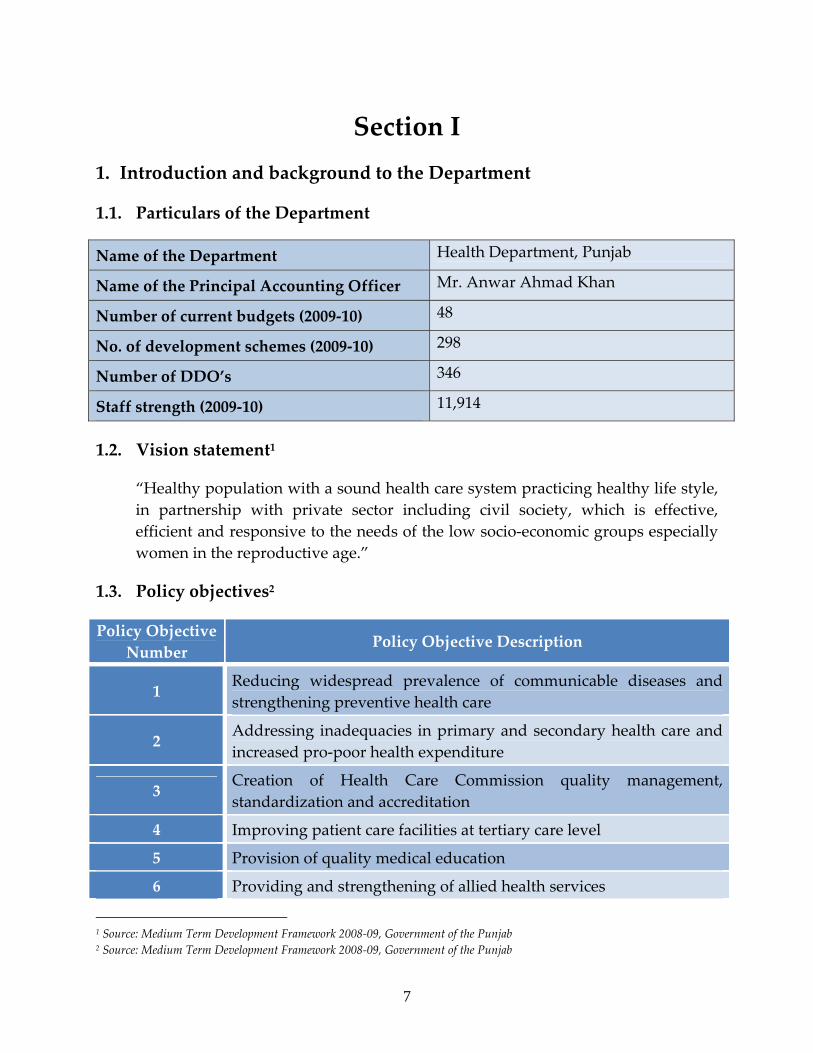
Section I 1. Introduction and background to the Department
1.1. Particulars of the Department
Name of the Department Health Department, Punjab
Name of the Principal Accounting Officer Mr. Anwar Ahmad Khan
Number of current budgets (2009‐10) 48
No. of development schemes (2009‐10) 298
Number of DDO’s 346
Staff strength (2009‐10) 11,914
1.2. Vision statement1
“Healthy population with a sound health care system practicing healthy life style, in partnership with private sector including civil society, which is effective, efficient and responsive to the needs of the low socio‐economic groups especially women in the reproductive age.”
1.3. Policy objectives2
Policy Objective Number
Policy Objective Description
1 Reducing widespread prevalence of communicable diseases and strengthening preventive health care
2 Addressing inadequacies in primary and secondary health care and increased pro‐poor health expenditure
3 Creation of Health Care Commission quality management, standardization and accreditation
4 Improving patient care facilities at tertiary care level
5 Provision of quality medical education
6 Providing and strengthening of allied health services
1 Source: Medium Term Development Framework 2008‐09, Government of the Punjab 2 Source: Medium Term Development Framework 2008‐09, Government of the Punjab
7
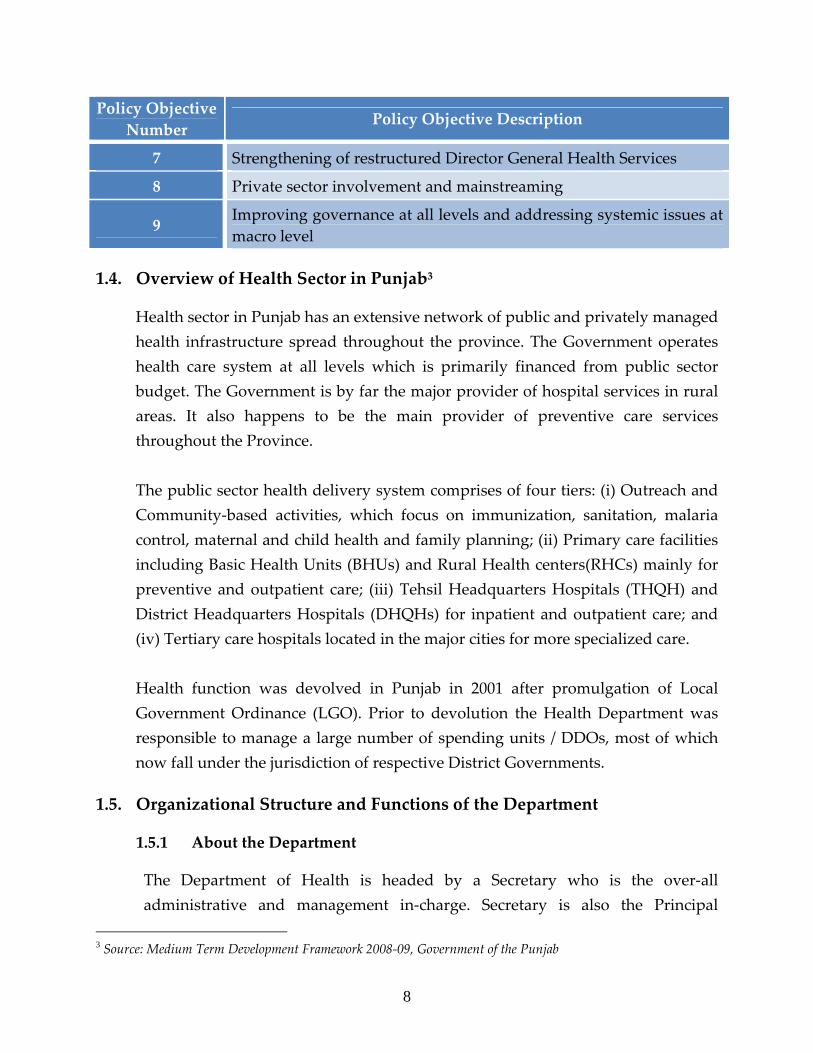
Policy Objective Number
Policy Objective Description
7 Strengthening of restructured Director General Health Services
8 Private sector involvement and mainstreaming
9 Improving governance at all levels and addressing systemic issues at macro level
1.4. Overview of Health Sector in Punjab3
Health sector in Punjab has an extensive network of public and privately managed health infrastructure spread throughout the province. The Government operates health care system at all levels which is primarily financed from public sector budget. The Government is by far the major provider of hospital services in rural areas. It also happens to be the main provider of preventive care services throughout the Province. The public sector health delivery system comprises of four tiers: (i) Outreach and Community‐based activities, which focus on immunization, sanitation, malaria control, maternal and child health and family planning; (ii) Primary care facilities including Basic Health Units (BHUs) and Rural Health centers(RHCs) mainly for preventive and outpatient care; (iii) Tehsil Headquarters Hospitals (THQH) and District Headquarters Hospitals (DHQHs) for inpatient and outpatient care; and (iv) Tertiary care hospitals located in the major cities for more specialized care. Health function was devolved in Punjab in 2001 after promulgation of Local Government Ordinance (LGO). Prior to devolution the Health Department was responsible to manage a large number of spending units / DDOs, most of which now fall under the jurisdiction of respective District Governments.
1.5. Organizational Structure and Functions of the Department
1.5.1 About the Department
The Department of Health is headed by a Secretary who is the over‐all administrative and management in‐charge. Secretary is also the Principal
3 Source: Medium Term Development Framework 2008‐09, Government of the Punjab
8
Accounting Officer for the Department with the over‐all responsibility of financial management and control. He/she also provides direction to the Department and plays lead role in setting and implementing provincial health policy objectives.
The Secretary Health is assisted by Director General Health Services (DGHS), Director General Nursing, Additional Secretaries (Admin, Development, Technical and General), Executive Director Special Projects, Chief Executives of teaching hospitals, Principals of Medical Colleges and Deans of Post Graduate Institutes in running the affairs of Health Department.
DGHS is at the apex of supervising health services in the periphery. He/she is supported by the Directors of Communicable Disease Control, Expanded Program of Immunization, Basic Health Services/Headquarters, Reproductive Health / Maternity and Child Health and Planning & Evaluation and a number of Additional and Assistant Directors Health Services at the provincial Directorate and by Directors Health Services at Divisional headquarters. An overall departmental organogram is given at Appendix – A.
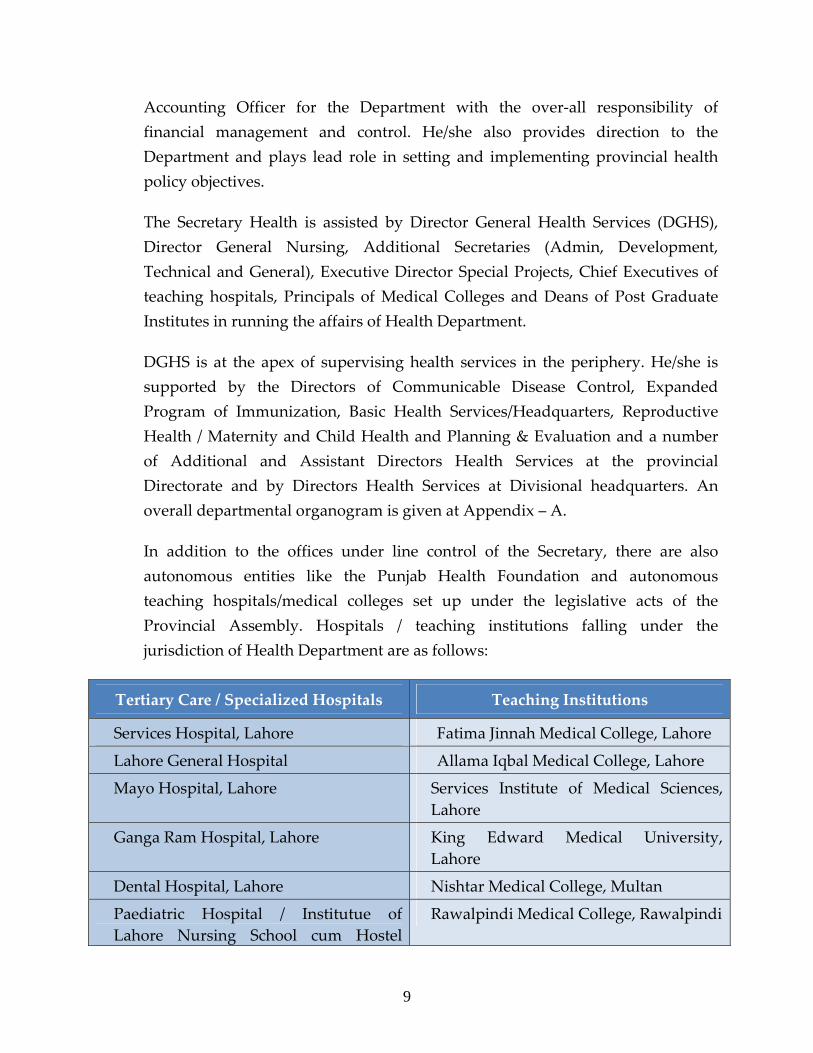
In addition to the offices under line control of the Secretary, there are also autonomous entities like the Punjab Health Foundation and autonomous teaching hospitals/medical colleges set up under the legislative acts of the Provincial Assembly. Hospitals / teaching institutions falling under the jurisdiction of Health Department are as follows:
Tertiary Care / Specialized Hospitals Teaching Institutions
Services Hospital, Lahore Fatima Jinnah Medical College, Lahore
Lahore General Hospital Allama Iqbal Medical College, Lahore
Mayo Hospital, Lahore Services Institute of Medical Sciences, Lahore
Ganga Ram Hospital, Lahore King Edward Medical University, Lahore
Dental Hospital, Lahore Nishtar Medical College, Multan
Paediatric Hospital / Institutue of Lahore Nursing School cum Hostel
Rawalpindi Medical College, Rawalpindi
9
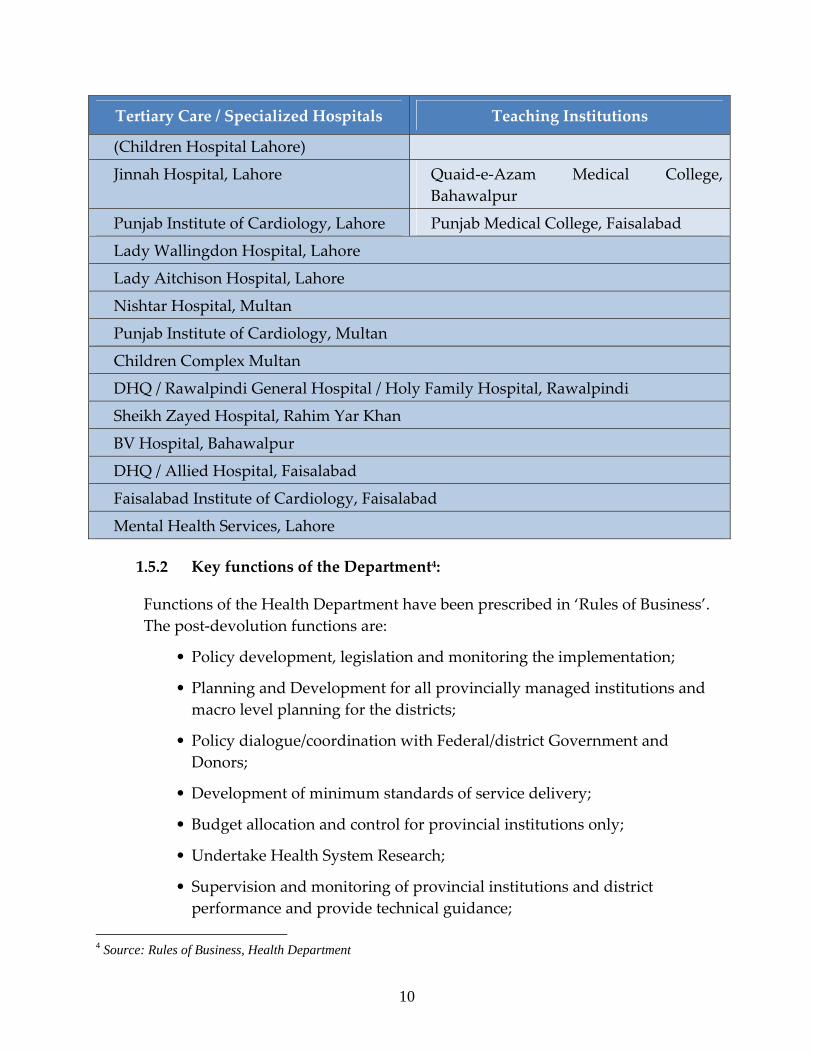
Tertiary Care / Specialized Hospitals Teaching Institutions
(Children Hospital Lahore)
Jinnah Hospital, Lahore Quaid‐e‐Azam Medical College, Bahawalpur
Punjab Institute of Cardiology, Lahore Punjab Medical College, Faisalabad
Lady Wallingdon Hospital, Lahore
Lady Aitchison Hospital, Lahore
Nishtar Hospital, Multan
Punjab Institute of Cardiology, Multan
Children Complex Multan
DHQ / Rawalpindi General Hospital / Holy Family Hospital, Rawalpindi
Sheikh Zayed Hospital, Rahim Yar Khan
BV Hospital, Bahawalpur
DHQ / Allied Hospital, Faisalabad
Faisalabad Institute of Cardiology, Faisalabad
Mental Health Services, Lahore
1.5.2 Key functions of the Department4:
Functions of the Health Department have been prescribed in ‘Rules of Business’. The post‐devolution functions are:
• Policy development, legislation and monitoring the implementation;
• Planning and Development for all provincially managed institutions and macro level planning for the districts;
• Policy dialogue/coordination with Federal/district Government and Donors;
• Development of minimum standards of service delivery;
• Budget allocation and control for provincial institutions only;
• Undertake Health System Research;
• Supervision and monitoring of provincial institutions and district performance and provide technical guidance;
4 Source: Rules of Business, Health Department
10
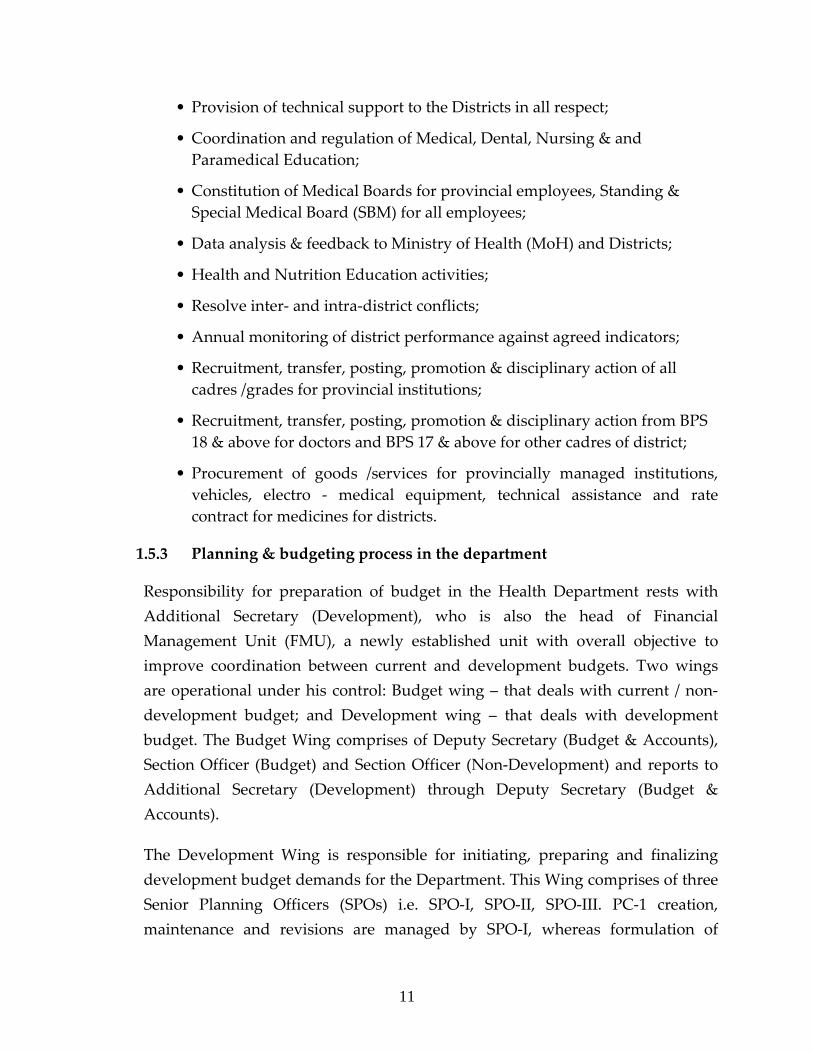
• Provision of technical support to the Districts in all respect;
• Coordination and regulation of Medical, Dental, Nursing & and Paramedical Education;
• Constitution of Medical Boards for provincial employees, Standing & Special Medical Board (SBM) for all employees;
• Data analysis & feedback to Ministry of Health (MoH) and Districts;
• Health and Nutrition Education activities;
• Resolve inter‐ and intra‐district conflicts;
• Annual monitoring of district performance against agreed indicators;
• Recruitment, transfer, posting, promotion & disciplinary action of all cadres /grades for provincial institutions;
• Recruitment, transfer, posting, promotion & disciplinary action from BPS 18 & above for doctors and BPS 17 & above for other cadres of district;
• Procurement of goods /services for provincially managed institutions, vehicles, electro ‐ medical equipment, technical assistance and rate contract for medicines for districts.
1.5.3 Planning & budgeting process in the department
Responsibility for preparation of budget in the Health Department rests with Additional Secretary (Development), who is also the head of Financial Management Unit (FMU), a newly established unit with overall objective to improve coordination between current and development budgets. Two wings are operational under his control: Budget wing – that deals with current / non‐development budget; and Development wing – that deals with development budget. The Budget Wing comprises of Deputy Secretary (Budget & Accounts), Section Officer (Budget) and Section Officer (Non‐Development) and reports to Additional Secretary (Development) through Deputy Secretary (Budget & Accounts).
The Development Wing is responsible for initiating, preparing and finalizing development budget demands for the Department. This Wing comprises of three Senior Planning Officers (SPOs) i.e. SPO‐I, SPO‐II, SPO‐III. PC‐1 creation, maintenance and revisions are managed by SPO‐I, whereas formulation of
11
Annual Development Plan (ADP) / Medium Term Development Framework (MTDF) and communication of approved estimates to spending units are performed by SPO‐II. Development programs funded by the provincial government through Health Department but executed by district governments are taken care by SPO‐III.
Budget submissions are made directly from the spending units (e.g. Hospitals) and through DGHS (for spending units operating under DGHS). Total number of individual budget submissions (for current and development) from spending units is around 386 (for 2009‐10), most of which are consolidated at various levels.
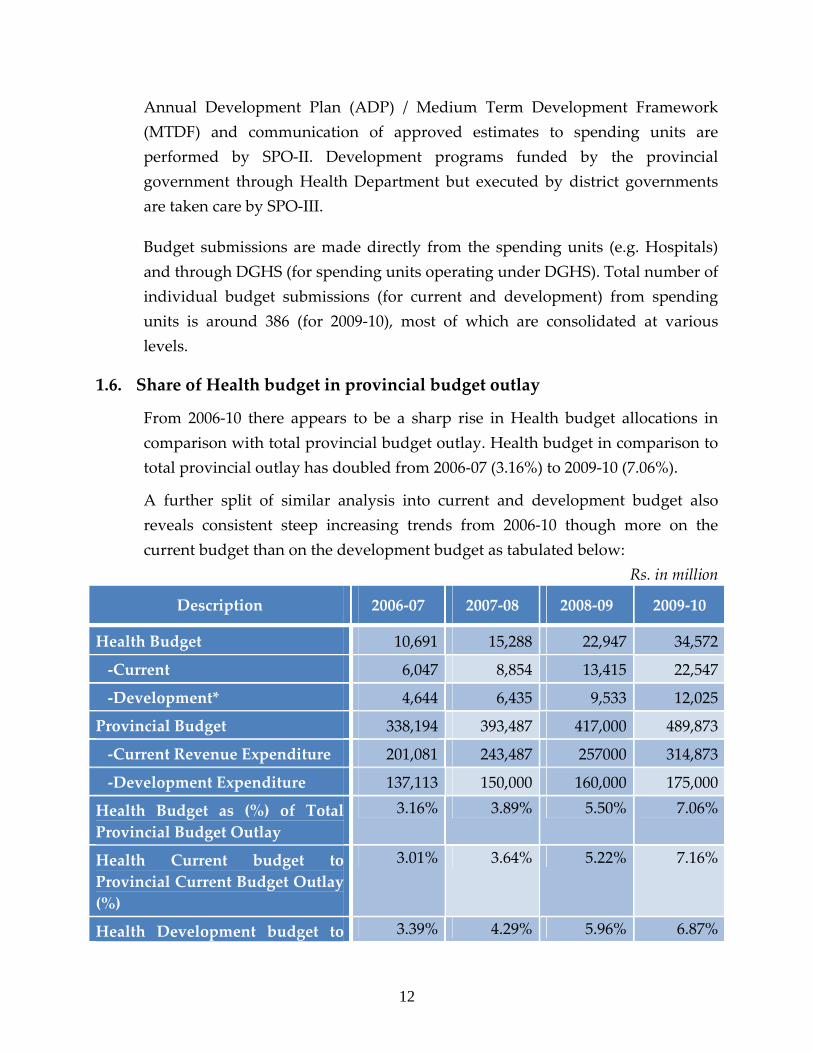
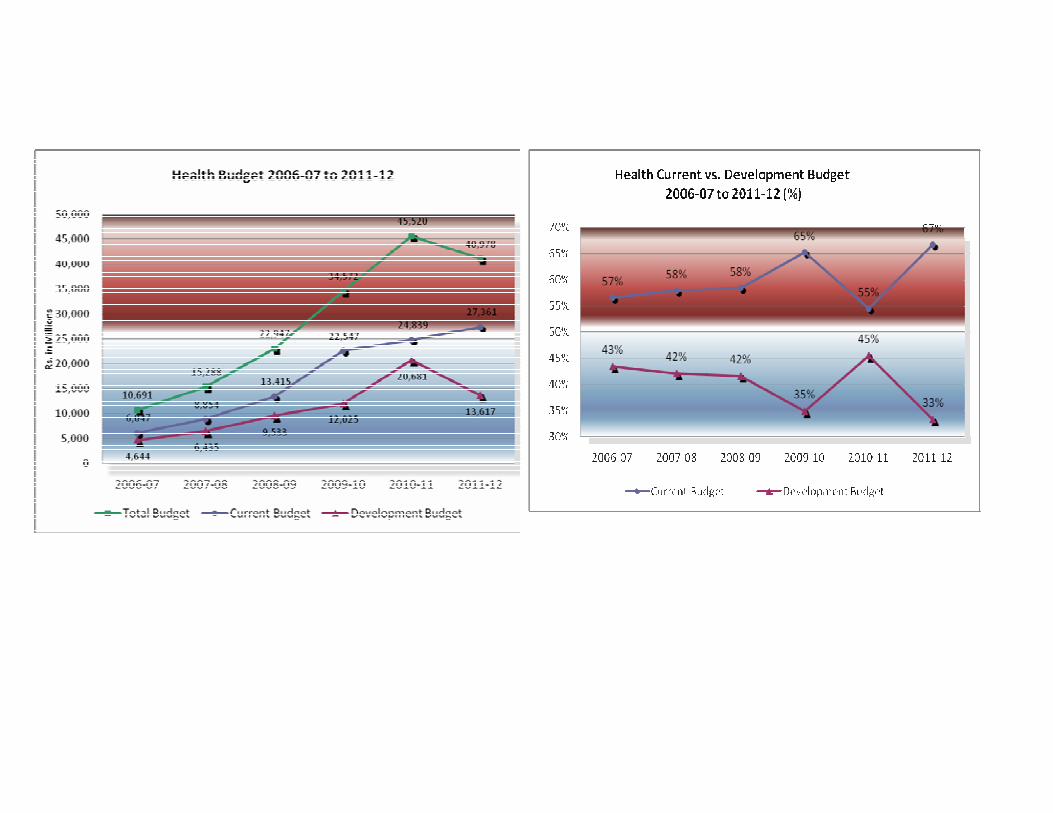
1.6. Share of Health budget in provincial budget outlay
From 2006‐10 there appears to be a sharp rise in Health budget allocations in comparison with total provincial budget outlay. Health budget in comparison to total provincial outlay has doubled from 2006‐07 (3.16%) to 2009‐10 (7.06%).
A further split of similar analysis into current and development budget also reveals consistent steep increasing trends from 2006‐10 though more on the current budget than on the development budget as tabulated below:
Rs. in million
Description 2006‐07 2007‐08 2008‐09 2009‐10
Health Budget 10,691 15,288 22,947 34,572
‐Current 6,047 8,854 13,415 22,547
‐Development* 4,644 6,435 9,533 12,025
Provincial Budget 338,194 393,487 417,000 489,873
‐Current Revenue Expenditure 201,081 243,487 257000 314,873
‐Development Expenditure 137,113 150,000 160,000 175,000
Health Budget as (%) of Total Provincial Budget Outlay
3.16% 3.89% 5.50% 7.06%
Health Current budget to Provincial Current Budget Outlay (%)
3.01% 3.64% 5.22% 7.16%
Health Development budget to 3.39% 4.29% 5.96% 6.87%
12
Description 2006‐07 2007‐08 2008‐09 2009‐10
Provincial Development Budget Outlay (%)
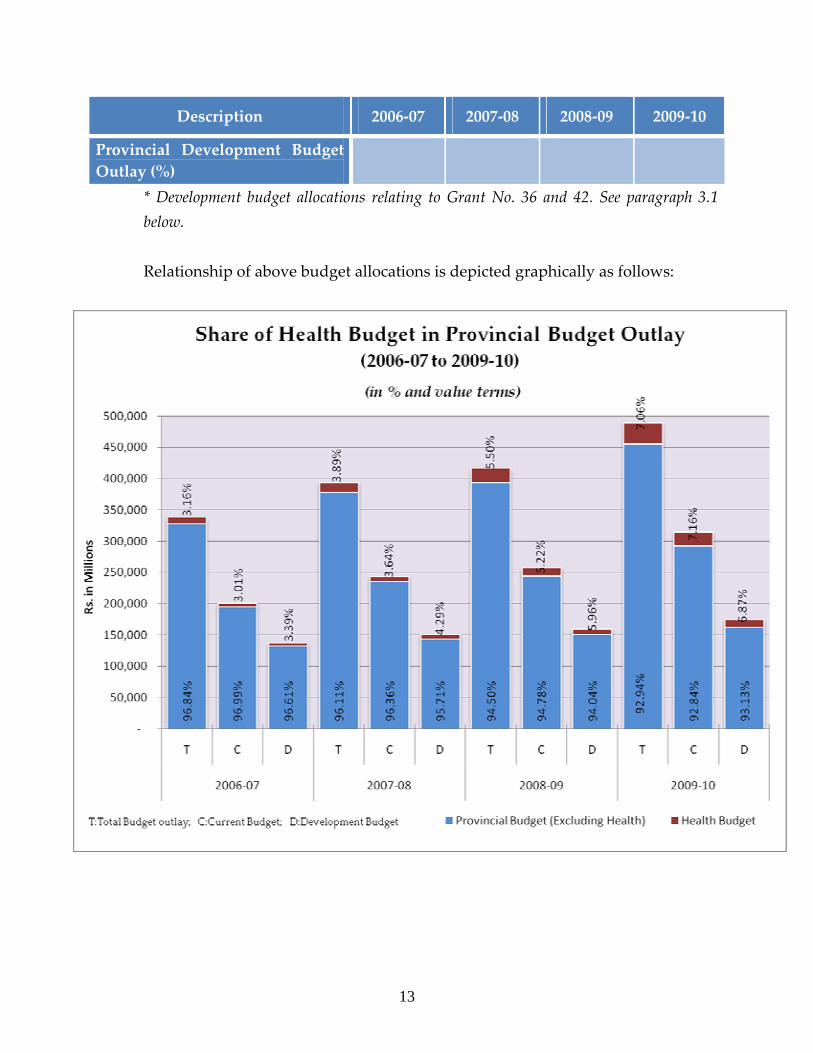
* Development budget allocations relating to Grant No. 36 and 42. See paragraph 3.1 below. Relationship of above budget allocations is depicted graphically as follows:
13
2. Priorities in the medium term (2009‐12)
Following are the key priorities of Health Department over the medium term (2009‐12): Current
− Provision of free treatment for in‐patient care services at tertiary care level; − Improving patient care facilities; − Improving quality of medical education in the Province − Improving governance.
Development
− Implementation of standardized service delivery package; − Focus on preventive health care; − Improving primary, secondary and tertiary health care;
3. Medium term budget estimates (2009‐12)
3.1 Summary of MTBF Estimates (2009‐12)5
Budget allocations of Health Department typically comprises of the following Grants:
Current budget
Grant No. 16 – represents allocations to spending units of tertiary care hospitals, teaching institutions and allied health services.
Development budget
Grant No. 36 – represents scheme‐wise allocations for various development schemes (e.g. relating to Health Sector Reforms Program, hospital services, teaching institutions, etc.).
Besides the above, a significant portion of development budget executed for Health is covered under budget of Communication & Works (C&W) Department’s Grant No. 42 (“Government Buildings”). Both these Grants together make up total development budget for Health according to Annual Development Plan (ADP) /
5 This only covers non-devolved spending units
14
15
Medium Term Development Framework (MTDF) 2009‐12. MTBF estimates for spending units / development schemes given in this Statement (Section‐II) cover Grants of Health Department only (i.e. 16 & 36) and not Grant No. 42, although in Section‐I where applicable summary budget tables do give allocations under Grant No. 42 as a balancing amount to match Health sector totals in ADP/MTDF.
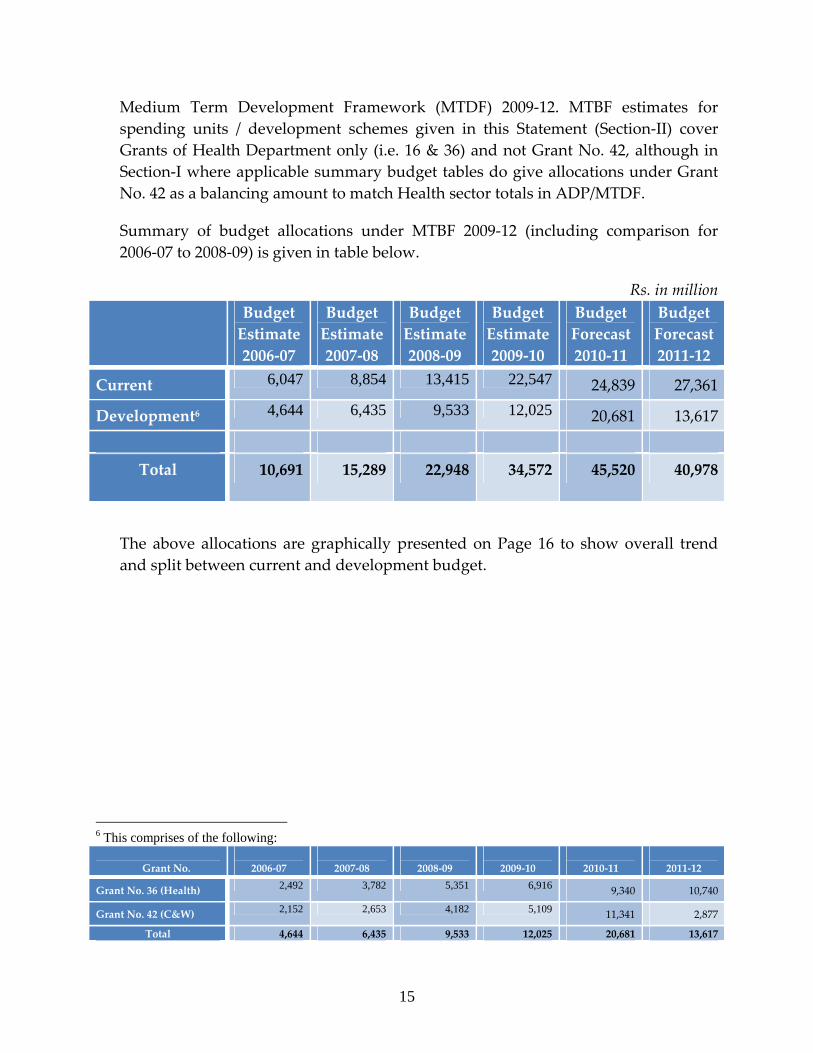
Summary of budget allocations under MTBF 2009‐12 (including comparison for 2006‐07 to 2008‐09) is given in table below.
Rs. in million Budget
Estimate 2006‐07
Budget Estimate2007‐08
Budget Estimate2008‐09
Budget Estimate2009‐10
Budget Forecast 2010‐11
Budget Forecast 2011‐12
Current 6,047 8,854 13,415 22,547 24,839 27,361
Development6 4,644 6,435 9,533 12,025 20,681 13,617
Total 10,691 15,289 22,948 34,572 45,520 40,978
The above allocations are graphically presented on Page 16 to show overall trend and split between current and development budget.
6 This comprises of the following:
Grant No.
2006‐07
2007‐08
2008‐09
2009‐10
2010‐11
2011‐12
Grant No. 36 (Health) 2,492 3,782 5,351 6,916 9,340 10,740
Grant No. 42 (C&W) 2,152 2,653 4,182 5,109 11,341 2,877
Total 4,644 6,435 9,533 12,025 20,681 13,617

17
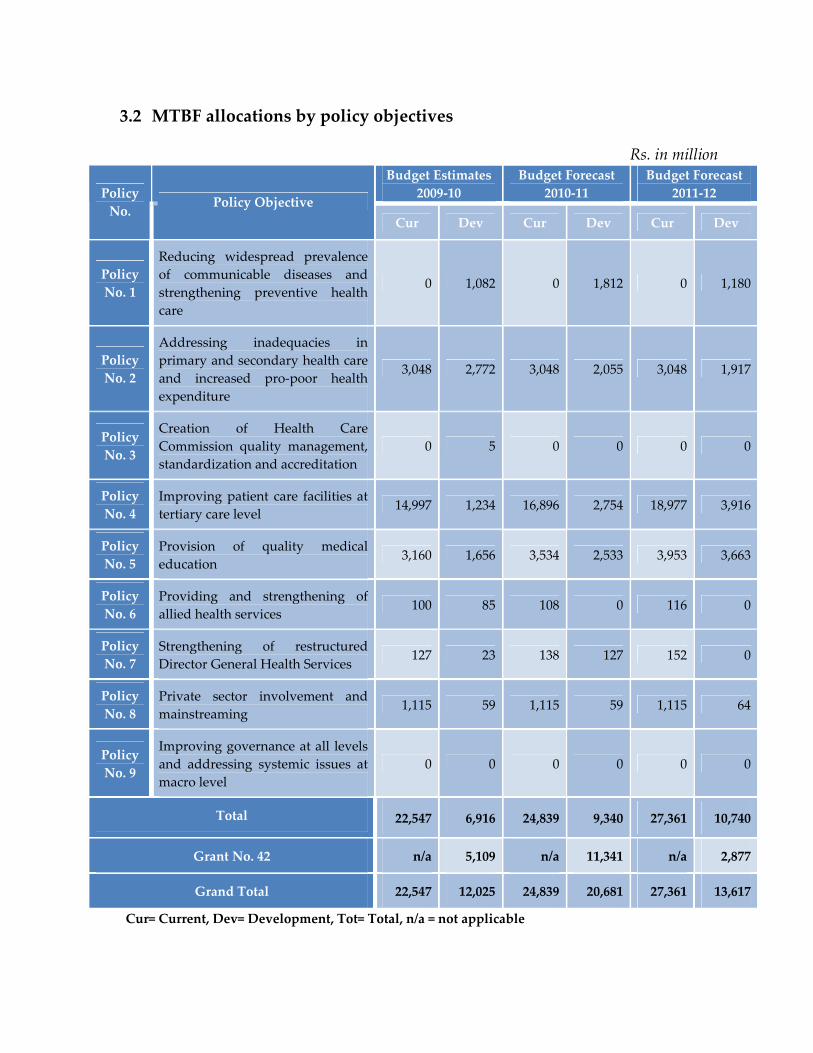
3.2 MTBF allocations by policy objectives
Rs. in million Budget Estimates
2009‐10 Budget Forecast
2010‐11 Budget Forecast
2011‐12 Policy No. Policy Objective
Cur Dev Cur Dev Cur Dev
Policy No. 1
Reducing widespread prevalence of communicable diseases and strengthening preventive health care
0 1,082 0 1,812 0 1,180
Policy No. 2
Addressing inadequacies in primary and secondary health care and increased pro‐poor health expenditure
3,048 2,772 3,048 2,055 3,048 1,917
Policy No. 3
Creation of Health Care Commission quality management, standardization and accreditation
0 5 0 0 0 0
Policy No. 4
Improving patient care facilities at tertiary care level
14,997 1,234 16,896 2,754 18,977 3,916
Policy No. 5
Provision of quality medical education
3,160 1,656 3,534 2,533 3,953 3,663
Policy No. 6
Providing and strengthening of allied health services
100 85 108 0 116 0
Policy No. 7
Strengthening of restructured Director General Health Services 127 23 138 127 152 0
Policy No. 8
Private sector involvement and mainstreaming
1,115 59 1,115 59 1,115 64
Policy No. 9
Improving governance at all levels and addressing systemic issues at macro level
0 0 0 0 0 0
Total 22,547 6,916 24,839 9,340 27,361 10,740
Grant No. 42 n/a 5,109 n/a 11,341 n/a 2,877
Grand Total 22,547 12,025 24,839 20,681 27,361 13,617
Cur= Current, Dev= Development, Tot= Total, n/a = not applicable
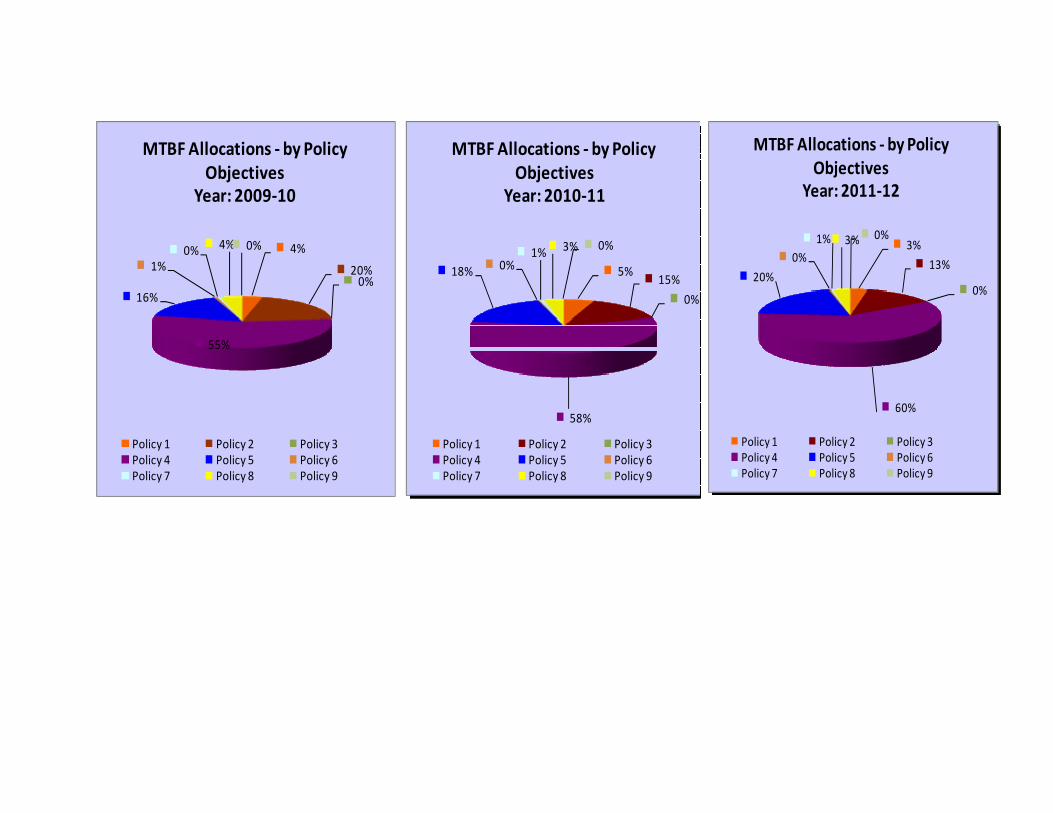
4%
20%0%
55%
16%
1%0% 4% 0%
MTBF Allocations ‐ by Policy Objectives
Year: 2009‐10
Policy 1 Policy 2 Policy 3Policy 4 Policy 5 Policy 6Policy 7 Policy 8 Policy 9
5%15%
0%
58%
18% 0%1% 3% 0%
MTBF Allocations ‐ by Policy Objectives
Year: 2010‐11
Policy 1 Policy 2 Policy 3Policy 4 Policy 5 Policy 6Policy 7 Policy 8 Policy 9
3%
13%
0%
60%
20%
0%1% 3% 0%
MTBF Allocations ‐ by Policy Objectives
Year: 2011‐12
Policy 1 Policy 2 Policy 3Policy 4 Policy 5 Policy 6Policy 7 Policy 8 Policy 9
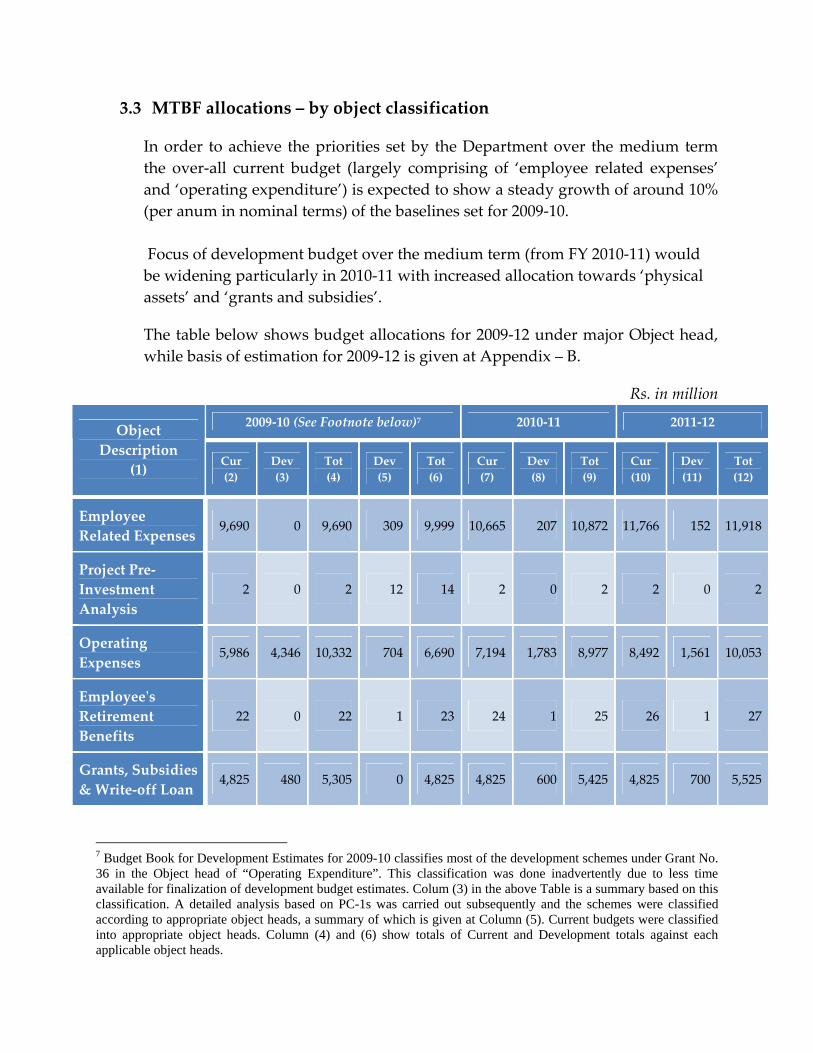
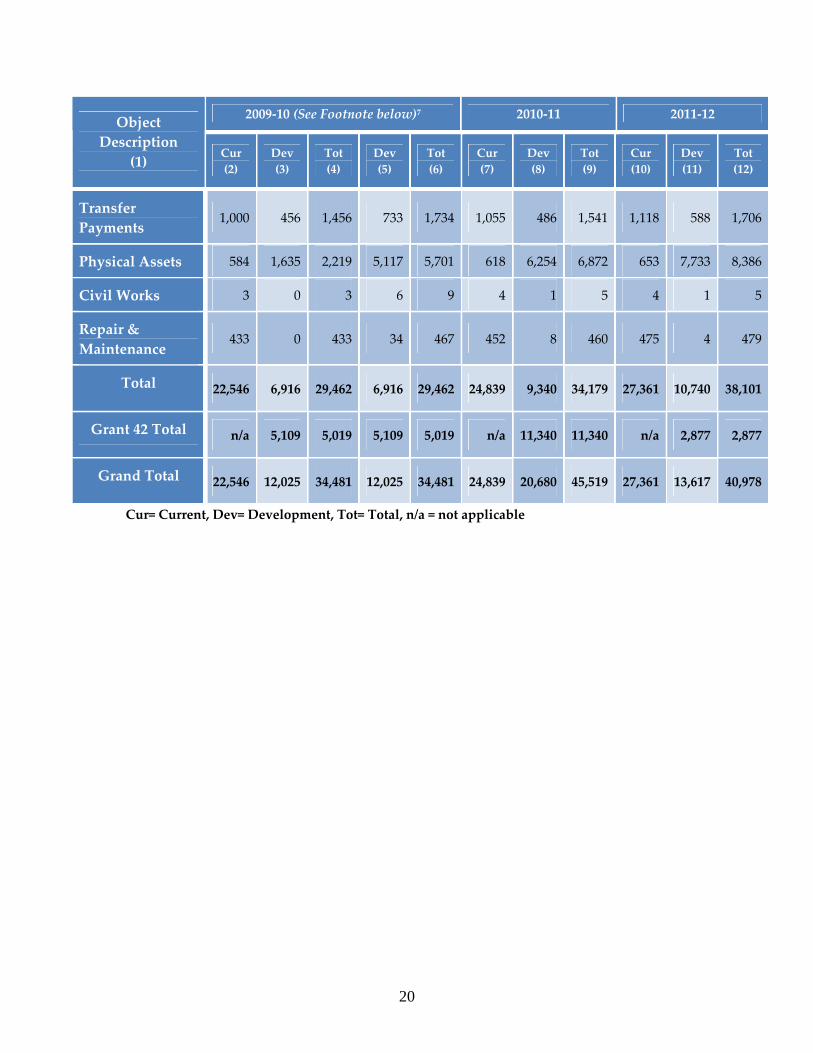
3.3 MTBF allocations – by object classification
In order to achieve the priorities set by the Department over the medium term the over‐all current budget (largely comprising of ‘employee related expenses’ and ‘operating expenditure’) is expected to show a steady growth of around 10% (per anum in nominal terms) of the baselines set for 2009‐10. Focus of development budget over the medium term (from FY 2010‐11) would be widening particularly in 2010‐11 with increased allocation towards ‘physical assets’ and ‘grants and subsidies’.
The table below shows budget allocations for 2009‐12 under major Object head, while basis of estimation for 2009‐12 is given at Appendix – B.
Rs. in million
2009‐10 (See Footnote below)7 2010‐11 2011‐12 Object Description
(1) Cur (2)
Dev (3)
Tot (4)
Dev (5)
Tot (6)
Cur (7)
Dev (8)
Tot (9)
Cur (10)
Dev (11)
Tot (12)
Employee Related Expenses
9,690 0 9,690 309 9,999 10,665 207 10,872 11,766 152 11,918
Project Pre‐Investment Analysis
2 0 2 12 14 2 0 2 2 0 2
Operating Expenses
5,986 4,346 10,332 704 6,690 7,194 1,783 8,977 8,492 1,561 10,053
Employeeʹs Retirement Benefits
22 0 22 1 23 24 1 25 26 1 27
Grants, Subsidies & Write‐off Loan
4,825 480 5,305 0 4,825 4,825 600 5,425 4,825 700 5,525
7 Budget Book for Development Estimates for 2009-10 classifies most of the development schemes under Grant No. 36 in the Object head of “Operating Expenditure”. This classification was done inadvertently due to less time available for finalization of development budget estimates. Colum (3) in the above Table is a summary based on this classification. A detailed analysis based on PC-1s was carried out subsequently and the schemes were classified according to appropriate object heads, a summary of which is given at Column (5). Current budgets were classified into appropriate object heads. Column (4) and (6) show totals of Current and Development totals against each applicable object heads.
20
2009‐10 (See Footnote below)7 2010‐11 2011‐12 Object Description
(1) Cur (2)
Dev (3)
Tot (4)
Dev (5)
Tot (6)
Cur (7)
Dev (8)
Tot (9)
Cur (10)
Dev (11)
Tot (12)
Transfer Payments
1,000 456 1,456 733 1,734 1,055 486 1,541 1,118 588 1,706
Physical Assets 584 1,635 2,219 5,117 5,701 618 6,254 6,872 653 7,733 8,386
Civil Works 3 0 3 6 9 4 1 5 4 1 5
Repair & Maintenance
433 0 433 34 467 452 8 460 475 4 479
Total 22,546 6,916 29,462 6,916 29,462 24,839 9,340 34,179 27,361 10,740 38,101
Grant 42 Total n/a 5,109 5,019 5,109 5,019 n/a 11,340 11,340 n/a 2,877 2,877
Grand Total 22,546 12,025 34,481 12,025 34,481 24,839 20,680 45,519 27,361 13,617 40,978
Cur= Current, Dev= Development, Tot= Total, n/a = not applicable
MTBF Allocations ‐ by ObjectYear: 2010‐11
15%
37%
0% 0% 18%
0%3%
2%
25%
MTBF Allocations ‐ by ObjectYear: 2011‐12
14%
44%
0% 0%14%
0%
2%
1%
25%
Employee Related Expenditure Project Pre‐Investment AnalyOperating Expenditure Employee Retirement BenefGrants, Subsidies and Write‐off loans TransfersPhysical Assets Civil WorksRepair & Maintenance
Employee Related Expenditure Project Pre‐Investment AnalysisOperating Expenditure Employee Retirement BenefitsGrants, Subsidies and Write‐off loans TransfersPhysical Assets Civil WorksRepair & Maintenance
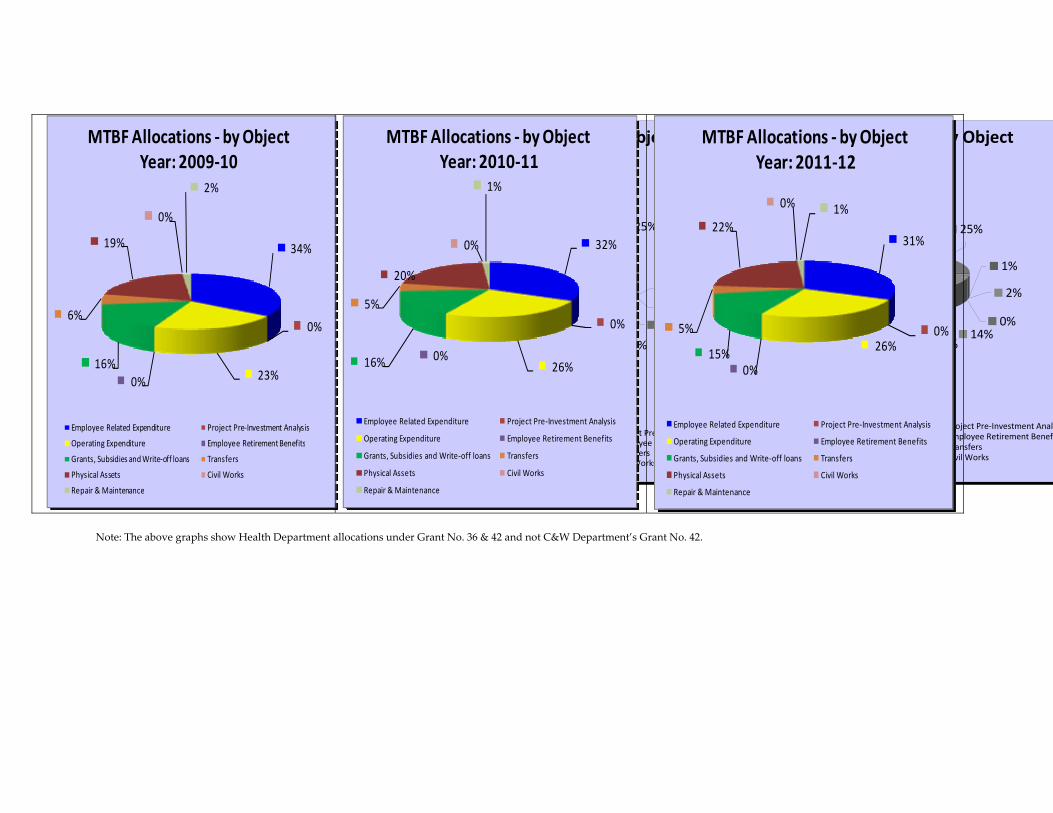
34%
0%
23%0%16%
6%
19%
0%
2%
MTBF Allocations ‐ by ObjectYear: 2009‐10
Employee Related Expenditure Project Pre‐Investment Analysis
Operating Expenditure Employee Retirement Benefits
Grants, Subsidies and Write‐off loans Transfers
Physical Assets Civil Works
Repair & Maintenance
32%
0%
26%0%16%
5%
20%
0%
1%
MTBF Allocations ‐ by ObjectYear: 2010‐11
Employee Related Expenditure Project Pre‐Investment Analysis
Operating Expenditure Employee Retirement Benefits
Grants, Subsidies and Write‐off loans Transfers
Physical Assets Civil Works
Repair & Maintenance
31%
0%26%
0%15%
5%
22%
0% 1%
MTBF Allocations ‐ by ObjectYear: 2011‐12
Employee Related Expenditure Project Pre‐Investment Analysis
Operating Expenditure Employee Retirement Benefits
Grants, Subsidies and Write‐off loans Transfers
Physical Assets Civil Works
Repair & Maintenance
Note: The above graphs show Health Department allocations under Grant No. 36 & 42 and not C&W Department’s Grant No. 42.
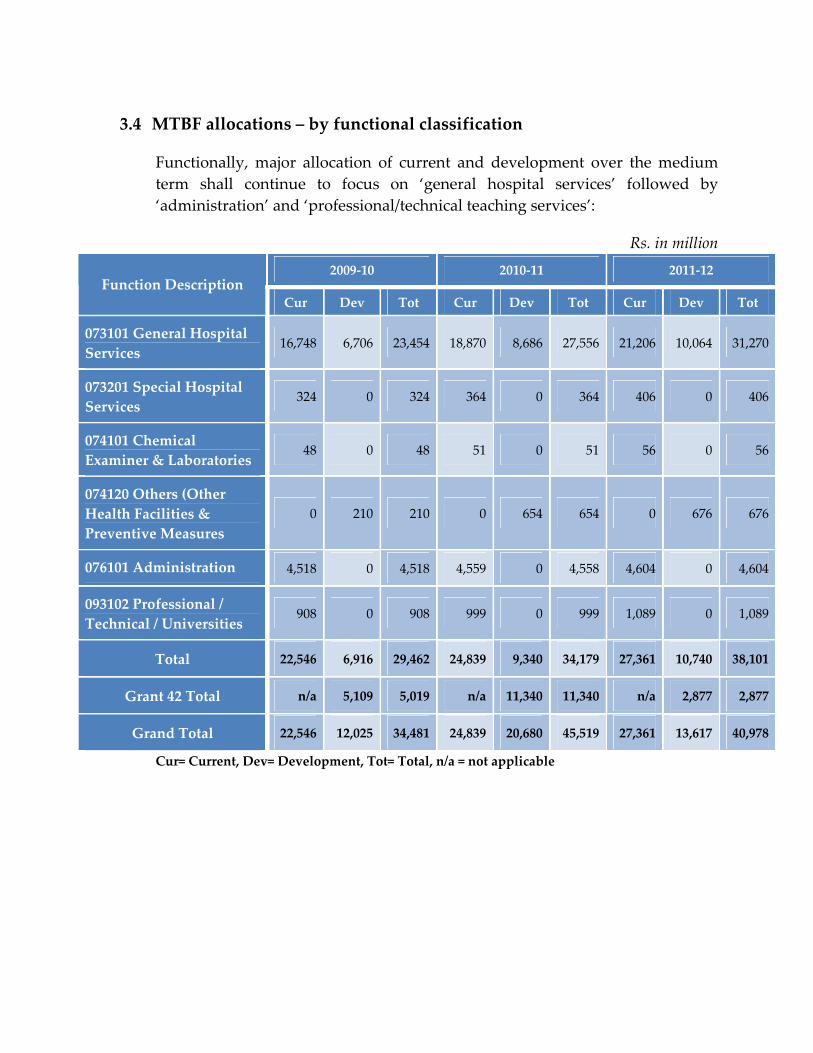
3.4 MTBF allocations – by functional classification
Functionally, major allocation of current and development over the medium term shall continue to focus on ‘general hospital services’ followed by ‘administration’ and ‘professional/technical teaching services’:
Rs. in million 2009‐10 2010‐11 2011‐12
Function Description Cur Dev Tot Cur Dev Tot Cur Dev Tot
073101 General Hospital Services
16,748 6,706 23,454 18,870 8,686 27,556 21,206 10,064 31,270
073201 Special Hospital Services
324 0 324 364 0 364 406 0 406
074101 Chemical Examiner & Laboratories
48 0 48 51 0 51 56 0 56
074120 Others (Other Health Facilities & Preventive Measures
0 210 210 0 654 654 0 676 676
076101 Administration 4,518 0 4,518 4,559 0 4,558 4,604 0 4,604
093102 Professional / Technical / Universities
908 0 908 999 0 999 1,089 0 1,089
Total 22,546 6,916 29,462 24,839 9,340 34,179 27,361 10,740 38,101
Grant 42 Total n/a 5,109 5,019 n/a 11,340 11,340 n/a 2,877 2,877
Grand Total 22,546 12,025 34,481 24,839 20,680 45,519 27,361 13,617 40,978
Cur= Current, Dev= Development, Tot= Total, n/a = not applicable
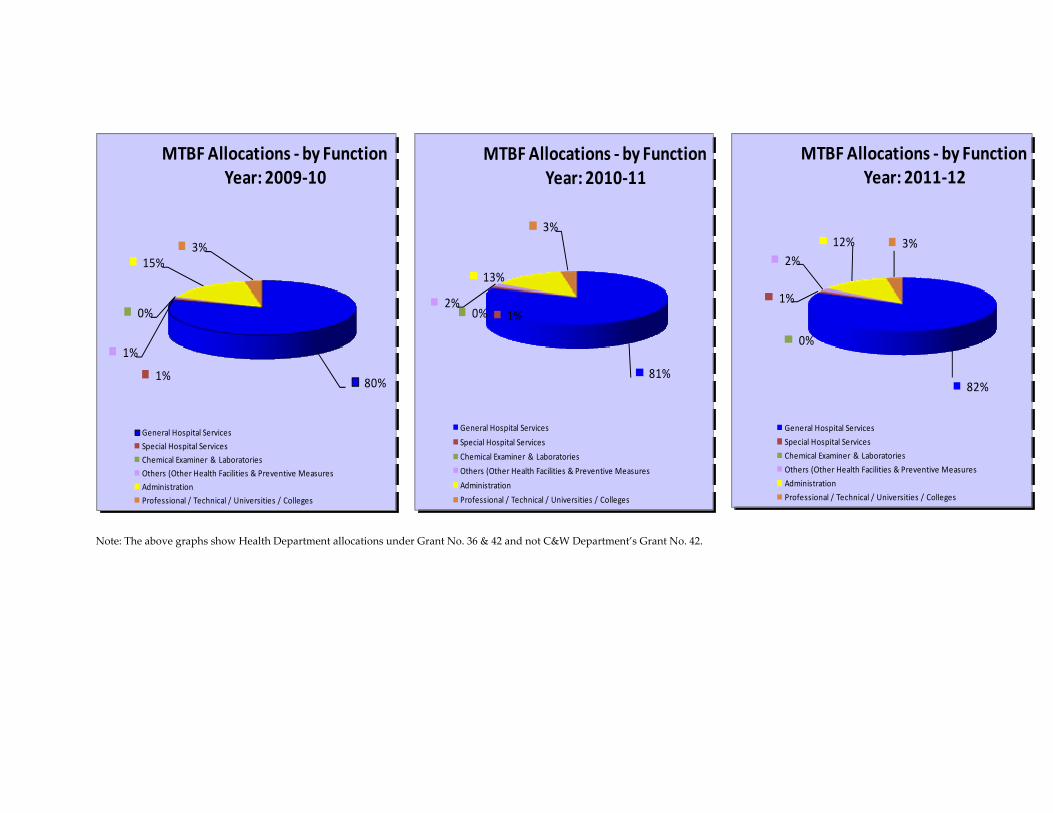
80%1%
0%
1%
15%3%
MTBF Allocations ‐ by FunctionYear: 2009‐10
General Hospital Services
Special Hospital Services
Chemical Examiner & Laboratories
Others (Other Health Facilities & Preventive Measures
Administration
Professional / Technical / Universities / Colleges
81%
1%0%2%
13%
3%
MTBF Allocations ‐ by FunctionYear: 2010‐11
General Hospital Services
Special Hospital Services
Chemical Examiner & Laboratories
Others (Other Health Facilities & Preventive Measures
Administration
Professional / Technical / Universities / Colleges
82%
1%
0%
2%12% 3%
MTBF Allocations ‐ by FunctionYear: 2011‐12
General Hospital Services
Special Hospital Services
Chemical Examiner & Laboratories
Others (Other Health Facilities & Preventive Measures
Administration
Professional / Technical / Universities / Colleges
Note: The above graphs show Health Department allocations under Grant No. 36 & 42 and not C&W Department’s Grant No. 42.
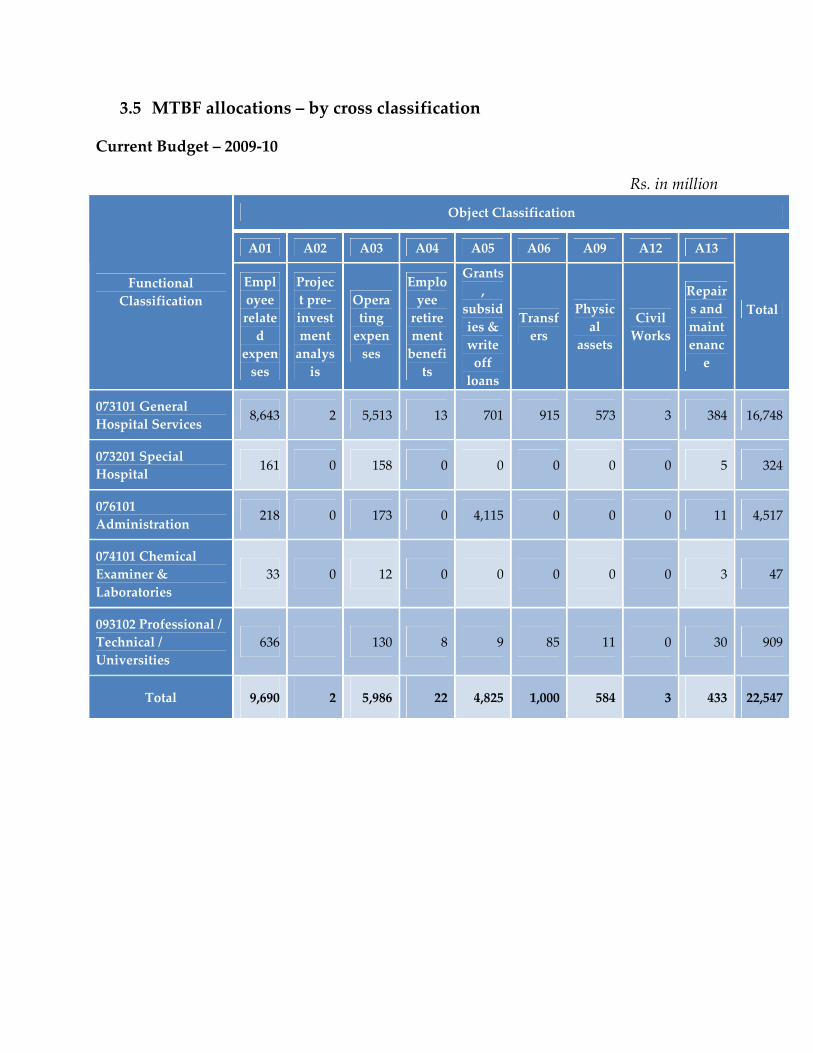
3.5 MTBF allocations – by cross classification
Current Budget – 2009‐10
Rs. in million
Object Classification
A01 A02 A03 A04 A05 A06 A09 A12 A13
Functional Classification
Employee related
expenses
Project pre‐investment analysis
Operating expenses
Employee retirement benefits
Grants,
subsidies & write off loans
Transfers
Physical
assets
Civil Works
Repairs and maintenance
Total
073101 General Hospital Services 8,643 2 5,513 13 701 915 573 3 384 16,748
073201 Special Hospital 161 0 158 0 0 0 0 0 5 324
076101 Administration 218 0 173 0 4,115 0 0 0 11 4,517
074101 Chemical Examiner & Laboratories
33 0 12 0 0 0 0 0 3 47
093102 Professional / Technical / Universities
636 130 8 9 85 11 0 30 909
Total 9,690 2 5,986 22 4,825 1,000 584 3 433 22,547
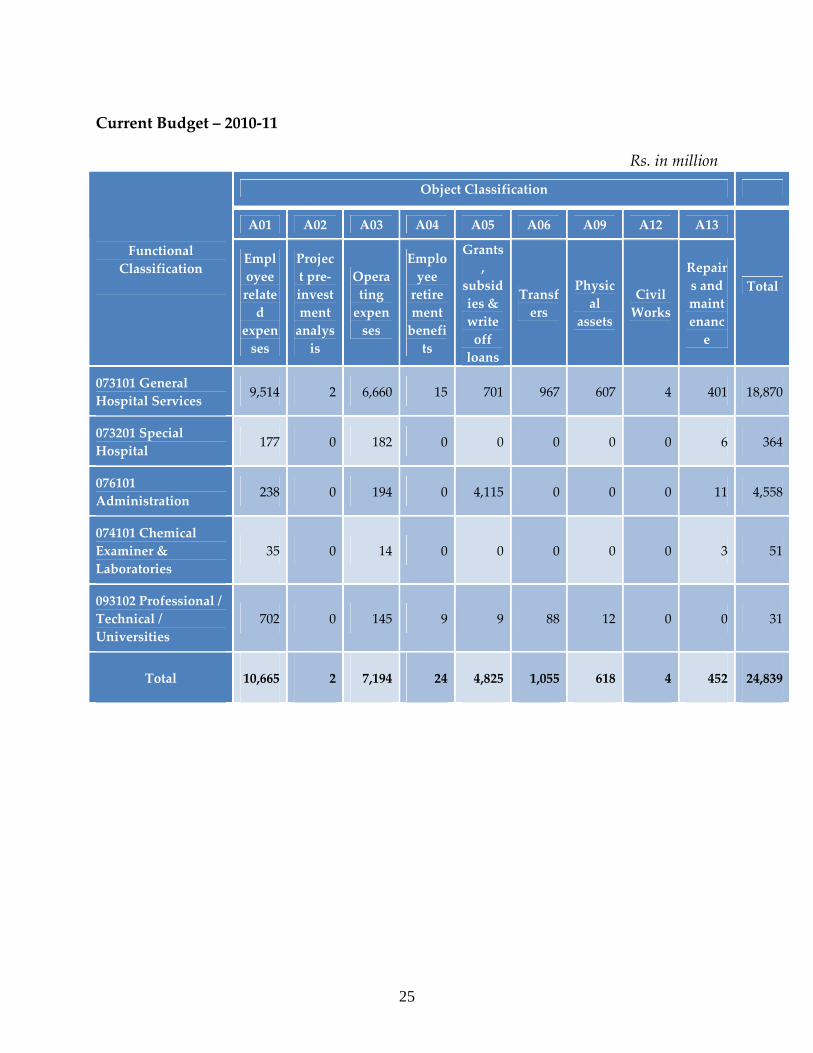
Current Budget – 2010‐11
Rs. in million
Object Classification
A01 A02 A03 A04 A05 A06 A09 A12 A13
Functional Classification
Employee related
expenses
Project pre‐investment analysis
Operating expenses
Employee retirement benefits
Grants,
subsidies & write off loans
Transfers
Physical
assets
Civil Works
Repairs and maintenance
Total
073101 General Hospital Services 9,514 2 6,660 15 701 967 607 4 401 18,870
073201 Special Hospital 177 0 182 0 0 0 0 0 6 364
076101 Administration 238 0 194 0 4,115 0 0 0 11 4,558
074101 Chemical Examiner & Laboratories
35 0 14 0 0 0 0 0 3 51
093102 Professional / Technical / Universities
702 0 145 9 9 88 12 0 0 31
Total 10,665 2 7,194 24 4,825 1,055 618 4 452 24,839
25
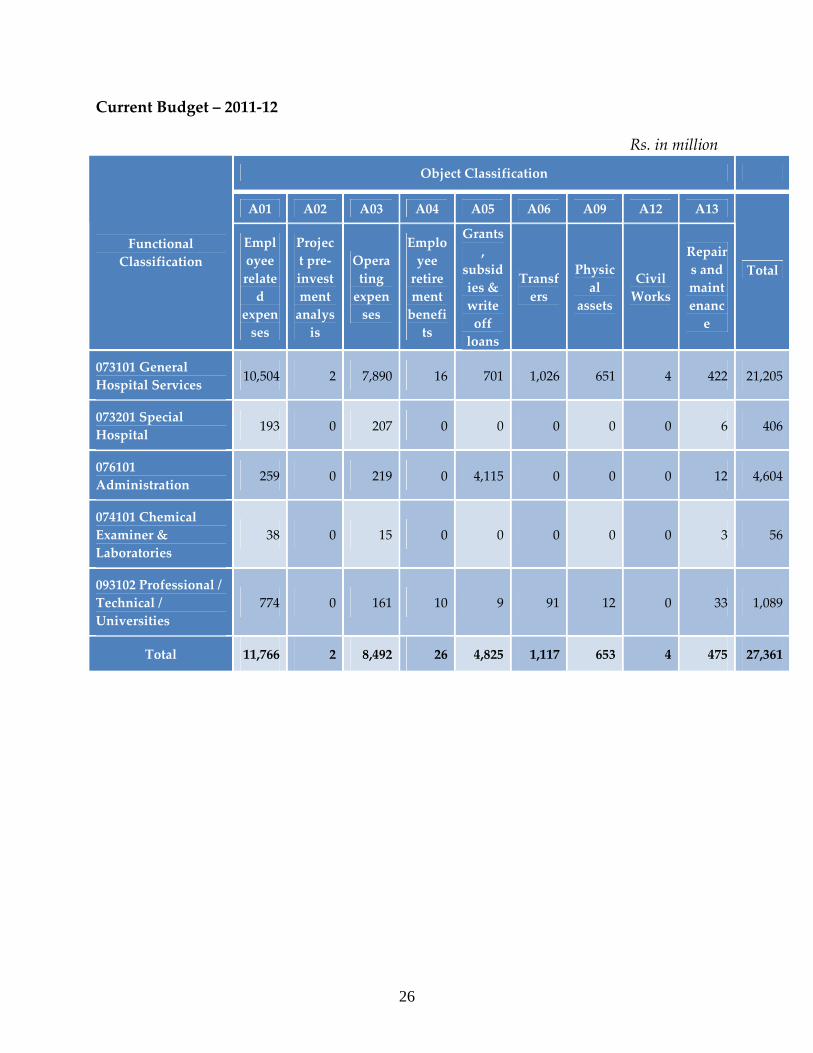
Current Budget – 2011‐12
Rs. in million
Object Classification
A01 A02 A03 A04 A05 A06 A09 A12 A13
Functional Classification
Employee related
expenses
Project pre‐investment analysis
Operating expenses
Employee retirement benefits
Grants,
subsidies & write off loans
Transfers
Physical
assets
Civil Works
Repairs and maintenance
Total
073101 General Hospital Services 10,504 2 7,890 16 701 1,026 651 4 422 21,205
073201 Special Hospital 193 0 207 0 0 0 0 0 6 406
076101 Administration 259 0 219 0 4,115 0 0 0 12 4,604
074101 Chemical Examiner & Laboratories
38 0 15 0 0 0 0 0 3 56
093102 Professional / Technical / Universities
774 0 161 10 9 91 12 0 33 1,089
Total 11,766 2 8,492 26 4,825 1,117 653 4 475 27,361
26
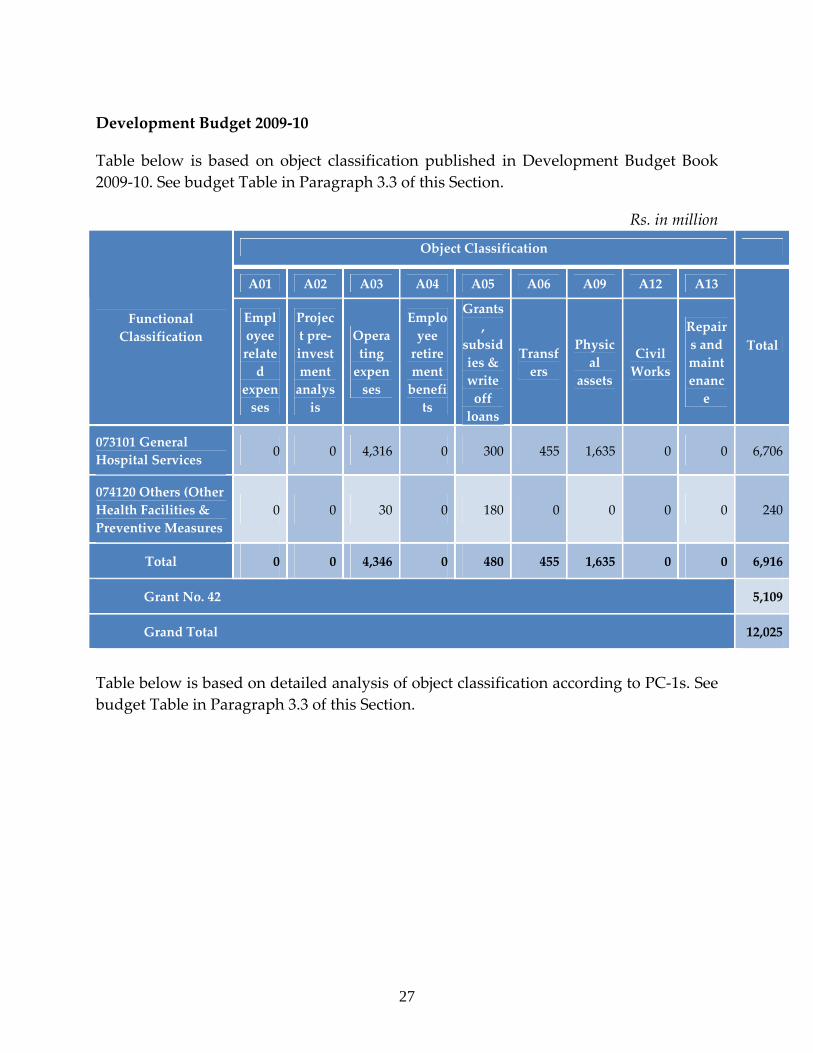
Development Budget 2009‐10
Table below is based on object classification published in Development Budget Book 2009‐10. See budget Table in Paragraph 3.3 of this Section.
Rs. in million
Object Classification
A01 A02 A03 A04 A05 A06 A09 A12 A13
Functional Classification
Employee related
expenses
Project pre‐investment analysis
Operating expenses
Employee retirement benefits
Grants,
subsidies & write off loans
Transfers
Physical
assets
Civil Works
Repairs and maintenance
Total
073101 General Hospital Services 0 0 4,316 0 300 455 1,635 0 0 6,706
074120 Others (Other Health Facilities & Preventive Measures
0 0 30 0 180 0 0 0 0 240
Total 0 0 4,346 0 480 455 1,635 0 0 6,916
Grant No. 42 5,109
Grand Total 12,025
Table below is based on detailed analysis of object classification according to PC‐1s. See budget Table in Paragraph 3.3 of this Section.
27
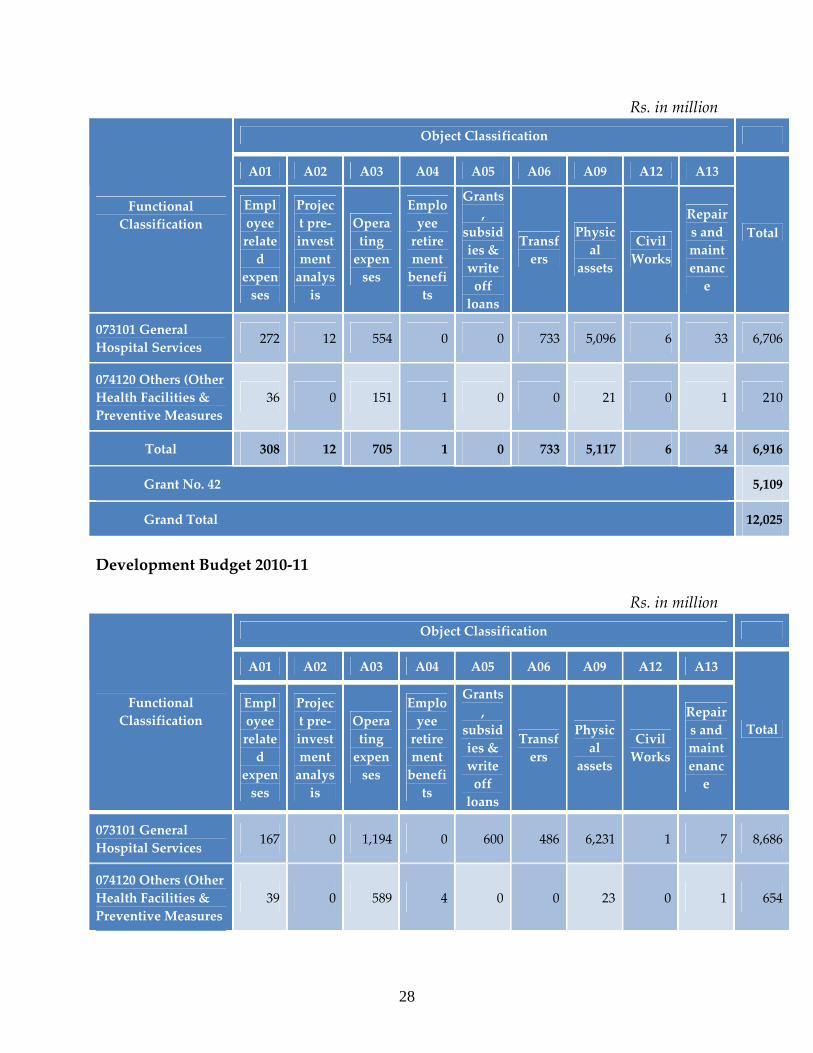
Rs. in million
Object Classification
A01 A02 A03 A04 A05 A06 A09 A12 A13
Functional Classification
Employee related
expenses
Project pre‐investment analysis
Operating expenses
Employee retirement benefits
Grants,
subsidies & write off loans
Transfers
Physical
assets
Civil Works
Repairs and maintenance
Total
073101 General Hospital Services 272 12 554 0 0 733 5,096 6 33 6,706
074120 Others (Other Health Facilities & Preventive Measures
36 0 151 1 0 0 21 0 1 210
Total 308 12 705 1 0 733 5,117 6 34 6,916
Grant No. 42 5,109
Grand Total 12,025
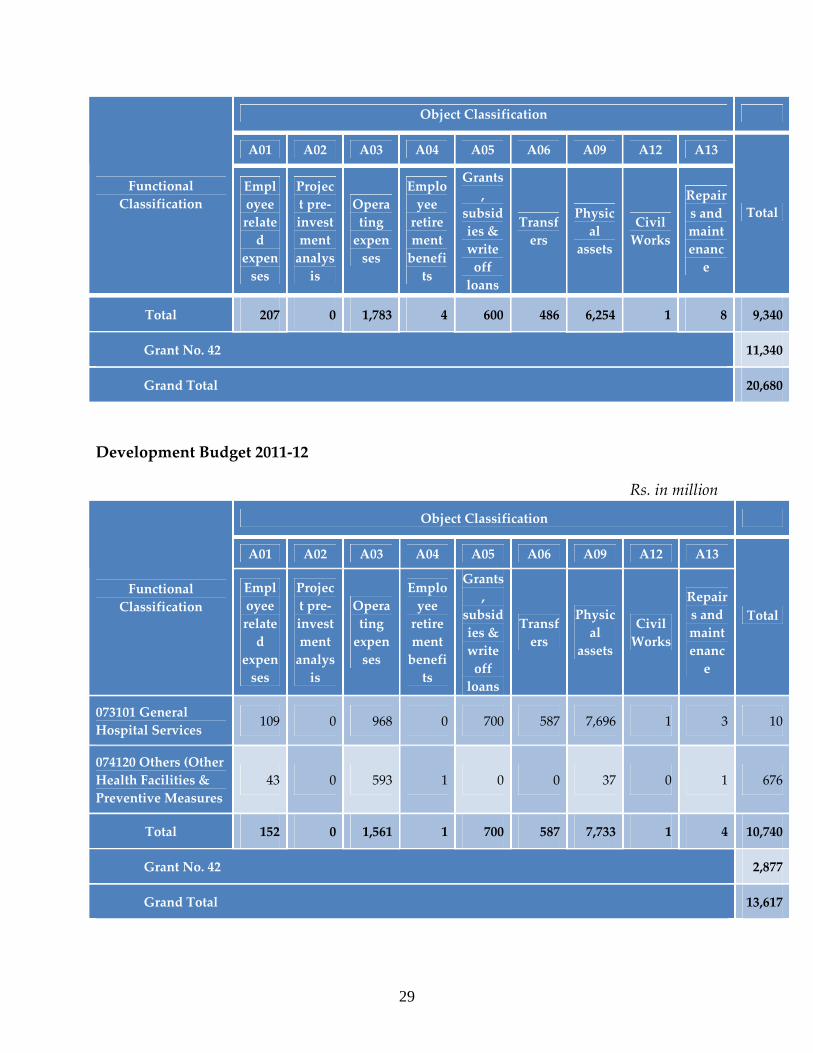
Development Budget 2010‐11
Rs. in million
Object Classification
A01 A02 A03 A04 A05 A06 A09 A12 A13
Functional Classification
Employee related
expenses
Project pre‐investment analysis
Operating expenses
Employee retirement benefits
Grants,
subsidies & write off loans
Transfers
Physical
assets
Civil Works
Repairs and maintenance
Total
073101 General Hospital Services 167 0 1,194 0 600 486 6,231 1 7 8,686
074120 Others (Other Health Facilities & Preventive Measures
39 0 589 4 0 0 23 0 1 654
28
29
Object Classification
A01 A02 A03 A04 A05 A06 A09 A12 A13
Functional Classification
Employee related
expenses
Project pre‐investment analysis
Operating expenses
Employee retirement benefits
Grants,
subsidies & write off loans
Transfers
Physical
assets
Civil Works
Repairs and maintenance
Total
Total 207 0 1,783 4 600 486 6,254 1 8 9,340
Grant No. 42 11,340
Grand Total 20,680
Development Budget 2011‐12
Rs. in million
Object Classification
A01 A02 A03 A04 A05 A06 A09 A12 A13
Functional Classification
Employee related
expenses
Project pre‐investment analysis
Operating expenses
Employee retirement benefits
Grants,
subsidies & write off loans
Transfers
Physical
assets
Civil Works
Repairs and maintenance
Total
073101 General Hospital Services 109 0 968 0 700 587 7,696 1 3 10
074120 Others (Other Health Facilities & Preventive Measures
43 0 593 1 0 0 37 0 1 676
Total 152 0 1,561 1 700 587 7,733 1 4 10,740
Grant No. 42 2,877
Grand Total 13,617
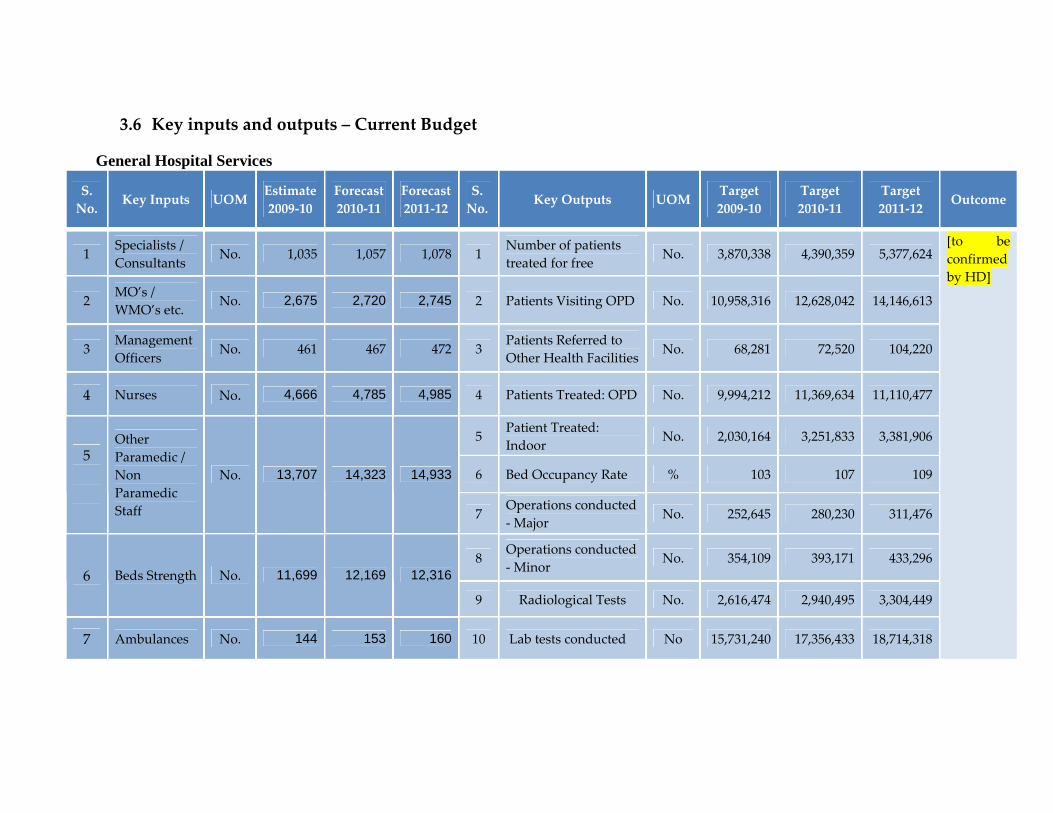
3.6 Key inputs and outputs – Current Budget
General Hospital Services
S. No.
Key Inputs UOM Estimate 2009‐10
Forecast2010‐11
Forecast 2011‐12
S. No.
Key Outputs UOM Target 2009‐10
Target 2010‐11
Target 2011‐12
Outcome
1 Specialists / Consultants
No. 1,035 1,057 1,078 1 Number of patients treated for free
No. 3,870,338 4,390,359 5,377,624
2 MO’s / WMO’s etc.
No. 2,675 2,720 2,745 2 Patients Visiting OPD No. 10,958,316 12,628,042 14,146,613
3 Management Officers No. 461 467 472 3
Patients Referred to Other Health Facilities No. 68,281 72,520 104,220
4 Nurses No. 4,666 4,785 4,985 4 Patients Treated: OPD No. 9,994,212 11,369,634 11,110,477
5 Patient Treated: Indoor
No. 2,030,164 3,251,833 3,381,906
6 Bed Occupancy Rate % 103 107 1095
Other Paramedic / Non Paramedic Staff
No. 13,707 14,323 14,933
7 Operations conducted ‐ Major No. 252,645 280,230 311,476
8 Operations conducted ‐ Minor
No. 354,109 393,171 433,2966 Beds Strength No. 11,699 12,169 12,316
9 Radiological Tests No. 2,616,474 2,940,495 3,304,449
7 Ambulances No. 144 153 160 10 Lab tests conducted No 15,731,240 17,356,433 18,714,318
[to be confirmed by HD]
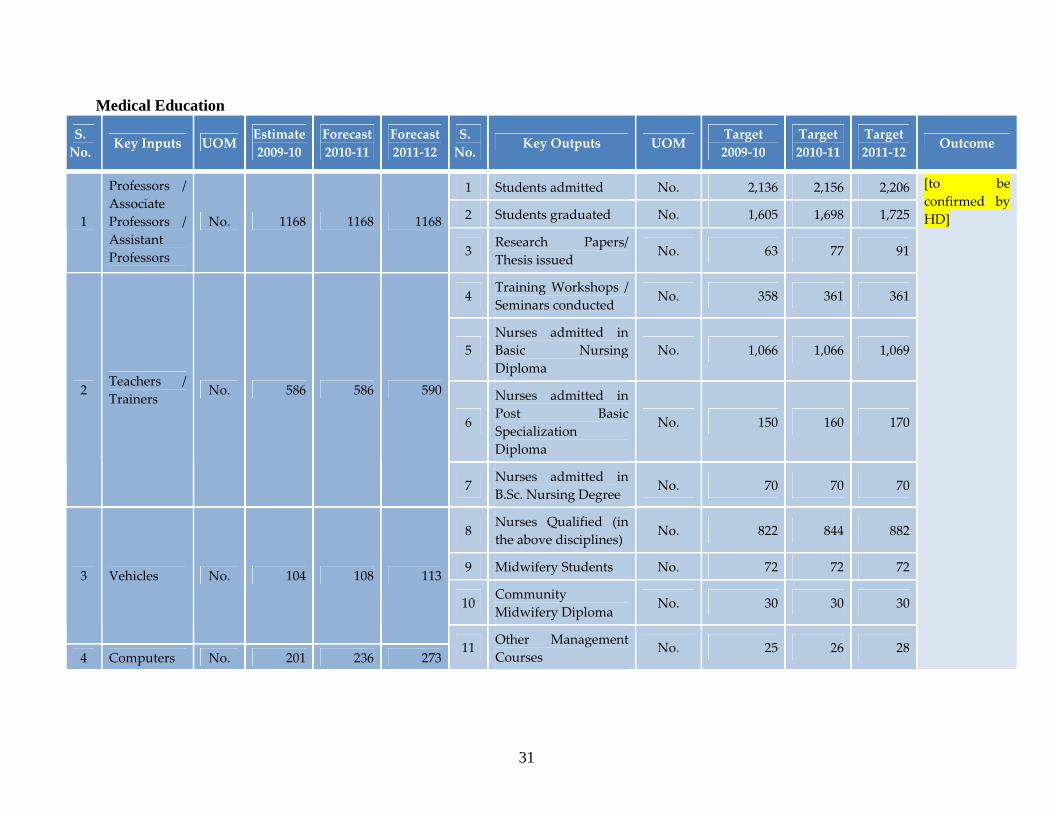
Medical Education
S. No. Key Inputs UOM
Estimate 2009‐10
Forecast2010‐11
Forecast 2011‐12
S. No. Key Outputs UOM
Target 2009‐10
Target 2010‐11
Target 2011‐12 Outcome
1 Students admitted No. 2,136 2,156 2,206
2 Students graduated No. 1,605 1,698 1,7251
Professors / Associate Professors / Assistant Professors
No. 1168 1168 1168
3 Research Papers/ Thesis issued
No. 63 77 91
4 Training Workshops / Seminars conducted
No. 358 361 361
5 Nurses admitted in Basic Nursing Diploma
No. 1,066 1,066 1,069
6
Nurses admitted in Post Basic Specialization Diploma
No. 150 160 170
2 Teachers / Trainers
No. 586 586 590
7 Nurses admitted in B.Sc. Nursing Degree
No. 70 70 70
8 Nurses Qualified (in the above disciplines)
No. 822 844 882
9 Midwifery Students No. 72 72 72
10 Community Midwifery Diploma
No. 30 30 30
3 Vehicles No. 104 108 113
4 Computers No. 201 236 27311 Other Management
Courses No. 25 26 28
[to be confirmed by HD]
31
32
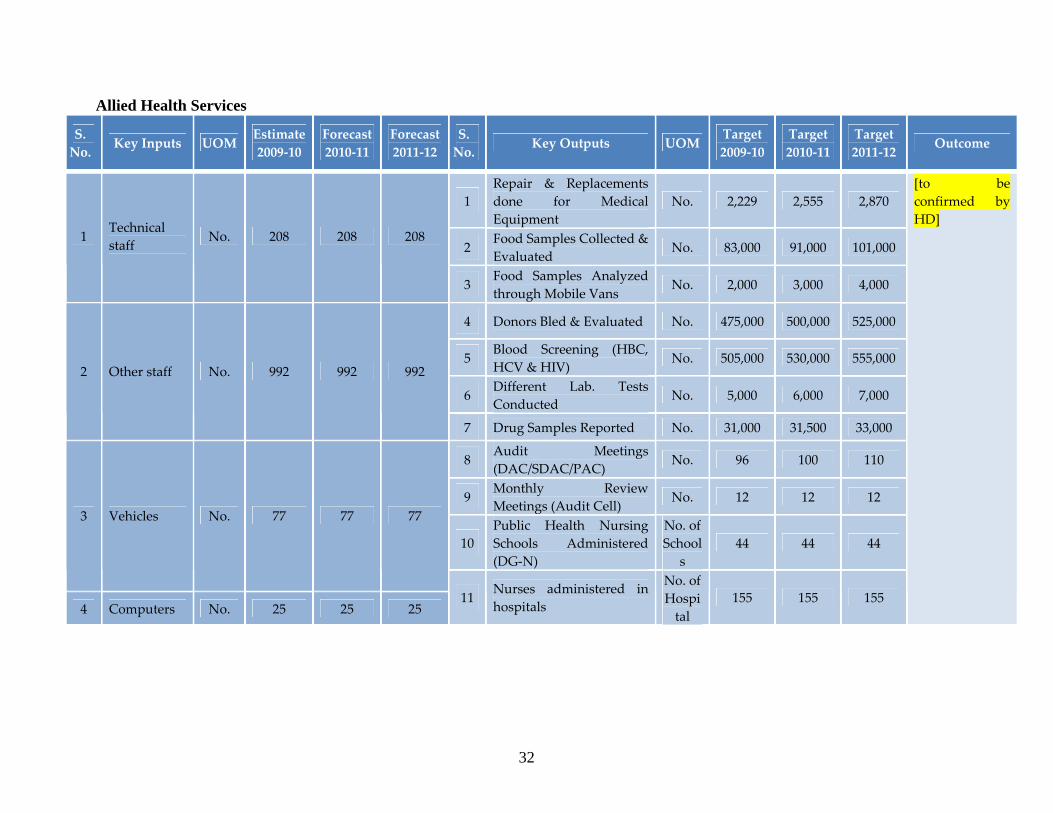
Allied Health Services
S. No. Key Inputs UOM
Estimate 2009‐10
Forecast2010‐11
Forecast 2011‐12
S. No. Key Outputs UOM
Target 2009‐10
Target 2010‐11
Target 2011‐12 Outcome
1 Repair & Replacements done for Medical Equipment
No. 2,229 2,555 2,870
2 Food Samples Collected & Evaluated
No. 83,000 91,000 101,000 1
Technical staff No. 208 208 208
3 Food Samples Analyzed through Mobile Vans
No. 2,000 3,000 4,000
4 Donors Bled & Evaluated No. 475,000 500,000 525,000
5 Blood Screening (HBC, HCV & HIV)
No. 505,000 530,000 555,000
6 Different Lab. Tests Conducted
No. 5,000 6,000 7,000
2 Other staff No. 992 992 992
7 Drug Samples Reported No. 31,000 31,500 33,000
8 Audit Meetings (DAC/SDAC/PAC)
No. 96 100 110
9 Monthly Review Meetings (Audit Cell) No. 12 12 12
10 Public Health Nursing Schools Administered (DG‐N)
No. of School
s 44 44 44
3 Vehicles No. 77 77 77
4 Computers No. 25 25 25 11 Nurses administered in
hospitals
No. of Hospital
155 155 155
[to be confirmed by HD]
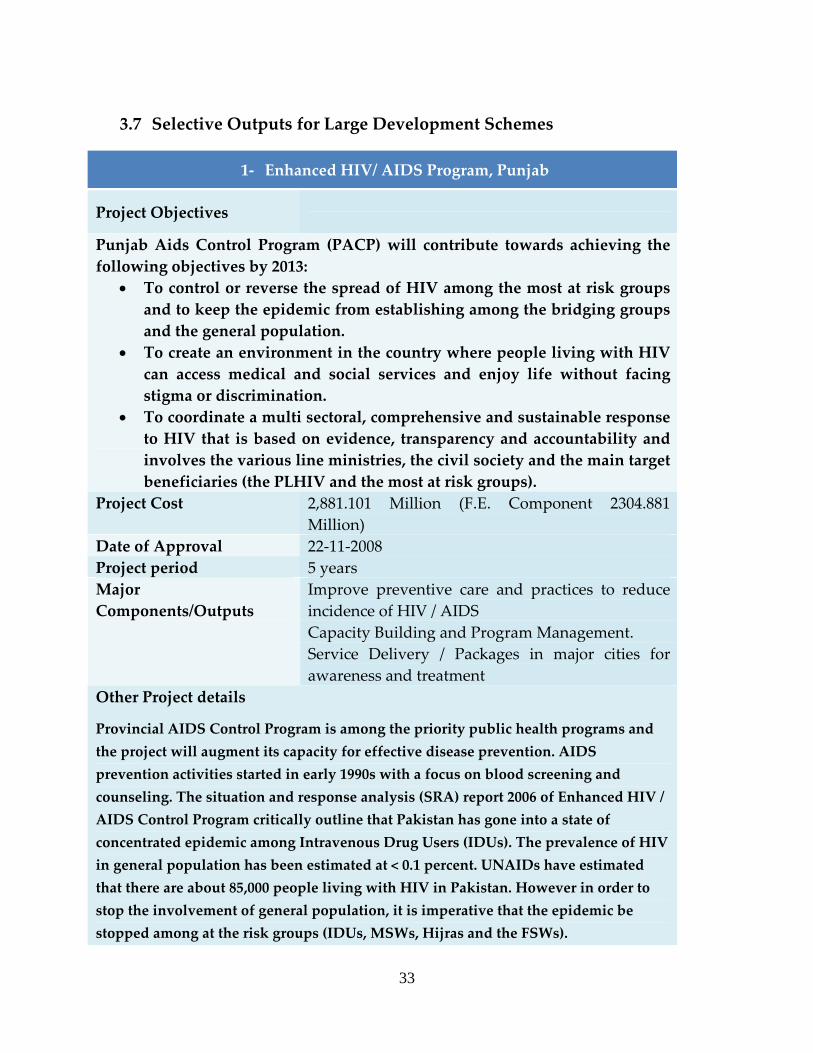
3.7 Selective Outputs for Large Development Schemes
1‐ Enhanced HIV/ AIDS Program, Punjab
Project Objectives
Punjab Aids Control Program (PACP) will contribute towards achieving the following objectives by 2013:
• To control or reverse the spread of HIV among the most at risk groups and to keep the epidemic from establishing among the bridging groups and the general population.
• To create an environment in the country where people living with HIV can access medical and social services and enjoy life without facing stigma or discrimination.
• To coordinate a multi sectoral, comprehensive and sustainable response to HIV that is based on evidence, transparency and accountability and involves the various line ministries, the civil society and the main target beneficiaries (the PLHIV and the most at risk groups).
Project Cost 2,881.101 Million (F.E. Component 2304.881 Million)
Date of Approval 22‐11‐2008 Project period 5 years
Improve preventive care and practices to reduce incidence of HIV / AIDS Capacity Building and Program Management.
Major Components/Outputs
Service Delivery / Packages in major cities for awareness and treatment
Other Project details
Provincial AIDS Control Program is among the priority public health programs and the project will augment its capacity for effective disease prevention. AIDS prevention activities started in early 1990s with a focus on blood screening and counseling. The situation and response analysis (SRA) report 2006 of Enhanced HIV / AIDS Control Program critically outline that Pakistan has gone into a state of concentrated epidemic among Intravenous Drug Users (IDUs). The prevalence of HIV in general population has been estimated at < 0.1 percent. UNAIDs have estimated that there are about 85,000 people living with HIV in Pakistan. However in order to stop the involvement of general population, it is imperative that the epidemic be stopped among at the risk groups (IDUs, MSWs, Hijras and the FSWs).
33
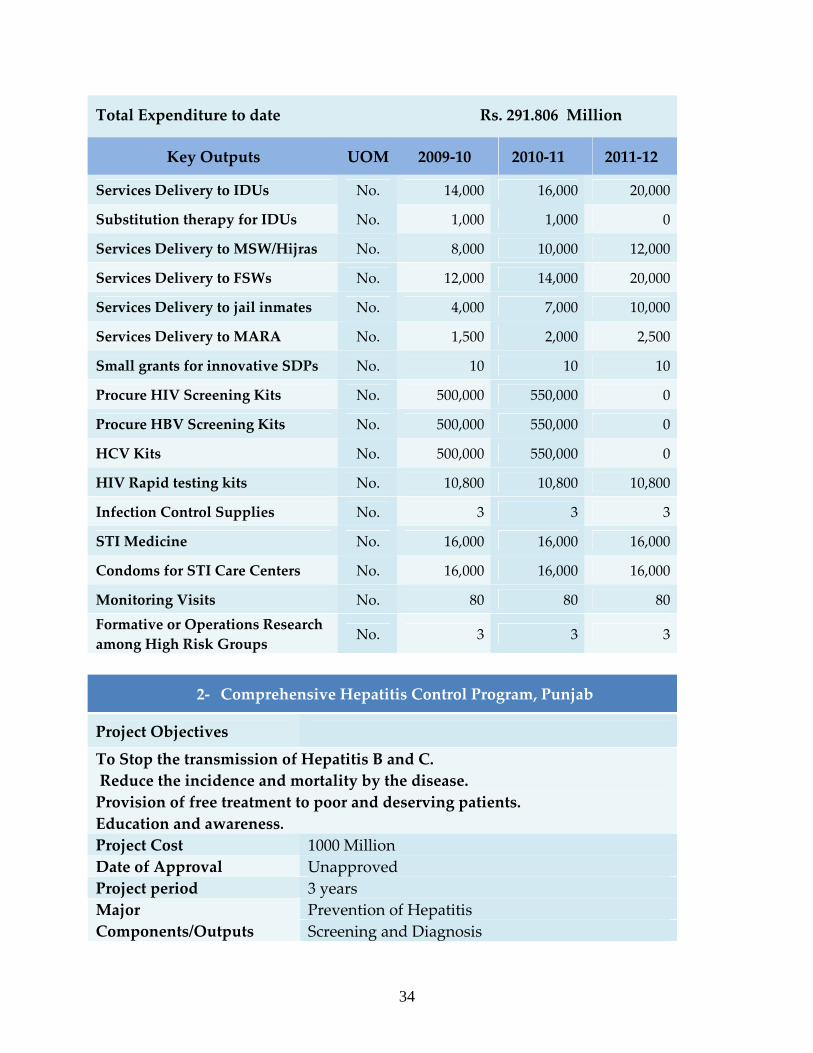
Total Expenditure to date Rs. 291.806 Million
Key Outputs UOM 2009‐10 2010‐11 2011‐12
Services Delivery to IDUs No. 14,000 16,000 20,000
Substitution therapy for IDUs No. 1,000 1,000 0
Services Delivery to MSW/Hijras No. 8,000 10,000 12,000
Services Delivery to FSWs No. 12,000 14,000 20,000
Services Delivery to jail inmates No. 4,000 7,000 10,000
Services Delivery to MARA No. 1,500 2,000 2,500
Small grants for innovative SDPs No. 10 10 10
Procure HIV Screening Kits No. 500,000 550,000 0
Procure HBV Screening Kits No. 500,000 550,000 0
HCV Kits No. 500,000 550,000 0
HIV Rapid testing kits No. 10,800 10,800 10,800
Infection Control Supplies No. 3 3 3
STI Medicine No. 16,000 16,000 16,000
Condoms for STI Care Centers No. 16,000 16,000 16,000
Monitoring Visits No. 80 80 80Formative or Operations Research among High Risk Groups No. 3 3 3
2‐ Comprehensive Hepatitis Control Program, Punjab
Project Objectives
To Stop the transmission of Hepatitis B and C. Reduce the incidence and mortality by the disease. Provision of free treatment to poor and deserving patients. Education and awareness. Project Cost 1000 Million Date of Approval Unapproved Project period 3 years
Prevention of Hepatitis Major Components/Outputs Screening and Diagnosis
34
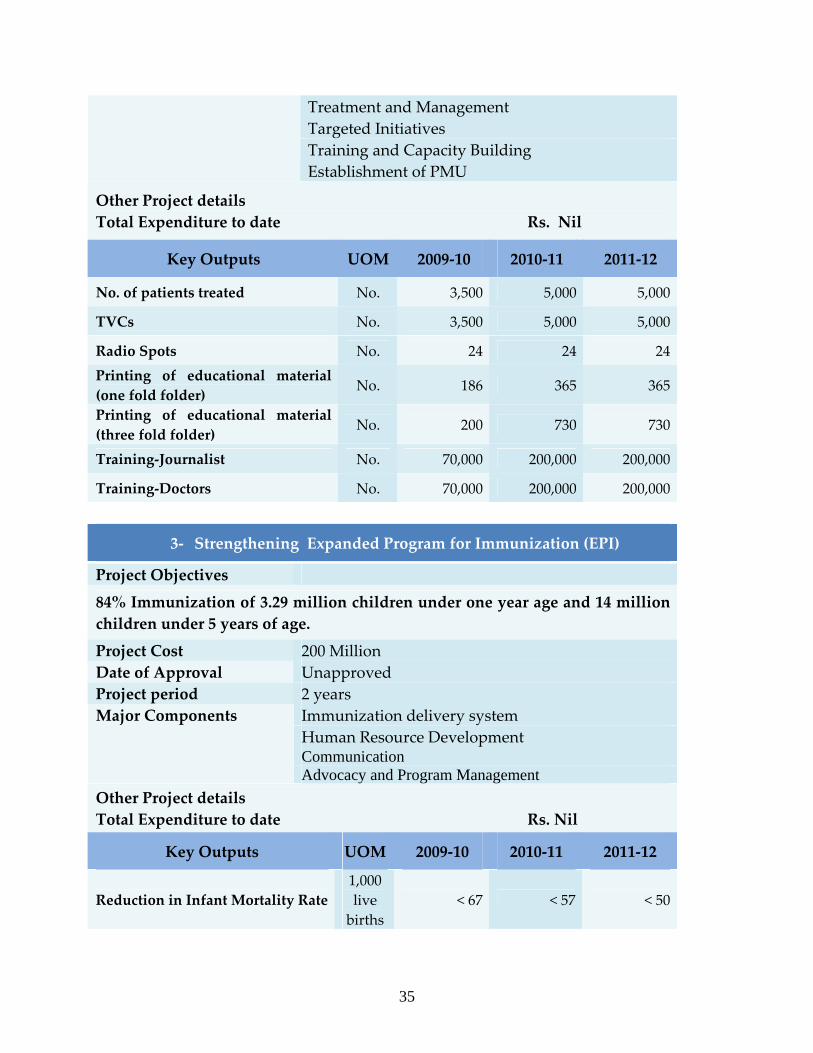
Treatment and Management Targeted Initiatives Training and Capacity Building Establishment of PMU
Other Project details Total Expenditure to date Rs. Nil
Key Outputs UOM 2009‐10 2010‐11 2011‐12
No. of patients treated No. 3,500 5,000 5,000
TVCs No. 3,500 5,000 5,000
Radio Spots No. 24 24 24Printing of educational material (one fold folder) No. 186 365 365
Printing of educational material (three fold folder) No. 200 730 730
Training‐Journalist No. 70,000 200,000 200,000
Training‐Doctors No. 70,000 200,000 200,000
3‐ Strengthening Expanded Program for Immunization (EPI)
Project Objectives
84% Immunization of 3.29 million children under one year age and 14 million children under 5 years of age.
Project Cost 200 Million Date of Approval Unapproved Project period 2 years
Immunization delivery system Human Resource Development Communication
Major Components
Advocacy and Program Management Other Project details Total Expenditure to date Rs. Nil
Key Outputs UOM 2009‐10 2010‐11 2011‐12
Reduction in Infant Mortality Rate 1,000 live births
< 67 < 57 < 50
35
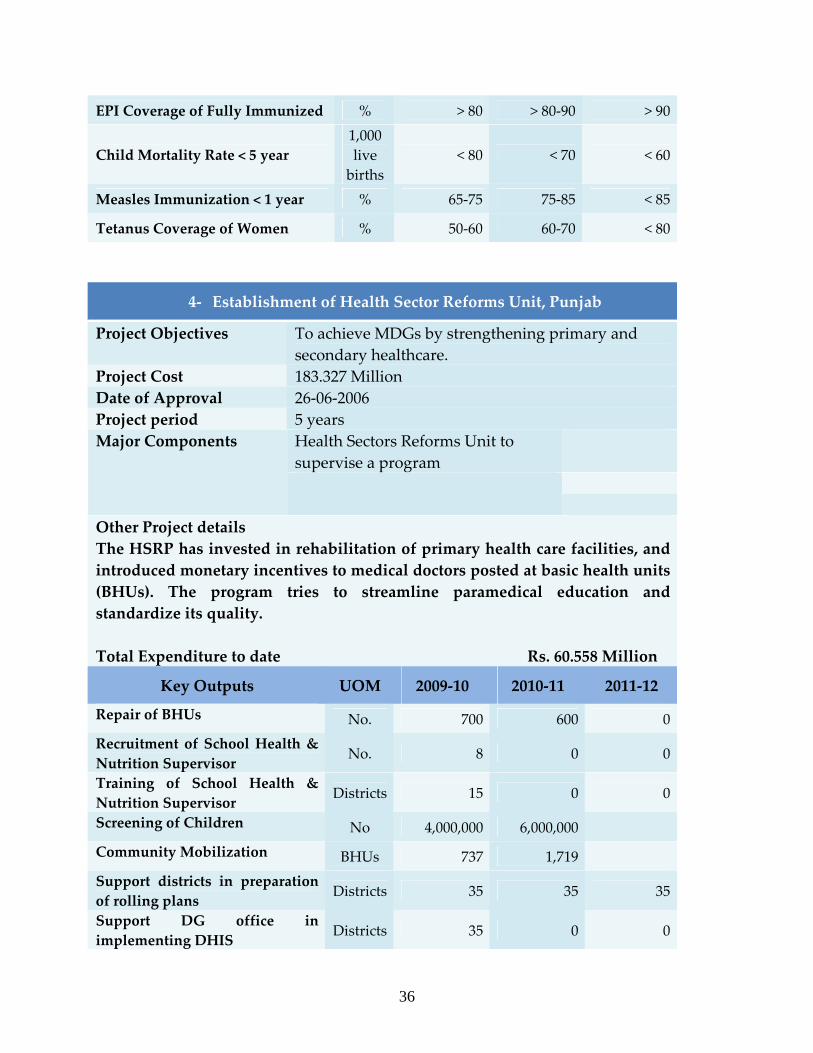
EPI Coverage of Fully Immunized % > 80 > 80‐90 > 90
Child Mortality Rate < 5 year 1,000 live births
< 80 < 70 < 60
Measles Immunization < 1 year % 65‐75 75‐85 < 85
Tetanus Coverage of Women % 50‐60 60‐70 < 80
4‐ Establishment of Health Sector Reforms Unit, Punjab
Project Objectives To achieve MDGs by strengthening primary and secondary healthcare.
Project Cost 183.327 Million Date of Approval 26‐06‐2006 Project period 5 years
Health Sectors Reforms Unit to supervise a program
Major Components
Other Project details The HSRP has invested in rehabilitation of primary health care facilities, and introduced monetary incentives to medical doctors posted at basic health units (BHUs). The program tries to streamline paramedical education and standardize its quality. Total Expenditure to date Rs. 60.558 Million
Key Outputs UOM 2009‐10 2010‐11 2011‐12
Repair of BHUs No. 700 600 0Recruitment of School Health & Nutrition Supervisor No. 8 0 0
Training of School Health & Nutrition Supervisor Districts 15 0 0
Screening of Children No 4,000,000 6,000,000 Community Mobilization BHUs 737 1,719 Support districts in preparation of rolling plans Districts 35 35 35
Support DG office in implementing DHIS Districts 35 0 0
36
37
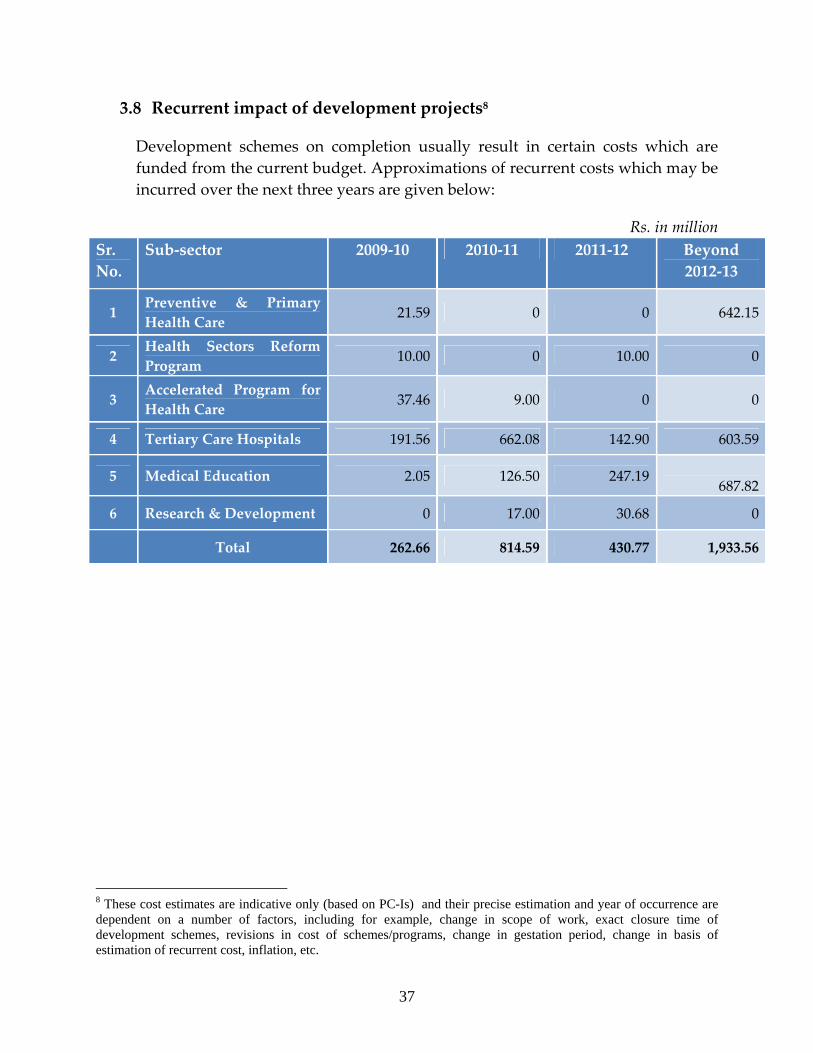
3.8 Recurrent impact of development projects8
Development schemes on completion usually result in certain costs which are funded from the current budget. Approximations of recurrent costs which may be incurred over the next three years are given below:
Rs. in million Sr. No.
Sub‐sector 2009‐10 2010‐11 2011‐12 Beyond 2012‐13
1 Preventive & Primary Health Care 21.59 0 0 642.15
2 Health Sectors Reform Program
10.00 0 10.00 0
3 Accelerated Program for Health Care 37.46 9.00 0 0
4 Tertiary Care Hospitals 191.56 662.08 142.90 603.59
5 Medical Education 2.05 126.50 247.19
687.82
6 Research & Development 0 17.00 30.68 0
Total 262.66 814.59 430.77 1,933.56
8 These cost estimates are indicative only (based on PC-Is) and their precise estimation and year of occurrence are dependent on a number of factors, including for example, change in scope of work, exact closure time of development schemes, revisions in cost of schemes/programs, change in gestation period, change in basis of estimation of recurrent cost, inflation, etc.
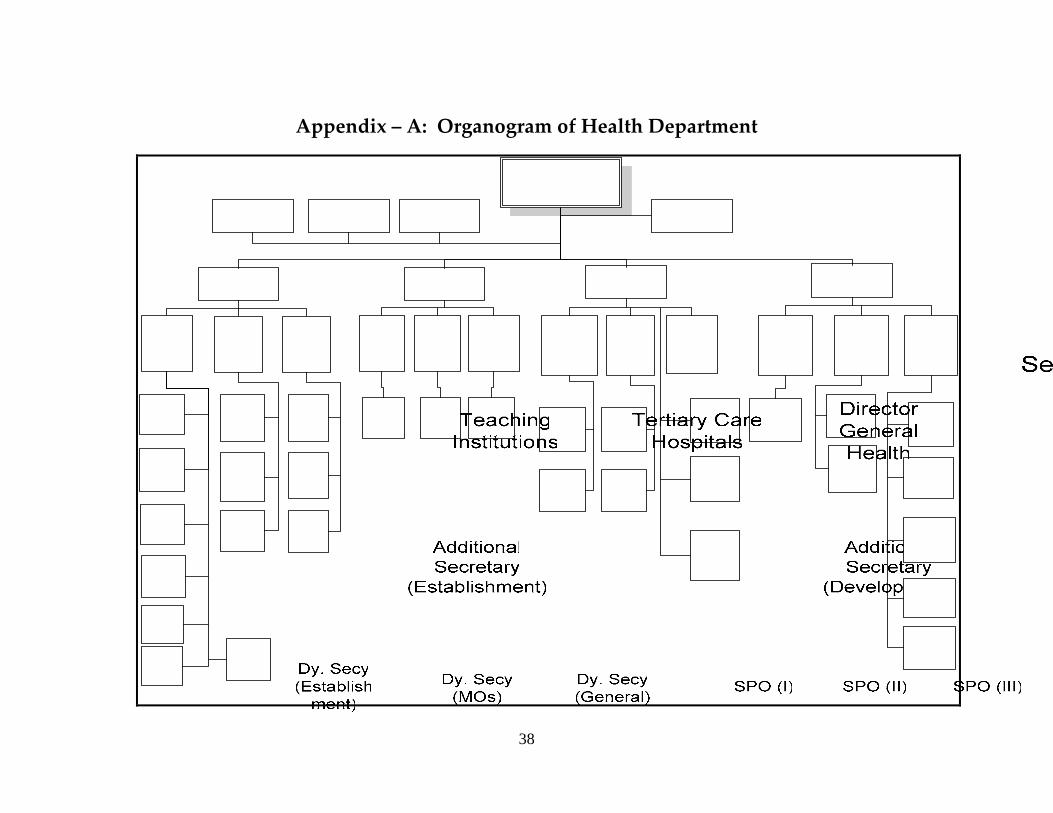
Appendix – A: Organogram of Health Department
38
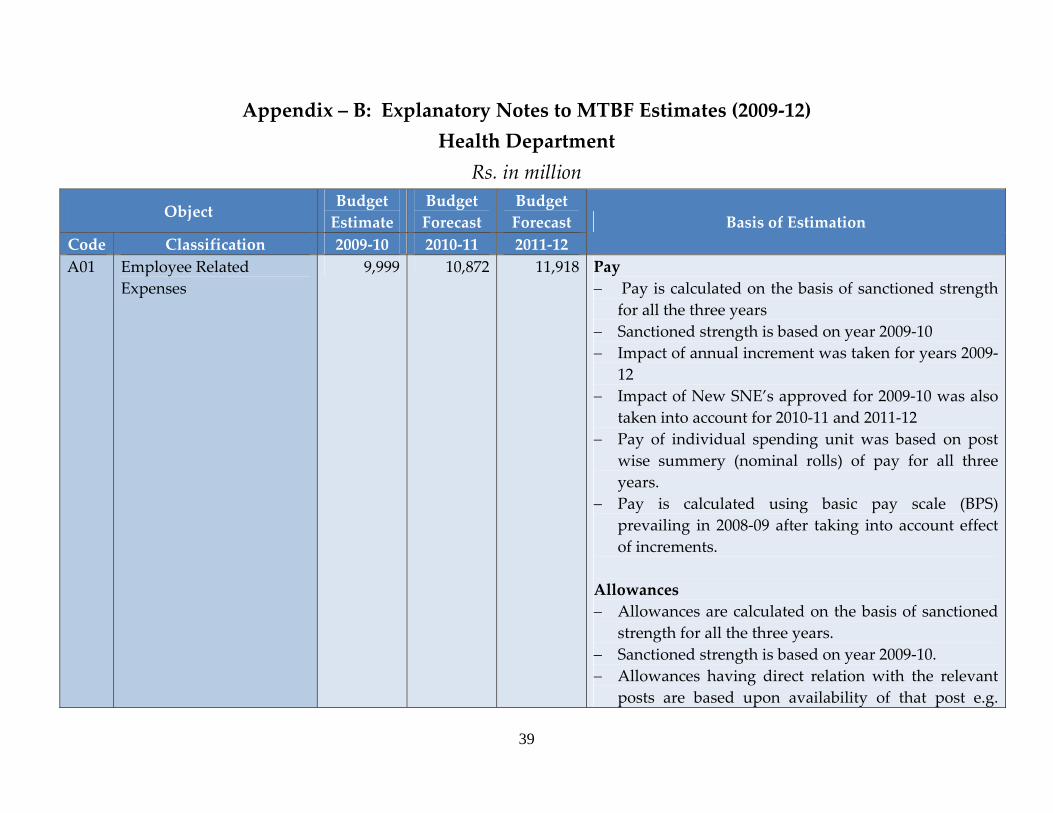
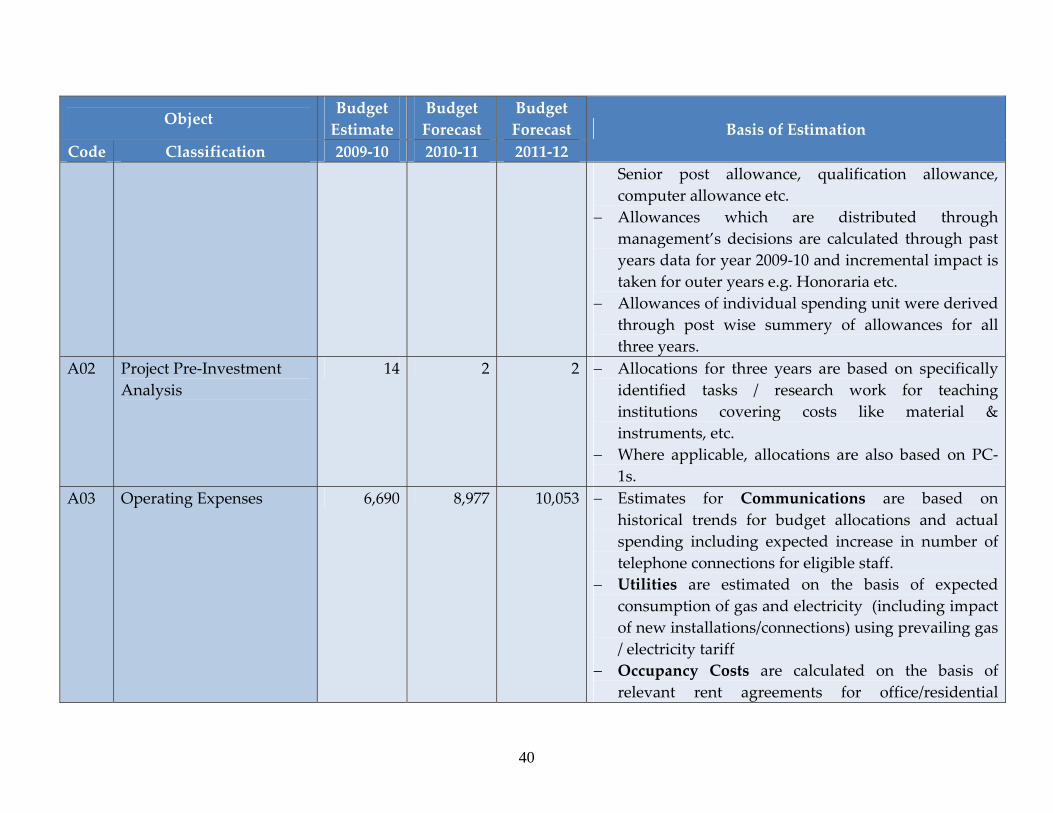
Appendix – B: Explanatory Notes to MTBF Estimates (2009‐12) Health Department
Rs. in million Object
Budget Estimate
Budget Forecast
Budget Forecast
Code Classification 2009‐10 2010‐11 2011‐12 Basis of Estimation
A01 Employee Related Expenses
9,999 10,872 11,918 Pay − Pay is calculated on the basis of sanctioned strength
for all the three years − Sanctioned strength is based on year 2009‐10 − Impact of annual increment was taken for years 2009‐
12 − Impact of New SNE’s approved for 2009‐10 was also
taken into account for 2010‐11 and 2011‐12 − Pay of individual spending unit was based on post
wise summery (nominal rolls) of pay for all three years.
− Pay is calculated using basic pay scale (BPS) prevailing in 2008‐09 after taking into account effect of increments.
Allowances − Allowances are calculated on the basis of sanctioned
strength for all the three years. − Sanctioned strength is based on year 2009‐10. − Allowances having direct relation with the relevant
posts are based upon availability of that post e.g.
39
Object Budget Estimate
Budget Forecast
Budget Forecast
Code Classification 2009‐10 2010‐11 2011‐12 Basis of Estimation
Senior post allowance, qualification allowance, computer allowance etc.
− Allowances which are distributed through management’s decisions are calculated through past years data for year 2009‐10 and incremental impact is taken for outer years e.g. Honoraria etc.
− Allowances of individual spending unit were derived through post wise summery of allowances for all three years.
A02 Project Pre‐Investment Analysis
14 2 2 − Allocations for three years are based on specifically identified tasks / research work for teaching institutions covering costs like material & instruments, etc.
− Where applicable, allocations are also based on PC‐1s.
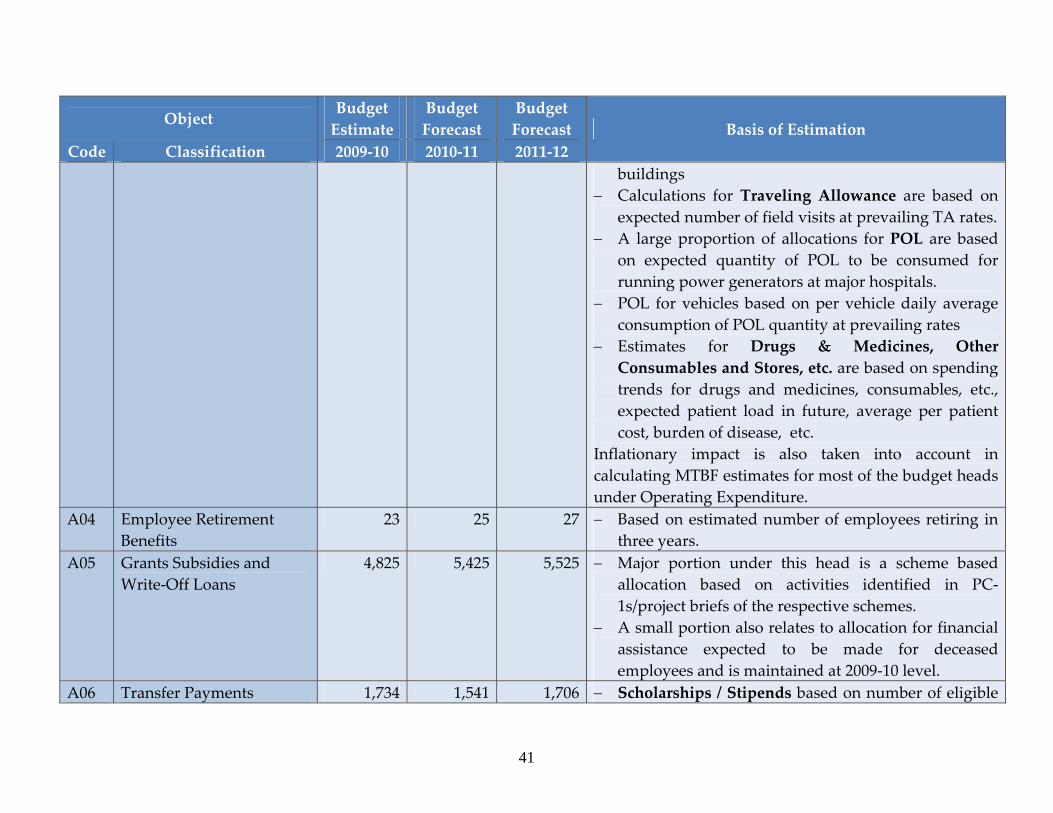
A03 Operating Expenses 6,690 8,977 10,053 − Estimates for Communications are based on historical trends for budget allocations and actual spending including expected increase in number of telephone connections for eligible staff.
− Utilities are estimated on the basis of expected consumption of gas and electricity (including impact of new installations/connections) using prevailing gas / electricity tariff
− Occupancy Costs are calculated on the basis of relevant rent agreements for office/residential
40
Object Budget Estimate
Budget Forecast
Budget Forecast
Code Classification 2009‐10 2010‐11 2011‐12 Basis of Estimation
buildings − Calculations for Traveling Allowance are based on
expected number of field visits at prevailing TA rates. − A large proportion of allocations for POL are based
on expected quantity of POL to be consumed for running power generators at major hospitals.
− POL for vehicles based on per vehicle daily average consumption of POL quantity at prevailing rates
− Estimates for Drugs & Medicines, Other Consumables and Stores, etc. are based on spending trends for drugs and medicines, consumables, etc., expected patient load in future, average per patient cost, burden of disease, etc.
Inflationary impact is also taken into account in calculating MTBF estimates for most of the budget heads under Operating Expenditure.
A04 Employee Retirement Benefits
23 25 27 − Based on estimated number of employees retiring in three years.
A05 Grants Subsidies and Write‐Off Loans
4,825 5,425 5,525 − Major portion under this head is a scheme based allocation based on activities identified in PC‐1s/project briefs of the respective schemes.
− A small portion also relates to allocation for financial assistance expected to be made for deceased employees and is maintained at 2009‐10 level.
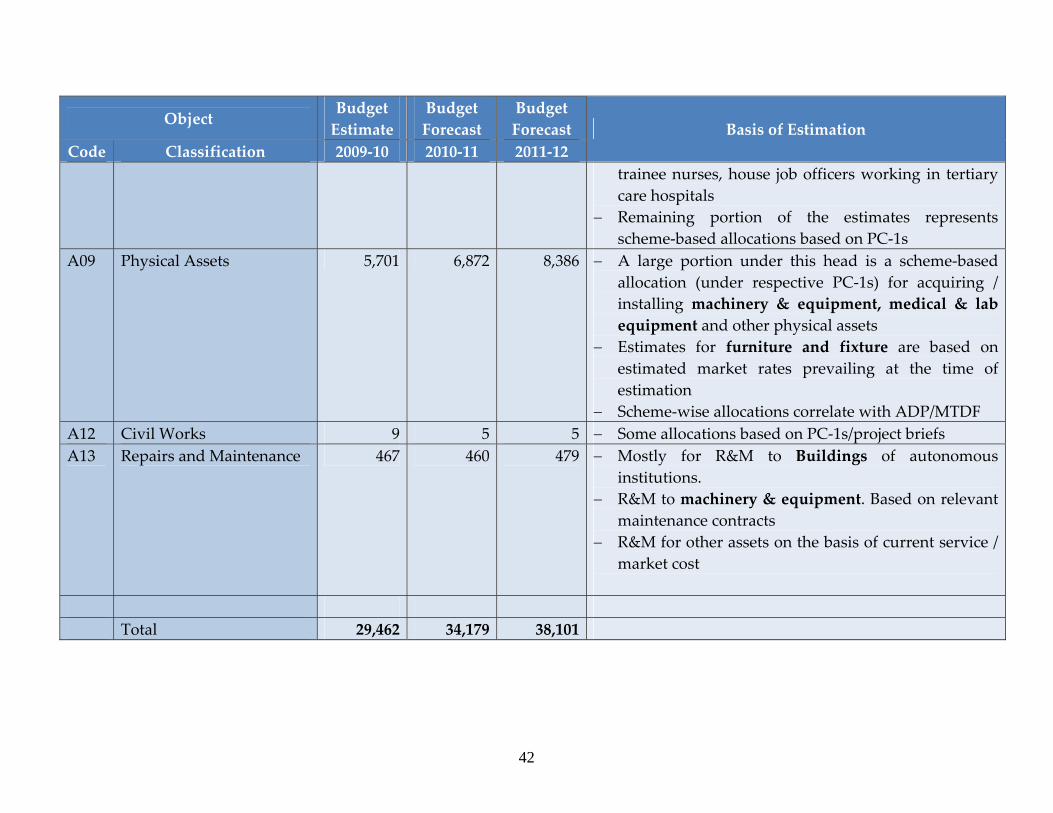
A06 Transfer Payments 1,734 1,541 1,706 − Scholarships / Stipends based on number of eligible
41
42
Object Budget Estimate
Budget Forecast
Budget Forecast
Code Classification 2009‐10 2010‐11 2011‐12 Basis of Estimation
trainee nurses, house job officers working in tertiary care hospitals
− Remaining portion of the estimates represents scheme‐based allocations based on PC‐1s
A09 Physical Assets 5,701 6,872 8,386 − A large portion under this head is a scheme‐based allocation (under respective PC‐1s) for acquiring / installing machinery & equipment, medical & lab equipment and other physical assets
− Estimates for furniture and fixture are based on estimated market rates prevailing at the time of estimation
− Scheme‐wise allocations correlate with ADP/MTDF A12 Civil Works 9 5 5 − Some allocations based on PC‐1s/project briefs A13 Repairs and Maintenance 467 460 479 − Mostly for R&M to Buildings of autonomous
institutions. − R&M to machinery & equipment. Based on relevant
maintenance contracts − R&M for other assets on the basis of current service /
market cost
Total 29,462 34,179 38,101
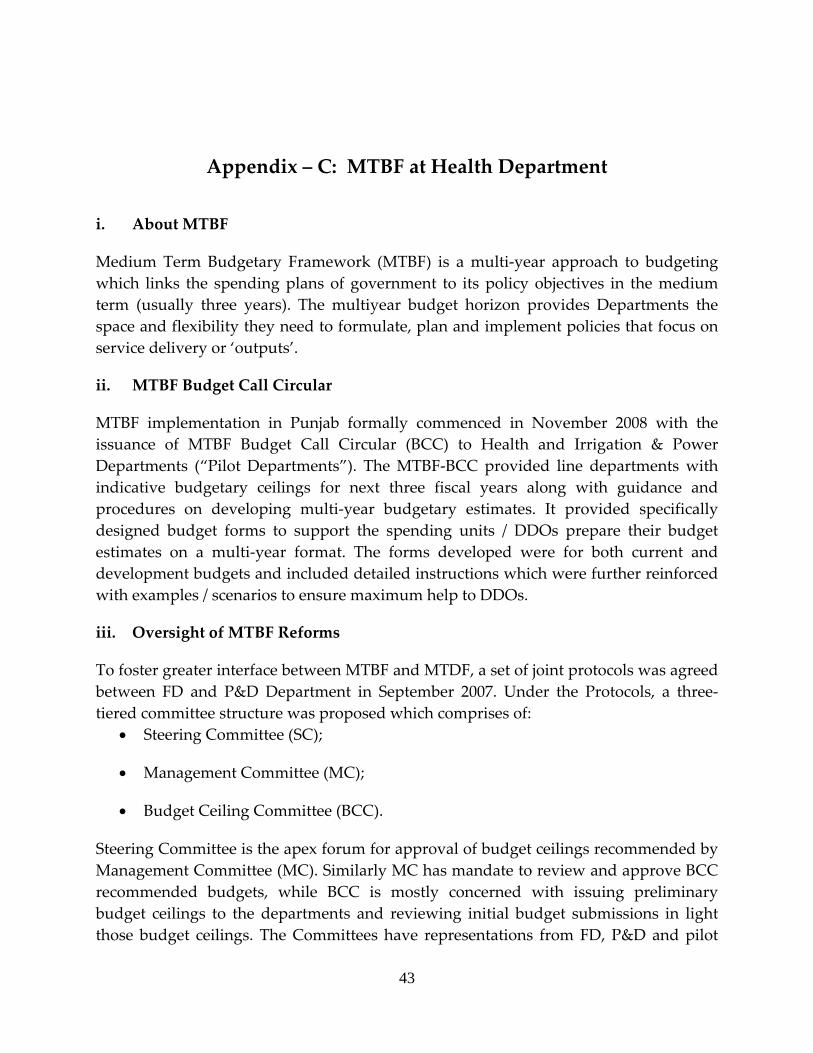
Appendix – C: MTBF at Health Department
i. About MTBF
Medium Term Budgetary Framework (MTBF) is a multi‐year approach to budgeting which links the spending plans of government to its policy objectives in the medium term (usually three years). The multiyear budget horizon provides Departments the space and flexibility they need to formulate, plan and implement policies that focus on service delivery or ‘outputs’.
ii. MTBF Budget Call Circular
MTBF implementation in Punjab formally commenced in November 2008 with the issuance of MTBF Budget Call Circular (BCC) to Health and Irrigation & Power Departments (“Pilot Departments”). The MTBF‐BCC provided line departments with indicative budgetary ceilings for next three fiscal years along with guidance and procedures on developing multi‐year budgetary estimates. It provided specifically designed budget forms to support the spending units / DDOs prepare their budget estimates on a multi‐year format. The forms developed were for both current and development budgets and included detailed instructions which were further reinforced with examples / scenarios to ensure maximum help to DDOs.
iii. Oversight of MTBF Reforms
To foster greater interface between MTBF and MTDF, a set of joint protocols was agreed between FD and P&D Department in September 2007. Under the Protocols, a three‐tiered committee structure was proposed which comprises of:
• Steering Committee (SC);
• Management Committee (MC);
• Budget Ceiling Committee (BCC).
Steering Committee is the apex forum for approval of budget ceilings recommended by Management Committee (MC). Similarly MC has mandate to review and approve BCC recommended budgets, while BCC is mostly concerned with issuing preliminary budget ceilings to the departments and reviewing initial budget submissions in light those budget ceilings. The Committees have representations from FD, P&D and pilot
43
departments. In addition, there exists a MTBF Working Group consisting of secretaries of FD, P&DD and pilot departments. This Group was constituted in November 2008.
To oversee MTBF implementation activities and to interact with consultant team on a day‐to‐day basis, a core team comprising of key officials (budget and planning) from Health Department was appointed which had the overall responsibility for institutionalizing and taking the reform process forward. Additional Secretary (Development) heads the core team. To support MTBF implementation a team of consultants was deployed at Health Department and Finance Department thus ensuring smooth implementation.
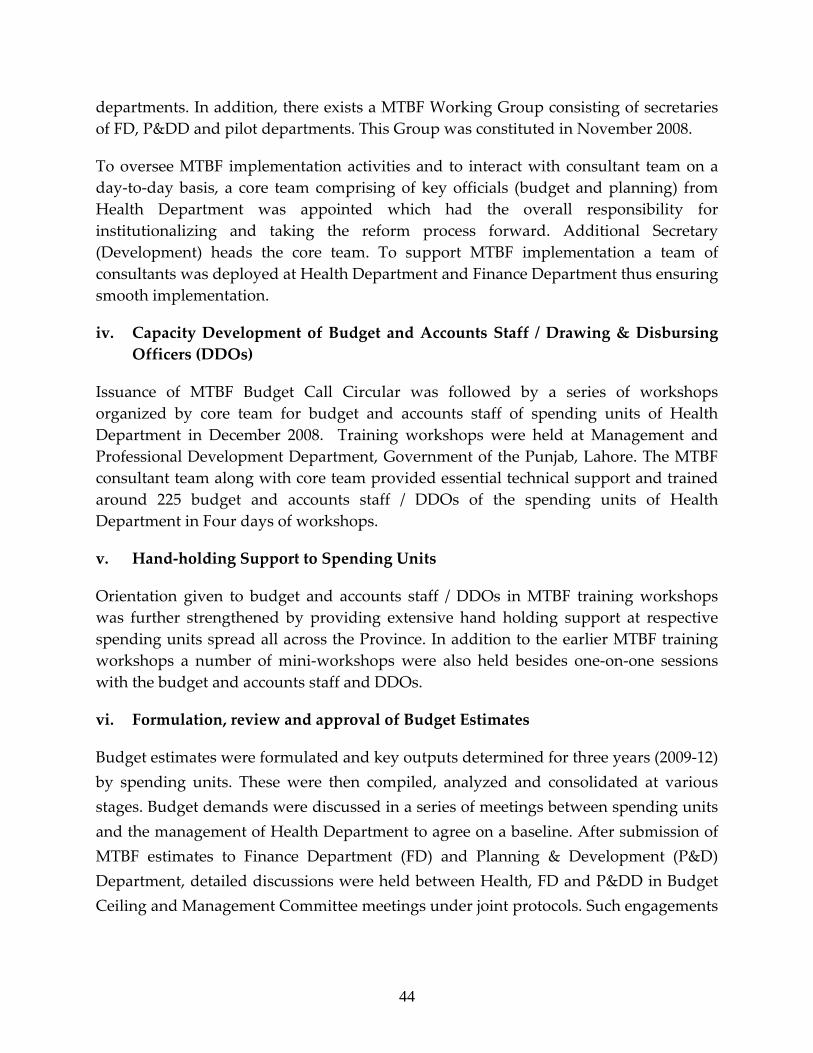
iv. Capacity Development of Budget and Accounts Staff / Drawing & Disbursing Officers (DDOs)
Issuance of MTBF Budget Call Circular was followed by a series of workshops organized by core team for budget and accounts staff of spending units of Health Department in December 2008. Training workshops were held at Management and Professional Development Department, Government of the Punjab, Lahore. The MTBF consultant team along with core team provided essential technical support and trained around 225 budget and accounts staff / DDOs of the spending units of Health Department in Four days of workshops.
v. Hand‐holding Support to Spending Units
Orientation given to budget and accounts staff / DDOs in MTBF training workshops was further strengthened by providing extensive hand holding support at respective spending units spread all across the Province. In addition to the earlier MTBF training workshops a number of mini‐workshops were also held besides one‐on‐one sessions with the budget and accounts staff and DDOs.
vi. Formulation, review and approval of Budget Estimates
Budget estimates were formulated and key outputs determined for three years (2009‐12) by spending units. These were then compiled, analyzed and consolidated at various stages. Budget demands were discussed in a series of meetings between spending units and the management of Health Department to agree on a baseline. After submission of MTBF estimates to Finance Department (FD) and Planning & Development (P&D) Department, detailed discussions were held between Health, FD and P&DD in Budget Ceiling and Management Committee meetings under joint protocols. Such engagements
44

paved way for a constructive budget dialogue between these departments and finally culminated in approval of budgetary estimates by Steering Committee for FY 2009‐12.
45
Glossary of Terms Activity A t of specific tasks achieve a eci c output.se undertaken to sp fi
Actual Expenditure
Amount expended by a spending unit / DDO out of the funds allocated against a particular account head.
ADP A statement of development schemes on‐going and those proposed o be launched by provincial government n a given t ifiscal year.
BE Budget Estimates – refers to budget estimates originally authorized by the Parliament and ncluded in Schedule of iAuthorized Expenditure
Current Budget A portion of the budget that relates to the on‐going / operational costs of the government. Also called non‐development budget.
DDO Drawing Disbursing Officer – an official authorized t draw & ospecific amount funds from government’s designate account and make authorized disbursements
Development Budget
A portion of the budget that is aimed at creating a specific asset or developing infrastructure whose benefits would continue for several years
FD Finance Department of the Government of Punjab
Function Classification
Function classification is one of the Chart of Accounts’ five components used to identify ‘purpose’ for which a budget allocation is utilized. Some of the common “functions” (and their relevant codes) are: Health (07), Irrigation Works (042), Education affairs and services (09), etc.
FY Fiscal Year – starting from 1st of July and on 30ending th of June next.
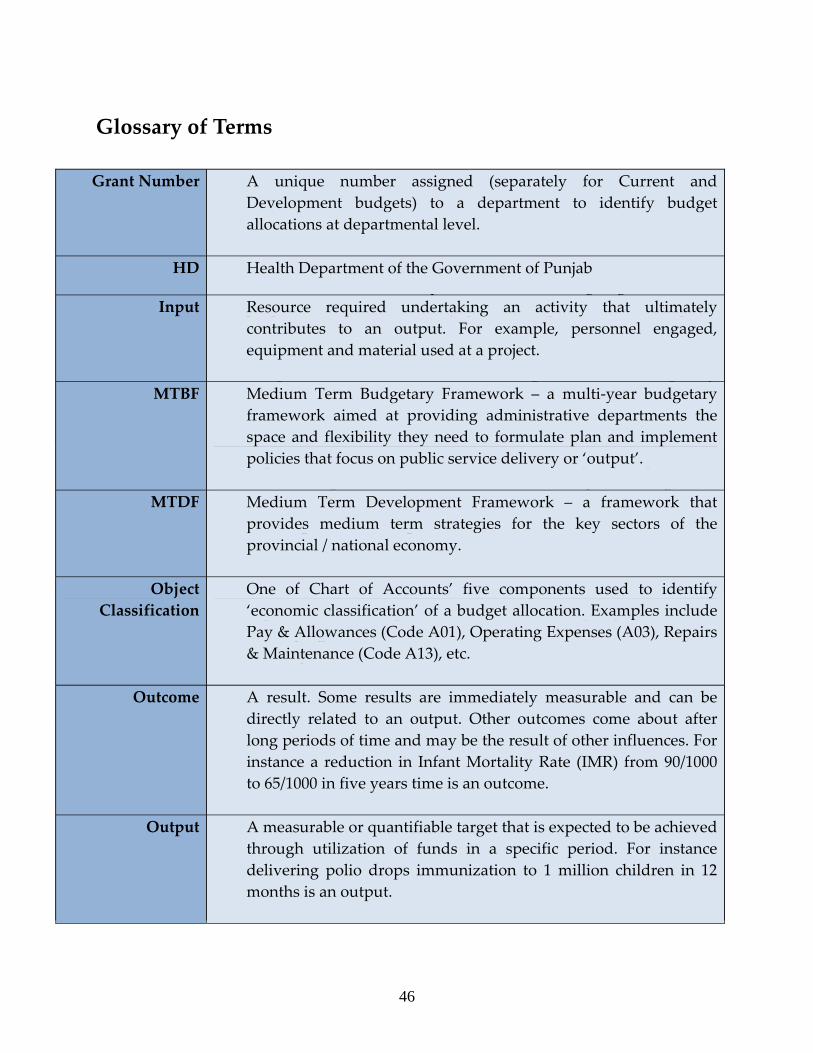
Grant Number A unique number assigned (separately for Current and Development budgets) to a department to identify budget allocations at departmental level.
HD Health Department of the Government of Punjab
Input Resource required undertaking an activity that ultimately contributes to an output. For example, personnel engaged, equipment and material used at a project.
MTBF Medium Term Budgetary Framework – a multi‐year budgetary framework aimed at providing administrative departments the space and flexibility they need to formulate plan and implement policies that focus on public service delivery or ‘output’.
MTDF Medium Term Development Framework – a framework that provides medium term strategies for the key sectors of the provincial / national economy.
Object Classification
One of Chart of Accounts’ five components used to identify ‘economic classification’ of a budget allocation. Examples include Pay & Allowances (Code A01), Operating Expenses (A03), Repairs & Maintenance (Code A13), etc.
Outcome A result. Some results are immediately measurable and can be directly related to an output. Other outcomes come about after long periods of time and may be the result of other influences. For instance a reduction in Infant Mortality Rate (IMR) from 90/1000 to 65/1000 in five years time is an outcome.
Output A measurable or quantifiable target that is expected to be achieved through utilization of funds in a specific period. For instance delivering polio drops immunization to 1 million children in 12 months is an output.
46
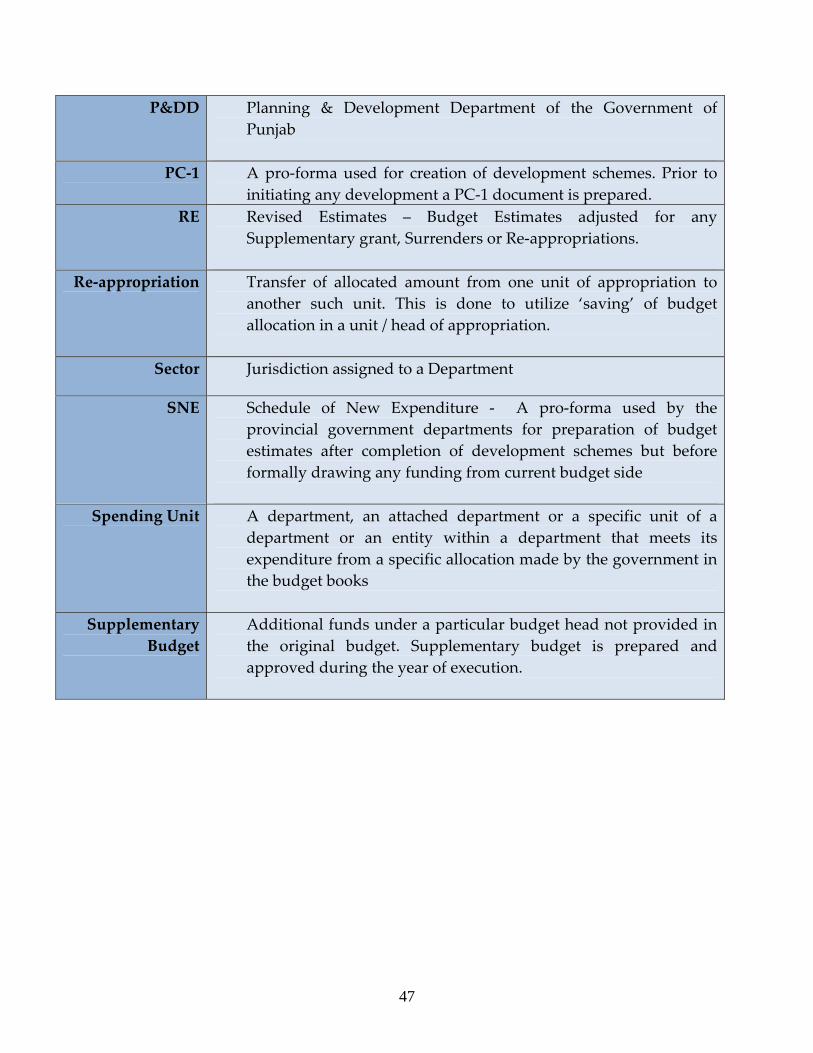
P&DD Planning & Development Department of the Government of Punjab
PC‐1 A pro‐forma used for creation of development schemes. Prior to initiating any development a PC‐1 document is prepared.
RE Revised Estimates – Budget Estimates adjusted for any Supplementary grant, Surrenders or Re‐appropriations.
Re‐appropriation Transfer of allocated amount from one unit of appropriation to another such unit. This is done to utilize ‘saving’ of budget allocation in a unit / head of appropriation.
Sector Jurisdiction assigned to a Department
SNE Schedule of New Expenditure ‐ A pro‐forma used by the provincial government departments for preparation of budget estimates after completion of development schemes but before formally drawing any funding from current budget side
Spending Unit A department, an attached department or a specific unit of a department or an entity within a department that meets its expenditure from a specific allocation made by the government in the budget books
Supplementary Budget
Additional funds under a particular budget head not provided in the original budget. Supplementary budget is prepared and approved during the year of execution.
47
Medium Term Budgetary Framework 2009-12
Section II (Part – A)
Part – A: Details of Current Budget Estimates 2009‐12
Details of Current Budget Estimates 2009‐12
(Page No. ____ to Page No. _____)
Health Department
48
Medium Term Budgetary Framework
2009-12
Section II (Part – B)
Part – B: Details of Development Budget Estimates 2009‐12
Details of Development Budget Estimates 2009‐12 (Page No. ____ to Page No. _____)
Health Department
218