Embed Size (px)
Citation preview

GRADE 12 LEARNERS’ PROBLEM-SOLVING SKILLS IN PROBABILITY
by
FRANCIS KWADWO AWUAH
Submitted in accordance with the requirements for the degree of
DOCTOR OF PHILOSOPHY
in
MATHEMATICS, SCIENCE AND TECHNOLOGY EDUCATION
UNIVERSITY OF SOUTH AFRICA
Supervisor: Dr U.I. Ogbonnaya
JUNE 2018

ii
DEDICATION
This work is dedicated jointly to my lovely mum and dad, Mr and Mrs Oppong Kyekyeku,
for their sacrifices, investment and prayerful support towards my education; to my late sister,
Elizabeth Timah, for her special love (to God be the glory), and finally to all my teachers for
the love and guidance shown to me throughout my education.

iii
DECLARATION
I, Francis Kwadwo Awuah, declare that the thesis Grade 12 learners’ problem-solving
skills in probability is my own work and that all the sources that I have used or quoted have
been indicated and acknowledged by means of complete references. I further declare that I
have not previously submitted this work or part of it, to the University of South Africa or any
other higher education institution for any other qualification.
Signature: ...................................... Date...11 June, 2018.
Francis Kwadwo Awuah

iv
ACKNOWLEDGEMENTS
My utmost thanks go to the Almighty God for the grace, knowledge and strength made
available to me towards the successful completion of this thesis.
The work presented in this thesis would not have been possible without my association with
many people. I seize this opportunity to express my profound gratitude to some individuals
who made this PhD thesis possible.
First and foremost, my sincere gratitude goes to my supervisor, Dr U.I. Ogbonnaya, who
expertly guided me through this discovery. His unwavering enthusiasm for research kept me
constantly engaged with my work. He taught me virtues such as dedication and perseverance
and provided advice, inspiration, encouragement and support toward the completion of this
work. He laid bare to me his rich experience in the field of research and particularly in this
area of mathematics education. My association with him during the period of this study
exposed me extensively to research methodologies, data analysis and in-depth understanding
of writing research articles. I owe him much appreciation for the role he played in my life,
particularly to make this work a success. I am grateful to his wonderful family for allowing
me to have full access to him. I know the family might have missed him sometimes because
he spent much of his time reading through these scripts and pointing out mistakes to ensure
that this study was a success. God bless you.
My appreciation extends to the staff of the Institute for Science and Technology Education
(ISTE): Prof. H.I. Atagana, Prof. L.D. Mogari, Prof. Jeanne Kriek and Dr C.E. Ochonogor for
their presence at all institute seminars to listen and provide constructive criticism and
insightful contribution to a student’s work. I must say I learnt a lot from such seminars and
will always be grateful to them. To all students who made presentations at such seminars,
asked questions and made contributions during the seminars, I wish to express my sincere
thanks to you for your contributions.
I am grateful to the Ethics Committee of the University of South Africa, the Kwa-Zulu Natal
Department of Education, Nongoma circuit of education, the principals, teachers, governing
bodies and parents who made my data collection a smooth process and to the learners who
made themselves available for data collection purposes during the pilot study and the main
work. I experienced a great sense of joy working with you and from the bottom of my heart I
wish to express my appreciation of your time and the confidence invested in me.

v
It is possible that a book of this sort may not be free from errors; if there are few or none then
I am grateful to Dr Jane Murray and Anetha de Wet for the language editing of this thesis.
God bless you for pointing out, to my consternation at times, a number of typographical
mistakes, and general errors. Once again many thanks for the wonderful work done.
A friend in need is a friend indeed. My special thanks also go to the following friends: Mr
Derick Folson, Mr Wonder Ekpe and Mr Masango. I will always be indebted to you for the
various roles you played in making this work a success. God bless you.
Lastly, my heartfelt appreciation goes to my wonderful siblings, Chief, Theresah and Gloria
for their unremitting support.

vi
ABSTRACT
This study investigated the problem-solving skills of Grade 12 learners in probability. A total
of 490 Grade 12 learners from seven schools, categorised under four quintiles (socioeconomic
factors) were purposefully selected for the study. The mixed method research methodology
was employed in the study. Bloom’s taxonomy and the aspects of probability enshrined in the
Mathematics Curriculum and Assessment Policy Statement (CAPS) document of 2011 were
used as a framework of analysis. A cognitive test developed by the researcher was used as an
instrument to collect data from learners. The instrument used for data collection passed the
test of validity and reliability. Quantitative data collected was analysed using descriptive and
inferential statistics and qualitative data collected from learners was analysed by performing a
content analysis of learners’ scripts. The study found that the learners in this study were more
proficient in the use of Venn diagrams as an aid in solving probability problems than in using
tree diagrams and contingency tables as aids in solving these problems. Results of the study
also showed that with the exception of Bloom's taxonomy synthesis level, learners in Quintile
4 (fee-paying schools) had statistically significant (P-value < 0.05) higher achievement scores
than learners in Quintiles 1 to 3, (i.e. non-fee-paying schools) at the levels of knowledge,
comprehension, application, analysis and evaluation of Bloom’s taxonomy.
Contrary to expectations, it was revealed that the achievement of the learners in probability in
this study decreased from Quintile 1 to Quintile 3 in all but the synthesis level of Bloom's
taxonomy. Based on these findings, the study argued that the quintile ranking of schools in
South Africa may be a useful but not a perfect means of categorisation to help improve
learner achievement. Furthermore, learners in the study demonstrated three main error types,
namely computational error, procedural error and structural error. Based on the findings of
the study it was recommended that regular content-specific professional development be
given to all teachers, especially on newly introduced topics, to enhance effective teaching and
learning.
Key terms: school quintile ranking; Bloom’s taxonomy; cognitive levels; Grade 12 learners;
learner achievement in probability; South Africa; cognitive levels; probability; computational
error, procedural error and structural error

vii
TABLE OF CONTENTS
DEDICATION ...........................................................................................................................II
DECLARATION ..................................................................................................................... III
ACKNOWLEDGEMENTS ..................................................................................................... IV
ABSTRACT ............................................................................................................................. VI
TABLE OF CONTENTS ........................................................................................................ VII
LIST OF TABLES .................................................................................................................. XII
LIST OF FIGURES .............................................................................................................. XIII
LIST OF ABBREVIATIONS ............................................................................................... XIV
CHAPTER ONE BACKGROUND OF THE STUDY .............................................................. 1
1.1 CONTEXT ..................................................................................................................... 3
1.2 PROBLEM STATEMENT ............................................................................................ 7
1.3 AIM OF THE STUDY ................................................................................................... 9
1.4 OBJECTIVES ................................................................................................................ 9
1.5 RESEARCH QUESTIONS ............................................................................................ 9
1.6 RATIONALE FOR THE STUDY ................................................................................. 9
1.7 SIGNIFICANCE OF THE STUDY ............................................................................. 10
1.8 DEFINITION OF TERMS ........................................................................................... 11
1.9 OUTLINE OF CHAPTERS ......................................................................................... 13
1.10 CONCLUSION ............................................................................................................ 14
CHAPTER TWO LITERATURE REVIEW AND CONCEPTUAL FRAMEWORK ........... 15
2.1 LITERATURE REVIEW............................................................................................. 15
2.1.1 Problem-solving ................................................................................................... 15

viii
2.1.2 Problem-solving skills ......................................................................................... 17
2.1.3 Investigations into learners’ problem-solving skills ............................................ 18
2.1.4 Problem-solving models ...................................................................................... 25
2.1.5 Evaluation of problem-solving skills (PSS) ......................................................... 29
2.1.6 Learners’ errors and misconceptions in probability ............................................. 45
2.1.7 Learner achievement and quintile ranking of schools in South Africa ................ 51
2.2 CONCEPTUAL FRAMEWORK ................................................................................ 52
2.2.1 Bloom’s taxonomy ............................................................................................... 52
2.2.2 Probability content in the CAPS document ......................................................... 54
2.3 SUMMARY ................................................................................................................. 58
2.4 CONCLUSION ............................................................................................................ 59
2.5 PROJECTION FOR THE NEXT CHAPTER .............................................................. 60
CHAPTER THREE RESEARCH METHODOLOGY ........................................................... 61
3.1 RESEARCH PARADIGM .......................................................................................... 61
3.2 METHODOLOGY ...................................................................................................... 62
3.3 RESEARCH DESIGN ................................................................................................. 63
3.4 POPULATION OF THE STUDY ................................................................................ 63
3.5 SAMPLING AND SAMPLING TECHNIQUE ........................................................... 63
3.6 DATA COLLECTION INSTRUMENT ...................................................................... 64
3.6.1 Development of the test ....................................................................................... 65
3.6.2 Data collection procedure .................................................................................... 67
3.6.3 Marking memorandum......................................................................................... 70
3.7 VALIDITY AND RELIABILITY OF INSTRUMEN ................................................. 70
3.7.1 Validity of the instrument .................................................................................... 70
3.7.2 Reliability of the instrument ................................................................................ 71
3.8 DATA ANALYSIS ...................................................................................................... 73

ix
3.8.1 Quantitative data analysis .................................................................................... 73
3.8.2 Qualitative data analysis ...................................................................................... 74
3.9 ETHICAL ISSUES ...................................................................................................... 74
3.10 SUMMARY ................................................................................................................. 75
3.11 PROJECTION OF CHAPTER FOUR ......................................................................... 75
CHAPTER FOUR FINDINGS ................................................................................................ 76
4.1 FINDINGS ................................................................................................................... 77
4.2 FINDINGS FROM QUANTITATIVE DATA ANALYSIS ........................................ 78
4.3 ANALYSIS OF QUALITATIVE DATA .................................................................... 96
4.3.1 Content analysis of learners’ performance .......................................................... 96
4.4 ERROR ANALYSIS IN THE DIFFERENT ASPECTS OF PROBABILITY ............. 99
4.4.1 Mutually exclusive events.................................................................................. 100
4.4.2 Complementary events....................................................................................... 101
4.4.3 Independent event .............................................................................................. 102
4.4.4 Dependent events ............................................................................................... 103
4.4.5 Use of Venn diagram ............................................................................................ 104
4.4.6 Use of the contingency table .............................................................................. 105
4.4.7 Fundamental counting principle ........................................................................ 106
4.5 REPORT ON RESEARCH QUESTIONS ................................................................ 107
4.5.1 Research question one........................................................................................ 107
4.5.2 Research question two ....................................................................................... 108
4.5.3 Research question three ..................................................................................... 108
4.5.4 Research question four ....................................................................................... 109
4.6 PROJECTION FOR THE NEXT CHAPTER ............................................................ 110
CHAPTER FIVE DISCUSSION OF FINDINGS ................................................................. 111

x
5.1 RESEARCH QUESTION ONE ................................................................................. 111
5.2 RESEARCH QUESTION TWO ................................................................................ 112
5.2.1 Mutually exclusive events.................................................................................. 113
5.2.2 Complementary event ........................................................................................ 114
5.2.3 Independent event .............................................................................................. 114
5.2.4 Dependent events ............................................................................................... 114
5.2.5 Venn diagrams ................................................................................................... 115
5.2.6 Contingency table .............................................................................................. 116
5.2.7 Fundamental counting principles ....................................................................... 117
5.3 RESEARCH QUESTION THREE ............................................................................ 117
5.4 RESEARCH QUESTION FOUR .............................................................................. 120
5.4.1 MUTUALLY EXCLUSIVE EVENTS .............................................................................. 120
5.4.2 Complementary events....................................................................................... 121
5.4.3 Dependent events and independent events ........................................................ 121
5.4.4 Use of Venn diagrams as an aid to solving probability problems ..................... 122
5.4.5 Use of tree diagrams as an aid to solve probability problems ........................... 123
5.4.6 Use of contingency tables as an aid to solve probability problems ................... 123
5.4.7 Fundamental counting principles ....................................................................... 124
5.5 SUMMARY OF CHAPTER ...................................................................................... 124
CHAPTER SIX SUMMARY, CONCLUSION AND RECOMMENDATIONS ................. 126
6.1 SUMMARY OF THE STUDY .................................................................................. 126
6.2 CONCLUSION .......................................................................................................... 127
6.3 RECOMMENDATIONS ........................................................................................... 128
6.4 SUGGESTIONS FOR FUTURE RESEARCH .......................................................... 129
6.5 LIMITATIONS OF THE STUDY ............................................................................. 130
6.7 FINAL THOUGHT .................................................................................................... 130

xi
REFERENCES ...................................................................................................................... 131
APPENDICES ....................................................................................................................... 149
APPENDIX A: COGNITIVE TEST ON PROBABILITY AND COUNTING PRINCIPLES ................. 149
APPENDIX B: SOLUTION TO COGNITIVE TEST ON PROBABILITY AND COUNTING PRINCIPLE . 156
APPENDIX C: PARENT’S CONSENT FORM ............................................................................. 162
APPENDIX D: VARIOUS GRAPHS SHOWING LEARNER PERFORMANCE IN DIFFERENT
CATEGORIES ........................................................................................................................ 163
APPENDIX E: SPSS 23 OUTPUT OF RELIABILITY COEFFICIENT ............................................. 166
APPENDIX F: LETTER OF PERMISSION TO CONDUCT RESEARCH ........................................... 167
APPENDIX G: ETHICAL CLEARANCE CERTIFICATE FROM UNISA ........................................ 168
APPENDIX H: GAMES-HOWELL POST-HOC MULTIPLE COMPARISON TEST ............................ 169

xii
LIST OF TABLES
Table 1.1 Trends in Grade 12 in performance in Grade 12 mathematics
examination from 2008 to 2016...........................................................
6
Table 1.2 South African learners’ pass rate in probability..................................... 8
Table 3.1: Distribution of questions based on Bloom’s taxonomy and aspects of
probability.....................................................................
68
Table 3.2 Comparison of scores between researcher and independent marker.....
according to cognitive levels
72
Table 3.3 Comparison of scores between researcher and independent marker
according to the aspect of probability
72
Table 4.1: Demographics of participants ............................................................... 77
Table 4.2 Descriptive statistics of learners’ achievement...................................... 78
Table 4.3 Learners’ mean percentage scores at Bloom’s taxonomy levels
according to quintiles....................................................
79
Table 4.4 Descriptive statistics of learners’ achievement according to the
aspects of probability
81
Table 4.5 Frequency distribution of learners’ performance per various aspects
in probability..........................................................................................
81
Table 4.6 Frequency distribution of learners’ performance in mutually
exclusive events ...................................................................................
84
Table 4.7 Frequency distribution in independent events 85
Table 4.8 Frequency distribution in complementary events................................ 86
Table 4.9 Frequency distribution of learners’ performance in dependent events.. 87
Table 4.10 Frequency distribution in use of Venn diagrams................................. 88
Table 4.11 Frequency distribution of learners on use of tree diagrams................... 89
Table 4.12 Frequency distribution contingency tables.......................................... 90
Table 4.13 Learners’ performance in fundamental counting principle per
quintiles ................................................................................................
91
Table 4.14 Levene test of homogeneity of the variances of learners’
achievements........................................................................................
92
Table 4.15 Welch test of equality of means............................................................. 93
Table 4.16 Test of between-subject effect............................................................... 94

xiii
LIST OF FIGURES
Figure 4.1: Percentage of learners who achieved at least 50% and at most 49% on
test according to cognitive levels .................................................................... 79
Figure 4.2: Frequency of learners per achievement in the aspects of probability .............83
Figure 4.3 Overall learner performances in the different aspects of probability ...............83
Figure 4.4: Mathematical production system performance analysis framework .................97
Figure 4.5 Production system problem-solving model .......................................................98
Figure 4.6 Percentage of learners per type of error in aspects of probability..................... 99

xiv
LIST OF ABBREVIATIONS
ANA: Annual National Assessment
AMESA: Association for Mathematics Education in South Africa
CAAPSA computer-aided algebraic problem-solving assessment
CAPS: Curriculum and Assessment Policy Statement
CAPSI: content-based problem-solving instruction
DoE: Department of Education
DBE: Department of Basic Education
FCP: fundamental counting principles
FET: Further Education and Training
GET: General Education and Training
HSRC Human Sciences Research Council
IoT: Internet of Things
ISTE Institute of Science and Technology Education
MCK: mathematical content knowledge
MPSPAF: mathematical production system performance analysis
NCS: National Curriculum Statement
NCTM: National Council of Teachers of Mathematics
NFER: National Foundation of Educational Research
OECD: Organisation for Economic and Cooperative Development
PBM problem-based module
PCK: pedagogic content knowledge
PK: pedagogic knowledge
PSPSM: production system problem-solving model
PSS: problem-solving skills
SASA: South African Statistical Association
SGB: school governing body
SMK: subject matter knowledge
TIMSS: trends in mathematics, science and technology education
Unisa: University of South Africa

1
CHAPTER ONE
BACKGROUND OF THE STUDY
With the 4th industrial revolution facing the world now, acquiring the necessary problem-
solving skills has become more critical than ever before. This revolution is moving the world
into an era of Internet of Things (IoT) and artificial intelligence. The era would see robots
taking the place of humans in industry. People who lack exceptional problem-solving skills
may in all likelihood find it difficult to fit into this competitive environment, more especially
when it comes to job acquisition. It is from this premise that the Director of Education and
Skills at the Organisation for Economic Cooperation and Development (OECD, 2014) noted
that 15-year-old and students with poor problem-solving skills are likely to become
tomorrow’s adults struggling to keep or find a job and as a result recommended the inclusion
of problem-solving in the school curriculum. By this strategy, learners’ conceptual
understanding of a topic would be enhanced, learners’ power to think rationally would be
improved and they would be well versed in mathematical principles as well as develop
interest and curiosity to study (Cobb, Yackel & Wood, 2011).
Promoting the acquisition of problem-solving skills is of the essence if this dream is to be
realised. To realise this, adequate emphasis should be placed on the teaching and learning of
mathematics. This is because mathematical ideas, knowledge and skills are crucial in
enhancing learners’ problem-solving abilities, an embodiment of the numerous procedures
and formulas used in solving problems (Ogbonnaya, 2011; Ojose 2011; Unodiaku, 2012).
According to the South African Department of Basic Education (DBE) (2011, p8),
“Mathematics is a discipline that aids the development of mental processes that improve
logical and critical-thinking accuracy and problem-solving skills needed in the making of
decisions.” Tella (2017) asserted that mathematics opens opportunities to most professions
studied at the highest levels of education because it helps in the acquisition of the necessary
skills needed in solving problems. Hence most courses offered at tertiary level require a pass
mark in mathematics before students are enrolled into the various faculties at universities and
training colleges. It is not surprising that many researchers have found a strong relationship
between mathematics and problem-solving (Che, Wiegert & Threlkeld, 2012; Sangcap,
2010). From this premise, it is undoubtedly a fact beyond dispute that a strong foundation in
mathematical concepts prepares young people in the acquisition of essential problem-solving
skills.

2
This notwithstanding, evidence abounds that mathematics in general and some topics (e.g.
statistics and probability) in particular seem to pose a challenge to most learners in South
Africa (Makwakwa, 2012; McCarthy & Oliphant, 2013; Modisaotsile, 2012; Spaull & Kotze,
2015). The situation has taken a toll on the country in terms of its manpower. Maree (2010)
reported an acute shortage of professionals in the fields of science, engineering, finance and
technology in the country. These shortages, according to McGrath and Akoojee (2007), pose
a challenge to South Africa’s developmental initiatives. McGrath and Akoojee (2007) argue
that if these challenges are to be met, learners should achieve a higher level of numeracy in
the early grades of school and there should be an increase in the secondary school graduation
rates in mathematics and science. Conventional reasoning also suggests that if the problem of
a shortage of scientists, engineers, financial experts and technologists is to be resolved, then
ensuring that learners obtain good marks in mathematics is paramount. The poor
mathematical performance of South African learners makes a case for the need to ensure that
learners’ problem-solving skills in the subject are improved.
Reports from many studies show that most teachers in South Africa find the task of teaching
the topic probability in the mathematics classroom to be arduous (Atagana, Mogari, Kriek,
Ochonogor, Ogbonnaya, Dhlamini & Makwakwa, 2011; Makwakwa 2012). Probability is a
fundamental topic in mathematics that finds application in almost every aspect of our lives.
For example, according to Brown and Wong (2015), knowledge of probability helps one to
understand issues in “politics, insurance, gambling, industrial quality control, and study of
genetics, quantum mechanics and the kinetic theory of gases” (Simmons, 1992). According to
NCTM (1989), probability connects many areas of mathematics, particularly those based on
counting and geometry. Batanero, Chernoff, Engel, Lee and Sanchez (2016) affirmed this fact
when proposing that learners’ experience in probability can contribute to their conceptual
knowledge of working with data. This is because probability terminologies and concepts such
as “unlikely”, “possible”, fair, “likely”, “impossible” and many others, are often used in these
fields. In addition, while the measurement of chance in everyday life may not be realised
consciously, subconsciously it is present in almost every decision taken. Hence the
knowledge of probability helps one to increase one's chances of making the right decisions
(Nantha, 2017; Newman, Obremski & Schaeffre, 1987). The implication is that the lack of
understanding of probability could lead to several negative effects in the economy of any
country.

3
The poor state of learners’ underperformance in probability in South Africa, especially among
rural schools (Adu & Gosa, 2014), has been attributed to factors such as “imbalance in the
educational system caused by the apartheid government” (Ogbonnaya, Mji & Mohapi, 2016).
Since the dawn of democracy in 1994, the post-apartheid government in South Africa has
made several efforts to enhance the performance of South African learners in mathematics
and transform education in general.
However, this is yet to yield any marginal dividend (Keeton, 2010; Parker, 2012). Critical
amongst these efforts is a series of transformations of the school curriculum, the emergence
of educational policies, e.g. the “no-fee” system and a number of educational workshops
(Chimuka, 2017). South Africa has been identified as a country of wide economic disparity
between rich and poor among the races and across the nine provinces (Spaull, 2015). To
address these issues of socioeconomic status and disparity in access to education in South
Africa, the government has categorised the country’s public schools into five quintiles
(Graven, 2014). Despite the introduction of the quintile classification of schools and its
concomitant budget implications in education, one wonders if the wide gap in academic
achievement of learners from the different geographical areas, especially in mathematics
(Graven, 2014), is actually being bridged because the problem of learners’ underperformance
still persists.
On this premise, understanding learners’ problem-solving skills in terms of cognitive
demands will be a step towards solving the problem of their underachievement in the topic of
probability. This would inform stakeholders about the weaknesses of learners at these
cognitive levels in order to help them improve their performance.
The study focused on Grade 12 learners’ problem-solving skills in probability because the
topic is reported as being difficult to teach and learn by a number of mathematics teachers in
South African secondary schools (Atagana et al., 2011).
1.1 CONTEXT
The education system in South Africa comprises two departments. These are the Department
of Basic Education (DBE) and the Department of Higher Education and Training (DHET).
The DBE is responsible for primary and the secondary schools while the DHET bears
responsibility for tertiary education as well as vocational training. The entire system of
education is divided into three levels, General Education and Training (GET) from Grade 0 to

4
Grade 9, Further Education and Training, comprised of learners from Grade 10 to Grade 12
and lastly, Higher Education and Training (tertiary education), which includes students
registered for a degree, diploma or certificate from undergraduate to postgraduate level
(South Africa Info, 2010). Learners sit for their first national examination in Grade 12, an
examination which, in common parlance is referred to as the matriculation examination.
Passing this examination is the requirement for admission to tertiary or higher education in
the country.
The management of schools is vested in the hands of the elected school governing body
(SGB). An SGB is made up of the principal, elected parents and a teacher representative;
however, the school management comprises the principal, the deputy principal and the
various heads of department of the school. Regarding examinations, there is only one national
examination, which is written once every year by Grade 12 learners; this grade being the
point of exit in secondary education in South Africa. This examination, popularly referred to
as the matriculation examination, serves as a requirement for entry to a tertiary or higher
education institution. Terminal examinations are controlled at provincial level.
Before 1994 South Africa’s educational system was divided among ethnic and racial lines.
The country had different education systems for its people based on colour. School systems
were inequitably resourced with regard to human and material resources (Sayed, 2002). This,
according to Sayed, led to the underdevelopment of mathematics, science and technology
education, particularly among the black secondary schools. The result of this fragmented
system of education is the perennial poor achievement in mathematical sciences and
technology (Graven, 2014; Spaull, 2015).
To solve this problem of imbalance caused by the then apartheid government, the educational
curriculum of the country has undergone several reforms since the dawn of democracy in
1994 (Sayed, 2002). The South African government is solving the issue of poor learner
underachievement, removal of financial barriers and promotion of equitable access to better
and quality education with the quintile system (Dass & Rinquest, 2017; Graven, 2014). This
system has categorised the country’s public schools into five quintiles. The categorisation is
based on average measures of income, unemployment rates, and the general literacy level of
the school’s geographical area. The most economically disadvantaged schools (the poorest)
are categorized as Quintile 1 and the most economically advantaged as Quintile 5. According
to the South African Department of Education (DoE) (Hall & Giese, 2008), the low quintiles

5
represent areas with “high poverty levels, low levels of education and high unemployment
rates,” while the high quintiles represent areas with “limited poverty, high levels of education
and low unemployment rates.” The classification of schools is used to determine their
government funding. Schools in Quintiles 1 to 3 are non-fee-paying and hence receive more
funding per learner from the government as well as the provision of meals to the learners at
school. Quintiles 4 and 5 are fee-paying schools, based on the assumption that they are
located in wealthier communities and, as a result, are better equipped in terms of their ability
to raise funds. Hence they require less support from the government than schools in lower
quintiles.
South Africa has mathematics education as one of its national priorities. This fact is seen in
the call by the office of the Presidency, Republic of South Africa (Lubisi, 2014) demanding
an increase in the number of learners achieving 50% in literacy and mathematics respectively.
The nation acknowledges that it has experienced over two decades of democracy; however,
the legacy of inferior mathematics education provided for the majority of learners in the years
of apartheid is still prevalent in most public schools.

6
Table 1.1: Trends in Grade 12 learners’ performance in mathematics examination from 2008 to
2016
Table 1.1 shows that the number of learners who write and graduate with at least a 30% pass
in mathematics is not encouraging. It is noticeable that the number of learners who have
written mathematics over the years saw a downward trend between 2008 and 2016. The
percentage might have improved from 45.7% in 2008 to 51.1% in 2016; however, the result
from Table 1.1 shows a significant decrease in the number of learners who wrote the
examination. Learners may choose to write mathematics or mathematical literacy in South
Africa, however, studies have revealed that some learners prefer to write mathematical
Year Candidates who Candidates who % who passed
wrote mathematics passed at 30% mathematics
2008 298821 136503 45.7
2009 290407 133505 46.0
2010 263034 124749 47.4
2011 224635 104033 46.3
2012 225870 121920 54.0
2013 241509 142666 59.1
2014 225 458 120 523 53.5
2015 263 903 129 481 49.1
2016 265810 135958 51.1

7
literacy instead of mathematics because of a fear of mathematics. Spangenberg (2012)
considers that mathematics is too complex but that mathematical literacy is not sufficiently
complex (Dhurumraj, 2013). This problem is most prevalent among schools in townships and
rural communities where the majority of black South Africans were mostly impacted by the
policies of the apartheid government with regard to the level of mathematical training they
received. This fact is evident in the statement by Hlalele (2012) that in spite of the South
African government’s higher budget allocation in education, the country is yet to reach its
target in terms of learners’ performance, particularly in mathematics education among rural
communities. This poses a threat to professions such as accounting, finance, engineering and
the likes as reported in the previous chapter.
Letseka and Maile (2008) reported that learners’ academic failure in South Africa could be
linked to poor primary and secondary schooling, poverty, and academic unpreparedness.
These authors acknowledged the effect of socioeconomic status on learner achievement
scores in South Africa. Other studies have also attributed learners’ underachievement in
mathematics to poor strategies employed in the teaching and learning of the subject, poor
infrastructure in some schools and lack of adequately trained mathematics teachers
(Ogbonnaya, 2011; Spaull, 2015). This has compelled DoE to accept teachers who might not
necessarily have the qualification to teach mathematics or teach it at the Grade 12 level, to
teach the subject, especially in the lower grades, thereby threatening the quality of
mathematics education of such learners.
1.2 PROBLEM STATEMENT
The study investigated Grade 12 learner problem-solving skills in probability. Probability
taught in the mathematics curriculum has been recognised as a challenge for South African
learners. Research has shown that teachers find teaching this topic to be challenging
(Makwakwa, 2012; Wessels & Nieuwoudt, 2011) and learners have not fared well on the
topic in the National Senior Certificate (NSC) examinations (Department of Basic Education,
2016).

8
Table 1.2: South African learners’ pass rate in probability
Adapted from DBE (2016)
Table 1.2 presents the performance of Grade 12 learners in probability. The table reflects the
inconsistencies in learner performance in the topic since its inclusion in the Curriculum and
Assessment Policy Statement (CAPS) curriculum. In comparison with other topics in
Mathematics Paper 1 (written nationally), this topic reflected a relatively poor achievement
among learners. South Africa’s Department of Basic Education (DBE) (2016) indicated that
learners addressed some aspects of the topic satisfactorily, but other areas were addressed
poorly. The DBE stated that learners’ poor performance in responding to probability
questions could be due to the fact that the subject matter was unfamiliar to some of the
teachers. This confirms the issue that a great majority of South African teachers still find the
task of teaching the principles of probability in the mathematics classroom to be taxing and
very demanding. When a teacher lacks content knowledge in any subject or curriculum, the
effect will be seen in the learners’ performance (Ogbonnaya & Mogari, 2014). Judging from
the fact that most of the teachers who are teaching the subject mathematics in South African
classrooms never studied the topic while they were at training college or secondary school, it
is not surprising that their learners are performing below expectation. According to Dhlamini
and Mogari (2011), underperformance in mathematics is addressed within the framework of
learners’ problem-solving skills. The researcher is of the opinion that understanding learners’
problem-solving skills would help to address the problems they have in understanding the
concept. This study, therefore, investigated Grade 12 learners’ problem-solving skills in
probability by exploring their achievements in the topic according to Bloom’s taxonomy.
Topic 2014 2015 2016
Probability 39% 28% 65%
Counting principle 29% 2%
Average percentage of whole examination 53,5% 49,1% 51,1%

9
1.3 AIM OF THE STUDY
The aim of this study was to investigate Grade 12 learners’ problem-solving skills in
probability.
1.4 OBJECTIVES
The objectives of the study were to investigate:
1. The problem-solving skills of Grade 12 learners in probability;
2. The impact of quintile ranking of schools on Grade 12 learners’ problem-solving
skills in probability;
3. Grade 12 learners’ errors and misconceptions in probability.
1.5 RESEARCH QUESTIONS
The research will attempt to answer the following questions. The main research question is:
What are Grade 12 learners’ problem-solving skills in probability?
The sub-questions are as follows:
1 What are Grade 12 learners’ problem-solving skills in probability according to Bloom’s
taxonomy?
2 What are Grade 12 learners’ problem-solving skills in probability on the following:
(i) Mutually exclusive events
(ii) Complementary events
(iii) Dependent events
(iv) Independent events
(v) Use of contingency tables, Venn diagrams and tree diagram as aids
(vi) Fundamental counting principles.
3 How are Grade 12 learners’ problem-solving skills in probability related to learners’
school quintile ranking?
4 What are learners’ errors and misconceptions in probability?
1.6 RATIONALE FOR THE STUDY
The study was necessitated by several factors of which a few are presented in this section.
First and foremost, the several invitations the researcher received as a mathematics teacher to
visit schools to assist mathematics teachers in teaching the topic in rural schools in Nongoma
and his experience as a marker suggested to him that teachers were experiencing serious
problems in teaching the concept of probability. To add to this, several studies have reported

10
the challenges faced by teachers teaching the subject in the mathematics classrooms that were
leading to the poor performance of learners in the topic. This is supported by Olivier (2013)
who noted that probability is among the 10 topics in the mathematics curriculum that teachers
find difficult to teach at Grade 12 level. This prompted the researcher’s interest in
investigating the problem-solving skills of Grade 12 learners by making use of Bloom’s
taxonomy to identify their problem-solving skills as well as to identify the common mistakes
learners make and the misunderstandings they have when solving probability problems. The
researcher believes this would assist stakeholders to improve learner performance in the topic.
1.7 SIGNIFICANCE OF THE STUDY
The study will inform all stakeholders of the level of problem-solving skills learners have in
probability. This information will assist teachers, curriculum developers and textbook authors
to be fully aware of the needs of learners in enhancing their achievement scores in the topic.
A review of the educational literature shows that learners make numerous errors and have a
great number of misconceptions on the topic probability. However, deductions made from the
review show that little has been done to identify where exactly in terms of cognitive demand
and the content of the topic the strength and weaknesses of these learners lie. The researcher
is of the opinion that if learners’ strengths and weaknesses in the topic are identified, it would
go a long way to enhance their problem-solving skills. The study contributes in this regard by
identifying learners’ errors and misconceptions as well as their strengths and weaknesses by
making use of Bloom’s taxonomy and the content learners are expected to study as enshrined
in the CAPS mathematics curriculum.
Among the specific aims stipulated in the CAPS mathematics curriculum is the development
of problem-solving and intellectual skills. The CAPS mathematics document highlights that
teaching should not merely cover the “how”, but must also include the “when” and “why” of
problem types. According to the DBE, “learning procedures and proofs without a good
understanding of why they are important will leave learners ill-equipped in the use of their
knowledge in later life” (DBE, 2011, p. 8). The curriculum also notes the specific skills
learners are to acquire. Among these is the use of “mathematical process skills to identify,
investigate, and solve problems creatively and critically; use spatial skills and properties of
shapes and objects to identify, pose and solve problems creatively” (DBE, 2011, p. 9). It is
imperative to identify the extent to which this is done.

11
There are varying opinions on the effect of the quintile ranking on learners’ achievement.
This study investigated the effect of the quintile ranking on learner achievement by the use of
a more viable approach to measure its effect on learner performance in probability. This
would bring to light the effect of the quintile ranking, particularly in rural schools, where
there is little to compare in terms of the economic situation of the people since the majority
are relatively poor compared to their urban counterparts.
Most studies that have looked at quintile ranking and learner achievement have used data
collected from students who were already engaged in tertiary education and also used data
collected from learners in secondary schools situated in urban areas. The researcher is of the
view that there is a need to look at quintile ranking and its effect on learner performance in
rural schools because it is likely that the dynamics of education in rural settings, as opposed
to urban settings, are not identical. Schools from Nongoma local municipality were chosen as
the catchment area, due to its rural setting and dense population, as well as other
characteristics of the area. The researcher was of the opinion that these characteristics were
appropriate for a study of this nature and would present a true reflection of the state of affairs
regarding learner performance and academic ranking in a rural environment.
South African learners, particularly those from rural areas and provinces such as KwaZulu-
Natal (Spaull & Kotze, 2015), perform poorly in mathematics in comparison with
international standards. On this basis, it was imperative to conduct this study to investigate
the incessant problem of low achievement in the selected topic and in mathematics as a
whole.
1.8 DEFINITION OF TERMS
Problem-solving
Krulik and Rudnick (1980, p. 3) describe problem-solving as “the means by which an
individual uses previously acquired knowledge, skills, and understanding to satisfy the
demands of an unfamiliar situation.” Learners must understand what they have learned, and
be able to understand its relevance in new and different situations.
Problem-solving skills
Learners’ problem-solving skills as used in this study are “the learners’ capabilities and
abilities to solve problems from intellectual domains such as mathematics” (Renkl &
Atkinson, 2010, p. 16).

12
Matriculant
Matriculant is an informal term to describe a Grade 12 learner in South Africa.
Grade 12
Grade 12 is the exit grade in the FET phase.
Matric examination
This term is informally used to describe the Grade 12 final examination in South Africa.
Mathematics
Mathematics is one of the subjects that form part of the curriculum of South Africa’s
education system. A learner may choose to study either mathematics or mathematical literacy
in the curriculum.
Further Education and Training (FET)
FET refers to Grades 10 to 12 of the South African school system.
General Education and Training (GET)
This refers to Grades 0 to 9 of the South African school system.
Secondary school
This refers to students in the FET band.
Quintile
The term is used to categorise schools in South Africa mainly in the area of financial
resources. Quintile 1 is seen as the poorest whereas Quintile 5 is regarded as the most affluent
(Grant, 2013).
Non-fee-paying schools
These are government schools that do not charge school fees in South Africa.
Fee-paying
These are government schools that charge school fees South Africa.

13
Educational ward
A ward is a division within an educational circuit.
Educational circuit
A circuit is a division within an educational district.
1.9 OUTLINE OF CHAPTERS
The study follows the outline described below.
Chapter One: Introduction
This chapter gives the background and context of the study and describes the educational
system of schools in South Africa. The chapter provides the statement of the problem, the
research questions, significance of the study, the aims and objectives and a brief definition of
terms used and structure of the thesis.
Chapter Two: Literature Review and Conceptual Framework
In this chapter, the conceptual structure of the study and review of some relevant literature is
presented. The literature sets the foundation for the main themes of the study: probability;
history of probability in South African schools; learners’ achievement and quintile ranking;
problem-solving; errors and misconceptions of learners in probability.
Chapter Three: Research Methodology
This chapter sets out the methods used in the study, explains the research design, how
samples were collected; it describes the data collection instruments and the development of
the instruments as well as the procedures of data collection. It determines the validity and
reliability of instruments, presents the pilot study and the ethical issues that arose from the
study.
Chapter Four: Findings
This chapter highlights the data analysis methods and procedures. The results of the data
analysis applied to evaluate the findings of the study and answer the research questions are
also presented.
Chapter Five: Discussion of Findings
In this chapter, the findings of the study are discussed alongside their implications.
14
Chapter Six: Summary, Conclusion and Recommendations
This chapter summarises the study and draws a conclusion upon which recommendations are
made.
1.10 CONCLUSION
In this chapter, the orientation of the study was established and the contextual view of the
project highlighted. The research questions and significance of the study, as well as the aims
and objectives, problem statement, definition of terms and outlines of other chapters of the
study were addressed.

15
CHAPTER TWO
LITERATURE REVIEW AND CONCEPTUAL FRAMEWORK
The chapter is divided into two main sections, the literature review and the conceptual
framework. The first section reviews studies that have been done on problem-solving,
problem-solving skills, problem-solving models and challenges learners face in probability,
as well as some common errors and misconceptions in probability as these factors could be
relevant to the quintile ranking of schools. The second part of the chapter discusses the
conceptual framework of the study. Bloom’s (1956) taxonomy and the CAPS (DBE, 2011)
probability curriculum were used as frameworks to tease out the learners’ problem-solving
skills in probability.
2.1 LITERATURE REVIEW
This section reviews the literature related to the subjects of the study, namely: problem-
solving; problem-solving skills; investigation into problem-solving skills; problem-solving
models; evaluation of problem-solving skills; probability; probability in the South African
school curriculum; studies on teaching and learning of probability; errors and
misunderstandings of probability experienced by learners; learner achievement and the
quintile ranking of schools in South Africa.
2.1.1 Problem-solving
For some years now, mathematical problem-solving has been seen as a vital aspect of the
teaching of mathematics, the learning of mathematics and mathematics in general. It is one of
the most important cognitive skills needed in many professions as well as in everyday life
(Jonassen, 2000). This is because everyone encounters problems in their daily activities.
Some of these problems may require simple solutions. Others may require a series of steps
before one arrives at the desired solution. The act of solving problems and getting problems
right demands some level of skill. Individuals who have these skills have greater
opportunities in their everyday life and profession. For example, people’s capacity to solve
complex problems enables them to adapt to changes in the community or the environment
and to learn from their mistakes. Proficiency in problem-solving contributes to self-
actualisation and leads to greater opportunities for employment as well as contributing to
economic growth (Hanushek, Wößmann, Jamison & Jamison, 2008). Due to its importance,
there have been calls for the teaching of problem-solving, as well as the teaching of
mathematics, through problem-solving to be included in the mathematics curriculum

16
(Liljedahl, Santos-Trogo Malaspina & Bruder, 2016; Zanzali & Lui, 2000). It is not surprising
that the field has seen tremendous interest by researchers in mathematics education. As a
result, the past decades have witnessed much research done on problem-solving in different
disciplines. Studies on problem-solving have focused on different themes (Anderson, 1980;
Jonassen, 2010; Mayer & Wittrock, 2006; Newell & Shaw, 1958). Among these themes is the
emergence of a number of problem-solving models such as Polya’s (1957) problem-solving
models, problem-solving assessment tools, problem-solving as a teaching method and the
identification of students’ problem-solving skills.
Researchers in the course of their studies have given different definitions of problem-solving.
A few are captured here. Heppner and Krouskopf (1987) defined problem-solving as
cognitive and effective behavioural processes for the purpose of adapting to internal or
external demands or requests. Bingham (1988) defined problem-solving as a process that
requires a series of efforts oriented towards eliminating the difficulties encountered in order
to achieve a certain objective. According to Kashani-Vahid, Afrooz, Shokoohi-Yekta,
Kharrazi, & Ghobari (2017, p. 176), “Problem solving is a self-directed cognitive-affective-
behavioural process” through which individuals or groups attempt to find effective solutions
to problems they encounter in life. Krulik and Rudnick (1980, p. 3) defined a problem as “a
situation, quantitative or otherwise, that confronts an individual or group of individuals, that
requires resolution, and for which the individual sees no apparent or obvious means or path to
obtaining solution”. Krulik and Rudnick (1980) opined that the problem-solving process
required individuals to use previously acquired knowledge, skills and understanding to satisfy
the demands of an unfamiliar situation. This implies that for one to be a good problem solver,
one ought to have acquired certain skills that could engineer the easy solving of the problem
from previous experience. The implication is that problems have some degree of difficulty
that requires special skills to tackle. The key to becoming a good problem solver lies in the
cognitive domain, since the process is a cognitive one. This study is therefore grounded in
Krulik and Rudnick’s (1980) definition of problem-solving.
Of all the various definitions of problem-solving, Mayer and Wittrock (2006, p 287)
definition of problem solving, “a cognitive process directed at overcoming obstacles” is the
most widely accepted by problem-solving advocates. According to the Meyer and Wittrock
(2006, p 287) problem-solving is a means of “transforming a given situation into a desired
situation when no obvious method of solution is available.” The various definitions presented
all have something in common, namely overcoming an obstacle to reach the desired solution.

17
These obstacles serve as barriers standing in between the problem and the solution (Funke,
2010). A popular mathematician, namely Halmos (1980, p. 519), argued that “the
mathematician’s main reason for existence is to solve problems”. Simply put, the act of
mathematics is mainly about problem-solving. This notion is supported Schoenfeld (2013)
who asserted that learners not only learn mathematics while solving problems but also
simultaneously develop problem-solving skills and strategies.
The existence of a problem lies in the fact that learners are faced with a question that they do
not recognise and where the mere application of a model is not appropriate. However, this is
seen as relative because to some learners what is required to solve a problem may be the mere
application of an algorithm (step-by-step procedure of solving a task). To others in the same
grade, it will be an arduous task to accomplish. A problem may be referred to as routine or
non-routine based on the solver’s familiarity with that particular problem. To a novice, a
particular problem may be a mountain to climb but to an experienced person, that same
problem may have an obvious solution. This argument supports the claim that to become a
good problem solver one needs to be exposed to more questions to gain the necessary
experience, as argued by Polya (1957), problem-solving is not inborn, but a skill that can be
improved over time through one's exposure to questions.
These are the skills that one gains when one studies a subject like mathematics. As noted by
the National Council of Teachers of Mathematics (NCTM, 1980), mathematics contains tools
that help one in solving problems. In the early 1980s the NCTM proposed that problem-
solving should be the priority in school mathematics (NCTM, 1980, p. 1) because of its
importance. It has been included in most mathematics curricula of which the South African
mathematics curriculum is no exception. Based on the importance of problem-solving,
Schoenfeld (1992, p. 3) opined that “the main goal of mathematics instruction should be to
train learners to become competent problem-solvers.”
2.1.2 Problem-solving skills
Problem-solving skills have been identified as one of the major requirements needed in the
job markets in most economies. As a result, there are calls for the inclusion of problem-
solving in most curricula in today’s classroom (Liljedahl, Santos-Trigo., Malaspina & Bruder
2016; OECD, 2012). Gagne (in Kim, 2014) acknowledged that “the central point of education
is to teach people to think, use their rational powers and to become better problem-solvers.”
Problem-solving has since been investigated by many researchers. Different studies have used

18
different names to describe it in literature. Bester (2014) used the terms “proficiency” and
“competence”. Scherer and Bechmann (2014) used “competence”, Renkel and Atkinson,
(2010) used “capabilities” while Awuah and Ogbonnaya (2016) used “skills” to describe a
measure of a learner’s problem-solving. For the purpose of this study, “problem-solving
skills” will be adopted because it is widely used in the literature of this field. The study,
however, adopted the Renkel and Atkinson (2010, p.16) definition of problem-solving as
“learners’ capabilities and abilities to solve problems from intellectual domains such as
mathematics” This study, therefore, measured learners’ problem-solving skills by studying
their abilities and capabilities to solve problems. Their achievement at the different cognitive
levels and with the different concepts taught in probability was used as a measure of their
skills.
2.1.3 Investigations into learners’ problem-solving skills
The studies of Lian and Idris (2006) on the algebraic problem-solving ability of Form 4
learners in Malaysia revealed that 62% of the learners had less than a 50% chance of success.
The authors used the Structure of Observing Learning Outcome (SOLO) model as a
theoretical framework for assessing the learner’s abilities in using linear equations. The
content that was investigated included linear pattern direct variation concepts of functions and
arithmetic sequences. The data collected was mainly through a written test consisting of eight
super-items of four items each. The partial credit model was used to analyse the results.
Clinical interviews were undertaken to search for illumination on the learners’ mental
processes to solve the algebraic problems. It was found that the learners had problems in the
use of algebraic symbols to generalise their thought processes. From an analysis of the
qualitative data, it was revealed that the participants seemed to be more proficient in
searching for recurring linear patterns in order to identify the linear relationship between
variables than in other areas. According to the study, they could coordinate all the
information supplied in the questions to form algebraic expressions and linear equations. The
low-ability learners, however, showed that they could master the drawing and counting
method though they did not understand the algebraic concepts. The study provides evidence
that learners have challenges in the algebraic solving of problems and thus need assistance in
the concepts of algebra. The current study would attest whether learners have problems
solving probability problems algebraically or by means of diagrams.
Chirinda (2013) used the mixed method approach, based on the constructivist model, to
research how the improvement of the mathematical problem-solving skills of Grade 8

19
learners would affect their performance and achievement in mathematics in a secondary
school in Gauteng. A teaching and learning environment, in which the presentation and
solution of problems were the main deductive mathematical activities, was created by the
author. Data was collected through a questionnaire, the compilation of a register of
mathematical problem-solving skills, direct observation and questioning of participants, semi-
structured interviews, learner journals, mathematical tasks and written tests including pre- and
post-multiple choice and a word problem test. The data was analysed using descriptive
analysis. Through analysis of the journal entries, semi-structured interviews, the mathematical
problem-solving skills register as well as participant observation and questioning, it was
found that participants in the experimental group had obtained and improved mathematical
problem-solving skills on conclusion of the intervention. The qualitative results also indicated
that the improvement of mathematical problem-solving skills enhanced learners’ performance
and achievement in mathematics. The study employed different methods of data collection
which enhanced the validity and reliability of the results, however, the study did not cover the
entire range of topics in the mathematics curriculum. This suggests that this study is a base
for further research on the topic, particularly in Grade 12 classes where the entire curriculum
should have been covered.
Mugisha (2012) studied learner performance in mathematics in open distance learning
settings. The author investigated the problem-solving skills of the University of South Africa
(Unisa) in calculus module MAT112. Data was collected from the end-of-year examination
scripts of the learners between 2006 and 2009. The researcher developed a qualitative
questionnaire from the quantitative data to give more meaning to the quantitative data. Due to
the mode of data collection, the study was time-consuming and cost efficient, however, one
may not be able to guarantee the appropriateness of the data for the purpose since it was
secondary data. Saunders, Lewis and Thornhill (2009) are of the view that secondary data
might not be qualitative enough to measure what it intended to measure and again it might be
out-dated or might have been used in previous studies for the same purpose. This limitation in
the study by Mugisha (2012) is solved by making use of primary data in the current study.
Tigere (2014) evaluated the learner problem-solving competency in respect of physical
sciences in the Highveld Ridge East and West circuits in Mpumalanga province of South
Africa. The study collected data from learners from three different schools using random
sampling. Learners were required to write a stoichiometric achievement test administered by
the physical sciences teachers at their respective schools. A memorandum was used to score

20
the test. The study investigated, among other things, the relationship between conceptual
problem-solving proficiency and algorithmic proficiency of Grade 12 physical sciences
learners. It also attempted to determine the capacity for problem-solving in respect of
physical sciences in stoichiometry, according to problem-solving strategies and the weakness
that existed in stoichiometry problem-solving that could be reflected during teaching. The
results revealed that learner proficiency in both algorithms (mean of 43. 84%) and conceptual
problem solving (19.67%) was low. Algorithm (p = 0.05; r = 0.18) and conceptual problem-
solving (P = 0.05, r = 0.18) proficiency were weakly correlated. The percentage of problems
correctly solved was the lowest (26.78%) for algorithmic solutions and 5.46% for conceptual
solutions, in comparison with the percentage of incorrect solutions (42.27%) and problems
not attempted (18.65%). The findings also revealed that there was no Grade 12 learner with
high algorithmic and high conceptual abilities. The study provides a basis for further research
in that it did not include rural, farm and private schools. The current study bridges the gap by
investigating the problem-solving skills of learners in a rural community.
Some studies have also looked at the use of different problem-solving teaching methods, e.g.
video games to teach learners problem-solving. For example, Shute and Wang (2015) used a
video game called “Portal 2” to assess the problem-solving skills of students. The participants
were 77 students from a university located in Northern Florida. Portal 2, according to the
authors, is a popular video game developed and published by Valve Corporation. It is a form
of brain-teasing game that is widely played by people of all ages. The participants were
randomly assigned to either the experimental group that played Portal 2 or the control group
that played a game developed by Luminosity. They were oriented in a laboratory at a
university across four sessions spanning 1–2 hours for a total of 10 hours. They completed an
online pre-test (50–60 minutes). After that, they were made to play their assigned game. The
last sessions saw the students completing a post-test. The findings of the study revealed that
Portal 2 has the potential to serve as a highly engaging way to measure and possibly support
cognitive skills such as problem-solving. However, the mode of data collection makes it
difficult to get a good percentage of participants as well as generalised data due to the small
number of participants involved in the study. The current study would bridge this gap by
making use of large data sets and thus findings could be generalised to other groups with the
same characteristics or features.
Dhlamini (2012) studied the effect of implementing a context-based problem-solving
instruction (CBPSI) on learners’ performance. The study employed a cognitive load theory as

21
the framework. Participants were 783 learners and four Grade 10 teachers from Gauteng
province in South Africa. Data was collected by making use of a standardised functional
mathematics achievement test. The study used “a non-equivalent control group design,
consisting of a pre- and post-measure. Classroom and semi-structured interviews were
conducted with teachers and learners.” The teachers used normal problem-solving lessons in
the four control schools while the researcher deployed CBPSI in the five experimental
schools. The design of the CBPSI was such that the learners in experimental schools were at
ease with the basic context-based problem-solving tasks that were posed to them through the
worked-out examples. A standardised functional mathematics achievement test was used as
the data collection instrument. A pre-test was given to learners to determine their initial
problem-solving status after which the intervention followed. The one-way analysis of
covariance and the analysis of variance and other statistical techniques were employed for the
data analysis. The findings revealed that the learners in the experimental schools
outperformed those in the control group. This was a confirmation that the CBPSI was an
effective instrumental tool to improve the problem-solving abilities of Grade 10 learners in
mathematics. The study challenged researchers to further examine what learners are thinking
during the process of developing problem-solving skills in mathematics. This, according to
the researcher, would explain how learners advance from basic skills to advanced problem-
solving skills in mathematics. The researcher urges that more studies be done on how
instruction can be tailored effectively to improve the problem-solving skills of South African
learners. The current study investigated learners’ problem-solving skills in a topic in
mathematics, probability, making use of Bloom’s taxonomy. The findings would demonstrate
the performance of learners at the different cognitive levels of Bloom’s taxonomy hence
bridging the gap of knowledge on what Dhlamini (2012) studied.
In Indonesia, Syafil and Yasin (2013) used a quasi-experimental non-equivalent pre-test and
post-test control group design to investigate biology students’ problem-solving skills at high
school level. The study employed a problem-based module (PBM) in teaching the
experimental group of students. The treatment group applied the PMB model in learning
problem-solving skills under the guidance of teachers and PMB was used as a framework in
their teaching and learning sessions. The students used task sheets indicating the main steps in
implementing the PMB to guide their learning activities. The teachers acted only as
facilitators. The student learning activities were structurally observed, utilising observation
sheets to monitor the learning progress in respect of problem-solving skills. The control group
was taught biology through conventional teaching methods, with the teacher guided by the

22
available lesson plan. The teaching methods only involved lectures and drills; students were
not exposed to the PMB model. Their progress was monitored through observation. The
following were used as indicators: ability to identify problems; ability to gather data; ability
to plan the solution; ability to execute the plan and solve the problem; and the ability to
evaluate the problem-solving process (Syafil & Yasin, 2013).
The post-test was conducted after the teaching and learning (T and L) session to measure the
ability of students from both groups. The students’ problem-solving skills were analysed
using descriptive analysis and inferential analysis through SPSS 18 software. The
performance of the experimental and control groups in mastering the concepts and learning
products was tested to compare the problem-solving skills of the two groups. The problem-
solving skills of the experimental group were measured as 85.47 % (very good); this was far
better than that of the control group which was measured at only 25.12% (low). Average
achievement in the experimental group was measured as 84.26% (good), while that of the
control group was 79.08% (moderate). Overall, the average of the product of the learning was
89.89% in the case of the experimental group compared to 52.10% in the case of the control
group. The findings clearly indicated that PBM can improve students’ problem-solving skills
in biology. The findings provided evidence that learners performed better when exposed to
PBM, however, the study was silent on the cognitive level at which learners performed. It
may happen that learners performed better at the lower cognitive level. This study measured
learners’ performance at the different cognitive levels of Bloom’s taxonomy, illustrating the
strengths and weaknesses of learners at these levels.
Carson (2007) conducted a study on the topic “A problem with problem-solving: Teaching
thinking without teaching knowledge” in the United States. According to Carson (2007, p.
14), “problem-solving would be more effective if a knowledge base and the application of
that knowledge were the primary principles of the theory and also practice.” In view of this,
advocates of problem-solving are proposing content less heuristic as a primary element for
the enhancement of problem-solving abilities while assigning the knowledge base and the
application of concepts or transfer to secondary status. This, according to the author,
dichotomizes thinking and knowledge as mutually exclusive domains. It was found that in the
case of solving any problem, learners would find themselves learning about all things, not
simply a heuristic related to the problem but also the algorithm. Teachers were, however,
being admonished not to teach learners only the heuristic since by so doing they will set the
learners free upon the problems of everyday life. Learners should be able to apply what they

23
have been taught to everyday problems outside the classroom. The study recommended that
teachers teach learners sound thinking skills and also the knowledge that has been used
successfully to solve problems and the reasons why they worked. This research bridges the
gap between teaching heuristic and algorithms. One can infer from this research that thinking
and knowledge are not mutually exclusive as perceived because critical thinking and
problem-solving need a great deal of specific content knowledge. Hence “problem-solving
and heuristic cannot be content-less and still be effective”, as argued by Carson (2007).
Some researchers have also investigated the factors that affect problem-solving skills of
learners. For example, Yigiter (2013) conducted an investigation into the problem-solving
skills, self-esteem and preferences of university students regarding sport and social activity in
Turkey. The study comprised 500 learners in an English preparatory programme from
different departments of the university. The study concluded that problem-solving skills were
not associated with gender or age nor did they differ according to gender and preferences in
relation to sport and social activity. But problem-solving skills are associated with some
demographic variable such as age. However, sport was found to have a positive effect on self-
esteem but not on the problem-solving skills of learners of the university. The study provides
evidence that the problem-solving skills of learners are independent of gender but dependent
on certain factors such as recreational physical activities. The current study, in addition to
investigating learners’ problem-solving skill in probability, also investigated the effect of
quintile ranking of schools (socioeconomic factor of learners) on learner problem-solving
skills.
Zanzali and Lui (2000) evaluated learners’ levels of problem-solving abilities in mathematics
in Malaysia. The study used 242 Form 4 science and non-science learners from four urban
schools selected from a Malaysian secondary school. The respondents were made to solve
mathematical problems. The tasks comprised content questions, multiple choice questions
and structured questions. Their levels of ability in using basic knowledge, the standard
procedure, as well as their problem-solving skills, were evaluated. The evaluation was done
by applying Polya’s model for solving problems. The findings revealed that the learners were
unable to use the correct and appropriate mathematical symbols and vocabulary to provide the
reasoning behind certain problem-solving procedures. The study further showed that the
learners had a good command of the basic knowledge and skills required for problem-solving,
although they did not demonstrate the use of problem-solving strategies as expected
(Lambert, 1990). The study provided a basis for further research, particularly in knowing

24
learners’ cognitive abilities, as the study was silent on that aspect. The current study looked
into the problem-solving skills of learners in terms of their levels of cognition.
Cai, Mosyer, Wang, Hwang, Nie, and Garber (2012) used problem posing as a measure of the
effect of the middle school curriculum on learners’ learning in high school. Learners who had
used a standards-based curriculum (a curriculum that used specific knowledge learning
experience to gain that knowledge, and assessment to check the mastery of the knowledge
developed by looking at the standards of the region) in middle school performed equally well
or better than learners who used a more traditional curriculum in high school. The findings
revealed that learners performed better in a standards-based reform curriculum. It was
revealed that problem posing is a better way of measuring curriculum effects on learners’
learning. A qualitative rubric as a means of assessing different characteristics of learners’
response to posing tasks was found to be useful. In this regard, the current study used both
quantitative and qualitative data to bring a more comprehensive meaning to the study.
Dunga and Baob (2017) studied Vietnamese students’ problem-solving skills in learning
about the error of measurements. The study was conducted following two parallel
approaches, by firstly analysing academic materials according to praxeological organisation
in relation to components of problem-solving skills so as to clarify the formation and
development of problem-solving skills through the evaluation system, and secondly, by
building an experiment of processing errors using statistical tools that students have learned
in the curriculum and evaluating the degree of problem-solving skills of a sample of 201
students randomly chosen in Ho Chi Minh City. The study was evaluated based on four
phases. Phase 1 presented how the students identified a solution to the problems. The results
showed that 57%, representing 115 students provided an incorrect solution, 69 of the students
representing 33% provided partially correct solutions and 10% provided the correct solution.
According to the study, few students were able to reach Phase 2 of the study. The results
show that processing errors by using statistics, as presented in mathematics and physics
textbooks did not enable the majority of students to propose a solution in the experiment. The
research questions, the practical teaching of teachers and teacher training in pedagogical
universities, as well as providing an evaluation of the reality of the current educational
system, contributed to the development of the mathematics curriculum and composition after
2018. Based on the findings of the study, the authors recommended that teacher training
should focus on the formation and development of problem-solving and an understanding that

25
is deep in terms of major knowledge (mathematical statistics) and broad in terms of relevant
sciences (theory of errors).
2.1.4 Problem-solving models
Rusbult (2000) defined a problem-solving model as an algorithmic and deductive approach to
solving a problem. This is to say there are steps that one has to follow to arrive at the desired
solution. The use of the models normally begins with a defined goal, however, previous
experience in solving a problem has been found to be helpful in reaching this goal.
Researchers like Carson (2007) referred to problem-solving models as information processing
theories because they are “concerned with the identification of the stages of problem-solving
and the cognitive process needed in sequential steps in problem-solving rather than separate
skills involved in the problem-solving process.” Wu and Adams (2006, p. 96) stated,
“Problem-solving strategies identified using these models are more likely to be of practical
use in the classroom”. It was therefore imperative to look at the different models that have
been applied in the evaluation of learner problem-solving skills. Various problem-solving
models are well documented in the literature. A few are presented in this study.
2.1.4.1 Polya’s PS model
Polya’s model is the oldest and most important problem-solving model (Bester, 2014). The
model was developed in 1945. The model which was documented in his book, How to solve
it, consisted of four stages. According to him the first stage in problem-solving is to
understand the problem as one needs to understand the problem before one can continue.
Understanding the problem has to do with understanding the language of the problem
statement, knowing what has been asked to be found or shown, being able to restate the
problem in one’s own words, being able to come up with a picture or diagram to represent
what is being asked and also to acknowledge whether there is enough data to propose a
solution.
The second stage of the model is devising a plan. According to Polya, there may be many
strategies by which a problem can be solved. This skill in choosing the appropriate strategy is
best learned by solving many problems. Some of the known strategies include looking for the
pattern, drawing a picture, using a formula to estimate and check and many more. The third
principle of Polya’s model is carrying out the plan. This step generally involves care and
patience, particularly when one has the skill. It must be noted that if the plan selected is not
working out one has to realise this and change it for another. The last stage of Polya’s model

26
is looking back. This involves a critical examination of the solution obtained to ascertain if
the result is correct or whether the plan can be used to solve another problem. These four
stages represent Polya’s model. Researchers have found that learners execute the last stage of
Polya’s model with less care. They argue that many learners believe they are done with their
mission of solving a problem and, as a result, they do not pay attention to the last stage (“look
back”) of the model (Lee, 2015). Polya’s model does not take into consideration the cognitive
demand for solving the question but looks at the stages of solving the problem irrespective of
the cognitive demand, as argued by Carson (2007).
The literature review also found certain models used to evaluate mathematical problem-
solving that were similar to Polya’s model. Prominent among these were the models
described by Schoenfeld (1987), Meyer and Hegarty (1996), Stilman and Galbraith (1998),
Weber and Caslon (2010) and Zakaria and Yusoff (2009).
2.1.4.2 Schoenfeld’s PS model
Schoenfeld (1987) came up with a problem-solving model which had characteristics of
Polya’s four-stage model. According to him, the first stage needed in solving a problem was
resources. This he explained as a proposition and procedural knowledge. The second category
one had to handle before a problem could be solved was the heuristic. By heuristics, he meant
knowing different strategies and techniques in solving the particular problem, e.g. working
backwards or drawing figures. The third, according to Schoenfeld, was the implementation,
that is the decisions about when and what resources and strategies to use, and lastly the fourth
was the interpretation. This explains the worldview that determines how a mathematical
problem is approached.
Schoenfeld (1987) is well known for his work in metacognition. Metacognition is higher
order thinking that allows the student to understand, analyse and control his or her cognitive
processes, especially when engaged in learning. In summary, Schoefield said that for one to
be able to solve a problem successfully one should have known about the question. After
reading the question the problem solver should be able to analyse and explain the question.
Correct analysis and explanation would serve as an indication of the understanding of the
problem; thus the ability to solve it. In doing this the problem solver would be able to come
up with a formula that would assist in the solution of the problem. Implementation is very
important here, entailing substitution and evaluation to identify the unknown variables in the

27
question. Afterwards, the last step demands that the problem solution should linked the
question to the answer by giving a vivid explanation of the solution.
The models of Schoenfeld and Polya models have some similarities. The major difference is
the addition of exploration to Polya’s model. According to Schoenfeld, “Exploration is the
heuristic ‘heart’ of the strategy. It is in the exploratory phase that problem-solving heuristics
come into play” (p. 802). His implementation and verification are very similar to the phases
of Polya’s model. One difference lies in the phase of design and that of Polya of devising a
plan. Schoenfeld (1980, p. 802) describes phase design as it “entails keeping the global
perspective on the problem and proceeding hierarchically”. The design and the exploration in
Schoenfeld have a cyclic nature. This is because after exploring the problem, the solver can
either return to design a plan or re-enter the analysis phase. This also brings a major
difference to that of Polya as that has been argued to be presented in linear steps (Wilson,
Fernandez & Hadaway, 1993).
2.1.4.3 Stillman and Galbreath’s PS model
Stillman and Galbreath (1998) applied a model based on information processing to research
the cognitive and metacognitive aspects of problem-solving in mathematics using a test
population of females in a secondary school mathematics course. Their model had four
phases, namely: “information gathering, information representation, search and information
processing and lastly, information validation” (Stillman & Galbreath, 1998, p. 27). The
phases were similar to those of Polya’s model. Comparing the two, information gathering
aligns well with “understanding the problem” of Polya; information representation also aligns
well with “making a plan”; search and information processing also aligns well with “execute
the plan”; and lastly information validation with “look back” in Polya.
2.1.4.4 Wu and Adams’ PS model
The model for problem-solving by Wu and Adams (2006) linked problem-solving and
cognitive processes. The model identified specific weaknesses of learners in solving
mathematical problems. It was a four-stage model consisting of reading or extracting
information from the question, a real-life and common sense approach to solving problems,
mathematics concepts, mathematisation and reasoning and lastly applying standard computational
skills and carefulness in carrying out computations (Wu & Adams, 2006).

28
Wu and Adams’ (2006) model served to solve the cognitive processes found in a task which
can be used as a problem-solving skill profile of learners. However, the framework does not
provide for the assessment of reflection or the interpretation of the results learners may
encounter.
2.1.4.5 Yimer and Ellerton’s PS model
Yimer and Ellerton (2006) proposed a five-stage model that assists learners in developing
their ability to monitor their own problem-solving activities. They used empirical data from a
study of pre-service teachers doing mathematical problem-solving that was not of a routine
nature. The five phases used were “engagement, transformation, formulation,
implementation, evaluation and internalization” (Yimer & Ellerton, 2006, p 16). Yimer and
Ellerton, (2006) showed aspects of mathematical problem-solving by pre-service teachers.
Their model had a reflection at each phase of the problem-solving process. This was the main
difference between their model and other models.
2.1.4.6 Zakaria and Yusoff’s PS model
Zakaria and Yusoff’s (2009) model to study problem-solving skills in algebra was based on
Mayer’s (1992) model. Their model consists of “problem translation and integration, solution
planning and monitoring and solution execution” (Zakari & Yusoff, 2009). The model’s first
three stages align well with the first three phases of Polya. This model, however, does not
have the interpretation of results as we have in Polya.
2.1.4.7 Marriott, Davies and Gibson’s PS model
Marriott, Davies and Gibson (2009) developed a problem-solving model as follows: specify
the problem and plan; collect data; process and represent; and lastly interpret and discuss. The
model by these authors' model does not differ greatly from the one presented above. They
believe the person solving the problem must be able to identify the problem and come up with
a plan, which in most cases would be a formula to solve the problem. They are of the opinion
that the problem solver, after reading the problem, should be able to extract the information
given in the question and identify the unknown. Afterwards, the problem solver would have
to process the information and represent the information diagrammatically. Then the problem
solver should come up with a formula to solve it. The last step involves the interpretation of
results and discussions.

29
Many other scholars have proposed other problem-solving models (Anderson, Mitchell &
Osgood, 2008; Krutetskii, 1976; Rott, 2012). It should be noted that all these models require
the problem solver to have knowledge of a sort about the question being asked to be able to
solve the problem. This suggests that one’s ability to solve a problem is in one way or the
other dependent on the individual’s previous knowledge on the said concept. The act of
collecting the data and brainstorming the appropriate method required to solve the problem is
present in the skills in solving a problem.
2.1.5 Evaluation of problem-solving skills (PSS)
A review of the literature showed that different problem-solving models, educational
strategies, taxonomies and methods have been employed to evaluate students’ PSS across
disciplines. For example, Bester (2014), Brijlall (2015) and Lupahla (2014) used Polya’s
1945 four-stage problem-solving model to evaluate students’ problem-solving skills. Dunga
and Baob (2017) evaluated student problem-solving skills by analysing academic materials
and also building an experiment researching processing errors by using the statistical tools
that the students had learned. Dimitriou-Hadjichristou and Ogbonnaya (2015) used Bloom’s
taxonomy to evaluate students’ problem-solving skills. These methods have been used to
evaluate PSS across disciplines. For the purpose of this study, Polya’s model and Bloom’s
taxonomy will be discussed because of their extensive use in the literature on this subject.
Polya’s 1945 model is one of the oldest and most used models to solve mathematical
problems. According to Schoenfeld (1987), Polya’s (1957) work presented two themes
looking at the basis of mathematical thinking, namely “order” and “discovery”. His model
consists of four stages that can be used to solve problems of any kind. The four stages are:
understanding the problem, devising a plan, carrying out the plan and looking back. Several
studies have used Polya’s method in evaluating PSS. Examples of such studies include
Brijlall (2015) who used the model to evaluate students’ problem-solving skills during
collaborative learning in studying the mathematical topic, fractions. The study was a small-
scale action research that used 47 Grade 10 learners in a South African middle school as
participants. The participants from two classes attempted to solve tasks involving the concept
of fractions. In one class the learners were assigned to work together in groups while
participants in the other class would work individually. Qualitative methods were used for
data collection and analysis. Most of the stages of Polya’s problem-solving model were
discernible in the groups working together. The study helped to identify the stages in the
model that promoted effective problem-solving. The study made recommendations to

30
mathematics classroom practitioners regarding problem-solving. The study recommended that
learners should be viewed as intelligent and creative individuals whose questions are
important and that more time should be awarded for discussion.
In a similar study, Bester (2014) measured learners’ level of problem-solving by making use
of Polya’s four stages of problem-solving as a departure point. The study used 128 second
year marketing learners offering quantitative techniques from Walter Sisulu University in
South Africa. The instruments utilised to collect data included a written test and
questionnaire. A profile of participants’ problem-solving was constructed. Learners’ strengths
and weaknesses as demonstrated in problem-solving were investigated. The findings of the
study revealed that 72.29% achieved the highest marks in understanding a problem.
Participants that were able to solve the problem comprised 73.77% of the students. The
findings revealed that 29.38% of the participants of the study could interpret their results. The
study recommended that the curriculum be revised to include course material on problem-
solving in order to improve learners’ proficiency in problem-solving.
Lupahla (2014) used Polya’s problem-solving model to document the level of attainment of
problem-solving skills among Grade 12 learners from the Oshana Region in Northern
Namibia. A computer-aided algebraic problem-solving assessment (CAAPSA) program was
used. A mixed method triangulation design was employed, while the data collection
instruments consisted of a knowledge-based diagnostic test and an algebraic problem-solving
achievement test, as well as an item analysis matrix, used to evaluate the alignment of
examination content with the curriculum and its assessment objectives. A purposively
selected sample consisting of learners’ solutions, the questionnaire utilised and the transcripts
of the interviews conducted were analysed. It was reported that 83% of the learners
performed below the trends in mathematics, science and technology education (TIMSS)
Level 2 (low) in mathematical problem-solving skills, while there was a correlation of r = 0.5
(Pearson correlation coefficient) between the achievement in the knowledge base and the
problem-solving test. The correlation between the learners’ achievement in the algebraic
problem-solving test and their achievement in the final Namibian senior secondary school
certificate examination of 2010 was r = 0.7. Polya’s first step was identified as presenting
problems for learners in respect of the reading as well as the understanding of the problem.
The study found that the algebraic approach was the most successful solution strategy.

31
The findings of the study, however, did not conform to those of Lian and Idris (2006) or the
findings from the report of the TIMSS study result as reported. Learners performed better in
the use of algebraic strategy in solving problems, according to Lupahla (2014). However, the
reason for learners’ poor performance in the TIMSS study can be attributed to the use of a
purposive sampling technique instead of a random sampling technique. Polya’s problem-
solving model has been used extensively to evaluate learners’ problem-solving skills,
however, researchers still contend that the phases of the model are often presented in linear
steps and thus there is a need to use a framework that emphases the dynamic and cyclic nature
of genuine problem-solving (Wilson, Fernandez & Hadaway, 1993).
Bloom’s taxonomy has been applied broadly to align course objectives and the curriculum
level of skill achieved by learners (Dettmer, 2006; Green, 2010). For example, Scott (cited in
Nafa, Othman & Khan, 2016) noted that the taxonomy has been applied to the education
domain of computer science for course design and evaluation, for structural assessments
(Lister & Leaney, 2003) and also for comparing the cognitive difficulty level of computer
science courses (Olivier, Dobele, Greber & Roberts, 2004).
McBain (2011) used Bloom’s taxonomy to evaluate learner problem-solving skills by
measuring their cognitive levels. The aim of the study was to examine what level on the scale
students were able to attain, in order to better understand higher order thinking skills. Two
classes of senior high school students participating in the same bilingual programme for five
years were assessed through the quality of their interaction in a social studies project. The
questions given were graded from simple knowledge questions to more complex evacuation
problems. The results indicated a difference in both classes between those who could answer
the questions and those who could not with respect to their understanding of the different
levels of Bloom’s taxonomy. Of the learners, 41.66% were found to have a sound knowledge
of the six levels of Bloom’s taxonomy while the remaining learners showed less
understanding of the levels. The gap became more prominent as they attempted the more
complex questions higher up the scale. The study recommended further research in the area of
materials development, which focuses on higher order thinking skills, in order to encourage
students to study more in-depth and so develop problem-solving skills ranked higher on the
scale of Bloom’s taxonomy. This could improve their motivation, self-regulation and critical
thinking skills.

32
Dimitriou-Hadjichristou and Ogbonnaya (2015) used Bloom’s taxonomy to evaluate students’
problem-solving skills when studying the effect of Lakatos’ heuristics method utilised to
teach the surface area of a cone (SAC), on students’ learning. The study involved 198 Grade
11 students from two schools in Cyprus. (Of these 98 were in the experimental group while
100 were in the control group). A pre-test semi-experimental research design was utilised in
the study. Data was collected making use of a cognitive test, lesson observations, interviews
and a questionnaire. The inferential statistical analysis was applied to the data while making
use of the Oh (2010) model of an enhanced conflict map. Differences in students’
performance within the group were monitored over a period of time. Students in the
experimental group achieved a mean score double that of those in the control group. The
Lakatosian method of teaching had a significant positive effect on students’ achievement at
all levels from the post-test to the delayed test. This was especially true of higher order
thinking levels (application and analysis and synthesis levels).
Karaali (2011) applied Bloom’s taxonomy to the calculus classroom and proposed utilisation
of the evaluation level, the highest level during mathematics lessons. This author was of the
view that most textbooks rarely gave examples of activities that involve the higher cognitive
levels of synthesis, analysis and evaluation and, as a result, learners tended to achieve low
marks for questions in this category. Based on this, Karaali concluded that evaluative tasks
have a place in the mathematics classroom and that teachers should incorporate questions on
this level in teaching the subject.
Radnehr and Almolhodaei (2010) used the cognitive process of the revised Bloom’s
taxonomy to study learners’ mathematical problem-solving skills. Their results showed that
there was a difference between learners' mathematical performance in each category of
knowledge dimension. Their findings also revealed that learners’ mathematical achievement
decreased from “remembering” to “creativity” for each category of knowledge dimension.
The authors pointed out that learners performed better in remembering mathematical
objectives than in any of the other five cognitive levels. They also achieved a better result in
“application” questions than in “comprehension” questions. These authors saw that there was
no significant difference between achievement in analysis questions and achievement in
evaluation questions. According to their study, learners were less successful with questions
that demanded creativity. The findings of this study align well with those of Karaali (2011).

33
Karns, Burton and Martin (1983) studied six principles of economic tests and the instruction
manuals. They followed it with a content analysis. The study determined if questions
contained in the instruction manuals really measured the level of achievement of the stated
course objectives. The findings revealed that the higher order thinking levels of Bloom’s
taxonomy were less addressed in most textbooks than the lower cognitive, knowledge,
comprehension and application levels. This finding was a confirmation of what most studies
had revealed. Ighbaria’s (2013) analysis of six units of Grade 9 English textbooks revealed
similar findings, as reported in most studies, however, there was a small deviation in his
study. The study found that the analysis level appeared at a percentage almost equal to that of
the knowledge level.
The investigation done by Ibrahim (1998) in Iran among Grade 6 history books revealed that
of the 87 questions that he found in the books, 72% of the questions were asked on the
knowledge cognitive level of Bloom’s taxonomy. A total of 25.4 % of the questions were on
the comprehension level and 2.2% on the evaluation level. The results revealed that
application, analysis and synthesis questions recorded 0% in the analysis. The findings did
not differ from those of Ighbaria (2013). It is evident that teachers pay scant attention to
higher order questions.
The reviews have shown that a majority of studies used both Polya’s model and Bloom’s
taxonomy in evaluating learners PSS. However, a well-organised and developed examination
question, according to Bloom’s cognitive thinking skills, contributes to an increase in
learners’ performance. Learners’ performance mostly depends on how they perform in tests,
quizzes, final examinations and assignments. Good tests, quizzes, final examinations and
assignments must provide the same level of cognitive thinking skills to all learners on what
they have learned (Ghulman & Mas’odi, 2009). This aligns well with Phan's (2014, p. 17)
statement that “students problem-solving skills in learning mathematics is a combination of
competences expressed through activities in the problem-solving process.” In this regard, in
the process of drawing up examination questions, it is imperative to fairly represent all of
Bloom’s cognitive levels in the question.
2.1.5.1 Probability
Probability can be thought of as a numeric measure of the chance or likelihood that a
particular event will occur (Anderson, Sweeney, & Williams, 1999). It is expressed as a
decimal fraction between 1 and 0 or as a percentage. An event with a probability of one or

34
100% is considered to be certain while an event with a probability of 0% is considered
impossible. Bhat (1999, p. 1) also defines probability as “a measure of the chance of
occurrence of events”. This implies that many events cannot be predicted with total certainty.
Examples of the uncertain nature of probability are found in the medical field. A medical
practitioner may want to know the success rate of a surgical operation on a patient. This
means knowing the chances of the patient surviving after the operation. In sports, for example
football, a coin may be tossed before play begins to determine which team starts the match.
Before the toss, both teams have a 50/50 chance of starting. The ages of a group of people can
be used as guidance by individuals such as financial advisors to help their clients plan for
retirement. Predicting the weather is another area of uncertainty. Before planning an outdoor
event, people will research the chances of rain. Likewise, the meteorologist will make
predictions based on historical data on temperature. The frequencies of natural disasters are
also predicted by chance. This and many other applications of the concept of probability
make it imperative to study it in schools.
Though the concepts of probability have been around for thousands of years, probability
theory became part of mathematics during the mid-17th century; however, the 15th century
saw the emergence of several works on probability (David, 1962). David acknowledged
Pascal and Fermat, the mathematicians ascribed with the work on probability theory. Pascal
and Fermat tried to answer the question put forward by de Méré on the throwing of dice in
getting good returns in gambling. The mathematicians exchanged a series of letters to share
ideas on the question posed, which eventually brought about the fundamental principles of
probability theory (David, 1962). The two mathematicians gave birth to the classical
definition of probability which is defined as “given ‘n’ equally likely outcomes, of which’
outcomes correspond to winning, then the probability of winning is 𝑚
𝑛” (David 1962). This
definition is applicable to equally likely outcomes. This is a limitation since it is not always
possible and even difficult to identify when probabilities are equally likely. As a result, the
frequency definition emerged. The frequency approach, which is also referred to as the
experimental approach, involves the repetition of events under the same conditions. The
probability of success is then given as the proportion of successes. In 1713 Bernoulli found
the result of the two definitions to be consistent with each other (David, 1962).
However, Christian Huygens, the Dutch scientist, was the first to publish a book on
probability entitled De Ratiociniis in Ludo Aleae in 1967. According to David (1962), de

35
Moiré contributed immensely in making probability popular in the 18th century. He is said to
have introduced the multiplication rule and many other important concepts. The author
mentioned that Laplace expounded new concepts and mathematical techniques in his book,
Théorie Analytique des Probabilités in 1812. David (1962) also considered that the
probability theory was in earlier times only concerned with developing a mathematical model
for games of chance. Pierre de Laplace, as he is popularly known, used the principles of
probability to solve numerous scientific problems at the time. Chebyshev, Markov, von
Mises, and Kolmogorov were keen mathematicians who also contributed to the theory of
probability (David, 1962). According to David (1962), the definition of probability was not
very clear, thus there was an attempt to find a universally acceptable definition. This took
nearly three centuries and led to much exchange of views. The matter was eventually resolved
in the 20th century by putting probability theory on a sound axiomatic basis. In 1950,
Kolmogorov came up with the axiomatic approach of defining probability and this forms the
foundation for the modern theory. Probability theory has since become part of a more general
theory known as measure theory (David, 1962). The axiomatic definition of probability
defines probability based on axioms, namely P(E) ≤1 and the P(S) =1 where E is an event and
S represents sample space.
2.1.5.2 Probability in the South African school curriculum
Probability is one of several new topics recently launched in the South African school
mathematics curriculum, namely CAPS. CAPS, introduced in 2011, replaced the National
Curriculum Statement (NCS), which had provided the prevailing framework until 2010. Until
the implementation of the CAPS document in 2014, the Grade 12 mathematics examinations
comprised three different papers with Mathematics Paper 111 being an optional paper. CAPS
moved the examination of probability to the two compulsory mathematics examination
papers, Papers 1 and 11 instead of examining it in the optional Mathematics Paper 111, as
was the case for NCS. The CAPS document saw changes in the form of the addition and
removal of certain topics from the mathematics examination guidelines. Probability became
compulsory and was to be examined in Mathematics Paper 1.
In the CAPS document for Grades 10–12, probability and statistics now form part of the ten
main topics (Department of Basic Education [DBE], 2011). According to DBE (2011),
learners in South Africa are introduced to the topic probability for the first time in their
mathematics studies under the topic “data handling” in the intermediate phase in Grade 4. At

36
this basic level learners study chance and are tasked with the comparison and classification of
events such as:
i. Certain that they will happen;
ii. Certain that they will not happen;
iii. Counting the number of possible outcomes for simple trials (DBE, 2011, p. 11).
According to the intermediate phase CAPS mathematics curriculum,
... the study of chance develops learners’ awareness that different situations have different
probabilities of occurring and ... for many situations there are a finite number of different
possible outcomes (DBE, 2011, p. 11).
This helps learners to develop skills and techniques for understanding randomness and
uncertainty and making informed choices and coping with probability in real-life situations.
Learners do not calculate the probability of events occurring at this level (DBE, 2011).
In Grade 5, learners compare and classify events on a scale from:
i. Certain that they will happen to certain that they will not happen;
ii. List possible outcomes for simple experiments like tossing a coin, rolling a dice, spinning
a spinner;
iii. Counting the frequency of the actual outcomes of a series of trials are also discussed in
this grade (DBE, 2011, p. 31).
In Grade 6, learners are introduced to predicting likelihood of events
... based on observation and places thrown on a scale from ‘impossible’ to ‘certain’; like
possible outcomes for simple experiments tossing a coin, rolling a dice and spinning a
spinner; and counting the frequency of actual outcomes for a series of up to fifty trials (DBE,
2011, p. 25).
Learners in the senior phase (Grades 7–9) perform experiments where the possible outcomes
may be equally likely and document the possible outcomes based on the conditions of the
event to ascertain the frequency and actual outcomes and subsequent probability of each
possible outcome, using the relative frequency definition. Learners at this level are taught
how to give reasons for the probabilities of events. They are also introduced to “the use of
two-way tables and tree diagrams to determine the probabilities of outcomes of events and
predict their relative frequency in simple experiments” (DBE, 2011, p. 36).

37
It can be seen that if probability lessons are well taught from Grade 4 to Grade 9, one would
not expect learners to have problems at the FET phase since almost all the terminologies they
need at that phase are discussed. In Grade 10, according to the CAPS,
Learners are expected to learn the use of probability models to compare the relative
frequency of events with the theoretical probability, the use of Venn diagrams to solve
probability problems and deriving and applying the following for any two events A and B in
a sample space S: “P (A or B) = P (A) + P (B) – P (A and B). If P (A and B) ≠ 0; A and B are
mutually exclusive if P (A and B) = 0; A and B are complementary if they are mutually
exclusive; and P (A) + P (B) = 1, then P (B) = P (not A) =1- P (A)” (DBE, 2011, p. 29).
Learners in this grade are expected to have an understanding of the basic terminologies they
learnt on probability in the lower grades, such as events, sample space, trial and experiment
as well as the definition of probability as stipulated in the CAPS document. It also includes
the terminologies: and, or, union, intersection, disjoint, randomness, null, baseness and their
different notations which are expected to be explained to learners. An example of questions
given to learners is:
In a survey, 80 people were questioned to find out how many read newspaper S or D or both.
The survey revealed that 45 read D, 30 read S and 10 read neither. Use a Venn diagram to
find how many read S only; D only: both D and S (DBE, 2011).
In Grade 11, the probability is taught in Term 4. The probability component at the end-of-
year examination in Grade 11 is 20±3 of the total mark. They are expected to be able to
“identify dependent and independent events and the product rule for independent events”.
They must also be able to use “Venn diagrams to solve probability problems” and derive and
apply “formulae for any three events A, B and C in a sample space S” (Department of Basic
Education, 2011, p. 38), They are also expected “to use tree diagrams to solve probability
problems and solve consecutive or simultaneous events which are not necessarily
independent” (DBE, 2011, p. 38). The contingency table as a means of solving probability
problems is introduced. The idea of dependent and independent events is also explained.
Learners are expected to be able to show if events are dependents or independents. Examples
of questions given in Grade 11 include determining if two events are mutually exclusive, or
independent.
Examples:
1. P (A) = 0.45, P (B) = 0.3 and P (A or B) = 0.615. Are the events A and B
mutually exclusive, independent or neither mutually exclusive nor independent?

38
Find the probability of an event making use of a tree diagram, Venn diagram or
contingency tables.
2. What is the probability of throwing at least one six in four rolls of a regular six-
sided dice?
Find the probability of an event making use of the Venn diagram.
3 A study was done to test how effective three different drugs, A, B and C were
in relieving headaches. Over the period covered by the study, 80 patients were
given the opportunity to use all three drugs. The following results were
obtained; from at least one of the drugs
40 reported relief from drug A, 35 reported relief from drug B, 40 reported
relief from drug C, 21 reported relief from both drugs A and C, 18 reported
relief from drugs B and C, 68 reported relief from at least one of the drugs, 7
reported relief from all three drugs.
3.1 Record this information in a Venn diagram.
3.2 How many patients got no relief from any of the drugs?
3.3 How many patients got relief from drugs A and B, but not C?
3.4 What is the probability that a randomly chosen subject got relief from at
least one of the drugs? (DBE, 2011, p. 38).
In Grade 12 the topic is taught in Term 3. The total mark allocation in the Grade 12
examination is 15±3 (DBE, 2011, p. 49). The curriculum stipulates that learners revise the use
of Venn diagrams to solve probability problems, to use a tree diagram to solve probability
problems, use two-way contingency tables and other techniques (e.g. the fundamental
counting principle, where events are not necessarily independent) and apply fundamental
counting principles to solve probability problems.
Questions given to learners in Grade 12 include questions on all the concepts in taught in
Grades 10 and 11 as well as questions based on fundamental the counting principles (FCP).
Examples of FCP are: To determine the number of ways of arranging objects given or not
given any restrictions.
Examples:
1. How many three-character codes can be formed if the first character must be a letter and
the second two characters must be digits?
2. What is the probability that a random arrangement of the letters BAFANA starts and ends
with an ‘A’?

39
3. A drawer contains twenty envelopes. Eight of the envelopes each contain five blue and
three red sheets of paper. The other twelve envelopes each contain six blue and two red
sheets of paper. One envelope is chosen at random. A sheet of paper is chosen at random
from it. What is the probability that this sheet of paper is red? (DBE, 2011, p. 49).
2.1.5.3 Studies on teaching and learning of probability
Makwakwa (2012, p. 21) explored the “problems encountered in the teaching and learning of
statistics among Grade 11 learners.” The author used a convenient sample of a hundred Grade
11 mathematics teachers and 448 Grade 11 mathematics learners in the study. A
questionnaire, a classroom observation schedule, teacher interviews and a diagnostic test were
the methods of data collection used for the teachers. The learners were required to write a
diagnostic test and data was also collected using classroom observation and a learner
questionnaire. The study revealed that
The learners experienced difficulties in using graphs to predict the results of data values;
interpreting and determining measures of dispersions; computing quartiles when the total
number of data values was even or representing data on graph or plots (Makwakwa, 2012).
In addition, interpreting and determining measures of central tendencies were found to be a
challenge for the learners in the study. They also had difficulties in constructing and
interpreting probability graphs and tables and interpreting probability terminologies, lack of
statistics content knowledge, inadequate textbooks and in-service programmes which did not
cover statistical topics or which did not pay adequate attention to probability.
Furthermore, the study found “teachers’ failure to attend in-service teacher workshops to be
the cause of the teachers’ difficulties in the topic.” The study further revealed that
... the causes of learner difficulties were the inadequate teaching of statistics topics in
previous grades, teachers’ lack of content knowledge, inadequate learning materials, and
learners’ inability to use the statistical function mode on their calculators and learners’ lack
of conceptual knowledge of certain topics in statistics” (Makwakwa, 2012, p. 126).
The author recommended that teachers receive financial support to attend in-service educators
and training programmes, textbooks should be well written and contain all the information
necessary to teach data handling and probability and lastly, more INSET programmes on
probability, preferably a five-day workshop, should be arranged for teachers.

40
In a similar study, Adu and Gosa (2014) investigated the teaching and learning of data-
handling in primary schools in South Africa. The study identified the
inability of teachers to explain and understand the CAPS, pedagogical content knowledge
(PCK), subject matter knowledge (SMK) and pedagogic knowledge (PK), lack of
mathematics problem-solving skills, language difficulties, inadequate statistical qualification
and an inadequacy of the prerequisite skills, facts and concepts to be the factors that affect
the teaching and learning of data handling in mathematics in primary school (Adu & Gosa,
2014).
The study found that in-service training of teachers through distance learning did not provide
much assistance due to the challenges mentors had in visiting distant schools, especially those
in rural areas. The researchers recommended that mathematics teachers should endeavour to
identify their challenges, especially in the concepts of data handling, and devote more time to
them in order to enhance learners’ achievement. They also urged the government to intensify
teacher development to prepare teachers for the implementation of the CAPS and offer in-
service training in the form of professional development to principals and teachers,
particularly those from underperforming schools. With regard to learner support material, the
study recommended that training be provided in line with former President Jacob Zuma’s call
in the 2016 State of the Nation address emphasising the need for more focus on the triple T,
Teachers, Text and Time:
We will double our efforts of providing high-quality workbooks in literacy and numeracy to
Grade 1–6 learners and life skills, these support materials should be given to learners (Adu &
Gosa, 2014, p 819).
The implications of the study led to the need to research Grade 12 learners’ problem-solving
skill in probability, where the entire concept of the topic is covered.
In China, Jun (2000) investigated Chinese students' understanding of probability using SOLO
taxonomy to describe learners’ hierarchical understanding of probability concepts. The study
revealed that there was no improvement at the developmental level at Grades 6 and 8.
However, Grade 12 learners had a better understanding than the younger learners. The study
also revealed that learners’ understanding of the frequentist concept of probability was the
weakest. Learners in the study had at least one misconception related to the frequentist
definition of probability in the written questionnaire. The results of the findings, however,
revealed that a short intervention could help learners overcome some of their misconceptions.

41
The outcome approach showed little change regarding the understanding of equiprobability
definition.
In a similar study, Laridon (1995) investigated the intuitive probability concepts in South
African adolescents (ages ranged between 14 and 15 years) from 14 schools in the
Witwatersrand and Transkei areas. The learners were given a pre-test and post-test. His
findings revealed that the learners’ responses to the questionnaire were similar to those
obtained from learners in the United Kingdom. South African learners were found to have
had misconceptions about probability. They exhibited misconceptions in equiprobability bias.
(Equiprobability bias is the tendency to believe that every process in which randomness is
involved, corresponds to fair distribution; equal probabilities for any possible outcome). The
findings also revealed that tuition did not significantly improve learners' performance. His
conclusion was that learners assimilate the formal learning of probability into intuitive and
experimental knowledge. There was little effect on the formal tuition on South African
learners' probabilistic thinking. This he attributed to the ineffective teaching of the concepts.
The study, however, did not go into detail regarding the standard of the teaching.
Fischbein, Nello and Marino (1991) explored the effect of the instruction on children’s
probabilistic thinking. The study showed that there was a significant difference in the
performance of children who were nine years and older. The study further showed that the
formal instruction that was designed by researchers themselves saw that children were able to
evaluate chance successfully. Castro’s (1998) work on the teaching experiment among 14 to
15-year-old Spanish learners revealed that teaching had a significant impact on learner
performance.
De Kock (2015) examined the mathematical, content knowledge (MCK) of teachers (n = 8)
on the topic probability in relation to the performance of Grade 11 (n = 89) and Grade 12 (n =
75) learners on the same topic in the Gauteng province of South Africa. By investigating the
qualifications, years of experience in teaching mathematics, professional development
sessions (organised by the DoE) they were involved in, as well as examining written
responses on examination-type questions on probability (Test 1), the teachers’ MCK was
examined. The performance of new learners was examined by assessing their written
responses on the same topic in the final Grade 11 examination (November 2013) and Grade
12 preparatory examination (September 2014).

42
The findings revealed that despite the fact that the teachers were qualified (all having a
teaching diploma or a degree), their average score in the test was 73% on Test 1. However, it
must be noted that the teacher with the most teaching experience excelled above all others in
the test. The results of the study also revealed that teachers teaching with diploma
certification outperformed those teaching with degree certification. It must also be noted,
however, that the teachers with a diploma qualification had more experience than those with a
degree. Furthermore, the teachers felt that the professional development sessions that they
attended did not contribute to the improvement of their MCK on probability. The results also
revealed that the performance of the learners on the topic was consistent with the poor
performance of learners in mathematics benchmark tests. On average, Grade 11 learners
scored 48% and Grade 12 learners scored 30%. The study recommended that an investigation
should be conducted into the content of diploma courses that the diploma teachers offered and
compare it to that of the teachers holding a degree. Finally, it must be noted that although the
study provided vital information that could go a long way to help the educational fraternity,
generalising the findings should be done with caution due to the small number of participants
used in a study of this nature.
In a similar study, Kodisang (2015) employed a qualitative approach to understand teachers’
insight into the teaching of probability to Grade 6 learners in the Nkangala district in
Mpumalanga province, South Africa. The author deployed two instruments to collect data in
the study, namely interviews and observations. The data was analysed using thematic
analysis. The results of the study indicated that the participating teachers used teaching and
learning approaches such as cooperation, discussion and problem-based approaches to
enforcing learners’ understanding of probability (Kodisang, 2015). However, it was found
that teachers’ knowledge on how to implement various teaching-learning approaches was
limited (Kodisang, 2015).
Bayaga (2010) studied the constraints of learning on statistics and probability education in
South Africa. The participants of the study were 43 students offering postgraduate
programmes of education (PGCE) at the University of Fort Hare in South Africa. They used
the mixed method approach in the study. Their findings revealed that students receiving
precise instructions on how to solve problems improved their ability to think statistically.
They also found that there was good reason to suggest that students’ level of specific
mathematical skills impacted their statistical ability. However, there was not enough
supporting evidence to support the belief that students’ intuitive notions of probability

43
become stronger with an increase in age. The use of computers in guiding the design of
instructions is an important component of statistics learning.
Danisman and Tanisli (2017) explored probability-related pedagogical content knowledge
(PCK) of secondary school mathematics teachers in terms of content knowledge, curriculum,
knowledge, student knowledge and knowledge of teaching methods and strategies. The
participants were three teachers from three secondary schools in Turkey. Data was collected
through observations and semi-structured interviews that were analysed using a deductive
approach (Danisman & Tanisli, 2017). The findings indicated that the PCK of these three
secondary school mathematics teachers about probability was insufficient. Furthermore,
teachers’ beliefs were the most important factor impacting their PCK (Danisman & Tanisli,
2017). Another finding was that the professional experience of the teachers had a partial
effect on their PCK.
2.1.5.4 Challenges facing the teaching and learning of probability in South Africa
According to Makwakwa (2012, p. 3),
Mathematics teachers are the implementers of the mathematics curriculum, however,
research literature has revealed that a significant number of mathematics teachers in South
Africa encountered data handling and probability for the first time in 2006 when the topic
became part of school mathematics in the Further Education and Training (FET) phase.
This author pointed out that probability was initially only treated as a component of statistics
at the tertiary education level in South Africa: “This is an indication that most South African
teachers who are teaching mathematics in the secondary schools have never studied the topic
when they themselves were at secondary school or college of education” (Makwakwa, 2012,
p. 3). The question then arises: How can one give what he/she has not received?
The poor state of learners’ underperformance in probability in South Africa, especially among
those in rural schools (Adu & Gosa, 2014), has also been linked to “imbalance in the
educational system caused by the apartheid government” (Ogbonanaya, Mji & Mohapi,
2016). Sayed (2002) noted that the majority of educational training in black colleges of
education was focused on the humanities and arts subjects, leading to the underdevelopment
of mathematics and science education. Rakumako and Laugksch (2010) opined that the black
teachers trained in the apartheid era only had a three-year College of Education Diploma and
the quality of the training, especially in mathematics, was of a poor standard. In addition,

44
learners’ underperformance has also been blamed on the fact that teachers of mathematics
lack experience (DBE, 2015, p. 162).
Makwakwa points out that “Initiatives that aim to provide teachers with the necessary content
knowledge and skills to teach statistics and probability have been organized by both non-
governmental and governmental organizations” (Makwakwa, 2012, p. 4). These organisations
include the South African Statistical Association (SASA), Statistics South Africa (Stats SA)
and the Association for Mathematics Education of South Africa (AMESA). The Institute for
Science and Technology Education (ISTE) of the University of South Africa (Unisa) has also
offered workshops during winter vacations for mathematics teachers on how to teach some
mathematics topics, including statistics.
These initiatives are intended to improve and upgrade teachers’ knowledge of data handling
and probability content, among other aspects. Ogbonnaya and Mogari (2014) stated that when
a teacher lacks content knowledge in any subject or curriculum, the effect will be seen in their
learners’ performance. One can, therefore, identify teachers’ content knowledge as one of the
major causes of learners’ poor performance in probability.
Wessels and Nieuwoudt (2010) investigated the knowledge and confidence of teachers in
Grades 8 and 9 on data handling and probability in South Africa. The study was motivated by
the continually disappointing mathematics results of learners across the country. They
adapted Watson’s profiling instrument and used it to profile participants consisting of 90
mathematics teachers in Pretoria. The findings revealed that despite support through in-
service training on probability almost all participants demonstrated low levels of confidence
in teaching statistics and probability, and particularly in applying statistical knowledge.
Wessels and Nieuwoudt (2010) are in consonance with Makwakwa (2012) in respect of
teachers’ weakness in teaching probability and the counting principle. However, the
instruments used do not conclusively confirm the level of teachers’ statistical and probability
knowledge. Observation of lessons, diagnostic tests and interviews with teachers and learners
might have provided more reliable information on teachers’ perspectives regarding the
teaching of the topic. In addition, the study also failed to identify the aspects of probability
that the teachers found difficult to teach. If these aspects are identified, it would clarify the
type of support that teachers require.

45
2.1.6 Learners’ errors and misconceptions in probability
An error is said to have been committed if one deviates from what is accepted as right.
Mutara (2015) also defines error as an indication that something is not quite right. This,
according to the author, may happen when learners use inappropriate means to arrive at a
goal. For example, given the equation 2x = 4, one may find x by dividing both sides of the
equation by 2 and get x as 2. However, if the learner subtracts 2 from both sides and still
arrives at 2 that learner would have committed an error because he or she used an
inappropriate means to arrive at the answer. In another scenario, a learner may think that the
probability of obtaining an ordered sequence HHH if a fair coin is tossed three times, may be
less likely than that of getting HTH, giving rise to an error of representativeness as argued by
Hirsch and O’Donnell (2001). Luneta and Makonya (2010) describe a misconception as a
deviation from accuracy.
There are two types of errors made by learners, namely systematic errors and non-systematic
errors. Systematic errors are “recurrent wrong answers methodically reproduced across space
and time” (Makonye & Luneta, 2014, p. 120). These errors are seen to be repetitive and may
occur as a result of misconceptions in a topic. A misconception is the faulty hypothesis that
causes systematic errors (Mutara, 2015). Errors caused by misconceptions are difficult to be
detected by learners because they happen intuitively (Brodie & Berger, 2010; Green, Piel, &
Flowers, 2008). According to Nesher (1987), systematic errors can go undetected for a long
time because they may even give correct answers on some occasions. Regarding errors caused
by misconceptions, Michael (2002) is of the view that they arise from an inconsistency
between the concept that learners learn and the mental model that they build in their minds.
They occur as a result of a language barrier and a lack of understanding of the principles
(Bennie & Newstead, 2008; Pratt, 2012).
Non-systematic errors are non-reoccurring and unintended wrong answers (Khazanov, 2008).
They do not necessarily happen as a result of misconceptions and can be corrected easily by
the learners themselves (Brodie & Berger, 2010). Despite the fact that these errors may not be
seen as important, they can easily be corrected by the learners themselves. Makonye and
Luneta (2014) argue that they can be very undesirable especially when they are carried over
to multitasks. Examples of non-systematic errors are errors from the improper use of
mathematical devices such as calculators.

46
The concept of probability has been identified as being more difficult to understand than
ordinary mathematics because it requires far more interpretation and understanding of context
(Batanero & Diaz, 2012, p. 5). The authors also found the teaching and learning of the
concept challenging because it is perceived to be abstract, hence the need to assist both
learners and teachers to overcome the problem it poses. This has given rise to extensive
research on learners’ errors and misconceptions (Brodie, 2014; Brodie & Berger, 2010;
Herholdt & Sapire, 2014). The area has become of interest to mathematics researchers in
South Africa due to the incessant poor performance of the country’s students in mathematics.
For example, Mutara (2015) explored Grade 10 learners’ errors and misconceptions in
solving probability problems using different representations in South Africa. The participants
were required to take a test on the probability that was followed by an interview. The study,
which adopted the use of qualitative research methods in arriving at its findings, revealed four
main categories of the learners’ errors and misconceptions: “difficulty with construction of
visual representations; improper distinction between simple and compound events;
application of inappropriate routine errors associated with familiarity; and misinterpretation
of language” (Mutara, 2015). According to the study, learners chose inappropriate
representations because they misinterpreted probability terminology. They committed fewer
errors where the assignment furnished them with representations. In addition, they were more
confident in using representations of tree diagrams, although they had difficulty in
constructing them, as compared to the use of Venn diagrams, outcomes listings and matrix
representations. Although a fairly substantial amount of work was covered in this study, it did
not cover all the concepts presented in the CAPS document. It was silent on fundamental
counting principles and dependent and independent events’ concepts. Nevertheless, the
researcher believes that the reason for this is because these concepts are not covered in the
Grade 10 syllabus of the CAPS document. On the contrary, this study assessed the entire
range of probability concepts taught in the CAPS document.
According to Higgins, Ryan, Swam and Williams (2002), learners’ errors are caused by their
inability to concentrate while solving problems, poor reasoning skills, memory overload and
failure to identify important features in a problem. Learners may understand a topic after it
has been taught, however, they make errors while solving problems because of their inability
to remember what they had been taught a few months previously. This situation, according to
Askew and William (1995), can be solved by the use of a diagnostic teaching strategy. These
authors are of the opinion that a diagnostic strategy of teaching enhances long-term learning
and transfer from the topic in question to general situations. The errors that learners make

47
when solving problems may be attributed to their cognitive level of development, especially
in relation to cognitive achievement in previous grades (Battista, 2001).
Several research studies from different theoretical perspectives seemed to show that learners
tend to have perceptions which hinder their learning of probability concepts (Antoine, 2000;
Das, 2007; Giuliano, 2006). Preconceptions, misperceptions and naïve concepts are some of
the terms that have been used to describe misconceptions research in literature; however, the
most common term, which is widely used by most researchers, is a misconception. Michael
(2002) defined misconception as “the inconsistency between the concept that learners learn
and the mental model that they build in their minds.” This, according to Clement (1993),
contradicted accepted scientific theories. Zembat (2008) is of the view that misconception “is
a perception or conception that is not compatible with the opinion commonly agreed to by
experts on a particular subject.” Pratt (2012) who investigated re-connecting probability and
reasoning about data in the secondary school in the United Kingdom, points out that there is a
depth of problems associated with the teaching and learning of probability and these are well
documented in the literature. This is because the concept of probability has been identified as
being complex and is thus characterised by numerous misconceptions in both the language
and principles. This view was seconded by Jones and Tarr (2007) who stated that despite the
importance of the concept probability, many children and adults held misconceptions about it.
Misconceptions are the primary cause of learners' errors in solving mathematical problems.
Curbing most misconceptions made by learners would substantially reduce the number of
errors that they make when solving mathematical problems.
Various studies have given courses on learner misconceptions in probability. Prominent
among them is a learner variation in intuition and conceptual development (Chadjipadelis &
Gastans, 1995). Most learners have a poor understanding of the topic and thus struggled to
reason instinctively. The major problem has been a poor foundation of the topic which leads
to poor development at a later stage.
Angle (2007) asserted that mathematical concepts can be understood only after the learner has
acquired procedural skills in using the concept. However, most learners easily forget what
they learnt from the probability classroom because of their lack of experience in the topic.
Experience in most cases is acquired through frequent exposure to questions. When learners
are not exposed adequately to the problems it turns out to have a negative effect on the
understanding of a concept. Bennie and Newstead (2008), however, associated learner

48
difficulties in probability to their belief. They propose that learners’ beliefs held about chance
long before they were taught any probability, disturbs them about the concepts taught in the
classroom. This is because concepts taught in probability are closely related to previously
learned concepts in mathematics. Hence learners come to the classroom with many
misconceptions making it difficult for them to understand the formal probability concepts.
Learners’ inability to have fully grasped certain concepts taught in earlier topics can lead to
an inherent misunderstanding of subsequent topics taught in the curriculum. For example, the
concept of fractions, as well as ratio and proportions, when not well understood by learners
can lead to misunderstanding of the concepts of the topic probability. This view is supported
by Tso (2012) who claims that learners’ challenge in probability is due to their weakness in
handling fractions, decimals and percentages. Kaplan (2006) attributed learners’ failure to
understand the concept of probability to their inability to handle rational number concepts and
proportional reasoning used in the calculation, reporting and interpreting of the concept. For
example, if a fair dice is thrown, the probability of obtaining a 1 is 1/6. Some learners have
the misconception that the probability of selecting a 2 is 2/6. Many mistakes in calculating
probability have also been linked to learners’ failure in conceptual understanding and to
inadequate cognitive and metacognitive learning strategies (Castro, 1998), lack of teaching
materials (Jun, 2000) and, according to other researchers, to the teacher (Fennema & Franke
1992; Papaieronymou, 2009). For example, Papaieronymou (2009) argued that a teacher’s
knowledge of the topic might also be a problem. His reason was that not all teachers had
studied probability during their own school education. This leads to a teacher’s inability to
teach the topic for learners to understand, as revealed by Watson (1995).
Similarly, Fennema and Franke (1992) noted that teacher content knowledge influences
classroom instruction and the richness of learners’ mathematical experiences. These
researchers opined that learners develop a dislike for the topic of probability because their
teachers present it to them in a highly abstract and formal way. Bennie (1998) noted that the
problem encountered in the teaching and learning of probability emanates from the fact that
teachers and learners find it arduous to come to grips with the differences between the
everyday concept of probability and the mathematical use of the language of probability.
When they find the language difficult, they reach a point where they develop negative
attitudes towards the topic (Paul & Hlanganipai, 2014).
Ang and Shahrill (2014) identified students’ specific misconceptions in learning probability at
secondary school level in Brunei Darussalam. The participants for the study were 177

49
students from years 10 and 11 from two secondary schools. They employed two instruments,
namely a two-tier multiple choice questionnaire and an interview on “misconception on
probability”. The study identified representativeness, equiprobability bias, beliefs and human
control specifically being some of the areas that lead to misconceptions in learners. The
language of probability has also been identified as a challenge to learners in comprehending
the concept itself. According to Meaney, Trinick and Fairhall (2012), language can either be a
support or a barrier to learners’ learning of probability. Paul and Hlanganipai (2014) cited
Langa, who had advocated for the use of learners’ home language to teach probability,
because they would understand better and interact well with their peers in their own language.
However, the teaching of mathematics in an indigenous language is seen as a difficult task as
most mathematical terms cannot be expressed in indigenous languages. In 1991 the national
statement on mathematics for Australian schools documented that learner challenges about
probability concepts occur as a result of incorrect meanings attached to probability terms.
This may arise if teachers try to express probability terms in learners’ indigenous language.
Learners bring their everyday understanding of certain words to the probability class only to
realise that these words now have different meanings.
Dean and Illowsky (2012) argued that the wording of probability is the first step in solving
probability problems. Moreover, probability concepts conflict with learners’ experiences.
This is in consonance with what most studies have argued. Fennema, Carpenter and Lamon
(1981) noted that the intuitions and experiences that learners (and teachers) bring to the study
of the topic at school could conflict with formal probability and intuitive knowledge of
probability and that its expression could be misleading.
Kahneman and Tversky (1972) explored misconceptions learners have about probability.
They viewed misconception as representativeness. According to them, representativeness is
the tendency of learners to “incorrectly think that samples which correspond to the population
distribution are more probable than the samples which do not.” (Kahneman & Tversky, 1972)
An example of this type of misconception is those that think that in tossing a coin, samples
with an equal number of heads and tails may be more probable than those with an unequal
number of heads and tail. However, these two have the same probabilities.
Another common misconception among learners is equiprobability. Learners with
equiprobability bias assume that random events have equal probabilities by nature. This is to
say, such learners view the occurrence of different outcomes as equally likely. Lecoutre

50
(1992) stated that “learners view three sixes or one six on three rolls of a dice as equally
likely to occur.”
According to Khazanov and Gourgey (2009), misconception can co-exist with correct
concepts and interfere with the learners’ ability to use these concepts consistently and with
confidence. Learners may learn probability rules and procedures and may actually calculate
correct answers in mathematical tests. However, the same learners may still misunderstand
basic ideas and concepts and would ignore the rules when making judgments about uncertain
events. In view of this, Khazanov and Gourgey (2009 p.250) believe that “instructional
interventions designed to specifically eliminate learners’ misconception of probability are
necessary if any tangible and stable improvements in learners’ concepts are expected”
(Khazanov & Gourgey, 2009).
Computer environments and simulations have been directed at fording the gap between
frequentists and classical probability (Pratt, 2012). However, current studies on the computer
simulation program, micro-world, has brought advancement that has led to new pedagogical
advances in the teaching of probability. Pratt’s Chance Maker micro-world provides models
of random generators that children could manipulate and alter. It enables learners to engage in
a task that refines their understanding of randomness by enabling them to generate and
evaluate the long-term behaviour of gadgets (probability generators that required fixing). The
micro-world program helped learners to focus their evaluation of random behaviour by
examining the sample space and data and the distributing of gadgets which in turn supported
and enhanced their understanding of randomness. Pratt recommended that educators ought to
produce probabilistic tasks that are also rewarding for learners. He encouraged educators to
include activities that incorporate purpose and utility. According to him, such tests allow
learners to test for conjectures, perform large-scale experiments and experience the systematic
variations of the context.
Konold (1989) used computer modelling instruction in an attempt to address learners’
misconceptions. The findings of the study showed that some learners' understanding of the
concept was enhanced, but others still had problems understanding the concepts. Similarly,
Garfield and DelMas (1989) used computer program COIN TOSS also to address learners’
misconceptions. The findings of their study were mixed with some learners changing their
ideas about variability while others persisted in their misconceptions about sample size and
variation. Although some researchers have reservations on the use of computer simulations to

51
improve learners’ misconceptions on probability, other researchers find the use of computers
facilitate conceptual understanding of probability in an insightful way.
2.1.7 Learner achievement and quintile ranking of schools in South Africa
Quintile ranking is used to categorise schools in South Africa, mainly for the purpose of
allocating financial resources (Grant, 2013). The categorisation is done based on the poverty
score of each school which is determined by the poverty level of the community in which the
school is situated. These scores are determined from the national census data: weighted
household data on income dependency ratio or unemployment rate, and the level of education
(or the rate of literacy) of the community (Human Sciences Research Council, [HSRC] report,
2009). These are factors determining the socioeconomic situation of learners and the school
as a whole.
In a study on the effect of social economic status on learners’ achievement, Van der Berg
(2008) used test scores on various socioeconomic measures and school input for full and
reduced samples using survey regression and a hierarchical model to deal with sample data.
The study found that learners in the most affluent quintile of schools outperformed learners in
schools in the other four quintiles substantially. However, this was particularly true of
Quintile 4 and 5 schools, suggesting that quintile ranking has little effect on learners’ test
scores among Quintile 1, 2 and 3 schools (the non-fee-paying schools). The implications are
that Quintile 1, 2 and 3 schools are dysfunctional and unable to equip learners with the
necessary numeracy and literacy skills that should be acquired in primary school (Spaull,
2011). Spaull’s study found that students from schools in Quintiles 4 and 5 outperformed the
lower Quintile 1, 2 and 3 schools in academic achievement.
Nevertheless, the study pointed out that learners’ achievement does not improve evenly
across the quintiles because the study found that the distribution among the quintiles was
bimodal by the top quintile and bottom four quintiles. According to the study by Reddy,
Prinsloo, Visser, Arends, Winnaar and Rogers (2012), on the average in mathematics, Grade
9 learners in Quintiles 1 and 2 in South Africa are three years behind in learning in
comparison with average Quintile 5 learners, suggesting that there is a large gap in
mathematical achievement between the Quintile 4 and 5 schools and Quintile 1, 2 and 3
schools. Mpofu (2015) categorised undergraduate students based on the quintile ranking of
the schools they had attended and found that students from lower quintile schools had lower
averages in Grade 12 scores, a higher dropout rate at university and also took a long time to

52
graduate compared to their counterparts from higher quintile schools. The implications of the
findings are that the lower quintiles are underperforming academically. This notwithstanding,
Njoroge and Nyabuto (2014) noted that students whose parents have a hands-on approach to
their education are more likely to perform better academically.
2.2 CONCEPTUAL FRAMEWORK
The current study which is focused on Grade 12 learners’ problem-solving skills in
probability was premised on two frameworks, Bloom’s 1956 taxonomy and the probability
concept in the CAPS document, South Africa.
2.2.1 Bloom’s taxonomy
Problem-solving is a cognitive process (Klieme, 2004; Krulik & Rudnick, 1980; Mayer and
Wittrock (2006). The study, therefore, found it most expedient to measure the learners’
problem-solving skills by making use of Blooms taxonomy. Bloom’s taxonomy is “a
classification system used to define and distinguish different levels of human cognition i.e.
thinking, learning and understanding” (Bloom, 1994). The taxonomy was originally published
in 1956 by a team of cognitive psychologists chaired by Benjamin Bloom and consists of
three main domains, namely: the cognitive domain, the affective domain and the psychomotor
domain. The taxonomy is not a measure of difficulty, but an indication of the type of
cognitive process required to answer questions correctly. This is an indication that attaining a
given level of learning requires mastery of the previous level. Teachers have focused on the
cognitive model to guide the development assessment (test and evaluation of students’
learning). Forehand (2012) asserted that it is imperative for teachers to measure the abilities
of their students. According to the author, this can accurately be done by making use of “a
classification of levels of intellectual behaviour important in learning.” The author believes
that Bloom’s taxonomy provides a measurement tool for thinking and thus serves this purpose
accurately. The primary aim of the taxonomy was to design a logical framework for teaching
and learning goals that would help develop new knowledge skills and understanding. Bloom
classifies the cognitive skill levels as “knowledge, comprehension, application, analysis,
synthesis and evaluation” (Bloom, 1956). The taxonomy has been described as hierarchical in
nature (Forehand, 2012) with the first three “knowledge, comprehension and application”
representing the lower levels of cognition and “analysis, synthesis and evaluation considered
as higher-order skills” (Bloom, 1956).

53
Knowledge cognitive demand deals with recall or recognition of terms, ideas, procedures,
theories, formulas and so on. For example: What is the condition for two events, A and B, to
be independent?
Comprehension cognitive demand examines learners on the ability to grasp the meaning of
previously learned material. This may be shown by translating material from one form to
another, interpreting material (explaining or summarising) or predicting consequences or
effects. For example, “give examples of mutually exclusive events.” Examples of keywords
used during test construction under comprehension are: comprehend, convert, distinguish,
predict, summarise, give examples, and so on.
Application cognitive demand requires the ability to apply the material studied in new and
real-life situations. It may include how to use rules, methods, concepts, principles, laws,
theories, and equations. For example the probability that it will rain is 0.6 and the probability
that it will not rain is 0.4. The question might be: Show that these two statements are
independent. Keywords that might be applicable in test construction items here are complete,
construct, demonstrate, discover, solve and show.
Analysis cognitive demand requires the ability to disassemble material into its constituent
parts so that its organisational structure may be understood. This exercise may include the
identification of the different constituent parts, the examination of the relationships between
the various parts and the understanding of the organisational principles involved. For
example:
In a class of thirty learners, fifteen have previously used the aeroplane to travel, seventeen
have used the ship to travel previously. Each learner has been on one of the two when
travelling before. Draw a Venn diagram to illustrate the information.
This question requires learners to be able to place figures at the correct regions on the Venn
diagram before being able to solve it. The keywords normally used in test construction
include “analysis”, “break down”, “compare”, “contrast”, “outline” and “distinguish”.
Synthesis cognitive demand requires the ability to integrate parts to form a new whole. This
may involve the production of a unique communication (thesis or presentation) or a plan of
operations (research proposal). For example: “Give an account of why the probability that it
will rain today and the probability that it will not rain today are said to be mutually

54
exclusive”. During test construction keywords used in framing questions include
categorising, combine, compile, compose, create, modify, write and tell. Evaluation cognitive
demand requires learners to make a judgment on ideas. The keywords used in framing
questions include compare, conclude, defend, explain, and support. Bloom’s taxonomy has
stood the test of time because it has been used by educational role-players for many years
and in the process has become the standard for developing frameworks for learning, teaching
and assessment goals. Due to its long history and extensive use, it has been condensed,
expanded and reinterpreted in a variety of ways (Forehand, 2012). One of such revisions is
the revised Bloom’s taxonomy. Lorin Anderson, a former student of Bloom, gave an update
of the original Bloom’s taxonomy in 2001 with a supporting team of cognitive psychologists,
curriculum theorists, instructional researchers and testing and assessment specialists when
they published the book entitled: The taxonomy for teaching, learning and assessment. They
were of the view that learning was a continuous process and thus felt it was more appropriate
to use verbs (action words) to classify the cognitive levels instead of the original nouns. As a
result, three of the cognitive levels were renamed and the top two highest cognitive levels
interchanged. The researcher recognises the revised Bloom’s taxonomy with changes made
to the original names; however, the researcher adopted the language of the old version of the
taxonomy because of its universal acceptance across disciplines and national borders, as
argued by Karaali (2011).
The taxonomy has several uses in the educational fraternity; among them is its usage in
finding the development of teaching and learning. The taxonomy gives an accurate measure
of learners’ abilities because it provides an understanding of the different levels of cognition
that are critical for learning. This current study, therefore, uses Bloom’s taxonomy together
with the probability content in the South African CAPS curriculum to evaluate learners’
problem-solving skills in probability.
2.2.2 Probability content in the CAPS document
The CAPS mathematics document (DBE, 2011) stipules that learners study the following
concepts of probability: mutually exclusive events; complementary events; dependent events;
independent events; use of the tree diagram to solve probability problems; use of the Venn
diagram as an aid to solve problems in probability problems; use of the contingency table as
an aid to solve probability problems; and fundamental counting principles (as explained in
Section 2.1.5.2.).

55
2.2.2.1 Mutually exclusive events
Events are mutually exclusive when the occurrence of one of the events rules out the
possibility of the occurrence of the other events (Kelly & Zwiers, 1986). This implies that the
events cannot occur simultaneously. The term is normally used to describe a situation where
the occurrence of one event is not influenced or caused by another event. For example, it is
not possible to roll a four and a two on a simple dice at the same time; thus these two events
are said to be mutually exclusive. In the CAPS mathematics document, the concept is
introduced in Grade 10. Learners are expected to learn how to use the addition formula when
the events are mutually exclusive and non-mutually exclusive. The application is extended to
questions in contingency tables and Venn diagrams.
2.2.2.2 Complementary events
Events are said to be complementary if they are both exhaustive and mutually exclusive. In
other words, the sum of probabilities of complementary events is unity (Pugachev, 2014).
Mathematically P (A) + P (A1) = 1. For example, if the probability that it will rain today is
0.4, the probability that it will not rain is 0.6, which is the complement of the latter. The
concept is introduced in Grade 10 of the CAPS mathematics document.
2.2.2.3 Independent events
Events are said to be independent when the occurrence (or non-occurrence) of one of the
events carries no information about occurrence (or non-occurrence) of the other event (Kelly
& Zwiers, 1986). Mathematically events A and B are considered to be independent if P
(A∩B) = P(A) × P(B). For example, if the probability that it will rain tomorrow is 0.4 and the
probability that I will go to the market tomorrow is 0.3, then the probability that both events
will occur tomorrow is (0.3) × (0.4) = 0.12. In the situation where we have more than two
events, the possible combination follows the multiplication rule (product rule) (Kelly &
Zwiers, 1986). Similarly when a coin is tossed twice or a dice tossed twice, the probability of
the outcome of the first toss does not affect the probability of the outcome of the second toss;
thus the events are said to be independent. The concept is introduced in Grade 11 in the
CAPS mathematics curriculum. It employs the use of product rule and the basic laws of
probability to solve probability problems that involve this concept.
2.2.2.4 Dependent events
Events are said to be dependent when the occurrence of one affects the occurrence of the
other (Kelly & Zwiers, 1986), for example, if dependent events are related to the probability

56
of selection of items from a container without replacement. In such events the probability of
the second depends on the outcome of the first since the total number of sample space or
number of events would be affected after each selection. The outcomes of the two are
dependent. Another example is the presence of fire is dependent on the presence of oxygen,
although the latter does not cause the former. The concept is introduced in Grade 11 in the
CAPS mathematics document. It employs the use of product rule and the basic laws of
probability to solve probability problems involving this concept.
2.2.2.5 Use of Venn diagrams as an aid in solving probability problems
Venn diagrams are made of overlapping circles widely used to demonstrate similarities and
differences in events (Manoli & Papadopoulou, 2012). The technique is employed in almost
every subject area that requires comparison of events (Moore, 2003). It is used to predict the
possibility of an event occurring or not occurring. According to Coleman (2010), Venn
diagrams are among the top three most popular graphic representations most teachers use in
the United States elementary school. This is most likely because of its usefulness in
mathematics and sciences and other disciplines (Baxendell, 2003). The use of Venn diagrams
has been identified to increase learners’ test scores (Humbert, 2014). Like any other
technique, Venn diagrams require learners to do considerable thinking while using them
(Johnson, 1983). According to the DBE (2011, p. 38), South African students in Grades 10 to
12 are expected to use “Venn diagrams to solve probability problems,” and derive and apply
“formulae for any three events A, B and C in a sample space S”. This could be effectively
done if learners are able to understand the terminologies as used in the concepts: draw a Venn
diagram; read a question and pick information from it placing them in their respective
regions; understand the notations as used in the techniques; and apply the laws governing the
use of Venn diagrams to execute any given problem.
2.2.2.6 Use of contingency table as an aid in solving probability problems
Contingency tables present a summarized way of a frequency distribution in a population or
sample that was classified according to statistical variables (Roca & Batanero, 2006). The
table may comprise different rows and columns with the simplest consisting of 2 rows and 2
columns. They are presented in a matrix or grid form. The numbers displayed on the table
give the frequency of each data point. In the table, a strong relationship between the variables
indicates that they are dependent or contingent, otherwise they are said to be independent or
not contingent. According to Roca and Batanero’s (2006) previous study, the concept of
probability focused on reasoning about the association with children in their formal operation

57
stage. A gap lies in learners’ ability to read data from a contingency table and also solve
problems using a contingency table. Makwakwa (2012) revealed that learners have
difficulties in the use of contingency tables to solve problems on mutually exclusive events,
dependent and independent events. The study, however, was silent on the learners’
proficiency in the concept.
Various research studies have documented mixed findings on learners’ use of the concept.
For example, Mutara and Makonye (2015) found that learners who took part in their study
preferred to use contingency tables to solve probability problems, an indication that the
learners in their study had a full grasp of the construction and interpretation of the technique.
However, Batanero, Estepa, Godino and Green (1996) noted that learners still had difficulties
in the use of the concept, particularly in the identification of correct rows and columns. Roca
and Batanero (2006) found that learners had difficulty with reading and computing
probabilities from the two-way contingency table. Falk (1986) stated that student difficulty in
the concept lies in the identification of the differences between the conditional probabilities P
(A/B) and P (B/A). This view is supported by Einhorn and Hogarth (1986), namely that
students misinterpret the conjunction and confuse joint and conditional probability.
2.2.2.7 Use of tree diagram as an aid in solving probability problems
A tree diagram has a single root node, a level of branches for each part of a multiple point
experiment, multiple branches on each level representing the number of outcomes on that
level, a probability of taking a path along a branch written on that branch and a leaf node at
the end of the path that represents each of the possible outcomes in a sample space (Nguyen,
2015). The use of a tree diagram assists learners in conceptualizing and understanding
probabilities. It is a useful tool to calculate the probabilities of events as well as to determine
sample space through organized counting (Nguyen, 2015). It is also useful for both
conditional probability problems as well as those related to sequential events (roll a dice, flip
a coin) (Zahner & Corter, 2010).
In the CAPS mathematics document, South African learners are expected to use the tree
diagram to solve questions involving both dependent and independent events, list sample
spaces and use the technique to solve probability problems. Questions are given involving
selection with replacement and without replacement. Studies have documented that South
African learners have difficulties in constructing tree diagrams as well as in using tree
diagrams to solve probability problems (Makwakwa, 2012; Mutara & Makonye, 2015).

58
2.2.2.8 Fundamental counting principles
The fundamental counting principle is a mathematical rule that allows one to find the number
of ways that a combination of events can occur. In South Africa, the concept is introduced for
the first time in the mathematics curriculum in Grade 12.
While acknowledging the various techniques that have been used by different researchers to
evaluate learners’ problem-solving skills discussed in the literature in section 2.1.5, this study
in assessing learners’ cognitive abilities by making use of Bloom’s taxonomy, found it most
appropriate to measure Grade 12 learners’ problem-solving skills by assessing learners on the
different aspects of the concepts of probability, as enshrined in the CAPS document. By this,
a first-hand idea of the strengths and weaknesses of learners in these aspects would be
highlighted and stakeholders informed on where to tackle the problem of learner
underperformance in probability.
Kodisang (2015) described the content of probability as the essential aspects which are the
key features evident in the teaching and learning of the topic. Knowing the length and depth
of learners’ understanding of mathematical concepts is always essential when it comes to the
evaluation of their problem-solving skills. To effectively do this, Makonye (2012) points out
that the identification of specific errors should be a priority for teaching. As part of the
investigation into learners’ problem-solving skills, the study found it appropriate to know the
kind of errors, if any, that learners’ make while solving problems on the concept of
probability.
The literature has also revealed that learners’ performance in a topic is dependent on certain
factors, e.g. socioeconomic factors, teacher content knowledge and classroom teaching
practices. This study found it necessary to investigate the effect of quintile rankings (a post-
apartheid government measure to bridge the disparity in education in South Africa) on a
newly introduced topic such as probability.
2.3 SUMMARY
This chapter has provided an overview of problem-solving, problem-solving skills, problem-
solving models and challenges learners face in probability, as well as some common errors
and misconceptions in probability as well as the quintile ranking of schools in the context of

59
South Africa. Gaps identified in the literature and in the conceptual framework of the study
have been presented accordingly.
The findings of the literature have revealed that mathematical problem-solving is an
important aspect of the teaching of mathematics, the learning of mathematics and
mathematics in general and thus is seen as one of the most important cognitive skills in many
professions as well as in everyday life. Knowing the problem-solving skills of learners in
different topics in mathematics has been a major concern for most researchers. As a result of
this concern, different problem-solving models have been employed. However, it is important
to note that the various studies discussed in the literature had some flaws in their content
coverage, methodology, sampling techniques or instrument. Some of these studies used a
small number of participants for a quantitative study, which had an effect on its
generalisation. These studies in one way or the other do not adequately measure learner
problem-solving skills.
Most studies in this area of mathematics were conducted in other countries; the few that were
conducted in South Africa did not cover the entire range of topics in the CAPS mathematics
document; they referred only to Grade 10 or 11 learners.
The literature has also established that problem-solving is a cognitive process; hence
evaluating learners’ cognitive abilities in a topic would be a sound way of measuring their
problem-solving skills. However, none of the studies discussed in the literature had
investigated learners’ cognitive skills in probability in South Africa. Knowing learners’
problem-solving skills in the different aspects of probability is the gap that was found in the
literature. Hence it is imperative that this study should be carried out at this time in South
Africa to look at learners’ problem-solving skills in probability by measuring their cognitive
skills as well as their abilities in the essential aspects of probability in the light of the CAPS
mathematics document.
2.4 CONCLUSION
The conceptual framework and the literature review presented in this chapter were purposed
to link the findings of the literature and the concepts governing learner problem-solving skills
in the current study. Some of the studies and literature indicated that learners were weak in
certain aspects of probability. Others indicated that learners’ problem-solving skills in these
same areas were high. The inconsistency in these findings could be as a result of contextual

60
differences or methodological flaws. However, no study investigated Grade 12 learners’
problem-solving skills by measuring their cognitive abilities or their performances in the
different aspects of probability in South Africa.
To this effect, the current study was aimed at investigating Grade 12 learners’ problem-
solving skills using Bloom's cognitive levels and the aspects of probability taught in the
CAPS mathematics document.
2.5 PROJECTION FOR THE NEXT CHAPTER
The next chapter discusses the research methodology adopted in the study. This includes the
research design sample and sampling technique, data collection instruments, the development
of the instrument and procedures of data collection, validity and reliability of the instrument,
and the ethical issues considered in the study.

61
CHAPTER THREE
RESEARCH METHODOLOGY
The study investigated Grade 12 learners’ problem-solving skills in probability. According to Flick
(2015), every research philosophy has its own assumptions which justify the design of the research.
This chapter presents the research paradigm which Rossman and Rollis (2003) defined as shared
understandings of reality guiding this study. May (2011) believes that if one understands the
underlying philosophy being used in research it helps to explain the assumptions ingrained in the
procedure and how they explain the methodology and method. The researcher’s perceived reality
(ontology), the relationship between the knower and the known (epistemology), methodology and
method (research design) guiding the study are justified in this chapter. The sampling technique
employed the data collection instruments and the procedure for the data collection and data analysis
methods are also discussed in this chapter. The ethical issues considered in the study are also
presented. The methodology adopted was based on the objectives of the research as stipulated in
chapter one.
3.1 RESEARCH PARADIGM
The study was guided by the post-positivist paradigm. The assumptions in this paradigm have been
utilised in the traditional forms of research and they hold true particularly for quantitative and
qualitative research. The paradigm challenges the notion of absolute truth of knowledge as argued
by Philips and Burbules (2000). The post-positivists develop numeric measures for observations
and study the behaviour of individuals. According to the post-positivist, data, evidence and rational
considerations shape knowledge. In practice, the researcher collects information with instruments
based on measures provided by participants or by observations recorded by the researcher (Philips
& Burbules, 2000). The ontological belief of a post-positivist is critical realism (Cook & Campbell,
1979). A post-positivist believes that reality is assumed to exist but only imperfectly and it is
assumed to be only probabilistically definable, because of the basically flawed human intellectual
mechanism and the fundamentally uncontrollable nature of the phenomena being studied. They
believe that reality must be critically scrutinised and examined as widely as possible to allow it to
be understood as closely as possible (but never perfectly). According to the post-positivist
epistemology,
Dualism is largely abandoned as not possible to maintain but objectivity remains a regulatory ideal
with special emphasis placed on external guardians of objectivity such as critical traditions (do the
findings ‘fit’ pre-existing knowledge?) and the critical community (such as editors, referees and

62
professional peers). Replicated findings are probably true (but always subject to falsification) (Guba
& Lincoln, 1994).
Bradley (1992) documented that it is always best to select a context-specific methodology suitable
for the problem under consideration and the researcher’s objectives. It is on this account that these
two paradigms were chosen and the mixed method adopted to investigate the problem-solving skills
of Grade 12 learners for this study to cater for the weaknesses of both paradigms.
3.2 METHODOLOGY
Mixed method research was adopted for this study. The researcher found it expedient to use because
it provides compelling benefits that offset the weaknesses of both quantitative and qualitative
research. Where quantitative research is weak in interpreting the context or setting in which people
behave, qualitative research is very well suited for such situations. Qualitative research is seen as
vulnerable to biased interpretations during the research process and to suffer from difficulties in
generalising findings to a large group. Quantitative research, however, does not have this weakness;
thus both types of research are used so they can complement each other. The mixed method also
provided a more complete and comprehensive understanding of the research problem than
qualitative or quantitative research alone. Use of the mixed method allows terms, pictures and
narratives to be used to add additional information to numbers and also has the advantage of being
able to utilise numbers to add precise quantitative data to words, pictures and narratives.
In addition, use of the mixed method allowed the researcher to tackle a broader and richer range of
research questions owing to the fact that the study was not confined to the constraints of a particular
method of research, that is to say, the study could use the strength of the method of research to
counter or overcome the weakness in another method thereby incorporating the complementary
concept. Use of the mixed method promoted development so that data collection and analysis could
occur sequentially. It also promoted triangulation because the data was collected about the same
construct in both qualitative and quantitative strands at the same time (Creamer, 2017). The data
collected for the first phase was linked to the second phase. Several studies have used different
terms to describe this methodology (Creamer, 2017). Terms like integrating, synthesis, quantitative
and qualitative methods, multi-method and the mixed methodology have been identified in the
literature. Recent studies, however, use mixed methods the most (Bryman, 2006). According to
Creswell and Clark (2017), there is increasing complexity of research problems in social sciences
that need to be addressed. Because of this, it is no longer adequate for a researcher to use only
quantitative or qualitative research tools. As a result of this, the emergence of the mixed method

63
approach has become imperative in most studies today. Despite the importance of this research
method, it has its own challenges. These include the need for broad data collection, the time
demands of analysing both text and numeric data, and the requirement that the researcher has to be
familiar with both quantitative and qualitative forms of research.
3.3 RESEARCH DESIGN
In addressing the research questions there was no attempt to control any variable and sample was
not randomly selected. The data collected for this study was cross-sectional with data collected at
one point in time. The quantitative data collected was a cognitive test on probability. Descriptive
statistics were drawn from this data. The qualitative data employed was a content analysis of
learners’ responses. Learners’ strengths and weaknesses, as well as different types of errors and the
misconceptions learners displayed, were analysed by this method. This data gave more insight into
the results of the quantitative data.
3.4 POPULATION OF THE STUDY
The population of this study consisted of all Grade 12 learners who studied mathematics in one of
the wards under the Nongoma circuit of education. Nongoma was purposefully selected because of
its rural nature. The inequities of the apartheid government as noted by Adler and Davis (cited in
Ogbonnaya, 2011), formally disadvantaged most black secondary schools, particularly in
mathematics. The numerous implications of this have led to the poor performance of most black
learners in mathematics, particularly in newly introduced topics in the CAPS mathematics
curriculum. Nongoma, a predominately black community, is no exception. This situation led to the
choice of the study area to investigate learners’ problem-solving skills in probability, a newly
introduced topic in the CAPS mathematics curriculum.
3.5 SAMPLING AND SAMPLING TECHNIQUE
The invitation was extended to all ten schools in the educational ward. However, only seven of
them consented to participate in the study. This was because some of the schools had not completed
their topics for the year at the time of collecting the data and as a result had little time at their
disposal to prepare for the national end-of-year examination. Therefore they could not compromise
their preparation for the national examination by administering research questionnaires. On this
note, they asked to be excused from participation in order to prepare adequately for the
examination. A total of 490 learners from seven out of a population of ten schools (70%) in the

64
educational ward eventually took part in the study. This sample represented a high percentage of the
population, which enabled the researcher to draw a valid and reliable conclusion on the population.
The Nongoma education circuit has five wards, each having a number of secondary schools. The
selected ward had the highest number of schools in the circuit. It is the only ward with a Quintile 4
school. There were no Quintile 5 schools in the research area, consequently only Quintiles 1 to 4
schools participated in the study. All wards had up to Quintile 3 with Quintiles 1 and 2 schools
dominating. This was the reason behind the selection of the ward used for the study. There were
two schools from Quintiles 1 to 3 that took part in the research while only one Quintile 4 school
participated.
The Quintile 4 schools had boarding facilities which allowed their learners to reside on the school
premises. This allowed their teachers to have easy way of organising extra classes for them at any
time of the day after school hours. Moreover, issues of lateness and absenteeism were controlled to
the minimum. The Quintile 1 to 3 schools had no boarding facilities. To control lateness and
absenteeism from school the Grade 12 learners had been requested by the school management to
find accommodation around the school. Quintiles 1, 2 and 3 schools that took part in the study had
similar characteristics except for differences in leadership qualities and teacher motivation. One of
the Quintile 2 schools had resource personnel who were assisting the substantive mathematics
teacher in the subject. The Quintile 1 schools were engaged in team teaching. One of the schools in
the Quintile 1 schools in this study had a very experienced mathematics teacher holding a degree in
mathematics education and who had also been marking the end of year Grade 12 final mathematics
examination for 10 years. There was a high level of dedication on the part of the teachers in
Quintile 1 and 2 schools. It was common practice for these schools to organise different forms of
extra classes for their learners which included educational camps for the learners in critical subjects
such as mathematics and physical sciences. However, the same cannot be said of the Quintile 3
schools in this study.
3.6 DATA COLLECTION INSTRUMENT
The instrument used for this study was mainly a pen-and-paper cognitive test (refer to Appendix A).
The test consisted of long essay “questions” to help measure the ability of learners to apply
concepts, analyse, synthesise and evaluate questions and demonstrate their problem-solving skills in
a variety of ways. The short answer questions were used to help measure learners’ skills in recall
(knowledge-based questions) and comprehension-based question. There were no multiple choice

65
questions. This was done to minimise or eliminate guessing completely in order to avoid crediting
learners with things they do not know. According to Nesher (1987), the use of a cognitive test
allows learners to express themselves freely without any fear or shyness. The use of normal
classroom observations may not be fully complete since some learners may decide not to talk out of
fear or shyness, thus this method of data collection was found to be most appropriate. Furthermore,
the cognitive test exposed learners’ strengths and weaknesses as noted by Flanagan, Macolo and
Hardy-Braz (2009). These authors are of the view that through the use of a task to identify learners’
strength and weakness in a topic the learners may be influenced by fatigue and tiredness,
nevertheless, it has good side effects, for example proper documentation of learners' results for
empirical verification. Results can be compared to those of their peers and thus findings can be
generalised. Participants also completed demographic information on their gender and stream, that
is, whether they were science learners or non-science learners. This information was entered on the
question paper of the test they wrote.
3.6.1 Development of the test
The test was developed by the researcher. The construction of the test was guided by Bloom’s
taxonomy and the Grades 10–12 mathematics curriculum assessment guidelines. The questions
were aligned to the curriculum and patterned after Grade 12 examination questions. This was done
to ensure that the test reflected the curriculum content. The study did not use a standardised test on
the basis that such a test might not reflect the expected questions based on the curriculum of the
learners (Flanagan et al., 2009). There was no time constraint to the test in order to eliminate undue
strain on learners and the possibility of errors being made because of time pressure; this strategy
ensured that learners could perform to the best of their ability (DBE, 2011).
Ogbonnaya (2011) documented that for a valid and reliable inference to be drawn from a study that
is based on learners’ achievement, the study must make use of the assessment that is aligned with
the curriculum standards expected to be learnt. This means that there must be coherence between
the cognitive test and the examination guidelines of the curriculum or assessment guidelines. This
was the baseline for developing the test instrument. The following steps were followed to ensure the
test instruments were properly aligned with the framework and also the data.
3.6.1.1 Step 1
The various contents to be learned in probability from Grade 10 to 12 as stipulated in the
curriculum and the curriculum assessment guidelines were written down. Various textbooks and

66
previous examinations questions were assembled to assist in the collection of questions. Table 3.1
presents a summary of the content to be learnt on probability as documented in the CAPS. The
researcher ensured that questions were aligned according to this guideline.
The construction of the test was guided by the curriculum and Bloom’s taxonomy. This taxonomy
categorises questions into different cognitive demands. The questions tested learners on the
following: cognitive demands, knowledge, comprehension, application analysis, synthesis and
evaluation. For example, on knowledge questions, learners were asked to write the addition formula
for two events A and B given that these two events were mutually exclusive. For understanding
questions, learners were given Venn diagrams and were asked to identify which of them was an
illustration of mutually exclusive, inclusive and also independent factors. In each case, they were
asked to provide reasons for their answers. On application questions learners used the addition
formula of the probability of two events to solve calculation questions. For questions involving
analysis, learners were given a story problem and were asked to put the respective figures at their
correct regions of a Venn diagram. On evaluation questions, learners were given an investigative
form of questions and they deduced a formula from the investigation. The various contents of the
Grade 12 probability concepts were covered in this study.
3.6.1.2 Step 2
The questions were given to mathematics teachers to moderate. All the moderators have taught
mathematics for five years or more, hence they were adjudged to have acquired adequate
experience in teaching the subject. To moderate the diction, they checked the mark allocation and
alignment of questions with the mathematics curriculum statement. Based on their comments the
questions were modified where necessary. For example:
Thandeka has a bag containing 5 green balls and 7 red balls. Two balls were picked at random from
the bag one after the other. Illustrate the information on a tree diagram.
This question had to be reformulated because it was not clear whether the balls were replaced after
the first selection or whether they were not replaced. It was further reframed to read as follows:
Thandeka has a bag containing 5 green balls and 7 red balls. Two balls were picked at random from
the bag one after the other. Illustrate the information in a tree diagram if
(i) The first ball was replaced before the second ball was picked.
(ii) The first ball was not replaced and the second ball was picked.

67
3.6.1.3 Step 3
After the modification of the questions, the test was pilot-tested in a school that did not take part in
the research. This was done two months before the actual studies. Moore, Carter, Nietert and
Stewart (2011) refer to a pilot study as the preparatory studies. Such studies are organised prior to
the main study to basically reveal the efficacies of the research methods or data collection. A pilot
study is helpful in diverse ways. It points out all shortcomings in the data collection instrument so
they can be corrected and thus save the cost of re-running the research study. If this is not done one
may waste time and resources in the middle of the main study. This pilot study used 60 learners, 25
boys and 35 girls from different schools to avoid contamination. This happens when data is
collected from the same participants severally (Makonya, 2011) in the pilot study. The learners
were required to write the proposed test for the study.
The learners’ scripts were marked and analysed. After writing the test, the learners raised concerns
about the clarity of some of the diction as used in the test. The resulting problems that accrued from
the question formulation were modified. For example, there was a question that required learners to
compute the probability of selecting a ball from a bag. The question was silent on whether in the
case of selection this happened without replacement or with replacement. This made the question
difficult to comprehend. This was clarified after their concerns were expressed to bring out a better
understanding. The final instrument was given to three experts in the field of mathematics who
further evaluated the mark allocation, wording and content covered.
3.6.2 Data collection procedure
Class teachers were requested to assist at schools with a larger number of learners, however,
examinations were written in bigger halls to allow the researcher to supervise the process of
examination. Scripts were marked by the researcher after all the schools had written the test.
Schools that took part in the test were widely spaced in terms of location; as a result, there was no
possibility that learners could have had access to the questions. In all seven schools that took part in
the study, the test was organised at the agreed date and times. The instrument was administered
within a two-day interval. Due to the time constraints and the fact that the topic (probability) is
taught during the last term of the academic year and also the long period of time taken to mark all
the scripts, the researcher could not organise interviews on learners’ responses as that would have
disrupted preparation for their final examination. Instead, content analysis of learners’ scripts was
done to ascertain learners’ errors and misconceptions and also their problem-solving skills at the

68
different cognitive levels of Bloom’s taxonomy and for the different content of the topic as
enshrined in the content coverage of the topic.
Table 3.1: Distribution of questions based on Bloom’s taxonomy and aspects of probability
Question
number
Bloom’s cognitive level Aspect of probability in the curriculum
Question 1
1.1.1 Comprehension Mutually exclusive/Venn diagram
1.1.2 Comprehension Inclusive/Venn diagram
1.1.3 Comprehension Complementary/Venn diagram
1.1.4 Comprehension Exhaustive/Venn diagram
1.2.2 Knowledge Mutually exclusive/Venn diagram
1.2.2 Knowledge Inclusive/Venn diagram
Question 2
2.1 Analysis Venn diagram
2.2 Comprehension Venn diagram
2.3 Comprehension Venn diagram
2.4 Application Venn diagram/independent
2.5 Knowledge Complementary/Venn diagram
2.6 Comprehension Complementary
Question 3
3.1.1 Analysis Dependent/Tree diagram
3.1.2 Analysis Independent/Tree diagram
3.2 Comprehension Tree diagram
3.3 Comprehension Tree diagram
3.4 Comprehension Contingency table/Tree diagram
3.5 Synthesis Tree diagram
3.6 Knowledge Contingency table/Tree diagram

69
Question 4
4.0 Comprehension Contingency table
4.1.1 Comprehension Mutually exclusive/Contingency
4.2 Application Independent/Contingency
4.3 Synthesis Independent/Contingency
4.4 Application Contingency
Question 5
5.1.1 Comprehension Fundamental counting principle (FCP)
5.1.2 Comprehension FCP
5.2.1 Comprehension FCP
5.2.2 Comprehension FCP
5.3 Knowledge FCP
5.4 Knowledge FCP
5.6 Knowledge FCP
5.7.1 Evaluation FCP
5.7.2 Evaluation FCP
5.7.3 Evaluation FCP
5.7.4 Evaluation FCP
Question 6
6.1.1 Comprehension FCP
6.1.2 Comprehension FCP
6.1.3 Comprehension FCP
6.1.4 Comprehension FCP
6.2.1 Comprehension FCP
6.2.2 Comprehension FCP
6.2.3 Comprehension FCP
6.2.4 Evaluation FCP

70
6.2.5 Evaluation FCP
(Refer to Appendix A for the question paper)
3.6.3 Marking memorandum
A marking memorandum (see Appendix B) was prepared to measure learners’ achievement in the
probability test. The memorandum was neither prescriptive nor exhaustive; participants’ responses
were considered on merit. Learners’ answers were assessed holistically and a mark awarded. Marks
were awarded to learners based on the sections of questions they had corrected according to the
memorandum on their inputs.
3.7 VALIDITY AND RELIABILITY OF INSTRUMENT
The validity of an assessment is the degree to which it measures what it is supposed to measure,
whereas reliability is the extent to which an assessment tool gives results that are highly consistent
(Dimitriou-Hadjichristou, 2015). Conscious efforts were made to ensure that the instruments used
were reliable and also valid as described in the following section.
3.7.1 Validity of the instrument
Content validity requires an instrument to adequately cover all the content that it should with
respect to the variable being measured. In other words, the instrument should cover the entire
domain related to the variable it is supposed to measure (Heale & Twycross, 2017). Content validity
answers the question of how well an assessment measures what it is intended to measure. According
to Osterlind (1989), content validity can be determined by a panel of judges who are experts in the
field to rate the item regarding content congruence according to laid down criteria. Regarding this
study, curriculum experts, mathematics educators and subject advisors can be used to determine the
content validity of the instrument. In this study, the content validity of the instrument, i.e. the test
used in the study, was determined by three experts in the field of mathematics education. They were
requested to moderate the questions to confirm their alignment with the content as stipulated in the
curriculum assessment guidelines. These experts evaluated the mark allocated to each question, the
language used and also the content covered. They judged the level of alignment of each question
against the curriculum by using a three-point rating scale (1 = not aligned; 2 = fairly aligned; 3 =
much aligned). All questions were retained following their judgement.
Construct validity of the memorandum was ascertained. Construct validity provides evidence that
there is a relationship between the content of the instrument and the construct it intends to measure.
According to Bennett, Seashore and Wesman (1991),

71
Construct validity provides evidence that the construct measured by the test is required for success
on the criterion of interest and that the specific test under consideration is a good measure of the
theoretical construct or trait.
In other words, construct validity determines whether the test results are related to the things that
they ought to be related to, and unrelated to things they ought not to be related to. The experts
employed in the measurement of the content validity also evaluated the construct validity of these
instruments. Their judgment confirmed that the instruments provided a good measure of what they
intended to measure.
3.7.2 Reliability of the instrument
Reliability is a requirement for validity. A questionnaire is said to be reliable if it can repeatedly
produce the same results over time (Venkitachalam, 2014). Cohen, Manion and Morrison (2013)
documented that for a research instrument to be reliable, it must demonstrate consistency. If it is
administered to a similar group of respondents in a similar context it should produce similar results.
The test-retest method which is described as an index of stability (Salvia & Yssldyke, 2001) was
used to ascertain the reliability of the instrument in this study. The method involves administering
the same test instrument to one group or sample at two different points in time (Ponterotto, 1996).
The test was administered to a group of learners and their scores were recorded after marking. After
two weeks the same test was administered to the same set of learners. A reliability coefficient of
0.771 was obtained with the help of SPSS 23 (see Appendix E). This value was found to be an
appropriate measure. According to Hof (2012), an acceptable reliability value should lie between
0.70 and 0. 90.
A sample of 60 scripts already marked by the researcher was randomly selected and remarked by an
independent person who was a senior colleague, researcher and a mathematics educator with over
10 years’ experience of marking national mathematics papers in South Africa. The two scores from
the two marks, those of the researcher and the independent marker, were compared for inter-rater
reliability. The results showed that 95% of the mark, representing an average of 57 scripts was the
same. For 3.3% of the scores, representing an average of 2 scripts, the scores of the researcher were
greater than those of the independent marker while for 2.5% of the scores representing an average
of 1.5 scripts the scores of the independent marker were lower than those of the researcher. This
shows that there was a strong correlation between the scores of the moderator and the marker; hence
evidence of a strong inter-rater reliability (see Table 3.2).

72
Table 3.2: Comparison of scores between researcher and independent marker on aspects of
probability
The results indicate that the marking done by the researcher and the independent marker were
consistent. Of the 60 scripts sampled for marking by the independent marker, 58 (highest number)
had the same marks for the fundamental counting principle as those of the researcher, and 56
(lowest number) of the scripts had the same marks on tree diagram. Scripts that showed a difference
in marks, whether greater or smaller, were few, an indication of consistency in marking and fairness
in the marking (refer to Table 3.2).
Table 3.3: Comparison of scores between researcher and independent marker on cognitive level
Cognitive levels Same Greater Lesser
Evaluation 58 0 2
Synthesis 56 3 1
Analyse 56 3 1
Application 56 2 2
Comprehension 57 2 1
Knowledge 56 2 2
Aspects of probability Same Greater Lesser
Fundamental counting principle 58 2 0
Contingency table 56 3 1
Tree diagram 56 1 3
Venn diagram 56 2 2
Dependent event
Independent event
57
56
1
1
2
3
Mutually exclusive
Complementary events
56
57
2
1
2
3

73
Table 3.3 indicates that most scores of the researcher and the independent marker were consistent,
suggesting the marking was accurate and fair. The results indicated that the marking done by the
researcher and the independent marker were consistent. Of the 60 scripts sampled for marking by
the independent marker 58 (the highest number) had the same marks for evaluation from both
markers, and 56 (the lowest number) the same marks on synthesis. Scripts that showed a difference
in marks, whether greater or smaller, were few, an indication of consistency and fairness in marking
(refer to Table 3.3).
3.8 DATA ANALYSIS
This section was divided into two, namely the quantitative data analysis and qualitative data
analysis.
3.8.1 Quantitative data analysis
Data was analysed using descriptive and inferential statistics. Descriptive statistics involved
calculating the frequencies, mean and standard deviations of the learners’ achievement scores at the
various levels of Bloom’s taxonomy and the probability aspects of the curriculum (minimum mark
and maximum mark). Descriptive statistics were used to compare the achievements of the learners
according to Bloom’s taxonomy and also according to the aspects of the probability taught. This
informed the researcher of the level of Bloom’s taxonomy and also the aspects of Bloom’s
taxonomy where learners achieved the most or lacked knowledge.
Inferential statistics involved the analysis of variance (ANOVA) in SPSS®. The Welch one-way
ANOVA was used to test the significance of learners’ mean achievement on the different aspects of
probability and different levels of Bloom’s taxonomy according to the quintile ranking of schools.
The inferential statistics were used to determine whether there were any significant differences in
the learners’ achievement according to Bloom’s taxonomy and also according to the aspects of
probability taught in the curriculum. Different analyses were drawn from the study. As an example,
the frequency of learners’ achievement showed 30% and 50% at the different cognitive levels and
also in the aspects of probability taught in the mathematics curriculum of South Africa. The total
learner performance was determined according to the different aspects of probability and the impact
of the quintile ranking on learner achievement using the partial Eta square.

74
3.8.2 Qualitative data analysis
Content analysis of data collection was performed after the quantitative data analysis. Learners’
performance in the different concepts of probability in the CAPS mathematics curriculum was
analysed according to whether their answers were completely correct, partially correct, or
completely wrong. In addition, learners’ scripts for each of the different control groups were
sampled and studied to ascertain the errors made in solving the problems according to the type of
errors: computational errors, structural errors and procedural errors (see Section 4.3).
3.9 ETHICAL ISSUES
Ethics is defined as a method, procedure or perspective for deciding how to act and for analysing
complex problems and issues (Rensnik, 2011). Ethical issues require researchers to avoid placing
participants in a situation where they might be at risk or harmed either physically or psychologically
as a result of their participation in a study. On this basis the following ethical issues were observed
to ensure the study was void of any unethical issues.
In the first place, permission was sought from the Department of Basic Education, SGBs, principals
and concerned teachers to ascertain their availability to take part in the study (see Appendix F). The
DBE issued a certificate to allow the research to be carried out in their schools. The certificate
instructed the researcher to also seek permission from the principals, SGBs and learners as well as
the parents of minors. Secondly, the university board responsible for ethical clearances cleared the
work and an ethical clearance certificate was issued to allow the work to be done in an ethical
manner (see Appendix G).
Learners under 18 years were given consent forms for their parents to endorse, allowing them to
participate in the study and those above 18 years were also given these consent forms to complete.
Copies of the consent letters are attached in Appendix C. This process ensures that the rights,
values, needs, and desires of each informant are respected, as argued by Dane (1990) (see Appendix
C).
The purpose of the research was clearly explained to participants and the right to withdraw also
emphasised to them. They were made to realise that they were not obliged to take part in the study.
This urged the participants not to hold anything back, but to respond fairly as expected of them.
With regard to ethical issues on reporting, sharing and storing of data the following steps were
taken. The findings of the study were reported with honesty. There was no record of falsifying the
evidence, findings and conclusions. To protect the anonymity of participants, fictitious names were

75
assigned to them as well as to the schools they attended. For example, a school was identified as
KD101. Efforts were made to prevent disruption of the data collection procedure by discussing with
the school the appropriate times that could be used for this purpose. Raw data would be kept and
saved with the researcher for a minimum of five years in accordance with the American Psychology
Association (APA) requirements (2011). The researcher would assume all responsibilities regarding
the conduct of the research. This gave participants the confidence to respond freely. The funders of
the study are duly recognised and disclosed (see acknowledgement). All stakeholders in
mathematics education would benefit from the findings of the study.
The researcher would be obliged to keep efficient records of the research and provide copies to
participants (schools that took part in the study) and authoritative results would be published in
different languages on the internet for use by other researchers. Copies would be found in the
University of South Africa library for use. The study was guided by the principles of research ethics
presented above.
3.10 SUMMARY
The study investigated the problem-solving skills of Grade 12 learners in probability. In addressing
this problem, the mixed method approach was employed. This consisted of a quantitative approach
of data collection, which was based on the cognitive test, and a qualitative approach which was
based on content analysis of the learners’ work. The instrument was subjected to validity and
reliability. It was found to be valid and reliable for the purposes of the study. The researcher
ensured that the study was conducted in an ethical manner.
3.11 PROJECTION OF CHAPTER FOUR
Chapter four presents the findings of the data analysis undertaken to address the research questions.
The analysis begins with the quantitative data and is followed by analysis of the qualitative data.

76
CHAPTER FOUR
FINDINGS
The previous chapter presented methods of data collection and measures taken to ensure rigour in
this study. The current chapter will discuss the analysis of the data collected and the findings. The
aim of this study was to investigate Grade 12 learners’ problem-solving skills in probability. In this
study, learners' problem-solving skills were measured according to their achievement and
performance in the different aspects of probability in the mathematics curriculum. To retain focus
on the analysis the research questions are kept in mind. The main research question is as follows:
What are the Grade 12 learners’ problem-solving skills in probability?
The sub-questions are as follows:
1 What are Grade 12 learners’ problem-solving skills in probability according to Bloom’s
taxonomy?
2 What are Grade 12 learner’s problem-solving skills in probability on the following?
(i) Mutually exclusive events
(ii) Complementary events
(iii) Dependent events
(iv) Independent events
(v) Use of contingency tables, Venn diagrams and tree diagrams as aids
(vi) Fundamental counting principles.
3 How are Grade 12 learners’ problem-solving skills in probability related to learners’ school
quintile ranking?
4 What are learners’ errors and misconceptions in probability?
In answering these questions quantitative and qualitative data analysis were found suitable because
they allow for generalisation and interactive processes (Makonye, 2011). The chapter presents the
results of the data analyses. In analysing the data in this study, the researcher organised it in a
manner so as to see patterns, discover relationships, give explanations and make interpretations.
In this study learner achievement was measured at the different cognitive levels of Bloom’s
taxonomy and also according to the different aspect of probability in the curriculum, namely
mutually exclusive events (M); complementary events (C); dependent events (D); independent
events (I); use of Venn diagram, tree diagram, contingency tables (A); and the fundamental
counting principle (FC). In the qualitative analysis, learner performance regarding their strengths

77
and weaknesses at the different cognitive levels as well as the different aspects of probability were
looked at. Analyses were made according to questions learners had completely correct (CC),
partially correct (PC) and completely wrong (CW). It was explained in the literature that learners’
inability to arrive at the desired conclusion of a question was based on certain errors they made and
misconceptions that they had. The study explored the various errors learners made in solving the
problems. Structural errors, computational errors and procedural errors were identified as the kind
of errors learners make (Moru, Qhobela, Wetsi & Nchejane, 2014; Ogbonnaya, 2011). The chapter
has been organized into two sections: analysis of quantitative data and analysis of qualitative data.
Demographic information of participants according to quintile
Table 4.1 presents the demographics of the participants who took part in the study. Table 4.1 shows
that of the 490 learners, 43% were boys and 57% were girls.
Table 4.1: Demographics of participants
Gender/quintiles Quintile 1 Quintile 2 Quintile 3 Quintile 4 Total Boys 74 50 33 53 210
Girls 69 57 59 95 280
Total 143 107 92 148 490
Quintile 4 learners had the highest number of participants in the study 148 (30%) and Quintile 3 had
the lowest number of participants in the study 92 (19%). The number of boys who took part in the
study was 70 or 14% more than girls. The total number of participants in the study was 490 (see
Table 4.1).
4.1 FINDINGS
The findings of the study were categorized into three main sections. The first section presents
findings on the quantitative analysis. Under this section learners’ descriptive analysis was made
according to Bloom’s taxonomy and also according to the aspects of probability in the CAPS of
South Africa. Each analysis is presented considering all the learners in the study in totality and after
considering them according to the different quintiles. The second section presents the findings from
the inferential statistics with regard to the impact of the quintile ranking on learner achievement.
This was measured using the partial Eta squared. The last section presents analysis of the
quantitative data which was mainly a content analysis of learners’ work. Various errors and

78
misconceptions learners make while solving probability problems were highlighted. The findings
are presented chronologically according to the research questions.
4.2 FINDINGS FROM QUANTITATIVE DATA ANALYSIS
Various descriptive statistics regarding learners’ performance in the test are presented in this
section. The statistics include the averages, minimum marks scored, maximum marks scored and
the standard deviations. The frequency of the number of learners who achieved at certain
percentage levels for the combined participants is presented as well as for the different school
quintiles. Frequencies of learner achievement are given based on the South African DoE
performance levels.
Table 4.2: Descriptive statistics of learners’ achievement
Variable %M SD N
Knowledge 70.77 22.74 490
Comprehension 40.93 22.36 490
Application 41.67 26.36 490
Analysis 34.76 18.44 490
Synthesis 19.54 22.71 490
Evaluation 12.49 23.57 490
Among the average scores of learners at the different cognitive levels, namely knowledge,
comprehension, application, analysis, synthesis and evaluation, “knowledge” had the highest
average (M = 70.77 %; SD = 22.74) with “evaluation” having the lowest average (M = 12.49 %; SD
= 23.57). The results show that learners’ performance was the weakest in the higher cognitive
levels, as was expected. However, they did better in “application” (M = 41%; SD = 26.36) as
compared to “comprehension” (M = 40%; SD = 22.36) contrary to expectation.

79
Figure 4.1 Percentage of learners who achieved at least 50% and at most 49% on test
according to cognitive levels
The number of learners in this study who achieved 50% and more decreased from “knowledge
cognitive demand” (82%) to “evaluation cognitive demand” (5%) (skewed to the left). However,
the number of learners in this study that achieved at least 50% in “application cognitive demand”
(41%) was slightly higher than in “comprehension cognitive demand” (39%). The reverse can be
said for the number that achieved 49% and less (skewed to the right) (see Figure 4.1).
Table 4.3: Learners’ mean percentage scores at Bloom’s taxonomy levels according to quintiles
Bloom’s cognitive
level Knowledge Comprehension Application
Quintiles N Mean SD Mean SD Mean SD
Q 1 143 66.39 19.33 37.34 19.66 50.11 21.27
Q 2 107 60.55 23.12 36.76 17.75 35.24 28.79
Q 3 92 51.32 15.56 18.12 10.64 17.84 19.57
Q 4 148 91.17 8.30 60.84 14.72 51.67 21.06
Total 490 69.78 22.69 40.73 22.18 41.28 26.12
Bloom’s cognitive
level Analysis Synthesis Evaluation
Quintiles N Mean SD Mean SD Mean SD
Q 1 143 37.49 12.15 17.65 20.60 9.44 20.70
Q 2 107 27.52 13.36 22.43 25.91 8.56 17.79
Q 3 92 11.51 11.35 14.40 28.76 5.43 18.01
Q 4 148 50.76 11.25 22.47 16.69 21.74 28.48
Total 490 34.44 18.34 19.54 22.71 12.21 23.21

80
Table 4.3 gives the mean percentage scores of learners in the study at Bloom’s taxonomy levels
according to the quintile ranking of schools in the study. The number of participants in the different
school quintile is shown under the column N; SD represents the standard deviation of the means.
The average achievement of Quintile 4 learners was higher than all the other quintiles at all levels
of Bloom’s taxonomy. Following Quintile 4 were Quintile 1, then Quintile 2 and Quintile 3
respectively.
At the knowledge level, Quintile 4 had the highest mean achievement score (M = 91.17; SD = 8.3)
followed by Quintile 1 (M = 66.39; SD = 19.33). Quintile 3 had the lowest mean achievement (M =
51.32; SD = 15.56).
Learners at the comprehension level of Bloom’s taxonomy showed that Quintile 4 learners had the
highest mean score (M = 60.84; SD = 1 4.72) whereas Quintile 3 learners had the lowest mean
score (M = 18.12; SD = 10.64). Quintile 1 learners achieved higher scores than Quintile 2 learners.
Similar to the learners’ achievement at the knowledge and comprehension levels, Quintile 4 had the
highest mean score at the application level (M = 51.67; SD = 21.26) and was closely followed by
Quintile 1 (M = 50.11; SD = 21.27). Quintiles 2 and 3 came third and fourth respectively.
The learners’ mean scores at the analysis level saw Quintile 4 obtaining the highest mean and
Quintile 3 the lowest mean scores. In general, learners' performance in the analysis came 4th
compared to other cognitive levels as indicated in Table 4.3.
The mean achievement scores of all the quintiles at the synthesis level were below 30%, with
Quintile 3 showing the lowest mean achievement and Quintile 4 the highest achievement (see Table
4.3). Learners’ scores in Quintile 4 were the least spread out, whereas the scores of Quintile 3
learners were the most spread out. Quintile 4 had the highest mean score followed by Quintile 1,
then Quintile 2, while Quintile 3 had the lowest (refer to Table 4.3). Quintile 4 had the highest
standard deviations showing that scores in Quintile 4 were the most widely spread and Quintile 2
the least spread.
4.2.1 Descriptive analysis according to aspects of probability
Learners wrote a test on probability. The scripts were marked and their performance recorded
according to the aspects of probability. The descriptive statistics of learners’ performance according
to the different aspects of probability studied in Grade 12 are indicated in Table 4.4

81
Table 4.4: Descriptive statistics of learners’ achievement according to the aspects of probability
N Min Max Mean Std.de
Mutually exclusive events 490 1 11 5.38 2.741
Independent events 490 1 11 5.32 2.423
Venn diagram 490 1 11 7.32 2.889
Tree diagram 490 1 11 3.88 1.810
Counting principles 490 1 11 3.16 2.327
Contingency table 490 1 7 3.11 .659
Dependent event 490 1 11 5.25 2.431
Complementary 490 1 11 5.36 2.759
Valid N (list-wise) 490
The average achievement in the use of Venn diagrams was the highest (M = 7.32; SD = 2.42).
Learners in the study performed the worst in the use of a contingency table (M = 3.11; SD = 2.23).
The average performance of learners in the study in questions on mutually exclusive events,
independent events, dependent events and complementary events were at par. The use of an aid to
solve probability problems, e.g. a contingency table or a tree diagram recorded low averages (see
Table 4.4).
Table 4.5: Distribution of learners’ performance per various aspects in probability
Mark
M
C
I
D
DOE
performance
level
F % F % F % F %
0-29 151 31 160 33 124 25 124 25
30-39 41 8 50 10 31 6 31 6
40-49 76 16 72 15 34 7 34 7
50-59 32 7 45 9 123 25 123 25
60-69 67 14 60 12 96 20 96 20
70-79 25 5 13 3 59 12 59 12
80-100 98 20 90 18 23 5 23 5
T0TAL 490 100 490 100 490 100 490 100

82
F = frequency, % = percentage
M = mutually exclusive; C = complementary events; I = independent event; D = dependent event;
V = Venn diagram; T = tree diagram; CT = contingency table; FC = fundamental counting principle
The results show that 31% of the learners scored in the range 0-29% in the category M; 25% scored
between 0% and 29% in the category D; 38% of the learners scored between 80% and 100% in the
category V.
In category T, 45% of the learners in the study scored between 30% and 39%; 64% of the learners
in the study scored between 0% and 29% in the category C. In the category FC, 85% of the learners
in the study scored between 0% and 29%. The results show that learners’ performance in the Venn
diagram in the range 80% to 100% was the highest Learners’ achievement in the different ranges
are indicated in Table 4.5
Mark / V
T
CT
FC
DOE
Performance
level
F % F % F % F %
0-29 61 13 128 26 313 64 418 85
30-39 18 4 218 45 35 7 62 13
40-49 64 13 66 14 27 6 4 1
50-59 53 11 51 11 50 10 2 0
60-69 53 11 12 2 46 9 4 1
70-79 57 12 9 2 16 3 0 0
80-100 184 38 6 1 3 1 0 0
T0TAL 490 100 490 100 490 100 490 100

83
Figure 4.1: Frequency of learners per achievement
Learners in the study’s achievement at 30% and 50% were compared. Most of the learners in the
study excelled the greatest in the use of Venn diagrams (87% of the learners in the study obtained at
least 30% and 72% obtained at least 50%. “Fundamental counting principle” recorded the lowest
performance of an aspect at both 30% achievement and 50% achievement (15% and 1% of learners)
respectively. With the exception of the use of “tree diagrams”, “contingency tables” and
“fundamental counting principles,” over 40 % of the learners in the study achieved in questions on
mutually exclusive events, complementary events, independent events and dependent events (see
Figure 4.2).
Figure 4.2: Overall learner performance
69 67
76 75
87
74
36
15
4642
62 62
72
1623
10
10
20
30
40
50
60
70
80
90
100
m C I D V T CT FC
of learners%
Aspect of probability
% of learners who passed at 30 % % of learners who passed at 50%
10 8 12 15 5 10 4 536 42 54 55
11
68
337
442 438 421 417
349
411
479447
2 2 3 3
125
1 4 10
100
200
300
400
500
600
M C I D V T CT FC
NO OF LEARNERS
ASPECT OF PROBABILITY
NO SOLUTION COMPLETELY WRONG PARTIALLY CORRECT COMPLETELY CORRECT

84
Figure 4.3 provides a graphical display of the performance of learners according to the questions
they had completely correct, partially correct or completely wrong. The majority of the learners fell
into the category of “partially correct” with the use of contingency tables having the highest number
of learners in a category (479 learners, 98%) and the use of Venn diagrams recording the least
number of learners in the category (349 learners, 71%). The use of Venn diagrams to solve
probability problems recorded the highest number of items of the completely correct category with
the fundamental counting principle obtaining the lowest number in that category.
Table 4.6: Frequency distribution in mutually exclusive events
Q Freq % Valid % Cum %
1 Valid < 50 116 81.1 81.1 81.1
50–99 27 18.9 18.9 100.0
Total 143 100.0 100.0
2 Valid < 50 60 56.1 56.1 56.1
50 – 99 45 42.1 42.1 98.1
100 2 1.9 1.9 100.0
Total 107 100.0 100.0
3 Valid < 50 80 87.0 87.0 87.0
50–99 12 13.0 13.0 100.0
Total 92 100.0 100.0
4 Valid < 50 12 8.1 8.1 8.1
50–99 136 91.9 91.9 100.0
Total 148 100.0 100.0
Quintile 4 learners excelled the most with 92% of the learners achieving between 50% and 99% and
only 8% achieving less than 50% in mutually exclusive events. Quintile 3 learners in this study
performed the least with 87% of the learners achieving less than 50% and 13% achieving between
50% and 99%. Quintile 2 learners in this study had almost the same percentage of learners
achieving less than 50% and also between 50% and 99%, that is, 42% and 56% respectively.
However, it is the only quintile with 2% of its learners scoring a total of 100% in this aspect of
probability; “mutually exclusive events” (refer to Table 4.6)

85
Table 4.7: Frequency distribution in independent event
Learners in this study from Quintile 4 excelled the most (89% achieving from 50% to 99%) in this
aspect of probability, “independent event.” Quintile 1 learners followed with 88% achieving
between 50% and 99%. Quintile 3 learners performed the worst in this aspect of probability with
96% scoring below 50% in the question on “independent events.” The difference between the
performance of learners in Quintile 2 in this study in these categories was not great compared to the
difference observed from other quintiles (refer to Table 4.7).
Q
Freq % Valid % Cum %
1 Valid < 50 17 12 12 12
50 – 99 126 88 88 100.0
Total 143 100.0 100.0
2 Valid < 50 63 63 63 63
50 – 99 37 35 35 97
100 3 3 3 100.0
Total 107 100.0 100.0
3 Valid < 50 96 96 96 96
50 – 99 4 4 4.3 100.0
Total 92 100.0 100.0
4 Valid < 50 17 11 11.5
50 – 99 131 89 89 100.0
Total 148 100.0 100.0

86
Table 4.8: Frequency distribution in complementary events
Q Freq % Valid % Cum %
1 Valid < 50 116 81.1 81.1 81.1
50–99 27 18.9 18.9 100.0
Total 143 100.0 100.0
2 Valid < 50 60 56.1 56.1 56.1
50–99 45 42.1 42.1 98.1
100 2 1.9 1.9 100.0
Total 107 100.0 100.0
3 Valid < 50 80 87.0 87.0 87.0
50–99 12 13.0 13.0 100.0
Total 92 100.0 100.0
4 Valid < 50 12 8.1 8.1 8.1
50–99 136 91.9 91.9 100.0
TOTAL 148 100.0 100.0
The performance of Quintile 4 learners in this study was the highest (136 learners achieving from
50% to 99%) in complementary events. Quintile 2 learners followed with 45 learners achieving
between 50% and 99%. Quintile 3 learners in this study performed the worst with 80 of the learners
achieving less than 50%. However, Quintile 2 learners performed better than Quintile 1; 116 of the
Quintile 1 learners in the study obtained less than 50%. The performance of learners in Quintile 2 in
this study seemed to be at par (refer to Table 4.8).

87
Table 4.9: Frequency distribution of learners’ performance in dependent events
Q Freq %
Valid % Cum%
1 Valid < 50 23 16.1 16.1 16.1
50 - 99 120 83.9 83.9 100.0
Total 143 100.0 100.0
2 Valid < 50 68 63.6 63.6 63.6
50 - 99 36 33.6 33.6 97.2
100 3 2.8 2.8 100.0
Total 107 100.0 100.0
3 Valid < 50 89 96.7 96.7 96.7
50 - 99 3 3.3 3.3 100.0
Total 92 100.0 100.0
4 Valid < 50 18 12.2 12.2 12.2
50 - 99 130 87.8 87.8 100.0 Total 148 100.0 100.0
Quintile 4 learners performed highest in questions on “dependent events” with 87% of the learners
obtaining 50% to 99%. Quintile 1 learners followed with 83% obtaining between 50% and 99%.
Quintile 3 learners performed the worst with 97% obtaining less than 50%. Quintile 2 learners in
the study’s performance were almost at par. A total of 3% of the learners in Quintile 2 in the study
scored full marks in this aspect of probability (see Table 4.9).

88
Table 4.10: Frequency distribution in use of Venn diagrams
Q
Freq
%
Valid %
Cum. %
1 Valid < 50 6 4.2 4.2 4.2
50–99 77 53.8 53.8 58.0
100 60 42.0 42.0 100.0
Total 143 100.0 100.0
2 Valid < 50 41 38.3 38.3 38.3
50–99 47 43.9 43.9 82.2
100 19 17.8 17.8 100.0
Total 107 100.0 100.0
3 Valid < 50 63 68.5 68.5 68.5
50–99 23 25.0 25.0 93.5
100 6 6.5 6.5 100.0
Total 92 100.0 100.0
4 Valid < 50 33 22.3 22.3 22.3
50 - 99 75 50.7 50.7 73.0
100 40 27.0 27.0 100.0
TOTAL 148 100.0 100.0
Quintile 1 learners excelled the most, with 60 (42%) scoring 100% and only 6 (4.2%) scoring less
than 50%. Quintile 3 learners performed the worst with 69% obtaining less than 50%.

89
Table 4.11: Frequency distribution of learners in use of tree diagrams
Q Freq % Valid % Cum. % 1 Valid < 50 132 92.3 92.3 92.3
50–99 11 7.7 7.7 100.0
Total 143 100.0 100.0
2 Valid < 50 86 80.4 80.4 80.4
50–99 21 19.6 19.6 100.0
Total 107 100.0 100.0
3 Valid < 50 92 100.0 100.0 100.0
4 Valid < 50 102 68.9 68.9 68.9
50–99 45 30.4 30.4 99.3
100
1
148
.7
100
.7
100 100.0
Quintile 3 learners in the study performed the worst with 100% obtaining less than 50%. Quintile 4
learners excelled the most but only 30% of the learners obtained between 50% and 99%. Learners
in this study performed the worst in this aspect of probability compared to other aspects up to this
point (refer to Table 4.12).

90
Table 4.12: Frequency distribution in use of contingency tables
Q freq % Valid % Cum %
1 Valid < 50 143 100.0 100.0 100.0
2 Valid < 50 103 96.3 96.3 96.3
50–99 4 3.7 3.7 100.0
Total 107 100.0 100.0
3 Valid < 50 91 98.9 98.9 98.9
50–99 1 1.1 1.1 100.0
Total 92 100.0 100.0
4 Valid < 50 147 99.3 99.3 99.3
50–99 1 .7 .7 100.0
Total 148 100.0 100.0
Quintiles 1, 2 and 3 learners in the study all obtained less than 50% in the use of the “contingency
table”. Quintile 4 learners might have been expected to perform better but 99% of the learners
obtained less than 50% (see Table 4.12)

91
Table 4.13: Learners’ performance in fundamental counting principle per quintile
Q Freq % Valid % Cumu
1
Vali
d < 50 142 99.3 99.3 99.3
50–99 1 .7 .7 100.0
Total 143 100.0 100.0
2
Vali
d < 50 98 91.6 91.6 91.6
50–99 9 8.4 8.4 100.0
Total 107 100.0 100.0
3
Vali
d < 50 89 96.7 96.7 96.7
50–99 3 3.3 3.3 100.0
Total 92 100.0 100.0
4
Vali
d < 50 46 31.1 31.1 31.1
50–99 101 68.2 68.2 99.3
100 1 .7 .7 100.0
Quintile 1 learners in the study performed the worst with 99% obtaining less than 50%. Quintile 4
excelled the most with 68% obtaining between 50% and 99%. Other learners in the study did not
perform well with 92% and 97% of the Quintile 2 and 3 learners falling in the range 0–50%
respectively (refer to Table 13).
4.2.2 Impact of quintile ranking
The Welch ANOVA (Welch, 1951) was used to examine whether the learners’ achievement scores
in the test significantly differed due to the quintile ranking of schools. This was used because the
Levene test for homogeneity of variance was significant for all levels of Bloom’s taxonomy except

92
for the analysis level (Table 4.1.4) hence the one way ANOVA could not be used. Welch’s
ANOVA is a good approach for performing an ANOVA when homogeneity of variances
assumptions are not met (Jan & Shieh, 2014). The participants were Quintile 1, Quintile 2, Quintile
3 and Quintile 4 learners. The outcome variable was found to be not normally distributed, however,
due to the large sample size of the data this was assumed to have a marginal impact on the result.
Therefore according to the central limit theorem for large sample sizes (when the sample size is
greater than 30 or 40), the sampling distribution turns to approximate normality regardless of the
shape of the data (Elliott & Woodward, 2007; Field, 2009). Using the quintile ranking as the
independent variable and the learners’ scores as the dependent variable in the different cognitive
levels, the Levene test of equality of variance was used to assess the homogeneity of the variances
of the dependent variables. The results showed that the variances were statistically significantly
different at α = 0.05 (see Table 4.14). This is an indication that the test for homogeneity was
violated.
Table 4.14: Levene test of homogeneity of variances in learners’ achievement
Levene statistic df1 df2 Sig.
Knowledge 36.825 3 486 .000
Comprehension 17.430 3 486 .000
Application 8.682 3 486 .000
Analysis 2.391 3 486 .068
Synthesis 21.306 3 486 .000
Evaluation 23.928 3 486 .000
The Welch correction of the learner’s achievement scores (see Table 4.14) revealed a statistically
significant difference between the achievement scores of the quintiles at all but the synthesis level
of Bloom’s taxonomy.

93
Table 4.15: Welch test of equality of means
There was a statistically significant difference between groups as determined by the Welch
ANOVA, as follows:
Knowledge: F (3, 486) = 121.627, p < .001;
Comprehension: F (3, 486) = 131.057, p < .001;
Application: F (3, 486) = 55.113. p < .001;
Analysis: F (3, 486) = 215.839. p < .001;
Synthesis, the result shows the difference according to the quintile was not statistically
significant: F (3, 486) = 3.108, p < 0.01;
Evaluation: F (3, 486) = 15.435, p < .001.
The Games-Howell’s post-hoc comparison procedure was used to determine which pairs of the four
groups implied a significant difference at the Knowledge, Comprehension, Application, Analysis
and Evaluation levels of Bloom’s taxonomy. The results are shown in (Appendix H)
The post-hoc result showed that at the knowledge level, Quintile 4 performed significantly better
than the other quintiles. This was followed by Quintile 1 that performed significantly better than
Quintiles 2 and 3. The achievement of Quintile 2 was also found to be significantly better than
Quintile 3. Similarly, at the comprehension level, Quintile 4 performed significantly better than the
other quintiles, and Quintiles 1 and 2 performed significantly better than Quintile 3.
At the application level, Quintiles 4, 1 and 2 all had statistically significantly better achievements
than Quintile 3. There was no statistically significant difference between the achievements of
Statistica df1 df2 Sig. Knowledge 229.669 3 218.999 .000
Comprehension 225.313 3 259.882 .000
Application 69.069 3 249.835 .000
Analysis 239.596 3 251.304 .000
Synthesis 2.753 3 234.173 .043
Evaluation 11.629 3 262.323 .000
a. Asymptotically F distributed

94
Quintiles 3 and 4, however, both quintiles performed significantly better than Quintile 2, and
Quintile 2 performed significantly better than Quintile 3 (Refer to appendix H).
At the analysis level, as was found at the other levels of Bloom’s taxonomy, Quintile 4 performed
significantly better than the other quintiles, followed by Quintile 1 that performed significantly
better than Quintiles 2 and 3 and Quintile 2 that performed significantly better than Quintile 3. At
the evaluation level, Quintile 4 performed significantly better than the other quintiles and no
statistically significant difference was found between the achievements of any two of Quintiles 1, 2
and 3. The impact of quintile ranking on learner achievement was ascertained by the use of partial
Eta Squared. The result (Table 4.16) shows that there was a significant difference between the
quintile ranking of schools at the Knowledge level, F (3.485) =.0.000, ᶯ2 = 0.458.
“Comprehension” and quintiles showed statistical significance, F (3.485) = 0.000, ᶯ2 = 0.458;
“Application” and school quintile showed statistical significance, F (3.485) = 0.000, ᶯ2 = 0.245;
“Analysis” and school quintile showed statistical significance F (3.485) = 0.000, ᶯ2 = 0.573;
“Synthesis” and school quintile showed statistical significance F (3.485) = 0.000. ᶯ2 = 0.020.
“Evaluation” and school quintile showed statistical significance F (3.485) = 0.000 ᶯ2 = 0.080.
Table 4.16: Test of between-subject effect
Dependent
variable
Sum of
squares df
Mean
square F Sig.
Partial
Eta
Squared Know Contrast 110057.427 3 36685.809 129.747 .000 .445
Error 137133.113 485 282.749
Comp Contrast 109958.974 3 36652.991 136.882 .000 .458
Error 129868.896 485 267.771
App Contrast 82009.125 3 27336.375 52.534 .000 .245
Error 252374.425 485 520.360
Ana Contrast 93745.709 3 31248.570 216.749 .000 .573
Error 69922.013 485 144.169
Syn Contrast 5120.730 3 1706.910 3.350 .019 .020

95
The F tests on the effect of quintile ranking of schools. This test is based on the linearly independent pair-wise
comparisons among the estimated marginal means.
The result showed that 4.16, 44.5% of all the variances in 45% of the variances in “knowledge” is
attributed to quintile ranking; 46% of variances in “comprehension” is attributed to quintile ranking;
25% of variances in “application” is attributed to quintile ranking; 57% of variances in “analysis” is
attributed to quintile ranking: 20% of variances in “synthesis” is attributed quintile ranking and 80%
of variances in “evaluation” is attributed to quintile ranking.
4.2.3 Learners’ errors and misconceptions
Mathematical errors have been defined as a deviation from accuracy or correctness (Harper, 2010).
Other researchers such as Elbrink (2008) have also defined mathematical errors as mistakes learners
make when solving problems. These researchers are of the opinion that the errors may be caused by
carelessness, misinterpretation of symbols or text; lack of relevant experience or knowledge related
to that mathematical topic; learning objectives; concepts; lack of awareness or inability to check the
answer given; or as a result of misconceptions.
The quest to enhance learner performance has led mathematical researchers and educators into
conducting error analysis, i.e. a study of errors in learners’ work with a view to finding explanations
for the cause of the learner’s errors. Studies like that of Riccomini (2005) have identified two major
types of errors, systematic errors and unsystematic errors. According to Riccomini (2005),
unsystematic errors are errors made unintentionally; they are non-recurring errors that learners can
easily correct by themselves. They normally happen as a result of carelessness (Yang, Sherman &
Murdick, 2011). On the other hand, systematic errors are those errors made out of poor reasoning.
In most cases learners who make these errors think their answers are right. This provides evidence
that learners get these questions wrong as a result of misconceptions on the topic. Such errors are
permanent and cannot be corrected easily by the learners themselves. Learners need to be assisted
before they become aware of their mistakes.
Error 247121.090 485 509.528
Eva Contrast 20796.165 3 6932.055 14.126 .000 .080
Error 238001.123 485 490.724

96
A number of studies have described the errors learners make when solving mathematical problems
of which some are highlighted here. Hodes and Nolting (1998) identified the following types of
errors learners make in the mathematics classroom. Notably among them are reading errors, the
type of errors learners make because they cannot read keywords or symbols correctly in a text;
comprehension error, made because learners misunderstand the questions they read; transformation
errors, made because learners find it difficult to identify the operation or sequence of operations
needed to solve the problem despite the fact that they are well able to read and understand the
questions. Procedural errors emanate from an incorrect algorithm or by missing the steps needed to
complete a procedure. Encoding errors are the errors learners make due to the inappropriate
presentation of the solution. For the purpose of this study, learners’ mathematical errors were
classified into three, namely computational errors, structural errors and procedural errors.
4.3 ANALYSIS OF QUALITATIVE DATA
A qualitative data analysis was done to bring about a better understanding of the quantitative data
analysis presented in the previous section. The analysis consisted of a content analysis of the
learners’ solutions to the cognitive test items. A report on how learners performed in solving each
category of questions under Bloom’s taxonomy and the different content knowledge is presented in
this section.
4.3.1 Content analysis of learners’ performance
The quantitative analysis of the school quintile rankings showed that there was a statistically
significant difference in all the different school quintiles at all levels of Bloom’s taxonomy except
for the “synthesis” cognitive level. The study adopted a model used by Ogbonnaya (2010),
mathematical production system performance analysis (MPSPAF), to analyse teachers and learners'
performance at various levels of an achievement test in trigonometry and a model put forward by
Frensch and Funke (1995) to analyse the data collected in this study. The analysis included but was
not limited to the statistics of the number of questions that were “completely correct,” “partially
correct,” “completely wrong,” solutions as provided by learners in each school quintile. The
analysis will be presented based on the highlighted aspects taught in “probability” and the
“cognitive” levels. The section describes the two models and how they are used to analyse learners’
problem-solving skills. The cognitive levels in which there were notable differences in performance
were “knowledge,” “comprehension,” “application,” “analysis” and “evaluation.”

97
4.3.1.1 Mathematical production system performance analysis framework (MPSPAF)
According to Ogbonnaya (2010), MPSPAF is an application of systems engineering principles and
methods and cognitive science research in human cognitive architecture used in explaining the
process of solving a mathematical problem. The system is designed for an input process, output
system that converts the input to the desired output or solution. The input comprises the givens or
raw materials; the process consists of the exchange of information needed to get the result and the
output is the expected results or finished product. A problem solver in one way or another makes
use of these steps when solving a mathematical problem. Relating to the mathematical problem-
solving scenario, the input refers to the operation used to reach the expected goal. Normally,
questions that are asked during an examination have specific conditions or constraints. These
conditions are what problem solvers are expected to identify and use to solve the given questions.
One is expected to have knowledge of or understand these conditions to enhance easy solving of the
problem. Similarly, the process aspect of the MPSPAF in solving mathematical problems refers to
the concepts and formulas one is expected to use to solve a given problem. Comparatively, the
output refers the solution to the problem. Hence it can be seen that solving a mathematical problem
fits well into MPSPAF, the framework applied in system engineering. Based on this, the framework
was adopted to analyse the problem-solving skills of Grade 12 learners in probability. In the course
of doing so, these learners’ errors in the topic are highlighted.
Figure 4.4 Mathematical production system performance analysis frameworks (MPSPAF)
(Adapted from Ogbonnaya, 2010)
4.3.1.2 Production system problem-solving model (PSPSM)
Similar to the MPSPAF, the production system problem-solving model (PSPSM), put forward by
Frensch & Funke (1995) for analysing learners’ problem-solving skills, consists of three stages,
namely the given, the operators and the goal. The given encompasses all the conditions and
constraints given in the question.
Output section Processing Input problem
solving conditions

98
Figure 4.5: Production system problem-solving model
The operators refer to the tools that are used to solve the problems and the goal is the expected
solution to the problem. According to the author, between the given and the goal are barriers. These
barriers are those things that the problem solver lacks and as a result he/she is limited from arriving
at the desired solution. The barriers can be a lack of knowledge, experience and so on. When a
person is confronted with a problem there is a likelihood that he/she will fall back on previous
experience or knowledge to enhance producing the desired solution. If one lacks the experience or
knowledge required to solve a problem the chances of solving that particular problem are likely to
be slim. What normally happens during problem-solving is that based on the inputs or givens in the
problem and one’s previous knowledge or experience, one is able to have a diagram or a pictorial
view of the said problem. The picture that is formulated from this paves the way for the problem to
be solved with ease. This is to say that if one encounters a problem and is unable to picture that
problem, executing it becomes a challenge.
This is what Silver (as cited in Ogbonnaya, 2010) describes as the path from the initial stages of the
problem to the solution. Every good problem solver is able to develop a concise algorithm in
solving a particular problem. Developing this algorithm is easy if one has experience or knowledge
of the problem. Once this aim becomes difficult to reach, then the question becomes a hard nut to
crack.
Similarly, Duncker and Lees (1945) pointed out that a problem may exist when a person has a goal
but does not know how to achieve it. This suggests that there are barriers to the goal, a view
supported by Frensch and Funke (1995). The barriers emanate from learners’ misconceptions on the
said topic. Niadoo and Ranjeeth (2007) noted that in solving a problem, it is expedient that one
Barriers
Operators
Goal Given

99
selects a structure from long-term memory and copy it into the working memory before processing
the problem or before the problem can be executed. The process of doing this is prone to error. The
errors are likely to arise from a wrong problem-solution structure or an incorrect execution of the
procedures. An error is likely to arise from misconceptions, the incorrect execution of the
procedures, or from conceptual lapses. The discussion presented in this study suggests that both
models, the MPSPAF and PSPSM, have similar features. The study would, therefore, adopt both
models to categorise errors made by learners when solving probability problems.
4.4 ERROR ANALYSIS IN THE DIFFERENT ASPECTS OF PROBABILITY
Learners’ tasks were marked with attention being paid to the systematic and unsystematic errors
made. As explained in Section 4.1.5, systematic errors are those errors learners can correct by
themselves. Systematic errors arise as a result of reading the question and computation errors.
Unsystematic errors are those learners cannot correct by themselves. They normally arise due to
wrong procedures and conceptual limitations (misconceptions) made in solving the questions. The
answers were marked as “completely correct” if the procedure and answers presented were correct;
on the contrary, the answers presented were also marked as “partially correct” or “completely
wrong.” An investigation was carried out into the possible cause of these errors. Figure 4.6 presents
an error analysis of learners’ scripts according to structural error, computational error and
procedural error.
Figure 4.6: Percentages of learners per type of error

100
4.4.1 Mutually exclusive events
The questions asked in the probability task on these aspects involved identification of these
concepts from a given Venn diagram (see Appendix A for questions) and a few applications.
Learners were to provide reasons for their choices. It was detected that learners had challenges in
giving reasons for their choices. A few captions of learners’ work are given in Vignette 4.4 and
Vignette 4.5.
Vignette 4.4: Learner A Vignette 4.5: Learner B
Vignette 4.6: Learner C Vignette 4.7: Learner D
Question 1.2.1 of the cognitive test, asked learners to:
1.2 Write down a mathematical expression for P (A or B); if A and B are mutually exclusive (see
Appendix A)
In this question, learners were supposed to understand the meaning of the “or” to be “union”, and
also to know the definition of “mutually exclusive” to be P (A∩B) = 0. They were supposed to
write the answer as P (A or B) = P (A) + P (B) since the intersection of the two events is empty in
this case. Looking at Vignette 4.5 (Learner B) the answer the learner gave indicates that he or she
did not understand the meaning of the “or” as well as the definition of “mutually exclusive”.

101
Learner D in Vignette 4.7 also did not understand the meaning of the word “or”. This learner also
had a problem with the notations as used in probability. Their answers demonstrated a limitation in
the concept or misconception as a result of a structural error.
These questions are regarded as “lower cognitive” and the concept is a prerequisite to doing well in
the “higher cognitive” level (Bloom, 1956). It is therefore expected that these properties and
definitions should be clearly explained to learners to enhance their problem-solving skills.
4.4.2 Complementary events
Learners were given questions that needed the application of the knowledge of complementary
events as given in the question below:
Given that 𝑃(𝐴) = 0,6 𝑃(𝐵) = 0,5 𝑃(𝐴 ∩ 𝐵) = 0,2
2.3 𝐹𝑖𝑛𝑑 𝑃(𝐴 ∪ 𝐵)′
They were expected to understand the notations as used in the questions and then make use of an
appropriate formula to solve the question. The question ought to have been solved as given below
P (AUB) 1 = 1- P (AUB) = 1- 0.9 = 0.1.
The answer provided by Vignette 4.8 suggests that the learner had understood the question.
However, the answer was wrong because of the answer from the previous question. The learner got
the formula for the addition law wrong in question 2.2, so although the learner got the formula for
the complementary event correct, the substitution was wrong. This is an error that can easily be
corrected once the misconception made on the addition law is corrected. In the addition law the
mistake was that instead of adding P (A) to P (B) the learner was multiplying them, which is
incorrect.
Vignette: 4.8
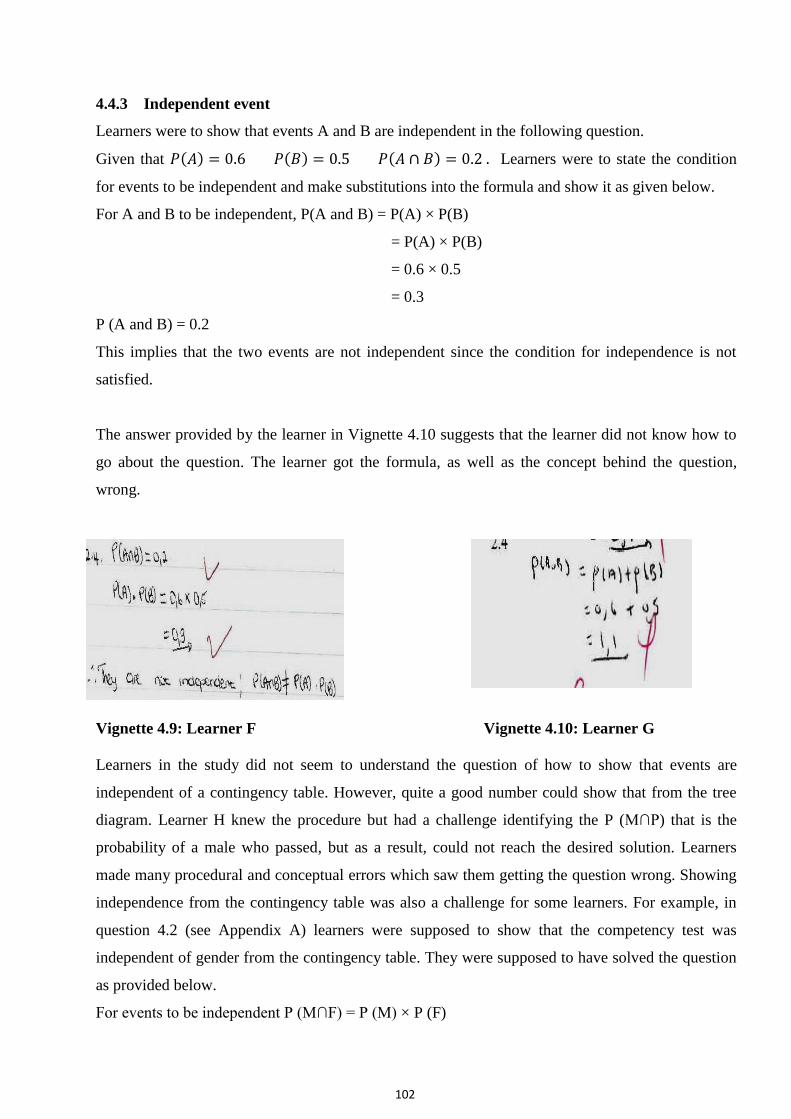
102
4.4.3 Independent event
Learners were to show that events A and B are independent in the following question.
Given that 𝑃(𝐴) = 0.6 𝑃(𝐵) = 0.5 𝑃(𝐴 ∩ 𝐵) = 0.2 . Learners were to state the condition
for events to be independent and make substitutions into the formula and show it as given below.
For A and B to be independent, P(A and B) = P(A) × P(B)
= P(A) × P(B)
= 0.6 × 0.5
= 0.3
P (A and B) = 0.2
This implies that the two events are not independent since the condition for independence is not
satisfied.
The answer provided by the learner in Vignette 4.10 suggests that the learner did not know how to
go about the question. The learner got the formula, as well as the concept behind the question,
wrong.
Vignette 4.9: Learner F Vignette 4.10: Learner G
Learners in the study did not seem to understand the question of how to show that events are
independent of a contingency table. However, quite a good number could show that from the tree
diagram. Learner H knew the procedure but had a challenge identifying the P (M∩P) that is the
probability of a male who passed, but as a result, could not reach the desired solution. Learners
made many procedural and conceptual errors which saw them getting the question wrong. Showing
independence from the contingency table was also a challenge for some learners. For example, in
question 4.2 (see Appendix A) learners were supposed to show that the competency test was
independent of gender from the contingency table. They were supposed to have solved the question
as provided below.
For events to be independent P (M∩F) = P (M) × P (F)

103
𝑃(𝑃) =118
200; 𝑃(𝑀) =
78
200
118
200×
78
200 = 0.23
𝑃(𝑀 ∩ 𝑃) =46
200 = 0.23
Because the condition is satisfied, it implies that competency is independent of gender.
4.3 𝑃(𝐹) =82
200; 𝑃(𝐹) =
122
200
82
200×
122
200= 0.25
𝑃(𝑀 ∩ 𝑃) =50
200
= 0.25
This implies that the competency test is independent of gender. However, the answer provided by
Learner K suggests that he/she lacked both the conceptual and the procedural understanding of the
question.
Vignette 4.11: Learner H Vignette 4.12: Learner K
4.4.4 Dependent events
Learners were given a question that demands the selection of an object from a container without
replacement and with replacement. With regard to this concept of selection with and without
replacement from a container, the latter was found to be the most challenging for learners. Learners

104
had problems, particularly in identifying the probabilities in the second selection where the first
selected ball was not replaced. For example, Learner I understood the concept of drawing the tree.
The learner got the branches of the tree right (which represented the different colours correctly) as
well as the number of different experiments done right. However, the learner struggled to identify
the probabilities particularly in the second trial (experiment) because the ball was not replaced in
the (3.1.1). One would expect that the total number of balls, as well as the total sample space,
remain intact after every selection.
These learners lacked this concept and, as a result, made mistakes in recording the wrong
probabilities in 3.1.2. The balls were not replaced after the first selection, thus it was expected that
the total number of balls in the second selection, as well as the different colours, would be reduced
by one. The answers provided by the learners paint the picture that he or she did not understand
what was really happening to the number of balls left, particularly in situations where balls are not
replaced after selecting a ball.
Vignette 4.13: Learner I
4.4.5 Use of Venn diagram

105
Vignette 4.14: Learner M, Vignette 4.15: Learner N
Learners were to illustrate information given in the question on a Venn diagram. They needed to
understand the notations as used in Venn diagrams and an understanding of the various regions in
the Venn diagram to be able to do this task. The errors detected were learners’ inability to put
figures in their respective regions on the Venn diagram. For example, the probability of A given as
0.6 is expected to be put on top of the circle of A as illustrated by learner M in vignette 4.14. This is
because the probability represents the probability of the entire circle not just inside the region of A
only (A ∩B1). Furthermore, the probability of P (A ∩ B) was expected to be put in between the two
circles as shown in Vignette 4.14 by learner M. However, some learners made mistakes in putting
the right figures where they ought not to be put for example the case of (learner N) and this led to
most of them getting the question wrong. The total probability on the Venn diagram is expected to
be 1. This is obtained by adding all the figures from their respective region and this was expected to
be put onto the Venn diagram as shown by learner M, however some learners got this wrong, for
example, learner N, who took the total probability as 1.3, which is an error since no probability is
greater than 1 according to basic axiomatic definition of probability. Coupled with that the learner
wrongfully placed the figures in the respective regions
4.4.6 Use of the contingency table
Vignette 4.16: Learner O Vignette 4.17: Learner P
Vignette 4.18: Learner Q Vignette 4.19: Learner R

106
The contingency table, like the tree diagram; is an effective way of solving probability problems.
Learners are expected to know how to read the various columns and rows from the table. Learners
were asked to complete the table with some missing figures (see Appendix A). They were also
asked to use the table to calculate some probabilities. With regard to finding the figures on the table,
the learners were expected to ensure that the sum of all the figures in the rows equalled the total on
the row and the sum of all columns equalled the total on the column. The grand total was
represented where the totals on the rows and the total on the columns on the table met. A typical
example of the solution to the question, as seen in the answers provided by learners in Question 4.4,
shows learners’ weakness in reading the figures from the correct columns and rows. Another
challenge worth noting is the correct interpretation of the word “OR” as used in probability and also
in reading figures from the tables. They were to find the probability of a male OR a female passing.
The answers provided show they lacked understanding of the expression “a male who passed” i.e. P
(M ∩ P).
4.4.7 Fundamental counting principle
Vignette 4.20: Learner T Vignette 4.21: Learner U
Questions on the arrangement of letters or objects where letters or objects are repeated and not
repeated were seen to be a challenge for learners in this section. Selections of objects were poorly
answered by learners. For example, in the question:
Write down all three-word arrangements that can be made if the
5.11 letters are repeated
5.12 letters are not repeated.
The answer provided by learner U in vignette 4.21 suggests that the learner did not understand the
question. The learner was expected to list the different arrangements according to the conditions
given in the question as seen below.

107
Six different arrangements
MAN AMN NAM
MNA ANM NMA
The answer provided by the learner in Vignette 21 is an indication of a misunderstanding of the
language of the question. Another major problem that contributed to learners’ poor performance in
answering these problems was misunderstanding of the word factorial and how to identify it even
on the calculator. The responses provided by Learner U articulated that he/she had scant knowledge
on the question being asked. Learner U was expected to list all the different arrangements that could
be made from the word ‘MAN’ if the letters were repeated. The response given illustrates that the
learner had a poor understanding of the questions in 5.11 to 5.22. The learners’ challenge had to do
with a poor understanding of the question. Although the learner seems to have a fair idea of the
question, the answer provided was not the correct response the examiner expected.
4.5 REPORT ON RESEARCH QUESTIONS
The findings of the analysis presented in Section 4.3 and 4.4 above were used to answer the
research question of the study. Section 4.5 addresses these questions.
4.5.1 Research question one
The first research question was: What are Grade 12 learners’ achievements in probability according
to Bloom’s taxonomy? This question was answered by the achievement of learners in the cognitive
test on probability.
To answer the first question, descriptive statistics were computed and learners' results analysed. The
mean and standard deviation of learners’ scores were recorded (Section 4.12; Table 4.2) Then
results revealed that the mean scores of learners in the “knowledge” and “cognitive” levels were 69
and 77, and the standard deviations were 22 and 69. The mean score of the comprehension
cognitive level was 40 and 70, and their standard deviations recorded as 22 and 19. In the
“application” cognitive level learners’ mean scores were 41 and 28, and their standard deviations
recorded as 26 and 12. Learners’ mean score and standard deviation in the “analysis” cognitive
MMM MAN MNN AAA AMN AMM NNN NAM NMM
MMA MNA MAM AAM ANM AMA NNA NMA NAN
MMN MAA MNM AAN ANN ANA NNM NAA NMN

108
level were seen to be 34.44 and 18.34 respectively. In the “synthesis” cognitive level learners’
achievement in terms of mean scores and standard deviation were identified to be 34, 44 and 18
respectively. In the “evaluation” cognitive level learners’ achievements were identified to be 12.21
and their standard deviation of 23.23. Learners who achieved a 50% and above pass mark for the
different cognitive levels were also recorded. It was seen that at least 82% achieved this in the
“knowledge” cognitive level, 39.3% achieved it in at least the “comprehension” cognitive level, at
least 40.8% in the “application” cognitive level, 28.3% in the “analysis” cognitive level and 18.8%
in the “synthesis” cognitive level and lastly, 5.2% in the “synthesis” cognitive level. The study
revealed that learners’ performance, according to the different cognitive levels, increased from
“knowledge” to “application”, “comprehension”, “analysis” and “synthesis” and lastly evaluation.
4.5.2 Research question two
Research question two investigated learners’ problem-solving skills according to the different
concepts taught in the Grade 12 probability topic in the CAPS mathematics document. In doing this
different analyses were made according to the learners’ performance in the different aspects. First
and foremost, descriptive statistics on learners’ performance on the different content knowledge
levels were presented, the frequency distribution of the different aspects in probability according to
the DBE, South Africa were presented, and rankings were also presented. The frequency of learners
who achieved at least 30% and at least 50% were presented as well as the performance of learners
according to questions they had “completely correct”, “partially correct” and “completely wrong”.
Based on the findings, it was concluded that learners performed well on questions on the use of
Venn diagrams. In terms of their means, learners performed better in mutually exclusive and
complementary events than in dependent events and independent events. However, it is worth
noting that the standard deviation of the learners’ performance in the former was more widely
spread than in the latter. In terms of the number of learners, more learners excelled in dependent
events and independent events than in mutually exclusive and complementary events. Learners’
performance in the use of the tree diagram followed closely. The use of contingency tables followed
by their performance on fundamental counting principle came last. This indicates that learners’
problem-solving skills in the fundamental counting principle was the weakest performance among
all the aspects of probability in this study.
4.5.3 Research question three
Research question three was: What is the impact of quintile rankings on Grade 12 learners’
problem-solving skills? As part of the study, the achievement levels of learners in terms of their

109
different quintile levels were measured. This was done according to cognitive levels and also
according to the different aspects of probability as enshrined in the CAPS document. The findings
in Table 4.4 reveal that Quintile 4 achieved higher than all the other school quintiles at all cognitive
levels of Bloom’s taxonomy; knowledge, comprehension, application, analysis, synthesis and
evaluation. Quintile 1 followed, showing higher achievement than Quintiles 2 and 3 at all cognitive
levels except for synthesis where the learners achieved slightly lower than Quintile 2 learners. It is
worth noting that a small number of learners in Quintile 2 obtained a score of 100% on questions
relating to aspects of mutually exclusive events, independent events and dependent events. Quintile
3 learners had the lowest achievement scores at all cognitive levels.
The learners’ performance, according to the different subtopics, was also analysed. The frequency
distribution of learners according to their performance in the different aspects of probability is
presented in Tables 4.9–4.14. The findings revealed that Quintile 4 learners excelled in most of the
topics followed by Quintile 1 and Quintile 3. It must be noted, however, that the overall
performance of learners in the “fundamental counting principle” was quite below expectation while
their performance in Venn diagrams was quite commendable. The study showed that there was a
significant difference between all the aspects of probability and school quintiles after subjecting the
data through the Welch ANOVA. The impact of quintile ranking on learner achievement was
ascertained by the use of partial Eta squared (Table 4.17). The result showed that 4.16 marks,
44.5% of all the variances in 45% of the variances in “knowledge” are attributed to quintile
rankings; 46% of variances in “comprehension” is attributed to quintile ranking; 25% of variances
in “application” is attributed to quintile ranking; 57% of variances in “analysis” is attributed to
quintile ranking; 20% of variances in “synthesis” is attributed to quintile ranking and 80% of
variances in “evaluation” is attributed to quintile ranking.
4.5.4 Research question four
Research question four is: What are the errors and misconceptions of learners’ in probability? This
question answered the different types of errors and misconceptions learners face when solving
problems in probability and counting principles. A content analysis was done. Learners' errors in
the different aspects of probability were identified. In doing this, learners’ weaknesses and strengths
in the different aspects of probability were measured by critically observing the questions they had
answered “completely correct”, “partially correct” and “completely wrong.” Learners’ errors were
categorised into structural, computational and procedural errors. These errors were measured based
on their performances in questions on mutually exclusive; complementary; dependent events and
independent event; use of a Venn diagram; use of a tree diagram; use of a contingency table and

110
also the fundamental counting principle. It was identified that learners were weak in solving
fundamental counting principles and excelled the most in the use of Venn diagrams to solve
probability problems.
4.6 PROJECTION FOR THE NEXT CHAPTER
The next chapter discusses the findings and the implications of the results. It also attempts to relate
the findings to the relevant literature.

111
CHAPTER FIVE
DISCUSSION OF FINDINGS
The chapter presents a discussion on the findings and the implications of these findings. The
findings are discussed according to the research questions as listed in Section 1.6.
5.1 RESEARCH QUESTION ONE
The first research question was: What are Grade 12 learners’ problem-solving skills according to
Bloom’s taxonomy? To answer this question various analyses were done. The results of data
analyses (see Section 4.12) show that learners were more successful in answering questions in the
knowledge category and least successful in answering questions in the evaluation category. This
trend was seen across all quintiles. With the exception of Quintile 1 that performed better in
“application” than “comprehension”, all other quintiles achieved higher in “comprehension” than
“application” (Table 4.4). It must be noted that even the overall performance of learners in the study
with regard to their mean mark was higher in “application” than in “comprehension.” The findings
also show the percentage of the learners in the study who achieved 50% and above in the
“knowledge”, “comprehension”, “application”, “analysis”, “synthesis” and “evaluation” levels of
the Bloom’s taxonomy. These are 82%, 39.3%, 40.8%, 28.3%, 18.8% and 5.2% respectively. These
figures confirm the fact that learners in the study were more successful in the lower cognitive
levels, particularly “knowledge” and “cognitive demand”, than in the levels of higher cognitive
demand.
Though learner achievement in “synthesis” and “evaluation” was poor, it is promising that they
obtained a substantial level of achievement in knowledge. This might be due to the fact that
knowledge questions do not put a great cognitive demand on learners. Most teachers tend to ask
about 80% knowledge-type questions during teaching (Fredericks, 2005). According to Polya
(1957), problem-solving is not innate; it is a skill that can be developed through exposure. When
learners are more exposed to questions they tend to develop the skill in solving problems of that
nature. The fact that these learners did well in one cognitive level and performed poorly in another,
suggests that they have not had enough exposure with regard to such activities. Most of the
exercises and tests in the majority of introductory mathematics courses typically address the lower
levels of the taxonomy rather than those that are on a higher cognitive level (Karaali, 2011).
Achievement on the higher cognitive level decreases from “analysis” through to “evaluation”. This
is in consonance with Bloom et al.’s (1956) view that the cognitive levels are hierarchical in nature

112
and as such higher levels demand the skill of the lower levels reflecting the reason why learners
performed better in lower levels than higher levels.
However, the achievement on the lower cognitive levels also decreases from “knowledge of
application” to “comprehension”. The result is a deviation from Bloom’s taxonomy (1956) as well
as that of Vidakavic, Bevis and Alexander (2004) that the cognitive levels are hierarchical from
“knowledge” to “evaluation”. However, the findings are in consonance with Radnehr and
Almolhodaei (2010) that the assumption that the cognitive levels are ordered on a single dimension
from simple to complex is a weakness in the original taxonomy.
Reasons accounting for learners’ higher achievement in application questions rather than in
comprehension questions could be an issue of poor or lack of understanding of the language, thus
they resort to the use of formulas and algorithms to solve the problems without really understanding
the question. Learners tend not to understand questions involving the higher level cognitive levels,
as asserted by Meaney et al. (2012). Lower achievement on the higher cognitive level is not a good
sign for the future of learners in academia, as these higher level questions are instrumental in
strengthening the brain (Fredericks, 2005). Moreover, questions on the higher-order level also
facilitate the development of critical thinking skills and problem-solving (Bloom et al., 1956).
According to Bloom (1956), the cognitive levels are hierarchical in nature, meaning that one needs
knowledge from a lower level before proceeding to higher cognitive levels to answer questions on
that level. The finding presupposes that learners had the algorithms for solving these problems, but
not that they necessarily understood the concepts behind them. Despite this fact, it is worth noting
learners’ ability to apply the algorithms learnt in order to solve to solve a problem, is commendable.
5.2 RESEARCH QUESTION TWO
The second research question was: “What are Grade 12 learners’ problem-solving skills according
to the different aspects of probability taught in the CAPS mathematics curriculum?” In answering
this research question, different analyses were done to ascertain how the learners in the study
performed. Among the analyses were descriptive statistics, distribution of learner performance
according to the Department of Education performance levels, frequencies of learners’ achievement
in exceeding 30% and 50% scores, learner performance according to the question they had
“completely correct”, “completely wrong”, “partially correct” and no solution offered; and lastly,
frequency distribution of learner performance in the different aspects of probability according to
quintiles.

113
5.2.1 Mutually exclusive events
The descriptive statistics show that the minimum mark scored was 1 out of 11 and the maximum
mark scored by learners in the study was 11 out of 11. The mean mark of the learners in the study
was five (M = 5.34 (49%); SD = 2.74). This average, compared to the other aspects of probability,
was the second highest after the mean achievement in Venn diagrams, of learners in the study. The
percentage mean of the learners in the study on the concept, however, is below 50 %, an indication
that most of the learners in the study could not be awarded half of the marks in this aspect of
probability. This means that learners in the study lack the basic definition of the concept. To
enhance their performance, it would be prudent for teachers to expose them to more questions on
this topic.
It is argued by Polya (1957) that problem-solving is not innate and learners can develop their
problem-solving skills if they are exposed to more questions. Judging from this premise one can
deduce that the fact that learners are not performing well in the topic might be that they are not
getting sufficient exposure with regard to activities on the topic. It could also be that their teachers
are not drilling them enough on the basic definitions of the topic. Orawiwatnakul and Wichadee
(2016) argue that if different learning activities are included in courses, it would give learners the
opportunity to practise more in discussion and thus enhance their critical thinking as well as their
language skills. In addition, compared to the other aspects, the standard deviation of learners’
performance in this category was the third highest, an indication that though the learners might have
performed better in terms of average marks than their performance in other aspects of probability,
the difference in the marks of the learners in the study in this aspect was comparatively widely
spread. This is likely to be as a result of sourcing participants from different schools or quintiles.
The study also revealed that 69% of the learners in the study exceeded a 30% pass rate while 46%
exceeded a 50% pass rate (refer to Figure 4.2). This confirms the results reflected in Table 4.4,
namely that fewer than half of the learners in the study obtained 50% of the marks in this category.
However, the results from Table 4.5 indicate that 20% of the learners obtained 80% to 100% on the
topic while 31% of the learners in the study obtained less than 30%. The poor performance by
learners in the study confirms that teachers find the teaching of the topic challenging to teach, as
argued by Atagana et al. (2010), namely that teachers in South Africa still find the teaching of
probability a challenge.

114
5.2.2 Complementary event
The result from the descriptive statistics shows that the maximum mark scored by learners in the
study was 11 out of 11 and the minimum was 1 out of 11. The fact that a learner was able to get a
full score suggests that he or she understood the concept. However, the result from Figure 4.3
suggested that only 2 (4%) of the learners in the study were able to score maximum marks. The
majority, 438 (89%) of the learners partially solved the questions. This suggests that there is a
knowledge gap on the part of learners or their performance might be due to poor teaching strategies
or other teacher factors, as argued by Paul and Hlanganipal (2014). These researchers argue that
most teachers have little experience with the topic of probability and share a variety of probabilistic
misconceptions with their students that lead to the learners’ poor performance in the topic. The
mean score, which was 5.36 (49%), suggests that if a learner was selected at random from the class,
that learner was likely to score 49% on a test in this concept. This is an indication that the concept is
a challenge for learners to comprehend and a confirmation that the teacher’s knowledge on
probability is lacking in this concept compared to the performance of the learners in the study on
mutually exclusive events. However, comparing their performance in mutually exclusive events to
their performance in complementary events, one can observe that the difference in learner
achievement exceeding 30% and 50% was 2% and 4% respectively. This is an indication that more
learners in this study performed better in mutually exclusive events than in complementary events.
5.2.3 Independent event
The result of learners in the study in terms of average performance in the topic (M = 5.32; SD =
2.423) was lower than that of mutually exclusive events and complementary events. However, the
results in Table 4.5 show that more (4.1%) of learners in the study were able to score between 80%
and 100%, an improvement on the performance of learners in the study on mutually exclusive and
complementary events. Again, 76 % of the learners achieved at least 30% and 62% achieved at least
50%, a performance which is better than the performance of learners in the study in mutually
exclusive and complementary events. The reason for this improvement might be that learners are
more exposed to questions on this concept than on the topics of mutually exclusive events and
complementary events, as argued by Polya (1957) that when learners are more exposed to questions
on a topic they are able to perform better on the topic.
5.2.4 Dependent events
The results of the achievement of learners on this concept indicated that their understanding of this
concept is suspect. The average mark scored by the learners was 5.26 (48%), with a standard
deviation of 2.43. However, according to the analysis, learners’ understanding of the concept is

115
better than on the concept of independent events, although the difference in learners’ performance
in the two concepts was marginal. The result also makes a case that those teachers teaching these
learners in this study have a challenge in explaining the concept well to the learners, as noted by
Ogbonnanya (2014), namely that there is a positive relationship between teacher content knowledge
and learner performance.
5.2.5 Venn diagrams
The results shown in Table 4.4, Figure 4.2 and Figure 4.3 indicate that most of the learners excelled
in the use of Venn diagrams to solve probability problems. The descriptive statistics show that
learner achievement in the use of Venn diagram as aids to solve probability problems was 7.32
(67%), with a standard deviation of 2.89. The average mark in this category, compared to all the
other averages in the other concepts, was the highest. However, the standard deviation was the
highest compared to standard deviations in other concepts, an indication that the performance of the
learners in the study was the most widely spread. The cause of this is likely to be the difference in
quintile rankings of the school. Some schools are likely to be performing better than the others,
leading to a high difference in the marks of the learners in the study. The results in Table 4.10
confirm this assertion as only 4.2% of learners in Quintile 1 achieved less than 50% whereas 67%
of learners in Quintile 3 achieved less than 50%. This finding of this study contradicts the findings
of Makwakwa (2012) and Mutara (2015) that students in their study found the use of the Venn
diagram to solve probability problems a challenge. The reason for learners’ better achievement in
this aspect of probability in this study might be due to the regular workshops that are organized for
these teachers to enhance their understanding of the pedagogy and content. This is an indication that
teachers are becoming accustomed to teaching the concept of a Venn diagram.
Humbert (2014) asserts that the use of Venn diagrams increases learners’ test scores and suggests
that learners have confidence in their use. A greater number of learners were able to illustrate
information given in a question on the Venn diagram. Learners in the study performed better in the
use of Venn diagrams as an aid to solve probability problems than the use of concepts like tree
diagrams and contingency tables. This is evident in the number of learners that achieved at least
30% and at least 50%, as well as the number of learners that obtained 80% to 100% in the concept.
The reason might be that learners in the study are more exposed to questions on the concept and
also that teachers might have more experience in teaching this concept as compared to other
concepts, as argued by de Kork (2015) who also states that teachers with the most teaching
experience in a topic tend to have an understanding of the concepts and as a result have a greater
impact on their learners. In the light of the author’s experience, a high qualification is not enough to

116
enable learners to perform better in the topic of probability. Experience has a part to play too.
Furthermore, Venn diagrams happen to be one of the top three most popular graphic representations
that most teachers prefer to use, as argued by Coleman (2010), thus the likelihood exists that
teachers have greater confidence in teaching the concept resulting in their learners’ high
achievement in it.
5.2.6 Contingency table
The performance of learners in the study in the use of contingency tables did not differ from their
performance in the fundamental counting principle. With regard to the average marks scored, it is
the concept that produced the lowest mean mark, i.e. 3.11 (28%). The standard deviation (SD =
0,66) indicates that the marks scored by the learners in the study were not widely spread, meaning
that they all had similarly a low mark of about 28%. The study also revealed that this was the
concept with the highest number, namely 479 (98%) of learners falling into the “partially correct”
category. The fact that most of the students (92%) in the study had their questions partially correct
supports the claim by Bayaga (2010) that there is a good reason to suggest that learners’ level of
specific mathematical skills impairs their ability in statistics.
The use of contingency tables to solve probability problems was the only concept in which all
learners in Quintile 1 fell below a 50% score, while Quintile 4 had 99% of the learners below 50%,
Quintile 3 at 99%, and Quintile 2 at 96%. This finding contradcts the findings of Mutara and
Makonye (2015), who documented that learners in their study were successful in the use of the
contingency table. The difference in the findings could result from the fact that learners in this study
had experienced shortcomings in their foundation of the concept. It was expected that they woul d
perfom better because they were Grade 12 students, unlike the Grade 10 learners used in the study
by Mutara and Makonye (2015). The result could also be a problem of lack of resources and poor
teaching practices, as agued by Kodisang (2015), namely that these poor teaching practices could
impair students’ performance in probability. A review of the literature on the concept indicates that
research studies on learner performance are scarce thereby indicating that little has been done in
terms of research to improve the poor problem-solving skills of learners on this concept.
Notwithstanding these views, the fact that most of the learners fell into the partially correct category
is an indication that they had made certain errors that were procedural, computational or structural
in nature.

117
5.2.7 Fundamental counting principles
The fundamental counting principle was the most poorly answered question in this study. This is
evident in Table 4.4, Table 4.5; Figure 4.2 and Figure 4.3. The finding is in consonance with that of
Makwakwa (2012) that teachers in the study identified the concept of fundamental counting
principle as a challenge. Their performance in fundamental counting was below expectation. This
finding was also in agreement with the findings of learners' performance in probability in the
national mathematics paper 1 (DBE, 2016). The learners find the solving of fundamental counting
principle a challenge. The performance of the learners in the study is in consonance with South
Africa’s national diagnostic report (see Table 1.2). The finding of the study is an indication that
learners in this study find questions on this concept a challenge. Another challenge would be that
the concept is still new to teachers, as a result, they lack experience in teaching it (DBE, 2016).
In Quintile 2, two learners scored 100% in mutually exclusive events as well as in complementary
events and three learners scored 100% in dependent events as well as in independent events. These
exceptional performances from these learners suggest that they are likely to be outliers. These are
exceptionally good learners among the learners in Quintile 2 who might have done more work on
their own thus the fact that their performances are not necessarily reflective of their teachers’
efforts.
5.3 RESEARCH QUESTION THREE
Research question three was how are Grade 12 learners’ problem-solving skills in probability
related to learners’ school quintile ranking? In connection with the performance of learners based
on quintile rankings, the findings revealed that Quintile 4 achieved higher than all the other
quintiles at all cognitive levels of Bloom’s taxonomy: knowledge, comprehension, application,
analysis, synthesis and evaluation. Quintile 1 followed, showing higher achievement than Quintiles
2 and 3 at all cognitive levels except for synthesis where the learners achieved slightly lower than
Quintile 2 learners. Quintile 3 learners had the lowest achievement scores at all cognitive levels.
The Games-Howell Post-hoc Multiple Comparisons test showed that there were statistically
significant differences among the mean scores of the quintiles at knowledge, comprehension,
application, analysis, and evaluation cognitive levels. Generally, data were widely spread from the
knowledge, cognitive level to the evaluation cognitive level, while the mean scores decreased
substantially from the knowledge cognitive level to the evaluation cognitive level.
The fact that Quintile 4 (fee-paying schools) achieved higher than Quintiles 1, 2 and 3, namely non-
fee-paying schools, at all cognitive levels of Bloom’s taxonomy is an indication that the relationship
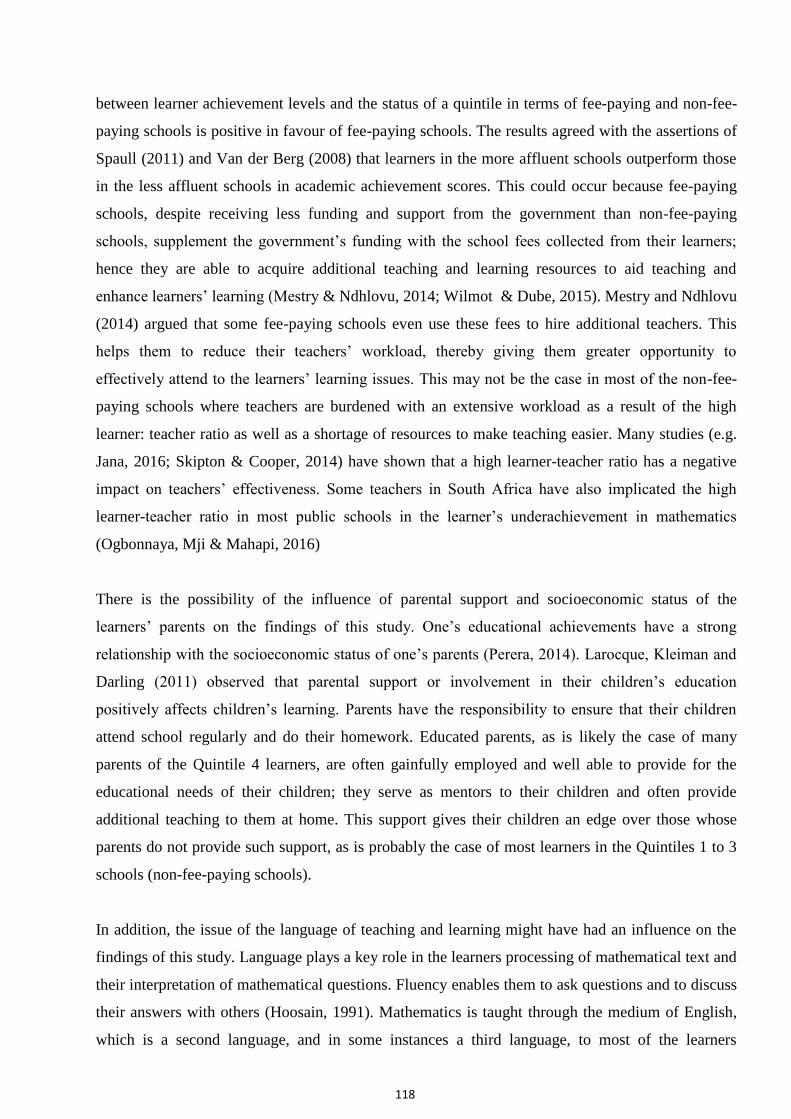
118
between learner achievement levels and the status of a quintile in terms of fee-paying and non-fee-
paying schools is positive in favour of fee-paying schools. The results agreed with the assertions of
Spaull (2011) and Van der Berg (2008) that learners in the more affluent schools outperform those
in the less affluent schools in academic achievement scores. This could occur because fee-paying
schools, despite receiving less funding and support from the government than non-fee-paying
schools, supplement the government’s funding with the school fees collected from their learners;
hence they are able to acquire additional teaching and learning resources to aid teaching and
enhance learners’ learning (Mestry & Ndhlovu, 2014; Wilmot & Dube, 2015). Mestry and Ndhlovu
(2014) argued that some fee-paying schools even use these fees to hire additional teachers. This
helps them to reduce their teachers’ workload, thereby giving them greater opportunity to
effectively attend to the learners’ learning issues. This may not be the case in most of the non-fee-
paying schools where teachers are burdened with an extensive workload as a result of the high
learner: teacher ratio as well as a shortage of resources to make teaching easier. Many studies (e.g.
Jana, 2016; Skipton & Cooper, 2014) have shown that a high learner-teacher ratio has a negative
impact on teachers’ effectiveness. Some teachers in South Africa have also implicated the high
learner-teacher ratio in most public schools in the learner’s underachievement in mathematics
(Ogbonnaya, Mji & Mahapi, 2016)
There is the possibility of the influence of parental support and socioeconomic status of the
learners’ parents on the findings of this study. One’s educational achievements have a strong
relationship with the socioeconomic status of one’s parents (Perera, 2014). Larocque, Kleiman and
Darling (2011) observed that parental support or involvement in their children’s education
positively affects children’s learning. Parents have the responsibility to ensure that their children
attend school regularly and do their homework. Educated parents, as is likely the case of many
parents of the Quintile 4 learners, are often gainfully employed and well able to provide for the
educational needs of their children; they serve as mentors to their children and often provide
additional teaching to them at home. This support gives their children an edge over those whose
parents do not provide such support, as is probably the case of most learners in the Quintiles 1 to 3
schools (non-fee-paying schools).
In addition, the issue of the language of teaching and learning might have had an influence on the
findings of this study. Language plays a key role in the learners processing of mathematical text and
their interpretation of mathematical questions. Fluency enables them to ask questions and to discuss
their answers with others (Hoosain, 1991). Mathematics is taught through the medium of English,
which is a second language, and in some instances a third language, to most of the learners

119
especially those in rural community schools. To achieve a high score in the test learners needed to
master the probability concepts, understand the questions and be able to communicate their
understanding in English when they answered the questions. Where learners experience difficulties
in grasping concepts and terminology in a subject because of a language barrier it will be difficult
for them to excel in it. This suggests that the poor achievement in the test of learners in Quintiles 1
to 3 compared to that of Quintile 4 learners may not be unconnected to the language barrier
experienced by learners in these quintiles.
Turning the focus to the non-fee-paying schools (Quintiles 1 to 3 schools), the findings of this study
show that Quintile 3 schools achieved least at all levels of Bloom’s taxonomy while Quintile 1
schools, the schools presumed to be least resourced according to the categorization, achieved above
Quintiles 2 and 3 schools at all levels of the taxonomy, except at the synthesis level where they
achieved slightly lower than Quintile 2. This is not in agreement with the assertion by the DBE (as
cited by Hall & Giese, 2008) that higher quintile schools perform better than lower quintile schools
in terms of achievement scores. While one may not rule out the possibility of ranking error in the
quintile ranking of schools (Collingridge, 2013), there is the possibility that effective school
leadership, teachers’ dedication and classroom teaching practices, as well as discipline on the part
of learners, contributed to the achievement of learners in the Quintile 1 schools. Quintile 1 and 2
schools in this study had such qualities. Quintile ranking errors may arise as a result of a regular
change in the context of schools due to factors such as relocations, transfer of learners, and their
schooling outside their communities. When this happens one might find learners of low
socioeconomic status in highly ranked schools and vice versa.. A school that might have been
ranked as a Quintile 4, for example, may not function as a Quintile 4 due to the fact that the learners
in the school might not be able to pay the fees. When this happens the whole ranking process would
have been an error. While it takes a period of time for a school to change its ranking status, all the
factors discussed may take place at any time within the academic year.
It is widely acknowledged that school leadership is one of the key factors that influence learner
learning and achievement (Dutta & Sahney, 2016; Shatzer, Caldarella, Hallam & Brown, 2014).
Leithwood, Harris and Hopkins (2008) are of the view that school leadership is next to classroom
teaching in influencing learners’ achievement. It is possible that Quintile 1 schools had stronger,
adept and more effective school leadership that inspired teachers and learners towards academic
excellence above that of schools in Quintiles 2 and 3. Effective school leadership and management
can instil passion in teachers and motivate learners towards academic excellence despite limited
teaching and learning resources. Under such school leadership, teachers will in all likelihood be

120
inspired to be resourceful, learners will be disciplined and these factors will lead to improved
instruction and consequently academic excellence.
One should also not rule out the effect of teacher knowledge and instructional practice on the
findings of this study, especially as it pertains to the non-fee-paying quintiles. Despite the fact that
all the teachers whose learners participated in the study were of comparable academic qualification
and years of teaching experience, there could be differences in their knowledge of the subject matter
and pedagogical knowledge that influenced their classroom practices and consequently the
achievements of their learners. The teachers may have qualified through participation in different
academic programmes, which implies that the content, and perhaps the quality, of their training may
also differ.
The results revealed that the mean score of the learners in all quintiles dropped, moving from the
lower levels to the higher cognitive levels of Bloom’s taxonomy. The low-level questions test
knowledge and comprehension; they ask for definitions requiring rote memorization and
paraphrasing of information given by the teacher or in textbooks. High-level questions require the
application, analysis, synthesis, or evaluation of information or concepts. Addressing a high-level
question requires critical thinking as a consequence of a conceptual understanding of the subject
matter. Learners’ poor achievement on the high-level questions suggests that they lack a conceptual
understanding of the topic which further suggests that the teaching of the topic in all the quintiles
focused more on memorization of concepts and procedures than on conceptual understanding. This
could have occurred because the teachers lack in-depth knowledge of the topic, which limited their
ability to teach in ways that could help their learners to think critically in order to address the high-
level questions.
5.4 RESEARCH QUESTION FOUR
The question was: What are learner’s errors and misconceptions in probability? To answer this
question errors and misconceptions were defined according to the literature and content analysis
was done to identify the various errors learners make while solving probability problems and also
the misconceptions that the learners had been also identified. The discussions are presented
according to the different aspects of probability.
5.4.1 Mutually exclusive events
The analysis revealed that of the 490 participants 10 (2%) of them did not answer questions on this
aspect; 36 (7%) got the question completely correct and 2 of the learners attempted the question but

121
got the question completely wrong. The majority of the learners 442 (90%) solved the question
partially. This means they got part of the solution correct and answered part wrongly. Errors and
misconceptions were identified from the questions they had completely wrong and those they had
partially correct. They were grouped into structural errors, computational errors and procedural
errors.
Most of the errors found here were structural in nature (Figure 4.6). There was no computational
error and procedural error. Learners' problems were a clear indication of their weaknesses in the
definition of these concepts. They tended to give poor reasons for their choices and in some cases
failed to give any reasons at all. This suggested that they might not have understood the concept
well.
5.4.2 Complementary events
In this aspect of probability, complementary events, 8 (2%) of the learners in the study did not
attempt the question on this aspect, while 2 out of 490 of the learners were able to completely solve
the question in this aspect. The learners who solved the question partially were 89% of the total and
2 of the learners got the question completely wrong. The content analysis revealed that learners
made two types of errors, structural and computational errors, with structural errors forming the
greatest number. These structural errors were identified to be misconceptions emanating from the
wrong definition of the concept. However, the computational errors were mistake learners made in
the use of calculators, multiplication of items, addition or subtraction. These are errors that can
easily be solved. The greatest challenge that led to a misconception in this aspect was the definition
of complementary events. Some learners in the study added complementary events and got more
than one. Others did not know that if two events are complementary then they must be mutually
exclusive (disjointed) and exhaustive (add up to give one). These are misconceptions that need
redress.
5.4.3 Dependent events and independent events
The dependent and independent event was discussed in one section because of certain similarities
and the learners’ challenge in differentiating between the two. Learners in this study performed
better in independent events as compared to dependent events. Learners were tested on probability
selection when there is a replacement and when there is no replacement, showing that two events
were independent, and also on applications of the use of the product rule. The errors identified with
the selection with and without replacement related to the counting of the events and the sample
space after each selection was made. The findings revealed that learners had difficulty in keeping

122
track of the number of items left in the bag and their effect on the probability of the next selection.
The problem with the product rule had to do with the wording, the use of “and” and intersection.
Learners interpreted these words incorrectly and as argued by Dean and Illowsky (2012) there were
also execution errors. These errors and misconceptions could be controlled by introducing learners
to additional questions and activities. This would enhance their familiarity and experience in
solving problems, as proposed by Angle (2007).
5.4.4 Use of Venn diagrams as an aid to solving probability problems
The performance of learners in the study in this concept was better than for all other concepts.
Learners in the study who were able to get questions in this concept “completely correct” numbered
26% and those that had the question partially correct at 71%. Among the errors and misconceptions
identified are the examples listed below.
With respect to the concept of Venn diagrams, learners in the study were tested on their ability to
illustrate information in Venn diagrams and find the probability of events from the Venn diagram.
Learners in the study found the identification of notations a challenge. Errors were made because
they could not differentiate between the symbol for union and intersection. They used them
interchangeably, leading to errors. The errors identified here were procedural, computational, and
structural; with procedural errors being the most common (refer to Figure 6).
From the analysis of errors, it was seen that learners had problems understanding the notations P
(A) and P (A only). Basic probability notations, for example, intersection (∩), union (U) and
complement (1), were misinterpreted. The basic definition of P (E) = n (E) / S was well noted by
learners, but the challenge was how to find the number of events and also the sample space.
Other learners could also not find the P (AUB) 1. The total probability of events in all regions in the
Venn diagram should add up to one. There were some learners who had the sum of probabilities in
the Venn diagram as greater than one. Few learners could find the P (AUB) 1 without the use of the
addition law. This is an indication that learners have problems understanding the underlying
principle of the addition law. On examining learners’ conceptual understanding, it was not difficult
to determine that they lacked knowledge on set theory.
The finding of the study on learners’ performance in the use of the Venn diagram as an aid does not
seem to align well with the findings of Mutara (2015) that learners have problems solving the
question on Venn diagram.

123
5.4.5 Use of tree diagrams as an aid to solve probability problems
The performance of learners in this study was not without errors and misconceptions. The learners
made more of procedural errors and computational errors although there were also a number of
structural errors. Content analysis on learners’ work on the concept of tree diagrams revealed that
learners in the study had a challenge in drawing tree diagrams. It was detected that the learners
misunderstood the concept of a number of experiments performed and the different choices from
which they were expected to select an object. Learners in the study lacked the understanding that
the experiment carried out represented the number of different trees and the branches represented
the different choices from which to select at a time.
Secondly, the concept of selection with replacement, and selection without replacement was one
identifiable misconception that was detected. This was seen in the sample spaces they had as they
continually selected from the box or container that contained whatever they were selecting. The
probabilities that learners indicated on their branches were affected by this misunderstanding. The
concept of the distinction between “or” and “and” was seen as a challenge to some learners. Basic
knowledge that the sum of probabilities on each branch should be one (1) was seen as lacking in
learners’ work. This suggests that if these highlighted concepts had been explained well enough to
learners and suitable questions given to them, their understanding would be significantly enhanced
when solving problems on tree diagrams. Contrary to the claim made by Mutara (2015) who
reported that learners were more confident in the use of tree diagrams and encountered few
challenges, the learners in this study performed very poorly in these concepts. However, Mutara
(2015) suggested that learners should be given additional support on the use of tree diagrams to
enhance their understanding of the concept.
5.4.6 Use of contingency tables as an aid to solve probability problems
Learners were examined for identifying missing figures on the two-way contingency table. They
performed appreciably in this section. Secondly, they were tested on the concept of mutually
exclusive on the contingency table. They were to identify if events were mutually exclusive and
also give reasons for their answer. Most (see Figure 4.5) were able to identify it, but only a few
could give reasons for the answer. The problem detected was that most of them could not express
themselves mathematically or even grammatically. Teachers are advised to assist learners on some
of these terminologies and mathematical notations so learners will be able to express themselves
adequately.

124
Learners were also tested on the concept of showing that events were independent. Their
performance was generally poor in these questions. Upon examination, it was detected that most
learners knew what the question was about, but made numerous procedural and computational
errors. Teachers are advised to assist learners in the methodology involved as well as the algebraic
computation required in solving problems of this nature. The last question exposed learners’ lack of
understanding of the concepts “or” and “and” as used in probability to identify the sample space
from contingency table. The author is of the opinion that learners should be given more questions to
assist them in understanding some of these words as used in probability. The learners in this study,
however, performed poorly compared to the findings in the use of contingency tables. The author
believes that teachers should be given greater support in terms of motivation and content workshops
to help them assist these learners better in the concepts.
5.4.7 Fundamental counting principles
The concept of the counting principles as enshrined in the CAPS document involves the use of
factorial notation, the arrangement of items, and general counting. It was detected that some
learners had problems with the basic definition of a factorial; some could not identify the symbol on
the calculator, a finding based on how they analysed questions in this section. Teachers are advised
to expose learners to a greater number of questions involving the use of this symbol and also set
more appropriate questions to enhance their understanding of factorial notation. It was also detected
that some learners had problems understanding the diction used. The authors, Dean and Illwosky
(2012) and Meaney, Trinick and Fairhall (2012) suggested that learners face challenges in
understanding the questions asked, which leads them to making errors.
One performance that is worth mentioning is the performance of three particular learners in Quintile
2 who were able to score full marks in the category of complementary events, mutually exclusive
events, independent events and dependent events. The teacher in this school had rich experience in
teaching the topic and had organised numerous extra classes for the learners. The performance of
these learners is a reflection of the fact that the difficulties experienced by other learners in this
topic are as a result of factors such as teaching strategy, learners’ weak background of the concept
or lack of teaching materials.
5.5 SUMMARY OF CHAPTER
The chapter has discussed the analysis of the performance of learners in the study by looking at the
respective research questions. Possible reasons were suggested for the causes of certain errors or

125
limitations identified by learners in the study. With regard to learner problem-solving according to
Bloom’s taxonomy, the study found that learners had the algorithms for solving problems but did
not understand the concepts behind them. A possibility suggested by some researchers is that
language acts as a barrier (Paul & Hlanganipai, 2014). These authors further suggested that
language barriers can lead to learners’ poor performance in probability. The study, however, noted
that the ability to apply algorithms learnt to solve the problem was commendable with regard to
learners in the study group. While it was detected that learners excelled the most in the use of Venn
diagrams, the performance of learners in the use of contingency tables and tree diagrams was found
to be a challenge. The study suggested that the reason for this might be inexperience on the part of
the teachers teaching the subject as well as limited or lack of exposure to more questions on the
concept.
A review of the research questions finds quintile ranking to have an impact on learner performance.
Though marginal, this had a measurable effect on learner performance in the topic. The four
research questions identified certain errors such as computational errors and poor identification of
symbols as used in probability to be some of the challenges learners are facing in solving
probability problems. Misconceptions emanating from structural errors and procedural errors were
also identified in the content analysis. The causes of these misconceptions were seen to emanate
from various sources. Particular among these are the teachers teaching concepts while their
knowledge is seen as suspect. In addition, the fact that the topic is presented to learners in an
abstract form was suggested by Fennema and Franke (1992) as a concern because teachers have
misconceptions that they share with their learners.

126
CHAPTER SIX
SUMMARY, CONCLUSION AND RECOMMENDATIONS
The chapter presents a review and summary of the study, gives conclusions and makes
recommendations mainly for educational purposes. In addition, highlights of limitations of the study
as well as suggestions for future research studies are presented.
6.1 SUMMARY OF THE STUDY
The study aimed to investigate Grade 12 learners’ problem-solving skills according to probability
and also the aspect of probability taught in the CAPS mathematics curriculum. The study was
conceptualised on Bloom’s taxonomy and the aspects of probability in the CAPS mathematics
curriculum. Data was collected using a cognitive test from 490 learners from four quintiles and
seven secondary schools. The methodology used was the mixed method and the design used was the
sequential explanatory design. The quantitative data were analysed and this was followed by a
qualitative data analysis.
The findings of the study revealed that learners excelled more in the lower cognitive levels, namely
“knowledge”, “comprehension” and “application” than in “analysis”, “synthesis” and “evaluation”.
However, they did better in application questions than in “comprehension” questions.
Regarding the learners’ performance in the different aspects of probability, the findings revealed
that learners excelled in the use of Venn diagrams to solve probability problems compared to their
performance in other aspects of the topic.
Regarding the impact of quintile ranking on learner performance, the result of the partial Eta
squared revealed that quintile ranking had an effect on learner performance though it was found to
be a moderate effect in all but evaluation of Quintile 4 (fee-paying quintile) that achieved a higher
mean score in probability than learners in lower quintiles, Quintiles 1 to 3 (non-fee-paying
quintiles), supporting the view that fee-paying quintiles achieve higher academic scores than non-
fee-paying quintiles. Among the non-fee-paying quintiles (Quintiles 1 to 3), there was a decline in
achievement from Quintile 1 to Quintile 3, supporting the view that quintile ranking, in essence the
socioeconomic status of schools, among non-fee-paying schools does not necessarily impact on
learners’ achievement in probability. Hence, the quintile system has a marginal effect on learner
achievement among lower quintile schools in this research.

127
On the issue of errors learners make and their misconceptions on probability, three main error types
were identified, namely errors due to computation, structural errors and procedural errors.
6.2 CONCLUSION
The study has shown that most learners in this study were not successful in questions that had a
higher cognitive demand, especially in “evaluation and “synthesis”. The findings of the study also
suggest that learners are particularly weak in the use of tree diagrams, contingency tables, and
fundamental counting principles as compared to other concepts of probability taught in the South
Africa mathematics curriculum. These are mutually exclusive and complementary events, the use of
Venn diagrams to solve probability problems, and dependent events and independent events all of
which are enshrined in the CAPS Grade 10–12 mathematics documents. Learners’ performance in
mutually exclusive events and complementary events; the use of Venn diagrams; dependent events
as well as independent events, however, was not exceptional since many answers were in the
category of partially correct solutions (Figure 4.5). Errors detected (see summary in Figure 4.6)
suggest misconceptions emanating from a poor understanding of the questions and a conceptual
weakness indicating that learners have problems in understanding concepts taught in lower classes.
It is an undoubted fact that probability is a challenge for both learners and teachers teaching the
topic in schools in South Africa.
Learners in Quintile 4 (a fee-paying quintile) achieved a higher mean score in probability than
learners in lower quintiles, Quintiles 1 to 3 (non-fee-paying quintiles), supporting the view that fee-
paying quintiles achieve higher academic scores than non-fee-paying quintiles. Among the non-fee-
paying quintiles (Quintiles 1 to 3), there was a decline in achievement from Quintile 1 to Quintile 3,
supporting the view that quintile ranking, in essence the socioeconomic status of schools, among the
non-fee-paying schools does not necessarily impact on learners’ achievement in probability. Hence,
the quintile system has a marginal effect on learner achievement among lower quintile schools in
this research. This is attested by the magnitude of the partial eta squared.
Overall, the findings of this study support the claim by Mpofu (2015) that the quintile ranking of
schools in South Africa is a useful tool but not a perfect means of categorisation to help improve
learner achievement. This is particularly true for topics (for example probability) that have been
newly introduced into the South African school curriculum.

128
6.3 RECOMMENDATIONS
From these findings, it is suggested that teachers adopt a problem-solving teaching approach in the
teaching of probability. Teaching mathematics by problem-solving is an inquiry-based method.
When teaching by this method, teachers should provide just enough information to establish the
background of the problem, leaving students to clarify, interpret and attempt to construct one or
more solution processes. This allows them to brainstorm while teachers guide, ask insightful
questions and share the process of solving the problem. This approach not only increases the
interaction between learner and learner and that between teacher and learner but it also enhances the
opportunity for relevant and vigorous mathematical dialogue between the learners. Ultimately,
teaching by means of this approach helps learners to construct their own deep understanding of
mathematical ideas and processes, because they are actively engaged in creating, conjecturing,
exploring, testing and verifying.
The fact that there is a wide standard deviation reveals that there is a high variation in learner
performance. In this regard, it is recommended that regular content workshops and professional
development should be organised for teachers to enhance their teaching methodologies of the
subject. The errors identified in the study suggest that teachers have low content and pedagogical
knowledge of the topic. In the first place, it is recommended that teachers should be assisted in this
regard by attending content workshops to enhance their relevant content and pedagogical skills.
Teachers should revise the concept of common fractions, mathematical operations, and the general
concepts of algebra to help learners avoid certain basic errors. Teachers should be supported by
their schools in the form of providing transport to encourage and serve as motivation for them to
attend these workshops. The workshops would help to enhance their understanding of the content as
well as improve their teaching methodologies. The study also revealed that there are wide variations
in learners’ scores on the aspect of probability. This could be solved by interaction between
experienced and inexperienced teachers so that the fresh teacher graduates from school or
inexperienced teachers would learn how to bridge that gap from their more experienced colleagues.
Teachers should assist learners on the use of calculators, especially the functions that deal with
probability, for example factorial notation. Learners should also be assisted in basic mathematics
topics as in a change of subject, fractions, and proportions. Learners’ inability to solve problems on
probability to reach the desired goal, apart from conceptual and structural weaknesses, was mainly
as a result of their weaknesses in these topics.

129
Textbook authors are also advised to pay close attention to activities that involve comprehension
questions and questions that involve the higher cognitive order, for example analysis, synthesis and
evaluation; as well as varied questions that involve the different terminologies and notations used in
the subject. It would be helpful if teachers and textbook authors would present questions in more a
practical way to learners instead of abstract presentations. This would go a long way to help them
appreciate the topic more. Learners are expected to be given more questions on these to enhance
their knowledge in the topic. Furthermore, the findings of this study provide evidence with practical
implications.
School leadership plays a significant role on learners’ achievement (Dutta & Sahney, 2016;
Leithwood, Harris & Hopkins, 2008); the leadership capabilities of the low quintile schools (non-
fee-paying schools) should be investigated with the view of providing necessary support to these
schools. The findings of this study also make a case for an in-depth study of teachers’ classroom
practices in teaching probability in schools across the different quintiles. The implication of the
findings of the study on how quintile ranking affects learner problem-solving skills in probability
suggests that the quintile ranking of schools, particularly among Quintiles 1, 2 and 3, may be a
useful but not a perfect means of categorisation to help improve learner achievement. The findings
of this study may be generalised, albeit with caution, to other provinces in the country because the
criteria for the quintile ranking of schools are identical across all nine provinces. The findings,
especially those relating to the drop in learners’ achievement from the lower to the higher cognitive
levels of Bloom’s taxonomy, might also apply to other countries given the problems learners have
in learning the topic probability in many instances.
6.4 SUGGESTIONS FOR FUTURE RESEARCH
Future research could look into other factors that affect learners' problem-solving skills in
probability, particularly teaching methods and resources used by both teachers and learners in
teaching probability. Teachers are the main source of knowledge for learners. The extent of their
knowledge and also their teaching methods as well as the resources used in teaching this newly
introduced topic would probably go a long way to realistically tackle the learners’ challenges in
problem-solving, particularly in the topic of probability.
Further studies could also delve deeper into ascertaining learners' problem-solving by conducting
interviews that would highlight the reasons for learner misconceptions in order to help stakeholders
and teachers to ascertain which area should be tackled the most thoroughly during class discussions
and how to supplement this study.

130
In conclusion, the study did not include independent secondary schools and Quintile 5 schools
because there were no such schools in the study area. Further study to include this category of
secondary schools and in another province would be of inestimable value to education.
6.5 LIMITATIONS OF THE STUDY
Because the study did not include independent and Quintile 5 schools generalisation of the results to
all schools in South Africa should be approached with caution. It should be pointed out that it would
be expedient to include these schools to make the research whole. The researcher did not conduct
interviews but used only a content analysis of the participants' scripts. Hence to enhance the
findings of the research it would be useful to include participant interviews to elaborate on the
reasons why certain errors and misconceptions occur.
Regarding the sampling of this research, some schools, due to the period (third term) when the topic
probability is taught in the school curriculum, opted out of the opportunity to engage with the
research study in order to allow their learners to prepare adequately for their final Grade 12
examination. It would be prudent to extend an invitation to more schools to validate the findings of
this study.
6.6 EPILOGUE
The study explored the problem-solving skills of learners in probability with focus on Grade 12
learners in rural schools. A substantial amount of the research looked into the effect of quintile
rankings and learner problem-solving skills among schools in South Africa, particularly in a rural
community. The study identified learners’ errors in probability and their strengths and weaknesses
at the various cognitive levels and also considered the various aspects of the Grade 12 mathematics
topic of probabilities. Conclusions were made based on the study’s findings and recommendations
have been made. Stakeholders in mathematics education within and outside South Africa may find
these recommendations helpful.
6.7 FINAL THOUGHT
Enhancing learner problem-solving skill in mathematics is the key that is needed to open more
economic doors in the 21st century. It is therefore imperative to ensure that learners who are
regarded as future leaders in every economy have the requisite problem-solving skills that can
impact future generations.

131
REFERENCES
Adu, E. O., & Gosa L. J. (2014). The teaching and learning of data-handling in primary schools:
South African Experience. Mediterranean Journal of Social Sciences, 5(23), 814-819.
American Psychology Association. (2011). The Publication Manual of the American Psychological
Association (6th ed). Washington, D.C: APA.
Anderson, D. R., Sweeney, D. J., & Williams, T. A. (1999). Statistics for business and economics.
(7th ed.). Cincinnati, OH: South-Western College
Anderson, E. (1980). Pleistocene mammals of North America. New York, NY: Columbia
University Press.
Anderson, W. L., Mitchell, S. M., & Osgood, M. P. (2008). Gauging the gaps in student problem-
solving skills: Assessment of individual and group use of problem-solving strategies using
online discussions. CBE-Life Sciences Education, 7(2), 254-262.
Ang, L. H., & Shahrill, M. (2014). Identifying students’ specific misconceptions in learning
probability. International Journal of Probability and Statistics, 3(2), 23-29
Angle, D. (2007). What is conceptual understanding? Retrieved March 25, 2019.from
https://www.maa.org/external_archive/devlin/devlin_09_07.html.
Antoine, W. (2000). An exploration of the misconceptions and incorrect strategies liberal arts
students. Use when studying probability. Unpublished Doctoral dissertation, Teachers
College Columbia University, New York, NY: Columbia.
Askew, M. & Wiliam, D. (1995). Recent Research in Mathematics Education 5–16. London, Great
Britain: Stationery Office Books.
Atagana, H. I., Mogari, L. D., Kriek, J., Ochonogor, E. C., Ogbonnaya, U. I., Dhlamini J. J., &
Makwakwa, E. G. (2010). An intervention into teachers' and learners' difficulties in some
topics in mathematics, science and technology: A report of the ISTE 2010 winter school.
Institute for Science and Technology Education, University of South Africa. Pretoria, South
Africa.
Awuah, F. K., & Ogbonnaya, U. I. (2016). Grade 12 learners’ achievement in probability. In B.
Goba & J. Naidoo (Eds) Reclaiming our African pride through mathematics teaching
Proceedings of 22nd Annual National Congress of the Association for Mathematics
Education of South Africa. (pp. 98-111). Mbombela, South Africa.
Batanero, C., & Díaz, C. (2012). Training school teachers to teach probability: reflections and
challenges. Chilean Journal of Statistics 3(1), 3-13.
Batanero, C., Chernoff, E. J., Engel, J., Lee, H. S. & Sánchez E. (2016). Research on teaching and
learning probability. New York, NY: Springer.

132
Batanero, C., Estepa, A., Godino, J.D. & Green, D.R. (1996). Intuitive strategies and
preconceptions about association in contingency tables. Journal for Research in
Mathematics Education, 27(2), 151-169
Battista, M. T. (2001). A research-based perspective on teaching school geometry. In J. Brophy
(Ed.).Subject-specific instructional methods and activities: Advances in research on
teaching Grade 8, (pp.145-185). Oxford, United Kingdom: Elsevier Health Science.
Baxendell, B. W. (2003). Consistent, coherent, creative. Teaching Exceptional Children, 35(3), 46-
53.
Bayaga, A. (2010). Statistics and probability education in South Africa: Constraints of learning.
Problems of Education in the 21st Century, 20, 25-35.
Bennett, G. K., Seashore, H. G., & Wesman, A. G. (1991). Differential Aptitude Test for Personnel
and Career Assessment. Chicago: Psychological Corporation.
Bennie, K. (1998). The “slippery” concept of probability: Reflections on possible teaching
approaches. Proceedings of 4th Annual Congress of the Association for Mathematics
Education of South Africa (pp. 53-67). Pietersburg, South Africa.
Bennie, K., & Newstead, K. (1999). Obstacles to implementing a new curriculum, In M. J Smith &
A.S Jordaan (Eds), Proceedings of the National Subject Didactics Symposium (pp.150-157).
Stellenbosch, South Africa.
Bester, L. (2014). Investigating the problem-solving proficiency of second-year quantitative
techniques students: the case of Walter Sisulu University (Unpublished Master’s thesis).
Walter Sisulu University, Mthatha, South Africa.
Bhat, C. R, (2001). Quasi-random maximum simulated likelihood estimation of the mixed
multinomial logit model. Transportation Research Part B: Methodological, 35(7), 677-693.
Bingham, G. P. (1988). Task-specific devices and perpetual bottleneck. Human Movement Sciences
7(2), 225-264.
Bloom, B. S. (1956). Taxonomy of educational objectives handbook: The cognitive domain. New
York, NY: McKay.
Bloom, B. S. (1994). Reflection on the development and use of the taxonomy. In: L. W. Anderson,
& L. A. Sosniak. (Eds.). Bloom’s taxonomy: A forty-year retrospective, (pp. 1–8). Chicago:
The National Society for the Study of Educational, Chicago: University of Chicago Press.
Bradley, J. R. (1992). Choosing research methodologies appropriate to your research focus. In L.S.
Estabrrk (Ed), decision making. Proceedings of the 33rd Conference of Allerton Park
Institute (pp. 97-116).IL: Illinois.
133
Brijlall, D. (2015). Exploring the Gurteen knowledge café approach as an innovative teaching for
learning strategy with first-year engineering students. Group Work, 24(3), 26-45.
doi.org/10.1921/13801240303.
Brodie, K. (2014). Learning about learner errors in professional learning communities. Educational
Studies in Mathematics, 85(2), 221-239.
Brodie, K., & Berger, M. (2010). Toward a discursive framework for learner errors in mathematics.
In V. Mudaly (Ed.), Proceedings of 18th Annual Meeting of the Southern African
Association for Research in Mathematics, Science and Technology Education (pp. 169-181).
Durban: University of KwaZulu-Natal.
Brown, S., & Wong. W. K. (2015). Probability and statistics with applications in finance and
economics. The Scientific World Journal, 2015, 1-2.
Bryman, A. (Ed.) (2006). Mixed methods: A four-volume set. London, Great Britain: Sage.
Cai, J., Moyer, J., Wang, N., Hwang, S., Nie, B., & Garber, T. (2012). Mathematical problem
posing as a measure of curricular effect on students' learning. Educational Studies in
Mathematics. 83(1), 57-69.
Carson, J. (2007). A problem with problem-solving: Teaching thinking without teaching
knowledge. The Mathematics Educator, 17(2), 7-14
Castro, C. S. (1998). Teaching probability for conceptual change La Enseñanza De La Probabilidad
Por Cambio Conceptual. Educational Studies in Mathematics, 35(3), 233-254.
Chadjipadelis, T. & Gastaris, P. (1995). Difficulties of understanding and misconceptions in
probabilities and statistics. Eucledes C’ 43, 35-68.
Che, M., Wiegert, E., & Threlkeld, K. (2012). Problem-solving strategies of girls and boys in
single-sex mathematics classrooms. Educational Studies in Mathematics, 79(2), 311-326.
Chimuka, A. (2017). The effect of integration of GeoGebra software in the teaching of circle
geometry on Grade 11 students’ achievement. (Unpublished Master’s dissertation).
University of South Africa, Pretoria South Africa. South Africa.
Chirinda, B. (2013). The development of mathematical problem-solving skills of Grade 8 learners in
a problem-centred teaching and learning environment school in Gauteng. (Unpublished
Doctoral dissertation). University of South Africa, Pretoria, South Africa.
Clement, J. (1993). Using bridging analogies and anchoring intuitions to deal with students’
preconceptions in physics. Journal of Research in Science Teaching. 30(10), 1241-1257.
Cobb, P., Yackel E., & Wood, T. (2011). Young children’s emotional acts while engaged in
mathematical problem-solving. In E Yackel, K. Gravemeijer, and A. Sfard (Eds), A Journey
in Mathematics Education Research: Insights from the work of Paul Cobb (pp 41-71).
Dordrecht: Springer.

134
Cohen, L., Manion, L., & Morisson, K. (2013). The ethics of educational and social research.
Research Methods in Education. (pp. 99-128). London: Routledge.
Coleman, J. (2010). Elementary teachers' instructional practices involving graphical representations.
Journal of Visual Literacy, 29(2), 198-222.
Collingridge, L. (2013). Schools’ quintile system to change? Corruption Watch. Retrieved from
https://www.corruptionwatch.org.za/schools-quintile-system-to-change/
Cook, T. D., & Campbell, D. T., (1979). Quasi-experimentation: design and analysis issues for field
settings. Chicago: Rand-McNally.
Creamer, E. G. (2017). An introduction to fully integrated mixed methods research. Thousand Oaks,
CA: Sage.
Creswell, J. W., & Clark, V. L. P. (2017). Designing and conducting mixed methods research.
Thousand Oaks, California, CA: Sage.
Dane, F. C. (1990). Research Methods.California, CA: Brooks/Cole Publishing.
Danisman, S., & Tanisli, D. (2017). Examination of mathematics teachers' pedagogical content
knowledge of probability. Malaysian Online Journal of Educational Sciences, 5(2), 16-34.
Das, K. (2007). Misconceptions about statistics and probability. Paper presented at the annual
meeting of the mathematical association of America, (MAA) (pp. 6-8). San Jose, CA.
Dass, S., & Rinquest, A. (2017). Amended National Norms and Standards for School Funding.
Government Notice No 869. Government Gazette no 29179 of 31 August 2006. Pretoria:
Government Printer.
David, F. N. (1962). Games, gods and gambling: The origins and history of probability and
statistical ideas from the earliest times to the Newtonian era. London, Great Britain:
Charles Griffin.
De Kock, S. M. (2015). Relating teachers' content knowledge to learner performance in probability
(Unpublished Doctoral dissertation), University of Pretoria, Pretoria, South Africa
Dean, S., & Illowsky, B. (2012). Collaborative statistics: Discrete random variables: Practice2;
Binomial Distribution. Houston, Texas: Connexions Project, Rice University.
Department of Basic Education. (2011). Curriculum and Assessment Policy Statement CAPS
mathematics Grade R-3. Pretoria: Government Printer.
Department of Basic Education. (2011). Curriculum and Assessment Policy Statement (CAPS).
Pretoria: Government Printer.
Department of Basic Education. (2015). National Senior Certificate Examination Diagnostic
Report. Retrieved from

135
http://www.ecexams.co.za/2015_Nov_Exam_Results/2015%20NSC%20Diagnostic%20Repo
rt.pdf
Department of Basic Education. (2016). National Senior Certificate Examination Diagnostic
Report. Retrieved from
http://www.ecexams.co.za/2016_Nov_Exam_Results/NSC%20DIAGNOSTIC%20REPORT%
202016%20WEB.pdf
Dettmer, P. (2006). New Blooms in established fields: Four domains of learning and doing. Roeper
Review 28(2): 70–78.
Dhlamini, J. J. (2012). Investigating the effect of implementing a context-based problem-solving
instruction on learner’s performance. (Unpublished Doctoral dissertation) University of
South Africa, Pretoria, South Africa.
Dhlamini, J. J., & Mogari, D. (2011). Using a cognitive load theory to account for the enhancement
of high school learners’ mathematical problem-solving skills. In Mogari, D., Mji, A. and
Ogbonnaya, U. I., (Eds.), Towards Effective Teaching and Meaningful Learning in MST.
Paper presented at the International Conference of the Institute of Science and Technology
Education (pp 309-326). Mopani camp in Kruger national park Limpopo, South Africa.
Dhurumraj, T. (2013). Contributory factors to poor learner performance in physical sciences in
Kwazulu-Natal province with special reference to schools in the Pinetown district.
(Unpublished Doctoral thesis). University of South Africa, Pretoria, South Africa.
Dimitriou-Hadjichristou, C., & Ogbonnaya, U. I. (2015). The effect of using the Lakatosian
heuristic method to teach the surface area of a cone on students’ achievement according to
Bloom's taxonomy levels. African Journal of Research in Mathematics, Science and
Technology Education, 19(2), 185-198.
Duncker, K., & Lees, L.S. (1945). On problem-solving. Psychological Monographs, 58(5), i-113.
Dunga, T. M., & Baob, P. M. (2017). Vietnamese students’ problem-solving skills in learning about
the error of measurements. International Electronic Journal of Mathematics Education,
12(4), 463-474.
Dutta, V., & Sahney, S. (2016). School leadership and its impact on learner achievement: The
mediating role of school climate and teacher job satisfaction. International Journal of
Educational Management, 30(6), 941-958.
Einhorn, H. J., &, Hogarth, R. M. (1986). Judging probable cause. Psychological Bulletin, 99(1), 3-
19.
Elbrink, M. (2008). Analysing and addressing common mathematical errors in secondary education.
Undergraduate Mathematical Exchange, 5(1), 2-4.
Elliot, A. C., & Woodward, W. A. (2007). Statistical analysis: Quick reference guidebook with
SPSS examples. London, Great Britain: Sage.

136
Falk, R. (1986). Conditional probabilities: Insights and difficulties. In R. Davidson and J. Swift
(Eds.), Proceedings of the Second International Conference on Teaching Statistics, (pp.
292-297). Victoria, Canada.
Fennema, E., & Franke, M. L. (1992) Teachers’ knowledge and its impact. In: D.A. Grouws
(Ed.). Handbook of research on mathematics teaching and learning: A project of the
National Council of Teachers of Mathematics (pp. 147-164). New York, NY: Macmillan.
Fennema, E., Carpenter, T. P., & Lamon, S. J. (Eds.) (1991). Integrating research on teaching and
learning mathematics. (pp. 83-120). Albany, NY: SUNY Press.
Field, A. (2009). Discovering statistics using SPSS (3rd ed). London, Great Britain: SAGE
Fischbein E., Nello M.S., & Marino, M. S. (1991). Factors affecting probabilistic judgments in
children and adolescents. Educational Studies in Mathematics, 22(6), 523-549.
Flanagan, D., Mascolo, J., & Hardy-Braz, S. (2009). Standardized testing.Retrived from
http://www.education.com/reference/article/standardized-testing/.
Flick, U. (2015). Introducing research methodology: A beginner's guide to doing a research
project. London, Great Britain: Sage.
Forehand, M. (2012). Bloom’s taxonomy. Emerging perspectives on learning, teaching, and
technology, 41(4), 47-56.
Fredericks, A. D. (2005, August 2). The Complete Idiots Guide to Success as a Teacher.
Indianapolis, IN: Alpha Books.
Frensch, P. & Funke., J. (1995). Experimental research on complex problem-solving.In P
.A.Frensch & J Funke( Eds), Complex problem-solving: The European perspective, (pp.
243-268.) Hillsdale, NJ:Lawrence Erlbaum Associates,
Funke, J. (2010). Complex problem-solving: A case for complex problem cognition? Cognitive
Processing, 11(2), 133-142.
Garfield, J., & del Mas, R. (1989). Reasoning about chance events: Assessing and changing
students’ conception of probability. In C Maher, G. Goldin, and Davis (Eds), Proceedings of
13th conference of international group the Psychology of Mathematics Education.
(pp.189-195). Paris, France.
Ghulman, H. A. & Mas' Odi, M. S. (2009). Modern measurement paradigm in engineering
education: Easier to read and better analysis using Rasch-based approach. In Proceedings of
International Conference on Engineering Education (ICEED 2009) December 7-8, 2009.
(pp. 1-6) Kuala Lumpur, Malaysia.
Giuliano, M. (2006). Conceptions about probability and accuracy in Argentine students who start a
career in engineering. In A.Rossman & B. Chance, Working cooperatively in statistics
137
education. Proceedings of 7th international conference on teaching statistics (pp. 1-5)
Salvador, Bahia, Brazil,
Grant, D. (2013). Background to the national quintile system. Media release by the minister of the
Western Cape Education Department. Retrieved from
https://wcedonline.westerncape.gov.za/comms/press/2013/74_14oct.html
Graven, M. H. (2014). Poverty, inequality and mathematics performance: The case of South
Africa’s post-apartheid context. ZBM Mathematics Education, 46(7), 1039-1049.
Green, D. P. (2010). Rockwood and Green's fractures in adults (1st ed) Philadelphia, PA:
Lippincott: Williams and Wilkins.
Green, M., Piel, J. A., & Flowers, C. (2008). Reversing education majors' arithmetic
misconceptions with short-term instruction using manipulatives. The Journal of Educational
Research, 101(4), 234-242.
Guba, E., G., & Lincoln, Y.S. (1994). Competing paradigms in qualitative research. In N.K. Denzin
and Y. S. Lincoln (Eds), Handbook of qualitative research (pp. 105-117), Thousand Oaks,
CA: Sage.
Hall, K., & Giese, S. (2008). Addressing quality through school fees and school funding. In S.
Pendlebury, L. Lake, and C. Smith (Eds.), South African Child Gauge 2008/2009 (pp. 35–
40). Cape Town: Children’s Institute, UCT.
Halmos, P. (1980). The heart of mathematics. American Mathematical Monthly, 87(7), 519-524.
Hanushek, E. A., Wößmann, L., Jamison, E. A., & Jamison, D. T. (2008). Education and economic
growth. Education Next, 8(2), 62-71.
Harper, D. (2010). Online etymology dictionary. Retrieved from https://www.etymonline.com/
Heale, R., & Twycross, A. (2017). What is a case study? Retrieved from
https://ebn.bmj.com/content/21/1/7.abstract
Hepper, P. P., & & Krauskopf, C. J. (1987). An information-processing approach to personal
problem-solving. The Counselling Psychologist, 15(3), 371-447.
Herholdt, R., & Sapire, I. (2014). An error analysis in the early grades of mathematics: A learning
opportunity? South African Journal of Childhood Education, 4(1), 43-60.
Higgins, S., Ryan, J., Swam, M. & Williams, J. (2002). Learning from mistakes, misunderstandings
and misconceptions in mathematics. In I. Thompsons, J. (Ed.), National numeracy and key
Stage 3 strategies. Hillsdale, NJ: Lawrence Erlbaum.
Hirsch, L. S., & O’Donnell, A. M. (2001). Representativeness in statistical reasoning: Identifying
and assessing misconceptions. Journal of Statistics Education, 9(2), 1-22.
doi:10.1080/10691898.2001.11910655

138
Hlalele, D. (2012). Exploring rural high schools’ experience of mathematics anxiety in academic
settings. South African Journal of Education. 32(3), 267 -278.
Hodes, E., & Nolting, P. (1998). Winning at mathematics. SBCC Mathematics. Santa Barbara, CA:
Academic Sources Press.
Hof, M. (2012). Questionnaire evaluation with factor analysis and Cronbach’s Alpha: An example.
Retrieved from http://citeseerx.ist.psu.edu/viewdoc/summary?
Hoosain, R. (1991). Psycholinguistic implications for linguistic relativity: A case study of Chinese.
New York, NY: Psychology Press.
Human Sciences Research Council. (2010). Annual report 2009/2010: The bigger picture. (Report
No.164/2010) Retrieved from
http://www.hsrc.ac.za/uploads/pageContent/623/HSRC%20Annual%20Report%202009%20
2010%20%20full%20document.pdf
Humbert, R A. (2014). A qualitative study on the effects of Venn diagram concepts maps on
student’s test scores (Unpublished Master’s thesis). State University of New York, NY,New
York.
Ibrahim, F. (1998). Curriculum foundations, organizations and evaluation. Cairo: Egypt Library
Ighbaria, A. K, (2013). A content analysis of the WH-questions: in the EFL textbook of horizons.
International Education Studies, 6(7), .200-224.
Jan, S. L., & Shieh, G. (2014). Sample size determinations for Welch’s test in one-way
heteroscedastic ANOVA. British Journal of Mathematical and Statistical Psychology, 67(1),
72–93.
Jana, M. (2016). Emerging issues of pupil-teacher ratios and teacher deficiencies in Bengali- and
Olchiki-medium government primary schools of the West Circle, Gopiballavpur, Paschim
Medinipur, India. Indian Journal of Research, 5(1), 163-165.
Johnson, M. L. (1983). Writing in mathematics classes: A valuable tool for learning. The
Mathematics Teacher, 76(2), 117-119.
Jonassen, D. H. (2000). Toward a design theory of problem-solving. Journal of Research on
Technology in Education 48(4):63-85.
Jones, D. L., & Tarr, J. E. (2007). An examination of the levels of cognitive demand required by
probability tasks in middle grades mathematics textbooks. International Association for
Statistical Education Research Journal (IASE/ISI). 6(2), 4-27.
Jun, L. (2000). Chinese students’ understanding of probability. (Unpublished doctoral dissertation)
National Institute of Education Nanyang Technological University, Singapore.Jurong West,
Singapore

139
Kahneman, D., & Tverskey, A. (1972). Subjective probability: A judgement of
representativeness. Cognitive Psychology, 3(3), 430-454.
Kaplan, J. J. (2006). Factors in statistics: Developing a dispositional attribution model to describe
differences on development of statistical proficiency. (Unpublished Doctoral Dissertation).
University of Texas, UT,Austin.
Karaali, G. (2011). An evaluative calculus project: Applying Bloom’s taxonomy to the calculus
classroom. Primus, 21(8), 719-731.
Karns, J. M., Burton G., E. & Martin, G. D. (1983). Learning objectives and testing: An analysis of
six principles of economic textbooks using Bloom’s taxonomy. The Journal of Economic
Education 14(3), 16-20.
Kashani-Vahid, L., Afrooz, G., Shokoohi-Yekta, M., Kharrazi, K., & Ghobari, B. (2017). Can a
creative interpersonal problem-solving program improve creative thinking in gifted
elementary students? Thinking Skills and Creativity, 24, 175-185.
Keeton, M. (2010). Our annual slice-up-and-interpretation of “matric” results. Johannesburg:
Epoch-Optima.
Kelly, I. W., & Zwiers, F.W. (1986). Mutually exclusive and independent: Unravelling basic
misconceptions in probability theory. Teaching Statistics, 8, 96-100
Khazanov, L. (2008). Addressing students' misconceptions about probability during the first years
of college. Mathematics and Computer Education, 42(3), 180-192.
Khazanov, L., & Gourgey, A. (2009). Instructors’ perspectives on students’ mistaken beliefs about
probability in an elementary college statistics course. In K. Safford-Ramus (Ed).
Proceedings of 15th annual international conference on adults learning mathematics
research forum, ALM, (pp. 249-264). Philadelpphia, Pennsylvania, United States of
America.
Kim, J. H. (2014, March). Competence in solving problems and blended learning environment in
student teaching. In Society for Information Technology and Teacher Education
International Conference (pp. 2869-2875). Association for the Advancement of Computing
in Education (AACE).
Klieme, E. (2004). Assessment of cross-curricular problem-solving competencies. In J. H.
Moskowitz and M. Stephens (Eds.) Comparing learning outcomes international assessments
education policy (pp 81-107) London: Routledge.
Kodisang, S. M. (2015). Teaching strategies used by mathematics teachers to teach Grade 6
probability in Nkangala District (Unpublished Doctoral dissertation). University of Pretoria,
Pretoria, South Africa.
Konold, C. (1989). Informal conceptions of probability. Cognitive and Instruction, 6(1) 59-
98.Doi:10.1207/s153269xci0601-3

140
Krulik, S. & Rudnick, J. A. (1980). Problem-solving: A handbook for teachers. Retrieved from
https://eric.ed.gov/?id=ED287731
Krutetskii, V. A. (1976). The psychology of mathematical abilities in schoolchildren. Chicago, IL:
The University of Chicago Press
Lambert, M. (1990). When the problem is not the question and the solution is not the answer:
Mathematical knowing and teaching. American Educational Research Journal, 27(1), 29-
63.
Laridon, P. (1995). Intuitive probability concepts in South African adolescents. Pythagoras, 37, 25-
29.
Larocque, M., Kleiman, I., & Darling, S. M. (2011). Parental involvement: The missing link in
school achievement. Preventing School Failure, 55(3), 115-122.
Lecoutre, M. P. (1992). Cognitive models and problem spaces in “purely random” situations.
Educational Studies in Mathematics, 23(6), 557-568.
Lee, S. J. (2015). Unravelling the “model minority” stereotype: Listening to Asian American youth.
New York, NY. Teachers College Press.
Leithwood, K., Harris, A., & Hopkins, D. (2008). Seven strong claims about successful school
leadership. School Leadership and Management, 28(1), 2-42.
Letseka, M., & Maile, S. (2008). High university dropout rates: A threat to South Africa’s future.
Pretoria: Human Sciences Research Council.
Lian, L. H., & Idris, N. (2006). Assessing the algebraic solving ability of the form four students
IEJME-Mathematics Education. 1(1), 55-76.
Liljedahl, P., Santos-Trigo, M., Malaspina, U., & Bruder, R. (2016). Problem-solving in
mathematics education. In Problem-solving in Mathematics Education (pp. 1-39). New
York, NY: Springer.
Lister, R., & Leaney, J. (2003). Introductory programming, criterion-referencing and bloom. In
ACM SIGCSE Bulletin 35(1), 143-147.
Lubisi, R. (2014). The presidency annual report 2013/2014. Pretoria: South Africa, State Printer.
Retrieved from www.thepresidency.gov.za/download/file/fid/1018
Luneta, K., & Makonye, P. J. (2010). Learner errors and misconceptions in the elementary analysis:
A case study of a Grade 12 class in South Africa. Acta Didactica Napocensia, 3(3), 35-44.
Lupahla, N. (2014). Assessing the algebraic problem-solving skills of Grade 12 learners in Oshana
Region, Namibia (Unpublished Masters’ dissertation). University of South Africa, Pretoria.
South Africa.

141
Makonye, J. P. (2011). Learner mathematical errors in introductory differential calculus task: A
study of misconceptions in the senior school certificate examinations. (Unpublished
Doctoral Dissertation): University of Johannesburg, Johannesburg, South Africa
Makonye, J. P., & Luneta, K. (2014). Mathematical errors in differential calculus task in the senior
secondary certificate examination in South Africa. Education as change 18(1) 119- 136.
https://doi.org/10.1080/16823206.2013. 847014
Makwakwa, E. G. (2012). Exploring problems experienced by Grade 11 mathematics in the
teaching and learning of statistics in Grade 11. (Unpublished Masters’ dissertation).
University of South Africa, Pretoria, South Africa.
Manoli, P., & Papadopoulou, M. (2012). Graphic organizers as a reading strategy: Research
findings and issues. Creative Education, 3(3), 384-356.
https://doi.org/10.4236/ce.2012.33055
Maree, J. G. (2010). Critical appraisal of the system of education and prospects of meeting the
manpower and developmental needs of South Africa. Africa Insight, 40(2), 85-108.
Marriott, J., Davies, N., & Gibson, L. (2009). Teaching, learning and assessing problem-solving.
Journal for Statistics Education, 17(1) 1-19.
May, T. (2011). Social research: Issues, methods and research. London: McGraw-Hill International
Mayer, R. E. (1992). The psychology of mathematical problem-solving. In F. K. Lester & J.
Garofalo (Eds.), Mathematical problem-solving: Issues in research (pp. 1-12). Philadelphia,
PA: The Franklin Institute Press.
Mayer, R. E., & Wittrock, M.C. (2006). Problem solving. In P.A Alexander & P. H. Winne (Eds.)
Handbook of educational psychology (pp. 287-303).Mahwah, N J, US: Lawrence Erbaum
Associates.
McBain, R. (2011). How high can students think? A study of students' cognitive levels using
Bloom's taxonomy in Social Studies. Online Submission. Retrieved from
https://eric.ed.gov/?id=ED524386.pdf:
McCarthy, J., & Oliphant, R. (2013). Mathematics outcomes in South African schools: What are the
facts? What should be done? In Bernstein (Ed), CDE Insight, Centre for Development and
Enterprise (CDE), Johannesburg.
McGrath, A. S., & Akoojee, S. (2007). Education and skills for development in South Africa:
Reflections on the accelerated and shared growth initiative for South Africa. International
Journal for Educational Development 27(4), 421-434.
Meaney, T., Trinick, T., & Fairhall, U. (2012). Collaborating to meet language challenges in
indigenous mathematics classrooms. New York, NY: Springer.

142
Mestry, R., & Ndhlovu, R. (2014). The implications of the national norms and standards for school
funding policy on equity in South African public schools. South African Journal of
Education. 34(3), 1-11.
Meyer, R. E., & Hegarty, M. (1996). The process of understanding mathematics problems. In R. J
Sternberg and T. Ben- Zeev (Eds). The nature of mathematical thinking (pp.29-54) Mahwah,
NJ: Erlbaum.
Michael, J., (2002). Misconceptions: What students think they know? Advances in Physiology
Education, 26(1), 4-6.
Modisaotsile, B. M. (2012).The falling standard of basic education in South Africa. Policy Brief,
72, 1-7.
Moore, C. G., Carter, R. E., Nietert, P. J., & Stewart, P. W. (2011). Recommendations for planning
polit studies in clinical and translational research. Clinical and Translational Sciences, 4(5),
332-337.
Moore, J. E. (2003). The art of sorting: Using a Venn diagram to learn sciences process skills.
Sciences Activities Classroom Projects and Curriculum Ideas. 39(4):12-21.
Moru, E. K., Qhobela, M., Wetsi, P., & Nchejane, J. (2014). Teacher knowledge of error analysis in
differential calculus. Pythagoras, 35(2), 1-10.
Mpofu, B. (2015). Profiling disadvantaged undergraduate learners in higher education. The Journal
of Sociology and Social Anthropology, 6(1), 15-30.
Mugisha, S. (2012). An investigation into problem-solving skills in calculus: The case of Unisa
first-year students (Unpublished Doctoral dissertation). University of South Africa, Pretoria,
South Africa.
Mutara, L. (2015). Exploring Grade 10 learners’ errors and misconceptions involved in solving
probability problems using different representations. (Unpublished Master’s dissertation).
University of the Witwatersrand, Johannesburg, South Africa.
Mutara. L., & Makonye, J. (2015). Learners’ use of probability models in answering probability
tasks in South Africa University of the Witwatersrand, South Africa. (Master’s dissertation)
University of the Witwatersrand.
Nafa, F., Othman. S., & Khan, J. (2016). Automatic concepts classification based on Bloom's
taxonomy using text analysis and the naïve Bayes Classifier method. In J.Uhomoibhi,G
Costagliola,S Zvacek and B McLaren (Eds). Educating the Educators; learning Analysis.
Proceedings of the 8th International Conference on Computer Supported Education (CSEDU
2016), (pp. 391-396). Rome, Italy.
Naidoo, R., & Ranjeeth, S. (2007). Error made by students in a computer programming course. In
Proceedings of the Computer Science and IT Education Conference, 26-29 June 2007 (pp.
499-510). Johannesburg, South Africa: Learning conference.

143
Nantha, Y. S. (2017). Probability or reasoning: Current thinking and realistic strategies for
improved medical decisions. Korean Journal of Family Medicine, 38(6), 315-321.
National Council of Teachers of Mathematics. (1980). An agenda for action. Reston, VA: NCTM.
National Council of Teachers of Mathematics. (1989). Curriculum and evaluation standards for
school mathematics. Reston, VA: NCTM.
Nesher, P. (1987). Towards an instructional theory: the role of students’ misconceptions. For the
learning of mathematics, 7(3), 33-39
Newell, A., Shaw, J. C., & Simon, H. A. (1958). Elements of a theory of human problem-solving.
Psychological Review, 65(3), 151.
Newman, C. K., Obremski, T., & Schaeffer, R. L. (1987). Exploring probability. Palo Alto, CA:
Dale Seymour Publication.
Nguyen, N. L. (2015). Developing a conceptual understanding and probabilistic thinking through
tree diagrams (Unpublished Master’s thesis). University of Manitoba, Winnipeg Manitoba.
Njoroge, P. M., & Nyabuto, A. N. (2014). Discipline as a factor in academic performance in
Kenya. Journal of Educational and Social Research, 4(1), 289-307.
Ogbonnaya, U. I. (2010). Improving the teaching and learning of parabolic functions by the use of
information and communication technology (ICT). African Journal of Research in
Mathematics, Science and Technology Education. 14(1), 49-60.
Ogbonnaya, U. I. (2011). Exploring the relationship between mathematics teachers’ subject matter
knowledge and their effectiveness. (Unpublished Doctoral thesis). University of South
Africa, Pretoria, South Africa.
Ogbonnaya, U. I., & Mogari, D. (2014). The relationship between Grade 11 learners’ achievement
in trigonometry and their teachers’ content knowledge. Mediterranean Journal of Social
Science, 5(4), 443-451.
Ogbonnaya, U. I., Mji, A., & Mohapi, S. J. (2016). Identifying some hindrances to students’
achievement in mathematics in South Africa. Dirasat: Educational Sciences, 43(2), 705-
714.
Oh, J. (2010). Using an enhanced conflict map in the classroom (photoelectric effect) based on
Lakatosian heuristic principle strategies. International Journal of Science and Mathematics
Education, 9(5), 1135-1166.
Ojose, B. (2011). Mathematics literacy: Are we able to put the mathematics we learn into everyday
use? Journal of Mathematics Education. 4(1), 89-100.
Olivier, D., Dobele, T., Greber , M., & Robert , T. (2004). This course has a Bloom Rating of 3.9.
In Proceedings of the Sixth Australasian Conference on Computer Education volume 30
(pp. 227-231) Australian Computer Society, Inc.

144
Olivier, W. A. (2013). Reflection on the training of teachers for CAPS mathematics curriculum: A
brief report..Retrieved from htpp://www.samf.ac.za/caps-mathematics-report.
Orawiwatnakul., W., & Wichadee,S. (2016). Achieving better learning performance through the
discussion activity on Facebook. The Turkish Online Journal of Education Technology
15(3), 1-8.
Organisation for Economic Co-operation and Development (OECD). (2012). PISA 2012 Creative
problem-solving: Students’ skills in tackling real-life problems. Retrieved from
https://www.oecd.org/pisa/keyfindings/pisa-2012-results-volume-V.pdf
Osterlind, S. J. (1989). Judging the quality of test items: Item analysis. In G .F Madaus, Chill & D.L
Stufflebeam (Eds), constructing test items Multiple Choice, Constructed Response,
Performance and other Formats, (2nd ed., pp. 259-310). Boston/Dordrecht/London. Kluwer
Academic Publisher.
Papaieronymou, I. (2009). Recommended knowledge of probability for secondary mathematics
teachers. In:V Durand-Guerrier, S.Soury-Lavergne & F. Arzarello (Eds) Proceedings of
Congress of the European Society for Research in Mathematics Education. (CERME 6),
28th January-1st February 2009 (pp. 358-367). Lyon, France
Parker, F. (2012). Myth-busting Grade 12 pass rate. Mail and Guardian, 7 January, 2012. Retrieved
from https://mg.co.za/article/2012-01-07-myth-busting-the-matric-pass-rate.
Paul, M., & Hlanganipai, N. (2014). Exploring mathematics students understanding of language of
estimative probability in relation to probability scale. Intentional Journal Educational
Sciences, 7(3), 439-447.
Perera, L. D. H. (2014). Parents’ attitude towards science and their children’s science achievement.
International Journal of Science Education, 36(18), 3021-3041.
Phan, A. T. (2014). Assessment of the problem-solving ability of students in teaching Grade 11
mathematics at middle school. (Unpublished Doctoral thesis). Vinh University, Vinh,
Vietnam.
Phillips, D. C., & Burbules, N. C. (2000).Philosophy, theory, and educational research. Post
positivism and educational research. Lanham, MD, US: Rowman & Littlefield.
Polya, G. (1957). How to solve it: A new aspects of mathematical methods. Upper Saddle River, NJ:
Prentice University Press.
Ponterotto, J. G., Rieger, B. P., Barrett. A., Harris, G. Sparks, R., Sanchez, C. M. & Magids, D.
(1996). "Development and initial validation of the multicultural counselling awareness
scale". In Multicultural Assessment in Counseling and Clinical Psychology, 12. Retrieved
from https://pdfs.semanticscholar.org/a3bf/35ca0849f5d5094ddc84281251daa910461d.pdf

145
Pratt, D. (2012). How do teachers foster students understanding of probability? In G. A Jones (Ed.)
Exploring probability in school: Challenges for teaching and learning, (pp. 171-189)
Netherlands: Kluwer Academic.
Pugachev, V. S. (2014). Probability theory and mathematical statistics for engineers; (1-14).
Oxford: Pergaman.
Radmehr, F., & Alamohdaei, H. (2010). A case study on the performance of students’ mathematical
problem-solving based on the cognitive process of revised Bloom’s taxonomy. Journal of
the Korea Society of Mathematical Education Series D: Research in Mathematical
Education, 14(4), 381-402.
Rakumako, A., & Laugksch, R. (2010). Demographic profile and perceived INSET needs of
secondary mathematics teachers in Limpopo province. South African Journal of Education
30, 139-152.
Reddy, V., Prinsloo, C., Visser, M., Arends, F., Winnaar, L., & Rogers, S. (2012). Highlights from
TIMSS 2011: The South African Perspective. Pretoria: HSRC.
Renkl, A., & Atkinson, R. K. (2010) Learning from worked-out examples and problem-solving. In
Cognitive load theory, (pp. 89-108).New York, NY: Cambridge University Press
https://doi.org/10.1017/CB0978511844744.00
Resnik, D. B. (2015). What is ethics in research and why is it important? National Institute of
Environmental Health Sciences, Retrieved from
https://www.niehs.nih.gov/research/resources/bioethics/whatis/index.cfm
Riccomini, P. J. (2005). Identification and remediation of systematic error patterns in subtraction.
Learning Disability Quarterly. 28(3), 233-241.
Roca, A. E., & Batanero, C.D. (2006, July 19-22). Computing probability from two-way tables: An
exploratory study with future teachers. Paper presented at the 7th International Conference
of Teaching Statistics. Salvador, Bahia, Brazil Retrieved from:
https://www.stat.auckland.ac.nz/~iase/publications/17/C413.pdf
Rossman, G. B., & Rallis, S. F. (2003). Learning in the field: An introduction to qualitative
research. Thousand Oaks, CA: Sage.
Rott, B. (2012, July 18-22). Heuristics in the problem-solving processes of fifth graders.Ppaer
presented at the 36th Conference of the International Group for the Psychology of
Mathematics Education. Taipei, Taiwan. Retrieved from http://www.tame.tw/pme36/
Rusbult, C. (2000). An introduction to design. http://www.asa3.org/ASA/education/think/intro.
process. Accessed January 10, 2016.
Salvia, J., & Yssldyke, J. E. (2001). Assessment. Boston, MA: Houghton Mifflin.

146
Sangcap, P. G. A. (2010). Mathematics-related beliefs of Filipino college students: Factors affecting
mathematics and problem-solving performance. Procedia Social and Behavioural Sciences.
8(2010), 465-475.
Saunders, M., Lewis, P., & Thornhill, A. (2009). Research methods for business students (5th
Ed.).Harlow, England:Pearson Education.
Sayed, Y. (2002). Democratising education in a decentralised system: South African policy and
practice. Compar. 32(1), 35-46
Scherer, R., & Beckmann, J. F. (2014). The acquisition of problem-solving competence: Evidence
from 41 countries that math and science education matters. Large-Scale Assessments in
Education. 2(10), 10.1-22
Schoenfeld, A. H. (1980). Teaching problem-solving skills. The American Mathematical Monthly,
87(10), 794-805
Schoenfeld, A. H. (1987). What’s all the fuss about metacognition? In Cognitive Science and
Mathematics Education, (pp. 189- 215). Hillsdale, NJ: Lawrence Erlbaum.
Schoenfeld, A. H. (1992). Learning to think mathematically: Problem-solving, metacognition, and
sense-making in mathematics. In D. A. Grouws (Ed.), Handbook of Research on
Mathematics Teaching and Learning (pp. 165-197). New York, NY: MacMillan.
Schoenfeld, A.H. (2013). Reflections of problem-solving theory and practice. The Mathematics
Enthusiast, 10(1), 9-34
Shatzer, R. H., Caldarella, P., Hallam, P. R., & Brown, B. L. (2014). Comparing the effects of
instructional and transformational leadership on learner achievement: Implications for
practice. Educational Management Administration and Leadership, 42(4), 445–459.
Shute, V. J., & Wang, L. (2015). Measuring problem-solving skills in Portal 2. In E-learning
systems, environments and approaches (pp. 11-24). New York, NY: Springer International.
Simmons, G. F. (1992). Calculus Gems: brief lives and memorable mathematics. New York, NY:
McGraw Hill.
Skipton, M., & Cooper, T. (2014). Business Schools, Learner/Teacher Ratios and Concerns for
Learning: Evidence from Canada. Journal of Higher Education Theory and Practice, 14(3),
32-43.
South Africa Info. (2010). South Africa: fast facts. Retrieved from https://www.south-africa-
info.co.za/country
Spangenberg, D. E. (2012). Thinking styles of mathematics and mathematics literacy learners:
Implications for subject choice. Pythagoras, 33(3), 1-12.
Spaull, N. (2011). A preliminary analysis of SACMEQIII South Africa. Stellenbosch Economic
Working Papers 11(11). University of Stellenbosch, Stellenbosch: South Africa.

147
Spaull, N. (2015). Education quality in South Africa and sub-Saharan Africa: An economic
approach. (Unpublished Doctoral dissertation) Stellenbosch University, Cape Town, South
Africa.
Spaull, N., & Kotze, J. (2015). Starting behind and staying behind in South Africa: The case of
insurmountable learning deficits in mathematics. International Journal of Educational
Development, 41, 13–24.
Stillman, G., & Galbraith, P. L. (1998). Applying mathematics with real-world connection:
Metacognitive characteristics of secondary students. Educational Studies in Mathematics.
36(2), 157-195.
Syafil, W., & Yasin, R. M. (2013). Problem-solving skills and learning achievements through the
problem-based module in teaching and learning biology in high school. Asian Social
Science, 9(12), 220-228.
Tella, A. (2017).Teacher variables as predictors of academic achievement of primary school pupils.
Mathematics International Electronic Journal of Elementary Education. 1(1) 17-33.
Tigere, E. (2014). Evaluating problem-solving proficiency of Grade 12 physical science learners in
Highveld Ridge East and West circuits when solving stoichiometry problems (Unpublished
Master’s dissertation). University of South Africa, Pretoria, South Africa.
Tso, T. Y. (Ed) (2012). Opportunities to learn in mathematics education. In Proceedings of 36th
Conference of the International Group of Psychology of Mathematics Education, Taipei,
Taiwan: PME
Unodiaku, S. S. (2012). Development and validation of mathematics readiness test for senior
secondary school students. African Journal of Science Technology and Mathematics
Education; 2(1), 57-71.
Van der Berg, S. (2008). How effective are poor schools? Poverty and educational outcomes in
South Africa. Studies in Educational Evolution, 34(3), 145-154.
Venkitachalam, R. (2014). Validity and reliability of questionnaires.(power point ) In HealthCare,
accessed on May 7th, 2015.
Watson, J. M. (1995). Probability and statistics: An overview. In: H. Grimison & J. Pegg (Eds)
Teaching Secondary School Mathematics: Theory into Practice (pp. 120-139). Sydney:
Harcourt Brace.
Weber, M. P., & Carlson, M. P. (2010). The Role of Pre- calculus students’ quantitative and
covariational reasoning in solving ' novel mathematics problems. Proceedings of 32nd
annual meeting of the North American chapter of international Group for the psychology of
mathematics education (pp. 815-822). Columbus, OH: The Ohio state university.
Welch, B. L. (1951). On the comparison of several mean values: An alternative approach.
Biometrika, 38(3-4), 330–336.

148
Wessels, H., & Nieuwoudt, H. (2010). Teacher knowledge and confidence in Grade 8 and 9 data
handling and probability. In C. Reading (Ed.), Data and context in statistics education:
towards and evidence –based society. Proceedings of the 8th International Conference on
Teaching Statistics. Ljubljana, Slovenia. Vooburg, the Nethalands: international Statistical
Institute Retrieved from http://icots.info/8/cd/pdfs/invited/ICOTS8_2F1_WESSELS.pdf
Wessels, H., & Nieuwoudt, H. (2011). Teachers’ professional development needs in data handling
and probability. Pythagoras, 32(1), 1- 9, doi:10.4102/pythagorus.v32i1.10
Wilmot, D., & Dube, C. (2015). School geography in South Africa after two decades of democracy:
Teachers' experiences of curriculum change. Geography, 100(2), 94-101.
Wilson, J. W., Fernandez, M. L., & Hadaway, N. (1993). Mathematical problem-solving. In P. S
Wilson (Ed), Research Ideas for the Classroom: High School Mathematics, (pp. 57-78).
New York: Macmillan.
Wu, M., & Adams. R. (2006). Modelling mathematics problem-solving item responses using a
multidimensional IRT Model. Mathematics Education Journal 18(2), 93-113.
Yang, C. W., Sherman, H. & Murdick, N. (2011). Error pattern analysis of elementary school-aged
students with limited English proficiency. Investigations in Mathematics Learning, 4(1), 50-
67.
Yigiter, K. (2013). Investigation of the problem-solving skills, self-esteem and preferences of
university students regarding sport and social activity in Turkey. International Journal of
Academic Research, 5(4), 220-226
Yimer, A., & Ellerton, N. F. (2006). Cognitive and metacognitive aspects of mathematical problem-
solving: An emerging model. Identities, Cultures, and Learning Spaces, 575-582.
Zahner, D., & Corter, J. E. (2010). The process of probability problem-solving: Use of external
visual representations. Mathematical Thinking and Learning, 12(2), 177-204.
Zakaria, E., & Yussoff, N. (2009). Attitudes and problem-solving skills in algebra among Malaysia
matriculation college students. European Journal of Social Sciences, 8(2), 232-245.
Zanzali, N. A. A., & Lui, L. N. (2000, November 18-23). Evaluating the levels of problem-solving
abilities in mathematics. Paper presented at the conference on mathematics education: Into
the 21st century: Mathematics for a living.Amman, Jordan. Retrieved from
http://math.unipa.it/-grim/jzanzalinam.pdf. .
Zembat, I, O. (2008). What is Misconceptions? In Ozmantar M.F, Bingolbali, M., Akkoc, H. (Eds).
Mathematical misconceptions and solutions (pp. 1-8), New York,NY: Pegem A publishing
1-8.

149
APPENDICES
APPENDIX A: Cognitive test on probability and counting principles
Written Test to Determine Problem-Solving Skills of Grade 12 Learners
Learner ID
Please complete this section by ticking ( x ) the one that applies you.
SEX STREAM
MALE FEMALE COMMERCE SCIENCE HUMANITIES
Instructions and Information to respondents

150
Read the following instructions carefully before answering the questions
1. The question paper consist of 6 questions
2. Answer All questions
3. Clearly show all calculations, diagrams graphs et cetera that you have used in
determining the answers
4. You may use an approved scientific calculator( non-programmable and non-
graphical) unless
Stated otherwise
5. Round off your answers to two decimal places unless stated otherwise
6. An answer sheet has been attached to the question paper. Write your special exam
numbers on the space provided.
7. Number the answer correctly according to the numbering system used in this
question paper
8. Write legibly and present your work neatly
Total mark: 96

151
Use the figures above to answer QUESTION 1 below
QUESTION 1
1.1 Identify with reasons the figure that exhibits the under listed properties
1.1.1. Mutually exclusive (2)
1.1.2. Inclusive (2)
1.1.3. Complementary (2)
1.1.4. Exhaustive (2)
1.2 Write down a mathematical expression for P (A or B)
1.2.1 if A and B are mutually exclusive (2)
1.2.2 If A and B are inclusive (2)
[TOTAL = 12 marks]
Figure 1 Figure 2
M S P Q
4, 5 1 6, 7 3,7 6, 2
9

152
QUESTION 2
Given that 𝑃(𝐴) = 0.6 𝑃(𝐵) = 0.5 𝑃(𝐴 ∩ 𝐵) = 0.2
2.1 illustrate the information on the Venn diagram (4)
2.2 Find 𝑃(𝐴 ∪ 𝐵) (2)
2.3 Find 𝑃(𝐴 ∪ 𝐵)′ (2)
2.4 Show that events A and B are not independent (2)
2.5 Are the events A and B complimentary? (2)
2.6 Give two reasons to support your answer in question 2.5 (2)
[TOTAL = 14 marks]
QUESTION 3
Thandeka has a bag containing 5 green balls and 7 red balls. Two balls are picked at random from
the bag one after the other.
3.1 illustrate the information on a tree diagram if
3.1.1 The first ball was replaced before the second ball was picked 4
3.1.2 The first ball was not replaced and the second ball was picked (4)
3.2 Find the probability that the ball selected were of different colours (2)
3.3 Find the probability that the two balls picked were of the same colour (2)
3.4 Find the probability that at least one of the of the balls picked was green (3)
3.5 Beside the use of the tree diagram, provide any other way of obtaining the sample
space to the question assuming that the probability of picking a ball is
independent (2)
3.6 For a number of experiments provide any two ways by which one can determine
whether a tree diagram drawn is correct or wrong (2)
[TOTAL = 19 marks ]
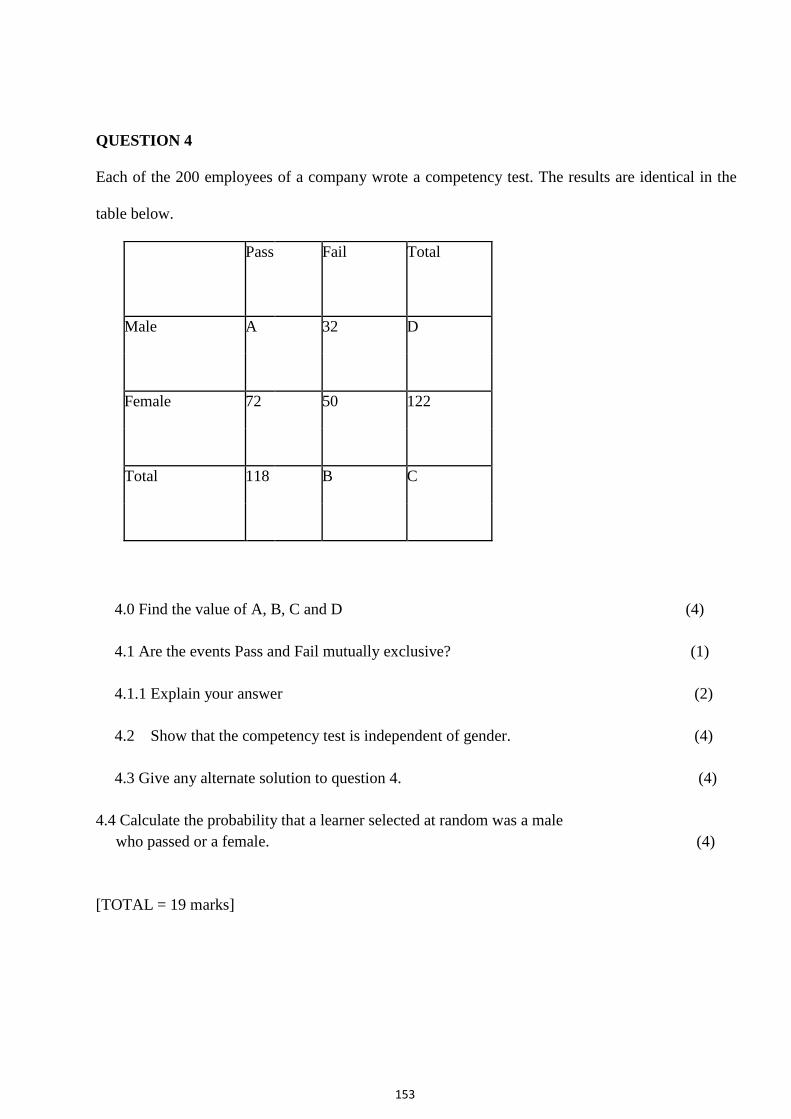
153
QUESTION 4
Each of the 200 employees of a company wrote a competency test. The results are identical in the
table below.
4.0 Find the value of A, B, C and D (4)
4.1 Are the events Pass and Fail mutually exclusive? (1)
4.1.1 Explain your answer (2)
4.2 Show that the competency test is independent of gender. (4)
4.3 Give any alternate solution to question 4. (4)
4.4 Calculate the probability that a learner selected at random was a male
who passed or a female. (4)
[TOTAL = 19 marks]
Pass Fail Total
Male A 32 D
Female 72 50 122
Total 118 B C

154
QUESTION 5
Consider the word MAN
5.1 Write down all the three-word arrangement that can be made if the
5.11 letters can be repeated (3)
5.12 letters not be repeated (1)
5.2 Write down all the two-letter word arrangement that can be made if the
5.2.1 Letters can be repeated (1)
5.2.2 Letters cannot be repeated (1)
5.3 How many words arrangement are possible in 5.11 (1)
5.4 How many words arrangement are possible in 5.1.2 (1)
5.5 How many words arrangement are possible in 5.2.1 (1)
5.6 How many words arrangement are possible in 5.2.2 (1)
From the above investigation come up with a formula that can be used
to arrive at the same answer as in 5.2 and 5.1
5.7.1 5.1.1 (2)
5.7.2 5.1.2 (2)
5.7.3 5.2.1 (2)
5.7.4 5.2.2 (2)
[Total = 18 marks]

155
QUESTION 6
6.1 3 vacant places are to be filled by 5 people
6.1.1 In how many ways can the first place be filled? (1)
6.1.2 In how many ways can the second place be filled? (1)
6.1.3 In how many ways can the third place be filled? (1)
6.1.4 In how many ways can the 5 people fill the 3 places? (2)
6.2 Compute the following
6.2.1 5! (1)
6.2.2 (5 − 3)! (1)
6.2.3 5!
(5−3)! (1)
6.2.4 Compare your result in 6.2.3 with result in 6.1.3 (2)
6.2.5 Hence for n items occupying r positions at a time predict an
appropriate formula to assist in the calculation of the number of ways to do
this. (4)
[TOTAL = 14 marks]

156
Appendix B: Solution to cognitive test on probability and counting principle
SOLUTION TO COGNITIVE TEST
QUESTION 1
1.1.1. Figure 2, this is because of P(P∩Q) =0, The two events are disjoint,
1.1.2. Figure 1, This is because P( M∩S) ≠0, The two events intersects
1.1.3. Figure 2, this because of the two events and mutually exclusive and exhaustive
1.1.4. Figure 2, This is because of the P (P or Q) =1
1.2
1.2.1. P (A or B) = P (A) + P (B)
1.2.2. P (A or B) = P (A) + P (B) - P (A and B)
QUESTION 2
2.1
ii. P (A or B) = P (A) + P(B)
2.2. n (µ) = P (AUB) + P (AUB)’
1 = P (AUB) + 0, 1
1- 0. 1= P (AUB)
0, 9 = P (AUB)
P (AUB) = P (A) only +P (A n B) +P (B) only
0.9 = 0. 6 - X + X + 0. 5 - X
0. 9 = 0, 11 –X
X = 0. 2
This implies that the probability of selecting a learner who passed in both subjects in the class is
0. 2
0.6-X 0.5-X
P(B) = 0.5 P (A) = 0.6
X

157
A learner might also look at the same question from this point of view
n (µ) = P (M) only +P (M n S) +P(S) only + P (MUS)’
1 = 0. 6 - X + X + 0. 5 - X + 0. 1
1- 0. 12 = -X
0. 2 = X
2.3 P (AUB) 1= 1- P (AUB)
= 1- 0.9
= 0.8
2.4 For A and B to be independent P(A and B) =P(A) × P(B)
P(A) × P(B)
0.6× 0.5
0.3
P (A and B) =0.2
This implies that the two events are not independent since the condition for independence is not
satisfied
2.5. No
2.6 This is because P (A or B) ≠1, or P(A or B) is not exhaustive and also P(A and B) is not
mutually exclusive
3.1.1
5
12×
7
12=
35
144
5
12×
5
12=
25
144
7
12
7
12
5
12
R
G
5
12
7
12
5
12 G
G
R
R
7
12×
5
12=
35
144
7
12×
7
12=
49
144

158
3.1.2
3.2
P (GR) +P (RG)
35
144 +
35
144 =
70
288
3.3
P (GG) +P (RR)
42
132 +
20
132 =
62
264
3.4
1- no green
1 - 49
144 =
105
144
3.5. by the use of contingency tables
3.5. by the use of Venn diagram
3.6 The sum of all probabilities on the branches of a tree must be 1
The sum of all probabilities should be one
QUESTION 4
4.0
a= 46; b= 82; d=78; c=200
4.1. Yes
5
12×
7
11=
35
132
5
12×
4
11=
20
132
7
11
7
12
5
12
R
G
4
11
6
11
5
11 G
G
R
R
7
12×
5
11=
35
132
7
12×
6
11=
42
132

159
4.1.1 Because P (F∩P) =0, the event fail and the event pass cannot occur at the same time
They are disjoint
4.2 For events to be independent P (M∩F) = P (M) ×P (F)
P (P) =118
200 ; P (M) =
78
200
×78
200 = 0.23
P (M∩P) =46
200
0.23
Because the condition is satisfied it implies that competency is independent of gender
4.3 P (F) =82
200, P (F) =
122
200
82
200×
122
200= 0.25
P (F∩F) =50
200
0.25
This implies that the competency test is independent of gender.
4.4 P(M ∩ P) OR P(F)
46
200 +
122
200 =
168
200
5.1.1
27 different arrangements
MMM MAN MNN AAA AMN AMM NNN NAM NMM
MMA MNA MAM AAM ANM AMA NNA NMA NAN
MMN MAA MNM AAN ANN ANA NNM NAA NMN

160
5.1.2
6 different arrangements
MAN AMN NAM
MNA ANM NMA
5.1.3
9 Different arrangements
MN NN AA
NM NA NN
MM AM MA
5.2.2
6 different arrangements
MA MN NA
AM NM AM
5.3. 27
5.4. 9
5.5. 9
5.6. 6
5.7.1 nn
5.7.2 n!
5.7.3 nr
5.7.4 𝑛!
(𝑛−𝑟)!

161
QUESTION 6
6.1.1 5
6.1.2 4
6.1.3 3
6.1.4 60
6.2.1 120
6.2.2 2
6.2.3 60
6.24 they are equal
6.2.5 𝑛!
(𝑛−𝑟)!

162
Appendix C: Parent’s consent form
PARENT/GUARDIAN CONSENT FORM
Institute for Science and Technology Education
University of South Africa (Unisa)
Learners’ participation in research study consent form
Title: Investigating Grade 12 learners’ problem-solving skills in probability
Your child is being asked to take part in a research study that investigates the problem-solving
skills of Grade 12 learners in probability. The study is for academic purpose and will enable us to
to understand some of the problems learners have in learning probability.
The study will involve the learners’ writing a test on probability aligned with the curriculum and
assessment policy statement (CAPS) document. The findings will be used to proffer solutions to
the problems students have on the topic.
Your child’s participation in the study is entirely voluntary, and he/she can withdraw from the
study at any time without any penalty. Your information will be treated confidential and the
identity of your child will by no means be revealed in a publication. I will provide you with a
summary of my research results on completion if you would like me to do so.
Thank you in advance for allowing your child to participate in the study.
Should you have any queries, please do not hesitate to contact me on 0788777435 or by email at
[email protected]. Please sign this form to indicate that:
You have read and understood the information above.
You give your consent to participate in the study on voluntary basis.
___________________________ ________________________
Learner signature Date

163
Appendix D: Various graphs showing learner performance in different categories
Figure 4.8: Learner performance by quintiles in mutually exclusive
Figure 4.9: Learner performances in independent events by quintiles
0
20
40
60
80
100
120
140
160
Q1 Q.2 Q.3 Q4
F
R
E
Q
U
E
N
C
Y
QUINTILES
< 50
50 – 99
100
0
10
20
30
40
50
60
70
80
90
Q1 Q2 Q3 Q4
F
R
E
Q
U
E
N
C
Y
QUINTILE
< 50
50 – 99
100

164
Figure 4.10: Learner performance in the use of Venn diagrams by quintiles
Figure 4.11: Learner performance by quintiles in the use of tree diagrams
0
10
20
30
40
50
60
70
80
90
Q1 Q2 Q3 Q4
F
R
E
Q
U
E
N
C
Y
QUINTILE
< 50
50 – 99
100
0
20
40
60
80
100
120
140
Q1 Q2 Q3 Q4
F
R
E
Q
U
E
N
C
Y
QUINTILES
< 50
50 - 99

165
Figure4.12: Learner performance by quintiles in the use of contingency tables
Figure 4.13: Learner performance by quintiles in fundamental counting principles
0
20
40
60
80
100
120
140
160
Q1 Q2 Q3 Q4
F
R
E
Q
U
E
N
C
Y
QUINTILES
< 50
50 - 99

166
Appendix E: SPSS 23 output of reliability coefficient
Scale: ALL VARIABLES
Case Processing Summary
N %
Cases Valid 490 100
Excludeda 0 0
Total 490 100.0
a. List-wise deletion based on all variables in the
procedure.
Reliability Statistics
Cronbach's Alpha N of Items
.771 6

167
Appendix F: Letter of permission to conduct research

168
Appendix G: Ethical clearance certificate from UNISA

169
Appendix H: Games-Howell post-hoc multiple comparison test
Dependent
variable
(I)
quintile
(J)
quintile
Mean
Difference (I-
J)
Std.
error Sig.
95% Confidence
interval
Lower
bound Upper bound
Knowledge 1 2 9.311* 2.782 .005 2.11 16.52
3 18.544* 2.315 .000 12.55 24.54
4 -21.416* 1.792 .000 -26.06 -16.77
2 1 -9.311* 2.782 .005 -16.52 -2.11
3 9.233* 2.756 .005 2.09 16.38
4 -30.727* 2.335 .000 -36.81 -24.65
3 1 -18.544* 2.315 .000 -24.54 -12.55
2 -9.233* 2.756 .005 -16.38 -2.09
4 -39.960* 1.752 .000 -44.52 -35.40
4 1 21.416* 1.792 .000 16.77 26.06
2 30.727* 2.335 .000 24.65 36.81
3 39.960* 1.752 .000 35.40 44.52
Comprehension 1 2 1.122 2.426 .967 -5.15 7.40
3 19.803* 2.040 .000 14.52 25.08
4 -22.860* 2.099 .000 -28.29 -17.43
2 1 -1.122 2.426 .967 -7.40 5.15
3 18.681* 2.039 .000 13.39 23.97
4 -23.982* 2.099 .000 -29.42 -18.55
3 1 -19.803* 2.040 .000 -25.08 -14.52
2 -18.681* 2.039 .000 -23.97 -13.39
4 -42.663* 1.637 .000 -46.90 -38.43
4 1 22.860* 2.099 .000 17.43 28.29

170
2 23.982* 2.099 .000 18.55 29.42
3 42.663* 1.637 .000 38.43 46.90
Application 1 2 16.442* 3.315 .000 7.85 25.04
3 33.923* 2.714 .000 26.89 40.95
4 -.046 2.499 1.000 -6.51 6.41
2 1 -16.442* 3.315 .000 -25.04 -7.85
3 17.480* 3.447 .000 8.54 26.42
4 -16.489* 3.281 .000 -25.00 -7.98
3 1 -33.923* 2.714 .000 -40.95 -26.89
2 -17.480* 3.447 .000 -26.42 -8.54
4 -33.969* 2.673 .000 -40.89 -27.05
4 1 .046 2.499 1.000 -6.41 6.51
2 16.489* 3.281 .000 7.98 25.00
3 33.969* 2.673 .000 27.05 40.89
Analysis 1 2 10.943* 1.647 .000 6.68 15.21
3 26.828* 1.571 .000 22.76 30.90
4 -12.343* 1.400 .000 -15.96 -8.73
2 1 -10.943* 1.647 .000 -15.21 -6.68
3 15.885* 1.739 .000 11.38 20.39
4 -23.286* 1.585 .000 -27.39 -19.18
3 1 -26.828* 1.571 .000 -30.90 -22.76
2 -15.885* 1.739 .000 -20.39 -11.38
4 -39.171* 1.506 .000 -43.07 -35.27
4 1 12.343* 1.400 .000 8.73 15.96
2 23.286* 1.585 .000 19.18 27.39
3 39.171* 1.506 .000 35.27 43.07

171
Evaluation 1 2 1.099 2.500 .972 -5.37 7.56
3 4.222 2.618 .374 -2.56 11.00
4 -14.166* 3.163 .000 -22.34 -5.99
2 1 -1.099 2.500 .972 -7.56 5.37
3 3.123 2.550 .612 -3.49 9.73
4 -15.265* 3.107 .000 -23.30 -7.23
3 1 -4.222 2.618 .374 -11.00 2.56
2 -3.123 2.550 .612 -9.73 3.49
4 -18.388* 3.203 .000 -26.68 -10.10
4 1 14.166* 3.163 .000 5.99 22.34
2 15.265* 3.107 .000 7.23 23.30
3 18.388* 3.203 .000 10.10 26.68
*. The mean difference is significant at P<.05