Embed Size (px)
Citation preview
Provincial Results
Assessments of Reading, Writing and Mathematics, Primary Division (Grades 1–3) and Junior Division (Grades 4–6), 2016–2017
Principal Questionnaire
Results as of August 14, 2017 1 of 40
Response rate for the Province: 2 121 out of 3 254 (65%)
School Demographics
Province*
Number of Respondents 2 121
# %†
1. Which of the following grade levels were taught in your school this year? Check all that apply.
Jr. kindergarten 2 017 95%Sr. kindergarten 2 026 96%Grade 1 2 040 96%Grade 2 2 043 96%Grade 3 2 046 96%Grade 4 2 042 96%Grade 5 2 044 96%Grade 6 1 947 92%Grade 7 1 563 74%Grade 8 1 551 73%Grade 9 22 1%Grades 10 to 12 18 1%
2. On September 30, 2016, what was the total enrolment of students in your school?
50 or fewer 19 1%51–150 175 8%151–250 449 21%251–350 486 23%351–450 365 17%451–550 251 12%551 or more 370 17%No response 6 <1%
* Numbers and percentages are based on the total number of principals who completed the questionnaire.† Percentages may not add up to 100, due to rounding. Note: N/D “No data available” is used to indicate that there were no principals in that group.
Provincial Results
Assessments of Reading, Writing and Mathematics, Primary Division (Grades 1–3) and Junior Division (Grades 4–6), 2016–2017
Principal Questionnaire
Results as of August 14, 2017 2 of 40
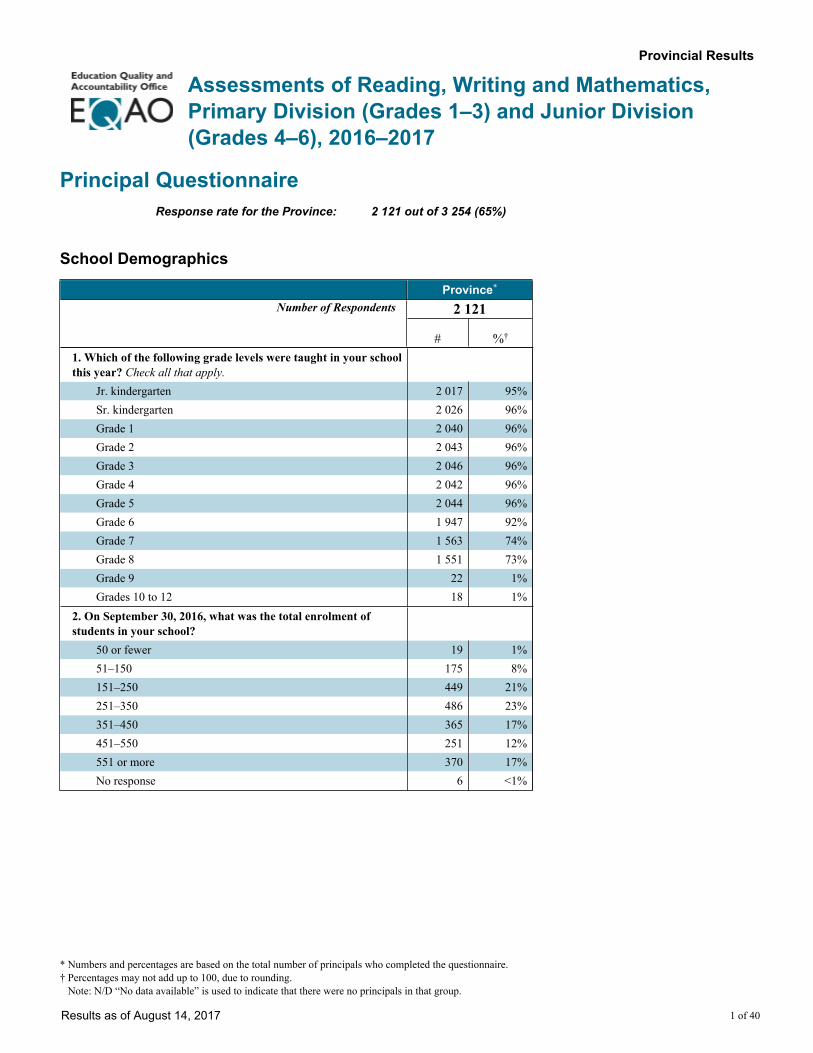
School Demographics
Province*
Number of Respondents 2 121
# %†
3. This year, what percentage of the total enrolment of students in your school were absent on an average day?
0–2% 369 17%3–5% 1 111 52%6–10% 529 25%11–20% 85 4%more than 20% 6 <1%No response 21 1%
* Numbers and percentages are based on the total number of principals who completed the questionnaire.† Percentages may not add up to 100, due to rounding. Note: N/D “No data available” is used to indicate that there were no principals in that group.
Provincial Results
Assessments of Reading, Writing and Mathematics, Primary Division (Grades 1–3) and Junior Division (Grades 4–6), 2016–2017
Principal Questionnaire
Results as of August 14, 2017 3 of 40
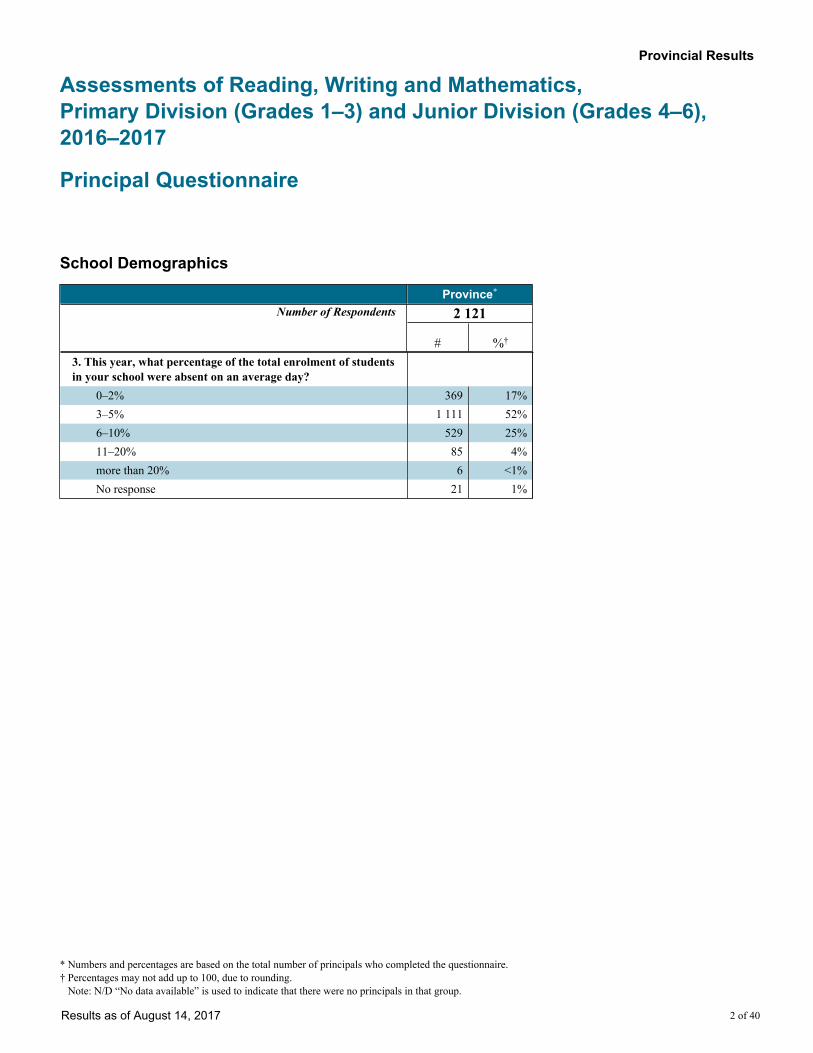
Background
Province*
Number of Respondents 2 121
# %†
4. What is your gender?Female 1 409 66%Male 687 32%No response 25 1%
5a. Including this year, for approximately how many years have you been a principal?
2 years or less 422 20%3–5 years 473 22%6–10 years 623 29%11 years or more 593 28%No response 10 <1%
b. Including this year, for approximately how many years have you been the principal of this school?
2 years or less 1 079 51%3–5 years 838 40%6–10 years 182 9%11 years or more 15 1%No response 7 <1%
c. Are you the principal of more than one school?Yes 76 4%No 2 033 96%No response 12 1%
* Numbers and percentages are based on the total number of principals who completed the questionnaire.† Percentages may not add up to 100, due to rounding. Note: N/D “No data available” is used to indicate that there were no principals in that group.
Provincial Results
Assessments of Reading, Writing and Mathematics, Primary Division (Grades 1–3) and Junior Division (Grades 4–6), 2016–2017
Principal Questionnaire
Results as of August 14, 2017 4 of 40
Background
Province*
Number of Respondents 2 121
# %†
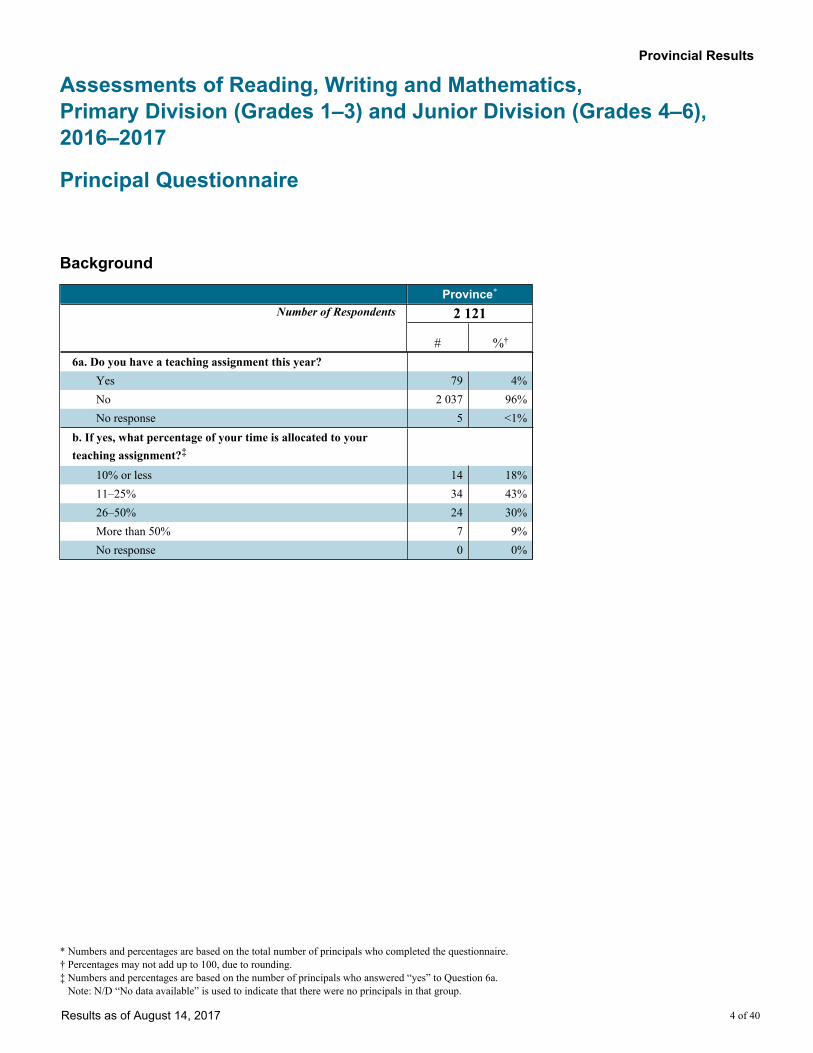
6a. Do you have a teaching assignment this year?Yes 79 4%No 2 037 96%No response 5 <1%
b. If yes, what percentage of your time is allocated to your teaching assignment?‡
10% or less 14 18%11–25% 34 43%26–50% 24 30%More than 50% 7 9%No response 0 0%
* Numbers and percentages are based on the total number of principals who completed the questionnaire.† Percentages may not add up to 100, due to rounding.‡ Numbers and percentages are based on the number of principals who answered “yes” to Question 6a. Note: N/D “No data available” is used to indicate that there were no principals in that group.
Provincial Results
Assessments of Reading, Writing and Mathematics, Primary Division (Grades 1–3) and Junior Division (Grades 4–6), 2016–2017
Principal Questionnaire
Results as of August 14, 2017 5 of 40
Your School
Province*
Number of Respondents 2 121
# %†
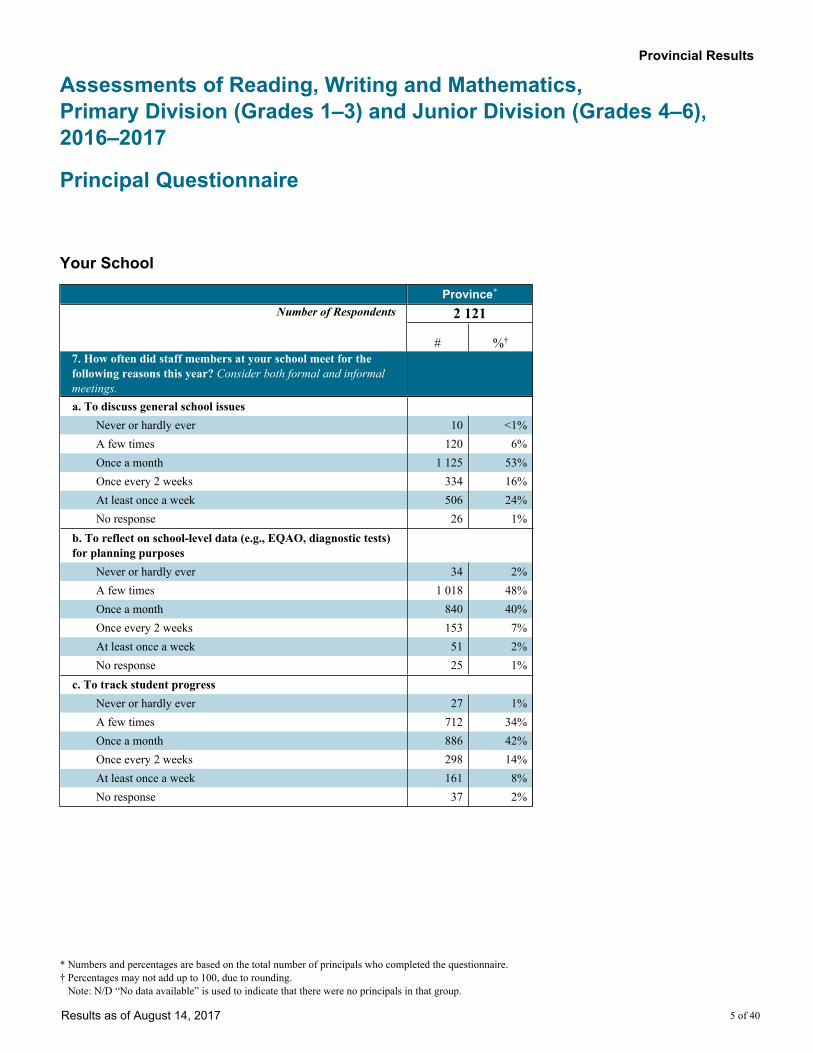
7. How often did staff members at your school meet for the following reasons this year? Consider both formal and informal meetings.a. To discuss general school issues
Never or hardly ever 10 <1%A few times 120 6%Once a month 1 125 53%Once every 2 weeks 334 16%At least once a week 506 24%No response 26 1%
b. To reflect on school-level data (e.g., EQAO, diagnostic tests) for planning purposes
Never or hardly ever 34 2%A few times 1 018 48%Once a month 840 40%Once every 2 weeks 153 7%At least once a week 51 2%No response 25 1%
c. To track student progressNever or hardly ever 27 1%A few times 712 34%Once a month 886 42%Once every 2 weeks 298 14%At least once a week 161 8%No response 37 2%
* Numbers and percentages are based on the total number of principals who completed the questionnaire.† Percentages may not add up to 100, due to rounding. Note: N/D “No data available” is used to indicate that there were no principals in that group.
Provincial Results
Assessments of Reading, Writing and Mathematics, Primary Division (Grades 1–3) and Junior Division (Grades 4–6), 2016–2017
Principal Questionnaire
Results as of August 14, 2017 6 of 40
Your School
Province*
Number of Respondents 2 121
# %†
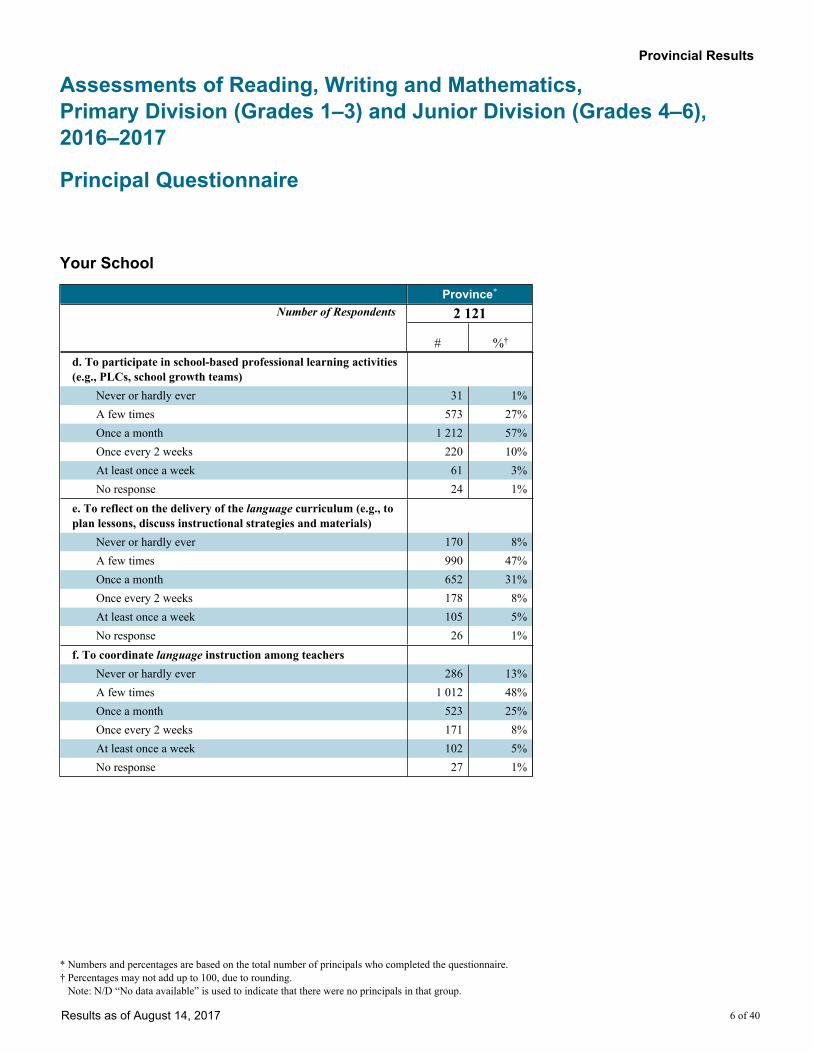
d. To participate in school-based professional learning activities (e.g., PLCs, school growth teams)
Never or hardly ever 31 1%A few times 573 27%Once a month 1 212 57%Once every 2 weeks 220 10%At least once a week 61 3%No response 24 1%
e. To reflect on the delivery of the language curriculum (e.g., to plan lessons, discuss instructional strategies and materials)
Never or hardly ever 170 8%A few times 990 47%Once a month 652 31%Once every 2 weeks 178 8%At least once a week 105 5%No response 26 1%
f. To coordinate language instruction among teachersNever or hardly ever 286 13%A few times 1 012 48%Once a month 523 25%Once every 2 weeks 171 8%At least once a week 102 5%No response 27 1%
* Numbers and percentages are based on the total number of principals who completed the questionnaire.† Percentages may not add up to 100, due to rounding. Note: N/D “No data available” is used to indicate that there were no principals in that group.
Provincial Results
Assessments of Reading, Writing and Mathematics, Primary Division (Grades 1–3) and Junior Division (Grades 4–6), 2016–2017
Principal Questionnaire
Results as of August 14, 2017 7 of 40
Your School
Province*
Number of Respondents 2 121
# %†
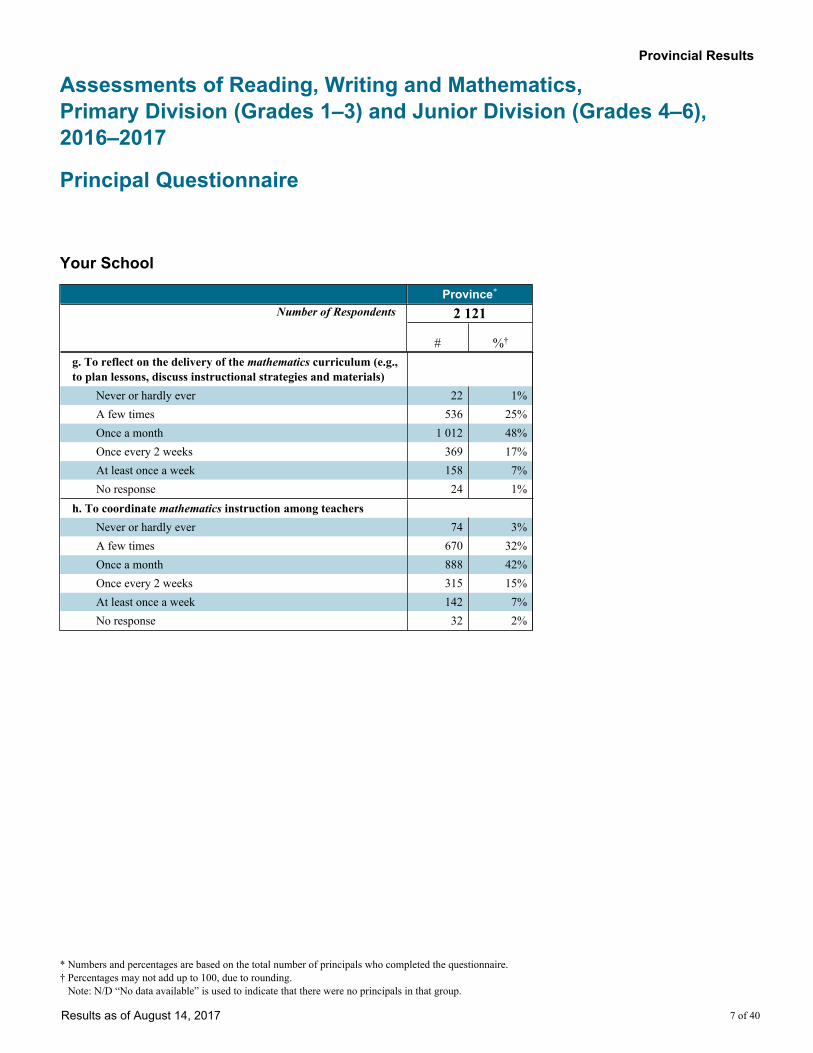
g. To reflect on the delivery of the mathematics curriculum (e.g., to plan lessons, discuss instructional strategies and materials)
Never or hardly ever 22 1%A few times 536 25%Once a month 1 012 48%Once every 2 weeks 369 17%At least once a week 158 7%No response 24 1%
h. To coordinate mathematics instruction among teachersNever or hardly ever 74 3%A few times 670 32%Once a month 888 42%Once every 2 weeks 315 15%At least once a week 142 7%No response 32 2%
* Numbers and percentages are based on the total number of principals who completed the questionnaire.† Percentages may not add up to 100, due to rounding. Note: N/D “No data available” is used to indicate that there were no principals in that group.
Provincial Results
Assessments of Reading, Writing and Mathematics, Primary Division (Grades 1–3) and Junior Division (Grades 4–6), 2016–2017
Principal Questionnaire
Results as of August 14, 2017 8 of 40
Your School
Province*
Number of Respondents 2 121
# %†
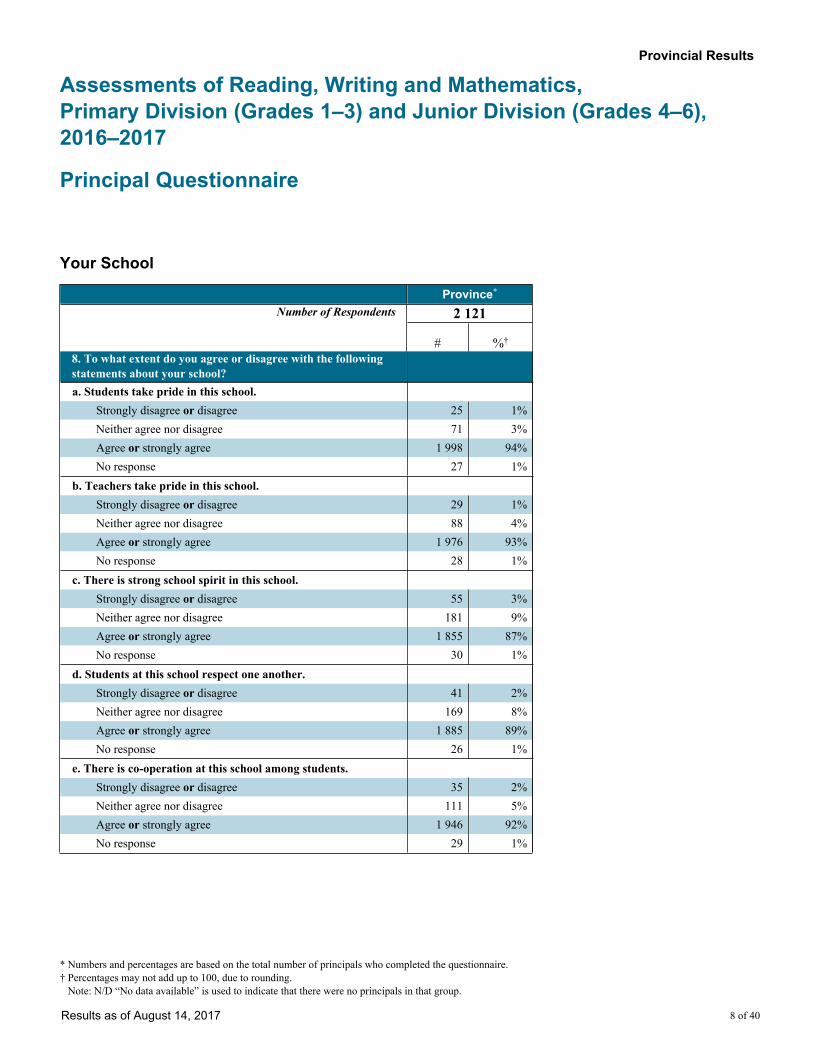
8. To what extent do you agree or disagree with the following statements about your school?a. Students take pride in this school.
Strongly disagree or disagree 25 1%Neither agree nor disagree 71 3%Agree or strongly agree 1 998 94%No response 27 1%
b. Teachers take pride in this school.Strongly disagree or disagree 29 1%Neither agree nor disagree 88 4%Agree or strongly agree 1 976 93%No response 28 1%
c. There is strong school spirit in this school.Strongly disagree or disagree 55 3%Neither agree nor disagree 181 9%Agree or strongly agree 1 855 87%No response 30 1%
d. Students at this school respect one another.Strongly disagree or disagree 41 2%Neither agree nor disagree 169 8%Agree or strongly agree 1 885 89%No response 26 1%
e. There is co-operation at this school among students.Strongly disagree or disagree 35 2%Neither agree nor disagree 111 5%Agree or strongly agree 1 946 92%No response 29 1%
* Numbers and percentages are based on the total number of principals who completed the questionnaire.† Percentages may not add up to 100, due to rounding. Note: N/D “No data available” is used to indicate that there were no principals in that group.
Provincial Results
Assessments of Reading, Writing and Mathematics, Primary Division (Grades 1–3) and Junior Division (Grades 4–6), 2016–2017
Principal Questionnaire
Results as of August 14, 2017 9 of 40
Your School
Province*
Number of Respondents 2 121
# %†
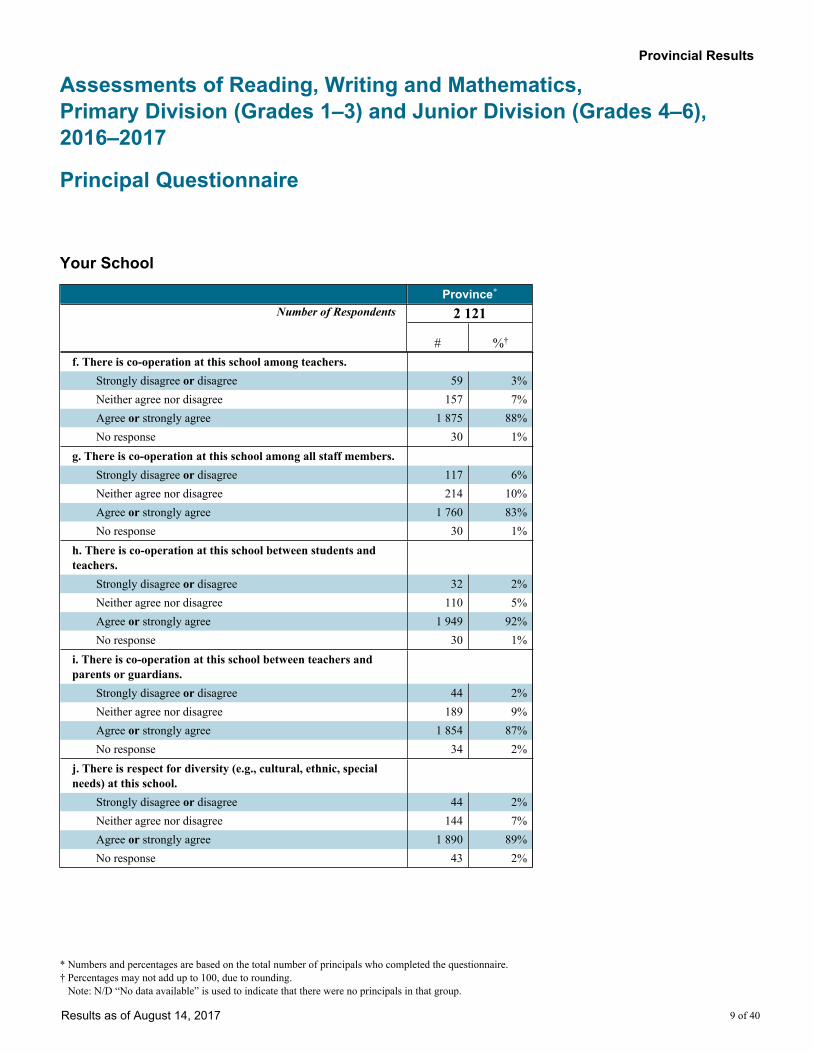
f. There is co-operation at this school among teachers.Strongly disagree or disagree 59 3%Neither agree nor disagree 157 7%Agree or strongly agree 1 875 88%No response 30 1%
g. There is co-operation at this school among all staff members.Strongly disagree or disagree 117 6%Neither agree nor disagree 214 10%Agree or strongly agree 1 760 83%No response 30 1%
h. There is co-operation at this school between students and teachers.
Strongly disagree or disagree 32 2%Neither agree nor disagree 110 5%Agree or strongly agree 1 949 92%No response 30 1%
i. There is co-operation at this school between teachers and parents or guardians.
Strongly disagree or disagree 44 2%Neither agree nor disagree 189 9%Agree or strongly agree 1 854 87%No response 34 2%
j. There is respect for diversity (e.g., cultural, ethnic, special needs) at this school.
Strongly disagree or disagree 44 2%Neither agree nor disagree 144 7%Agree or strongly agree 1 890 89%No response 43 2%
* Numbers and percentages are based on the total number of principals who completed the questionnaire.† Percentages may not add up to 100, due to rounding. Note: N/D “No data available” is used to indicate that there were no principals in that group.
Provincial Results
Assessments of Reading, Writing and Mathematics, Primary Division (Grades 1–3) and Junior Division (Grades 4–6), 2016–2017
Principal Questionnaire
Results as of August 14, 2017 10 of 40
Province*
Number of Respondents
# %†
9. This question is not reported. Currently under field-testing.
* Numbers and percentages are based on the total number of principals who completed the questionnaire.† Percentages may not add up to 100, due to rounding. Note: N/D “No data available” is used to indicate that there were no principals in that group.
Provincial Results
Assessments of Reading, Writing and Mathematics, Primary Division (Grades 1–3) and Junior Division (Grades 4–6), 2016–2017
Principal Questionnaire
Results as of August 14, 2017 11 of 40
Your School
Province*
Number of Respondents 2 121
# %†
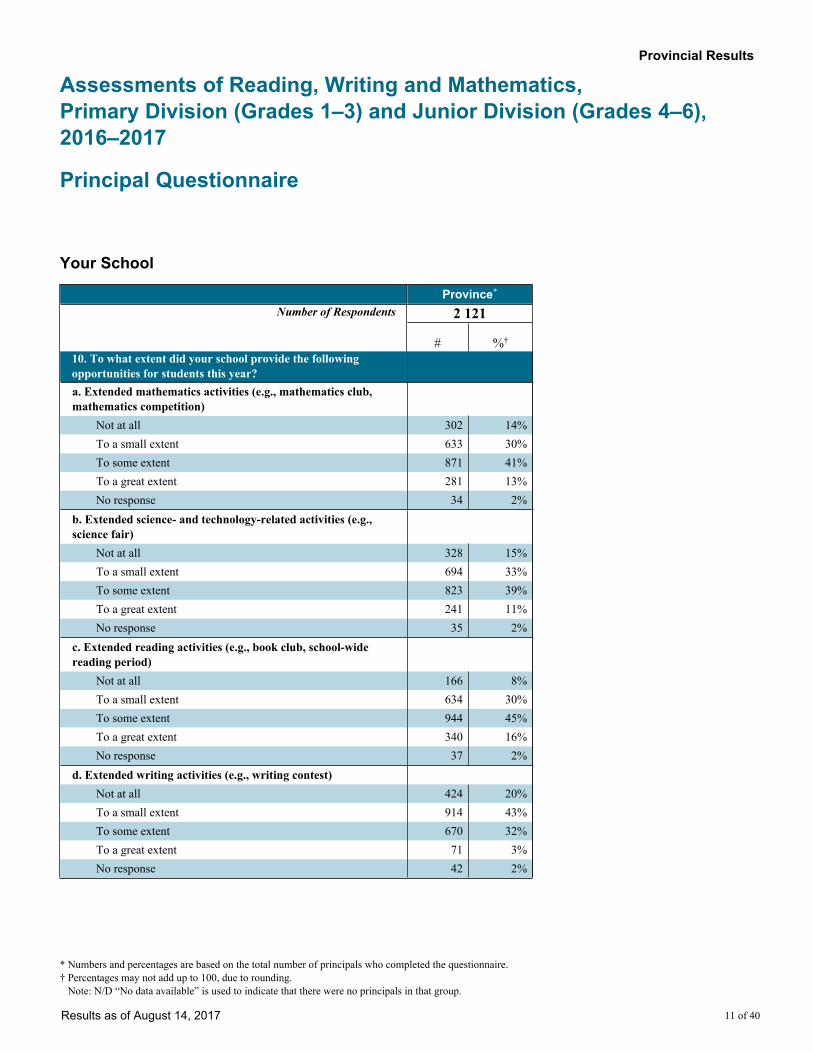
10. To what extent did your school provide the following opportunities for students this year?a. Extended mathematics activities (e.g., mathematics club, mathematics competition)
Not at all 302 14%To a small extent 633 30%To some extent 871 41%To a great extent 281 13%No response 34 2%
b. Extended science- and technology-related activities (e.g., science fair)
Not at all 328 15%To a small extent 694 33%To some extent 823 39%To a great extent 241 11%No response 35 2%
c. Extended reading activities (e.g., book club, school-wide reading period)
Not at all 166 8%To a small extent 634 30%To some extent 944 45%To a great extent 340 16%No response 37 2%
d. Extended writing activities (e.g., writing contest)Not at all 424 20%To a small extent 914 43%To some extent 670 32%To a great extent 71 3%No response 42 2%
* Numbers and percentages are based on the total number of principals who completed the questionnaire.† Percentages may not add up to 100, due to rounding. Note: N/D “No data available” is used to indicate that there were no principals in that group.
Provincial Results
Assessments of Reading, Writing and Mathematics, Primary Division (Grades 1–3) and Junior Division (Grades 4–6), 2016–2017
Principal Questionnaire
Results as of August 14, 2017 12 of 40
Your School
Province*
Number of Respondents 2 121
# %†
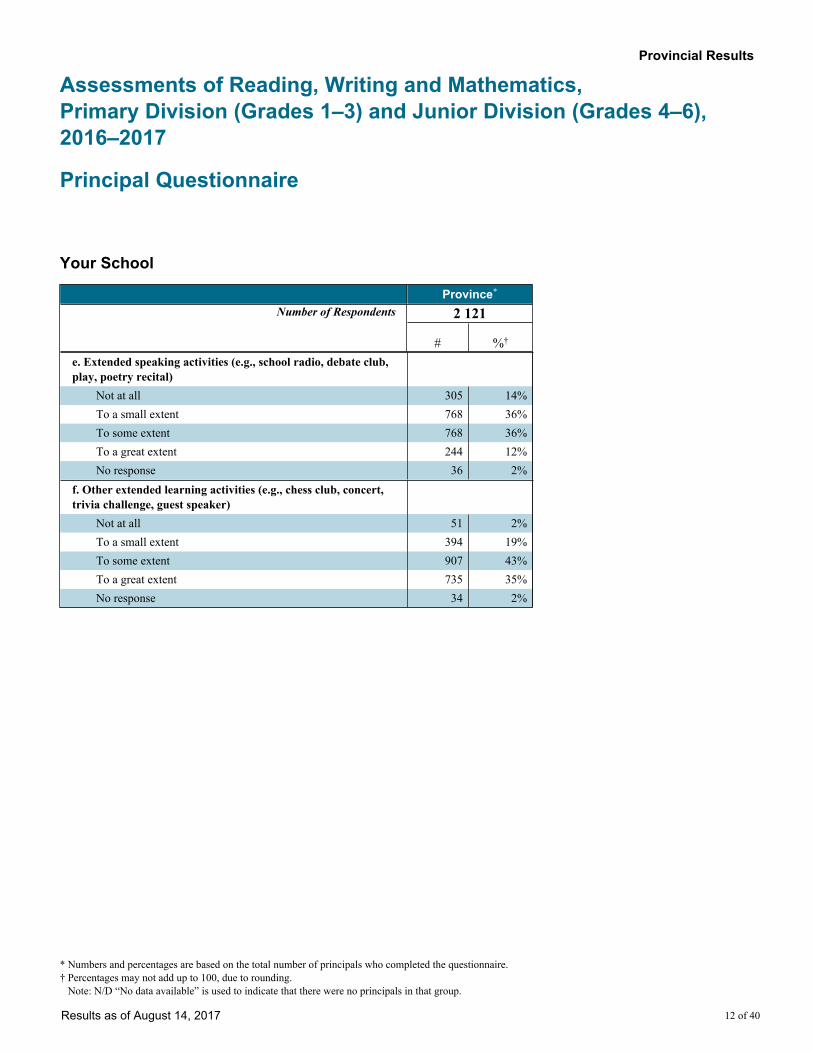
e. Extended speaking activities (e.g., school radio, debate club, play, poetry recital)
Not at all 305 14%To a small extent 768 36%To some extent 768 36%To a great extent 244 12%No response 36 2%
f. Other extended learning activities (e.g., chess club, concert, trivia challenge, guest speaker)
Not at all 51 2%To a small extent 394 19%To some extent 907 43%To a great extent 735 35%No response 34 2%
* Numbers and percentages are based on the total number of principals who completed the questionnaire.† Percentages may not add up to 100, due to rounding. Note: N/D “No data available” is used to indicate that there were no principals in that group.
Provincial Results
Assessments of Reading, Writing and Mathematics, Primary Division (Grades 1–3) and Junior Division (Grades 4–6), 2016–2017
Principal Questionnaire
Results as of August 14, 2017 13 of 40
Your School
Province*
Number of Respondents 2 121
# %†
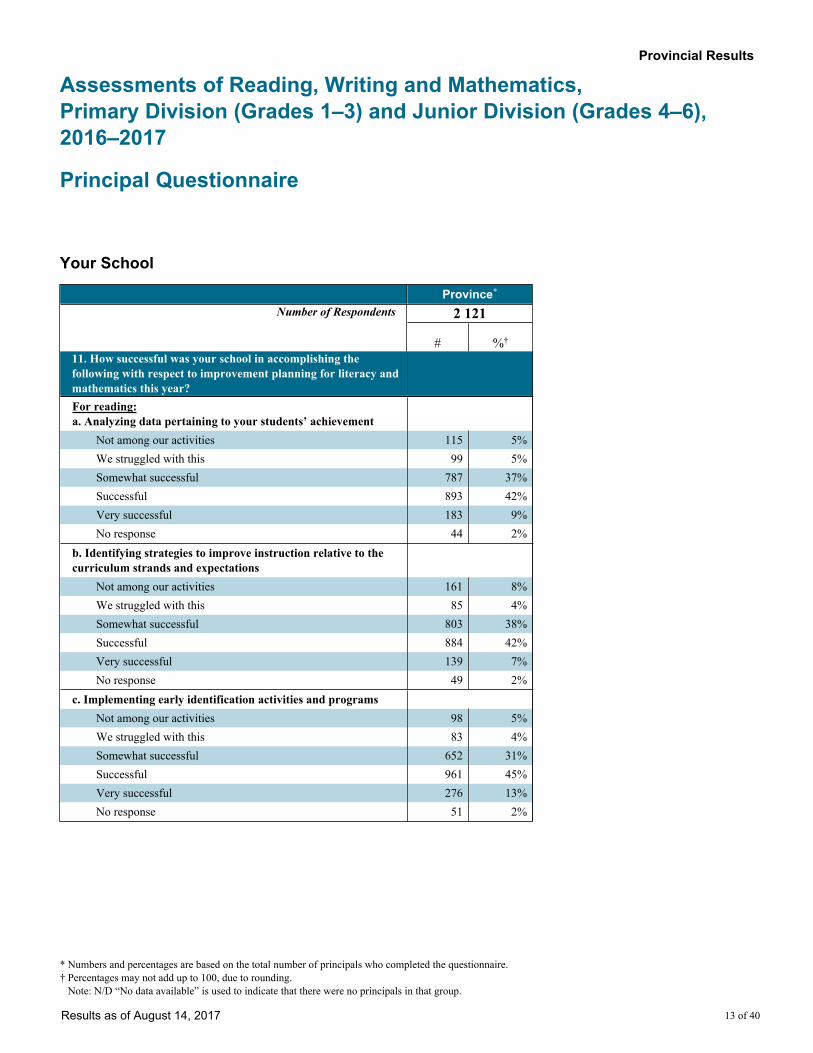
11. How successful was your school in accomplishing the following with respect to improvement planning for literacy and mathematics this year?For reading:a. Analyzing data pertaining to your students’ achievement
Not among our activities 115 5%We struggled with this 99 5%Somewhat successful 787 37%Successful 893 42%Very successful 183 9%No response 44 2%
b. Identifying strategies to improve instruction relative to the curriculum strands and expectations
Not among our activities 161 8%We struggled with this 85 4%Somewhat successful 803 38%Successful 884 42%Very successful 139 7%No response 49 2%
c. Implementing early identification activities and programsNot among our activities 98 5%We struggled with this 83 4%Somewhat successful 652 31%Successful 961 45%Very successful 276 13%No response 51 2%
* Numbers and percentages are based on the total number of principals who completed the questionnaire.† Percentages may not add up to 100, due to rounding. Note: N/D “No data available” is used to indicate that there were no principals in that group.
Provincial Results
Assessments of Reading, Writing and Mathematics, Primary Division (Grades 1–3) and Junior Division (Grades 4–6), 2016–2017
Principal Questionnaire
Results as of August 14, 2017 14 of 40
Your School
Province*
Number of Respondents 2 121
# %†
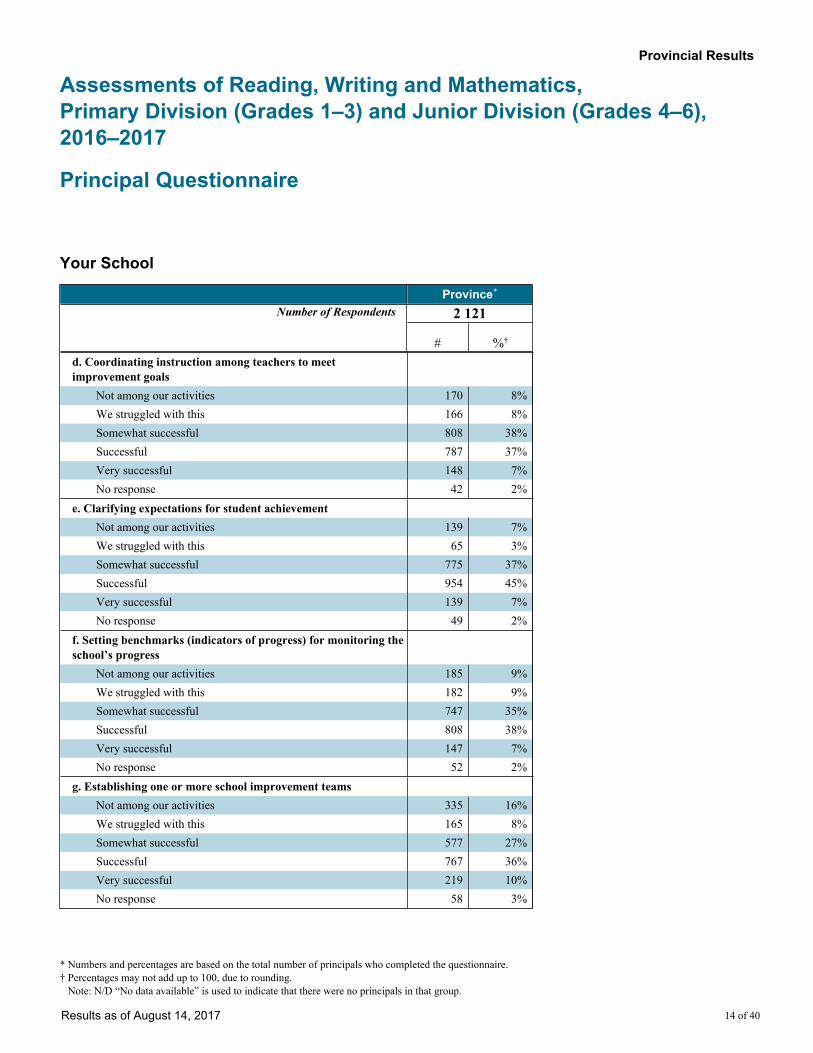
d. Coordinating instruction among teachers to meet improvement goals
Not among our activities 170 8%We struggled with this 166 8%Somewhat successful 808 38%Successful 787 37%Very successful 148 7%No response 42 2%
e. Clarifying expectations for student achievementNot among our activities 139 7%We struggled with this 65 3%Somewhat successful 775 37%Successful 954 45%Very successful 139 7%No response 49 2%
f. Setting benchmarks (indicators of progress) for monitoring the school’s progress
Not among our activities 185 9%We struggled with this 182 9%Somewhat successful 747 35%Successful 808 38%Very successful 147 7%No response 52 2%
g. Establishing one or more school improvement teamsNot among our activities 335 16%We struggled with this 165 8%Somewhat successful 577 27%Successful 767 36%Very successful 219 10%No response 58 3%
* Numbers and percentages are based on the total number of principals who completed the questionnaire.† Percentages may not add up to 100, due to rounding. Note: N/D “No data available” is used to indicate that there were no principals in that group.

Provincial Results
Assessments of Reading, Writing and Mathematics, Primary Division (Grades 1–3) and Junior Division (Grades 4–6), 2016–2017
Principal Questionnaire
Results as of August 14, 2017 15 of 40
Your School
Province*
Number of Respondents 2 121
# %†
h. Meeting the timelines in your school’s improvement planNot among our activities 270 13%We struggled with this 139 7%Somewhat successful 658 31%Successful 846 40%Very successful 154 7%No response 54 3%
i. Providing evidence of the school’s progress in meeting improvement goals
Not among our activities 254 12%We struggled with this 169 8%Somewhat successful 758 36%Successful 755 36%Very successful 120 6%No response 65 3%
j. Engaging all staff in improvement activitiesNot among our activities 252 12%We struggled with this 173 8%Somewhat successful 645 30%Successful 807 38%Very successful 181 9%No response 63 3%
* Numbers and percentages are based on the total number of principals who completed the questionnaire.† Percentages may not add up to 100, due to rounding. Note: N/D “No data available” is used to indicate that there were no principals in that group.
Provincial Results
Assessments of Reading, Writing and Mathematics, Primary Division (Grades 1–3) and Junior Division (Grades 4–6), 2016–2017
Principal Questionnaire
Results as of August 14, 2017 16 of 40
Your School
Province*
Number of Respondents 2 121
# %†
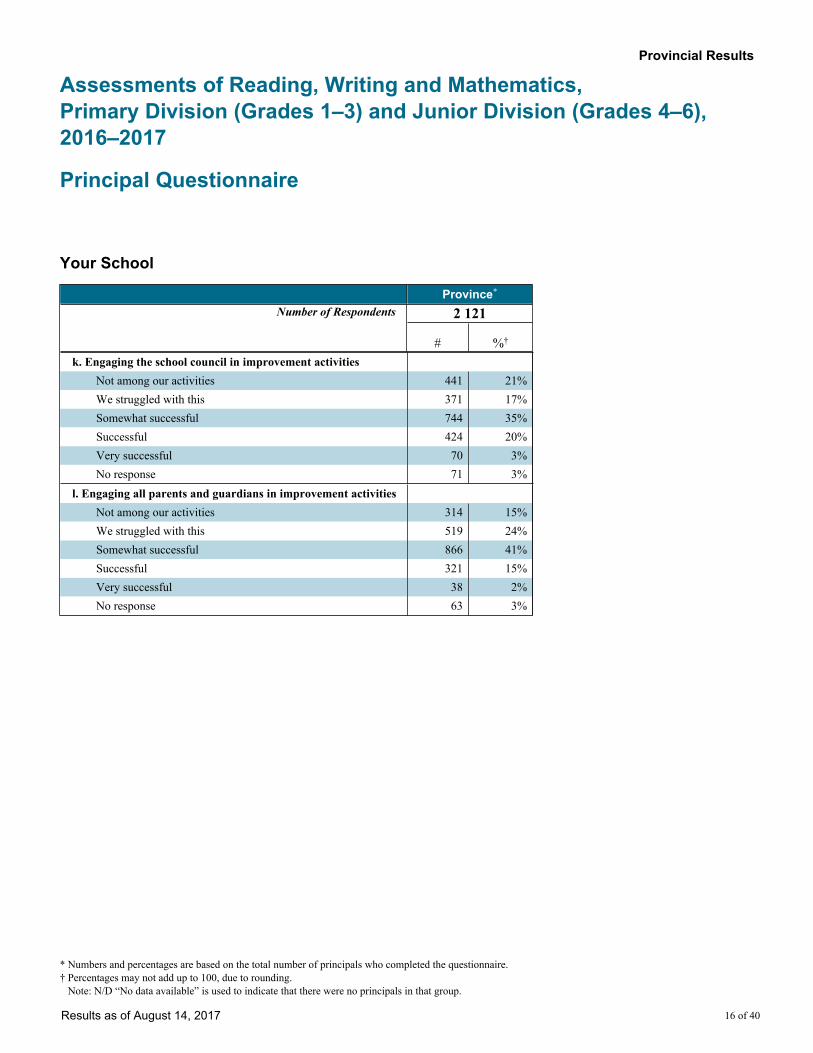
k. Engaging the school council in improvement activitiesNot among our activities 441 21%We struggled with this 371 17%Somewhat successful 744 35%Successful 424 20%Very successful 70 3%No response 71 3%
l. Engaging all parents and guardians in improvement activitiesNot among our activities 314 15%We struggled with this 519 24%Somewhat successful 866 41%Successful 321 15%Very successful 38 2%No response 63 3%
* Numbers and percentages are based on the total number of principals who completed the questionnaire.† Percentages may not add up to 100, due to rounding. Note: N/D “No data available” is used to indicate that there were no principals in that group.
Provincial Results
Assessments of Reading, Writing and Mathematics, Primary Division (Grades 1–3) and Junior Division (Grades 4–6), 2016–2017
Principal Questionnaire
Results as of August 14, 2017 17 of 40
Your School
Province*
Number of Respondents 2 121
# %†
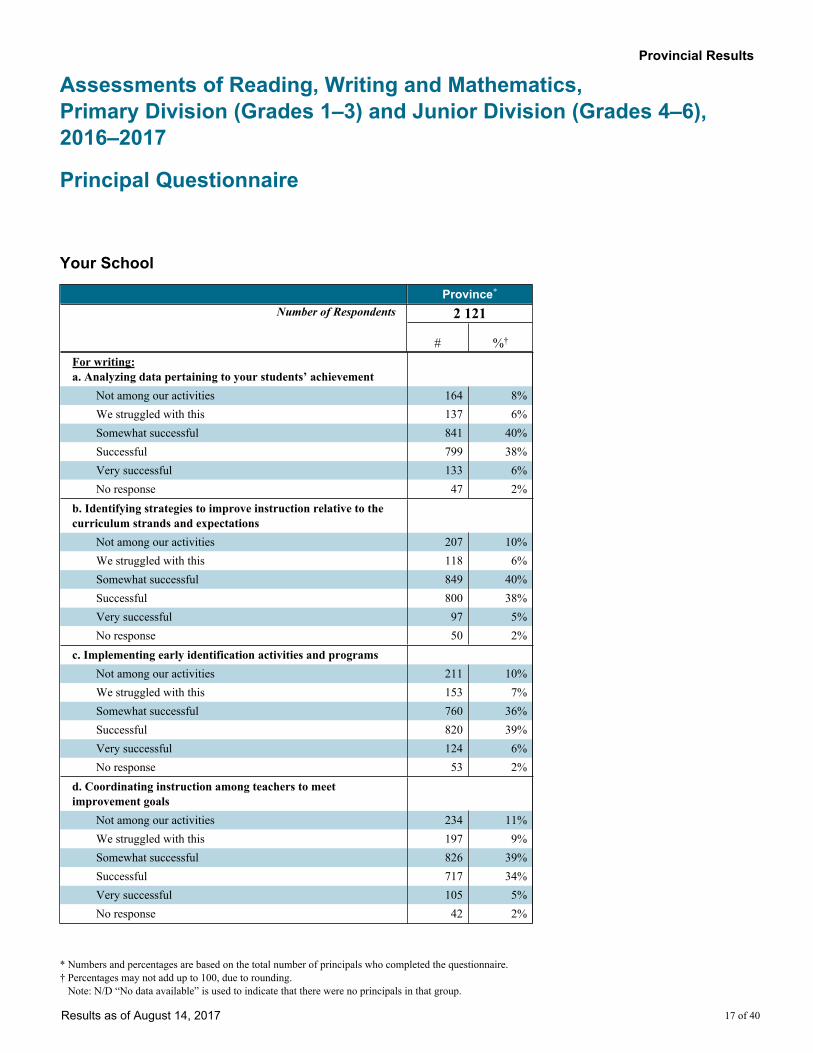
For writing:a. Analyzing data pertaining to your students’ achievement
Not among our activities 164 8%We struggled with this 137 6%Somewhat successful 841 40%Successful 799 38%Very successful 133 6%No response 47 2%
b. Identifying strategies to improve instruction relative to the curriculum strands and expectations
Not among our activities 207 10%We struggled with this 118 6%Somewhat successful 849 40%Successful 800 38%Very successful 97 5%No response 50 2%
c. Implementing early identification activities and programsNot among our activities 211 10%We struggled with this 153 7%Somewhat successful 760 36%Successful 820 39%Very successful 124 6%No response 53 2%
d. Coordinating instruction among teachers to meet improvement goals
Not among our activities 234 11%We struggled with this 197 9%Somewhat successful 826 39%Successful 717 34%Very successful 105 5%No response 42 2%
* Numbers and percentages are based on the total number of principals who completed the questionnaire.† Percentages may not add up to 100, due to rounding. Note: N/D “No data available” is used to indicate that there were no principals in that group.

Provincial Results
Assessments of Reading, Writing and Mathematics, Primary Division (Grades 1–3) and Junior Division (Grades 4–6), 2016–2017
Principal Questionnaire
Results as of August 14, 2017 18 of 40
Your School
Province*
Number of Respondents 2 121
# %†
e. Clarifying expectations for student achievementNot among our activities 199 9%We struggled with this 91 4%Somewhat successful 788 37%Successful 890 42%Very successful 104 5%No response 49 2%
f. Setting benchmarks (indicators of progress) for monitoring the school’s progress
Not among our activities 264 12%We struggled with this 230 11%Somewhat successful 794 37%Successful 703 33%Very successful 77 4%No response 53 2%
g. Establishing one or more school improvement teamsNot among our activities 409 19%We struggled with this 187 9%Somewhat successful 602 28%Successful 687 32%Very successful 171 8%No response 65 3%
* Numbers and percentages are based on the total number of principals who completed the questionnaire.† Percentages may not add up to 100, due to rounding. Note: N/D “No data available” is used to indicate that there were no principals in that group.

Provincial Results
Assessments of Reading, Writing and Mathematics, Primary Division (Grades 1–3) and Junior Division (Grades 4–6), 2016–2017
Principal Questionnaire
Results as of August 14, 2017 19 of 40
Your School
Province*
Number of Respondents 2 121
# %†
h. Meeting the timelines in your school’s improvement planNot among our activities 350 17%We struggled with this 155 7%Somewhat successful 653 31%Successful 770 36%Very successful 136 6%No response 57 3%
i. Providing evidence of the school’s progress in meeting improvement goals
Not among our activities 345 16%We struggled with this 208 10%Somewhat successful 784 37%Successful 637 30%Very successful 82 4%No response 65 3%
j. Engaging all staff in improvement activitiesNot among our activities 335 16%We struggled with this 192 9%Somewhat successful 664 31%Successful 714 34%Very successful 152 7%No response 64 3%
* Numbers and percentages are based on the total number of principals who completed the questionnaire.† Percentages may not add up to 100, due to rounding. Note: N/D “No data available” is used to indicate that there were no principals in that group.
Provincial Results
Assessments of Reading, Writing and Mathematics, Primary Division (Grades 1–3) and Junior Division (Grades 4–6), 2016–2017
Principal Questionnaire
Results as of August 14, 2017 20 of 40
Your School
Province*
Number of Respondents 2 121
# %†
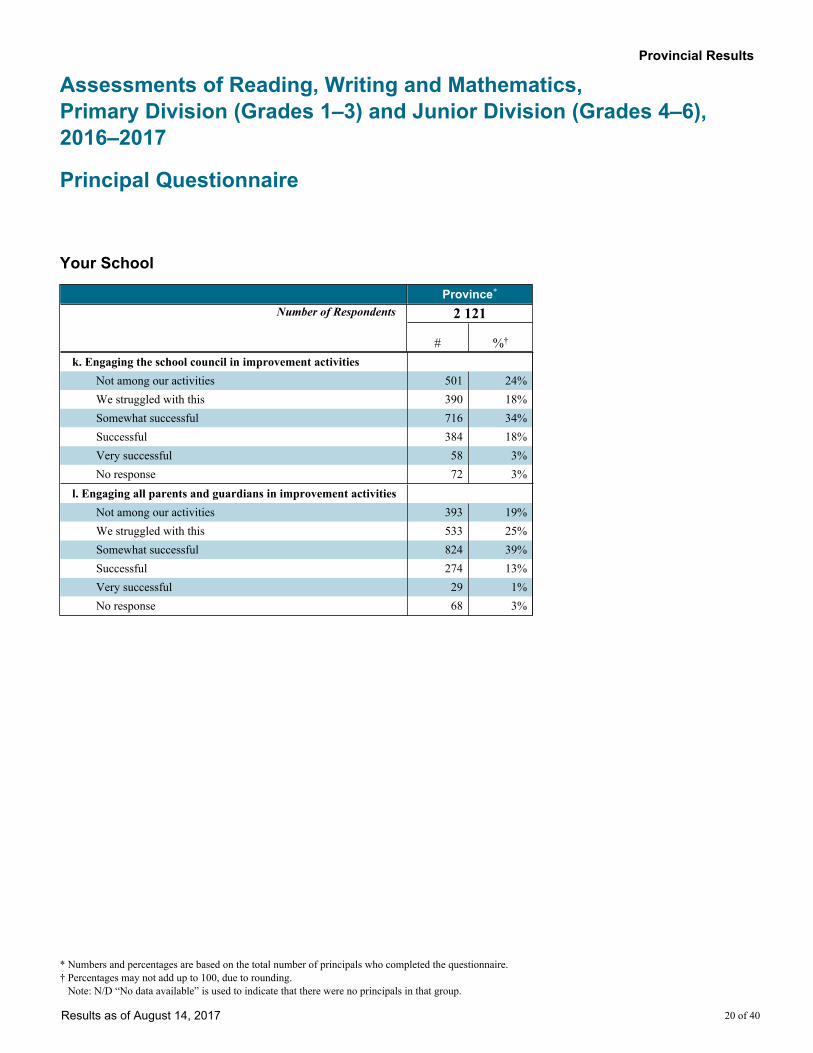
k. Engaging the school council in improvement activitiesNot among our activities 501 24%We struggled with this 390 18%Somewhat successful 716 34%Successful 384 18%Very successful 58 3%No response 72 3%
l. Engaging all parents and guardians in improvement activitiesNot among our activities 393 19%We struggled with this 533 25%Somewhat successful 824 39%Successful 274 13%Very successful 29 1%No response 68 3%
* Numbers and percentages are based on the total number of principals who completed the questionnaire.† Percentages may not add up to 100, due to rounding. Note: N/D “No data available” is used to indicate that there were no principals in that group.
Provincial Results
Assessments of Reading, Writing and Mathematics, Primary Division (Grades 1–3) and Junior Division (Grades 4–6), 2016–2017
Principal Questionnaire
Results as of August 14, 2017 21 of 40
Your School
Province*
Number of Respondents 2 121
# %†
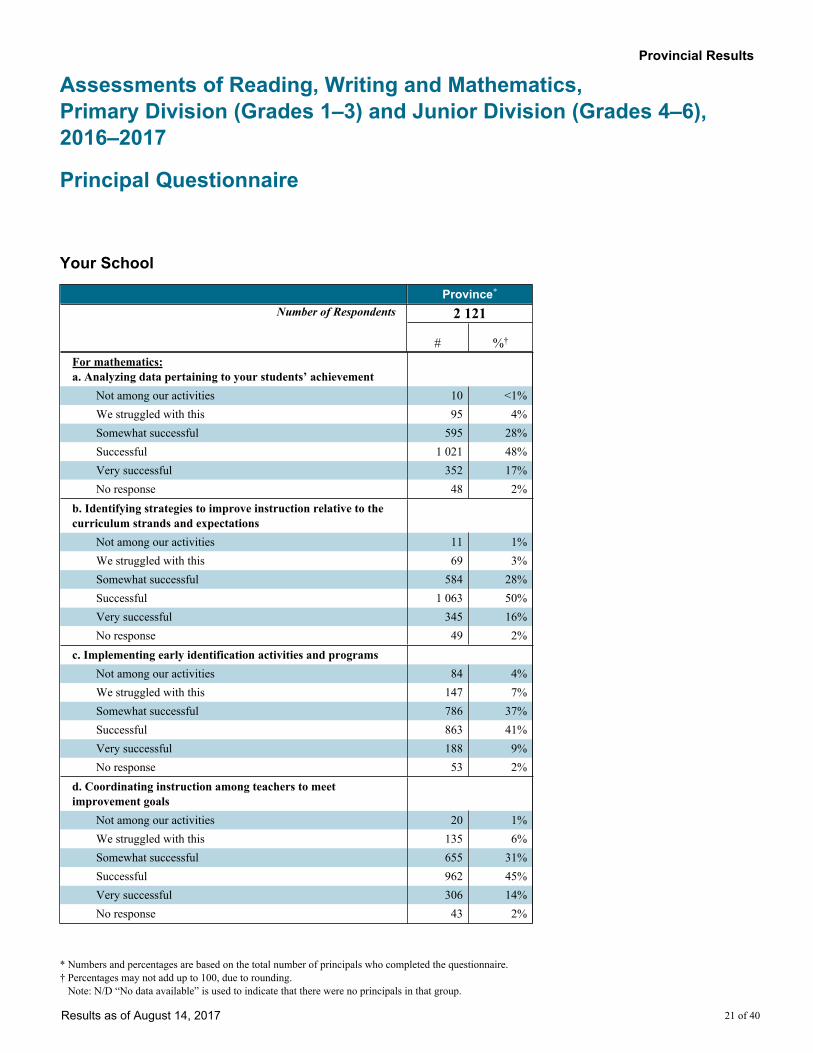
For mathematics:a. Analyzing data pertaining to your students’ achievement
Not among our activities 10 <1%We struggled with this 95 4%Somewhat successful 595 28%Successful 1 021 48%Very successful 352 17%No response 48 2%
b. Identifying strategies to improve instruction relative to the curriculum strands and expectations
Not among our activities 11 1%We struggled with this 69 3%Somewhat successful 584 28%Successful 1 063 50%Very successful 345 16%No response 49 2%
c. Implementing early identification activities and programsNot among our activities 84 4%We struggled with this 147 7%Somewhat successful 786 37%Successful 863 41%Very successful 188 9%No response 53 2%
d. Coordinating instruction among teachers to meet improvement goals
Not among our activities 20 1%We struggled with this 135 6%Somewhat successful 655 31%Successful 962 45%Very successful 306 14%No response 43 2%
* Numbers and percentages are based on the total number of principals who completed the questionnaire.† Percentages may not add up to 100, due to rounding. Note: N/D “No data available” is used to indicate that there were no principals in that group.
Provincial Results
Assessments of Reading, Writing and Mathematics, Primary Division (Grades 1–3) and Junior Division (Grades 4–6), 2016–2017
Principal Questionnaire
Results as of August 14, 2017 22 of 40
Your School
Province*
Number of Respondents 2 121
# %†
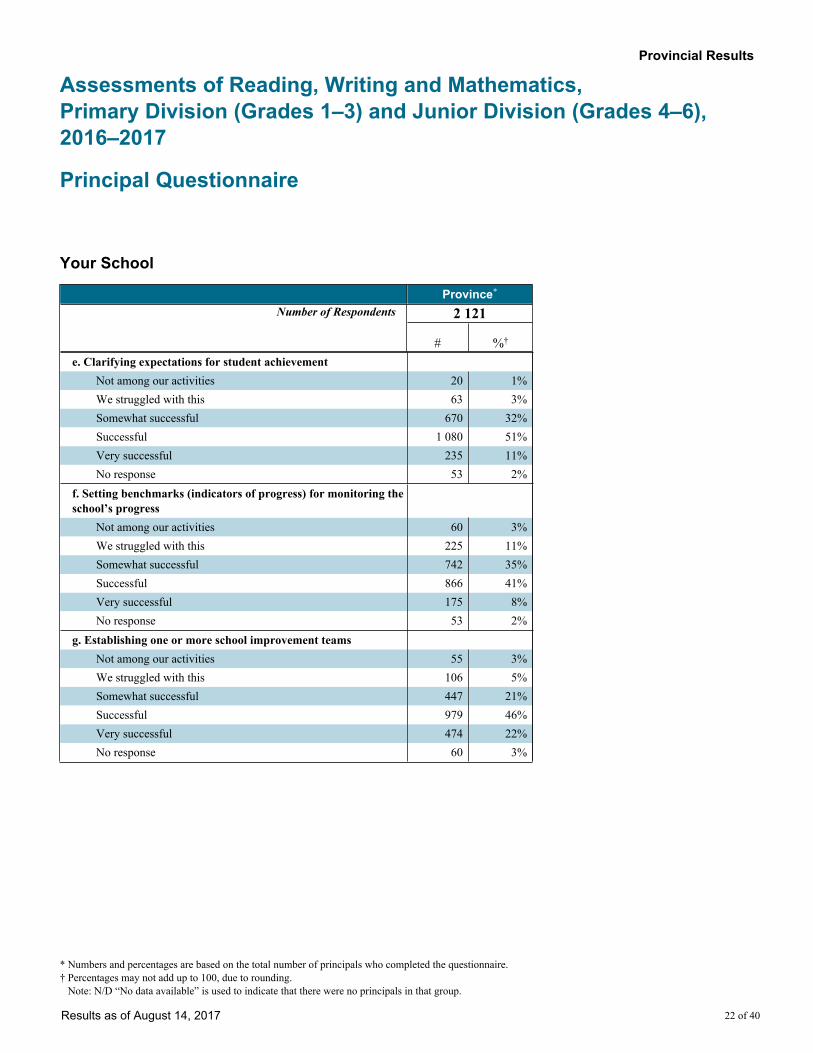
e. Clarifying expectations for student achievementNot among our activities 20 1%We struggled with this 63 3%Somewhat successful 670 32%Successful 1 080 51%Very successful 235 11%No response 53 2%
f. Setting benchmarks (indicators of progress) for monitoring the school’s progress
Not among our activities 60 3%We struggled with this 225 11%Somewhat successful 742 35%Successful 866 41%Very successful 175 8%No response 53 2%
g. Establishing one or more school improvement teamsNot among our activities 55 3%We struggled with this 106 5%Somewhat successful 447 21%Successful 979 46%Very successful 474 22%No response 60 3%
* Numbers and percentages are based on the total number of principals who completed the questionnaire.† Percentages may not add up to 100, due to rounding. Note: N/D “No data available” is used to indicate that there were no principals in that group.

Provincial Results
Assessments of Reading, Writing and Mathematics, Primary Division (Grades 1–3) and Junior Division (Grades 4–6), 2016–2017
Principal Questionnaire
Results as of August 14, 2017 23 of 40
Your School
Province*
Number of Respondents 2 121
# %†
h. Meeting the timelines in your school’s improvement planNot among our activities 29 1%We struggled with this 129 6%Somewhat successful 651 31%Successful 994 47%Very successful 269 13%No response 49 2%
i. Providing evidence of the school’s progress in meeting improvement goals
Not among our activities 37 2%We struggled with this 170 8%Somewhat successful 734 35%Successful 912 43%Very successful 203 10%No response 65 3%
j. Engaging all staff in improvement activitiesNot among our activities 14 1%We struggled with this 144 7%Somewhat successful 560 26%Successful 964 45%Very successful 378 18%No response 61 3%
* Numbers and percentages are based on the total number of principals who completed the questionnaire.† Percentages may not add up to 100, due to rounding. Note: N/D “No data available” is used to indicate that there were no principals in that group.
Provincial Results
Assessments of Reading, Writing and Mathematics, Primary Division (Grades 1–3) and Junior Division (Grades 4–6), 2016–2017
Principal Questionnaire
Results as of August 14, 2017 24 of 40
Your School
Province*
Number of Respondents 2 121
# %†
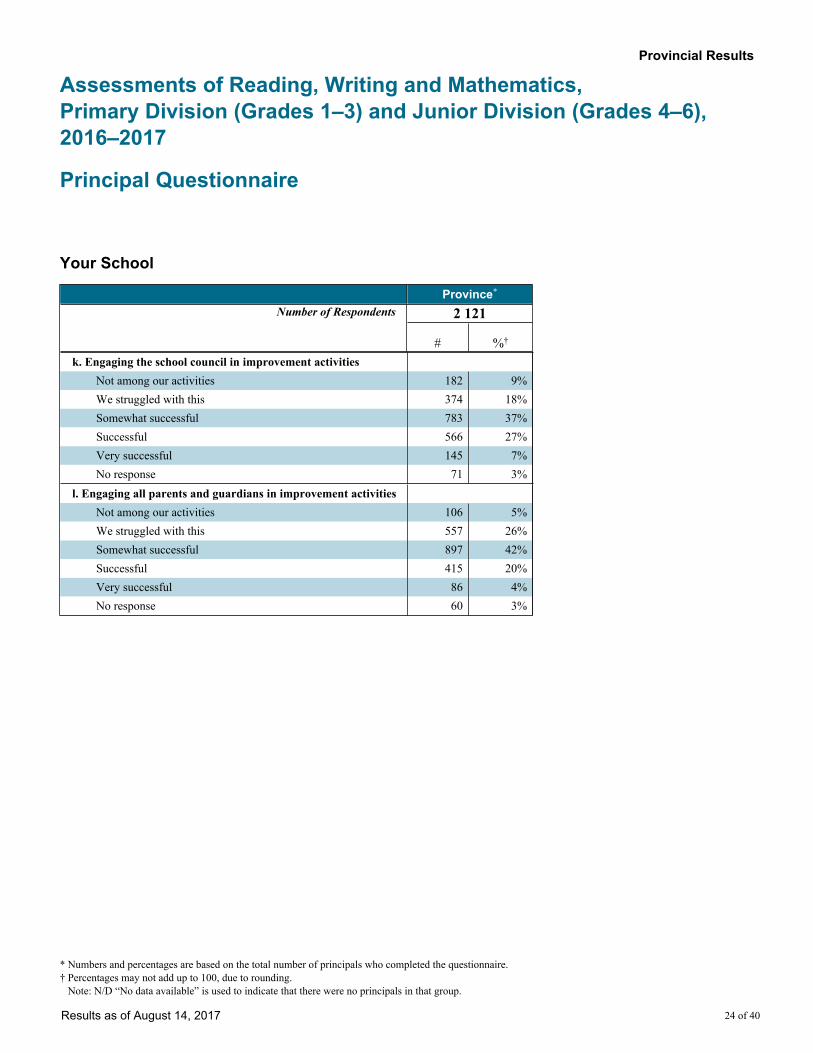
k. Engaging the school council in improvement activitiesNot among our activities 182 9%We struggled with this 374 18%Somewhat successful 783 37%Successful 566 27%Very successful 145 7%No response 71 3%
l. Engaging all parents and guardians in improvement activitiesNot among our activities 106 5%We struggled with this 557 26%Somewhat successful 897 42%Successful 415 20%Very successful 86 4%No response 60 3%
* Numbers and percentages are based on the total number of principals who completed the questionnaire.† Percentages may not add up to 100, due to rounding. Note: N/D “No data available” is used to indicate that there were no principals in that group.
Provincial Results
Assessments of Reading, Writing and Mathematics, Primary Division (Grades 1–3) and Junior Division (Grades 4–6), 2016–2017
Principal Questionnaire
Results as of August 14, 2017 25 of 40
Use of EQAO Resources
Province*
Number of Respondents 2 121
# %†
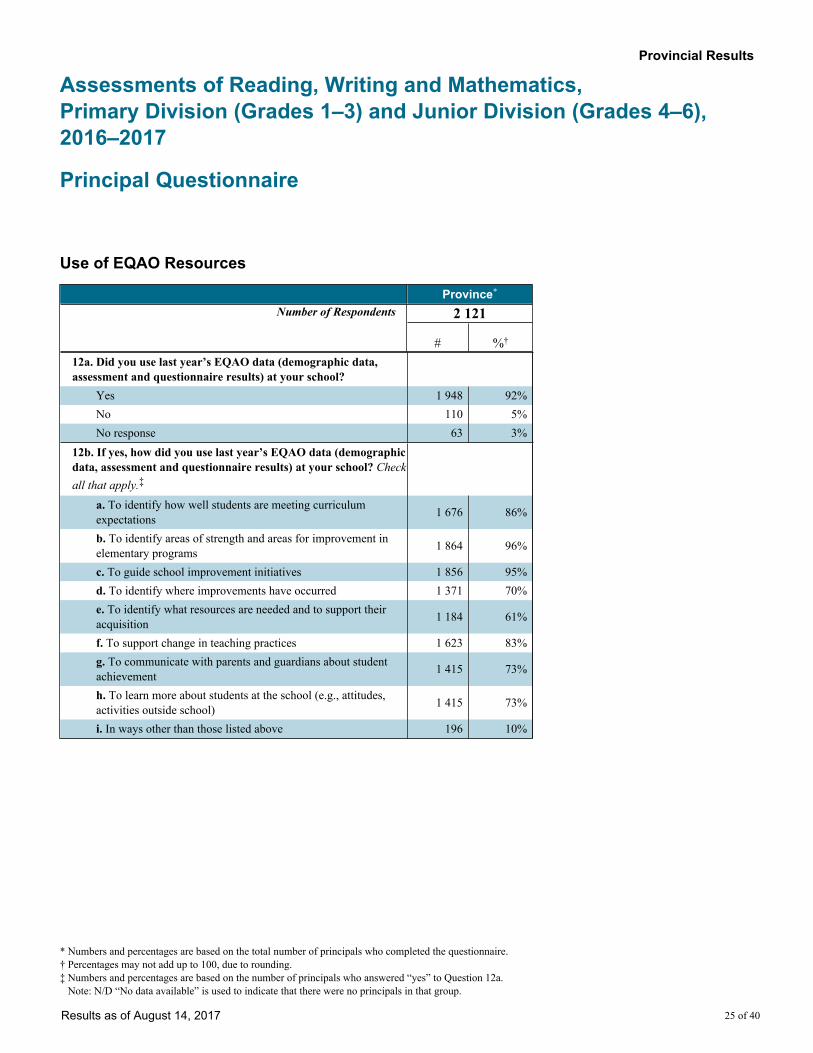
12a. Did you use last year’s EQAO data (demographic data, assessment and questionnaire results) at your school?
Yes 1 948 92%No 110 5%No response 63 3%
12b. If yes, how did you use last year’s EQAO data (demographic data, assessment and questionnaire results) at your school? Check all that apply.‡
a. To identify how well students are meeting curriculum expectations 1 676 86%
b. To identify areas of strength and areas for improvement in elementary programs 1 864 96%
c. To guide school improvement initiatives 1 856 95%d. To identify where improvements have occurred 1 371 70%e. To identify what resources are needed and to support their acquisition 1 184 61%
f. To support change in teaching practices 1 623 83%g. To communicate with parents and guardians about student achievement 1 415 73%
h. To learn more about students at the school (e.g., attitudes, activities outside school) 1 415 73%
i. In ways other than those listed above 196 10%
* Numbers and percentages are based on the total number of principals who completed the questionnaire.† Percentages may not add up to 100, due to rounding.‡ Numbers and percentages are based on the number of principals who answered “yes” to Question 12a. Note: N/D “No data available” is used to indicate that there were no principals in that group.
Provincial Results
Assessments of Reading, Writing and Mathematics, Primary Division (Grades 1–3) and Junior Division (Grades 4–6), 2016–2017
Principal Questionnaire
Results as of August 14, 2017 26 of 40
Use of EQAO Resources
Province*
Number of Respondents 2 121
# %†
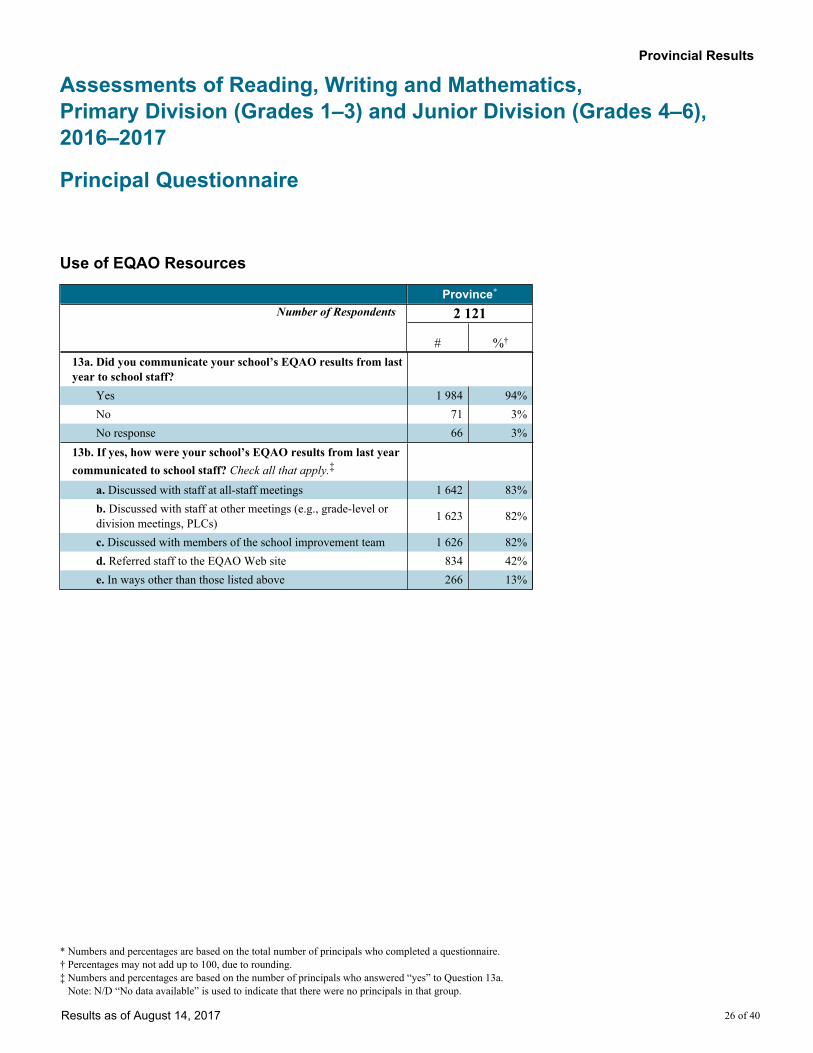
13a. Did you communicate your school’s EQAO results from last year to school staff?
Yes 1 984 94%No 71 3%No response 66 3%
13b. If yes, how were your school’s EQAO results from last year communicated to school staff? Check all that apply.‡
a. Discussed with staff at all-staff meetings 1 642 83%b. Discussed with staff at other meetings (e.g., grade-level or division meetings, PLCs) 1 623 82%
c. Discussed with members of the school improvement team 1 626 82%d. Referred staff to the EQAO Web site 834 42%e. In ways other than those listed above 266 13%
* Numbers and percentages are based on the total number of principals who completed a questionnaire.† Percentages may not add up to 100, due to rounding.‡ Numbers and percentages are based on the number of principals who answered “yes” to Question 13a. Note: N/D “No data available” is used to indicate that there were no principals in that group.
Provincial Results
Assessments of Reading, Writing and Mathematics, Primary Division (Grades 1–3) and Junior Division (Grades 4–6), 2016–2017
Principal Questionnaire
Results as of August 14, 2017 27 of 40
Use of EQAO Resources
Province*
Number of Respondents 2 121
# %†
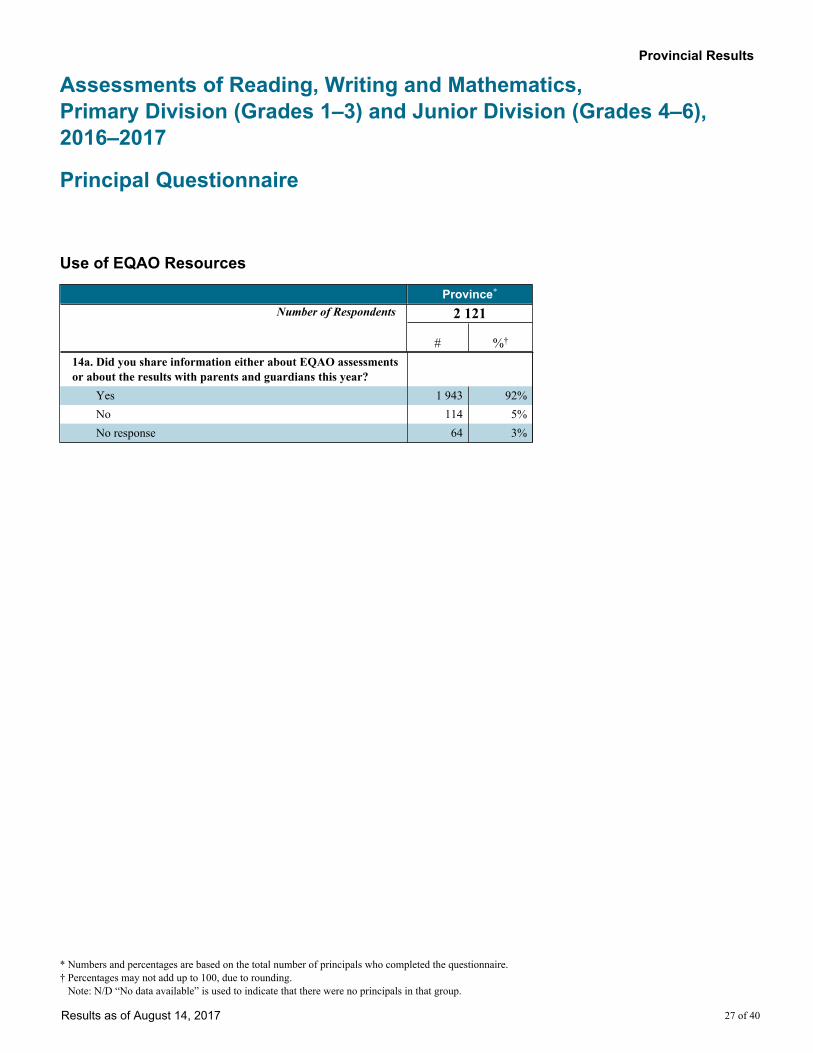
14a. Did you share information either about EQAO assessments or about the results with parents and guardians this year?
Yes 1 943 92%No 114 5%No response 64 3%
* Numbers and percentages are based on the total number of principals who completed the questionnaire.† Percentages may not add up to 100, due to rounding. Note: N/D “No data available” is used to indicate that there were no principals in that group.
Provincial Results
Assessments of Reading, Writing and Mathematics, Primary Division (Grades 1–3) and Junior Division (Grades 4–6), 2016–2017
Principal Questionnaire
Results as of August 14, 2017 28 of 40
Use of EQAO Resources
Province*
Number of Respondents 1 943
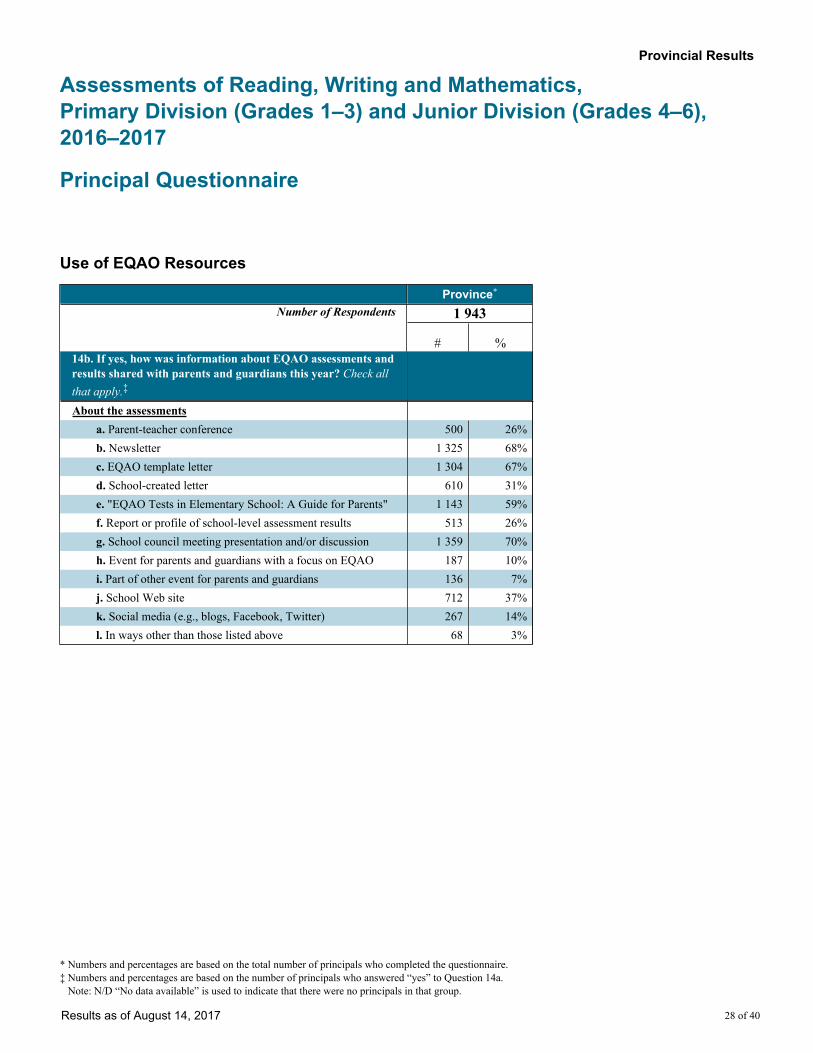
# %14b. If yes, how was information about EQAO assessments and results shared with parents and guardians this year? Check all that apply.‡
About the assessmentsa. Parent-teacher conference 500 26%b. Newsletter 1 325 68%c. EQAO template letter 1 304 67%d. School-created letter 610 31%e. "EQAO Tests in Elementary School: A Guide for Parents" 1 143 59%f. Report or profile of school-level assessment results 513 26%g. School council meeting presentation and/or discussion 1 359 70%h. Event for parents and guardians with a focus on EQAO 187 10%i. Part of other event for parents and guardians 136 7%j. School Web site 712 37%k. Social media (e.g., blogs, Facebook, Twitter) 267 14%l. In ways other than those listed above 68 3%
* Numbers and percentages are based on the total number of principals who completed the questionnaire.‡ Numbers and percentages are based on the number of principals who answered “yes” to Question 14a. Note: N/D “No data available” is used to indicate that there were no principals in that group.
Provincial Results
Assessments of Reading, Writing and Mathematics, Primary Division (Grades 1–3) and Junior Division (Grades 4–6), 2016–2017
Principal Questionnaire
Results as of August 14, 2017 29 of 40
Use of EQAO Resources
Province*
Number of Respondents 1 943
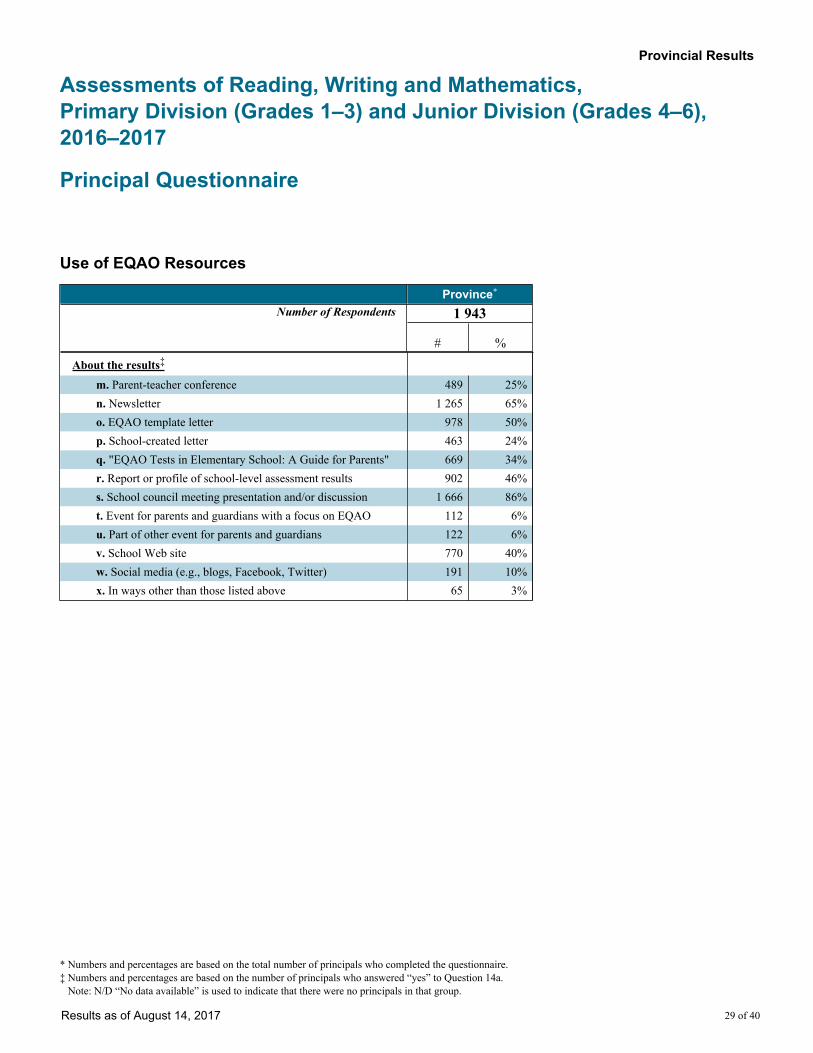
# %About the results‡
m. Parent-teacher conference 489 25%n. Newsletter 1 265 65%o. EQAO template letter 978 50%p. School-created letter 463 24%q. "EQAO Tests in Elementary School: A Guide for Parents" 669 34%r. Report or profile of school-level assessment results 902 46%s. School council meeting presentation and/or discussion 1 666 86%t. Event for parents and guardians with a focus on EQAO 112 6%u. Part of other event for parents and guardians 122 6%v. School Web site 770 40%w. Social media (e.g., blogs, Facebook, Twitter) 191 10%x. In ways other than those listed above 65 3%
* Numbers and percentages are based on the total number of principals who completed the questionnaire.‡ Numbers and percentages are based on the number of principals who answered “yes” to Question 14a. Note: N/D “No data available” is used to indicate that there were no principals in that group.
Provincial Results
Assessments of Reading, Writing and Mathematics, Primary Division (Grades 1–3) and Junior Division (Grades 4–6), 2016–2017
Principal Questionnaire
Results as of August 14, 2017 30 of 40
Use of EQAO Resources
Province*
Number of Respondents 2 121
# %†
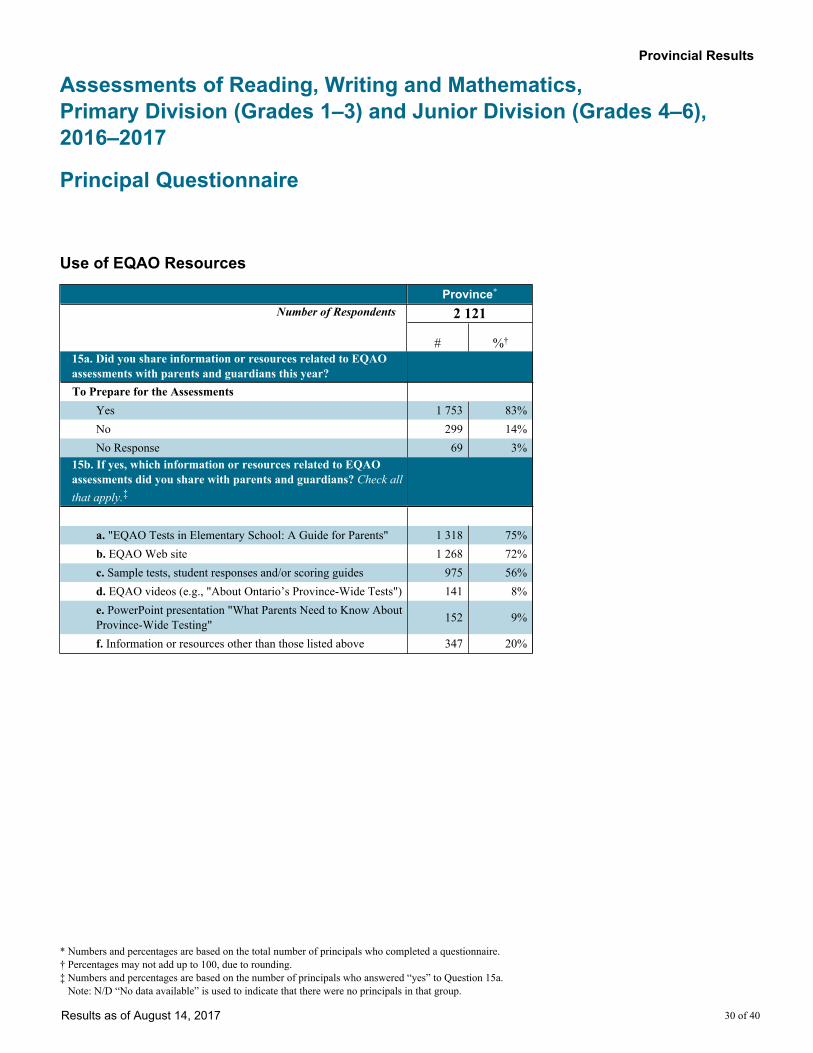
15a. Did you share information or resources related to EQAO assessments with parents and guardians this year?To Prepare for the Assessments
Yes 1 753 83%No 299 14%No Response 69 3%
15b. If yes, which information or resources related to EQAO assessments did you share with parents and guardians? Check all that apply.‡
a. "EQAO Tests in Elementary School: A Guide for Parents" 1 318 75%b. EQAO Web site 1 268 72%c. Sample tests, student responses and/or scoring guides 975 56%d. EQAO videos (e.g., "About Ontario’s Province-Wide Tests") 141 8%e. PowerPoint presentation "What Parents Need to Know About Province-Wide Testing" 152 9%
f. Information or resources other than those listed above 347 20%
* Numbers and percentages are based on the total number of principals who completed a questionnaire.† Percentages may not add up to 100, due to rounding.‡ Numbers and percentages are based on the number of principals who answered “yes” to Question 15a. Note: N/D “No data available” is used to indicate that there were no principals in that group.
Provincial Results
Assessments of Reading, Writing and Mathematics, Primary Division (Grades 1–3) and Junior Division (Grades 4–6), 2016–2017
Principal Questionnaire
Results as of August 14, 2017 31 of 40
Use of EQAO Resources
Province*
Number of Respondents 2 121
# %†
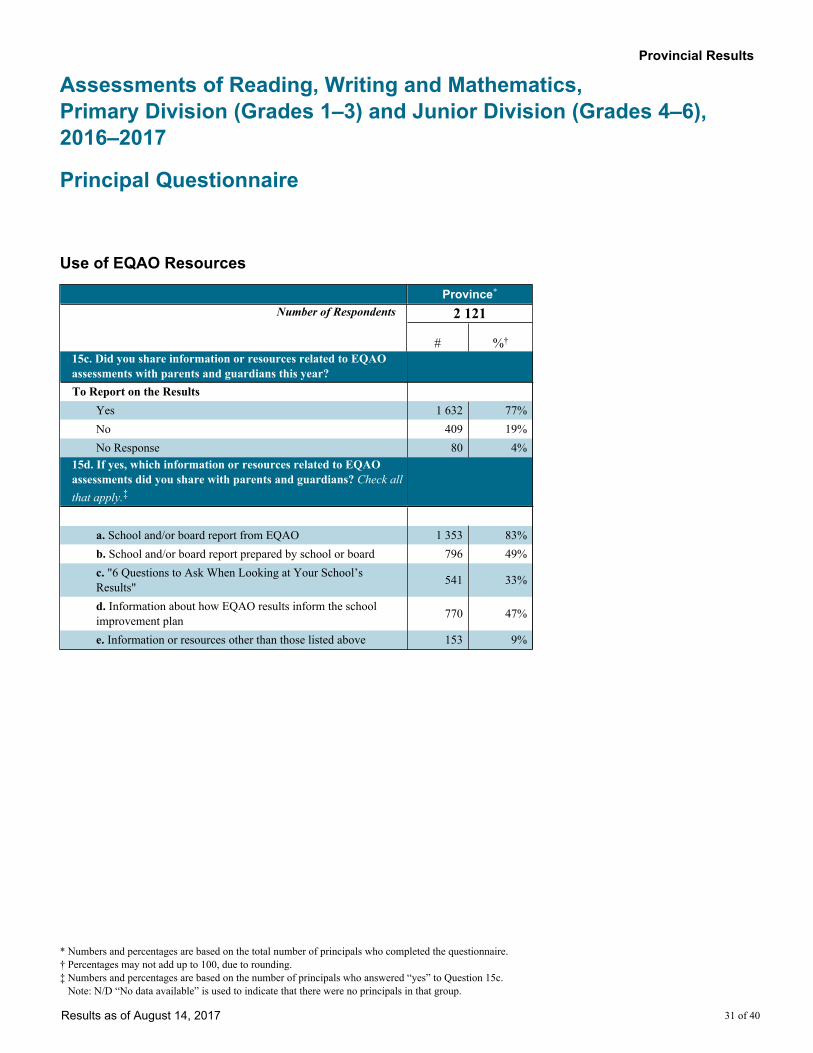
15c. Did you share information or resources related to EQAO assessments with parents and guardians this year?To Report on the Results
Yes 1 632 77%No 409 19%No Response 80 4%
15d. If yes, which information or resources related to EQAO assessments did you share with parents and guardians? Check all that apply.‡
a. School and/or board report from EQAO 1 353 83%b. School and/or board report prepared by school or board 796 49%c. "6 Questions to Ask When Looking at Your School’s Results" 541 33%
d. Information about how EQAO results inform the school improvement plan 770 47%
e. Information or resources other than those listed above 153 9%
* Numbers and percentages are based on the total number of principals who completed the questionnaire.† Percentages may not add up to 100, due to rounding.‡ Numbers and percentages are based on the number of principals who answered “yes” to Question 15c. Note: N/D “No data available” is used to indicate that there were no principals in that group.
Provincial Results
Assessments of Reading, Writing and Mathematics, Primary Division (Grades 1–3) and Junior Division (Grades 4–6), 2016–2017
Principal Questionnaire
Results as of August 14, 2017 32 of 40
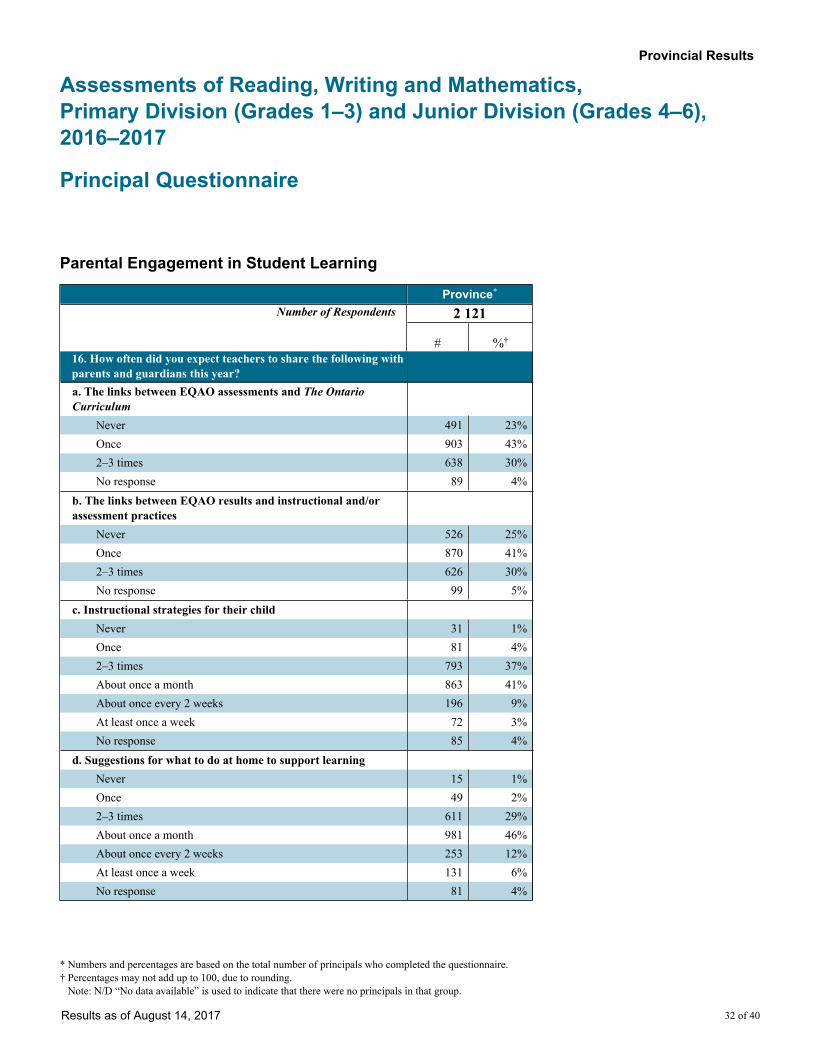
Parental Engagement in Student Learning
Province*
Number of Respondents 2 121
# %†
16. How often did you expect teachers to share the following with parents and guardians this year? a. The links between EQAO assessments and The Ontario Curriculum
Never 491 23%Once 903 43%2–3 times 638 30%No response 89 4%
b. The links between EQAO results and instructional and/or assessment practices
Never 526 25%Once 870 41%2–3 times 626 30%No response 99 5%
c. Instructional strategies for their child Never 31 1%Once 81 4%2–3 times 793 37%About once a month 863 41%About once every 2 weeks 196 9%At least once a week 72 3%No response 85 4%
d. Suggestions for what to do at home to support learning Never 15 1%Once 49 2%2–3 times 611 29%About once a month 981 46%About once every 2 weeks 253 12%At least once a week 131 6%No response 81 4%
* Numbers and percentages are based on the total number of principals who completed the questionnaire.† Percentages may not add up to 100, due to rounding. Note: N/D “No data available” is used to indicate that there were no principals in that group.
Provincial Results
Assessments of Reading, Writing and Mathematics, Primary Division (Grades 1–3) and Junior Division (Grades 4–6), 2016–2017
Principal Questionnaire
Results as of August 14, 2017 33 of 40
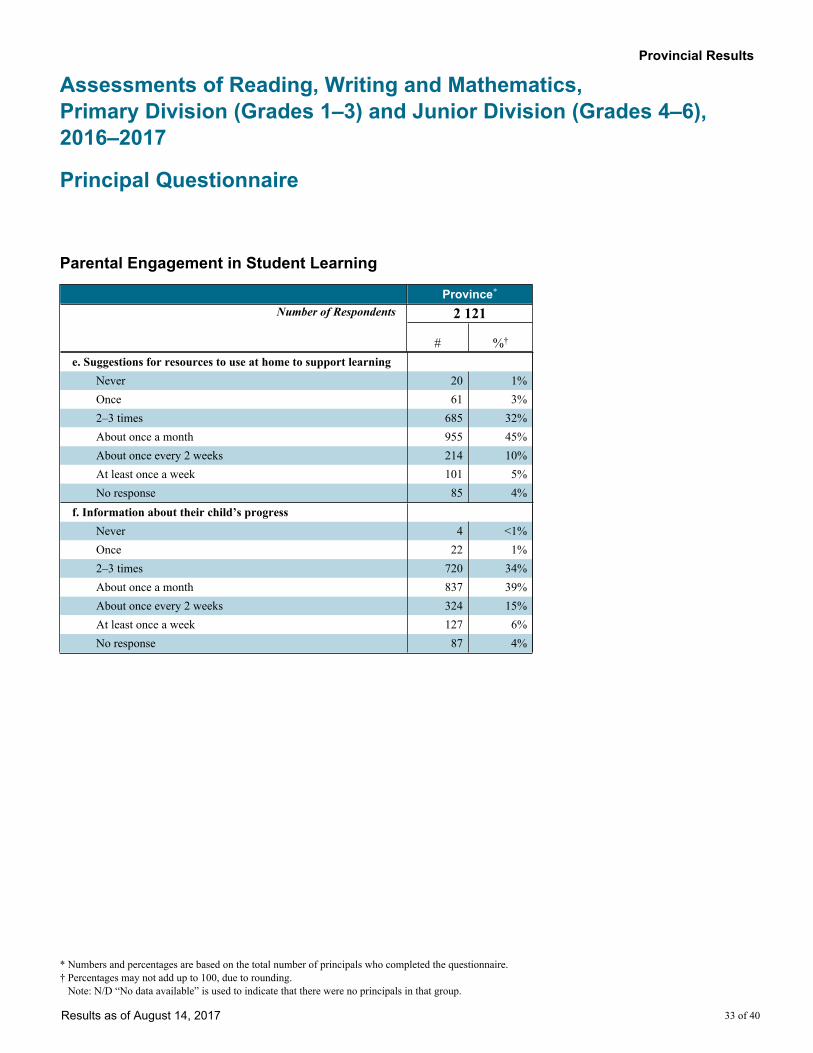
Parental Engagement in Student Learning
Province*
Number of Respondents 2 121
# %†
e. Suggestions for resources to use at home to support learningNever 20 1%Once 61 3%2–3 times 685 32%About once a month 955 45%About once every 2 weeks 214 10%At least once a week 101 5%No response 85 4%
f. Information about their child’s progressNever 4 <1%Once 22 1%2–3 times 720 34%About once a month 837 39%About once every 2 weeks 324 15%At least once a week 127 6%No response 87 4%
* Numbers and percentages are based on the total number of principals who completed the questionnaire.† Percentages may not add up to 100, due to rounding. Note: N/D “No data available” is used to indicate that there were no principals in that group.
Provincial Results
Assessments of Reading, Writing and Mathematics, Primary Division (Grades 1–3) and Junior Division (Grades 4–6), 2016–2017
Principal Questionnaire
Results as of August 14, 2017 34 of 40
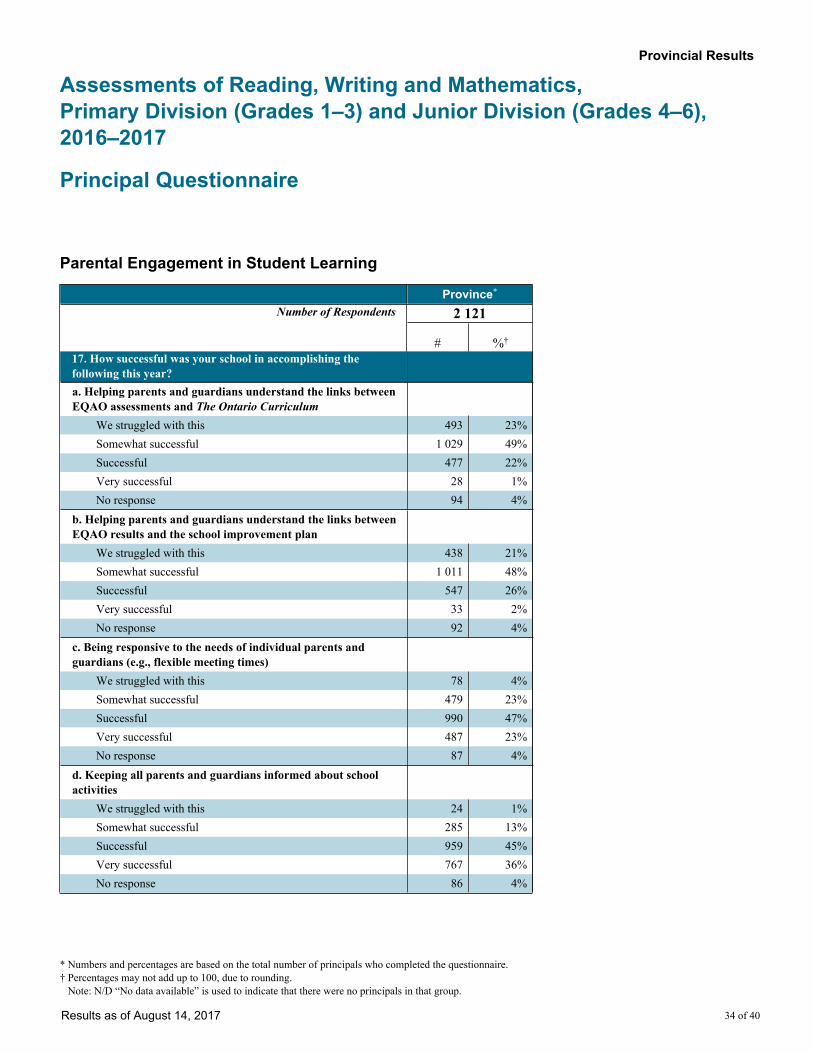
Parental Engagement in Student Learning
Province*
Number of Respondents 2 121
# %†
17. How successful was your school in accomplishing the following this year?a. Helping parents and guardians understand the links between EQAO assessments and The Ontario Curriculum
We struggled with this 493 23%Somewhat successful 1 029 49%Successful 477 22%Very successful 28 1%No response 94 4%
b. Helping parents and guardians understand the links between EQAO results and the school improvement plan
We struggled with this 438 21%Somewhat successful 1 011 48%Successful 547 26%Very successful 33 2%No response 92 4%
c. Being responsive to the needs of individual parents and guardians (e.g., flexible meeting times)
We struggled with this 78 4%Somewhat successful 479 23%Successful 990 47%Very successful 487 23%No response 87 4%
d. Keeping all parents and guardians informed about school activities
We struggled with this 24 1%Somewhat successful 285 13%Successful 959 45%Very successful 767 36%No response 86 4%
* Numbers and percentages are based on the total number of principals who completed the questionnaire.† Percentages may not add up to 100, due to rounding. Note: N/D “No data available” is used to indicate that there were no principals in that group.
Provincial Results
Assessments of Reading, Writing and Mathematics, Primary Division (Grades 1–3) and Junior Division (Grades 4–6), 2016–2017
Principal Questionnaire
Results as of August 14, 2017 35 of 40
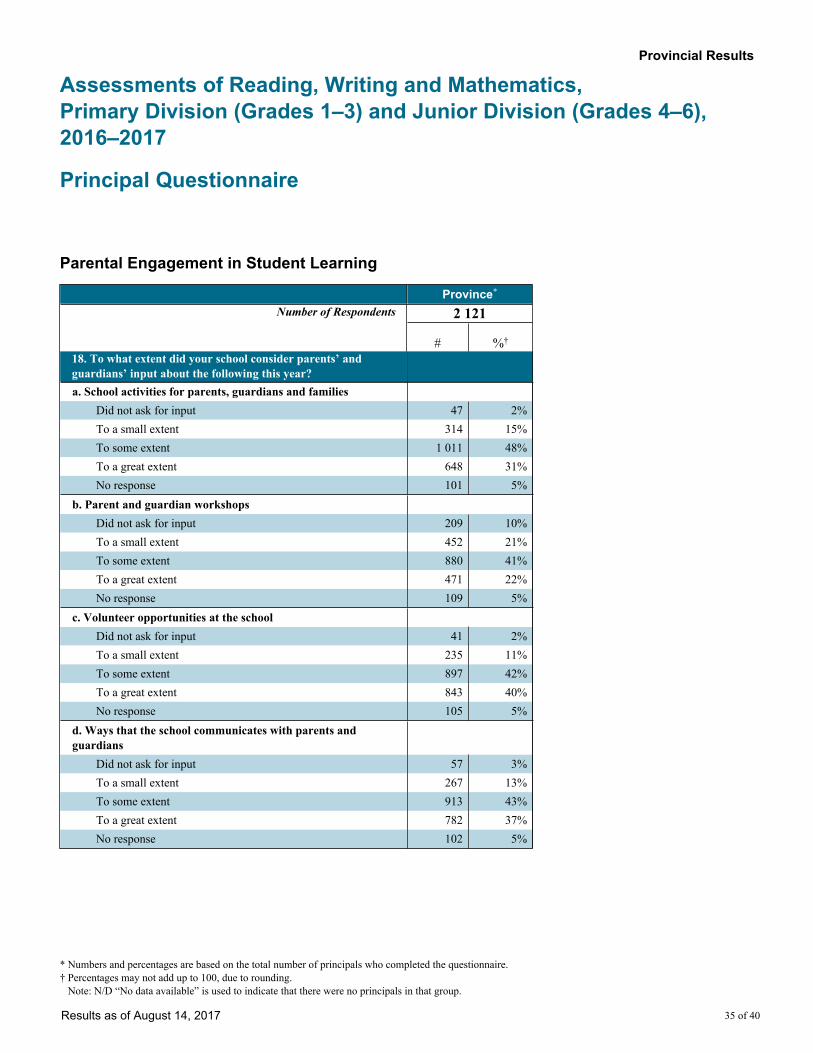
Parental Engagement in Student Learning
Province*
Number of Respondents 2 121
# %†
18. To what extent did your school consider parents’ and guardians’ input about the following this year?a. School activities for parents, guardians and families
Did not ask for input 47 2%To a small extent 314 15%To some extent 1 011 48%To a great extent 648 31%No response 101 5%
b. Parent and guardian workshopsDid not ask for input 209 10%To a small extent 452 21%To some extent 880 41%To a great extent 471 22%No response 109 5%
c. Volunteer opportunities at the schoolDid not ask for input 41 2%To a small extent 235 11%To some extent 897 42%To a great extent 843 40%No response 105 5%
d. Ways that the school communicates with parents and guardians
Did not ask for input 57 3%To a small extent 267 13%To some extent 913 43%To a great extent 782 37%No response 102 5%
* Numbers and percentages are based on the total number of principals who completed the questionnaire.† Percentages may not add up to 100, due to rounding. Note: N/D “No data available” is used to indicate that there were no principals in that group.
Provincial Results
Assessments of Reading, Writing and Mathematics, Primary Division (Grades 1–3) and Junior Division (Grades 4–6), 2016–2017
Principal Questionnaire
Results as of August 14, 2017 36 of 40
Parental Engagement in Student Learning
Province*
Number of Respondents 2 121
# %†
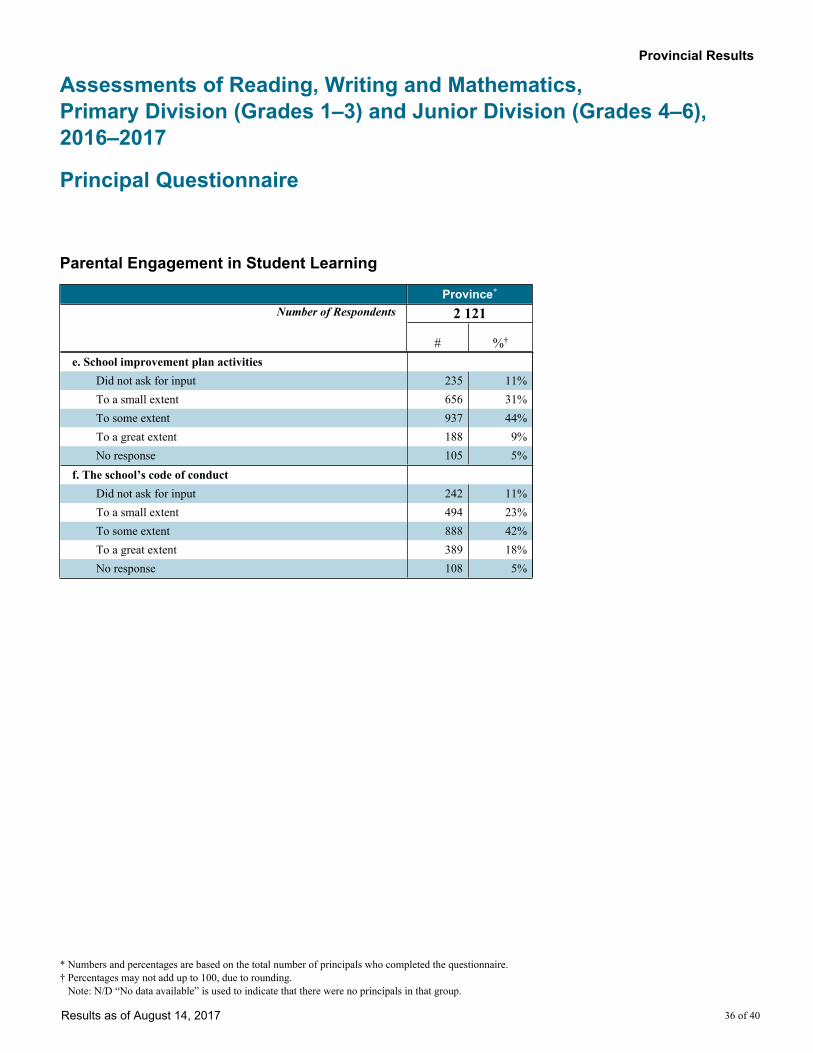
e. School improvement plan activitiesDid not ask for input 235 11%To a small extent 656 31%To some extent 937 44%To a great extent 188 9%No response 105 5%
f. The school’s code of conductDid not ask for input 242 11%To a small extent 494 23%To some extent 888 42%To a great extent 389 18%No response 108 5%
* Numbers and percentages are based on the total number of principals who completed the questionnaire.† Percentages may not add up to 100, due to rounding. Note: N/D “No data available” is used to indicate that there were no principals in that group.
Provincial Results
Assessments of Reading, Writing and Mathematics, Primary Division (Grades 1–3) and Junior Division (Grades 4–6), 2016–2017
Principal Questionnaire
Results as of August 14, 2017 37 of 40
Parental Engagement in Student Learning
Province*
Number of Respondents 2 121
# %†
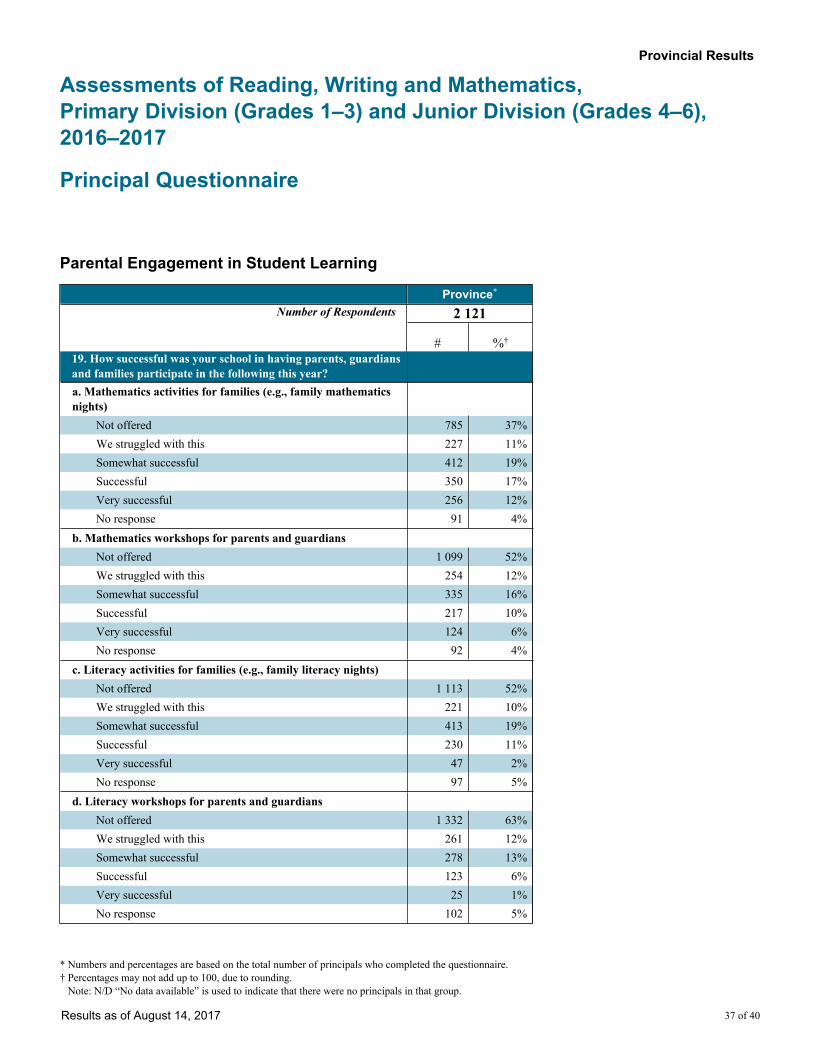
19. How successful was your school in having parents, guardians and families participate in the following this year?a. Mathematics activities for families (e.g., family mathematics nights)
Not offered 785 37%We struggled with this 227 11%Somewhat successful 412 19%Successful 350 17%Very successful 256 12%No response 91 4%
b. Mathematics workshops for parents and guardiansNot offered 1 099 52%We struggled with this 254 12%Somewhat successful 335 16%Successful 217 10%Very successful 124 6%No response 92 4%
c. Literacy activities for families (e.g., family literacy nights)Not offered 1 113 52%We struggled with this 221 10%Somewhat successful 413 19%Successful 230 11%Very successful 47 2%No response 97 5%
d. Literacy workshops for parents and guardiansNot offered 1 332 63%We struggled with this 261 12%Somewhat successful 278 13%Successful 123 6%Very successful 25 1%No response 102 5%
* Numbers and percentages are based on the total number of principals who completed the questionnaire.† Percentages may not add up to 100, due to rounding. Note: N/D “No data available” is used to indicate that there were no principals in that group.
Provincial Results
Assessments of Reading, Writing and Mathematics, Primary Division (Grades 1–3) and Junior Division (Grades 4–6), 2016–2017
Principal Questionnaire
Results as of August 14, 2017 38 of 40
Parental Engagement in Student Learning
Province*
Number of Respondents 2 121
# %†
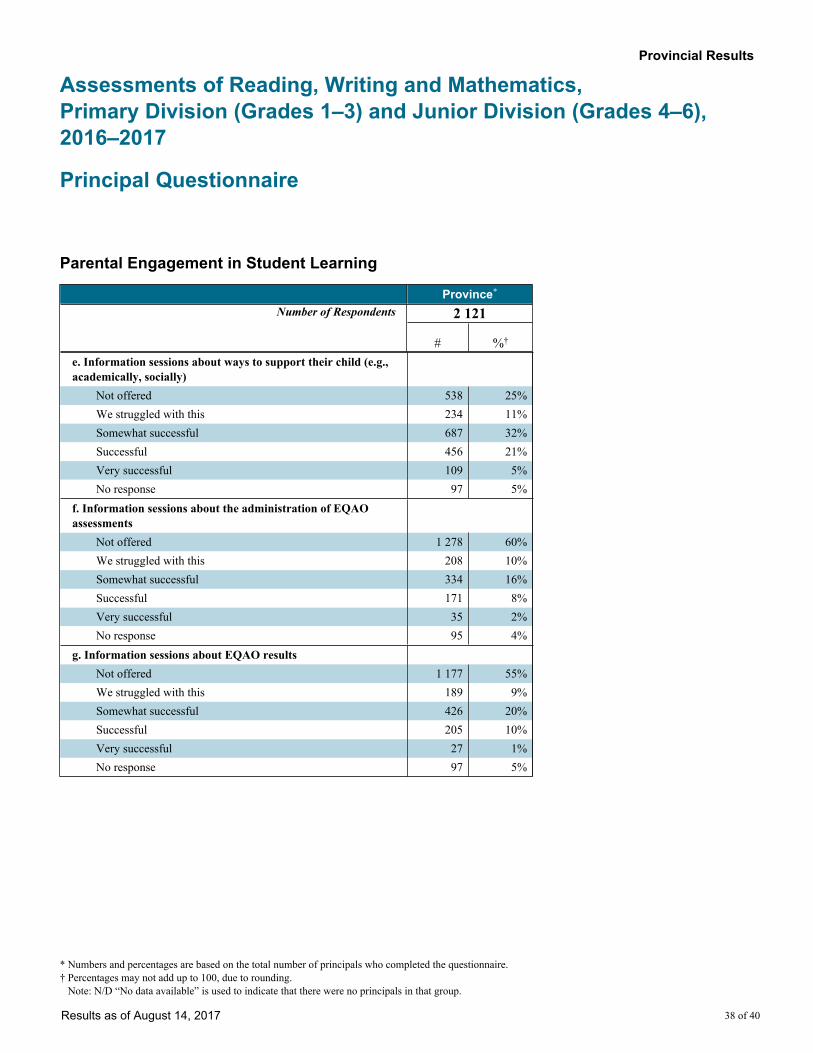
e. Information sessions about ways to support their child (e.g., academically, socially)
Not offered 538 25%We struggled with this 234 11%Somewhat successful 687 32%Successful 456 21%Very successful 109 5%No response 97 5%
f. Information sessions about the administration of EQAO assessments
Not offered 1 278 60%We struggled with this 208 10%Somewhat successful 334 16%Successful 171 8%Very successful 35 2%No response 95 4%
g. Information sessions about EQAO resultsNot offered 1 177 55%We struggled with this 189 9%Somewhat successful 426 20%Successful 205 10%Very successful 27 1%No response 97 5%
* Numbers and percentages are based on the total number of principals who completed the questionnaire.† Percentages may not add up to 100, due to rounding. Note: N/D “No data available” is used to indicate that there were no principals in that group.
Provincial Results
Assessments of Reading, Writing and Mathematics, Primary Division (Grades 1–3) and Junior Division (Grades 4–6), 2016–2017
Principal Questionnaire
Results as of August 14, 2017 39 of 40
Parental Engagement in Student Learning
Province*
Number of Respondents 2 121
# %†
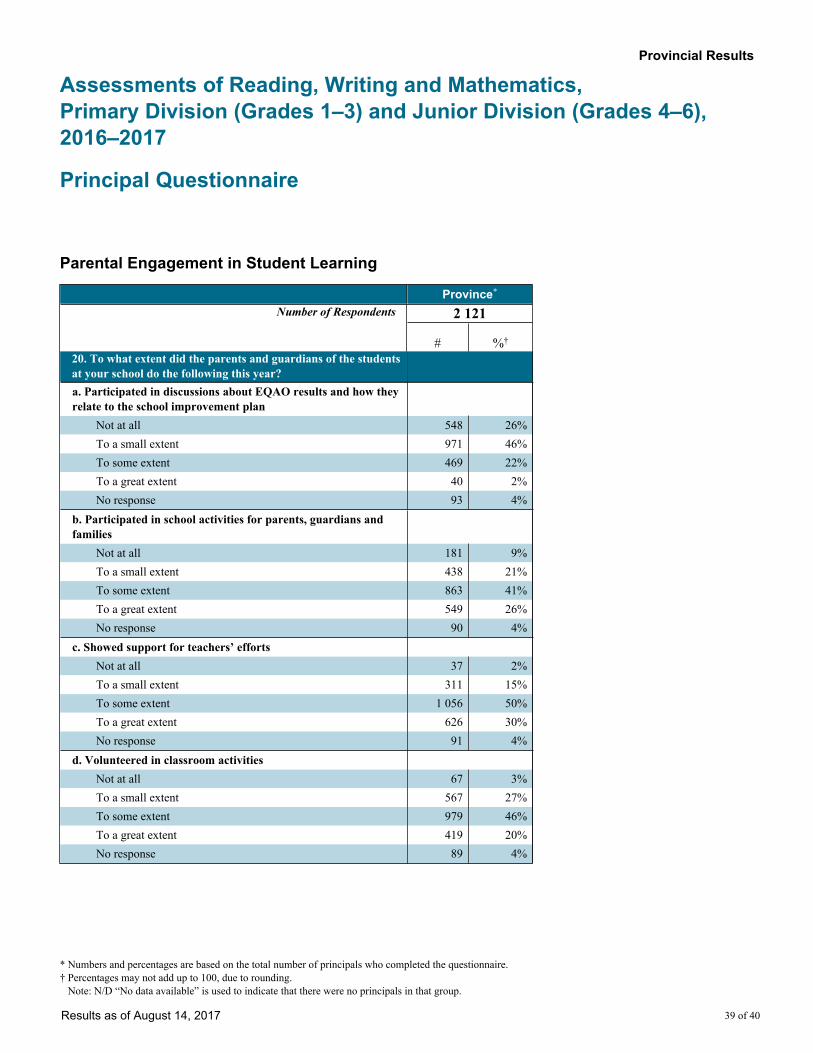
20. To what extent did the parents and guardians of the students at your school do the following this year?a. Participated in discussions about EQAO results and how they relate to the school improvement plan
Not at all 548 26%To a small extent 971 46%To some extent 469 22%To a great extent 40 2%No response 93 4%
b. Participated in school activities for parents, guardians and families
Not at all 181 9%To a small extent 438 21%To some extent 863 41%To a great extent 549 26%No response 90 4%
c. Showed support for teachers’ effortsNot at all 37 2%To a small extent 311 15%To some extent 1 056 50%To a great extent 626 30%No response 91 4%
d. Volunteered in classroom activitiesNot at all 67 3%To a small extent 567 27%To some extent 979 46%To a great extent 419 20%No response 89 4%
* Numbers and percentages are based on the total number of principals who completed the questionnaire.† Percentages may not add up to 100, due to rounding. Note: N/D “No data available” is used to indicate that there were no principals in that group.
Provincial Results
Assessments of Reading, Writing and Mathematics, Primary Division (Grades 1–3) and Junior Division (Grades 4–6), 2016–2017
Principal Questionnaire
Results as of August 14, 2017 40 of 40
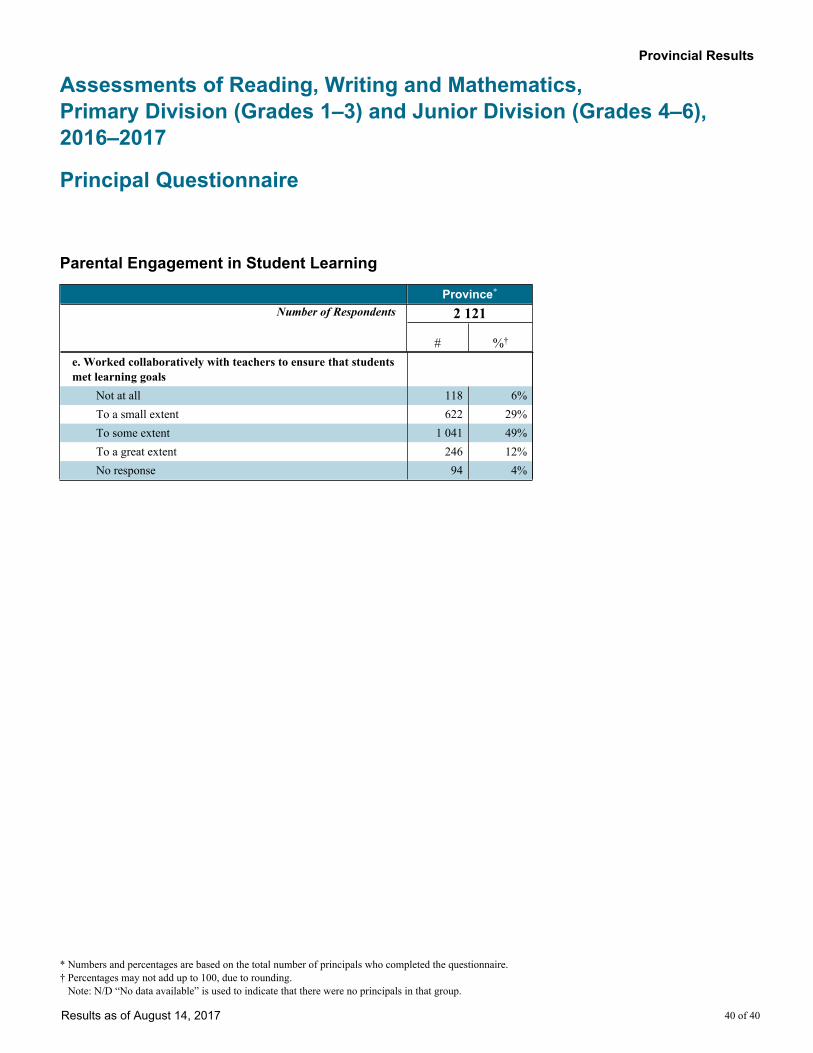
Parental Engagement in Student Learning
Province*
Number of Respondents 2 121
# %†
e. Worked collaboratively with teachers to ensure that students met learning goals
Not at all 118 6%To a small extent 622 29%To some extent 1 041 49%To a great extent 246 12%No response 94 4%
* Numbers and percentages are based on the total number of principals who completed the questionnaire.† Percentages may not add up to 100, due to rounding. Note: N/D “No data available” is used to indicate that there were no principals in that group.