Embed Size (px)
Citation preview
Graduate Medical Education:
Will Supply Meet Demand?
Paul H. Rockey, MD, MPH
WWAMI GME Summit
Spokane, Washington
March 23, 2012
WWAMI GME Summit
Spokane , Washington

“If you don’t know where you are,
you don’t know who you are”
Washington
okane , Washington
• Quote from Wendell Berry, who settled to
write on the bank of the Kentucky River,
where he grew up and where his family
lived for many generations.
• Wallace Stegner wrote in The Sense of
Place: “a place is not a place until people
have been born in it, have grown up in it,
lived in it, known it, died in it – have both
experienced and shaped it…”
2

My Idaho Connection

• “America changes fastest west of the 100th
meridian. Mining booms, oil booms,
irrigation booms, tourist booms, culture
booms as at Aspen and Sun Valley, crowd
out older populations and bring in new
ones.”
• “Many western towns never lasted a single
human lifetime. Many others have
changed so fast that memory cannot cling
to them; they are unrecognizable to
anyone who knew them twenty years ago.”
Wallace Stegner 4


9
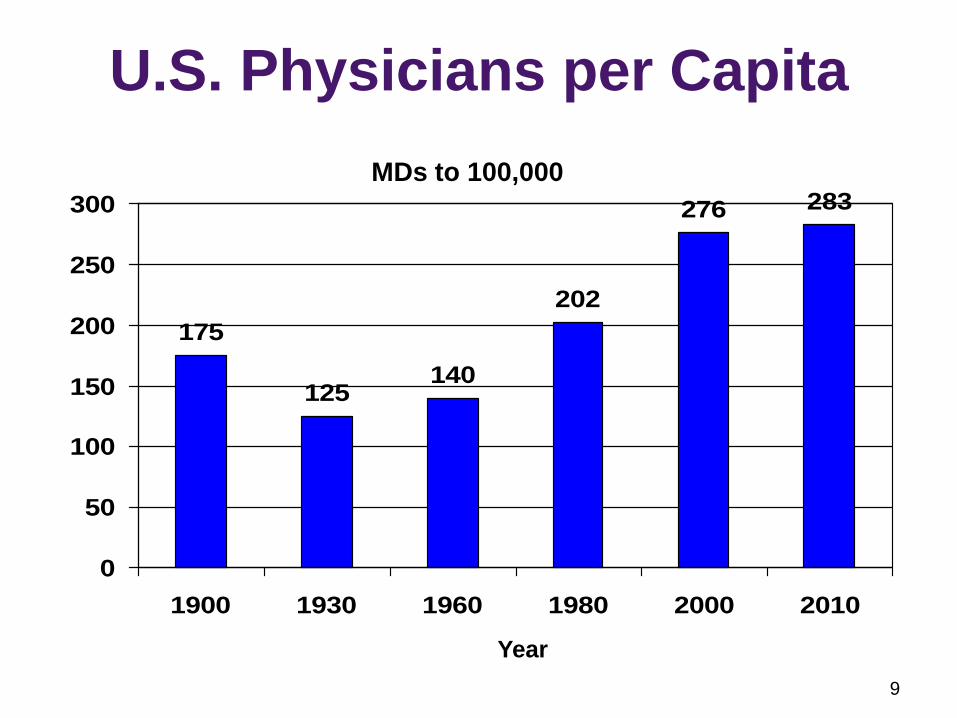
U.S. Physicians per Capita
175
125140
202
276 283
0
50
100
150
200
250
300
1900 1930 1960 1980 2000 2010
MDs to 100,000
Year
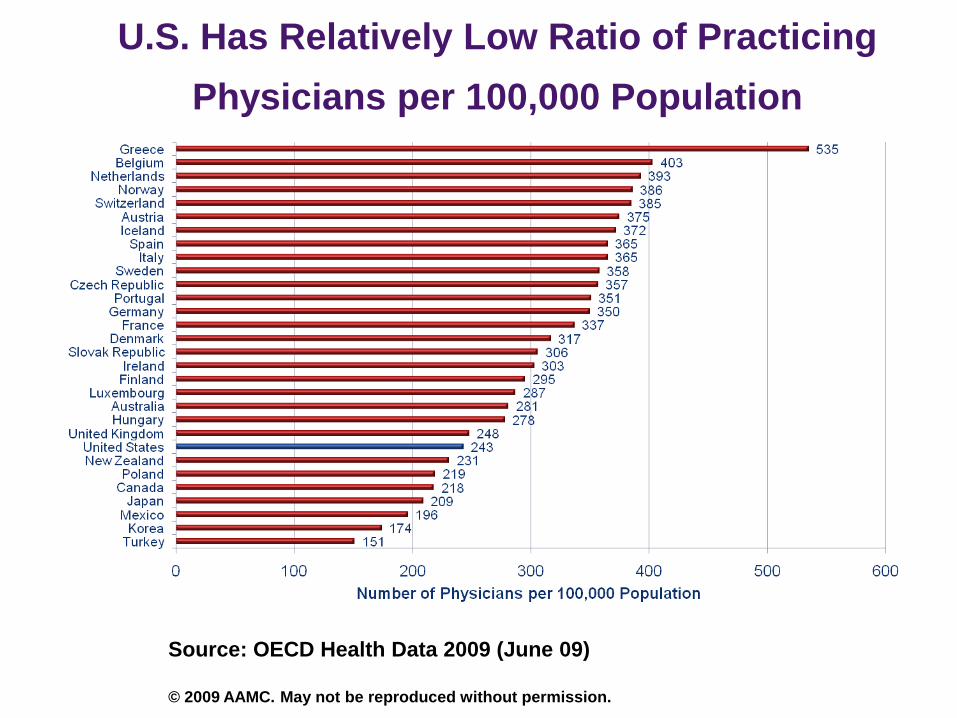
U.S. Has Relatively Low Ratio of Practicing
Physicians per 100,000 Population
Source: OECD Health Data 2009 (June 09)
© 2009 AAMC. May not be reproduced without permission.
11
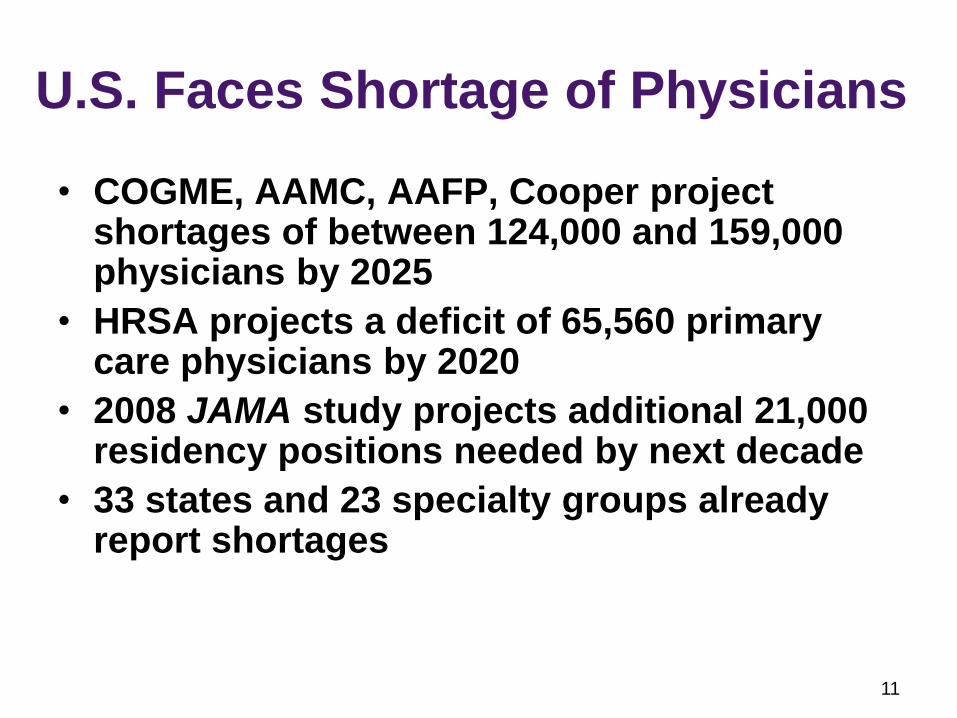
U.S. Faces Shortage of Physicians
• COGME, AAMC, AAFP, Cooper project shortages of between 124,000 and 159,000 physicians by 2025
• HRSA projects a deficit of 65,560 primary care physicians by 2020
• 2008 JAMA study projects additional 21,000 residency positions needed by next decade
• 33 states and 23 specialty groups already report shortages
12
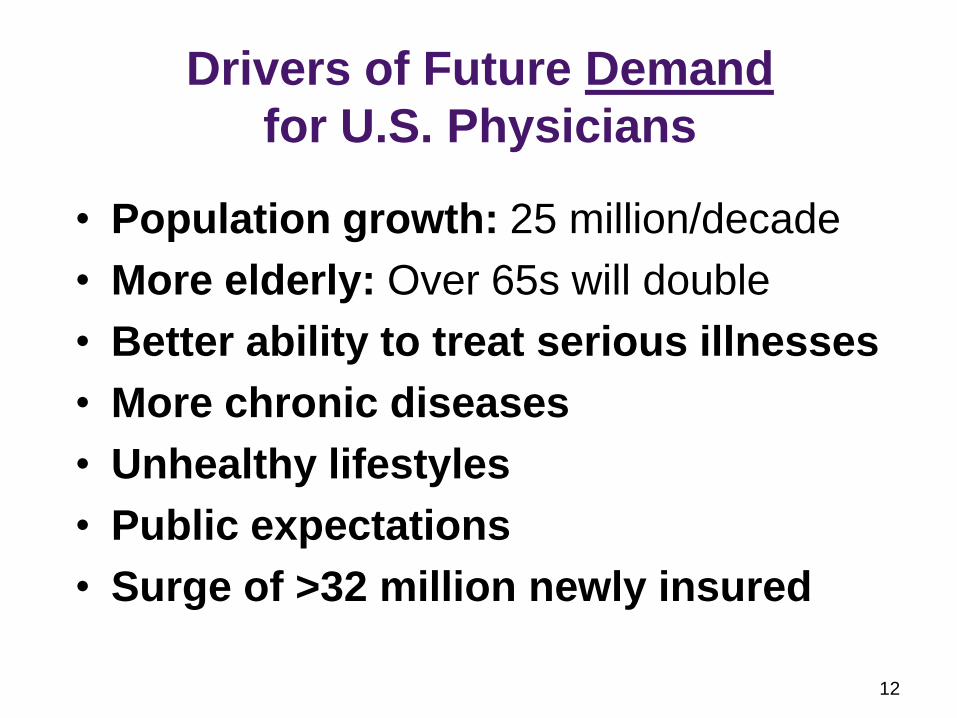
Drivers of Future Demand
for U.S. Physicians
• Population growth: 25 million/decade
• More elderly: Over 65s will double
• Better ability to treat serious illnesses
• More chronic diseases
• Unhealthy lifestyles
• Public expectations
• Surge of >32 million newly insured
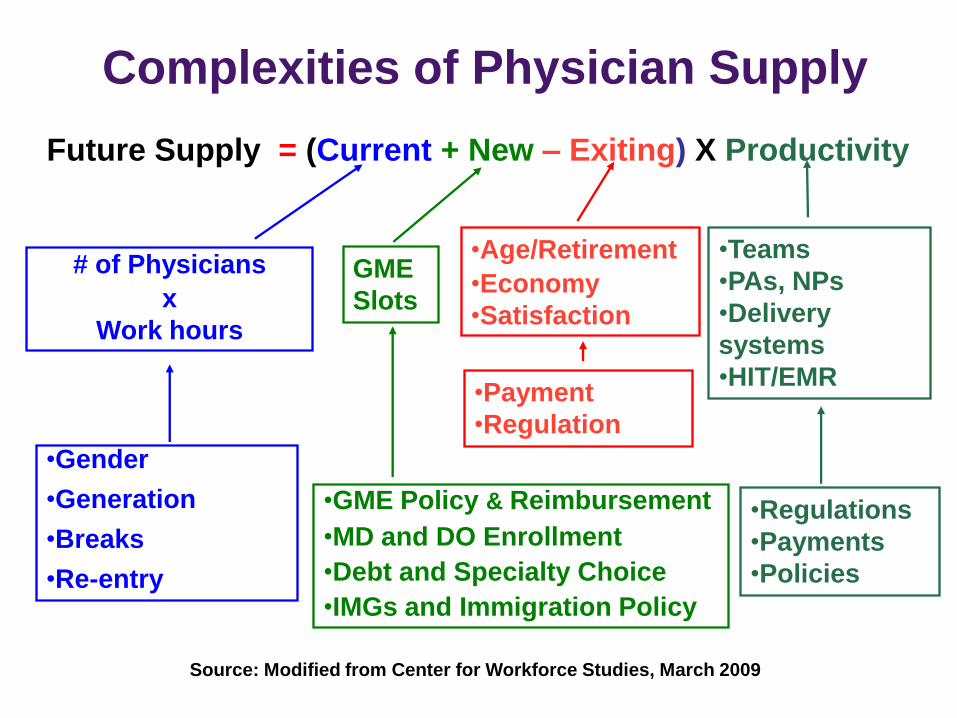
Complexities of Physician Supply
Future Supply = (Current + New – Exiting) X Productivity
# of Physicians
x
Work hours
•Gender
•Generation
•Breaks
•Re-entry
GME
Slots
•GME Policy & Reimbursement
•MD and DO Enrollment
•Debt and Specialty Choice
•IMGs and Immigration Policy
•Age/Retirement
•Economy
•Satisfaction
•Payment
•Regulation
Source: Modified from Center for Workforce Studies, March 2009
•Teams
•PAs, NPs
•Delivery
systems
•HIT/EMR
•Regulations
•Payments
•Policies
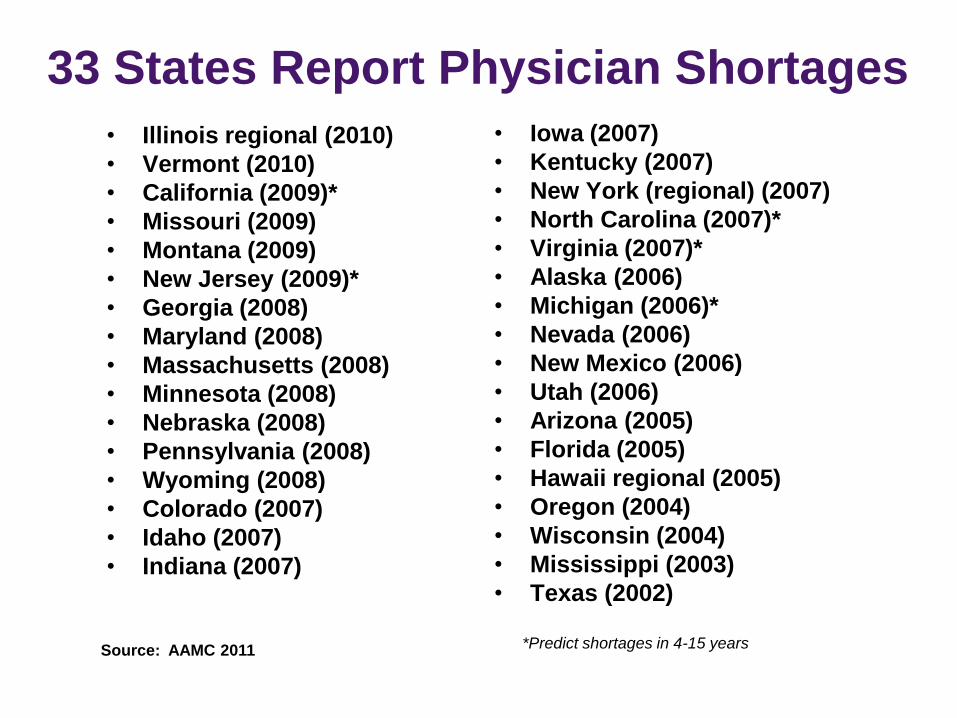
33 States Report Physician Shortages
• Illinois regional (2010)
• Vermont (2010)
• California (2009)*
• Missouri (2009)
• Montana (2009)
• New Jersey (2009)*
• Georgia (2008)
• Maryland (2008)
• Massachusetts (2008)
• Minnesota (2008)
• Nebraska (2008)
• Pennsylvania (2008)
• Wyoming (2008)
• Colorado (2007)
• Idaho (2007)
• Indiana (2007)
• Iowa (2007)
• Kentucky (2007)
• New York (regional) (2007)
• North Carolina (2007)*
• Virginia (2007)*
• Alaska (2006)
• Michigan (2006)*
• Nevada (2006)
• New Mexico (2006)
• Utah (2006)
• Arizona (2005)
• Florida (2005)
• Hawaii regional (2005)
• Oregon (2004)
• Wisconsin (2004)
• Mississippi (2003)
• Texas (2002)
*Predict shortages in 4-15 years Source: AAMC 2011

• “Plunging into the future through a
landscape that had no history, we did both
the country and ourselves some harm
along with some good.”
• “Neither the country nor the society we
built out of it can be healthy until we stop
raiding and running, and learn to be quiet
part of the time, and acquire the sense not
of ownership but of belonging.”
Wallace Stegner
16
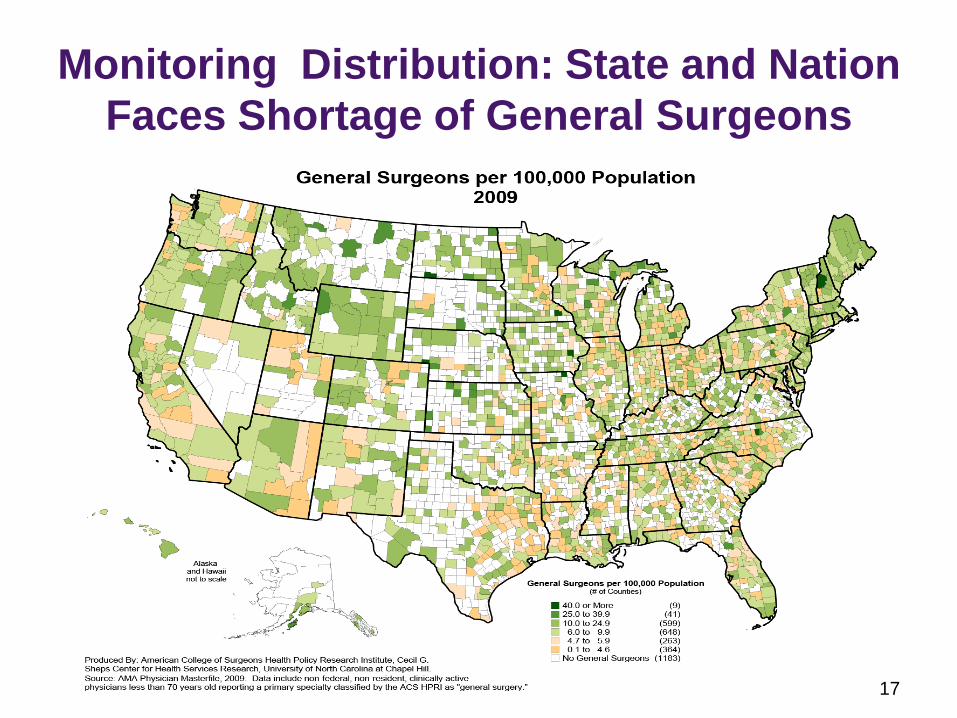
Monitoring Distribution: State and Nation
Faces Shortage of General Surgeons
17
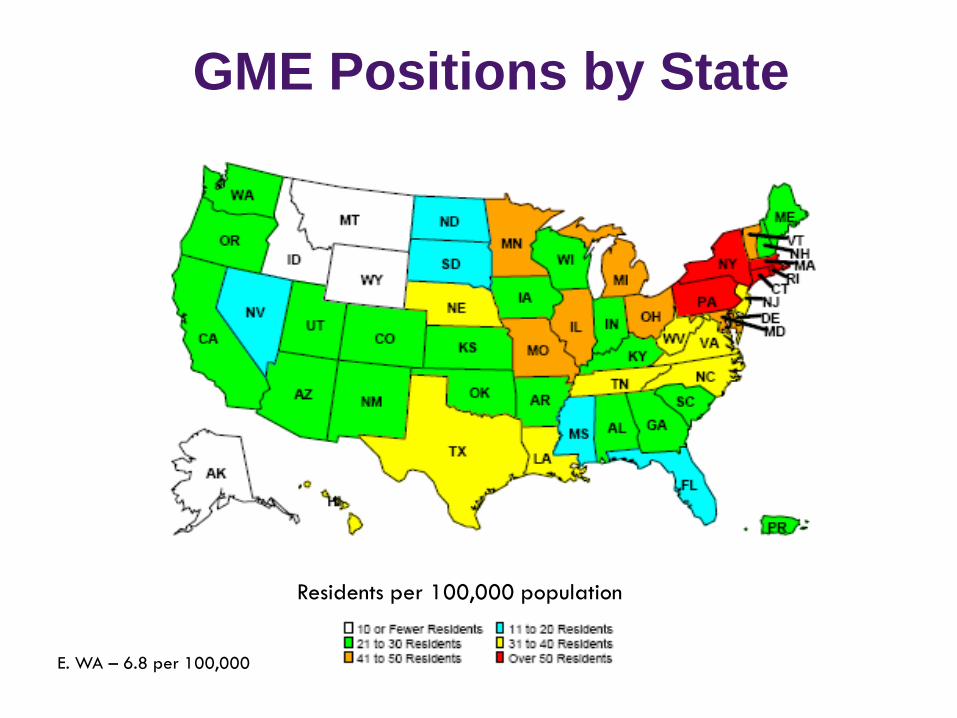
GME Positions by State
Residents per 100,000 population
E. WA – 6.8 per 100,000
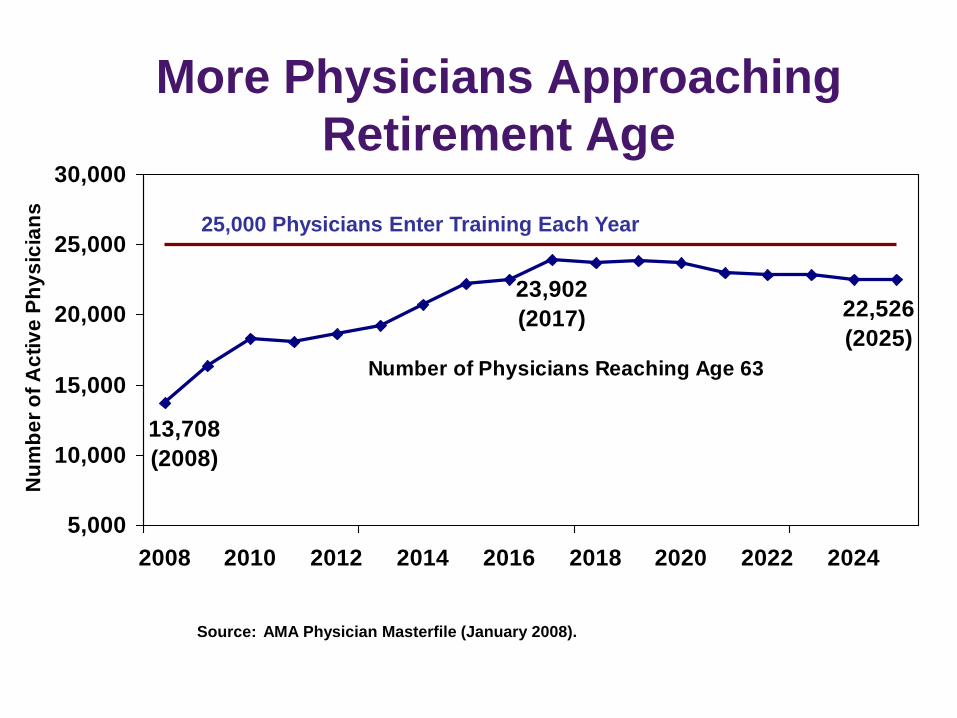
Number of Physicians Reaching Age 63
22,526
(2025)
23,902
(2017)
13,708
(2008)
5,000
10,000
15,000
20,000
25,000
30,000
2008 2010 2012 2014 2016 2018 2020 2022 2024
Nu
mb
er
of
Ac
tiv
e P
hy
sic
ian
s
Source: AMA Physician Masterfile (January 2008).
25,000 Physicians Enter Training Each Year
More Physicians Approaching
Retirement Age
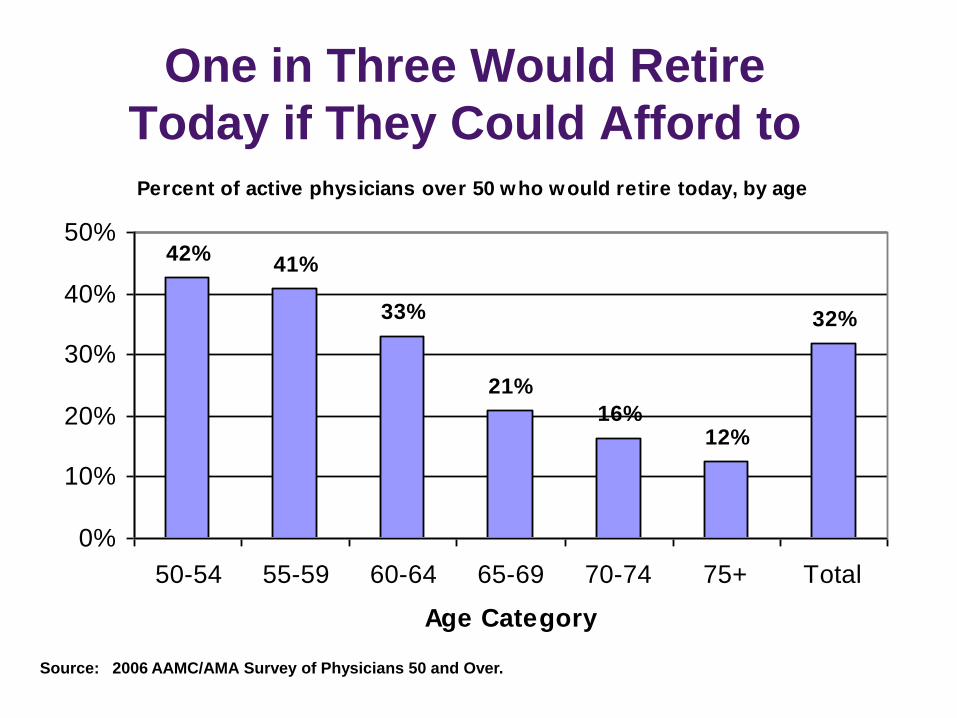
One in Three Would Retire
Today if They Could Afford to Percent of active physicians over 50 who would retire today, by age
42%41%
33%
21%
16%12%
32%
0%
10%
20%
30%
40%
50%
50-54 55-59 60-64 65-69 70-74 75+ Total
Age Category
Source: 2006 AAMC/AMA Survey of Physicians 50 and Over.
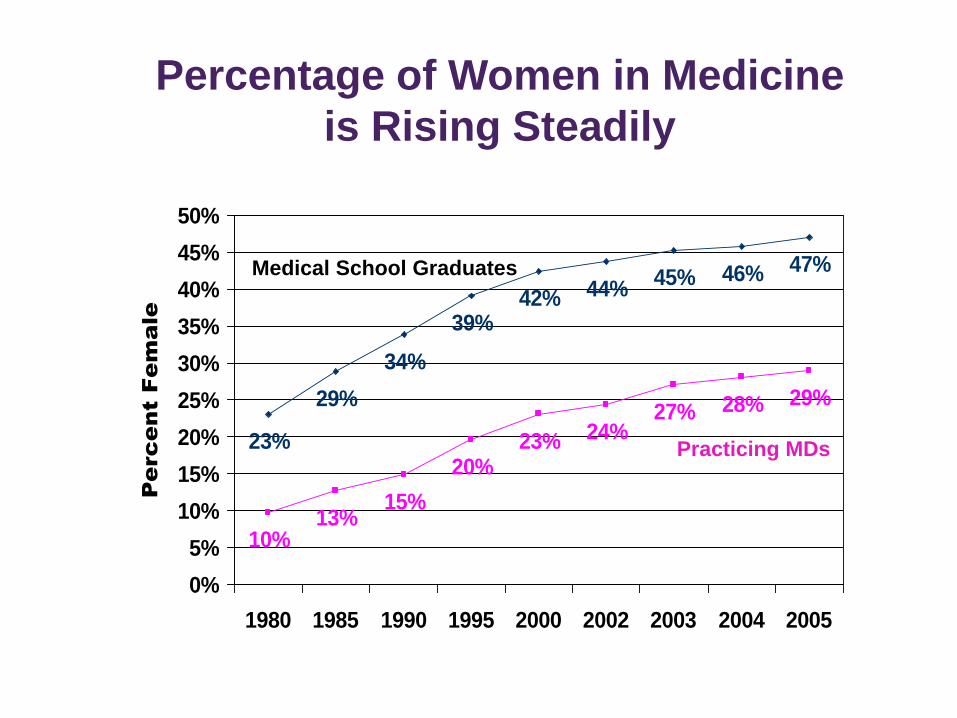
Percentage of Women in Medicine
is Rising Steadily
23%
29%
34%
39%42% 44%
45% 46% 47%
10%13%
15%
20%23% 24%
27% 28% 29%
0%
5%
10%
15%
20%
25%
30%
35%
40%
45%
50%
1980 1985 1990 1995 2000 2002 2003 2004 2005
Pe
rc
en
t F
em
ale
Medical School Graduates
Practicing MDs

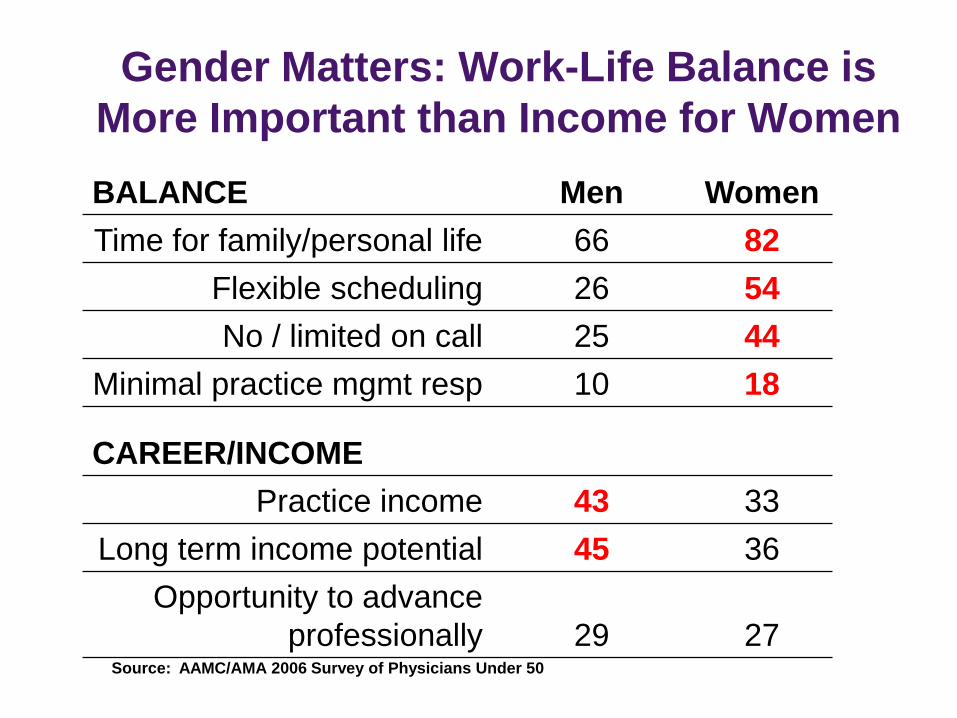
Gender Matters: Work-Life Balance is
More Important than Income for Women
BALANCE Men Women
Time for family/personal life 66 82
Flexible scheduling 26 54
No / limited on call 25 44
Minimal practice mgmt resp 10 18
CAREER/INCOME
Practice income 43 33
Long term income potential 45 36
Opportunity to advance
professionally 29 27 Source: AAMC/AMA 2006 Survey of Physicians Under 50
26
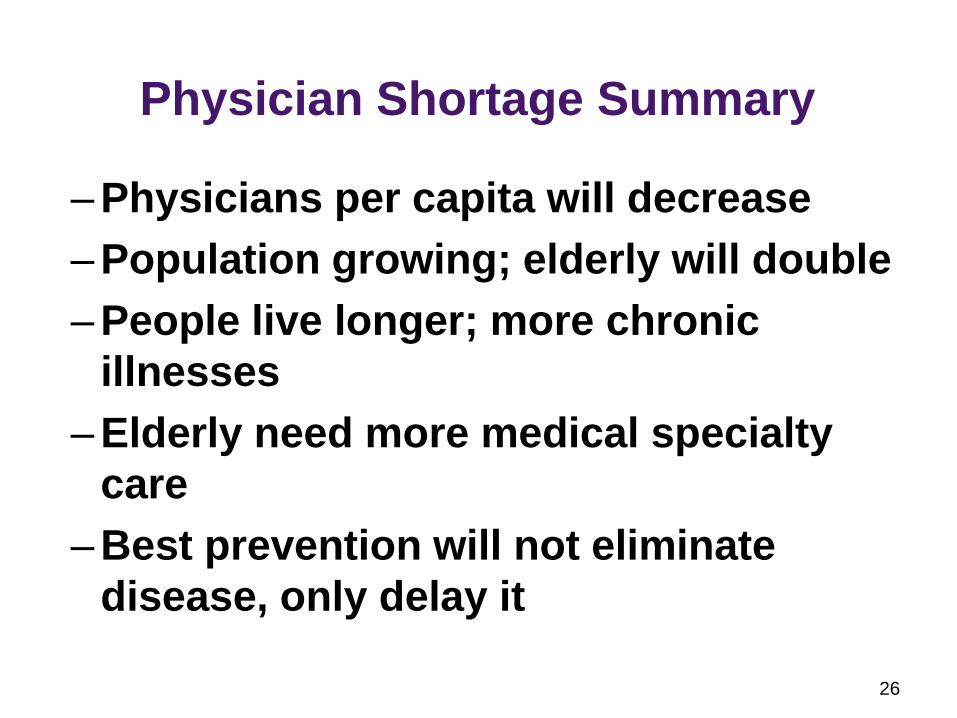
Physician Shortage Summary
– Physicians per capita will decrease
– Population growing; elderly will double
– People live longer; more chronic
illnesses
– Elderly need more medical specialty
care
– Best prevention will not eliminate
disease, only delay it
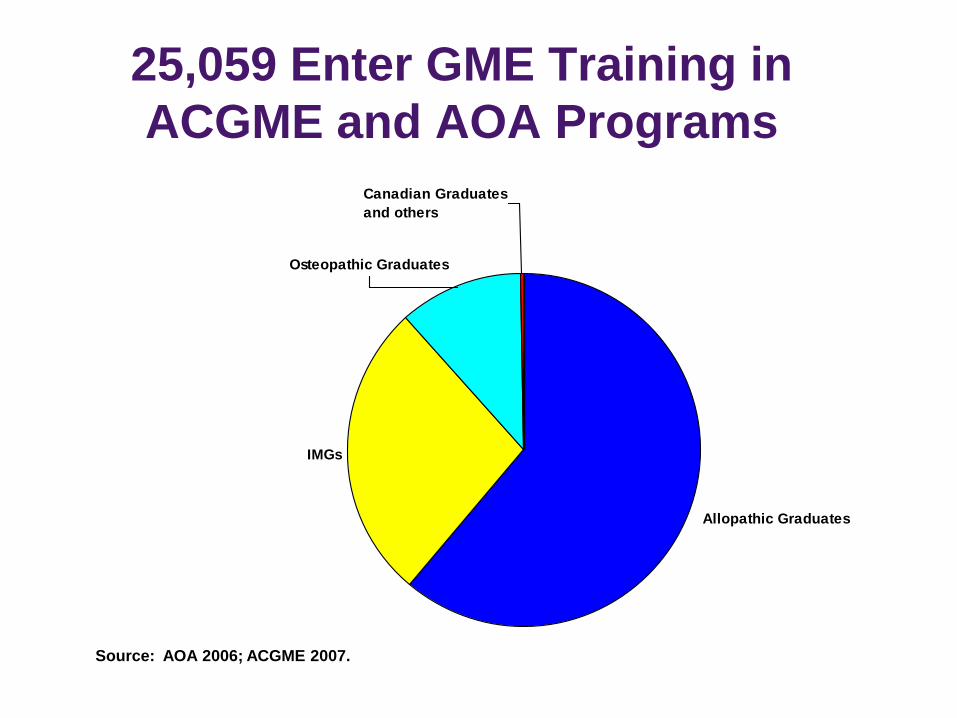
25,059 Enter GME Training in
ACGME and AOA Programs
Allopathic Graduates
IMGs
Osteopathic Graduates
Canadian Graduates
and others
Source: AOA 2006; ACGME 2007.
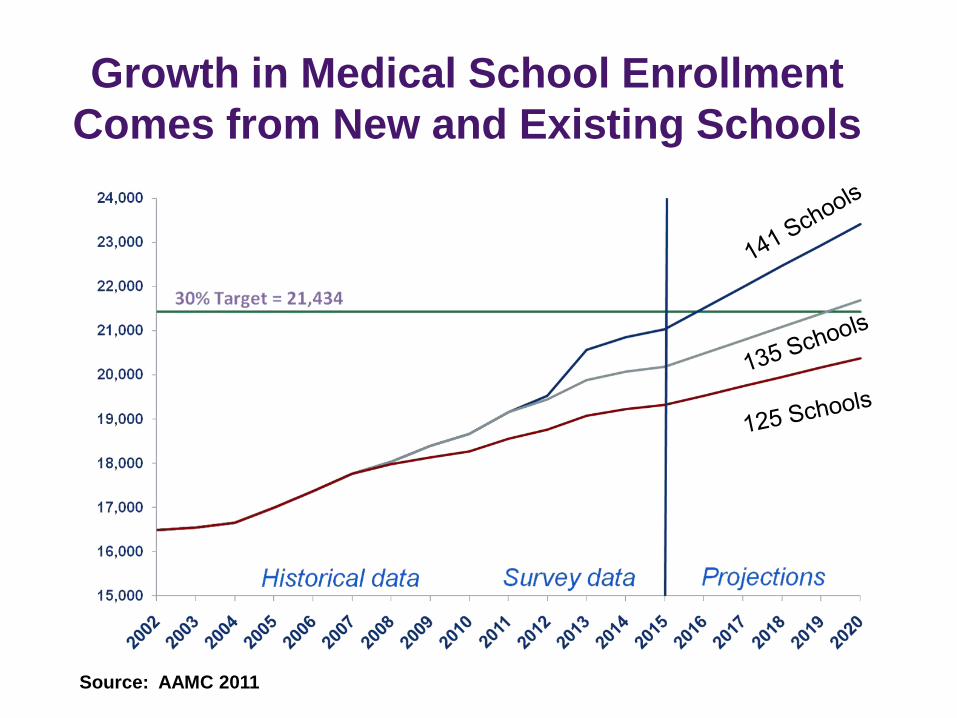
Growth in Medical School Enrollment
Comes from New and Existing Schools
Source: AAMC 2011
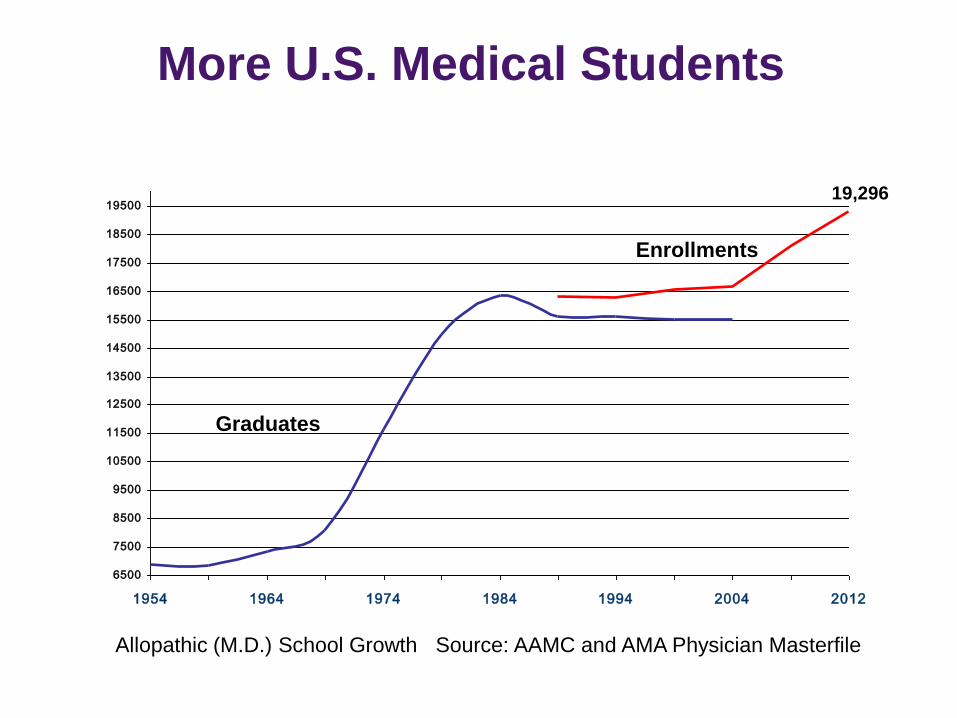
More U.S. Medical Students
6500
7500
8500
9500
10500
11500
12500
13500
14500
15500
16500
17500
18500
19500
1954 1964 1974 1984 1994 2004 2012
Graduates
19,296
Enrollments
Allopathic (M.D.) School Growth Source: AAMC and AMA Physician Masterfile
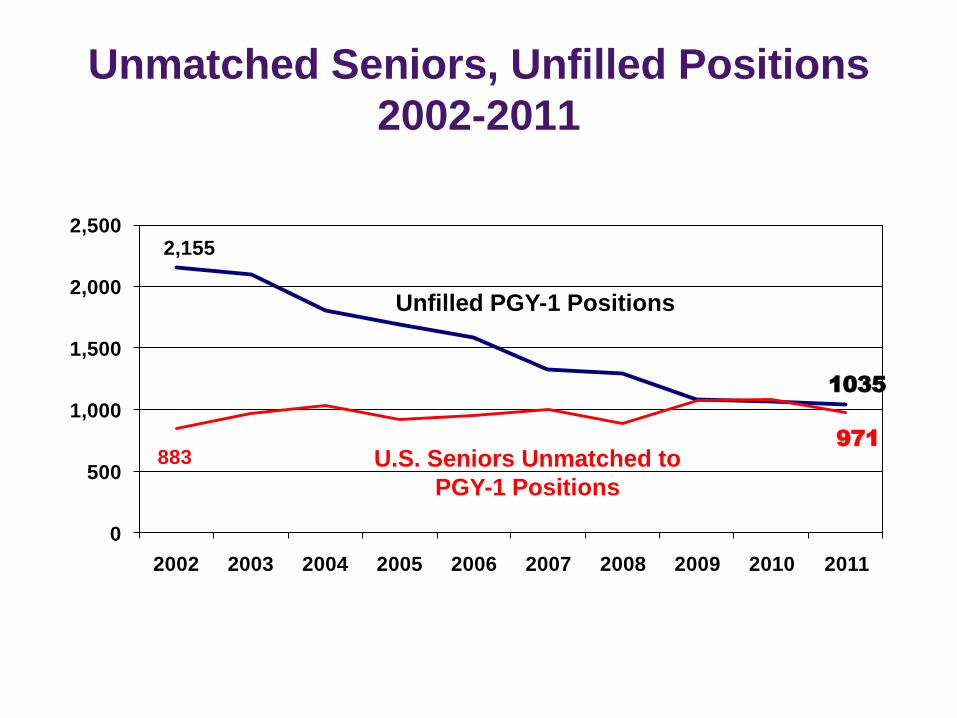
Unmatched Seniors, Unfilled Positions
2002-2011
2,155
883
1035
971
0
500
1,000
1,500
2,000
2,500
2002 2003 2004 2005 2006 2007 2008 2009 2010 2011
Unfilled PGY-1 Positions
U.S. Seniors Unmatched to
PGY-1 Positions
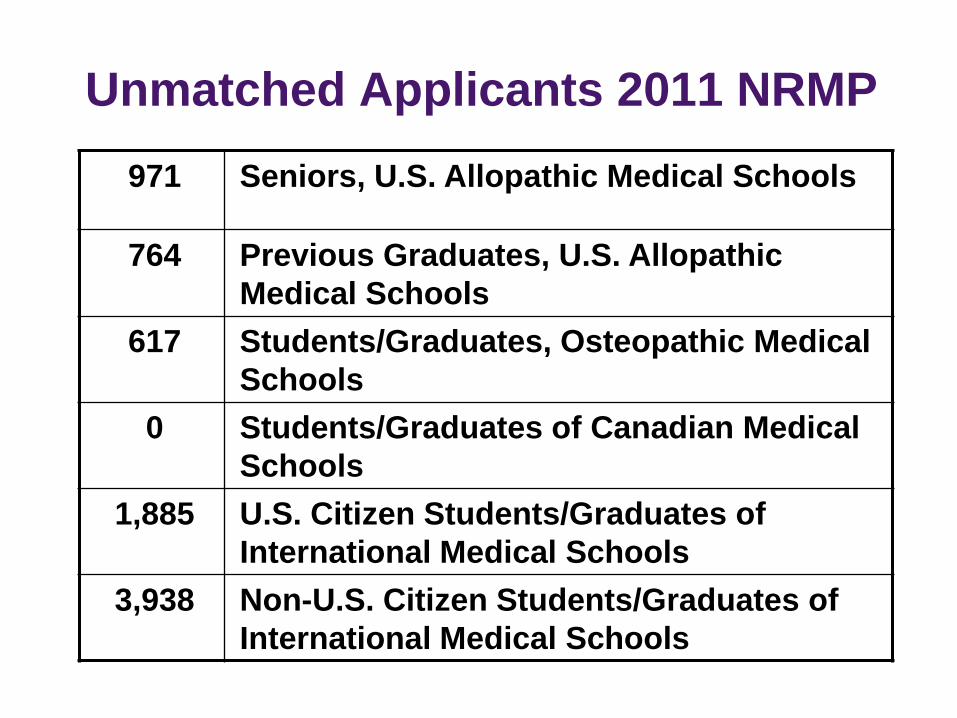
Unmatched Applicants 2011 NRMP
971 Seniors, U.S. Allopathic Medical Schools
764 Previous Graduates, U.S. Allopathic
Medical Schools
617 Students/Graduates, Osteopathic Medical
Schools
0 Students/Graduates of Canadian Medical
Schools
1,885 U.S. Citizen Students/Graduates of
International Medical Schools
3,938 Non-U.S. Citizen Students/Graduates of
International Medical Schools
32
Are core training
programs expanding
enough to meet our
nation’s needs?
33
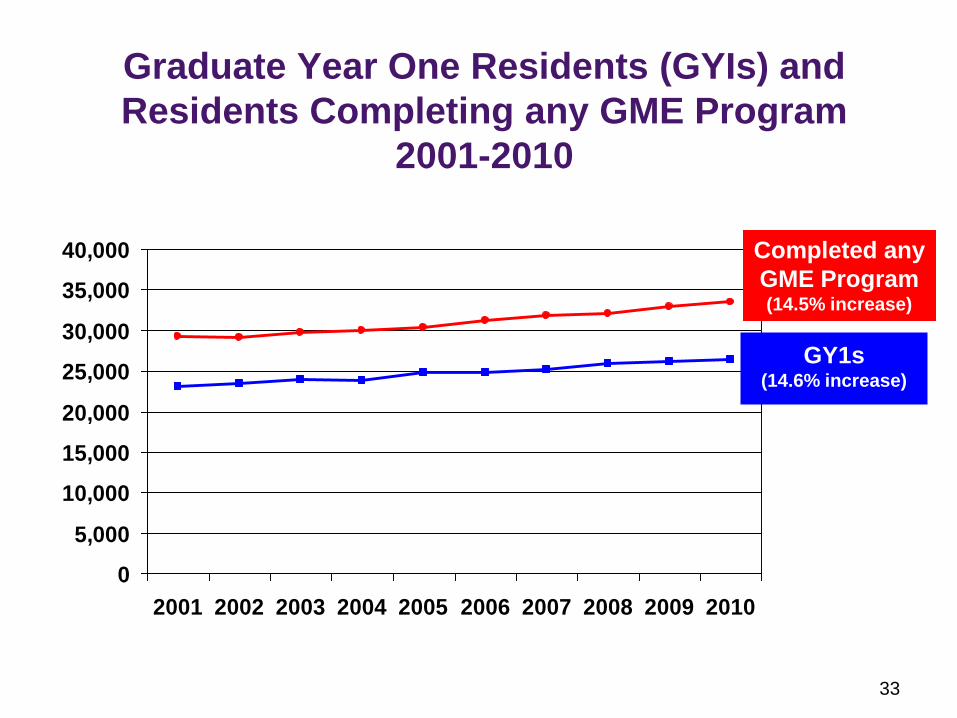
Graduate Year One Residents (GYIs) and
Residents Completing any GME Program
2001-2010
0
5,000
10,000
15,000
20,000
25,000
30,000
35,000
40,000
2001 2002 2003 2004 2005 2006 2007 2008 2009 2010
Completed any
GME Program (14.5% increase)
GY1s (14.6% increase)
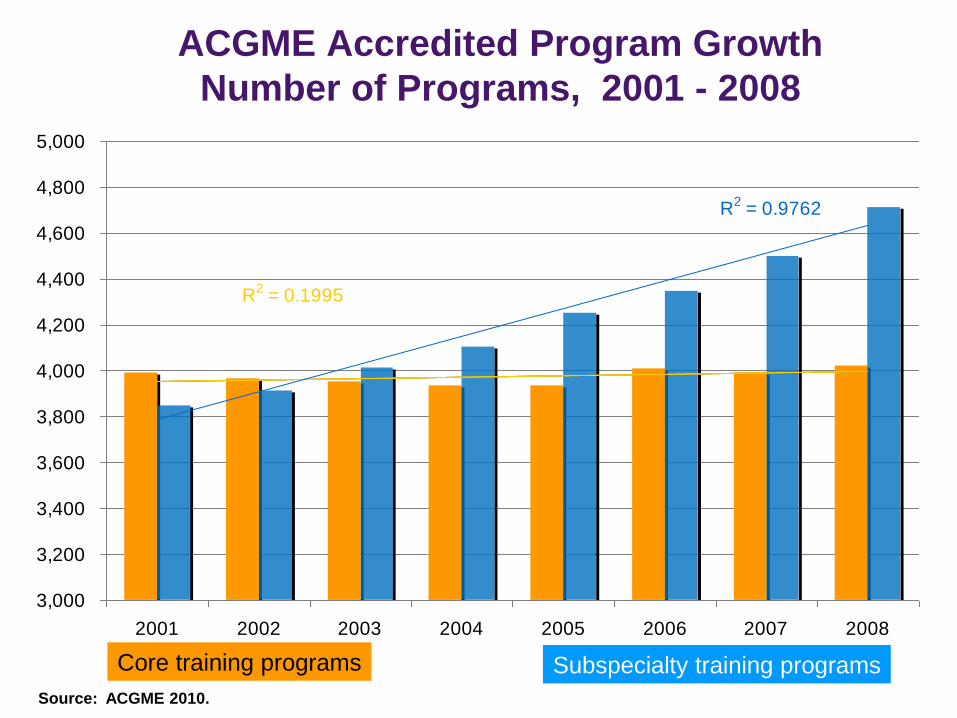
ACGME Accredited Program Growth
Number of Programs, 2001 - 2008
R2 = 0.1995
R2 = 0.9762
3,000
3,200
3,400
3,600
3,800
4,000
4,200
4,400
4,600
4,800
5,000
2001 2002 2003 2004 2005 2006 2007 2008
"Pipeline" Residency Programs Fellowship Programs
Linear ("Pipeline" Residency Programs) Linear (Fellowship Programs)
Core training programs Subspecialty training programs
Source: ACGME 2010.
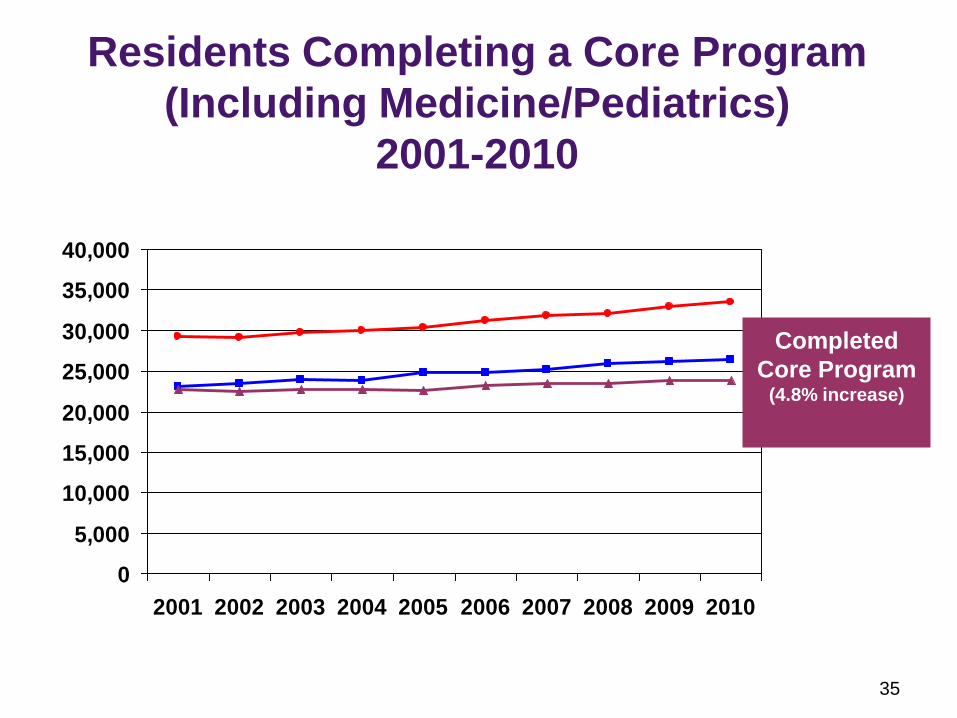
35
Residents Completing a Core Program
(Including Medicine/Pediatrics)
2001-2010
0
5,000
10,000
15,000
20,000
25,000
30,000
35,000
40,000
2001 2002 2003 2004 2005 2006 2007 2008 2009 2010
Completed
Core Program (4.8% increase)
36
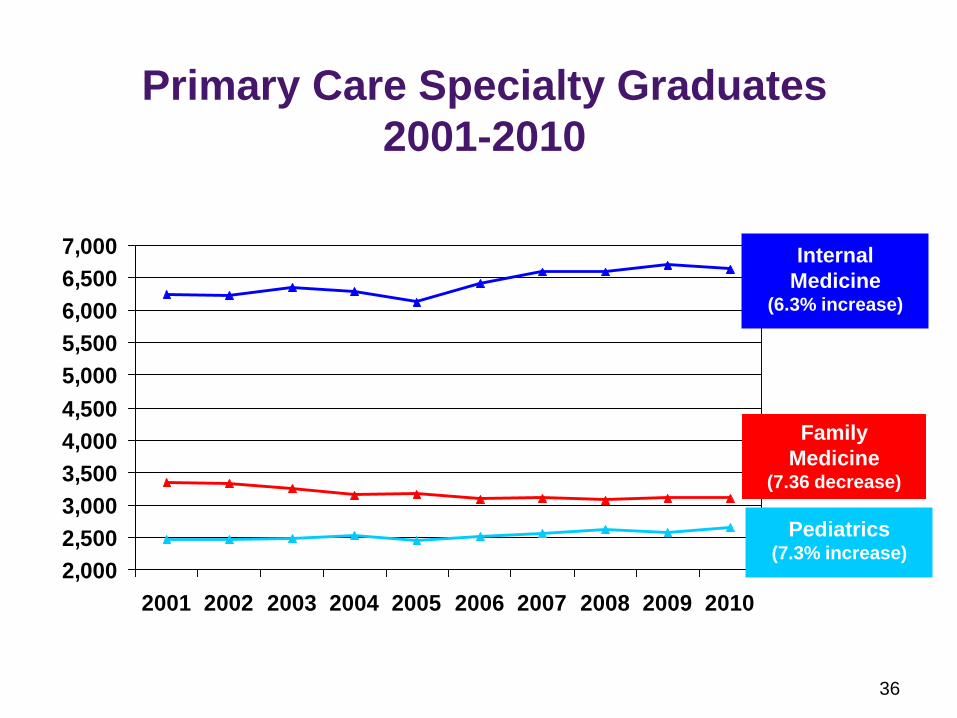
Primary Care Specialty Graduates
2001-2010
2,000
2,500
3,000
3,500
4,000
4,500
5,000
5,500
6,000
6,500
7,000
2001 2002 2003 2004 2005 2006 2007 2008 2009 2010
Family
Medicine (7.36 decrease)
Internal
Medicine (6.3% increase)
Pediatrics (7.3% increase)

37
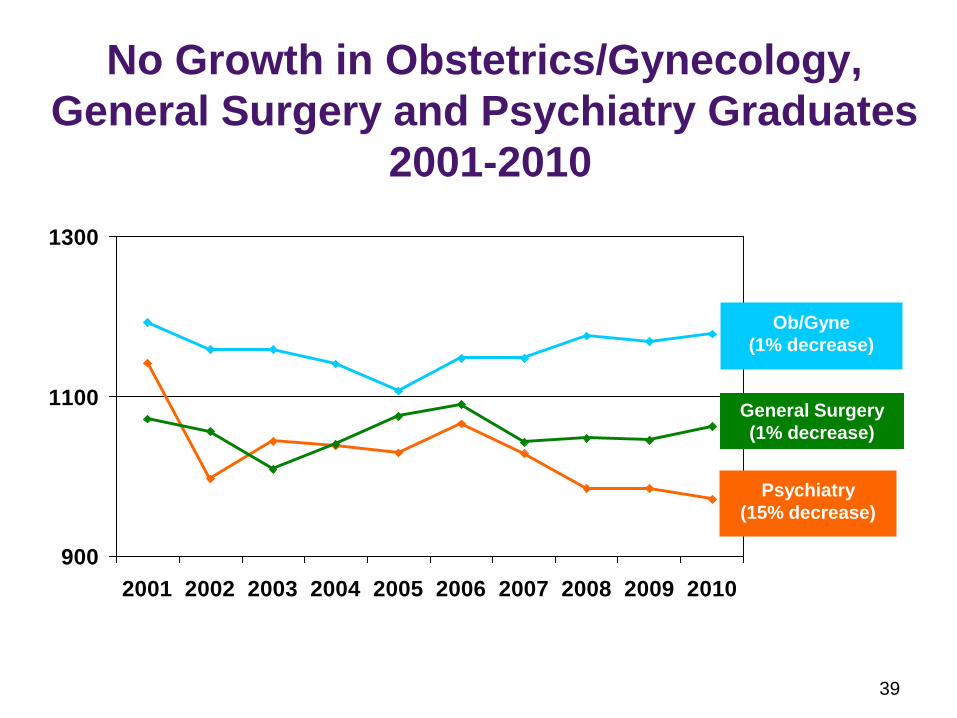
No Growth in Obstetrics/Gynecology,
General Surgery and Psychiatry Graduates
2001-2010
900
1100
1300
2001 2002 2003 2004 2005 2006 2007 2008 2009 2010
Ob/Gyne
(1% decrease)
Psychiatry
(15% decrease)
General Surgery
(1% decrease)
38
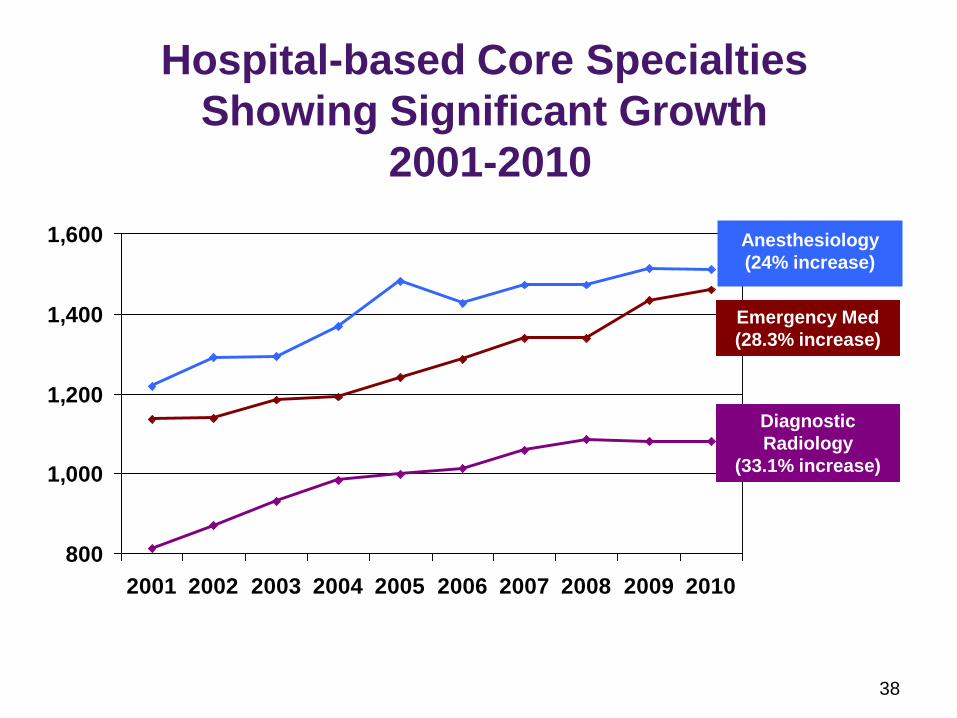
Hospital-based Core Specialties
Showing Significant Growth
2001-2010
800
1,000
1,200
1,400
1,600
2001 2002 2003 2004 2005 2006 2007 2008 2009 2010
Emergency Med
(28.3% increase)
Anesthesiology
(24% increase)
Diagnostic
Radiology
(33.1% increase)
39
No Growth in Obstetrics/Gynecology,
General Surgery and Psychiatry Graduates
2001-2010
900
1100
1300
2001 2002 2003 2004 2005 2006 2007 2008 2009 2010
Ob/Gyne
(1% decrease)
Psychiatry
(15% decrease)
General Surgery
(1% decrease)

40
Hospital-based Core Specialties
Showing Significant Growth
2001-2010
800
1,000
1,200
1,400
1,600
2001 2002 2003 2004 2005 2006 2007 2008 2009 2010
Emergency Med
(28.3% increase)
Anesthesiology
(24% increase)
Diagnostic
Radiology
(33.1% increase)
41
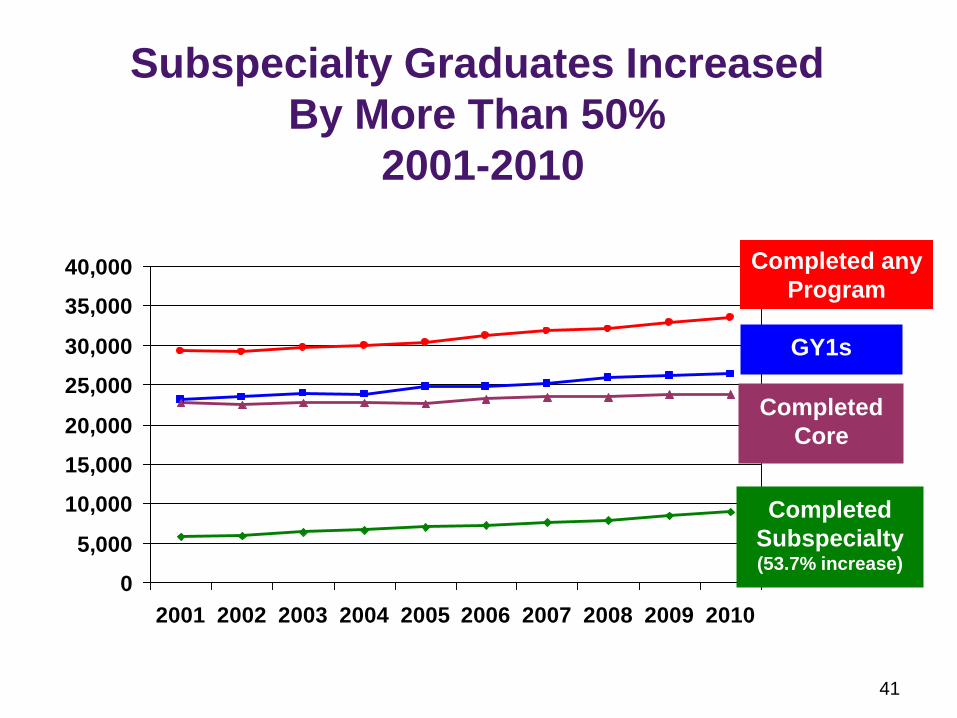
Subspecialty Graduates Increased
By More Than 50%
2001-2010
0
5,000
10,000
15,000
20,000
25,000
30,000
35,000
40,000
2001 2002 2003 2004 2005 2006 2007 2008 2009 2010
Completed
Subspecialty (53.7% increase)
Completed any
Program
GY1s
Completed
Core
42
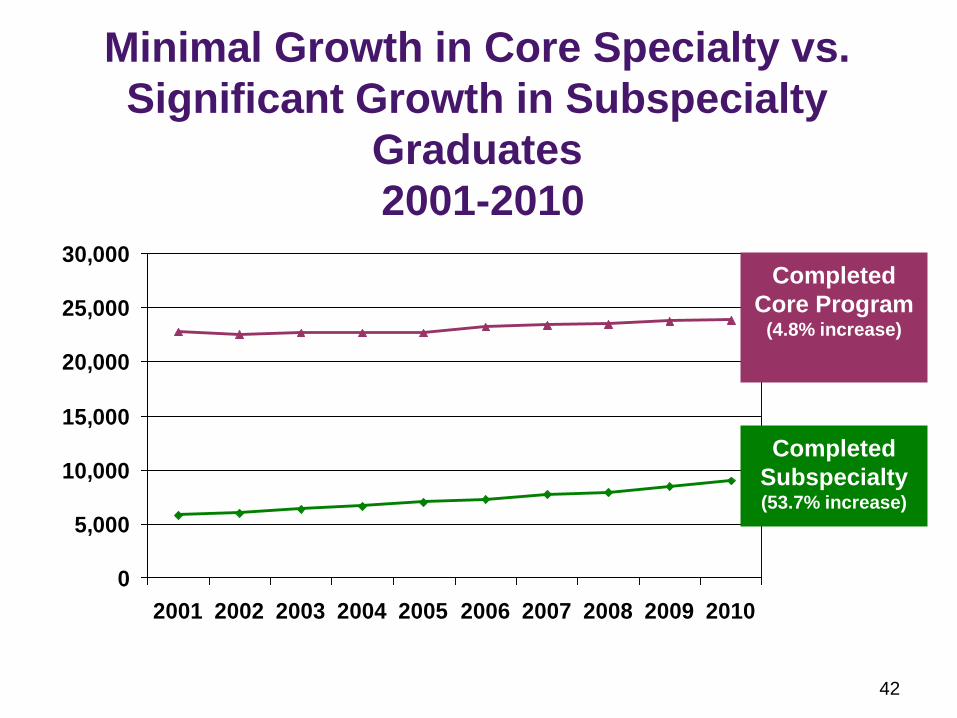
Minimal Growth in Core Specialty vs.
Significant Growth in Subspecialty
Graduates
2001-2010
0
5,000
10,000
15,000
20,000
25,000
30,000
2001 2002 2003 2004 2005 2006 2007 2008 2009 2010
Completed
Subspecialty (53.7% increase)
Completed
Core Program (4.8% increase)
43
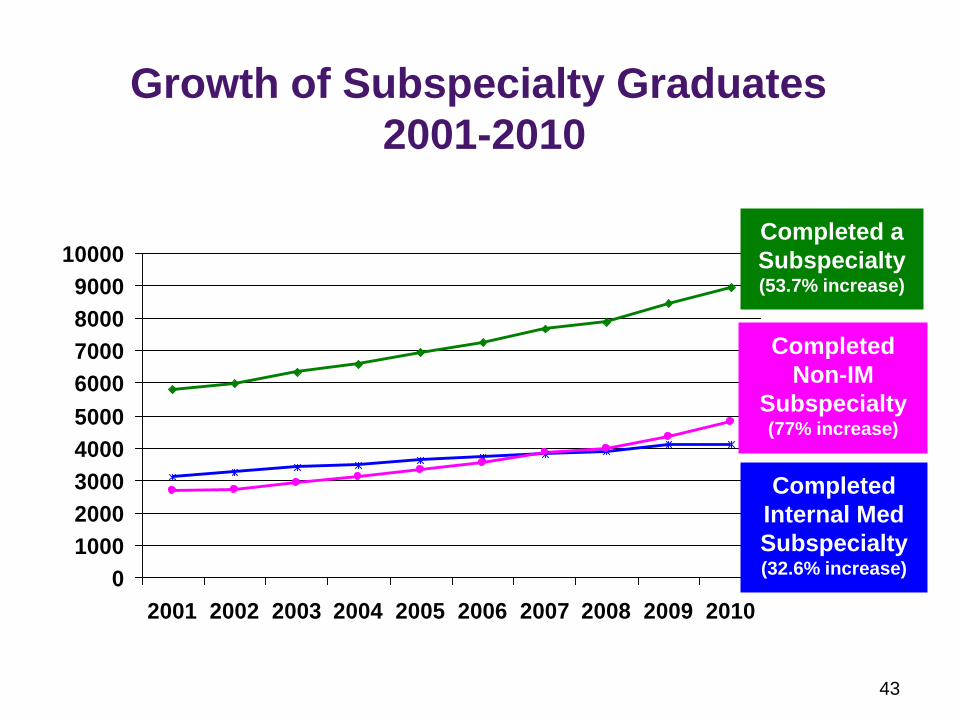
Growth of Subspecialty Graduates
2001-2010
0
1000
2000
3000
4000
5000
6000
7000
8000
9000
10000
2001 2002 2003 2004 2005 2006 2007 2008 2009 2010
Completed a
Subspecialty (53.7% increase)
Completed
Internal Med
Subspecialty (32.6% increase)
Completed
Non-IM
Subspecialty (77% increase)
44
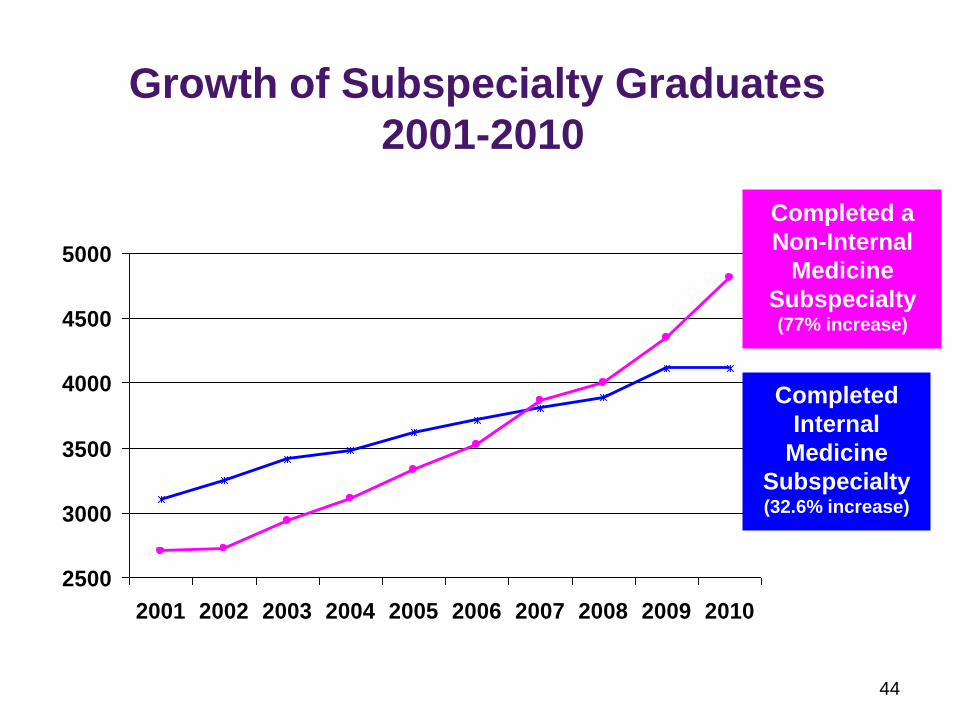
Growth of Subspecialty Graduates
2001-2010
2500
3000
3500
4000
4500
5000
2001 2002 2003 2004 2005 2006 2007 2008 2009 2010
Completed
Internal
Medicine
Subspecialty (32.6% increase)
Completed a
Non-Internal
Medicine
Subspecialty (77% increase)
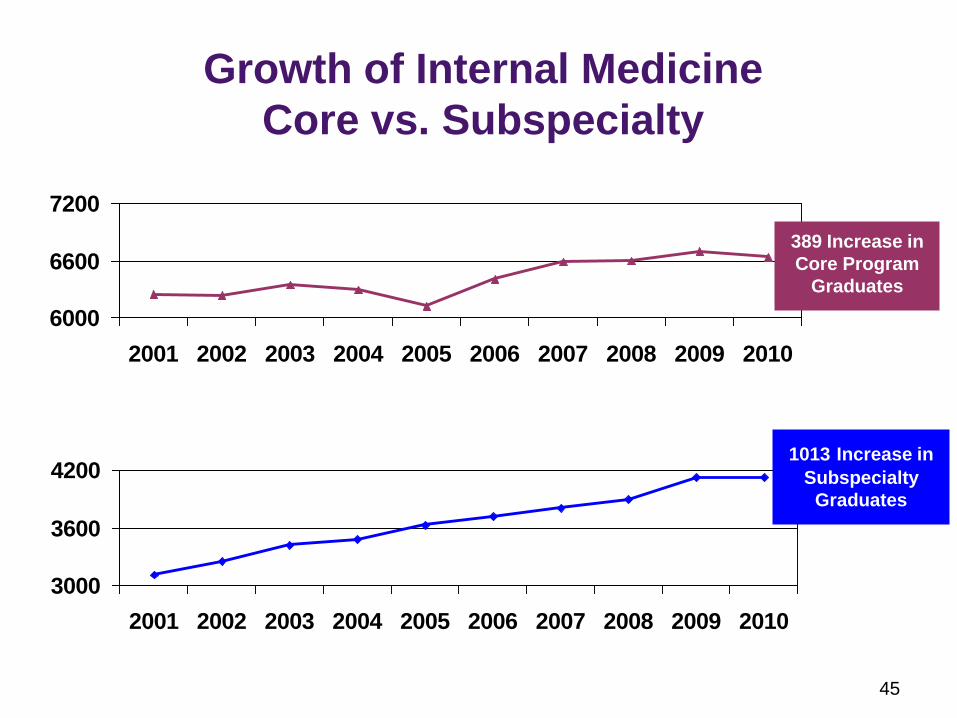
45
Growth of Internal Medicine
Core vs. Subspecialty
3000
3600
4200
2001 2002 2003 2004 2005 2006 2007 2008 2009 2010
6000
6600
7200
2001 2002 2003 2004 2005 2006 2007 2008 2009 2010
1013 Increase in
Subspecialty
Graduates
389 Increase in
Core Program
Graduates
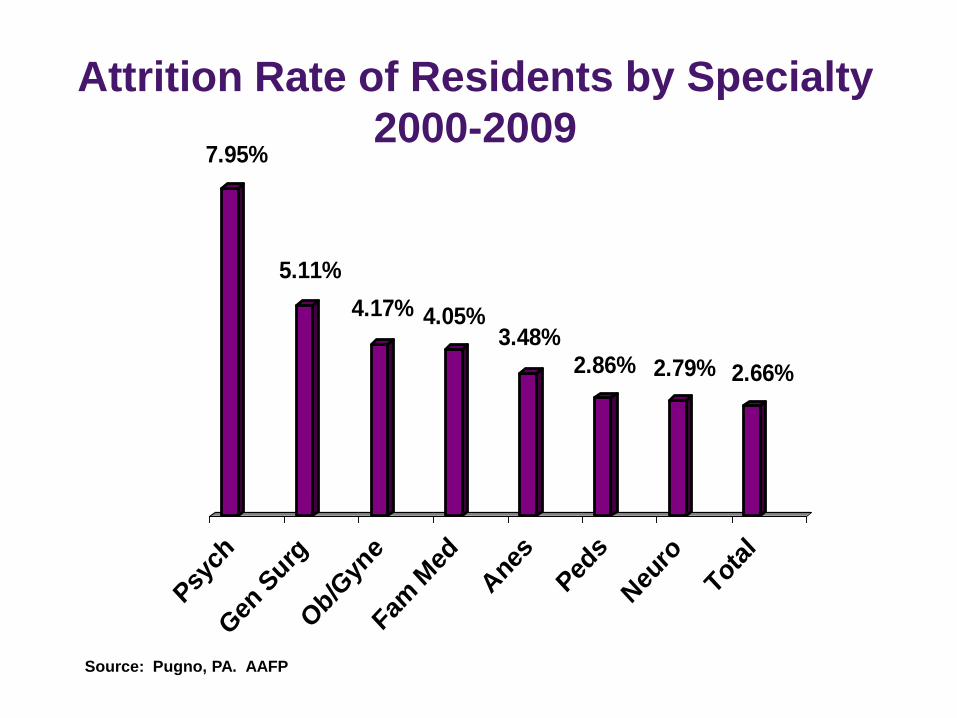
Attrition Rate of Residents by Specialty
2000-2009 7.95%
5.11%
4.17% 4.05%3.48%
2.86% 2.79% 2.66%
Psy
ch
Gen
Surg
Ob/G
yne
Fam M
ed
Ane
s
Ped
s
Neu
ro
Total
Source: Pugno, PA. AAFP
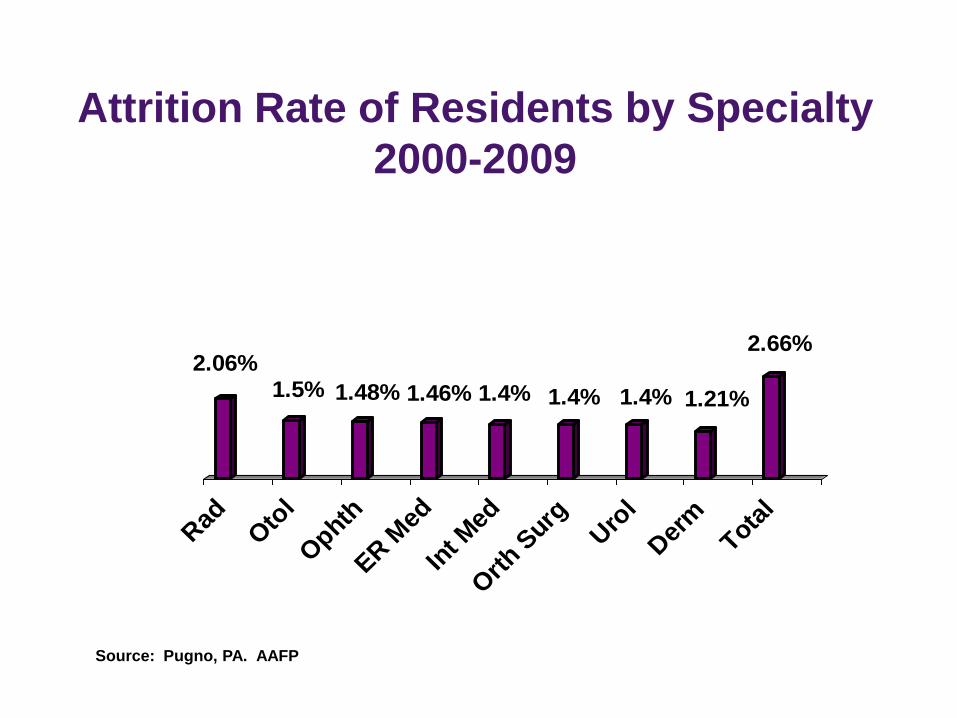
Attrition Rate of Residents by Specialty
2000-2009
2.06%1.5% 1.48% 1.46% 1.4% 1.4% 1.4% 1.21%
2.66%
Rad
Oto
l
Ophth
ER M
ed
Int M
ed
Orth S
urgUro
l
Der
mTota
l
Source: Pugno, PA. AAFP
48
What We Don’t Know, But Should
• Reasons for drop outs from core programs
(withdrawal vs. dismissal, program transfers
within specialty, changes of specialty)
• Issues of work-life balance, breaks in training,
opportunities for re-entry
• Impact of economics (debt, future earnings)
• Flexibility to change specialty choice
• Impact of gender and generation
• Do residencies “weed out” incompetence
• Number practicing with incomplete training
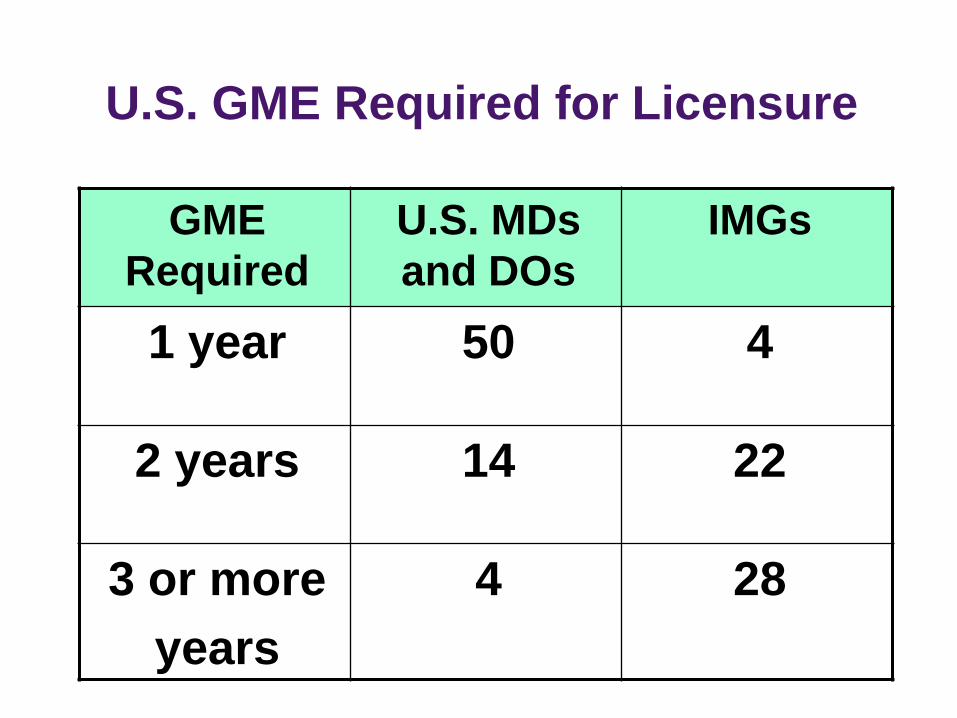
U.S. GME Required for Licensure
GME
Required
U.S. MDs
and DOs
IMGs
1 year 50 4
2 years 14 22
3 or more
years
4 28
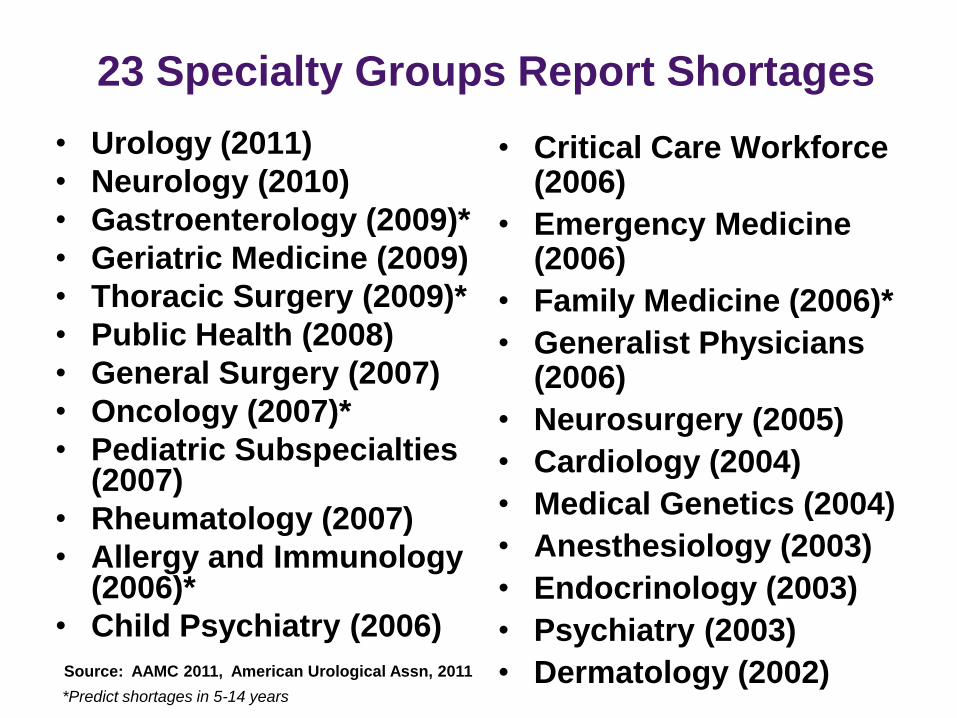
23 Specialty Groups Report Shortages
• Urology (2011)
• Neurology (2010)
• Gastroenterology (2009)*
• Geriatric Medicine (2009)
• Thoracic Surgery (2009)*
• Public Health (2008)
• General Surgery (2007)
• Oncology (2007)*
• Pediatric Subspecialties (2007)
• Rheumatology (2007)
• Allergy and Immunology (2006)*
• Child Psychiatry (2006)
• Critical Care Workforce (2006)
• Emergency Medicine (2006)
• Family Medicine (2006)*
• Generalist Physicians (2006)
• Neurosurgery (2005)
• Cardiology (2004)
• Medical Genetics (2004)
• Anesthesiology (2003)
• Endocrinology (2003)
• Psychiatry (2003)
• Dermatology (2002) *Predict shortages in 5-14 years
Source: AAMC 2011, American Urological Assn, 2011
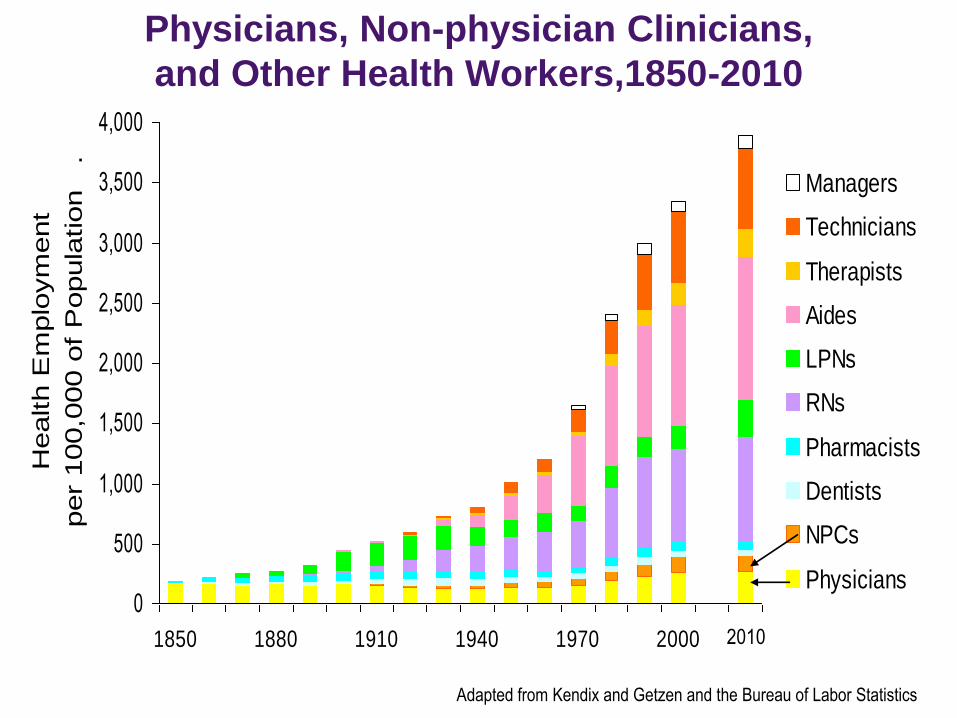
Physicians, Non-physician Clinicians,
and Other Health Workers,1850-2010
0
500
1,000
1,500
2,000
2,500
3,000
3,500
4,000
1850 1880 1910 1940 1970 2000
Health E
mplo
ym
ent
per
100,0
00 o
f P
opula
tion
.
Managers
Technicians
Therapists
Aides
LPNs
RNs
Pharmacists
Dentists
NPCs
Physicians
Adapted from Kendix and Getzen and the Bureau of Labor Statistics
2010
53
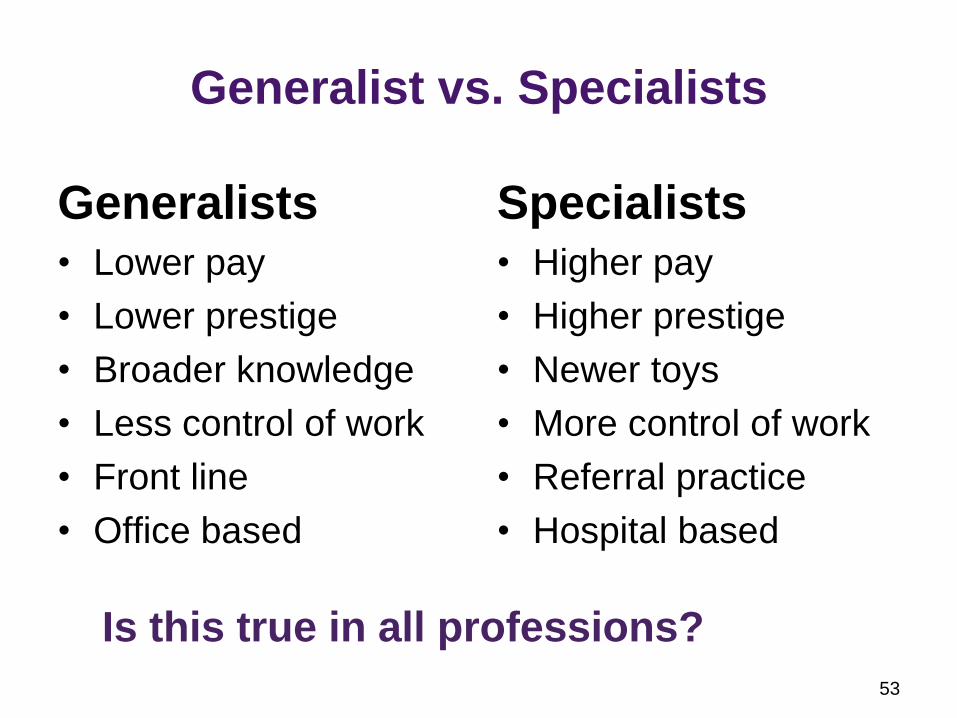
Generalist vs. Specialists
Generalists • Lower pay
• Lower prestige
• Broader knowledge
• Less control of work
• Front line
• Office based
Specialists • Higher pay
• Higher prestige
• Newer toys
• More control of work
• Referral practice
• Hospital based
Is this true in all professions?
General vs. Specialist
55
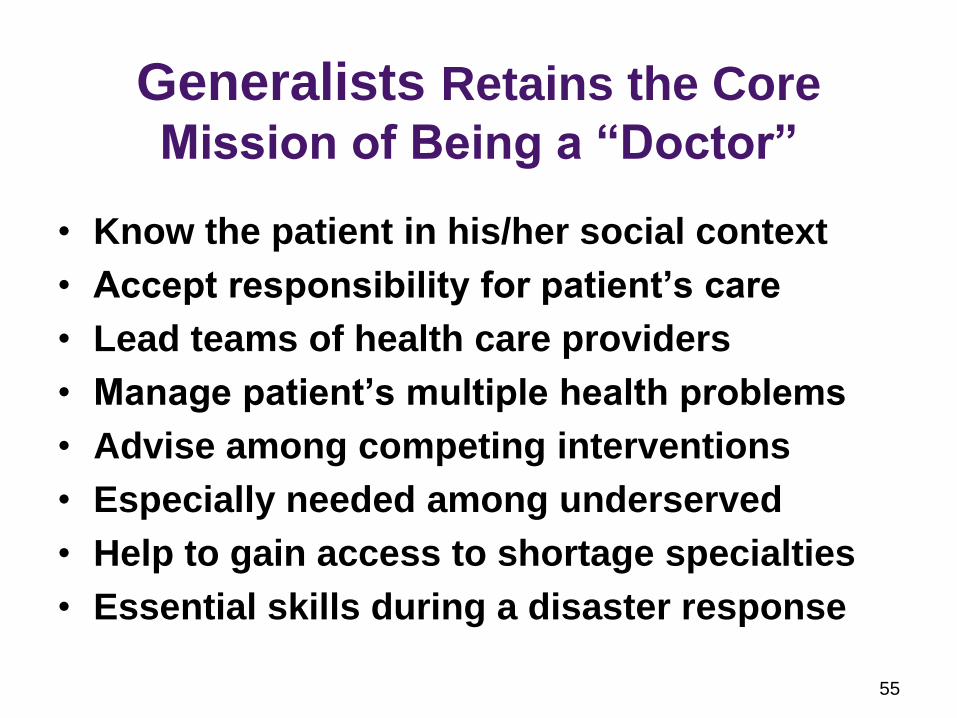
Generalists Retains the Core
Mission of Being a “Doctor”
• Know the patient in his/her social context
• Accept responsibility for patient’s care
• Lead teams of health care providers
• Manage patient’s multiple health problems
• Advise among competing interventions
• Especially needed among underserved
• Help to gain access to shortage specialties
• Essential skills during a disaster response
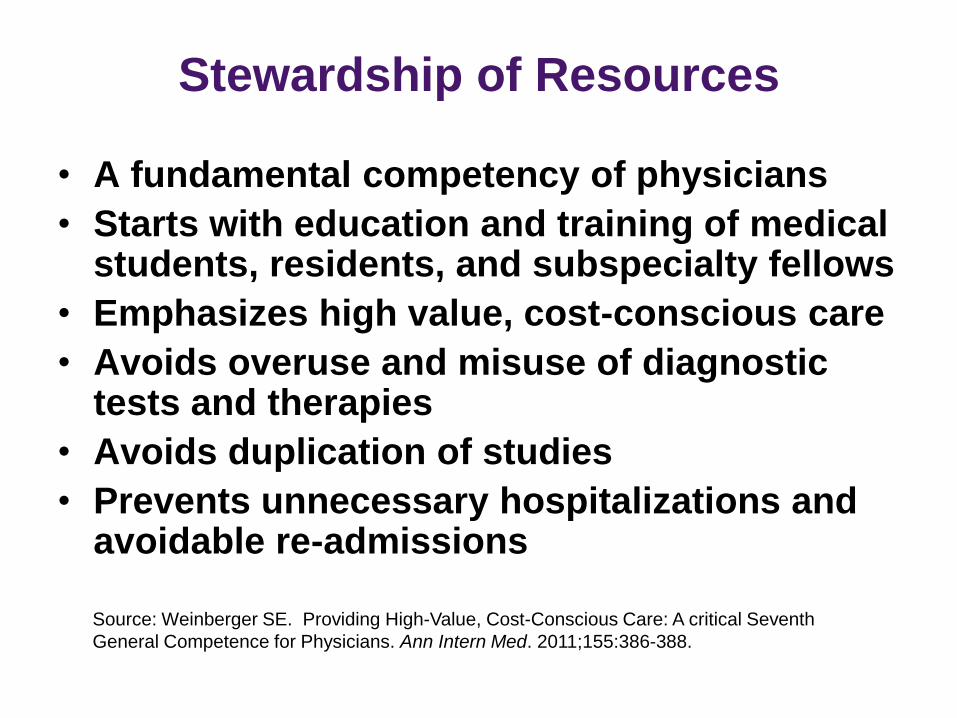
Stewardship of Resources
• A fundamental competency of physicians
• Starts with education and training of medical students, residents, and subspecialty fellows
• Emphasizes high value, cost-conscious care
• Avoids overuse and misuse of diagnostic tests and therapies
• Avoids duplication of studies
• Prevents unnecessary hospitalizations and avoidable re-admissions
Source: Weinberger SE. Providing High-Value, Cost-Conscious Care: A critical Seventh
General Competence for Physicians. Ann Intern Med. 2011;155:386-388.
57
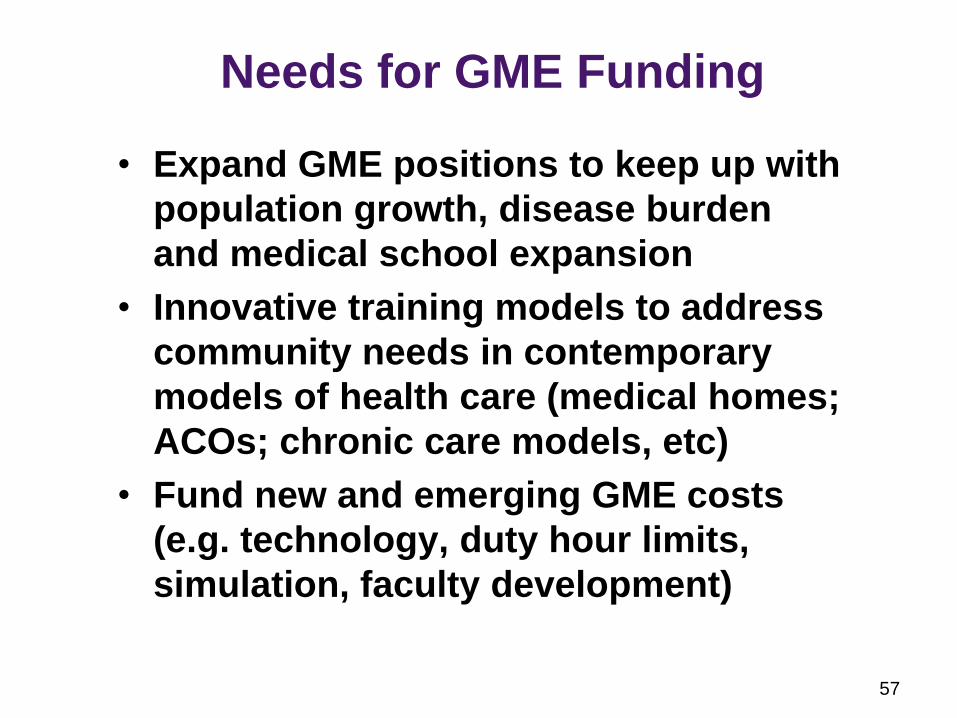
Needs for GME Funding
• Expand GME positions to keep up with
population growth, disease burden
and medical school expansion
• Innovative training models to address
community needs in contemporary
models of health care (medical homes;
ACOs; chronic care models, etc)
• Fund new and emerging GME costs
(e.g. technology, duty hour limits,
simulation, faculty development)
© 2012 American Medical Association. All rights reserved. 58
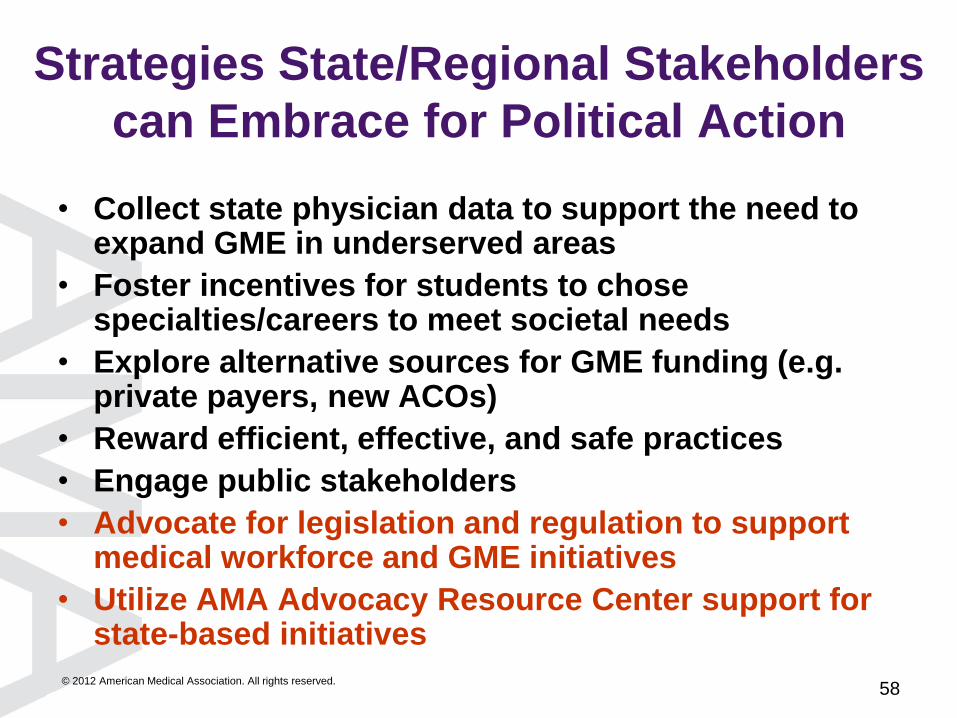
Strategies State/Regional Stakeholders
can Embrace for Political Action
• Collect state physician data to support the need to expand GME in underserved areas
• Foster incentives for students to chose specialties/careers to meet societal needs
• Explore alternative sources for GME funding (e.g. private payers, new ACOs)
• Reward efficient, effective, and safe practices
• Engage public stakeholders
• Advocate for legislation and regulation to support medical workforce and GME initiatives
• Utilize AMA Advocacy Resource Center support for state-based initiatives
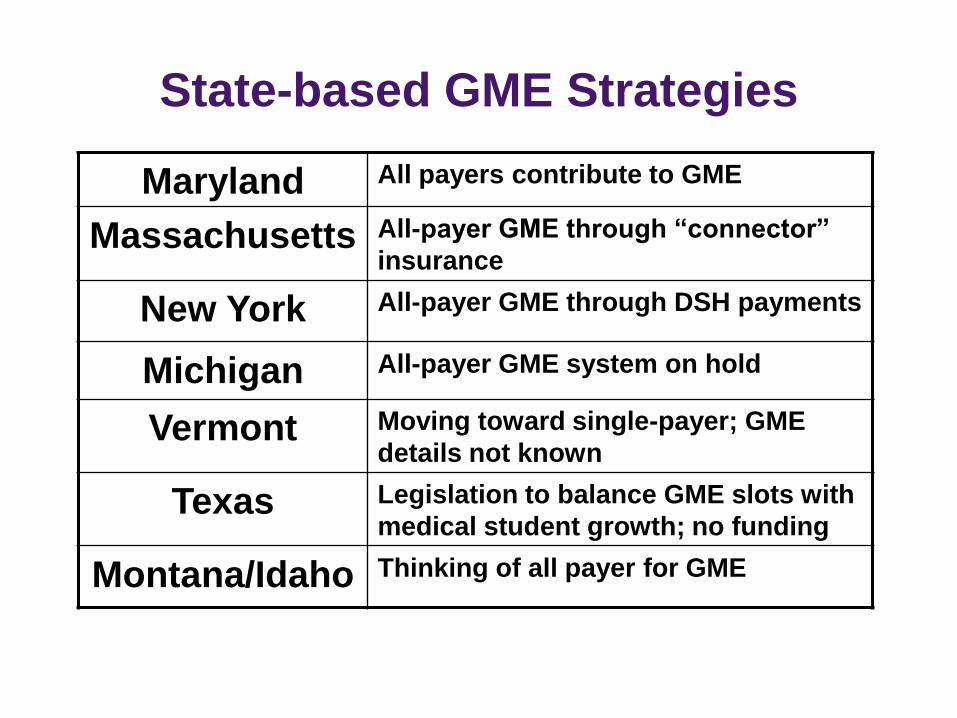
State-based GME Strategies
Maryland All payers contribute to GME
Massachusetts All-payer GME through “connector”
insurance
New York All-payer GME through DSH payments
Michigan All-payer GME system on hold
Vermont Moving toward single-payer; GME
details not known
Texas Legislation to balance GME slots with
medical student growth; no funding
Montana/Idaho Thinking of all payer for GME
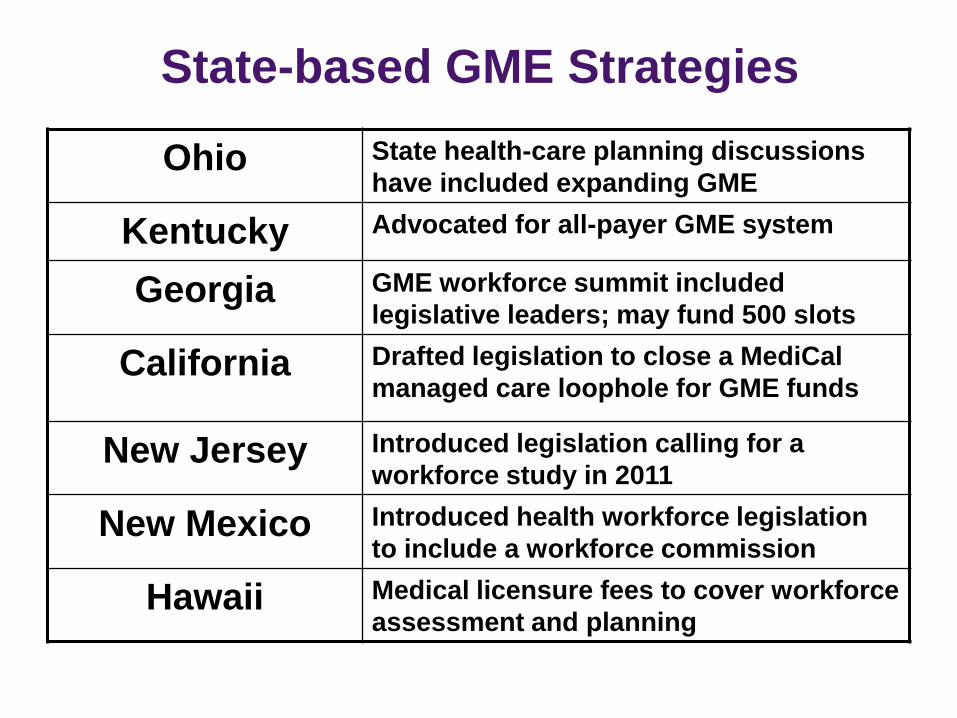
State-based GME Strategies
Ohio State health-care planning discussions
have included expanding GME
Kentucky Advocated for all-payer GME system
Georgia GME workforce summit included
legislative leaders; may fund 500 slots
California Drafted legislation to close a MediCal
managed care loophole for GME funds
New Jersey Introduced legislation calling for a
workforce study in 2011
New Mexico Introduced health workforce legislation
to include a workforce commission
Hawaii Medical licensure fees to cover workforce
assessment and planning
© 2012 American Medical Association. All rights reserved. 61
AMA Federal Advocacy
• Recommended adequate, stable GME funding
for Community Health Centers, NHSC and
Title VII Programs in April letter to Congress
• Supported the “Resident Physician Shortage
Reduction Act of 2011”
• Joined the AAMC and 38 other physician,
hospital and educational organizations urging
the Joint Congressional Committee on Deficit
Reduction to protect Medicare GME funding
62
Potential Policy Implications for
Graduate Medical Education
Funding
• Target funding to core programs
• Tie GY1 years to core training
• Provide flexibility to transfer between
specialties
• Accommodate re-starts within specialties
• Accommodate delayed re-entry into GME
• Provide mid-career transitions
© 2012 American Medical Association. All rights reserved. 63
• Ensure adequate GME opportunities for
qualified applicants including IMGs
• Ensure well-trained, competent medical
workforce entering practice
• Create incentives for efficient, effective,
safe and high quality medical practices
• Encourage medical workforce expansion
to correct shortages by specialty and
geography
Solutions Supported by AMA
© 2012 American Medical Association. All rights reserved. 64
Solutions Supported by AMA
• Seek all payer funding for core residency
programs leading to initial board certification
• Align federal and state incentives through:
– all-payer GME system (federal or state
mandates)
– GME funds to meet broader community
needs
– reduce disparities in medical access and
quality
– support GME in innovative health care
systems (PCMHs and ACOs)
66
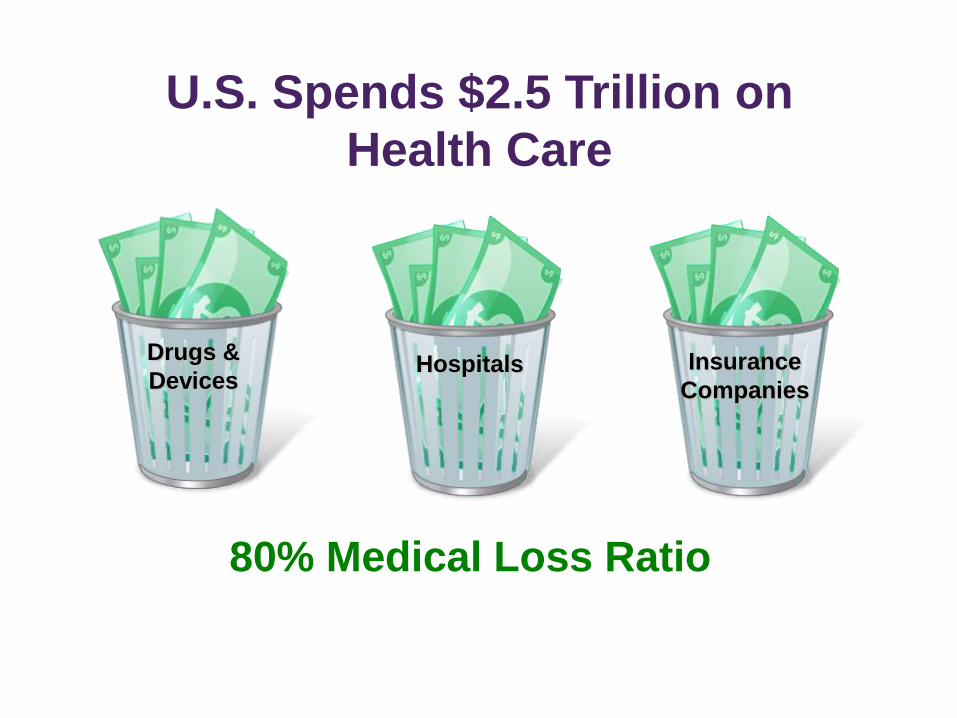
U.S. Spends $2.5 Trillion on
Health Care
• ~$8,000 /person /year while U.S. median
household income $50K
• There is enough in the “system” to rebuild
doctor supply
• How should we pay for GME?

Drugs &
Devices Hospitals Insurance
Companies
U.S. Spends $2.5 Trillion on
Health Care
$317 Billion in U.S. Pharma Revenues
Pharmaceutical and Medical
Device Manufacturers
• Pharma alone spends
over $8 Billion on
100,000 “drug reps”
• Device reps are in
our ICUs and ORs
everyday
Drugs &
Devices
Pharmaceutical and Medical Device
Manufacturers
• Pharma alone spends
over $8 Billion on
100,000 “drug reps”
• Device reps are in
our ICUs and ORs
everyday
• Major conflicts of
interest
Drugs &
Devices

Drugs &
Devices Hospitals Insurance
Companies
U.S. Spends $2.5 Trillion on
Health Care
$750 Billion-a-Year Industry
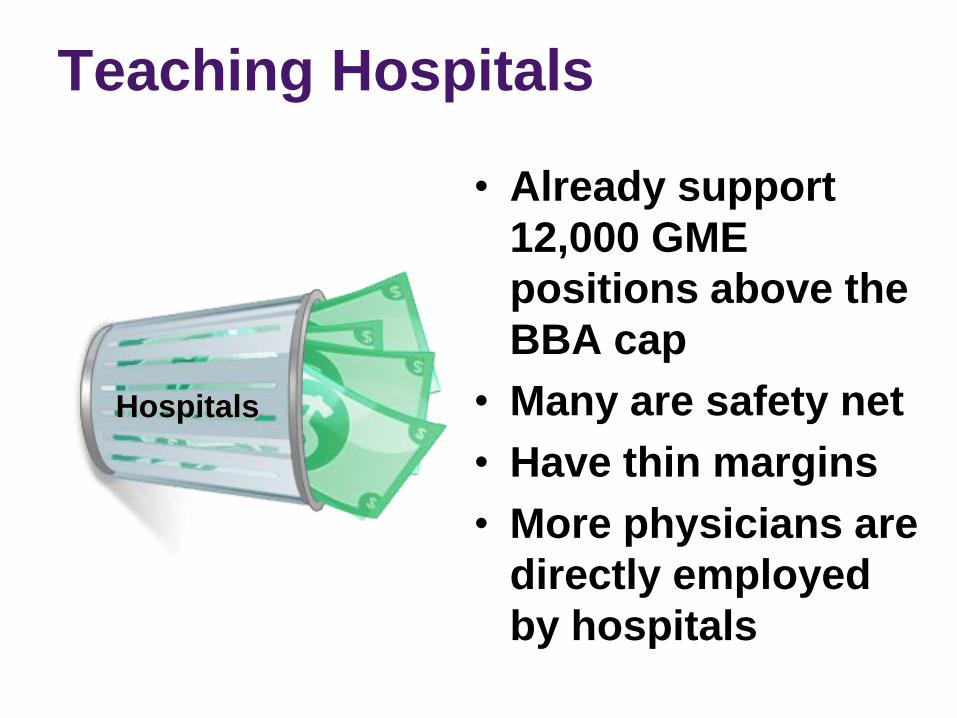
Teaching Hospitals
• Already support
12,000 GME
positions above the
BBA cap
• Many are safety net
• Have thin margins
• More physicians are
directly employed
by hospitals
Hospitals
73
Evidence from Three Experiments:
two real and one virtual
1. How New York and Medicare GME
funding intersected in the ’90s
2. How the Balanced Budget Act shaped
the growth of GME positions
3. How IOM Duty Hours Standards would
have added to GME costs
74
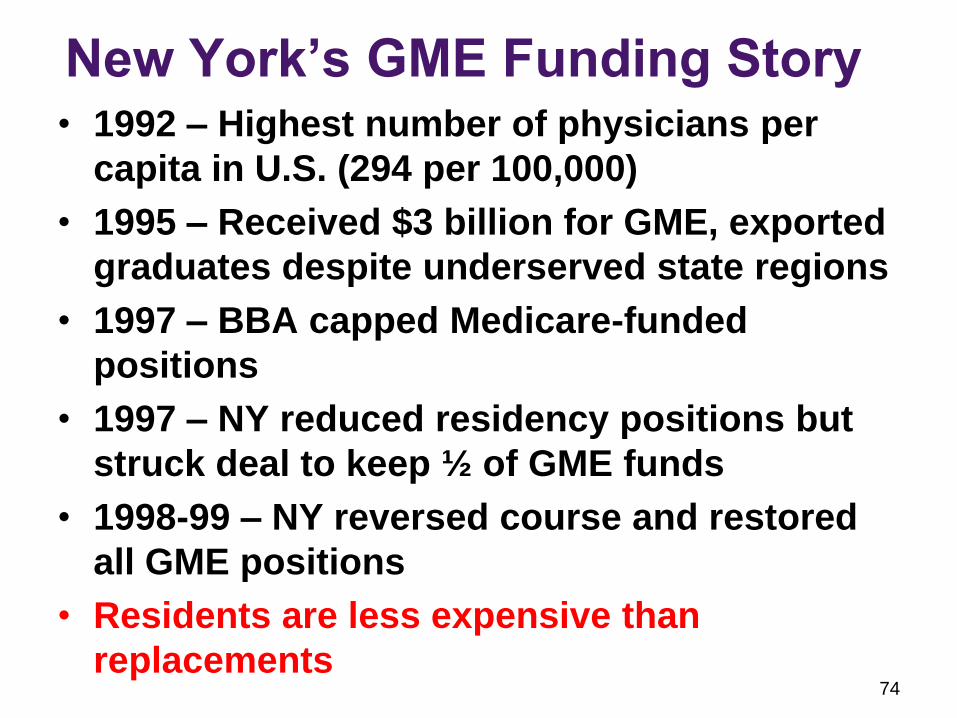
New York’s GME Funding Story • 1992 – Highest number of physicians per
capita in U.S. (294 per 100,000)
• 1995 – Received $3 billion for GME, exported
graduates despite underserved state regions
• 1997 – BBA capped Medicare-funded
positions
• 1997 – NY reduced residency positions but
struck deal to keep ½ of GME funds
• 1998-99 – NY reversed course and restored
all GME positions
• Residents are less expensive than
replacements
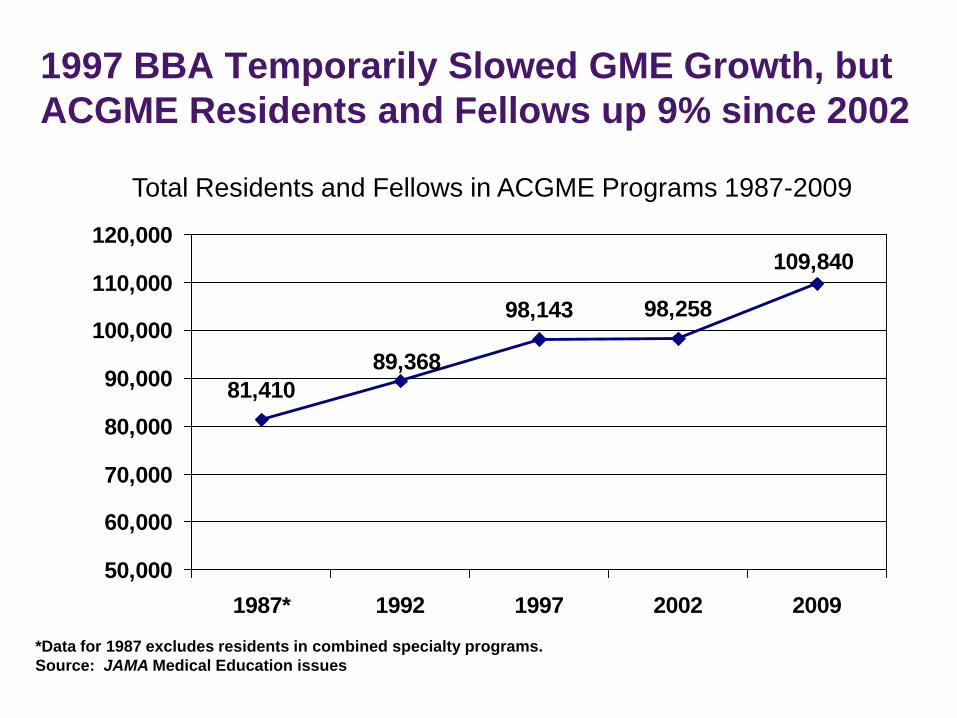
81,410
98,143 98,258
109,840
89,368
50,000
60,000
70,000
80,000
90,000
100,000
110,000
120,000
1987* 1992 1997 2002 2009
*Data for 1987 excludes residents in combined specialty programs.
Source: JAMA Medical Education issues
Total Residents and Fellows in ACGME Programs 1987-2009
1997 BBA Temporarily Slowed GME Growth, but
ACGME Residents and Fellows up 9% since 2002
76
Residents in Training Before and After
the 1997 Balanced Budget Act
• 2002-2007 – number of resident physicians
began increasing (8% net increase)
• Growth of resident physicians (financed by
hospitals) was driven by:
– 7.6% increase in new entrants, mostly
international medical graduates
– increasing subspecialization = longer training;
fewer physicians entering generalist careers
• Residents are less expensive than
replacements
77
IOM Duty Hour Recommendations Would
Have Cost ~ $2 Billion
• Additional staff to handle transitions of
patient care
• Additional residents to cover nap time
• Ensure safe transportation home after long
shifts
• New ACGME standards estimated to cost
$380M
• Residents are less expensive than
replacements
78
Other GME Funding Sources
• Medicaid (annual state appropriations and matching federal payments)
2002 – Medicaid GME funding totaled $2 billion
2008 – Medicaid GME funds less than $2 billion
• Veterans Administration (10% of residents - $1 billion)
• Department of Defense (2,200 residents)
• Private payers (cost shifting is going away)
Drugs &
Devices Hospitals Insurance
Companies
U.S. Spends $2.5 Trillion on
Health Care
80% Medical Loss Ratio
Insurance Companies Could Finance
GME
• Medicare (CMS) already
bears it’s fair share = $9 B
~ 40% of cost
• In 2009, top five health
insurers’ profits = $12.2 B
(up 56%)
• 80% of patient care and
doctor visits occur outside
hospital
• HSR retains private
insurance
• AMA policy advocates all-
payer funding for GME
Insurance
Companies
81
Health Insurers Should Want to Invest in
Physician Education, especially GME
• Access –need competent providers with right
knowledge and skills in right place and time
• Quality – starts with making correct diagnosis
and implementing best therapies
• Medical errors – caused by system failures
• Population outcomes – insurers have data
• Smart medicine is efficient and intellectual
capital would be a good investment