Embed Size (px)
Citation preview

UNIVERSITY OF THE WESTERN CAPE
DEPARTMENT OF ECONOMICS
Graduate unemployment in South Africa: Extent, nature and causes
by
Taryn Joy van de Rheede
(2423517)
A mini-thesis submitted in partial fulfillment of the requirement for the degree of Master of Economics in the Department of Economics,
University of the Western Cape.
Supervisors: Elizabeth Stoltz and Derek Yu
August 2012

i
DECLARATION
I declare that Graduate unemployment: Extent, nature and causes is my own work, that it has
not been submitted for any degree or examination in any university, and that all the sources
that I have used or quoted have been indicated and acknowledged by complete references.
Taryn van de Rheede
Signature:
Date: 20 August 2012

ii
ABSTRACT
The South African economy faces a challenging socio-economic problem of high and
persistent unemployment since the transition. Looking at the unemployment problem in
greater perspective, numerous studies found that it is most serious amongst the youth. Since
the beginning of the 2000s, a few studies focused particularly on youth and graduate
unemployment, but there has been a lack of research in this area in recent years. Hence, this
dissertation aims to fill some gap in the available research by investigating the extent, nature
and causes of graduate unemployment in South Africa.
This study firstly defined the relevant concepts and discussed some theories relevant to
graduate unemployment, before reviewing the results of the past studies on the nature and
extent of graduate unemployment. Thereafter, the possible causes were investigated, such as
lack of experience, lack of soft skills, skills mismatch, poor quality of education of the
graduates, discrimination by employers, etc. Graduate unemployment in India, China and
Europe were also considered, and it was found that graduate unemployment was not in a
unique problem in South Africa.
The study proceeded with an analysis the Statistics South Africa 1995-2010 labour survey
data and conducted more up-to-date statistical analyses of the profile of graduate unemployed.
The results showed that the characteristics of unemployed graduates were, in general, the
same as what was found by the previous studies, as graduate unemployed were more likely to
be female and black, aged 15-34 years at the time of the survey, residing in Gauteng, with
only post-Matric certificates or diplomas, and graduating from the fields of Business /
Commerce / Management, and Education / Training / Development. The Oaxaca-Blinder
decomposition was also applied, and the results indicated that employment discrimination
against black graduates was very likely, after controlling for differences in demographic and
educational attainment blacks and whites. Hence, the results of the empirical analysis showed
that graduate unemployment persists.
Finally, graduate employment elasticity coefficients and employment absorption rates were
derived by educational attainment category, and the results showed that although graduate
unemployment is clearly less serious than unemployment in other educational categories, the
labour demand for graduates is not rapid enough to absorb all the graduates.
KEYWORDS: Graduate unemployment, labour market trends, South Africa

iii
LIST OF ABBREVIATIONS AGR Actual growth rate
BBBEE Broad Based Black Economic Empowerment
BEE Black Economic Empowerment
DPRU Development Policy Research Unit
EAR Employment absorption rate
GDP Gross Domestic Product
HBU Historically Black University
HSRC Human Sciences Research Council
HWU Historically White universities
LFS Labour Force Survey
OECD Organisation for Economic Co-operation and Development
OHS October Household Survey
QLFS Quarterly Labour Force Survey
SET Science, Engineering and Technology
SME Small and Medium-sized Enterprises
Stats SA Statistics South Africa
TGR Target growth rate

iv
TABLE OF CONTENTS
CHAPTER ONE: INTRODUCTION 1
1.1 INTRODUCTION 1
1.2 RESEARCH OBJECTIVES 2
1.3 METHODOLOGY AND ORGANISATION OF THE STUDY 3
CHAPTER TWO: CONCEPTUAL AND THEORETICAL FRAMEWORK 4
2.1 INTRODUCTION 4
2.2 RELEVANT CONCEPTS 4
2.3 TYPES OF UNEMPLOYMENT 6
2.4 THEORIES APPLICABLE TO GRADUATE UNEMPLOYMENT 8
2.4.1 Human capital theory 8
2.4.1.1 The theory 8
2.4.1.2 Criticisms of the human capital theory 9
2.4.1.3 Relevance of the human capital theory 12
2.4.2 The screening / signaling hypothesis 12
2.4.2.1 The theory 12
2.4.2.2 Criticism 13
2.4.2.3 Relevance of the hypothesis 13
2.4.3 Types and theories of discrimination 14
2.4.3.1 Types of discrimination 14
2.4.3.2 Theories of discrimination 15
2.5 CONCLUSION 18
CHAPTER THREE: GRADUATE UNEMPLOYMENT IN SOUTH AFRICA AND IN
A COMPARATIVE CONTEXT 19
3.1 INTRODUCTION 19
3.2 GRADUATE UNEMPLOYMENT IN SOUTH AFRICA 19
3.2.1 The extent of graduate unemployment 19
3.2.2 The nature of graduate unemployment 20
3.2.2.1 Demographic characteristics 20
3.2.2.2 Human capital characteristics 22
3.2.2.3 Duration of job search 27
3.2.3 Causes 28
3.2.3.1 Structural problems 28

v
3.2.3.2 Discrimination 29
3.2.3.3 Quality of education 30
3.2.3.4 Labour market inflexibility 36
3.2.3.5 Lack of experience, language proficiency and soft skills 38
3.3 GRADUATE UNEMPLOYMENT IN AN INTERNATIONAL CONTEXT 40
3.3.1 Graduate unemployment in India 40
3.3.1.1 Extent and nature 40
3.3.1.2 Causes 41
3.3.2 Graduate unemployment in China 43
3.3.2.1 Extent and nature 43
3.3.2.2 Causes 44
3.3.2.3 Underemployment 46
3.3.3 Graduate unemployment in Europe 46
3.3.3.1 Extent and nature 47
3.3.3.1 Causes 48
3.3.3.3 Underemployment 49
3.3.4 International comparative overview 49
3.4 CONCLUSION 51
CHAPTER FOUR: GRADUATE UNEMPLOYMENT: 1995-2010 53
4.1 INTRODUCTION 53
4.2 METHODOLOGY 53
4.2.1 Data 53
4.2.2 Advanced analysis 54
4.3 DESCRIPTIVE STATISTICS 55
4.3.1 The extent of graduate unemployment 55
4.3.2 The nature of graduate unemployment 57
4.3.2.1 Demographic characteristics 57
4.3.2.2 Human capital characteristics 62
4.3.2.3 Previous work experience 68
4.4 MORE ADVANCED ANALYSIS 68
4.4.1 Econometric analysis 68
4.4.2 Oaxaca-Blinder decomposition 71
4.4.3 Jobless growth 75
4.4.4 Graduate employment coefficient 76
4.4.5 Graduate employment absorption rate 77
vi
4.4.6 Graduate under-employment 78
4.5 CONCLUSION 79
CHAPTER FIVE: GENERAL CONCLUSIONS 81
BIBLIOGRAPHY 84

vii
LIST OF TABLES Table 3.1 Breakdown of tertiary unemployment by type of qualification 24
Table 3.2 Breakdown of tertiary unemployment by field of Study, 2000-2005 25
Table 3.3 Trends in unemployment rates by educational attainment across OECD countries (tertiary
education, 2000-2004) 47
Table 3.4: Causes of graduate unemployment in South Africa, India, China and Europe 50
Table 4.1: Number of graduate unemployed 56
Table 4.2: Racial share of unemployed graduates 59
Table 4.3: Age cohort share of unemployed graduates 60
Table 4.4: Gender share of unemployed graduates 61
Table 4.5: Provincial share of unemployed graduates 62
Table 4.6: Unemployment rates by educational attainment 63
Table 4.7: Proportion of graduate unemployed in each field of education category 67
Table 4.8: Previous worked experience of graduate unemployed 68
Table 4.9: Probit regressions on likelihood of labour force with post-Matric qualifications to be
employed 69
Table 4.10: Oaxaca-Blinder decomposition of employment likelihood of graduates, Whites vs. Blacks
73
Table 4.11: Target growth rates, actual growth rates, employment absorption rates by educational
attainment 78
viii
LIST OF FIGURES Figure 4.1: Graduate unemployed as a proportion of all unemployed 57
Figure 4.2: Graduate unemployment rates by race 58
Figure 4.3: Proportion of graduate unemployed who were younger than 35 years at the time of survey
60
Figure 4.4: Unemployment rates by educational attainment 64
Figure 4.5: Unemployment rates of the graduates 65
Figure 4.6: Proportion of graduate unemployed who are Black by type of education 65
Figure 4.7: Marginal fixed effects of each race dummy variables in the probit regressions (reference
group: Blacks) 71
Figure 4.8: Marginal fixed effects of Degree dummy variable in the probit regression 71
Figure: 4.9 Oaxaca-Blinder decomposition (assuming you suspect that employers discriminate against
Black graduates) 72
Figure 4.10: Oaxaca-Blinder decomposition of employment likelihood of graduates, Whites vs.
Blacks 74
Figure 4.11: Comparison of Real GDP and the number of graduate unemployed 75
Figure 4.12: Comparison of Real GDP and the Graduate unemployment rate 76
Figure 4.13: Employment coefficient by educational attainment 77
Figure 4.14: Employment Absorption Rate by educational attainment 78
Figure 4.15: The proportion of employed who are under-employed, by educational attainment
category, QLFS 2010 Q2 79
1
CHAPTER ONE: INTRODUCTION
1.1 INTRODUCTION
The South African economy experienced a structural shift in recent years, away from the
primary and secondary sectors towards the services or tertiary sectors. This is a natural
phenomenon for any developing economy and, as a result, there has been a notable increase in
the demand for skilled at the expense of unskilled labour (Pauw, Oosthuizen and Van der
Westhuizen 2006:4). On the other hand, the ongoing globalisation of the world economy,
together with stronger competitive pressures, had adjustment costs in the form of job losses.
The country’s competitive position is adversely affected by the shortage of skilled labour as
well as emigration of highly skilled workers, together with a weak level of human resource
development (Barker 2007:148). As a result, in recent year, huge public and private
investment have been made in tertiary education, while increased access to higher education
institutions has been an important strategy of the South African government to create a more
skilled labour force. This resulted in an increasing rate of labour force participation by
graduates in recent years. Despite this, the economy suffers from a serious lack of skills that
constrains the prospects for economic growth and job creation.
The term graduates generally refer to individuals with any type of post-matriculation or
tertiary qualification. A tertiary qualification may include different kinds of qualifications
from a variety of institutions, technikons as well as universities, as a result of which output is
varied according to field of study, entry requirements, length of study, real and perceived
quality of the qualification, etc. The growth of joblessness amongst tertiary educated
individuals in South Africa stands in sharp contrast to the above-mentioned shortage of highly
skilled labour. According to MacGregor (2008:1), unemployment among graduates grew from
6.6% in 1995 to 9.7% in 2005 and, although it remains low relative to overall unemployment,
it increased by almost 50% between 1995 and 2005, making it the fastest growing section of
the unemployed in South Africa.
From the literature it is clear that the nature of graduate unemployment is complex and relates
to various factors such as the quality of education, lack of experience, discrimination, labour
market inflexibility and other structural elements. For example, it is evident that the rates of
unemployment differ considerably between graduates from different race groups. In 1995 the
unemployment rate amongst African graduates, at 10.1 per cent, was four times that of
2
Whites. This number further increased to more than six times higher in 2004 (Oosthuizen
2006:41). Graduate unemployment is also most prevalent among graduates from historically
Black institutions. This may be related to statistical discrimination, where employers
discriminate because of a perception that on average workers from certain groups are less
productive. Furthermore, there is evidence of a skills mismatch, where graduates accumulated
human capital in fields of expertise that are not in demand by employers (such as humanities,
teaching and nursing). This may be the result of impaired access to studies in medical and
natural sciences as well as engineering courses. Some graduates also lack soft skills, such as
general communication skills, presentation skills, financial management skills, time
management skills or creative thinking skills. Pauw et al. (2006:26) claim that graduates may
have relatively high reservation wages and expect their qualifications to immediately open
doors at middle management level. They are often unwilling to start at entry level.
The problem of graduate unemployment is not unique to South Africa. The problem exists in
both emerging and developed countries and is thus a universal issue. However, whilst the
South African government is taking youth unemployment very seriously, their focus is not
specifically on graduate unemployment and research on this topic is rather limited. Primarily,
research specifically focused on graduate unemployment in South Africa was done by the
Development Policy Research Unit (DPRU) and the Human Sciences Research Council
(HSRC) covering the period 1995 - 2005. There are vey few studies on youths in the labour
market after this date.
The research problem thus relates to the problem of graduate unemployment in South Africa:
its extent, specific nature and causes in a dynamic context. The study investigates underlying
supply and demand as well as institutional and global factors that determine outcomes in the
market for graduates.
1.2 RESEARCH OBJECTIVES
More specific objectives of the study are:
To lay down the necessary conceptual and theoretical framework as the basis for the
study on graduate unemployment;
To present a descriptive overview of the literature related to findings of earlier studies
on the problem of graduate unemployment in South Africa;
To present a comparative overview of the problem in an international context;
3
To conduct a more advanced analysis, using later data, also using more than one data
source as well as more sophisticated analytical techniques to assess the current
situation.
1.3 METHODOLOGY AND ORGANISATION OF THE STUDY
The nature of the methodology is qualitative, quantitative and analytical. The study presents a
descriptive overview of the literature on the graduate unemployment problem. A comparative
overview is presented of empirical evidence from some selected countries. In order to analyse
the latest data sources, descriptive statistics and other relatively advanced econometric
techniques were used, and tables and graphs were constructed from the following secondary
sources: Stats SA (October Household Survey, Labour Force Survey and the Quarterly
Labour Force Survey) and the South African Reserve Bank Quarterly Bulletin data.
This study is divided into five chapters. Chapter One introduces the topic, explaining the
objectives and structure of the study. Chapter Two presents the conceptual and theoretical
framework, focusing specifically on some relevant terminology, on the human capital theory,
the screening hypothesis and various theories of discrimination. Chapter Three presents a
literature review of the problem in the South African context together with some empirical
evidence from other countries. Chapter Four updates knowledge and information on the South
African case by investigating graduate unemployment between 1995 and 2010. Chapter Five
presents the conclusions of the study.

4
CHAPTER TWO: CONCEPTUAL AND THEORETICAL FRAMEWORK
2.1 INTRODUCTION
This chapter presents the conceptual and theoretical framework which will serve as the
foundation for the study of the problem of graduate unemployment in South Africa. It will
firstly defines the relevant terminology and then presents a descriptive overview of the
relevant theories, such as the theory of human capital, the screening/signalling hypothesis as
well as the different types and theories of discrimination.
2.2 RELEVANT CONCEPTS
Discrimination: in an economic sense it exists “…when female or minority (i.e. black
workers – who have the same abilities, education, training and experience as white
male workers – are accorded inferior treatment with respect to hiring, occupational
access, promotion, wage rate, or working conditions.”, (McConnell et al, 2006:428 as
referred to in Barker 2007: 229). It is the valuation in the market place of personal
characteristics of the worker that are unrelated to worker productivity (Riley and
College 2006:1).
Employment elasticity of economic growth (employment coefficient): the sensitivity or
the degree of responsiveness of employment to changes in economic growth (Barker
2007:44). In this study it will refer to the extent to which graduate employment will
change as a result of changes in economic growth.
Employment gap: the difference between employment of comparable groups at a
specific period of time due to economic circumstances or choice (Brooks and Hinks
2004: 575). In the case of graduate unemployment, it is important to investigate the
factors behind such any employment gap.
Employment growth rates:1
o Actual growth rate (AGR): the rate of employment growth in the labour market
over a period (Oosthuizen and Bhorat 2004:7).
1 The formulas to calculate AGR, TGR and EAR will be presented in section 4.4. In addition, these ratios will be calculated to determine the extent of graduate unemployment.

5
o Target growth rate (TGR): the extent to which employment would have had to
grow to provide jobs for all net entrants into the labour market over a specific
period (Oosthuizen and Bhorat 2004:7).
o Employment absorption rate (EAR): the ratio between the target rate and the
actual employment growth, expressed as a percentage. The closer the
employment absorption rate is to 100, the actual growth rate is to the desired
employment performance (Oosthuizen and Bhorat 2004:7).
Human capital: Filer, Hamermesh and Rees (1996:84) define human capital as “…all
acquired characteristics of workers that make them more productive”. It is a general
term used for the accumulation of education and other human capacities that can raise
productivity (Todaro and Smith 2006:369). It is relevant for this study because
graduates have invested in tertiary education and training to enhance their stock of
human capital.
Jobless growth has two definitions:
- Firstly, it occurs when economic growth takes place, but the number of
unemployed increases (Altman 2003:12).
- Secondly, jobless growth can also occur when economic growth is
complemented with an increasing unemployment rate (Altman 2003:12).
Labour market rigidity (or inflexibility): the extent to which an enterprise’s
productivity is constrained because it is prevented from adjusting aspects of its work
or workforce to “…technological transformation, changing economic circumstances,
external shocks and more intense international competition” (Barker 2007:127). The
rigidities of the South African labour market may impact on the employment prospects
of graduates.
Reservation wage: the value of leisure if the person is not working (Filer, Hamermesh
and Rees 1996: 12). It is the minimum wage that an individual will accept, considering
the expenses and other factors such as travelling and the nature of the work, impacting
on the decision to accept the wage. Christensen (2002: 4) states that it is the wage
demand of unemployed individuals.

6
Underemployment can be visible or invisible:
o Visible underemployment refers to a person who works for less time than what
is considered normal as per the respective job and who is seeking or who
would want to work additional hours or full time (Pollack 1997:19).
o Invisible underemployment refers to the inefficient allocation of human
resources, when people earn lower incomes than expected by their
qualifications. They carry out tasks that require a lower level of educational
attainment than they actually possess (Pollack 1997:19).
Unemployed: This includes all people who are 15 years and older, who are without
work, but who are available for work and who are job searching (Barker, 2007:174).
Stats SA distinguishes between two definitions, the strict (narrow) and the expanded,
(broad)2 when determining the extent of unemployment:
o Strict definition: the unemployed are those people who are part of the labour
force who (a) did not work seven days prior to the survey interview; (b) were
available and wanted to start work within a week of the survey interview and
(c) took active steps to look for work in the four weeks prior to the survey
interview (Kingdon and Knight 2000:4).
The strict definition is the official one used by Stats SA.
o Expanded definition: This refers to unemployed people who meet the first two
criteria above but who have not taken active steps to seek work (Kingdon and
Knight 2000:4). This definition captures discouraged individuals and those
without the resources to search for jobs.
Unemployment rate: the unemployed as percentage of the economically active
population (or labour force), which includes the employed and unemployed.
2.3 TYPES OF UNEMPLOYMENT
In order to investigate the nature of graduate unemployment in South Africa, it is necessary to
distinguish between the different types.
Frictional unemployment “…arises as a result of normal labour turnover that occurs in
any dynamic economy and the time lags involved in the re-employment of labour.’’
(Barker 2007:176). Ehrenberg and Smith (2009:503) mention that frictional
2 In the remainder of the dissertation only the terms strict and expanded will be used.

7
unemployment will exist even in a situation of full-employment or market equilibrium
situation because some people will always be between jobs. There may be
unemployed graduates as well as vacancies at the same time, as people are moving
between jobs and others enter the labour market for the first time. This type of
unemployment is usually of short duration and is a function of labour market
information.
Cyclical unemployment occurs during periods of recession when aggregate demand
and the derived demand for labour are low (Barker 2007:177). During an economic
downturn this time few or no jobs are created for new entrants to the labour market.
Demand/deficient unemployment occurs because the level of aggregate expenditure in
the economy is insufficient to provide employment opportunities for all labour market
participants (Bosworth, Dawkins and Stromback 1996:410). When graduate
unemployment increases during periods of economic downturns and decreases during
boom periods, the nature of the unemployment is cyclical.
Structural unemployment refers to the overall inability of the economy, due to
structural imbalances, to accommodate the total labour force even at the peak of the
business cycle (Barker 2007:177). It also refers to a skills mismatch between the fields
of education supplied by graduates and those demanded by employers. Therefore,
there is a difference between the skill that the employers require and those that
employees offer.
Seasonal unemployment occurs due to "normal and expected changes in economic
activities during the course of a single year" (Barker 2007:177). This type occurs on a
regular and predictable basis and although found in various sectors, it is especially
relevant in the agriculture and retail trade. Bosworth et al (1996:410) adds that
seasonal unemployment refers to the component of unemployment with a 12 month
cycle. Furthermore, it arises because of variations in product demand and the timing of
labour inputs over the year.
Although all types may be relevant in the case of graduates, structural and cyclical
unemployment seem predominantly to affect graduates.
8
2.4 THEORIES APPLICABLE TO GRADUATE UNEMPLOYMENT
The following sub-sections give a brief descriptive overview of the human capital theory, the
screening hypothesis as well as various theories of discrimination.
2.4.1 Human Capital Theory
2.4.1.1 The theory
The theory of human capital explains the positive relation between educational qualifications
and higher earnings over the working life of a person as a result of which a person will invest
in education. The basic premise of the theory is that education and training augment an
individual's stock of human capital and therefore increase that person's productive potential.
This, in turn, leads to higher earnings. The human capital theory claims that education
increases the productivity of workers. It does so through increased knowledge and skills and
therefore augments the workers’ future income by increasing their lifetime earnings (Xiao
2001:2). Barker (2007:206) adds that education and training provide not only immediate
benefits such as subjective satisfaction and status, but also long-term monetary benefits
through higher earnings. Filer et al. (1996:90) claim that people with more education
typically have higher age-earnings profiles with later peaks and steeper age-earnings than
those with less education.
It is however the case that the more educated workers occasionally start out with lower
earnings than those with less education, but quickly overtake the less educated and enjoy
higher earnings on average over the rest of their working lives. In addition to higher earnings,
Ehrenberg and Smith (2009: 281) mention that with an investment in education, there is an
expectation of increased job satisfaction over individuals' lifetime and a greater appreciation
of nonmarket activities and interests. According to Barker (2007:208), such investment will
result in sharp improvements in the earnings and, therefore, standards of living of workers in
the labour market, without causing inflation, because of the higher productivity of workers.
Given this and the option of higher earnings over a lifetime, why would a person then not
invest in further education? The fact is that there are direct (class fees, books, living expenses)
as well as indirect costs (in terms of earnings forgone) involved in improving education as
well as psychic costs (occurs because learning is often difficult and tedious) (Ehrenberg and
Smith 2009: 281). Todaro and Smith (2006:363) state that the envisaged income gains from
education must be compared with the total costs incurred to understand the decision to invest

9
in further education. Both the costs and the benefits, some of which will only accrue much
later in the person’s life, need to be considered to determine the rate of return on the
investment in education.3
The rate of return is determined by calculating the present discounted value of the increased
income stream made possible by these investments and then comparing it with their direct and
indirect costs. Stroomberger, Rote and Nana (2002:3) also claim that the interest rate used to
measure the present value of an expected future stream of benefits needs to take account of
both the individual’s time preference and the uncertainty inherent in any assessment of
expected future benefits. Thus the opportunity cost of investing in education can be
determined by a range of variables of interest to the individual, which need to be measured.
These opportunity costs are beyond the foregone income.
The human capital theory assumes that people are utility maximisers and take a lifetime
perspective when making decisions about investing in education (Ehrenberg and Smith 2009:
283). In the long run human capital theory suggests that skilled workers will be supplied at
that wage which compensates them for the costs of attaining those skills (Bosworth et al
1996:14).
2.4.1.2 Criticisms of the human capital theory
Measurement: The measurement of human capital is complex by nature. To calculate the
effect education and training have on productivity, the education and training as well as the
productivity of the individual need to be measured. How would this quality and quantity of
education and training be measured? Years of educational attainment are not an indication of
the quality of education and training (Barker 2007:209). Additionally, there is the problem of
measuring both worker productivity and the future income attached to the respective career,
which the theory fails to explain (Marshall 1998:1).
An individual may also be poorly educated relative to the market. This can occur if skills are
out-dated or if character or culture is not conducive to profit gain. Thus human capital levels
are by definition low, since they constitute small increases in productivity (Darwin 2010:2).
Consequently, one cannot assume that because of increased years of education, the individual
is necessarily more productive in the workplace. The extent to which these factors inhibit
productivity are immeasurable.
3 See Filer, Hamermesh and Rees (1996: 91-103) for a detailed discussion on the decision to invest in education.
10
Ability and Attributes: Graduates with the same level of educational attainment may have very
different abilities. Workers with the necessary abilities attain higher educational qualifications
and it is therefore ability, not necessarily educational qualifications, which is rewarded with
higher earnings (Barker 2007:209). If this is the case, increases in educational spending would
not necessarily lead to increases in productivity and higher earnings over a person’s lifetime.
As a result of an innate inability to acquire the necessary skills to find employment, many
students will initially invest in education but then fail to attain their qualifications, or fail to
procure employment.
The human capital theory does not distinguish between actual human capital and the attributes
of individuals, which both influence the graduate’s ability to perform productively. Failing to
distinguish between these, means in the context of the theory of human capital that those
attributes seen as improvements in the qualitative nature of the factor labour are in reality
‘enhancements’ of labour power (Krul 2010:1). These attributes determine the extent to which
graduates are able to successfully apply their knowledge and function efficiently in terms of
personal skills in the workplace. Therefore the attributes of graduates are pivotal in explaining
their employability. Stroomberger et al. (2002:5) state that knowledge, skills, competencies
and attributes embodied in individuals, facilitates the creation of personal, social and
economic wellbeing.
Family background and financial status: Both these factors could lead to higher educational
qualifications and then to higher earnings, without there being a direct relationship between
education and earnings. Family background and financial status could facilitate entrance to
certain higher-paying occupations, which might otherwise have been more difficult to access
(Barker 203:249). According to Schugurensky (2010: 3), these social forces prevent people
from having equal access to employment despite their skill and experience. For this reason
graduates who may be better suited for a job and who may be more productive, would have a
greater chance of being unemployed if they do not have the necessary contacts or status. This
may be of particular relevance in the South African context as referred to in Chapter 3.
Change of demand for human capital: The human capital theory does not consider the fact
that the labour market changes over time which affects the specific human capital that is
demanded. The changing structure of final demand and level of labour productivity change as
a country develops (Stryker, Cassim, Rajaratnam, Bhorat, Leibbrandt and Plunkett 2001:27).
11
It is impossible to accurately predict future labour market needs (Schugurensky 2010: 3).
Organizations value particular skills and what these skills are often changes over time. There
are not necessarily better skills, just ones that fit the needs of the organization at the time. For
this reason graduates may study in fields of education which, once they enter the labour
market, are no longer in demand.
In order to keep up with the changing needs of employers, individuals tend to over-invest in
education. Work has not become more complex; in fact, with technology it should have
become easier (Schugurensky 2010: 3) The need to improve one's skills comes from having to
compete in a job market with people who are in many cases over-qualified (Schugurensky
2010: 3). The human capital theory does not consider that over time the encouragement to
invest in education can result in a market of over-qualified labour. This over-qualification
results in it taking longer to gain the return on investment in human capital as the qualification
is not met by an appropriate job. A market of labour with inflated qualifications may cause
that those with an adequate qualifications to perform the job remain unemployed because the
playing field is not level.
Quality of education: According to Fedderke (2005:38), “...a crucial finding is that it is the
quality of human capital rather than the quantity of human capital that is an important
determinant of employment, which the human capital theory does not take cognisance of.
Policy on education cannot focus simply on a quantity dimension.” Investment in human
capital offers a means of improving growth performance, provided that we recognize that the
impact is one that is manifest in the long run and that requires close attention to quality
education as well as widening access to education. In Chapters Three and Four it is shown
that the quality of education largely determines the probability of finding employment. This
means that increasing access and the level of education is not necessarily a true signal of the
employability and productivity of the graduate.
The existence of graduate unemployment thus contradicts this positive relation between
investment in education and higher productivity as well as higher earnings. Employment is
not guaranteed and the expected rate of return is not achieved. The theory assumes that
through investment in education, productivity also increases. However, there are other factors,
such as an inborn ability, which are not considered that lead to increased productivity.
Likewise, increased education does not necessarily result in augmented productivity.

12
2.4.1.3 Relevance of the human capital theory
The human capital theory has been used to motivate and justify massive investments in
education as a tool to enhance economic development and growth. However the expected
future benefits from this investment are undetermined as graduates are not guaranteed to find
employment or at least employment which is equivalent to their investment in education. The
mere existence of graduate unemployment contradicts the prediction of the human capital
theory. Instead of being able to increase productivity and earnings, graduates who have
invested in education are unemployed. Some may even be over-qualified in comparison to
what the market wants.
Furthermore, the model implies that the person, once leaving school or graduating, will
immediately be employed and will continuously be employed over the years until retirement.
However, it is possible that the person would only find a job few years after leaving school or
graduating. Also, the person could be suddenly unemployed during a certain period. For
instance, the person’s skills become obsolete and he/she might need to attain training to
upgrade his/her skills, before having a chance to be employed again.
2.4.2 The screening / signalling hypothesis
2.4.2.1 The theory
The screening/signalling hypothesis, like the human capital theory, also encourages
investment in education. It proposes that education plays a filtering role which conveys much
needed information to the economic agents in the markets. Arrow (1973:194) states that
higher education serves as a screening device, in that it sorts out individuals with different
abilities, and thereby conveys information to employers”. However, human capital theory is
focused the role of learning in determining the return on schooling, whilst screening models,
while allowing for learning, focus on the ways in which education serves as a signal for
productivity differences (Weiss 1995:135). Lee, Thakor and Vora (2004:1507) confirm that
signalling eliminates information asymmetry.
Spence's (1973, 1974) work on market signalling is one of the first treatments of incomplete
information (Kubler, Muller and Norman 2003:4). This presupposes that one market
participant may hold private information that for some reason cannot be verifiably revealed,
and which affects the other participants’ incentives (Horner 2006:1). However an employer
can observe certain indicators that are positively correlated with productivity, such as age,
experience, education and other personal characteristics (Ehrenberg and Smith 2009:307).

13
Bosworth et al. (1996: 316) mention that additional indicators such as appearance and
presentation as well as aptitude and ability tests can provide a substantial amount of
information.
A particularly important reason why workers may invest in education is that it may serve as a
signal to potential employers (Kubler et al. 2003:4). Consequently, students will choose a
length of schooling to signal their ability to employers, and employers will demand a
minimum level of education from applicants in order to screen their workers (Weiss
1995:134). The productivity and ability of a potential employee are not publicly observable,
but diplomas and degrees are. The potential employers cannot observe the ability of the
workers, but they know that investing in education is cheaper for highly able workers.
Therefore, education serves as a credible signal of unobserved productivity and it is rewarded
with a higher wage.
Moreover, Filer et al. (2006:104) state that educational attainment sorts individuals with traits
that employers find attractive into those jobs that pay higher wages. Years spent in college
may be a way of signalling to employers that the graduates have the self-discipline,
motivation and ability to perform well on the job. On the other hand, the screeners argue that
the attainment of human capital may have the same apparent effect on earnings, either
because the productivity linkage is a valid one, or because it is the instrument through which
the effect of some other background variables are transmitted (e.g., family background).
2.4.2.2 Criticism
The screening/signalling theory assumes that education is homogeneous. Therefore signals
may be misleading and do not accurately reflect the productivity of the graduate. Among
other information asymmetries, employers are therefore not sure of the productive capabilities
of a potential employee at the time of hiring. Nor will this information become available
immediately after hiring. Using the level of education as a proxy serves as an effective tool to
circumvent information asymmetries; nevertheless, there are other factors which should to be
considered when determining a graduate’s level of productivity.
2.4.2.3 Relevance of the hypothesis
The screening hypothesis hold, Filer et al (1996: 105) claimed that the investment in
education may generate a relatively high private return when those who have invested and
acquired the education enjoy the higher earnings.

14
However, should the level of educational attainment be used as a screening device, it will
keep people out of jobs when the specific requirement for the job is wrongly pitched. This
may be relevant in the case of graduate unemployment.
2.4.3 Types and theories of discrimination
Due to discrimination graduates may experience varied probabilities of finding employment.
For this reason certain graduate cohorts are more likely than others to be unemployed.
Various types of discrimination exist which may be relevant to the problem of graduate
unemployment. On the other hand, various theories of discrimination may also enhance a
deeper understanding of the problem.
2.4.3.1 Types of discrimination
Barker (2007:275) distinguishes between three types of possible labour market
discrimination. The first type of discrimination – human capital discrimination – is referred to
as before-the-market discrimination as it occurs before the individual seeks employment or, in
the case of on-the-job training, before the individual is fully productive in the labour market.
The remaining two types of discrimination – employment and occupational discrimination –
are referred to as within-the-market discrimination, because they are encountered after the
individual has entered the labour market:
Human capital: This implies discrimination in respect of education and training, which could
include impaired access or inferior quality (Barker 2007: 229). Inequalities persist in terms of
access to quality tertiary education in South Africa. This variation in quality, which may be
real or perceived, can impact on the employability of graduates. In addition, the requirements
to access quality institutions are high, while discrimination stems from the low standards of
certain secondary institutions, which do not deliver on the criteria necessary to gain access to
higher education institutions.
Employment: Some groups bear a disproportionate share of the burden of unemployment
(Barker 2007: 229). For instance, if 99% of the cashiers of a big retail store are females
because the owner of the store discriminates against hiring males as cashiers (despite the fact
that the male applicants meet the necessary skills requirements for the vacancy), this is
defined as employment discrimination.

15
Occupational: This type of discrimination occurs when the type of occupation influences the
discrimination coefficient of the employer (Filer et al 1996:537). As a result of occupational
discrimination, specific groups may be under-represented in skilled occupations, although
they are as capable as other groups and also have the necessary qualifications (Barker
2007:275). The discrimination model of occupational crowding provides more detail on this
type of discrimination.
2.4.3.2 Theories of discrimination
(a) Becker’s ‘taste for discrimination’
The most prominent theory of discrimination is based on the work of Gary Becker in 1957. In
According to this model employers have a ‘taste for discrimination,’ implying that there is a
disamenity value to employing ‘minority group’ workers (Autor 2003:3). No justification is
given as to why this prejudice exists. Instead it is assumed that there is a ‘taste’ or preference
to avoid employing people from disadvantaged groups. Hence, minority workers may have to
‘compensate’ employers by being more productive at a given wage or by accepting a lower
wage for equal productivity.
In the taste-based theory, some economic actors prefer not to interact with a particular class of
people and are willing to pay a financial price to avoid such interactions. Each employer’s
taste for discrimination is measured by the wage that the employer would offer a minority
worker compared to that of a majority worker (Filer et al. 1996:530).This is confirmed by
Riley and College (2006:1), who state that discrimination arises because employers and
workers have a distaste for working with people from different ethnic backgrounds, or final
customers dislike buying from salespeople of different races.
Regardless of this, discriminatory employers see value in their discrimination and
consequently Becker introduced the taste parameter of employers. This parameter he called
the coefficient of discrimination, which explains that when employers are prejudiced the
coefficient will take on a positive value (Autor 2003:3).
A denotes the majority group and B denotes the minority group, and let d be the coefficient of
discrimination and W indicates the wage of the respective groups. Employers who are
prejudiced (d >0) and have a positive discrimination coefficient, will act as if the wage of b
group members is ).( dWb Hence, they will only hire b group members if .)( dWW ba

16
To summarise: if employers have a positive coefficient of discrimination, they have a taste for
discrimination which is based on prejudice. Graduates may be affected by such
discrimination, which may result in the minority graduates having to ‘compensate’ employers
by being more productive at a given wage or accepting a lower wage for equivalent
productivity. This is highly unrealistic in the South African context where wages are rigid
downwards.
(b) Statistical discrimination
"Statistical discrimination can be viewed as a part of the screening problem that arises when
observable personal characteristics that are correlated with productivity are not perfect
predictors" (Ehrenberg and Smith 2009: 421). In models of statistical discrimination,
economic actors have no animus (unlike taste-based models), but discrimination nonetheless
arises (Autor 2003:2). This discrimination is based on either (1) signals of ability are less
informative within that group or (2) in the presence of human capital investment, equilibria
exist in which negative prior beliefs about members of a particular cohort become rewarding.
The premise of this theory of discrimination is that firms have limited information about the
skills of job applicants. This gives them an incentive to use easily observable characteristics
such as race or gender to infer the expected productivity of applicants (if these characteristics
are correlated with productivity). Statistical discrimination therefore provides a rationale
behind which employers with no taste for discrimination might discriminate in favour of
particular groups and against others. Under circumstances of asymmetric information it is
rational for employers to take account of personal characteristics in hiring decisions. However
this has the effect that wages and employment of particular groups are below the levels what
it would have been, had they been given equal treatment (Bosworth et al. 1996:335).
In the labour market it may be too costly for employers to obtain sufficient information to
make accurate inferences about the productivity of each prospective employee (Bosworth et
al 1996:335). Furthermore Ehrenberg and Smith (2009: 422) states that firms can legitimately
use both individual data (test scores, educational attainment, experience) and group data when
the former is not an accurate predictor of productivity. Nonetheless the use of group data may
result in discrimination because people with the same productive characteristics (test scores,
education, etc) will be treated differently depending on the group they affiliated with. If
statistical discrimination is not derived from prejudice, then employers will show evidence of

17
learning (relying less on group affiliation) as more accurate information on individuals
become available (Ehrenberg and Smith 2009: 422).
In summary, due to asymmetric information firms use observable characteristics such as race
and gender to determine employment prospects. Therefore graduates from particular groups
are less likely to be employed regardless of their actual potential.
(c) Transaction cost model
This model may be relevant to explain labour market outcomes for cultural, ethnic and
linguistic minorities (Filet et al, 1996: 542). According to Barker (2007: 232) employers may
encounter higher costs to restructure the workplace, because African workers have their own
languages and culture and often lower educational qualifications. In this model, there are
transaction costs within a firm when some members of the firm have to learn the language of
other members; this can also refer to differences in proficiency (Hellerstein and Neumark
2002: 24).
Additional training and other courses may be necessary to accommodate these differences
which will increase the cost of labour. Another example of transaction cost may be in the
mining sector, an area not traditionally suited for woman. It may be necessary to provide
special facilities to cater for the needs of woman. The transaction cost of employing blacks or
woman may result in discrimination.
(d) Occupational crowding model
According to the crowding model graduates are sorted into two groups, based on factors other
than their productivity, and then allocated between two markets (Bosworth, Dawkins and
Stromback 1996:334). The crowding models emphasise historical and discriminatory forces
that have limited the mobility of black graduates into some job markets, while crowding them
into others (Hirsch and Schumacher 1991:15). Occupational crowding results in an increase in
labour supply into a specific occupation and depresses equilibrium wages for both white and
black workers in crowded job markets (Hirsch and Schumacher 1991:1516).
In general crowding models are more applicable to the position of woman in the labour
market, in which case perceptions changed slowly. For example, woman should be secretaries
and primary school teachers, but not engineers, pilots and CEO’s of large corporations.

18
2.5 CONCLUSION
This chapter firstly presented some basic concepts related to labour market issues in general,
but that are important for the investigation into the problem of graduate unemployment in
South Africa. The theoretical framework highlighted three main theories pertaining to
graduate unemployment. The human capital theory maintains that by investing in education,
labour productivity will be enhanced and this increased productivity will result in higher
earnings over the person’s lifetime. The screening/signalling theory is built on the premise
that the educational level transmits a signal to employers about the level of productivity of the
candidate. This signal therefore eliminates information asymmetry. Both these theories
encourage investment in education and explain the rationale behind graduates' decisions to
invest in further education and training.
However, there are points of criticism against the theories. For example, a person’s
productivity may be a function of innate ability. Furthermore, employers value factors beyond
just the level of education, as a result of which certain graduates are more employable than
others, regardless of the fact that they may have the same level of education.
Various theoretical models of labour market discrimination (‘taste’ for discrimination;
statistical; transactions cost and occupational crowding) were also discussed. The literature
overview of Chapter Three and the more advanced analysis of Chapter Four will investigate
whether any of these theories are relevant in the case of graduate unemployment in South
Africa.

19
CHAPTER THREE: GRADUATE UNEMPLOYMENT IN SOUTH AFRICA AND IN
A COMPARATIVE CONTEXT
3.1 INTRODUCTION
This chapter reviews the literature on graduate unemployment in South Africa. Its key focus is
on understanding which graduates are most likely to be unemployed and the factors (such as
structural elements, market inflexibility and discrimination) leading to graduate
unemployment. It draws on existing studies which predominantly analysed trends for the
period 1995 to 2005. Additionally, a comparative overview is done to explore the extent,
nature and causes of graduate unemployment in international context.
Section 3.2 presents a descriptive overview of the extent, specific nature and causes of the
graduate unemployment problem in South Africa. Section 3.3 focuses on graduate
unemployment in an international context and determines if graduate unemployment is unique
to South Africa. Finally 3.4 will conclude the chapter.
3.2 GRADUATE UNEMPLOYMENT IN SOUTH AFRICA
3.2.1 The extent of graduate unemployment
Mac Gregor (2008:1) claims that graduate unemployment rate increased from 6.6% in 1995 to
9.7% in 2005. Consequently graduate unemployment shows an overall increasing trend in
South Africa for this period. Although graduate unemployment remained low relative to
overall unemployment, with graduates amounting to only 2.6% of the unemployed, their
actual unemployment figure rose by 51.2% for the period 1995 and 2005 compared to 26% in
national unemployment overall for the same period (Feathermen, Hall and Krislov 2010:139).
Therefore graduate unemployment is the fastest growing type of unemployment in South
Africa since 1995.
In the study by Oosthuizen (2006), he found that the unemployment rate for this cohort in
particular increased from 6.6 % in 1995 to 14.6% in 2002 and then decreased to 10.4% in
2004. This is a statistically significant increase highlighting the severity of graduate
unemployment. In 2004, approximately 204 000 members of the labour force with tertiary
education were unemployed, representing less than 2.6% of the unemployed (Oosthuizen
2006:40). Graduate unemployment is concentrated amongst graduates with certain

20
demographic characteristics and who have attained particular types and fields of human
capital from specific institutions. Through determining the nature of graduate unemployment,
the likelihood of having a tertiary education and being unemployed is identified.
3.2.2 The nature of graduate unemployment
Graduates who enter the labour market are heterogeneous and therefore disparities exist
between which graduates are more likely to be unemployed. These disparities are caused by
demographic differences as well as differences between human capital attainment. To
determine which groups of graduates are more likely to be unemployed, the nature of graduate
unemployment will be examined.
3.2.2.1 Demographic characteristics4
a) Race
Graduate unemployment is distinguishable across races. Black graduates account for the
highest share of graduate unemployment. Oosthuizen (2006:41) explicitly states the
unemployment rate amongst Black graduates in 1995 was 10.1%. This is four times greater
than the rate of graduate unemployment for Whites. This unemployment rate amongst black
graduates increased to six times more than White graduates in 2004 (18.1% vs. 2.8%).
Between 1995 and 2004 the unemployment gap between non-African and African graduates
widened. The differences in post-tertiary education unemployment rates among Africans,
Coloureds and Asians were insignificant in 1995. However, the rate for Africans was
statistically different from that for unemployed Coloured and Asian graduates in 2004
(Oosthuizen 2006:41). Therefore, graduate unemployment rates among African graduates
became notably higher than that of other races while on the other hand, unemployment rates
amongst Coloured and Asian graduates declined slightly. In addition, Pedersen and Lund
(1987:229) stated that the labour market hierarchy is restricted by social constraints and
networks instead of guided by the level of productivity.
There was an 11.8% decline in employment levels for Black graduates, indicating a decrease
in demand for these graduates between 1995 and 2005 (Pauw et al. 2007). The number of
unemployed African graduates more than doubled from under 10 000 to approximately 25
000 between 1995 and 2004 (Oosthuizen 2006:41). Africans comprised just over half of the
unemployed with degrees in 1995, this proportion had risen to 70% in 2004 (Oosthuizen
2006:41). Employment generation in South Africa was evident for only 28.74% of all new
4 Gender issues and provincial detail could not be derived from available literature
21
African entrants into the labour market, while 74.69% of all new White entrants were able to
find employment. This resulted in the unemployment levels of African graduates being higher
than that of Whites (Bhorat and Lundall 2003:27).
In contrast, the demand for non-African graduates increased between 1995 and 2005, with
Whites experiencing the highest increase in employment (Pauw et al. 2007: 22). In absolute
terms, unemployment amongst White graduates remained relatively unchanged between 1995
and 2004 (Oosthuizen 2006:41). The impact of the type of human capital attained further
impacts the differences between graduate unemployment across races. The probability of
White candidates attending university rather than college is higher than for Black candidates,
therefore White graduates are less likely to be unemployed (Branson, Leibbrandt and Zuze
2009:55).
In 2005, 73% of unemployed graduates were Blacks with a certificate/ diploma. This presents
an increase from 63% in 1995 to 73% in 2005. Africans attending technikons in 1990
amounted to 19% of the total number of technikon students this amount increased to 73% of
the total technikon students in 2000. By 2003 Africans accounted for 76% of all technikon
students and 60% of students in all state-subsidised universities and technikons (Pauw et al.
2006:25). This increased access of Africans is related to the fact that the burden of graduate
unemployment falls predominantly on Africans. The type of human capital which graduates
attain is also a cause of graduate unemployment and will be examined from this context in
Section 3.2.2.
African graduates additionally account for the highest share of graduate unemployment
because of the field of study they choose. Africans tend to enrol in fields of study with higher
unemployment prospects; this is largely because they do not qualify to enrol in mathematics,
science and engineering courses, which are fields in greater demand.
Du Toit (2003:6) stipulates that approximately 97% of economically active white youths who
hold qualifications in the business, commerce and management fields are employed. This is
can be compared with only 53.3% of African youths with qualifications in this field who were
able to find employment. Du Toit also states that this is the result of African youths who are
pursuing training in business, commerce and management specializing in fields such as
human resource management and marketing, which are not in demand when compared to
subjects like finance, accounting and economics.

22
The majority of Africans also study in fields such as humanities and the arts field of education
which accounts for one of the highest proportions of graduate unemployment. In contrast,
Africans in professionally orientated study fields were doing well; they experienced zero
unemployment in fields such as engineering and medical sciences, while there were positive
levels of unemployment for White graduates in all fields of education (Moleke 2005:10). The
field of education as a cause of graduate unemployment will be discussed further in Section
3.2.2.
b) Age
Graduates which fall under the youth age category often have inflated expectations of finding
employment and, furthermore, the reservation wages of unemployed youths are generally
higher than what these people could expect to earn in employment (Roberts 2011:6).
Graduates at this age are also more susceptible to losing their jobs because this is cheaper for
employers than dismissing someone who has worked for an extended period of time and also
because the youths have less experience (Du Toit 2003:6).
In the evaluation of the age composition of the unemployed graduates in 2005, it was found
that about 77% of graduate unemployed are young, suggesting that they are recent graduates
(Pauw et al. 2006:14); 54.9% of unemployment among those with a tertiary qualification are
between the ages 25 to 34 at the time of survey (Pauw et al. 2006:14). Therefore most of the
graduate unemployed are youngsters who just entered the labour market with no previous
work experience. Unemployment among educated youths is potentially damaging for the
economy as it can lead to frustration and discouragement among young people. In addition,
extended periods of unemployment may result in young people’s skills base becoming
outdated.
3.2.2.2 Human capital characteristics
a) Type of qualification
The type of qualification determines the probability of graduates being unemployed.
Graduates who attain human capital from technikons or colleges account for a higher share of
graduate unemployment than graduates with a degree from a university. In August 1999 the
Ministry of Education released statistics indicating that an increasing number of South
Africans are deciding to study at technikons instead of universities. This trend may be
attributed to an array of factors, including the lower entrance requirements at the technikons

23
and the vocational nature of technikon qualifications. Enrolments at technikons rose by 46%,
while at the universities they increased by only 8% between 1993 and 1997. Total higher
education enrolments increased from 496 000 in 1993 to 594 000 in 1997 (Ministry of
Education 1999:4).
However, more recent statistics illustrates that university enrolment has increased the most,
with university of technology enrolment numbers decreasing since the 1990's. More
specifically in 2002, the enrolment shares between university, university of technology and
college were 41%, 29% and 30%, respectively. By 2007 this had shifted to 54%, 15% and
31% (Branson et al 2009:25). This shift in enrolment emphasises the increase in demand from
individuals for a university education because of the competitive nature of the graduate labour
market and the fact that graduates with a degree have become more employable. Graduates
with a degree are also advantaged in that they are better able to signal their levels of
productivity to employers and thereby decreasing their chances of unemployment.
There is a clear distinction between graduates when comparing the types of qualifications
attained. When comparing employed matriculants (reference group) to individuals who have
attained higher education there is a distinctive difference in earnings between the types of
qualifications. The financial return (wage premium) from attaining a diploma/certificate is
between 170% and 220% higher than employed matriculants. On the other hand, the average
graduate with a degree gains between 250% and 400% higher earnings than the reference
group (Branson et al. 2009:12). These statistics relate to the theory of human capital, which
postulates that increased investment in education results in an increase in future earnings.
Table 3.1 shows that the majority of unemployed tertiary education graduates have a diploma
or a certificate. In 1995 and 2005 graduates with a diploma or a certificate accounted for
80.9% and 82% of graduate unemployment respectively, whereas in 1995 degree holders
made up 19.1% of unemployed graduates, which decreased marginally to 18% in 2005. The
fact that the highest proportion of unemployed are graduates with a diploma/ certificate could
be attributed to the quality of these institutions and the negative perception amongst
employers of these institutions causing statistical discrimination. Therefore those graduates
with a diploma/ certificate are more likely to be unemployed than graduates with a degree.

24
Table 3.1 Breakdown of tertiary unemployment by type of qualification 1995 2005 Diploma/ certificate 080.9% 082.0% Degree 019.1% 018.0% Total 100.0% 100.0%
Source: Pauw et al. 2006:19
b) Field of study
Graduate unemployment is concentrated amongst students aspiring to work in particular
fields. Based on a study done between 1990 and 1998 by Moleke, it was found that the
humanities and the fields of study accounted for 53.5% of unemployed graduates. This is the
highest proportion of unemployed by field when compared to other fields of studies,
indicating an over-supply of these graduates during this period (Moleke 2005:15). This is
followed by education and economic and management sciences, which account for 17.9% and
10.3% respectively. However these trends of graduate unemployment by field of education
changed over time.
Table 3.2 distinguishes between particular fields of education according to post-Matric
qualifications between 2000 and 2005. Based on the analysis, business, commerce and
management account for the highest proportion of graduate unemployment over the period
2000 to 2005. Graduates with qualifications in education, training and development accounted
for the second highest share of unemployed graduates reaching its peak in 2001 at 26.5% and
then in 2005 it decreased to 14.1%. Substantial shares of graduate unemployment were also
accounted for by graduates with qualifications in physical, mathematical, computer and life
sciences or manufacturing, engineering and technology. Human and other social sciences
accounted for the lowest proportion of graduate unemployment for this same period.
According to Moleke (2005:15) other fields of study such as medical sciences, engineering
and natural sciences account for a combined total of only 7.6% of graduate unemployment
(Moleke 2005:15).

25
Table 3.2 Breakdown of tertiary unemployment by field of Study, 2000-2005 Field of study 2000 2001 2002 2003 2004 2005 Business, Commerce & Management 030.5% 026.9% 028.2% 027.6% 028.2% 028.1%Education, Training & Development 025.6% 026.5% 023.2% 019.0% 021.1% 014.1%Physical, mathematical, Computer & Life Sciences
011.3% 015.1% 010.5% 014.4% 009.8% 016.5%
Manufacturing, Engineering & Technology
008.6% 009.2% 012.4% 013.7% 010.8% 011.6%
Health Sciences & Social Sciences 005.8% 003.4% 005.7% 005.5% 008.3% 009.7%Human& Other Special Sciences 002.7% 003.8% 006.8% 004.4% 004.9% 004.9%Other/ Unspecified 015.5% 015.1% 013.1% 015.4% 016.9% 015.2%Total 100.0% 100.0% 100.0% 100.0% 100.0% 100.0%
Source: Pauw et al 2006:20
However these statistics need to be read within the correct context. It is important to keep in
mind that commerce students typically make up a very large proportion of students at tertiary
institutions; this is even true for technical institutions, which partially explains why graduate
unemployment would be concentrated in this field. Hence it is not surprising to see that they
represent a large share of the unemployed (Pauw et al. 2006:22).
In addition, it was proven in the above section that graduates from technical institutions
account for higher shares of graduate unemployment. This point is related to the fact that
graduates with qualifications in physical, mathematical, computer and life sciences as well as
those who graduated in manufacturing, engineering and technology make up over 80% of
technical college enrolments. Nonetheless this remains contrary to the demand figures, which
indicates that engineers, accountants and auditors are in high demand. Therefore, one should
also consider the impact the quality of qualifications inherent in technical institutions (Pauw
et al. 2006:23).
Moleke (2005:11) notes that almost two thirds of economic and management studies (EMS)
university graduates found work immediately after completing their studies. This statistic
compares positively to the average of 60% of university graduates across all other fields of
education. The fact that the majority of graduates who are unemployed among commerce
students are non-university students explains that graduate unemployment of commerce
students is largely concentrated amongst those with a diploma or a certificate in this field.
This again highlights the importance of choosing the right the type of qualification and field
of education to signal the value of human capital and determining the prospect of graduate
unemployment.

26
c) Institutional Context
The legacy of the apartheid education system continues to plague tertiary institutions.
Consequently graduates experience different prospects of unemployment based on the tertiary
institution they attend. Despite the improvement in resources and increase in funding directed
at African tertiary institutions in attempts to equalise education, there is still evidence of
persisting inequalities, which are reflected in differences in the quality of education.
Incidentally, findings regarding the employment prospects of graduates from historically
White universities (HWUs) and historically Black universities (HBUs) are particularly
interesting.
Students from HWUs are found to have much better employment prospects than those from
HBUs. This can also be seen in the fact that, when considering all post-matric qualifications,
84.6% of graduate unemployment was experienced by Black graduates, whereas White
graduates only accounted for a share of 8.2 % between 2008 and 2010 (Stats SA, own
calculations).
According to Moleke (2005:12), a survey was conducted and at that time the results revealed
that the percentage of graduates unemployed from HBUs in South Africa is approximately
82.1% while those from HWU’s is only 17.9%. Therefore unemployment of graduates from
HBU's has increased which is predominantly explained by the quality of these institutions and
the perceptions employers have of these institutions which causes discrimination.
Furthermore, higher proportions of graduates from HWUs, approximately 69% are absorbed
in the labour market immediately compared to only 40% of graduates from HBUs (Moleke
2005:3). This is partly explained by employers’ perception about the quality of the institutions
(Pauw et al. 2006:24). Additionally, this points to the poor signalling value of HBUs.
However, it is also important to note that HBUs enrol disproportionate numbers of students in
fields of study with poor employment prospects, resulting in a skills mismatch. In addition,
HBUs are perceived to be of a lower quality causing human capital discrimination and thus
leading to graduate unemployment.
Unfortunately, anecdotal evidence indicates that employers are biased against employing
graduates from specific institutions, and perhaps quality of education at certain institutions
needs to be investigated. Employers may also engage in statistical discrimination based on the
institution students attended and thus employers would be more reluctant to employ graduates
from HBUs. Moses (2011:3) states that the number of years spent attending school is unlikely

27
to be a reliable signal of actual productivity as graduates attain various standards of education
based on quality differences. Therefore statistical discrimination is likely to occur in South
Africa.
3.2.2.3 Duration of job search
Duration refers to the length of time graduates take to find employment. Determining the
duration is important considering that the greater the length of unemployment, the more
discouraged graduates become. The duration of unemployment is related to the type of
tertiary education attained and the graduates' field of education.
In 2005 Moleke (2005: 10) administered a postal survey among employed university students
in South Africa. Findings suggest that 60% of graduates found a job immediately, a further
28% found employment between a month and six months after qualifying, 6% took between
seven and twelve months, while the remainder 6% took more than a year to find a job.
Furthermore, those graduating from the historically black tertiary institutions from the fields
of Humanities and Arts, as well as Commerce were more likely to take a longer time (e.g.,
more than six months) before finding employment.
More than half of all the graduates found their first job in the public sector, with 46.8%
finding employment in the private sector and 2.4% being self-employed (Moleke 2005:11).
This analysis found that 76.6% of Africans found their first job in the public sector, while
57.5% of White graduates and 51.2% of Asian graduates found their first job in the private
sector. This alludes to the fact that the private sector is more reluctant to employ African
graduates which is largely due to statistical discrimination.
However, to more directly determine the employment prospects of graduates, it is important
to look at which fields of education absorb graduates more rapidly in order to determine
where the demand for graduates lies. The absorption rates therefore reflect the demand for a
particular field of education and how this aligns with the supply of graduates. 79.3% of
graduates from the medical sciences find work immediately, while 77.2% of engineering
graduates finds work immediately (Moleke 2009:11). Other fields of education which have a
relatively high demand for graduates include economic and management sciences and
agriculture, while among those who study in fields of humanities and arts only 46.8% find a
job immediately, while 4.2% may take up to 2 years to find their first job (Moleke 2009:11).
Therefore, graduates in the medical sciences and engineering fields find jobs sooner, meaning

28
that the period of job search is shorter than those from other fields of education and
consequently the likelihood of graduate unemployment in less.
3.2.3 Causes
Unemployment in South Africa is a key concern, however more alarming is the fact that
graduates who should be the most likely to find employment have illustrated increasing shares
of unemployment in South Africa. Therefore in order to target the problem of Graduate
unemployment it is important to understand the primary causes from which graduate
unemployment stems from.
3.2.3.1 Structural problems
Graduate unemployment is particularly caused by a mismatch between the skills demanded by
the economy and the skills supplied by graduates resulting in structural unemployment among
graduates. It was estimated that in 2002 the vacancy rate was about 4% for high-skill and
skilled levels, translating into 90 700 vacancies (Altman 2007:11).5 Therefore had all
vacancies been filled, graduate unemployment might have been halved (Altman 2007:11).
However, the leading cause of these vacancies not being filled was that the available
vacancies did not correspond with the field in which graduates had studied.
The structural change in the demand for graduates is linked to the pressure of globalisation to
focus on particular fields of education in order to remain competitive. Demand shocks are
transmitted into the unemployment of graduates (Pedersen and Lund 1987:5), therefore
globalisation causes a change in the demand for graduates and thus a mismatch between
demand and supply.
Moreover, in order to remain competitive, the market for labour changes, which often results
in the field of education in which graduates studied no longer being in demand once they
graduate. There is a demand specification problem in the graduate labour market, which
means that graduates have been accumulating human capital in fields of expertise not in
demand by employers and thus causing unemployment. The specific fields in which graduates
study and those demanded by the economy was presented in Section 3.2.2.2.
5 Caution should be taken when using vacancy rates as a proxy for employment opportunities as vacancies may not necessarily be open to the public.

29
This demand-specification problem among graduates reveals that students are not informed
about the demand for labour. However, information is not perfect and people are not perfectly
matched to opportunities, so some mismatch is always likely (Altman 2007:11). Therefore
there is a need for collaboration between industry and institutions to target this information
gap. It is important that institutions of supply, i.e. the tertiary institutions, produce graduates
with a skills profile that matches current demand trends and become informed about the future
skill needs of the economy.
3.2.3.2 Discrimination
Inter-racial differences in unemployment figures in South Africa continue to prevail due to
discrimination in the labour market. This is predominantly due to our history of racial
segregation, which impacted on unemployment figures. To correct the wrongs of the past will
take many years to reflect in labour market figures.
An HSRC survey indicated that by the mid-1990s the unemployment rate for white graduates
of tertiary institutions in South Africa was approximately 2%. On the other hand, it was
almost 25% for black tertiary graduates. The African unemployed individuals are more than
twice as likely as Whites not to have worked. Therefore, Africans bear a disproportionate
share of the burden of unemployment which illustrates that employment discrimination exists
in the South African labour market. This could be due to the inferior employment-enhancing
qualities of Africans such as low quality of education and lack of soft skills compared to
Whites. It could also be due to the racial discrimination of employers.
According to the DPRU study (2007:7), discrimination favours Whites in that it is more likely
for other races to be discriminated against in terms of employment opportunities. It is
assumed that the majority of the African youths attained their qualifications from previously
disadvantaged institutions, which encourages discrimination amongst employers. This is
because Africans are more likely to be accepted at these institutions than at Historically White
Institutions who have more restrictive access. Therefore, it seems that employers have the
perception that African graduates from these institutions lack essential competencies causing
human capital discrimination (Du Toit 2003).
Before the market discrimination is evident from the DPRU firm survey of 2006. From this
survey it was found that employers are biased in that they prefer not to hire graduates from
historically Black institutions. Some firms who participated in this survey explicitly stated

30
that they do not approach historically black institutions during campus recruitment drives
because of concerns about the quality of education at these institutions. Thus graduates from
these institutions are more likely to be unemployed because of human capital discrimination.
Dube (2009:2) alludes to within-the-market discrimination by stating that there are numerous
stories of continued discrimination against black professionals in the corporate world. It
shows that there is continued resistance among the White captains of the economy to embrace
the idea of total inclusiveness, the recognition of talent as well as progression based on merit
alone. There is a need for institutions which were previously disadvantaged to be fully
equipped and informed, so that graduates from these institutions have the same employment
prospects and to avoid statistical discrimination by employers.
Statistical discrimination by employers is predominantly related to the quality perceptions of
certain institutions. These quality issues can be traced back to secondary education and
tertiary education. “Educational quality differs widely across race groups. In terms of
outcomes, the South African school system performs much the same as during apartheid, with
most historically black schools (despite vast improvements in resources) still performing
abysmally in terms of cognitive outcomes and most historically white schools (despite
significantly reduced funding and now also containing many black children) largely
performing as successfully as in the past” (Burger and van der Berg 2011:1). The quality of
education will be further detailed in the following section.
3.2.3.3 Quality of education
a) Tertiary
The quality of education is an important factor determining the employment prospects of
graduates. Returns to tertiary human capital is limited by the impact of poor quality of
education which results in a negative signal of productivity to employers and increases the
chances of graduates being unemployed (Chamberlain and Van der Berg 2002: 19). The
quality of tertiary education plays a direct role in establishing whether the graduate will be
able to perform in a work environment. Although quality is difficult to measure, there are
many proxies available in this regard. Quality of education can be measured by establishing
how relevant and up to date the curriculum is, the availability of resources such as libraries
and internet access, lecturer-pupil ratios, and pass and graduation rates.

31
Tertiary institutions in South Africa have been enrolling increasing numbers of students. This
point is further established in Section (c). This increased access to tertiary education is the
result of various factors, including the requirements to enter tertiary institutions being lowered
to make tertiary education more accessible coupled with the low quality of secondary
education which results in students performing well, thereby gaining admission into tertiary
institutions and the fact that many formerly disadvantaged individuals are now able to access
study loans and bursaries more easily than in the past (Letseka et al. 2010:3). This increase in
access has, however, been together with decreasing trends in public expenditure on tertiary
institutions in South Africa. “As a percentage of educational expenditure the proportion of
higher educational expenditure dropped from 15.43% in 1987 to 14.03% in 1999 and
thereafter decreased even further to 11.51% in 2009” (De Villiers and Nieuwoudt 2010:16).
This increase in expansion relative to a decrease in public spending reflects how the quality of
institutions can be negatively impacted.
With that said, however, students find difficulty in managing the academic workload at these
institutions, given poor quality teaching and preparation at secondary schools. Consequently
high failure rates are experienced at institutions. Certain institutions find themselves under
pressure, knowingly or not, to lower the standards and maintain throughput rates to ensure
that the system does not congest (Pauw et al. 2006:24). However, resorting to such measures
influences the quality of education being delivered and thereby negatively affects the
marketability of graduates.
In 2001, South Africa’s graduation rate was 15%, making it one of the lowest in the world
(Letseka and Maile 2008:1). There is also inequality in the graduation rates of black and white
students. Evidence suggests that the average graduation rate of White students tends to be
more than twice that of Black students. Drop-out rates reflect the effect of the quality issues
around secondary education and thus its impact on a tertiary level. Letseka, Cosser, Breier and
Visser (2010:3) reported that in 2005, of the 120 000 students that enrolled in higher
education in 2000, 3 600 (30%) dropped out in the first year of study. A further 24 000 (20%)
dropped out during their second and third years of study. Of the remaining 60 000 (50%) only
22% graduated with a generic bachelors degree within the specified three-year period
(Letseka et al. 2010:3). The quality of graduates' human capital is predominantly influenced
by the institution they attend. Admittance to tertiary institutions is determined by students'
performance at secondary institutions and the quality of the respective secondary education,
which will be discussed in the next section.

32
b) Secondary
The quality of secondary education has a great impact on the occurrence of graduate
unemployment. Matriculation results determine options for university entry, bursaries, career
choice and labour market prospects (Taylor, van der Berg, Reddy and Van Rensburg 2011:1).
Secondary education also determines the field of study students will choose and their
performance at tertiary institutions. The quality of education, however, is difficult to measure.
Nonetheless particular variables are considered when determining the quality of education.
These variables include school resources, the pass rates of Senior Certificate students and the
pass rates of Senior Certificate students in science and mathematics.
Of the half a million learners who wrote the final exams in 1995 (508 363), 68.3% passed.
From those who were successful, 25% passed with exemption, qualifying them to apply to
university (Papier 2006). This statistic is important as only a quarter qualify to obtain a degree
and those graduates with a degree are more likely than those with a diploma or a certificate to
find employment. This leaves the remaining 75% qualifying for a diploma/certificate
(Department of Education 2007). In 2001 approximately 13% of those who passed with a
Senior Certificate qualified to attend university. This represents a decline over this period.
Furthermore, the continuous assessment of students in secondary education signals to them
their strengths and guides them into which field of education they should enrol in at a tertiary
level. However the quality of such assessments needs to be of a high quality in order for
accurate inferences to be made from them. Van der Berg and Shepherd (2010:29) indicates
that continuous assessment accuracy was weakest in terms of the great leniency of assessment
in many schools (inflated CASS marks), although irregularity of assessment was also a key
concern. These quality issues in assessment therefore incorrectly signals to students which
fields of study they should enrol in and could also impact on which type of tertiary education
they apply to.
The low quality of secondary education is indicated by the fact that 82% of students accepted
into tertiary institutions are functionally illiterate (literacy rate below grade eight). Moreover,
60% experience difficulty in mathematics and science. The lowest average scores were among
those individuals attending African schools, when compared to the former House of
Assembly schools, who achieved much higher scores (Moleke 2005:8)

33
Moreover, South Africa has experienced declining numbers of Matric candidates who pass
with exemption for university entrance, which is particularly worrying. Based on Department
of Education data of 2007, the number of candidates passing the Senior Certificate has
increased in comparison with those sitting for exams. However, of those who passed the
Senior Certificate, only 13.6% passed with exemption in 2001 which qualified them to apply
at a university.
Regardless of resource transfers to Black schools and large influxes of Black pupils to
historically White schools, historically White and Indian schools still far outperform Black
and Coloured schools in matriculation examinations and performance tests at various levels of
the school system (Van der Berg 2006:1). These differences point to quality deficiencies of
schools which expedite the racial inequality which already exists in South Africa.
60% of students cannot cope with the level of mathematics and science offered at university,
which is evidence of the poor quality of both primary and secondary schools (DPRU
2006:17). In addition, the figures based on those who wrote the 2010 National Senior
Certificate examination indicate that there has been a national decline in the number of
learners registering to write the mathematics exam. Enrolment in the mathematics exams
showed a decline between 1998 and 2010 (Department of Education 2010:92). This trend is in
contrast with the demand for graduates because it is necessary for students to enrol and pass
mathematics, in order for them to qualify to study in fields such as engineering and medical
sciences, as demanded by the labour market.6 The pass rate in mathematics increased from
46% in 2009 to 47.4% in 2010; however, the overall pass rate is low when compared to other
subjects such as Life Sciences which have a 75% pass rate.
Since 2008 the number of learners taking physical sciences has dropped in all provinces
except the Eastern Cape and Limpopo. Physical science is another important subject
necessary to qualify for the tertiary fields of education demanded by the economy and the
drop in enrolment in this subject will result in shortage of graduates studying in fields of
education linked to physical science. Nationally the enrolment in the physical science has
dropped from 218 749 to 202 604, a percentage of 7.3%. The overall pass rate in physical
science dropped from 54% in 2008 to 36% in 2009. In 2010 the pass rate increased to 49%. 6 It is possible that the black students who performed poorly in Matric were not accepted to study in fields under demand in the labour market, such as Engineering and Medical Sciences, and hence pursued their post-Matric studies by enrolling in the fields like Humanities and Arts as well as Commerce. As a result, this could worsen the skills mismatch problem (because there is already an oversupply of these graduates), and they struggle to find employment upon graduating.

34
However, this still represents a decrease in in pass rate from 54% in 2008 to 49% in 2010
(Department of Education 2010:113). This decline in both enrolment and pass rates in
mathematics and science means that students are not able to register in the fields offered at
tertiary institutions which are in demand by the labour market.
In South Africa the increase in resources in formerly disadvantaged schools after 1994 did not
bring about the anticipated developments in educational outcomes (Burger and Van der Berg
2011:6). Some schools may have had difficulty filling positions for quality educators,
particularly schools located in deep rural areas, because quality educators prefer teaching in
richer, urban schools. Consequently this impact on the quality of the education delivered in
the more disadvantaged schools (Van der Berg: 2006). Van der Berg and Burger (2010:3)
highlight the importance of the need for quality educators to ensure quality education and that
the remuneration of teachers is also linked to the quality of education they deliver. Van der
Berg and Burger (2010:33) states that “teachers at the top end of the earnings distribution are
underpaid, whereas teachers at the bottom end are overpaid. This compression of wages could
mean that teachers with the most favourable sets of labour market characteristics will leave
the teaching profession, whereas those with least favourable endowments will find it attractive
to stay.” If this is the case the quality of education delivered is under threat in South Africa.
These factors all contribute to the low quality of education and explain why such schools
experience low Senior Certificate pass rates and matriculation exemptions. These constraints
have implications for students’ progress once they enter tertiary institutions. Correcting the
issues around the quality of education will reduce human capital discrimination between
Whites and Blacks (Chamberlain and Van der Berg 2002: 2) and reduce unemployment
amongst Black graduates.
c) Increased access to tertiary institutions
The growing trend in worldwide demand for higher education is evident when official global
student numbers are determined. Global enrolment figures for higher education increased by
4.6% for the period 1970 to 2007, which translates into the average number of tertiary
students doubling every 15 years (De Villiers and Nieuwoudt 2010:3). This supply-side
expansion for tertiary education is apparent in South Africa as well.
Increased access is indicated by the statistics. The number of degrees, diplomas and
certificates awarded by public institutions of higher learning increased by 29% between 1992

35
and 1996, but declined by approximately 5% between 1996 and 1998. By 2004 there were a
total of 28 756 graduates from university and technikons; this accounts for a 61.34% increase
in graduates between 1995 and 2004 (Paterson and Arends 2009:33). This statistic is a clear
measure of the success of widening access to higher education. Nonetheless, according to
Pandor (2007:1), the largest growth was in business and management sciences, while the
lowest was engineering sciences and technology and health sciences between the period 1995
to 2004.
There has also been an increase in the African graduate unemployment share which is partly
explained by a massive increase in the enrolment of African students at tertiary institutions
after 1994 (Pauw 2006:21). The racial composition of tertiary students is 60% for African
students, 30% White and 10% Coloured and Asian. However these statistics are largely
related to the population growth in South Africa which is in proportion to the growth in the
racial composition of tertiary students (Branson et al. 2009:20). Nonetheless, this high share
of African tertiary students translates into graduate unemployment.
On the other hand, the over-supply of graduates caused by this increased access can also
cause underemployment of graduates also explained in section 2.2. Stone and Mc Craw
(2007:21) stated underemployment has become an unfortunate reality in that graduates are
only able to find part- time wok even though they would prefer to work full- time. Stone and
Mc Craw (2007:21) also refer to those underemployed as contingent workers who are not
only part-time but employed on a temporary, short- term contract or as casual workers. Many
qualified graduates in South Africa have become contingent workers instead of being
employed in decent, sustainable permanent jobs as would be expected. On the other hand,
graduates’ qualifications can often also be exploited by employers in that they perform tasks
related to their capabilities due to investment in education but are not remunerated
accordingly. This underemployment is in contrast with the human capital theory explained in
section 2.4.1 in that the return on the investment into education is not guaranteed.
Tertiary education has become more accessible to people including Blacks. Therefore there is
an over-supply of graduates into the labour force. However, the demand for graduates is not
high enough to absorb all of them. More specifically, the actual growth rate of employment
should be higher in order to meet the target growth rate in order to absorb all graduates into
the labour market. Also, some graduates labour force entrants studied in the wrong field and

36
at institutions of poor quality, which explains why the supply exceeds demand and why
graduate unemployment occurs.
3.2.3.4 Labour market inflexibility
a) Labour Legislation
Labour legislations are intended to assist in correcting market failure and protect the relevant
participants in the labour market, however they have unintended negative consequences
which encourages graduate unemployment. The primary criticism of South Africa's labour
legislation is that its rigidity constrains the employment of labour. Such rigidity curtails the
employment of graduates as employers would rather invest in capital, hire on a temporary
basis, or hire more experienced workers who are less of a risk.
Rigid legislations make it difficult for employers to dismiss employees and thus making them
reluctant to employ new labour. The South African economy is positioned at the 65th
percentile for hiring rigidity and at about the 60th percentile for the difficulty of firing index
(Benjamin et al. 2009: 4). The strict labour legislation of South Africa discourages employers
from hiring graduates, because compliance with this legislation has the potential to lead to
increased costs for the business.
Racial inequality in terms of the hiring practices of graduates is impacted by the BEE (Black
Economic Empowerment) Act of 2003. This Act's purpose is to facilitate economic
empowerment of all black people, including women, workers, youths, people with disabilities
and people living in rural areas (Burger and Jafta 2010:7). Benjamin (2005:40) mentions that
the Act seeks to leverage the state’s economic power to promote and encourage empowerment
and transformation within the private sector. BEE is therefore able to correct the injustice of
the apartheid regime and thus, facilitate the employment of Black graduates who currently
bear the highest share of graduate unemployment.
However, Burger and Jafta (2010:4) claim that the effects of affirmative action policies in
reducing the employment or wage gaps have been marginal at best. The policies were much
less significant in bringing about changes in labour market outcomes and add to the rigidity of
the labour market. Nonetheless, section 4.3.2 will present evidence which will reflect the
changes in unemployment rates specifically related to graduates by race where the possible
impact of BEE and other labour market policies will be more clearly explained.

37
The 2008 OECD Indicators of employment protection shows that hiring and firing costs as
well as the hours rigidity index (legislation around working hours) of South Africa are below
the global average. However, the hiring and firing rigidity measures are markedly above the
world average (Benjamin, Bhorat and Cheadle 2009: 4). The ADCORP 2011 report points out
that South Africa performs poorest against firing practices (135th) compared to the rest of the
world. These firing practices refer to the legislation which stipulates the processes and
appropriate reasons employers are allowed to fire employees.
Leibbrandt, Woolard, McEwen and Koep (2010:33) state that the Basic Conditions of
Employment Act, the Labour Relations Act and the Employment Equity Act are far too strict
for a country with the currently prevailing unemployment conditions. These regulations
impose costs onto employers. Costs are involved in complying with wage and benefit
standards, legal requirements with regard to hiring and firing practices, the extension of
contracts and agreements and the number of trade unions that firms are required to relate with.
Therefore, the costs associated with labour legislation discourage employers from employing
new graduates and often employers substitute labour with capital adding to the problem of
graduate unemployment.
b) Minimum wages
According to Kingdom and Knight (2000:11), labour market institutions such as Industrial
Councils (now called Bargaining Councils) and Wage Boards set sectoral minimum wages in
many industries in South Africa. These minimum wages and stipulations are applied to all
firms in the industry and region, irrespective of size. South Africa's system of sectoral
minimum wages may have contributed to the low levels of youth and graduate employment
through pushing up the cost of entry-level workers (National Treasury 2011:14). Du Toit
(2003:6) mentions that the effect of minimum wages on unemployment is often found to be
quite significant.
Graduate unemployment is concentrated amongst the youth, as indicated above in section 3.2.
High minimum wages drive a wedge between youth labour costs and their expected
productivity, thereby raising unemployment and discouraging some youths and graduates
from entering the labour market. The average minimum wage across all sectors is about 62%
of the average formal sector wage. This is very high by international standards and far above
the average in the OECD (37%), which is already elevated compared to emerging and
developing countries (National Treasury 2011:14). Furthermore, it increases the unit cost of

38
labour which hinders competitiveness. Thus employers are reluctant to employ graduates
because the high minimum wage does not guarantee that the graduates will be equally
productive.
Furthermore, whereas many countries such as the Netherlands and France differentiate
minimum wages by age through the inclusion of sub-minima for youths, this is not the case
for South Africa. This has negative implications for the employability of graduates. The
minimum wage in South Africa therefore does not account for the lower productivity of
younger workers. This exacerbates the implicit gap between entry-level wages and
productivity, and hinders the hiring of younger workers, including graduates.
c) Reservation wages
Given the uncertainty about the potential of school leavers, employers consider entry-level
wages to be too high relative to the risk of hiring these inexperienced workers (high
reservation wage) (National Treasury 2011:4). Du Toit (2003:6) adds to this by stating that as
part of the debate on wages it is argued that graduate wages are not flexible downward, as
graduates expect that because of their investment in education they should attain a wage
which is aligned with their years of education. Von Fintell and Black (2007:13) claim that
graduates misinterpret their possible position within the labour market. However, experience
and quality of education play major roles in wage determination. Pauw et al. (2006) add to
this by stating that limited experiential training makes graduates’ expectations unrealistic.
Graduates expect their qualifications to allow them to start at management level and are thus
unhappy to start at entry level. Firms feel that it is necessary for graduates to have a more
realistic view of what they can offer and what to expect from their first job.
3.2.3.5 Lack of experience, language proficiency and soft skills
Mannack (2009:2) states that one of the most salient reasons for graduate unemployment is a
lack of work experience. Work experience is used as an indication of ability to employers.
Employers look for skills and experience; they regard inexperienced jobseekers as a risky
investment (National Treasury: 2011:4).When graduates do succeed in finding employment,
employers need to provide extensive training before they can be productive which
discourages employers from employing graduates without work experience (The World Bank
2009: 46). Due to the economic downturn employers prefer to employ experienced workers as
training graduates would result in employers incurring unnecessary costs. The effect of this
downturn results in cyclical unemployment amongst graduates. Some companies, especially

39
small and medium-sized enterprises (SMEs), cannot afford training at all (Mannack 2009:2).
Du Toit (2003) points out that layoffs occur more often amongst this cohort due to their
inexperience, resulting in high graduate unemployment rates. Von Fintell and Black
(2007:14) suggest that graduates should offer to work as apprentices at no cost in order to
gain experience and increase their employability.
An important factor impacting the employability of graduates in South Africa is language.
The English language may be used by employers to screen the quality of higher education and
thus signal a high level of productivity.7 In addition if a graduate speaks the preferable
language of the employer it will reduce transactional costs imposed on employers associated
with on- the- job training through language courses. Of Africans who speak English at home
have a 15.8% higher chance of employment than those with an official African mother-tongue
language (Cornwell and Inder 2008:513). African men with post-secondary education are
estimated to earn approximately 97% more if they are also English language proficient
(Casale and Posel 2010:22).
Furthermore Afrikaans- or English-speaking Whites remain better off for employment than
any other group defined on the basis of population group and language, whereas the worst off
are Asians who speak Afrikaans or English at home. In addition, there is virtually no
difference in employment prospects for an English-speaking African compared with an
English-speaking White (Cornwell and Inder 2008:513). These statistics highlight the
importance of the English language in attaining a job. It is evident that Black graduates who
speak English have a higher probability of finding employment.
Adding to the causes of graduates’ unemployment is their lack of soft skills which often
curtails their performance in interviews as well as within their respective jobs. Many
graduates were found to struggle with the lack of ‘‘soft skills’’ such as time management,
communication and creative thinking, or lacking the ability to work independently (Mannack
2009:1). It is assumed that that the knowledge, skills, competencies and values (combined to
represent “graduate attributes”) developed by higher education may in varying degree be out
of sync with the needs and expectations of employers and, at the same time, with the demands
of a rapidly changing world of work. There is a need to increase a student’s career literacy
while still at university.
7 Refer to Chapter Two, Section 2.4.2 for a more detailed explanation of the screening/ signalling theory.

40
The employability of graduates is dependent on a multitude of issues from life skills to soft
skills, from instilling a work ethic to personal initiative (Griesel and Parker 2009:1).
Employers value the conceptual foundation, knowledge and intellectual approach to tasks
produced by higher education, which highlights the need to target this lack of soft skills
amongst graduates. However, Pauw et al. (2006:15) state that some firms have started to use
learnership programmes successfully as a way to bridge the soft skills deficit and narrow the
gap between the workplace environment and student life.
3.3 GRADUATE UNEMPLOYMENT IN AN INTERNATIONAL CONTEXT
This section investigates graduate unemployment in India, China and within the European
countries. Within this context, it is possible to determine whether graduate unemployment is
unique to South Africa. Additionally, this section reviews India and China because it directly
relates to South Africa in that they are both emerging economies. India and China both form
part of the BRICS and are therefore seemingly economically comparable. On the other hand,
European countries will also be examined to determine if graduate unemployment is a
phenomenon which occurs only in developing countries or if it is a universal problem not
determined by the stage of development. Furthermore, the section will look at the extent,
nature and causes of graduate unemployment and how they differ internationally.
3.3.1 Graduate unemployment in India
Soon after independence in 1947 the need for qualified and technically skilled manpower was
recognised. It was expected that the system of Indian education would be geared to meet the
requirements of a developing country. India therefore experienced a structural shift towards
the demand for skilled labour. However with the emphasis on increasing the amount of skilled
labour unemployment amongst graduates became an increasingly important problem as the
economy could not absorb all the graduates entering the labour market.
3.3.1.1 Extent and nature
Unemployment amongst graduates in India has shown an increasing trend and a share of
unemployment of 20% (Chakratoborty 2010:1). A much higher percentage of male compared
with female graduates are unemployed. The lower percentage of female graduates without
employment is a consequence of the fact that the proportion of graduates is much less for
females in comparison with their male counterparts. In addition a significant proportion of
female graduates do not seek employment after graduation.

41
3.3.1.2 Causes
Increased access: The total enrolment started picking up in the wake of independence. As a
result of the investments made in the successive Five Year Plans for various developmental
projects under higher education, there has been a phenomenal growth in new institutions and
in enrolment (Indian Institute of Education 2002). Next to the US, India most likely has more
students in universities than any other country, although the number of university students per
1000 of the population is amongst the lowest (Ilchman 1969:787). By the end of the 1980s
higher education in India had become one of the largest systems in the world, with about 10
million students enrolled in 188 universities and about 14 000 colleges and with 400 000
teachers (Tilak and Varghese 1991: 3). Yet, the number of degree-granting institutions is
merely 350. Average enrolment in each institution is around 600 (Agarwal 2006:4645).
Enrolment across institutions increased by 15% from 1995 to 2002 (Indian Institute of
Education 2002).
The growth of jobs for graduate and technical degree holders was lower than the growth in the
graduate labour force numbers (Sharma and Apte 1976: 920). Government is confronted with
a situation in which the numbers of graduates seeking unemployment outweigh the potential
of the economy to provide jobs for them (Ilchman 1969: 792). The private organised sector in
India employs around nine million people (around 2.2 % of the total workforce). This is so
small that any expectation of it absorbing the large pool of around 3.5 million graduates
coming out of the system is unrealistic. In the face of moves towards right-sizing, the public
and the government sector (with 20 million people) cannot absorb many more graduates
(Agarwal 2006:4645). And finally, for most jobs in the unorganised sector that employs a
bulk of the Indian people, higher education qualifications are not essential. Under these
circumstances the problem of graduate unemployment will persist.
Skills mismatch: Chakratoborty (2010:2) mentioned that unemployment among the educated
in India is due to a mismatch between the aspirations of graduates and the opportunities
available to them, which alludes to structural limitations causing graduate unemployment. In
1971 more than 75% of the total graduate job seekers were arts and science degree holders.
Following these were engineering and commerce degree holders. These constituted more than
10% and 8%, respectively, of the total job seekers. The proportion of other degree holders
was all below 2%. Thus a larger proportion of engineering degree holders was seeking jobs
than doctors or agricultural scientists. Also, there were a larger proportion of arts degree
42
holders seeking jobs than science and commerce degree holders (Sharma and Apte 1976:
916). These trends largely still prevail due to the mismatch between the field of study which
graduates choose and what is demanded by the economy.
In 1966 commerce faculty enrolment was only 9.60 % of the total enrolment. However, this
amount has since shown an increasing trend. During 1997-98 this figure increased to 21.9%.
It is apparent that there has been a shift away from the arts faculty towards the commerce
faculty (Indian Institute of Education 2002). A concern is that fields of science have had
persistently low enrolment rates relative to the demand for graduates in this field.
Furthermore, the share of engineering and medicine to the total enrolments is now less than
what it used to be in 1947-48; this too is inversely related to the demand for graduates. This is
a matter of serious concern for policy-makers. In 1997-1998 enrolment in the arts including
oriental learning accounted for 40.4%, whilst commerce amounted to 21.9%, whereas
medicine and engineering/technology accounted for 3.1% and 4.9% respectively (Indian
Institute of Education 2002). Enrolment rates in India are misaligned with the economic needs
of the country, thus leading to unemployment among graduates in fields of commerce and
arts.
Quality of tertiary education: The proliferation of the Indian education system led to an
erosion in the quality of tertiary institutions (Tilak and Varghese 1991: 3). Most institutions in
India are very small and many are too small to be viable. A bulk of the enrolment is in the
affiliated colleges that have uniform and often out-dated curricula. Higher education courses
with an occupational focus form less than one-fifth of the total (Agarwal 2006:4646). The
small numbers of higher education institutions that are of high quality are government-
funded. Their number continues to be very small, while a large expansion has occurred in sub-
standard programmes and non-viable institutions.
Quality issues associated with institutions are indicative of the fact that only 25% of
engineering graduate in India are employable (Chakratoborty 2010:2). Moreover, industry
claims that only about one-fourth of graduates from the Indian higher education institutions
are employable. As a result there are skill shortages despite large graduate unemployment,
which can be explained by the skills-mismatch. The overall standards of higher education
have continually deteriorated, thereby reducing the value of an academic degree from India
(Agarwal 2006:4646).

43
Wage rigidity: Market inflexibility prevents wage rates from declining to levels where all
graduates may be employed at the rate at which graduate numbers increase. With the
expansion of education, there has been a devaluation of education too; a decade ago a clerical
job could be had with a Matric qualification, but now the same job requires a graduate
qualification (Sharma and Apte 1976: 920).
Other causes: Adding to graduate unemployment in India is that it is taking longer on average
to secure a job after attaining a degree and the first job is usually temporary, resulting in
frictional unemployment. 20.5% of graduates take between three and six months to find
employment, while 79.5 % take more than a year (Das 1981: 16). Invisible underemployment
may also occur in that graduates qualified for good positions are often employed as clerks or
administrative officials (Ilchman 1969:792). Furthermore, Chakratoborty (2010:2) states that
political instability in India, lack of entrepreneurship, lack of quality education and quality
students creates excessive unemployment.
3.3.2 Graduate unemployment in China
The rapid increase in graduate unemployment in China has predominantly been a
consequence of China's efforts to augment levels of post- secondary education. The various
causes of graduate unemployment in China stems from the earlier education reforms,
particularly the government’s decision to expand tertiary enrolment by nearly 50% in 1999
(Litao and Yanjie 2010: 2). Subsequently, four years later, unemployment for the first time
became a big problem for graduates
3.3.2.1 Extent and nature
A high level of graduate unemployment exists in China, as many as 22.1% of new graduates
are unemployed (Patridge and Keng 2008:2). Approximately 30% of college graduates fail to
secure a job upon graduation each year (Litao and Yanjie 2010: 2). In fact, out of the 2.12
million graduates in the higher education sector in 2003, 640,000 had not had any plans for
employment at the end of their studies (Nanping 2004:2).
The problem of educated unemployment first appeared in 2003 with the graduation of the
1999 cohort. As many as 750,000 college graduates could not find a job after graduation. The
number increased to 1.2 million in 2005, and nearly 2 million in 2009, or 32% of the 6.1
million graduates. The real numbers could even be higher than the official figures (Litao and
Yanjie 2010: 2).
44
3.3.2.2 Causes
Increased access: From 1995 to 2008 the number of Chinese graduates has risen substantially.
Chinese graduates increased more than five-fold from 926 000 to 6.07 million per annum aver
this period (Liu 2009:1). This significant increase in graduates is a direct cause of the
expansion of access to higher education. The number of new intake of college students on
average grew 22% annually between 1998 and 2006 (Litao and Yanjie 2010: 2).
In 2002, there were 2,003 higher education institutions in China. By 2005 this had increased
by 16% to 2,395. The number of students in higher education has consequently also risen to
the extent that undergraduate enrolment of 5,560,900 in 2000 increased to 9,433,395 in 2006
(Patridge and Keng 2008: 4).
The Chinese government set up its national goal to reach 15 per cent enrolment in higher
education by 2010. In 1999 the government began to accelerate the pace of higher education
growth, and in 2002 it achieved its goal, eight years earlier than originally planned (Bai
2006:1). The increased access to higher education was due to government intervention
through the 211 and 985 projects. These projects aimed at expanding student enrolment but
according to Liu (2009:1), the Chinese government did not make the necessary labour market
adjustments to accommodate this influx of graduates to the market and thus created an
oversupply of graduates. In 1995 the Chinese government launched Project 211, which aimed
to establish one hundred leading national universities. According to Patridge and Keng (2008:
4), three major components drove the 211 project:
1. Increasing institutional capacity;
2. Developing particular disciplinary areas and
3. Growing the public service system within higher education.
Project 985 was launched to develop world-class universities: Beijing University, Fudan
University, Harbin Institute of Technology, Hefei University, Nanjing University, Shanghai
Jiao Tong University, Tsinghua University, the University of Science and Technology, Xi’an
Jiao Tong University, and Zhejiang University (Patridge and Keng 2008: 5).
Collectively, projects 211 and 985 caused a massive oversupply of graduates within a short
period of time at a rate which was too fast for the labour market to absorb. China has the
largest higher education sector globally, with 6.6 million college graduates entering the job

45
market upon graduation and 1 million going on to pursue graduate studies (Litao and Yanjie
2010: 1)
Quality of higher education: The poor quality of certain institutions causes an increase in
graduate unemployment from these institutions. Chinese diplomas especially those from
institutions which did not receive government intervention during the period of expansion, to
the extent of others have a lower quality of education and therefore a lower value in the job
market ( Liu 2009: 45). Graduates from key universities have greater employment
probabilities than their counterparts from ordinary universities based on quality differences
(Li, Morgan and Ding 2008:641).
Educational quality suffered in the process for a number of other reasons. Universities
lowered admission requirements in competition for fee paying students. High quality faculty
members could not possibly grow as rapidly as student enrolment. Moreover, creation of
profitable programs was prioritised over the creation of a good teaching and learning
environment (Litao and Yanjie 2010: 2) Furthermore, the rapid expansion of the system has
made it difficult to sustain quality inputs such as the number of qualified faculty and staff,
curriculum development and program upgrading, laboratory facilities, and library books (Bai
2006:8).
Less than 10% of China's labour force is qualified to work for multinational companies,
which require higher employment standards. This quality issue presents problems for China
when competing globally. From 2003 to 2008 it was estimated that multinationals employed
750 000 graduates, while China supplied 1.2 million suitable candidates suitable candidates
out of 30.5 million total graduates. Therefore multinationals are able to employ 60%, however
China faces an over- supply of under- qualified graduates in terms of the quality of their
education which makes the unemployable (Liu 2009: 45). In the single-minded pursuit of size
and revenue, most universities have little motivation to improve the quality and employability
of its students. As a result, a large gap has emerged between the educational profile and
knowledge structure of college graduates and the actual demand of the industries (Litao and
Yanjie 2010: 7)
Skills mismatch: Structural unemployment among graduates may occur because of a
mismatch between the sectors which China focuses on and the skills of graduates. The
Chinese economy has a large manufacturing sector and relatively small modern services
46
industry. The majority of the manufacturing sector consists of millions of labour-intensive
factories, a thriving construction sector and large energy and capital intensive industries.
None of these three major industrial sectors offers large number of jobs suitable for graduates.
(Litao and Yanjie 2010: 7)
There is also a mismatch between the field of education demanded and supplied among
graduates. The most popular industry sectors among graduates are IT and communications,
followed by the commerce, finance and insurance. However according Li et al (2008: 690)
fields of education such as philosophy, economics, law, history, engineering, agriculture and
management, the rates of a confirmed future is over 60%. The field of engineering accounts
for the highest certainty at 73.2%. The rates for education and literature amount to the lowest
future certainty in terms of confirmed futures at 28.2% and 48.7%, respectively. The fact that
the most popular fields in which graduates study in are not aligned to possible employment
opportunities alludes to a mismatch in the skills demanded and supplied in China resulting in
structural unemployment.
3.3.2.3 Underemployment
A consequence of graduate unemployment in China is underemployment. Many have to lower
their expectations to take jobs that high school graduates would qualify. The oversupply of
college graduates has also brought down the average wage levels, as many are forced to take
low-paying manual jobs. (Litao and Yanjie 2010: 2) The fact that certain graduates attended
institutions which are of a lower quality than world- class institutions result in many of them
suffering from underemployment when compared to the qualification they achieved (Liu
2009: 45). The SMEs are often more willing to employ fresh college graduates as junior staff
or interns. In fact, in 2009, 75% of China’s fresh college graduates employed in the labour
force were absorbed by the SMEs.
3.3.3 Graduate unemployment in Europe
A comparative study across countries in Europe regarding graduate unemployment shows
substantial differences in terms of the transition to employment. However, although the extent
of graduate unemployment varies across countries in Europe the primary causes are largely
the same. Through the evaluation of graduate unemployment in Europe one can determine to
what extent this phenomenon in more developed countries is different from graduate
unemployment in developing countries.

47
3.3.3.1 Extent and nature
Based on the OECD countries between 2000 and 2004 in Table 3.3, Spain experienced the
highest share of graduate unemployment for the respective period compared to the other
OECD countries. Other countries with high graduate unemployment rates over this period
were Italy and France. The trends in higher education unemployment differ between the
countries. While it is fluctuating in Japan and France, we see, for example, a steady growth in
Germany and a decreasing trend in Italy.
Table 3.3 Trends in unemployment rates by educational attainment across OECD countries (tertiary education, 2000-2004)8 AT BE CH CZ DE ES FI FR IT JP NL NO UK 2000 1.6 2.7 C 2.5 4.2 9.5 4.7 5.1 5.9 3.5 1.9 1.9 2.1 2002 1.9 3.5 2.2 1.8 4.5 7.7 4.5 5.2 5.3 3.8 2.1 2.1 2.4 2004 2.9 3.9 2.8 2.0 5.5 7.3 4.7 6.1 4.8 M 2.8 2.4 2.2
Source: Kouchy, Meng and van der Velden 2007.
Based on a survey commissioned across ten European countries with a sample size of 30 000
graduates, approximately 5% of graduates experienced difficulty in finding employment. In
addition, the waiting time for a graduate to enter the job market varies from country to
country, but it might take six months or more, a factor that has abiding costs for the national
economies (Kostoglou and Paloukis 2007). The average search time for employment across
seven of these countries was three to six months while, on the other hand, countries such as
Spain, Italy and France took between seven and nine months to find employment, leading to
frictional unemployment. In fact the percentage of graduates employed rises sharply within
the first six months after graduation and decreases in subsequent years. Even when graduates
become employed, it is often on a part-time or on a short-term contract basis and tasks might
be that graduates look for another opportunity, causing frictional unemployment (Teichler
2007:2).
For both European and UK graduates it is the older graduates (aged 30 or over) who have the
highest probability of being unemployed for longer than six months. Almost 50% of the
European graduates who had experienced this level of unemployment were mature relative to
40% of UK graduates (Little and Tang 2008:10). In comparison, for both European graduates
overall and UK graduates, those aged 25-29 at graduation were less likely to have experienced
periods of unemployment longer than six months.
8The abbreviations for countries refer to: Austria (AT), Belgium (BE), Switzerland (CH), Czech Republic (CZ), Germany (DE), Spain (ES), Finland (FI), France (FR), Italy (IT), Japan (JP), Netherlands (NL), Norway (NO) and the United Kingdom (UK)

48
In terms of gender differentiation of graduate unemployment, in Germany and the United
Kingdom male graduates are more likely to be unemployed. This contrasts with the situation
in the Mediterranean countries, where female graduates were much more likely to be
unemployed than males. Finally, in Belgium, the Netherlands, Austria and Finland no
significant gender difference is found (Kouchy et al. 2007).
3.3.3.2 Causes
Increased access: Over the last decades the number of graduates entering the labour market
has increased significantly (Nunez and Livanos 2009:3). Since the 1970s it is noted that
increased access to tertiary education is a substantive cause of graduates being unemployed.
The rapid expansion of higher education has produced an unprecedented number of highly
skilled workers whose employment prospects have become more uncertain than they used to
be a few decades ago. According to Kostoglou and Adamidis (2009: 3), the high level of
competitiveness in the labour market and the consequently dire need for specialization
accelerated the need for increased access to higher education in Europe. Teichler (2007:2)
states that such expansion has resulted in many graduates acquiring a high level of education
in vain, which resulted in over-education causing both unemployment and low-level
employment. Finding employment has become more difficult than ever and graduate
unemployment is rising (Nunez and Livanos 2009:3).
Skills mismatch: Nunez and Livanos (2009:8) discussed the employability of graduates in
Europe based on various fields of tertiary education. In a multivariate analysis, social business
and law were used as the reference groups. Fields of study in which graduates are most likely
to find employment are: physics and chemistry, foreign languages, statistics and mathematics,
and computer science. The fields of study in which graduates are least likely to find
employment include: health and welfare, education and engineering. However, the analysis
shows that health and welfare degrees provide over-the-mean employability. For these
graduates the likelihood of being employed is 0.54 times higher than the probability of the
reference group.
Lack of soft skills: In Belgium and Sweden, two of the EU countries with the lowest graduate
unemployment rates, potential employers consider that although university graduates are
hard-working and possess an excellent knowledge of their specialization, they are ill prepared
for real-world conditions and show few signs of creativity, adaptability and flexibility. This

49
view has been also expressed in some other countries, including Germany, Japan, New
Zealand, Norway and the United Kingdom (Kostoglou and Paloukis 2007).
Other causes: Teichler (2007:3) further added that graduate unemployment in Europe is due to
a diverse range of other factors such as the length of higher education programmes, vocational
versus academic provision, institutional reputation, and the extent to which independent learning is
encouraged.
3.3.3.3 Underemployment
The fact that employment opportunities matching the skills levels of graduates are not
available results in underemployment in Europe. The appropriateness of the level of
employment, in terms of the position or profession is often not aligned to the level of
educational attainment and credentials. Too many graduates were viewed as over-educated
and thus they were underemployed due to both the economy not being able to create jobs at a
pace which is able to absorb all graduates into the labour market and to the mismatch of skills.
European graduates surveyed see about four years after graduation that there is little or no
utilisation of their skills acquired during their studies while employed, and that the work and
employment situation is worse than expected. This predominantly occurs in France, where 36%
of graduates feel this way, followed by Spain and the United Kingdom, where the figure is
25% (Teichler 2002:211).
3.3.4 International comparative overview
Table 3.4 summarises the causes of unemployment in South Africa, India, China and Europe, which
leads to the conclusion that graduate unemployment in South Africa is nothing peculiar, as similar
causes apply in other countries.

50
Table 3.4: Causes of graduate unemployment in South Africa, India, China and Europe South
Africa India China Europe
Cau
ses
of G
radu
ate
Une
mpl
oym
ent
Skills mismatch × ×
× ×
Quality of education × × × × Employment discrimination
×
Lack of soft skills × × Lack of work experience
×
High reservation wage
×
Wage rigidity × × Increased access to tertiary education
× × ×
×
Duration (frictional unemployment)
× ×
×
Consequence Underemployment × × ×
The international comparative analysis firstly shows that graduate unemployment in South
Africa, India and China is higher than graduate unemployment on average in Europe.
However the causes of graduate unemployment are predominantly similar and not specific to
the development phase of countries. Nonetheless it is important to note that developing
countries all experienced the natural structural shift away from unskilled labour towards
skilled labour. This structural shift caused an increase in access to tertiary education but what
is common among the developing countries is that the increase in graduates was not matched
with an increase in job opportunities, therefore causing graduate unemployment.
Across all countries graduate unemployment is largely augmented by the poor quality of
institutions hindering the employment prospects of graduates from these institutions. Another
key cause of graduate unemployment is the mismatch between the skills demanded by the
various economies and the skills supplied by graduates. The fields of education demanded
across the countries investigated are quite similar alluding to the effect of globalisation on the
demand for skills to remain competitive.
Interestingly, all countries experience underemployment. Underemployment is a serious
consequence of graduate unemployment. The South African case of underemployment will be
discussed in chapter four. Graduates do not find jobs which are aligned to their qualifications.
Graduates therefore do not receive the expected return on their investment in education as
stated by the human capital theory. Conclusively, graduate unemployment and its causes is

51
not unique to South Africa and nor is it concentrated amongst developing countries
consequently graduate unemployment is a global phenomenon.
3.4 CONCLUSION
Graduate unemployment in South Africa has shown a decreasing trend of late but is, however,
the fastest growing type of unemployment. Furthermore it is concerning that in South Africa
we are not able to employ those individuals which are the most educated and therefore have
the highest employment prospects. However to better understand graduate unemployment it
was important to investigate the primary causes of graduate unemployment.
South Africa experienced an increase in access to higher education resulting in an increase in
graduates entering the labour market. However, employment creation in the economy did not
meet this augmentation of graduates, thus causing graduate unemployment. Higher education
is a heterogeneous product. This heterogeneity ensures that all individuals exiting the higher
education system will have different probabilities of finding employment in the labour
market. This difference may often be linked to the quality of certain institutions and
subsequently the perception of employers of graduates from these institutions causing
statistical discrimination. There is a serious skills mismatch problem which plagues graduates.
Graduates therefore are encouraged and advised to study in the fields in greater demand by
the labour market. Furthermore, market rigidities also largely attributed to the increasing trend
of graduate unemployment.
These factors driving graduate unemployment have resulted in the nature of graduate
unemployment being concentrated among the youth, Africans and particularly those within
the fields of business, commerce and management and education, training and development.
Graduate unemployment is not unique to South Africa and is clearly a universal phenomenon
across both developed and developing countries. It is higher in India, China and South Africa,
when compared to European countries; this can be attributed to the differing economic and
demographic circumstances. The causes of graduate unemployment in China, India and
Europe are largely linked to the expansion of access to tertiary education. This factor
coincides with the causes of graduate unemployment in South Africa in that after 1994 Blacks
gained increased access to tertiary education, which plays an important role in this race group
accounting for the highest share of graduate unemployment. The field of education also has a

52
substantive impact on the employability of graduates internationally. The issue around wage
rigidities distinctively affects graduates access to employment in South Africa and India.
Furthermore, as internationally proven, elements such as the institutional reputation and soft
skills of graduates are also important determinants of employment. Lastly, underemployment
seems to be a common trend amongst the investigated countries, which is further confirmed in
Chapter Four with regards to South Africa.
Through assessing the literature on graduate unemployment for the period 1995 and 2005 it is
apparent that the acquiring of higher education is a necessary but not a sufficient condition for
finding employment in the domestic labour market. Graduate unemployment, however,
continues to plague South Africa's socio-economic development and therefore it is critical to
determine if any recent changes in the nature and causes of graduate unemployment occurred
beyond 2005 in order to effectively address this problem.

53
CHAPTER FOUR: GRADUATE UNEMPLOYMENT: 1995- 2010
4.1 INTRODUCTION
Through the review of relevant theory and literature, a premise has been derived for a
descriptive and analytical overview of graduate unemployment. The review of the literature in
chapter three has revealed the problem of graduate unemployment by comparing the OHS
1995 with the latest available LFS. However, this chapter will present a dynamic overview of
the nature of graduate unemployment as well as consider other leading factors to account for
unemployment amongst graduates. The analysis will in addition to the existing literature
determine graduate unemployment by gender and by province as well as the effect of previous
work experience of the employment of graduates. This will be done by analysing all 1995–
2010 Stats SA labour survey data, that is, the 1995-1999 October Household Surveys (OHS),
the 2000-2007 Labour Force Surveys (LFS) and the 2008-2010 Quarterly Labour Force
Surveys (QLFS). A key aim of this chapter is to conduct a time-series analysis on graduate
unemployment using analytical techniques and thereby update existing data on graduate
unemployment so that more accurate inferences on this topic can be made.
The chapter will firstly discuss the data sources. Secondly, the descriptive statistics will be
analysed to determine the trends involved in graduate unemployment as well as the
demographic and human capital characteristics of graduate unemployment. Thirdly,
multivariate probit analyses will determine the characteristics of the graduate labour force that
were more likely to find employment. Lastly, an advanced analysis will be done related to
topics such as discrimination, jobless growth, employment absorption and underemployment.
4.2 METHODOLOGY
4.2.1 Data
Before proceeding with the analysis, it is worth speaking briefly about the data used in this
study. Three main data sources were utilised in this study, namely the October Household
Survey (OHS), the Labour Force Survey (LFS) and the Quarterly Labour Force Survey
(QLFS). All surveys are nationally representative household surveys conducted by Statistics
South Africa (Stats SA). Stats SA has been collecting labour market data since 1993. The
OHS, which was conducted annually between 1993 and 1999, as well as the LFS, which was

54
a biannual survey introduced in 2000 to replace the OHS. The QLFS was introduced to
replace the LFS in 2008.
These changes in data collection by Stats SA have implications on conclusive long-term trend
analysis. The changeover from OHS to LFS included changes in the sampling frame,
variation in the questionnaire design, adjustments in the methodology to determine the labour
market status, trends in several variables (e.g., demographics, educational attainment, labour
force participation rates, unemployment rates, earnings, etc.), over-sampling of informal
sector workers in 2000, over-estimation of the earnings of self-employed in the OHSs, and the
continuous development of the questionnaire by Stats SA (Yu 2009: 3).
Two newly derived variables in the QLFS – unemployment status and underemployment
status – are also discussed (Yu 2009:21). Furthermore, the broad labour market status
derivation methodologies adopted between 1995 and 2007, and from 2008 onwards are not
comparable;9 therefore this chapter will only use the narrow definition of unemployment.
4.2.2 Advanced analysis
The section on descriptive statistics makes use of economic data with the aim of giving
empirical content to the problem of graduate unemployment between 2005 and 2010. This
time series analysis makes use of a single variable as a function of one or more explanatory
variables to assess the extent and nature of graduate unemployment.
The advanced analysis applies mathematical and statistical methods to determine economic
relations. Firstly, a multivariate analysis is done to determine the maximum likelihood of
particular variables to be employed compared to the reference group. Furthermore an analysis
will be done to observe jobless growth, employment absorption and underemployment
amongst graduates in South Africa. The Oaxaca- Blinder decomposition is used as an
analytical tool which measures explained and unexplained discrimination amongst graduates
in the labour market. This analytical tool is further explained in section 4.4.2.
9 Refer to Yu (2009) for more detailed information on the incomparability of broad and narrow unemployment between 1995 and 2008

55
4.3 DESCRIPTIVE STATISTICS
This section will focus on single variate analysis with the aim of determining the extent and
nature of graduate unemployment in South Africa from a dynamic perspective for the period
1995 to 2010.
4.3.1 The extent of graduate unemployment
Between 1995 and 2010 there was a general increase in the number of graduates who were
unemployed in South Africa. However unstable up and down trends are observed when
observing the data in greater detail. In Figure 4.1 an increasing trend in unemployment was
experienced by graduates for most years between 1995 and 2003a; after that graduate
unemployment began to decrease from 2003b. Between 2004 and 2009 graduate
unemployment showed an increasing trend. 2009 onwards the number of unemployed
graduates began to show marked increases peaking in 2010.
Graduate unemployment as a proportion of all unemployed persons indicate an increasing
trend between 1995 and 2010. Figure 4.2 shows that from 2004 the percentage of graduate
unemployment consistently increased. This trend is in line with the literature, which states
that the rapid increase in access to tertiary education, particularly for Black students, resulted
in noticeable increases in graduate unemployment. Section 3.2.3 explains in more detail how
the rapid increase in access to tertiary education resulted in the oversupply of graduates,
compared to the demand for graduates and thus attributing graduate unemployment. The
lagged cyclical effect of the 2008 financial crisis on unemployment had a marked impact.
Section 2.3 can be referred to for a more specific explanation on how cyclical effects impacts
on unemployment. This cyclical effect is displayed by the peak in graduate unemployment
between 2009 and 2010 at approximately 6%.
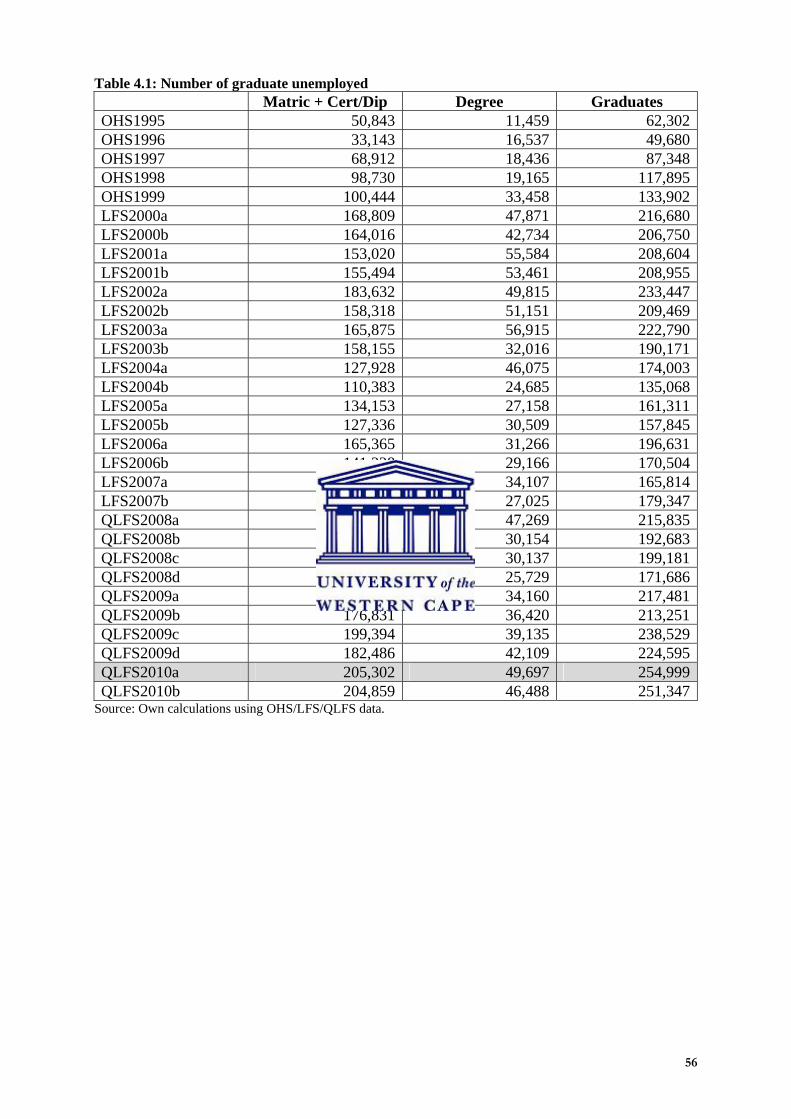
56
Table 4.1: Number of graduate unemployed Matric + Cert/Dip Degree Graduates
OHS1995 50,843 11,459 62,302OHS1996 33,143 16,537 49,680OHS1997 68,912 18,436 87,348OHS1998 98,730 19,165 117,895OHS1999 100,444 33,458 133,902LFS2000a 168,809 47,871 216,680LFS2000b 164,016 42,734 206,750LFS2001a 153,020 55,584 208,604LFS2001b 155,494 53,461 208,955LFS2002a 183,632 49,815 233,447LFS2002b 158,318 51,151 209,469LFS2003a 165,875 56,915 222,790LFS2003b 158,155 32,016 190,171LFS2004a 127,928 46,075 174,003LFS2004b 110,383 24,685 135,068LFS2005a 134,153 27,158 161,311LFS2005b 127,336 30,509 157,845LFS2006a 165,365 31,266 196,631LFS2006b 141,338 29,166 170,504LFS2007a 131,707 34,107 165,814LFS2007b 152,322 27,025 179,347QLFS2008a 168,566 47,269 215,835QLFS2008b 162,529 30,154 192,683QLFS2008c 169,044 30,137 199,181QLFS2008d 145,957 25,729 171,686QLFS2009a 183,321 34,160 217,481QLFS2009b 176,831 36,420 213,251QLFS2009c 199,394 39,135 238,529QLFS2009d 182,486 42,109 224,595QLFS2010a 205,302 49,697 254,999QLFS2010b 204,859 46,488 251,347
Source: Own calculations using OHS/LFS/QLFS data.

57
Figure 4.1: Graduate unemployed as a proportion of all unemployed
0%
1%
2%
3%
4%
5%
6%
7%
OH
S19
95
OH
S19
96
OH
S19
97
OH
S19
98
OH
S19
99
LF
S20
00a
LF
S20
00b
LF
S20
01a
LF
S20
01b
LF
S20
02a
LF
S20
02b
LF
S20
03a
LF
S20
03b
LF
S20
04a
LF
S20
04b
LF
S20
05a
LF
S20
05b
LF
S20
06a
LF
S20
06b
LF
S20
07a
LF
S20
07b
QL
FS
2008
a
QL
FS
2008
b
QL
FS
2008
c
QL
FS
2008
d
QL
FS
2009
a
QL
FS
2009
b
QL
FS
2009
c
QL
FS
2009
d
QL
FS
2010
a
QL
FS
2010
b
Source: Own calculations using OHS/LFS/QLFS data. Note: Unemployed with unspecified educational attainment are excluded.
4.3.2 The nature of graduate unemployment
The nature of graduate unemployment reviews the demographic and human capital
characteristics of graduates between 1995 and 2010. This section therefore explains which
factors determines and impacts the probability of being an unemployed graduate.
4.3.2.1 Demographic characteristics
a) Race
If one looks at graduate unemployment by race, Figure 4.2 shows that the highest
unemployment rates were experienced by Black graduates. Black graduates show an
increasing trend in unemployment rates before peaking in 2000 at approximately 24%.
However, these rates have since displayed a declining trend. This decline can be a result of
the impact of BEE which encourages the employment of Blacks in South Africa and which is
explained further in section 3.2.3.4 under labour market inflexibility.
On the other hand, White graduate unemployment rates account for the lowest rates of
graduate unemployment for this period compared to other races. This pattern is evidence of
the fact that employment in South Africa was generated for approximately only a quarter of
all new African entrants into the labour market, relative to 74.69% of all new White entrants
as explained in section 3.2.2. Therefore through extending the period of analysis it can be

58
concluded that the racial trends have consistently continued, in that graduate unemployment is
concentrated amongst Black graduates and lowest amongst White graduates.
Figure 4.2: Graduate unemployment rates by race
0%
2%
4%
6%
8%
10%
12%
14%
16%
18%
20%
22%
24%
26%
OH
S19
95
OH
S19
96
OH
S19
97
OH
S19
98
OH
S19
99
LF
S20
00a
LF
S20
00b
LF
S20
01a
LF
S20
01b
LF
S20
02a
LF
S20
02b
LF
S20
03a
LF
S20
03b
LF
S20
04a
LF
S20
04b
LF
S20
05a
LF
S20
05b
LF
S20
06a
LF
S20
06b
LF
S20
07a
LF
S20
07b
QL
FS20
08Q
1
QL
FS20
08Q
2
QL
FS20
08Q
3
QL
FS20
08Q
4
QL
FS20
09Q
1
QL
FS20
09Q
2
QL
FS20
09Q
3
QL
FS20
09Q
4
QL
FS20
10Q
1
QL
FS20
10Q
2
All Black Coloured Indian White
Source: Own calculations using OHS/LFS/QLFS data.
From Table 4.2 one will notice that between 1995 and 2010 Black graduates account for the
highest percentages of graduate unemployment amongst those with a certificate/diploma and
those with degrees.. Of total graduate unemployment, unemployment amongst Blacks with a
certificate/diploma increased from 79.0% to 87.0% for 1995 and 2010 respectively.
Conversely it decreased for White graduates with the same type of tertiary education from
11.1% to 6.3%. Similar trends were observed with graduates with degrees, where the
proportion of Black graduates made up 53.4% of the unemployed. This figure then increased
to 73.3% in 2010. On the other hand, the share of unemployment among White graduates’
with degrees declined from 16.3% to 8.2%.

59
Table 4.2: Racial share of unemployed graduates Matric + Cert/Dip
1995-1997
1998-1999
2000-2002
2003-2005
2006-2007
2008-2010
Black 79.0% 82.1% 86.9% 88.1% 89.4% 87.0% Coloured 6.2% 4.9% 4.1% 3.4% 3.0% 4.5% Indian 3.7% 4.3% 2.5% 1.4% 1.2% 2.2% White 11.1% 8.6% 6.4% 7.0% 6.4% 6.3% Other/Unspecified 0.0% 0.0% 0.1% 0.1% 0.0% 0.0% 100.0% 100.0% 100.0% 100.0% 100.0% 100.0% Degree
1995-1997
1998-1999
2000-2002
2003-2005
2006-2007
2008-2010
Black 53.4% 71.8% 75.9% 66.0% 71.1% 73.4% Coloured 7.3% 2.9% 3.3% 2.6% 0.7% 5.2% Indian 6.0% 2.6% 4.9% 6.6% 4.9% 4.2% White 33.3% 22.7% 15.8% 24.1% 23.4% 17.3% Other/Unspecified 0.0% 0.0% 0.1% 0.8% 0.0% 0.0% 100.0% 100.0% 100.0% 100.0% 100.0% 100.0% Graduates
1995-1997
1998-1999
2000-2002
2003-2005
2006-2007
2008-2010
Black 73.1% 80.0% 84.3% 83.5% 86.3% 84.6% Coloured 6.4% 4.5% 3.9% 3.3% 2.6% 4.6% Indian 4.3% 4.0% 3.0% 2.5% 1.9% 2.6% White 16.3% 11.6% 8.6% 10.6% 9.3% 8.2% Other/Unspecified 0.0% 0.0% 0.1% 0.3% 0.0% 0.0% 100.0% 100.0% 100.0% 100.0% 100.0% 100.0%
Source: Own calculations using OHS/LFS/QLFS data. Note: Unemployed with unspecified educational attainment are excluded.
b) Graduate unemployment by age
Table 4.3 shows that the youth (people aged 15-24 years and 25-34 years at the time of the
survey) present the highest proportion of unemployment for the period 1995 to 2010.10 This is
true for both those with a certificate/diploma and with a degree. The youth are most likely to
be unemployed due to their lack of experience and soft skills, their high reservation wages
and their inflated expectations. Those between the age of 25 and 34 years with a
certificate/diploma make up more than half of unemployed graduates, while those with a
degree account for an equally high 43.7% of graduate unemployment. Figure 4.3 more
explicitly shows the extent to which graduate unemployment is concentrated amongst the
youth. From the youth between 2006 and 2007, 82% of graduates were unemployed, 83% of
10 Because of such high youth unemployment rates (including graduate unemployment), the government will be implementing the youth wage subsidy from 1 April 2012 to boost youth employment creation, however the wage subsidy is not specifically directed at graduates.

60
graduates with a certificate/diploma are unemployed, while a lower, 74% of persons with a
degree were unemployed
Table 4.3: Age cohort share of unemployed graduates Matric + Cert/Dip 1995-1997 1998-1999 2000-2002 2003-2005 2006-2007 2008-2010 15-24 years 29.7% 31.1% 30.3% 28.2% 30.6% 28.2%25-34 years 55.5% 53.9% 55.0% 56.1% 52.2% 51.9%35-44 years 10.1% 11.1% 10.1% 11.3% 12.2% 14.2%45-54 years 2.9% 3.4% 4.1% 3.8% 4.4% 4.3%55-65 years 1.9% 0.6% 0.5% 0.6% 0.6% 1.5% 100.0% 100.0% 100.0% 100.0% 100.0% 100.0% Degree 1995-1997 1998-1999 2000-2002 2003-2005 2006-2007 2008-2010 15-24 years 26.0% 28.4% 21.2% 17.1% 18.3% 25.5%25-34 years 53.6% 43.8% 54.8% 54.8% 55.0% 43.7%35-44 years 11.4% 15.4% 15.1% 19.3% 15.3% 19.1%45-54 years 3.2% 12.5% 6.4% 7.0% 7.5% 7.6%55-65 years 5.8% 0.0% 2.4% 1.8% 3.9% 4.2% 100.0% 100.0% 100.0% 100.0% 100.0% 100.0% Graduates 1995-1997 1998-1999 2000-2002 2003-2005 2006-2007 2008-2010 15-24 years 28.8% 30.5% 28.2% 25.9% 28.5% 27.7%25-34 years 55.0% 51.8% 55.0% 55.8% 52.7% 50.5%35-44 years 10.4% 12.0% 11.3% 13.0% 12.8% 15.1%45-54 years 3.0% 5.3% 4.6% 4.5% 4.9% 4.8%55-65 years 2.8% 0.5% 1.0% 0.9% 1.2% 2.0% 100.0% 100.0% 100.0% 100.0% 100.0% 100.0%
Source: Own calculations using OHS/LFS/QLFS data. Figure 4.3: Proportion of graduate unemployed who were younger than 35 years at the time of survey
0
10
20
30
40
50
60
70
80
90
100
1995-1997 1998-1999 2000-2002 2003-2005 2006-2007
Graduates Matric + Cert/Dip Degree
Source: Own calculations using OHS/LFS/QLFS data.

61
c) Graduate unemployment by gender
The trends below differentiate graduate unemployment between males and females. Between
1995 and 2010 unemployment amongst female graduates increased from 56.1% to 60.5%. In
2008 to 2010 unemployment among graduates with degrees shows an almost even gender
split. Those with a certificate/diploma show a greater difference in graduate unemployment,
where males make up 37.4% and females 62.6% of total unemployment.
Table 4.4: Gender share of unemployed graduates Matric + Cert/Dip 1995-1997 1998-1999 2000-2002 2003-2005 2006-2007 2008-2010Male 41.7% 40.2% 39.1% 38.6% 37.0% 37.4%Female 58.3% 59.8% 60.9% 61.4% 63.0% 62.6% 100.0% 100.0% 100.0% 100.0% 100.0% 100.0% Degree 1995-1997 1998-1999 2000-2002 2003-2005 2006-2007 2008-2010Male 51.0% 48.9% 43.9% 52.2% 50.3% 49.3%Female 49.0% 50.0% 56.1% 47.8% 49.7% 50.7% 100.0% 100.0% 100.0% 100.0% 100.0% 100.0% Graduates 1995-1997 1998-1999 2000-2002 2003-2005 2006-2007 2008-2010Male 43.9% 42.0% 40.2% 41.5% 39.3% 39.5%Female 56.1% 57.8% 59.8% 58.5% 60.7% 60.5% 100.0% 100.0% 100.0% 100.0% 100.0% 100.0%
Source: Own calculations using OHS/LFS/QLFS data.
d) Graduate unemployment by province
In the assessment of graduate unemployment by province, marked differences are noticed
across the provincial structures of South Africa. Gauteng province consistently shows the
highest shares of graduate unemployment over the period 1995 to 2005 with figures averaging
30%. Gauteng province is South Africa's leading province in terms of GDP contribution;
therefore there is an influx into this province of graduates in pursuit of employment, which
consequently leads to a high unemployment rate11. Alternatively, provinces such as the
Northern Cape and Free State account for the lowest shares of graduate unemployment, which
may be due to the fact that in these provinces people dropped out before Matric or do not have
the ability or finance available to pursue post-matriculation studies. Therefore, this limits the
students gaining access to tertiary institutions and thus these provinces do not have an over-
supply of graduates in comparison to the demand for graduates. Furthermore individuals from
11 It is possible that these migrant graduates still remain unemployable (due to skills mismatch / etc.), even after they migrate to Gauteng, the province with most abundant job opportunities, yet they remain in Gauteng to seek employment opportunities. This eventually pushes up the graduate unemployment rate in Gauteng.

62
these provinces may have opted to move to other provinces such as Gauteng with the
perception that employment opportunities are greater in alternative provinces.
Table 4.5: Provincial share of unemployed graduates Graduates 1995-1997 1998-1999 2000-2002 2003-2005 2006-2007 2008-2010Western Cape 12.8% 6.9% 5.3% 6.6% 6.6% 9.5%Eastern Cape 11.5% 13.9% 12.0% 12.0% 10.7% 8.5%Northern Cape 0.9% 1.3% 1.0% 1.3% 1.6% 1.3%Free State 4.9% 4.9% 5.4% 6.9% 6.2% 5.5%KwaZulu-Natal 13.4% 15.4% 19.2% 14.1% 14.1% 13.9%North West 5.2% 6.4% 7.3% 8.4% 8.4% 8.0%Gauteng 31.2% 24.2% 28.2% 28.2% 32.6% 30.4%Mpumalanga 4.4% 8.3% 6.8% 6.1% 6.7% 8.8%Limpopo 15.8% 18.8% 14.9% 16.2% 13.2% 14.2% 100.0% 100.0% 100.0% 100.0% 100.0% 100.0%
Source: Own calculations using OHS/LFS/QLFS data.
4.3.2.2 Human capital characteristics
a) Educational attainment
Table 4.6 shows that individuals with an incomplete secondary education accumulate the
highest share of unemployment increasing from 21.3% in 1995 to 30.7% in 2010.
Interestingly, those with a Matric become equally highly unemployed as the years progress,
which indicates the increasingly higher demand for education by employers over the years.
Therefore the unemployment rate amongst the graduates still remains the lowest, compared
with unemployment rates of people from other educational attainment categories.
However, it is clearly illustrated that individuals with a certificate/diploma have significantly
lower unemployment rates. As expected, it is evident that graduates with a degree account for
the lowest unemployment rates. Graduate unemployment displayed an increasing trend before
peaking in 2000 at 16.6%. Thereafter graduate unemployment rates in South Africa have
displayed a decreasing trend, reaching 10.9% in 2010. Although graduate unemployment rates
have decreased, it remains a matter of concern that, withstanding the structural shift towards
skilled employment, graduate unemployment still exists.
Figure 4.4 in addition graphically shows that the level of educational attainment matters. The
higher the level, the lower the probability of being unemployed as explained by the human
capital theory in Section 2.4.1. The fact that unemployment is higher amongst those with
lower levels of education explains the rationale behind graduates decision to invest in higher
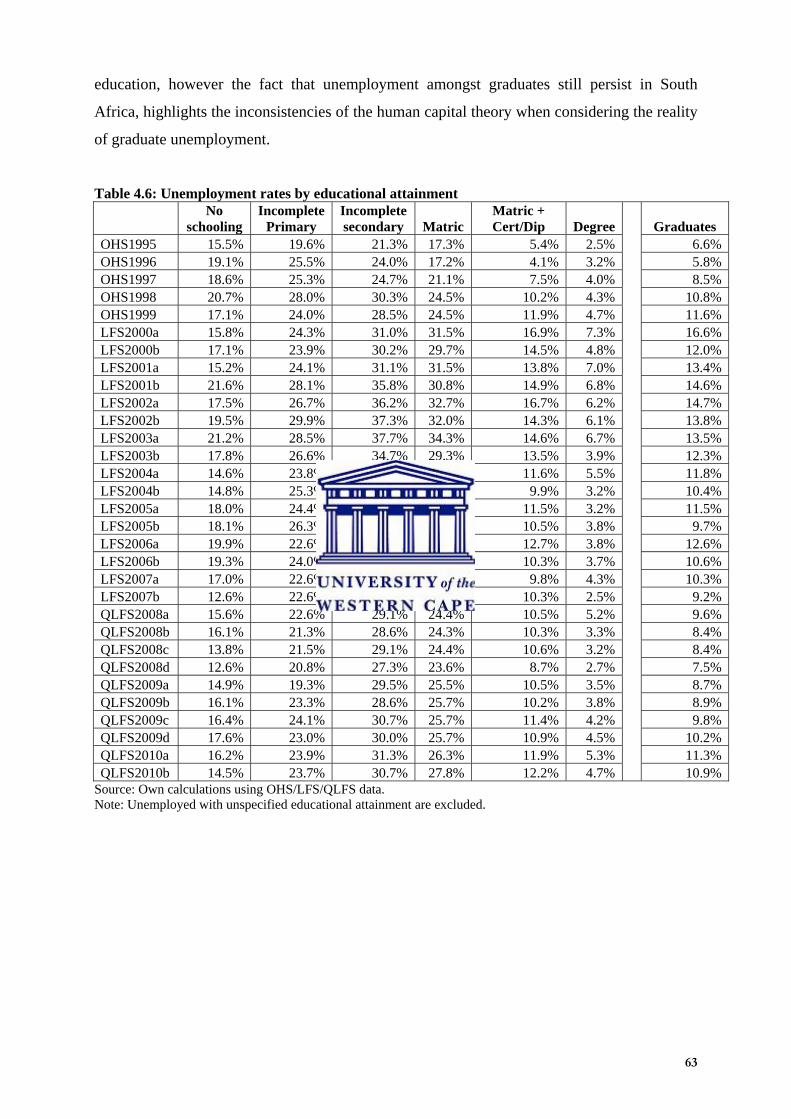
63
education, however the fact that unemployment amongst graduates still persist in South
Africa, highlights the inconsistencies of the human capital theory when considering the reality
of graduate unemployment.
Table 4.6: Unemployment rates by educational attainment
No
schooling Incomplete
Primary Incomplete secondary Matric
Matric + Cert/Dip Degree
Graduates
OHS1995 15.5% 19.6% 21.3% 17.3% 5.4% 2.5% 6.6%OHS1996 19.1% 25.5% 24.0% 17.2% 4.1% 3.2% 5.8%OHS1997 18.6% 25.3% 24.7% 21.1% 7.5% 4.0% 8.5%OHS1998 20.7% 28.0% 30.3% 24.5% 10.2% 4.3% 10.8%OHS1999 17.1% 24.0% 28.5% 24.5% 11.9% 4.7% 11.6%LFS2000a 15.8% 24.3% 31.0% 31.5% 16.9% 7.3% 16.6%LFS2000b 17.1% 23.9% 30.2% 29.7% 14.5% 4.8% 12.0%LFS2001a 15.2% 24.1% 31.1% 31.5% 13.8% 7.0% 13.4%LFS2001b 21.6% 28.1% 35.8% 30.8% 14.9% 6.8% 14.6%LFS2002a 17.5% 26.7% 36.2% 32.7% 16.7% 6.2% 14.7%LFS2002b 19.5% 29.9% 37.3% 32.0% 14.3% 6.1% 13.8%LFS2003a 21.2% 28.5% 37.7% 34.3% 14.6% 6.7% 13.5%LFS2003b 17.8% 26.6% 34.7% 29.3% 13.5% 3.9% 12.3%LFS2004a 14.6% 23.8% 34.5% 31.5% 11.6% 5.5% 11.8%LFS2004b 14.8% 25.3% 32.9% 27.7% 9.9% 3.2% 10.4%LFS2005a 18.0% 24.4% 33.0% 27.7% 11.5% 3.2% 11.5%LFS2005b 18.1% 26.3% 32.6% 28.2% 10.5% 3.8% 9.7%LFS2006a 19.9% 22.6% 31.3% 27.1% 12.7% 3.8% 12.6%LFS2006b 19.3% 24.0% 31.4% 26.7% 10.3% 3.7% 10.6%LFS2007a 17.0% 22.6% 31.9% 26.8% 9.8% 4.3% 10.3%LFS2007b 12.6% 22.6% 29.5% 23.2% 10.3% 2.5% 9.2%QLFS2008a 15.6% 22.6% 29.1% 24.4% 10.5% 5.2% 9.6%QLFS2008b 16.1% 21.3% 28.6% 24.3% 10.3% 3.3% 8.4%QLFS2008c 13.8% 21.5% 29.1% 24.4% 10.6% 3.2% 8.4%QLFS2008d 12.6% 20.8% 27.3% 23.6% 8.7% 2.7% 7.5%QLFS2009a 14.9% 19.3% 29.5% 25.5% 10.5% 3.5% 8.7%QLFS2009b 16.1% 23.3% 28.6% 25.7% 10.2% 3.8% 8.9%QLFS2009c 16.4% 24.1% 30.7% 25.7% 11.4% 4.2% 9.8%QLFS2009d 17.6% 23.0% 30.0% 25.7% 10.9% 4.5% 10.2%QLFS2010a 16.2% 23.9% 31.3% 26.3% 11.9% 5.3% 11.3%QLFS2010b 14.5% 23.7% 30.7% 27.8% 12.2% 4.7% 10.9%
Source: Own calculations using OHS/LFS/QLFS data. Note: Unemployed with unspecified educational attainment are excluded.
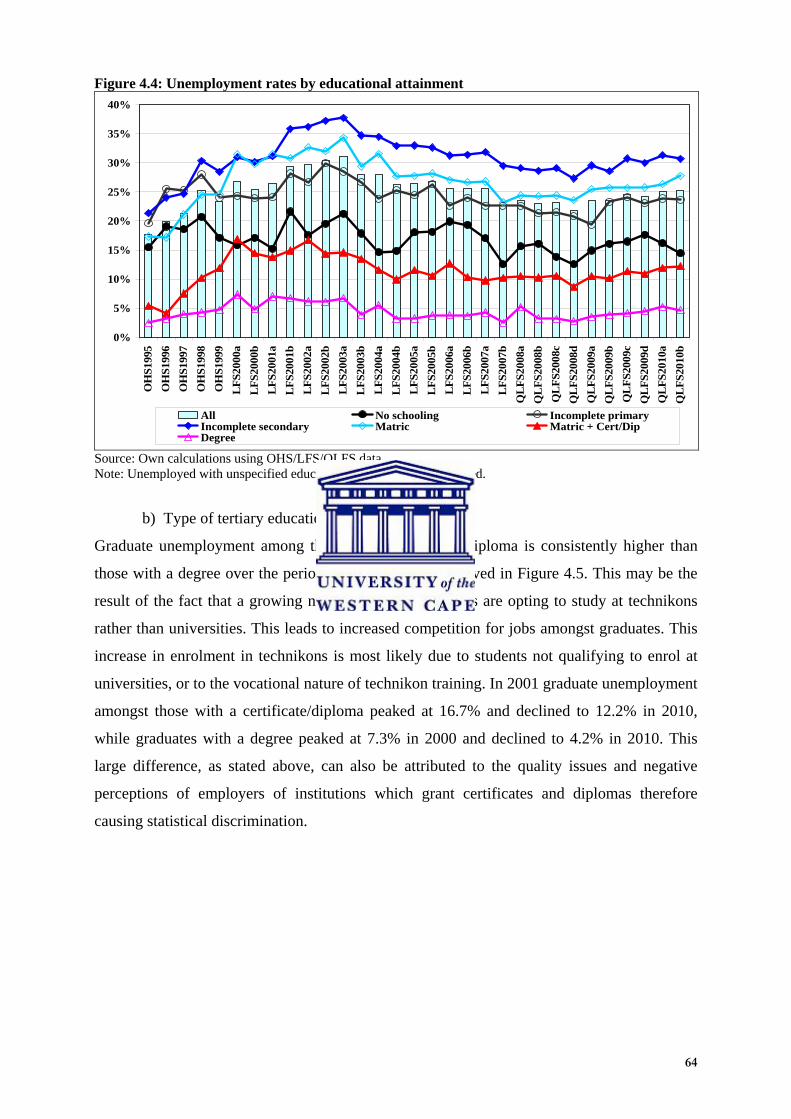
64
Figure 4.4: Unemployment rates by educational attainment
0%
5%
10%
15%
20%
25%
30%
35%
40%
OH
S19
95
OH
S19
96
OH
S19
97
OH
S19
98
OH
S19
99
LF
S20
00a
LF
S20
00b
LF
S20
01a
LF
S20
01b
LF
S20
02a
LF
S20
02b
LF
S20
03a
LF
S20
03b
LF
S20
04a
LF
S20
04b
LF
S20
05a
LF
S20
05b
LF
S20
06a
LF
S20
06b
LF
S20
07a
LF
S20
07b
QL
FS
2008
a
QL
FS
2008
b
QL
FS
2008
c
QL
FS
2008
d
QL
FS
2009
a
QL
FS
2009
b
QL
FS
2009
c
QL
FS
2009
d
QL
FS
2010
a
QL
FS
2010
b
All No schooling Incomplete primaryIncomplete secondary Matric Matric + Cert/DipDegree
Source: Own calculations using OHS/LFS/QLFS data. Note: Unemployed with unspecified educational attainment are excluded.
b) Type of tertiary education
Graduate unemployment among those with a certificate/diploma is consistently higher than
those with a degree over the period 1995 to 2010 as observed in Figure 4.5. This may be the
result of the fact that a growing number of South Africans are opting to study at technikons
rather than universities. This leads to increased competition for jobs amongst graduates. This
increase in enrolment in technikons is most likely due to students not qualifying to enrol at
universities, or to the vocational nature of technikon training. In 2001 graduate unemployment
amongst those with a certificate/diploma peaked at 16.7% and declined to 12.2% in 2010,
while graduates with a degree peaked at 7.3% in 2000 and declined to 4.2% in 2010. This
large difference, as stated above, can also be attributed to the quality issues and negative
perceptions of employers of institutions which grant certificates and diplomas therefore
causing statistical discrimination.
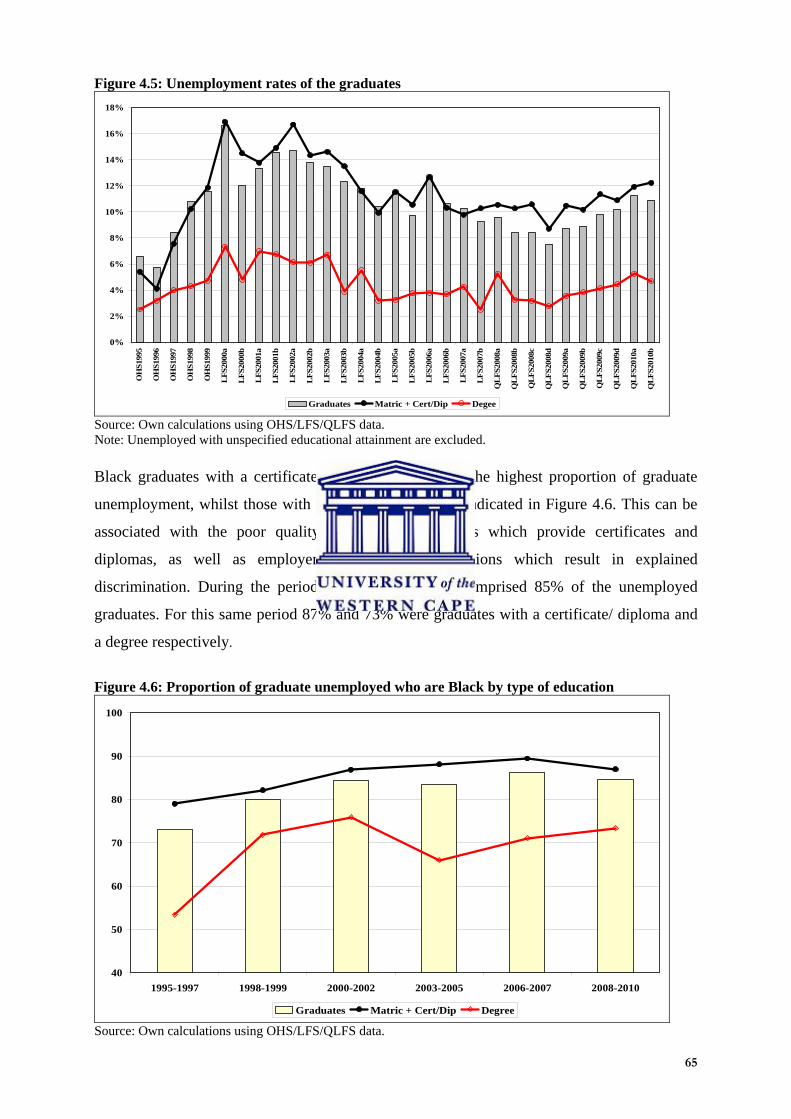
65
Figure 4.5: Unemployment rates of the graduates
0%
2%
4%
6%
8%
10%
12%
14%
16%
18%
OH
S19
95
OH
S19
96
OH
S19
97
OH
S19
98
OH
S19
99
LF
S20
00a
LF
S200
0b
LF
S20
01a
LF
S200
1b
LF
S20
02a
LF
S200
2b
LF
S20
03a
LF
S200
3b
LF
S20
04a
LF
S200
4b
LF
S20
05a
LF
S200
5b
LF
S20
06a
LF
S200
6b
LF
S20
07a
LF
S200
7b
QL
FS
2008
a
QL
FS2
008b
QL
FS2
008c
QL
FS2
008d
QL
FS
2009
a
QL
FS2
009b
QL
FS2
009c
QL
FS2
009d
QL
FS
2010
a
QL
FS2
010b
Graduates Matric + Cert/Dip Degee
Source: Own calculations using OHS/LFS/QLFS data. Note: Unemployed with unspecified educational attainment are excluded.
Black graduates with a certificate/diploma contribute to the highest proportion of graduate
unemployment, whilst those with a degree are lower, as indicated in Figure 4.6. This can be
associated with the poor quality of tertiary institutions which provide certificates and
diplomas, as well as employers’ institutional perceptions which result in explained
discrimination. During the period 2008- 2010 Blacks comprised 85% of the unemployed
graduates. For this same period 87% and 73% were graduates with a certificate/ diploma and
a degree respectively.
Figure 4.6: Proportion of graduate unemployed who are Black by type of education
40
50
60
70
80
90
100
1995-1997 1998-1999 2000-2002 2003-2005 2006-2007 2008-2010
Graduates Matric + Cert/Dip Degree
Source: Own calculations using OHS/LFS/QLFS data.

66
c) Field of education12
Graduates who studied in the field of business/commerce/management consistently accounted
for the highest proportion of graduate unemployment. Interestingly, this proportion is even
higher for those with a degree in this field. In the period 2006 to 2007 graduates with a degree
in this field accounted for approximately a third of the unemployed graduates (36.8%). A
similar trend was observed for those with a diploma/certificate, who accounted for a
marginally lower share of 31.4%. However, this high unemployment of graduates in the
commerce field can be attributed to the high inflow of students studying in this direction. This
empirical finding is consistent with past literature which states that business, commerce and
management account for the highest share of graduate unemployment over the period 2000 to
2005 and that commerce students typically make up a very large proportion of tertiary
institutions (Pauw et al. 2006:19) as explained in Section 3.2.2.2.
Table 4.7 further indicates that fields such as education/training/development/
physical/mathematical/computer/life sciences and manufacturing/engineering/technology also
show high proportions of graduate unemployment over the period under investigation.
However, graduates with a certificate / diploma in the field of manufacturing / engineering /
technology and physical / mathematical / computer / life sciences show the highest levels of
unemployment. This is a consequence of the fact that South Africa demands graduates in the
fields of engineering, mathematics and science, but graduates with degrees are preferable as a
result of institutional perceptions.
12 The question on field of education was only asked in the LFS and therefore these statistics are only available for the period 2000 to 2007.
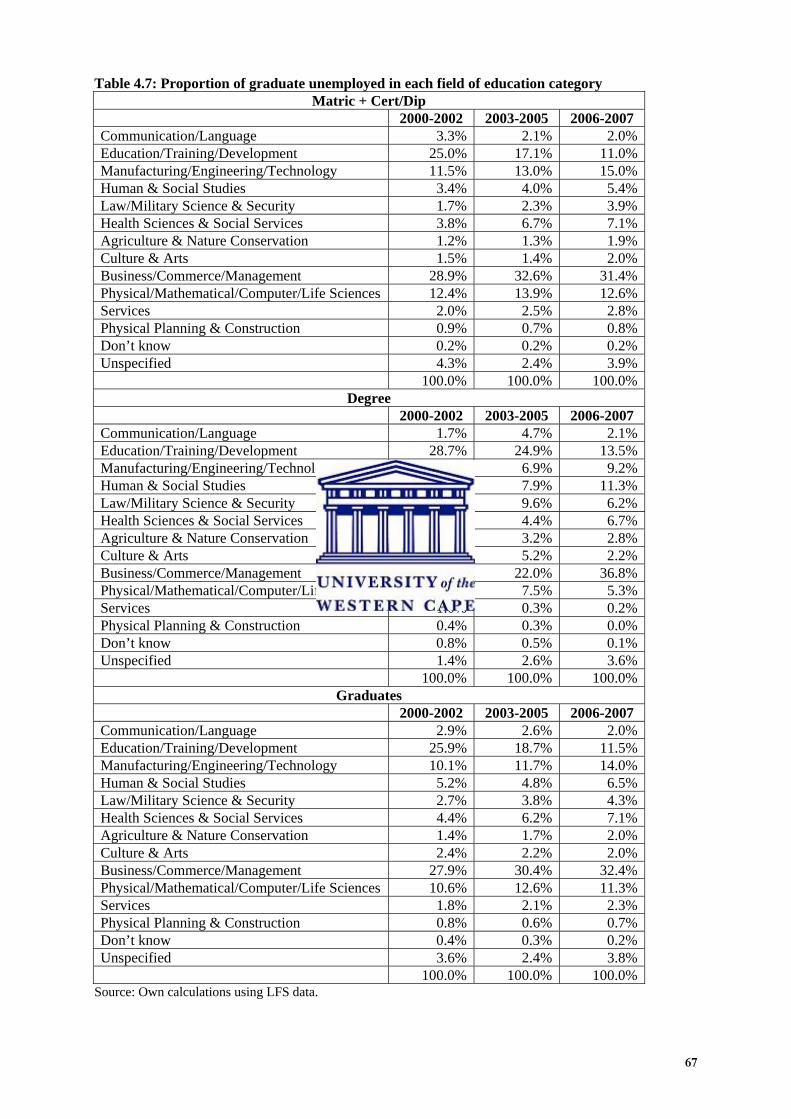
67
Table 4.7: Proportion of graduate unemployed in each field of education category Matric + Cert/Dip
2000-2002 2003-2005 2006-2007 Communication/Language 3.3% 2.1% 2.0% Education/Training/Development 25.0% 17.1% 11.0% Manufacturing/Engineering/Technology 11.5% 13.0% 15.0% Human & Social Studies 3.4% 4.0% 5.4% Law/Military Science & Security 1.7% 2.3% 3.9% Health Sciences & Social Services 3.8% 6.7% 7.1% Agriculture & Nature Conservation 1.2% 1.3% 1.9% Culture & Arts 1.5% 1.4% 2.0% Business/Commerce/Management 28.9% 32.6% 31.4% Physical/Mathematical/Computer/Life Sciences 12.4% 13.9% 12.6% Services 2.0% 2.5% 2.8% Physical Planning & Construction 0.9% 0.7% 0.8% Don’t know 0.2% 0.2% 0.2% Unspecified 4.3% 2.4% 3.9% 100.0% 100.0% 100.0%
Degree 2000-2002 2003-2005 2006-2007 Communication/Language 1.7% 4.7% 2.1% Education/Training/Development 28.7% 24.9% 13.5% Manufacturing/Engineering/Technology 5.4% 6.9% 9.2% Human & Social Studies 10.9% 7.9% 11.3% Law/Military Science & Security 6.1% 9.6% 6.2% Health Sciences & Social Services 6.5% 4.4% 6.7% Agriculture & Nature Conservation 1.9% 3.2% 2.8% Culture & Arts 5.6% 5.2% 2.2% Business/Commerce/Management 24.7% 22.0% 36.8% Physical/Mathematical/Computer/Life Sciences 4.7% 7.5% 5.3% Services 1.0% 0.3% 0.2% Physical Planning & Construction 0.4% 0.3% 0.0% Don’t know 0.8% 0.5% 0.1% Unspecified 1.4% 2.6% 3.6% 100.0% 100.0% 100.0%
Graduates 2000-2002 2003-2005 2006-2007 Communication/Language 2.9% 2.6% 2.0% Education/Training/Development 25.9% 18.7% 11.5% Manufacturing/Engineering/Technology 10.1% 11.7% 14.0% Human & Social Studies 5.2% 4.8% 6.5% Law/Military Science & Security 2.7% 3.8% 4.3% Health Sciences & Social Services 4.4% 6.2% 7.1% Agriculture & Nature Conservation 1.4% 1.7% 2.0% Culture & Arts 2.4% 2.2% 2.0% Business/Commerce/Management 27.9% 30.4% 32.4% Physical/Mathematical/Computer/Life Sciences 10.6% 12.6% 11.3% Services 1.8% 2.1% 2.3% Physical Planning & Construction 0.8% 0.6% 0.7% Don’t know 0.4% 0.3% 0.2% Unspecified 3.6% 2.4% 3.8% 100.0% 100.0% 100.0%
Source: Own calculations using LFS data.

68
4.3.2.3 Previous work experience
Over the long term, graduates who have worked before had lower levels of unemployment.
The difference between unemployed graduates who have and have not worked before
indicates a declining trend for individuals with a certificate/ diploma. Table 4.8 shows that,
between 2008 and 2010, 46.2 % of unemployed graduates claimed that they have never
worked before This may have to do with the fact that they studied in the wrong field, they
graduated from the poor-quality historically Black institutions, they have a too high
reservation wage and/or they are too optimistic about their chances of finding employment in
the future.
Table 4.8: Previous worked experience of graduate unemployed Matric + Cert/Dip 1995-1997 1998-1999 2000-2002 2003-2005 2006-2007 2008-2010 Worked before 26.2% 30.6% 39.6% 39.8% 43.4% 54.0%Never worked before 73.8% 69.4% 60.4% 60.2% 56.6% 46.0% 100.0% 100.0% 100.0% 100.0% 100.0% 100.0% Degree 1995-1997 1998-1999 2000-2002 2003-2005 2006-2007 2008-2010 Worked before 41.4% 44.5% 42.8% 40.4% 45.1% 52.7%Never worked before 58.6% 55.5% 57.2% 59.6% 54.9% 47.3% 100.0% 100.0% 100.0% 100.0% 100.0% 100.0% Graduates 1995-1997 1998-1999 2000-2002 2003-2005 2006-2007 2008-2010 Worked before 29.6% 33.5% 40.4% 40.0% 43.7% 53.8%Never worked before 70.4% 66.5% 59.6% 60.1% 56.3% 46.2% 100.0% 100.0% 100.0% 100.0% 100.0% 100.0%
Source: Own calculations using OHS/LFS/QLFS data.
4.4 MORE ADVANCED ANALYSIS
The preceding analysis focussed on one variable at a time. This section will present a
multivariate analysis. The aim of this section is to simultaneously look at the various factors
which determine the likelihood of employment of the labour force. Furthermore, it will draw
on particular techniques such as the Oaxaca-Blinder decomposition to identify if
discrimination exists. In addition, it will ascertain whether or not jobless growth exists
amongst graduates as well as what the graduate employment coefficient and what the
employment absorption rates are.
4.4.1 Econometric analysis
This section aims to achieve the likelihood of employment of certain cohorts relative to their
respective reference group. The dependent variable of the probit regression is employment (1:
Employed; 0: Unemployed). Therefore 1 will indicate the maximum likelihood of the
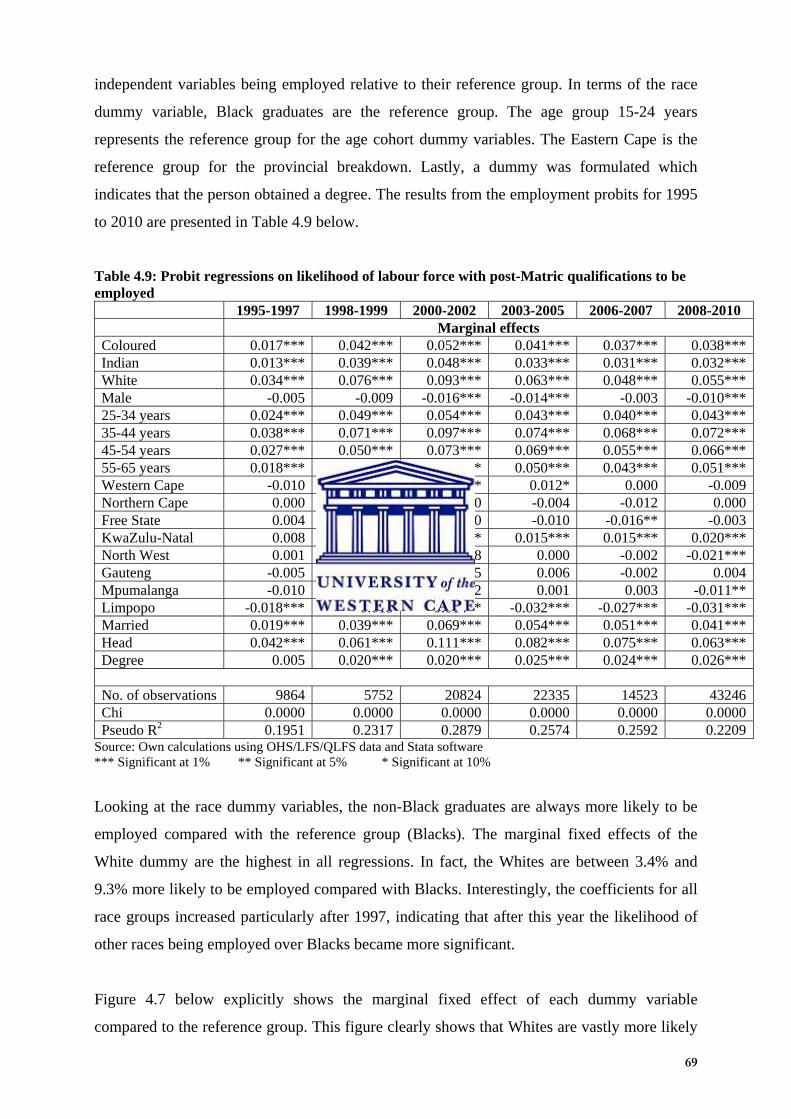
69
independent variables being employed relative to their reference group. In terms of the race
dummy variable, Black graduates are the reference group. The age group 15-24 years
represents the reference group for the age cohort dummy variables. The Eastern Cape is the
reference group for the provincial breakdown. Lastly, a dummy was formulated which
indicates that the person obtained a degree. The results from the employment probits for 1995
to 2010 are presented in Table 4.9 below.
Table 4.9: Probit regressions on likelihood of labour force with post-Matric qualifications to be employed 1995-1997 1998-1999 2000-2002 2003-2005 2006-2007 2008-2010 Marginal effects Coloured 0.017*** 0.042*** 0.052*** 0.041*** 0.037*** 0.038***Indian 0.013*** 0.039*** 0.048*** 0.033*** 0.031*** 0.032***White 0.034*** 0.076*** 0.093*** 0.063*** 0.048*** 0.055***Male -0.005 -0.009 -0.016*** -0.014*** -0.003 -0.010***25-34 years 0.024*** 0.049*** 0.054*** 0.043*** 0.040*** 0.043***35-44 years 0.038*** 0.071*** 0.097*** 0.074*** 0.068*** 0.072***45-54 years 0.027*** 0.050*** 0.073*** 0.069*** 0.055*** 0.066***55-65 years 0.018*** 0.050*** 0.063*** 0.050*** 0.043*** 0.051***Western Cape -0.010 0.010 0.019** 0.012* 0.000 -0.009Northern Cape 0.000 0.004 -0.010 -0.004 -0.012 0.000Free State 0.004 0.019* 0.000 -0.010 -0.016** -0.003KwaZulu-Natal 0.008 0.019** 0.012** 0.015*** 0.015*** 0.020***North West 0.001 0.017 0.008 0.000 -0.002 -0.021***Gauteng -0.005 0.013 0.005 0.006 -0.002 0.004Mpumalanga -0.010 0.005 0.002 0.001 0.003 -0.011**Limpopo -0.018*** -0.015 -0.014** -0.032*** -0.027*** -0.031***Married 0.019*** 0.039*** 0.069*** 0.054*** 0.051*** 0.041***Head 0.042*** 0.061*** 0.111*** 0.082*** 0.075*** 0.063***Degree 0.005 0.020*** 0.020*** 0.025*** 0.024*** 0.026*** No. of observations 9864 5752 20824 22335 14523 43246Chi 0.0000 0.0000 0.0000 0.0000 0.0000 0.0000Pseudo R2 0.1951 0.2317 0.2879 0.2574 0.2592 0.2209
Source: Own calculations using OHS/LFS/QLFS data and Stata software *** Significant at 1% ** Significant at 5% * Significant at 10%
Looking at the race dummy variables, the non-Black graduates are always more likely to be
employed compared with the reference group (Blacks). The marginal fixed effects of the
White dummy are the highest in all regressions. In fact, the Whites are between 3.4% and
9.3% more likely to be employed compared with Blacks. Interestingly, the coefficients for all
race groups increased particularly after 1997, indicating that after this year the likelihood of
other races being employed over Blacks became more significant.
Figure 4.7 below explicitly shows the marginal fixed effect of each dummy variable
compared to the reference group. This figure clearly shows that Whites are vastly more likely

70
than Blacks to find employment, whereas the likelihood of Coloureds and Indians finding
employment is comparatively similar.
The probit regression suggests that the probability of males being employed is less than that
of females. This point, however, contradicts results in the bivariate analysis, which showed
that unemployment was greater amongst females than males for the period 1995 to 2010.
Nonetheless, this result is not statistically significant in the period 1995 to 1999. The
estimations suggest that all age categories are more likely to be employed than the reference
group. However, graduates between the ages of 35 and 44 years are the most likely to be
employed than youths. This is not surprising, because they might have past work experience.
Statistically they are between 3.8% and 9.7% more likely to be employed compared to the
reference group.
As would be expected, an individual’s location can be a predictor of their (un)employment
status. Compared to the Eastern Cape, only individuals from the Gauteng province, Western
Cape and Mpumalanga are less likely to be employed. This can be the result of jobs being
more competitive in these provinces, as the probability of having a post-Matric qualification
is higher specifically the Western Cape and Gauteng than in other provinces.
The probit additionally indicates that individuals who are married are more likely to be
employed. For the investigated period they are between 1.9% and 6.9% more likely to be
employed. This is often the result of the increased responsibility and pressure which comes
with marriage. The results of the estimations indicate that household heads are most likely to
be employed than their counterparts. This is an expected result, as household heads have the
pressure of providing for others and thus are more prone to being employed.
The education coefficients are all positive, indicating that, graduates with degree are more
likely to be employed compared to those with only post-Matric certificates or diplomas. This
result is not statistically significant in the 1995-1997 regression. In the remaining regressions,
the graduates with degree are about 2% to 3% more likely to be employed. Figure 4.8 below
summarises the marginal fixed effects of the degree dummy variable 2008 and 2010. The
results of the estimation indicate that graduates with a degree have a 2.5% greater probability
than certificate/diploma graduates of finding employment.

71
Figure 4.7: Marginal fixed effects of each race dummy variables in the probit regressions (reference group: Blacks)
0%
1%
2%
3%
4%
5%
6%
7%
8%
9%
10%
1995-1996 1997-1999 2000-2002 2003-2005 2006-2007 2008-2010
Coloured Indian White
Source: Own calculations using OHS/LFS/QLFS data and Stata software
Figure 4.8: Marginal fixed effects of Degree dummy variable in the probit regression
0.0%
0.5%
1.0%
1.5%
2.0%
2.5%
3.0%
1995-1996 1997-1999 2000-2002 2003-2005 2006-2007 2008-2010
Source: Own calculations using OHS/LFS/QLFS data and Stata software
4.4.2 Oaxaca-Blinder decomposition
The Oaxaca- Blinder decomposition is an analytical tool which measures discrimination in the
labour market. It decomposes wage or employment differentials into two components: a
portion that arises because two comparison groups have, on average, different qualifications
or credentials (e.g., years of schooling and experience in the labour market), when both

72
groups receive the same treatment (explained component), and a portion that arises because
one group is more favourably treated than the other given the same individual characteristics
(unexplained component).
Figure: 4.9 Oaxaca-Blinder decomposition (assuming you suspect that employers discriminate against Black graduates)
Source: Filer et al. 1996
Assuming the mean years of educational attainment are 13 bE and 15 wE for Black and
White graduates respectively, while the employment likelihood is 50% bP and 70% wP
respectively. That is, the employment likelihood gap between White and Black graduates is
20% (70% - 50%).
Assuming the White graduates have exactly the mean years of educational attainment as the
Black graduates (i.e., 13 years, sE ), they still have a greater employment likelihood (i.e., *bP ),
for example, 65%. Alternatively, it could be said that the Black graduates with 13 years of
education should have 65% instead of 50% employment likelihood. This differential of 15%
represents the unexplained component of the employment probability gap and could be
attributed to issues such as quality of education and discrimination by the employer.
If the Black graduates with 13 years of educational attainment now really have 65%
employment probability, the difference of 5% between White and Black employment
probabilities (70% - 65%) indicates the explained component of probability difference,
because that White graduates are really more educated on average. This employment
probability gap is acceptable, i.e. the explained component.

73
The above example assumes education is the only factor accounting for employment
probability. However, other variables such as province of residence, gender, age, marital
status, etc. also have an influence on the employment probability difference between the two
groups of graduates. Hence, multivariate regressions on employment likelihood (i.e., probit
regressions) should be conducted on each group of graduates, before the Oaxaca-Blinder
decomposition is applied for more precise estimates of the explained and unexplained
components of the employment probability differential between White and Black graduates.
The Oaxaca-Blinder decomposition investigates what happened to the racial differentials
observed for employment over the period 1995 to 2010. We are specifically interested in
seeing whether the component that is unexplained by between race differences has decreased.
Table 4.10: Oaxaca-Blinder decomposition of employment likelihood of graduates, Whites vs. Blacks Explained Unexplained Total gap Explained Unexplained 1995-1997 0.0185 0.0500 0.0685 27.0% 73.0% 100.0%1998-1999 0.0401 0.1006 0.1407 28.5% 71.5% 100.0%2000-2002 0.0758 0.1127 0.1885 40.2% 59.8% 100.0%2003-2005 0.0530 0.0836 0.1366 38.8% 61.2% 100.0%2006-2007 0.0463 0.0655 0.1117 41.4% 58.6% 100.0%2008-2010 0.0486 0.0653 0.1138 42.7% 57.3% 100.0%
Source: Own calculations using OHS/LFS/QLFS data and Stata software
In Table 4.10 the Oaxaca-Blinder decomposition decomposes the employment probability
difference between White and Black graduates into two components: the explained
component and the unexplained component. In the period 1995-1997 South Africa
experienced the highest level of unexplained discrimination, 73.0%. This high level of
discrimination is associated with the historical background of South Africa, which
marginalised Blacks from equal opportunities of employment. Although over the years this
amount has decreased to 57.3%, it is still extremely high, indicating that employers maintain
their taste for discrimination. Therefore Black graduates are less likely to be employed than
White graduates and this is largely because of the perceptions of employers.
Figure 4.10 shows that between 1995 and 2000 South Africa was characterised by increasing
discrimination against graduates. This pattern then changed towards a declining trend of
discrimination. During the period 1995 to 1997 the racial employment gap between Whites
and Blacks shows that White participants in the graduate labour market force were

74
approximately 7% more likely to find work than their Black counterparts. The Oaxaca-
Blinder decomposition suggests that most of this difference is attributed to unexplained
discrimination. In the period 2000 to 2002 the White graduates were more than 18% more
likely to find employment than Black graduates. However, discrimination became increasing
linked to the characteristics of Black graduates rather than unexplained discrimination. During
the period 2008 to 2010 the likelihood of Whites gaining employment over Blacks declined.
Now Whites were approximately 11% more likely to gain employment over their Black
counterparts. Nonetheless, this difference was predominantly accounted for by unexplained
discrimination. From Figure 4.10 it is clearly evident that between 1995 and 2010
unexplained discrimination was dominant. Therefore, although Black graduates may have had
equal levels of productivity as Whites, their likelihood of finding employment was less.
Nonetheless, the unexplained decomposition has indicated a rapid decline after the period
1998- 1999, after which it stabilised between 2000 and 2010.
Figure 4.10: Oaxaca-Blinder decomposition of employment likelihood of graduates, Whites vs. Blacks
0.00
0.02
0.04
0.06
0.08
0.10
0.12
0.14
0.16
0.18
0.20
1995-1997 1998-1999 2000-2002 2003-2005 2006-2007 2008-2010
Unexplained Explained
Source: Own calculations using OHS/LFS/QLFS data and Stata software
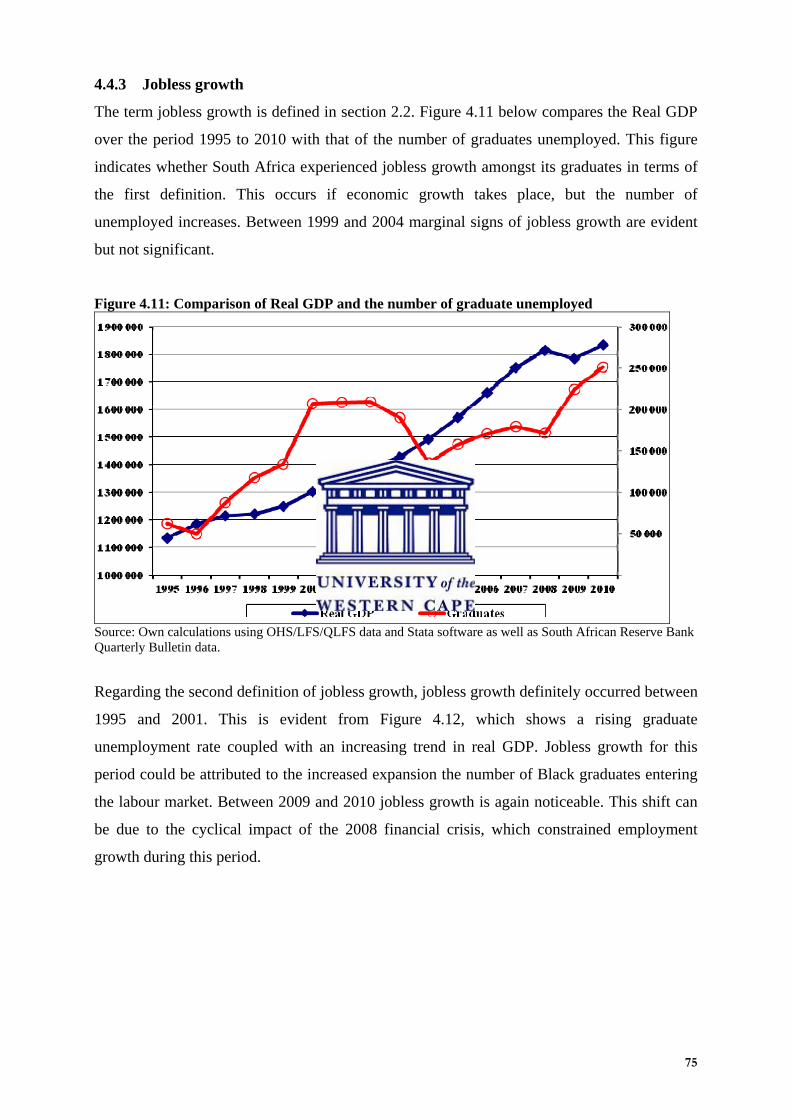
75
4.4.3 Jobless growth
The term jobless growth is defined in section 2.2. Figure 4.11 below compares the Real GDP
over the period 1995 to 2010 with that of the number of graduates unemployed. This figure
indicates whether South Africa experienced jobless growth amongst its graduates in terms of
the first definition. This occurs if economic growth takes place, but the number of
unemployed increases. Between 1999 and 2004 marginal signs of jobless growth are evident
but not significant.
Figure 4.11: Comparison of Real GDP and the number of graduate unemployed
Source: Own calculations using OHS/LFS/QLFS data and Stata software as well as South African Reserve Bank Quarterly Bulletin data.
Regarding the second definition of jobless growth, jobless growth definitely occurred between
1995 and 2001. This is evident from Figure 4.12, which shows a rising graduate
unemployment rate coupled with an increasing trend in real GDP. Jobless growth for this
period could be attributed to the increased expansion the number of Black graduates entering
the labour market. Between 2009 and 2010 jobless growth is again noticeable. This shift can
be due to the cyclical impact of the 2008 financial crisis, which constrained employment
growth during this period.

76
Figure 4.12: Comparison of real GDP and the graduate unemployment rate
Source: Own calculations using OHS/LFS/QLFS data and Stata software as well as South African Reserve Bank Quarterly Bulletin data.
4.4.4 Graduate employment coefficient
Employment elasticity of economic growth (employment coefficient) indicates the sensitivity
of employment to changes in economic growth (Barker 2007:44). It is measured as:
Employment Coefficient = % change in employment / % change in economic growth
Figure 4.13 depicts that employment of all labour force from all educational attainment
categories is relatively weakly responsive to economic growth, accounting for an employment
coefficient of 0.558. Once differentiation is made between educational attainments, one will
notice from column four that the employment of graduates with a degree is the most
responsive cohort to economic growth accounting for an employment coefficient of 1.821.
Graduates with a certificate and diploma are the second most employed in response to
economic growth. However, these coefficients both need to increase in order for all graduates
to be absorbed into the labour market. When assessing graduates in their entirety which is
highlighted by the horizontal line in the graph, it is clear that individuals with a certificate and
diploma decrease the employment coefficient of graduates to 1.317. Although the 1.317
coefficient is quite big compared to other education groups, it still needs to increase further
before graduate unemployment would completely be eradicated. Furthermore, the coefficients
are 1.065 and 1.821, for those with post-Matric certificates/diplomas and bachelor degrees
respectively, and the results once again suggest that the relatively slower employment growth
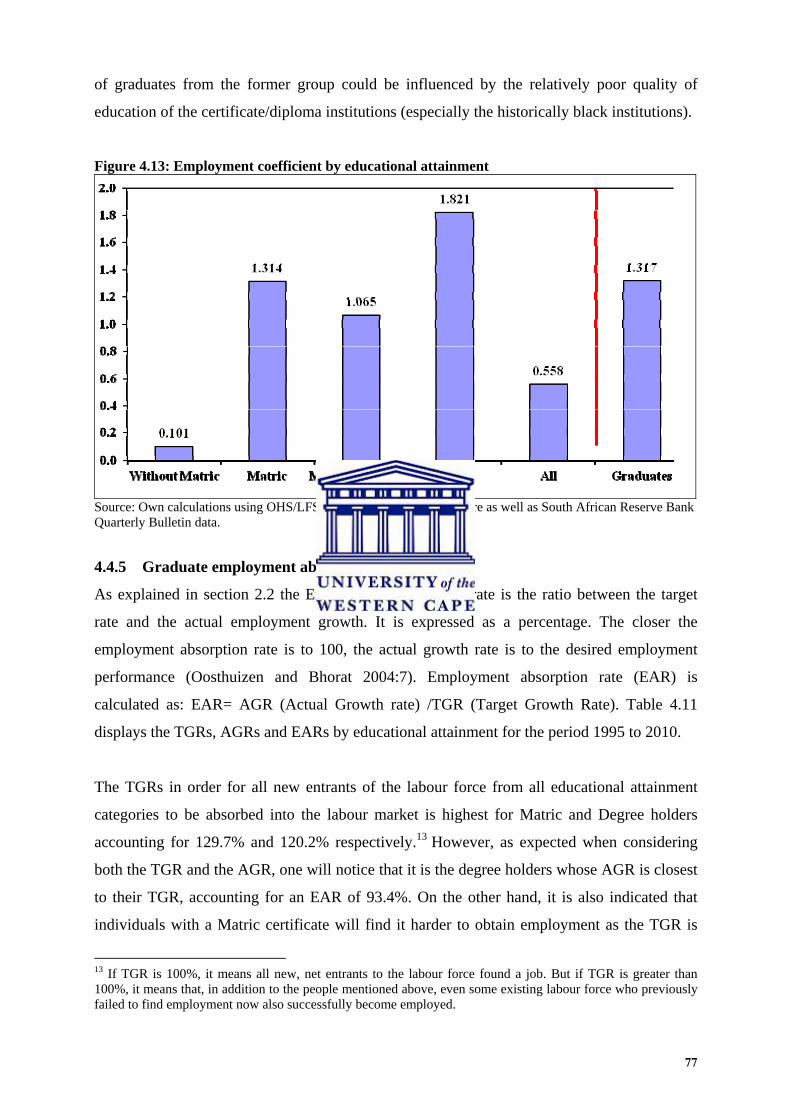
77
of graduates from the former group could be influenced by the relatively poor quality of
education of the certificate/diploma institutions (especially the historically black institutions).
Figure 4.13: Employment coefficient by educational attainment
Source: Own calculations using OHS/LFS/QLFS data and Stata software as well as South African Reserve Bank Quarterly Bulletin data.
4.4.5 Graduate employment absorption rate
As explained in section 2.2 the Employment Absorption rate is the ratio between the target
rate and the actual employment growth. It is expressed as a percentage. The closer the
employment absorption rate is to 100, the actual growth rate is to the desired employment
performance (Oosthuizen and Bhorat 2004:7). Employment absorption rate (EAR) is
calculated as: EAR= AGR (Actual Growth rate) /TGR (Target Growth Rate). Table 4.11
displays the TGRs, AGRs and EARs by educational attainment for the period 1995 to 2010.
The TGRs in order for all new entrants of the labour force from all educational attainment
categories to be absorbed into the labour market is highest for Matric and Degree holders
accounting for 129.7% and 120.2% respectively.13 However, as expected when considering
both the TGR and the AGR, one will notice that it is the degree holders whose AGR is closest
to their TGR, accounting for an EAR of 93.4%. On the other hand, it is also indicated that
individuals with a Matric certificate will find it harder to obtain employment as the TGR is
13 If TGR is 100%, it means all new, net entrants to the labour force found a job. But if TGR is greater than 100%, it means that, in addition to the people mentioned above, even some existing labour force who previously failed to find employment now also successfully become employed.

78
high compared to their respective AGR. Figure 4.14 presents the EARs by educational
attainment, which illustrates that degree holders, followed by certificate and diploma holders,
have the highest EARs, while those without Matric account for the lowest EARs, as expected.
Although graduates represent the group with the highest EAR, it is still below 100%. This
explains why there is still graduate unemployment. Figure 4.14 more clearly depicts that the
degree holders / graduates are still the most privileged group compared to other groups of
educational attainment. This is highlighted by the increasing trend of EARs which is visible
as educational attainment increases.
Table 4.11: Target growth rates, actual growth rates, employment absorption rates by educational attainment Rates
TGR AGR EAR Without Matric 023.7% 006.2% 26.2% Matric 129.7% 081.1% 62.5% Matric + Cert/Dip 083.0% 065.7% 79.1% Degree 120.2% 112.3% 93.4% All 058.4% 034.4% 58.9% Graduates 095.4% 081.2% 85.1%
Source: Own calculations using OHS 1995 and QLFS 2010Q2 data.
Figure 4.14: Employment Absorption Rate by educational attainment
Source: Own calculations using OHS/LFS/QLFS data and Stata software as well as South African Reserve Bank Quarterly Bulletin data
4.4.6 Graduate under-employment
Under-employment is used to indicate inadequate employment in relation to specific
standards or alternative forms of employment to which the person's qualifications are suited.

79
However, Stats SA does not take into account invisible under-employment, so Figure 4.15
below displays only visible under-employment. Of all the employed, regardless of educational
attainment, 4.3% are visibly underemployed. Visible under-employment is highest for those
without Matric and lowest for individuals with a degree, amounting to 6.0% and 0.5%
respectively. On the other hand 2.2% of graduates with a certificate/diploma are
underemployed. The horizontal line in the graph highlights the combination of graduates with
a certificate/ diploma and graduates with a degree, labelled graduates from other educational
attainments. Thus 1.5% of all post- Matric graduates are underemployed. This therefore
shows that degree holders have the highest probability of finding a job which is aligned to
their educational attainment. The graph clearly indicates that with increased educational
attainment the chances of being under-employed declines. More specifically the graduates
employed are much less likely to be under-employed, compared with other employed with
low educational attainment (i.e., 6.0%).
Figure 4.15: The proportion of employed who are under-employed, by educational attainment category, QLFS 2010 Q2
Source: Own calculations using OHS/LFS/QLFS data and Stata software
4.5 CONCLUSION
The above analysis has provided a dynamic perspective on graduate unemployment between
1995 and 2010. From this further analysis we can conclude that there has recently been a shift
in graduate unemployment, which is now showing a decreasing trend in South Africa.

80
However, rates are still particularly high considering that the most educated individuals
should be able to obtain employment in a skills-constrained country such as South Africa.
The graduate unemployment problem is structural in nature, in that there is a mismatch
between the skills demanded of, and supplied by, graduates. It is evident that there is an
oversupply of graduates in the business/commerce/management field. Another consistent
factor is that graduates who have obtained either a diploma or a certificate dominate graduate
unemployment.
This chapter has revealed new information by presenting the fact that Gauteng province
experiences the highest share of graduate unemployment. Furthermore, there is a relatively
even split between graduate unemployment disparities between males and females.
Interestingly, the gap between unemployed graduates in terms of work experience shows a
declining trend.
Additionally, this chapter has also revealed that during the period investigated unexplained
discrimination has decreased, but it nevertheless remains high. Moreover, jobless growth
amongst graduates has also occurred, which reflects the impact of tertiary expansion and
cyclical change due to the 2008 financial crisis. EARs are also positive for graduates, but
decline as educational levels increase. Lastly, a similar trend exists for under-employment in
that the more educated the individual, the less likely he or she would be to experience under-
employment.
With this overarching view of graduate unemployment one can clearly ascertain the nature of
this problem and to what extent graduate employment is linked to economic growth and
which factors should be considered in an attempt to further decrease graduate unemployment
in South Africa.
81
CHAPTER FIVE: GENERAL CONCLUSIONS
Graduate unemployment in South Africa has become an increasingly important socio-
economic problem. The economy is characterised by graduate unemployment on the one hand
and a serious shortage of skills together with a high vacancy rate on the other. Although it is
not as serious as the youth employment problem, it deserves special attention because it is
ironic that those who have acquired the necessary human capital are jobless. Very little
research focusing specifically on graduates has been done in recent years. This study intends
to make a contribution in this respect.
Chapter Two presented the relevant theoretical framework. According to the human capital
theory as well as the screening hypothesis, graduates should not be unemployed as they have
invested in more advanced human capital and their qualification should act as a signal to
employers reflecting their employability. However South Africa’s experience with graduate
unemployment highlights that these theories have not considered labour market rigidities, the
changing demand for labour, as well as the impact of globalisation on the type of skills
demanded.
Furthermore, the historical context of South Africa in which certain cohorts were
marginalised results in continued discrimination. Discrimination of graduates impacts on the
employability of Black graduates compared to their racial counterparts. This is predominantly
linked to the quality of both secondary and tertiary education of Black graduates which are
relatively inferior when compared to other race groups. Some discrimination, such as human
capital discrimination relating to education and training, occurs before the market, i.e. even
before the individual seeks employment. Discrimination within the market against graduates
may also be the result of transactions cost, relating to additional cost of training, etc.
Chapter three summarised the findings from earlier studies related to the extent, nature and
causes of graduate unemployment in South Africa. According to the existing literature it was
found that graduate unemployment had increased between 1995 and 2005. Graduate
unemployment is concentrated among the youth, Africans and particularly those within the
fields of business, commerce and management and education, training and development. The
unemployment of graduates is also caused by the structural nature of the unemployment
problem which emphasises the skills mismatch problem of our country.

82
Other causes of graduate unemployment are related to the labour market rigidities which
constrict the absorption of graduates into the job market. Graduates also have high reservation
wages, a lack of soft skills and experience which decreases their employability relative to that
of other graduates. Moreover, post 1994 there has been a noticeable increase in access to
tertiary education resulting in an increase in rate of graduates participating the labour market.
Graduate unemployment was also investigated in an international context to determine if this
phenomenon is unique to South Africa. The problem exists in both developing countries and
developed countries and is caused by similar factors globally, excepting for the before-the-
market discrimination relating to education, institution and the field of study in South Africa.
Chapter four further investigated the extent, nature and causes of graduate unemployment by
analysing data beyond the period which existing literature has. This section analysed graduate
unemployment in a dynamic context by reviewing OHS, LFS and QLFS data for the period
1995 to 2010. During this period, there was a general increase in the number of graduates who
were unemployed in South Africa, peaking in 2010. With regarding to the graduate
unemployment rate, it showed an upward trend between 1995 and 2003, before stabilizing at
about 5% between 2004 and 2010.
Graduate unemployed are more likely to be black, female, with post-Matric certificate or
diploma qualification, and reside in Gauteng province. Moreover, jobless growth amongst
graduates has also occurred which reflects the impact of tertiary expansion and cyclical
change due to the 2008 financial crisis. EARs are also positive for graduates but decline as
educational levels decrease. Lastly, a similar trend exists for underemployment in that the
more educated the less likely the individual would be to experience underemployment.
In researching graduate unemployment one could identify the characteristics of graduates who
are most likely to be unemployed. Moreover this study was able to ascertain the extent at
which employment creation should be increased in order to absorb all graduates who have
entered the labour market. In short, this study has covered salient factors necessary to target
graduate unemployment in a way that informed policy and strategic initiatives can be made in
South Africa to alleviate graduate unemployment. For instance, the quality of Maths and
Science teaching at school level should be improved so as to increase the chance of the
students (when they attend tertiary education) to enrol subjects that are under great demand,
such as Engineering and Medical Sciences as discussed in the study; something should be

83
done to improve wage flexibility (e.g., reducing minimum wage) so that it is easier for the
graduates (i.e., the ‘outsiders’) to find employment; there should be stricter examination on
the quality of post-Matric education offered by certificate/diploma institutions, especially
from the historically black tertiary institutions.

84
BIBLIOGRAPHY
Agarwal, P. (2006). Higher education in India: The need for change. ICIRER Working Paper No. 180. New Delhi: Indian Council for Research on Economic International Relations. Available: http://www.icrier.org/pdf/icrier_wp180__higher_education_in_india_.pdf Altman, M. (2007).Youth labour market challenges in South Africa. Cape Town: HSRC Press. Arrow, F. (1972). The theory of discrimination. Industrial relations section, Woodrow Wilson School and conference office of Princeton University. Autor, D. (2003). Lecture Note: The Economics of Discrimination – Theory. Available: http://econ-www.mit.edu/files/553 Bai, L. (2006) Graduate unemployment: Dilemmas and challenges in China's move to mass higher education. The China Quarterly. 185: 128-144. Barker, F. (2007). The South African labour market. Fifth Edition. Pretoria: Van Schaik publishers. Becker, G. (1992). The economic way of looking at life. Chicago: Department of Economics, University of Chicago. Benjamin, P. (2005). A review of labour markets in South Africa: Labour market regulation: International and South African perspectives. Cape Town: Human Sciences Research Council. Benjamin, P., Bhorat, H. and Van der Westhuizen, C. (2010). Regulatory impact assessment of selected provisions of the Labour Relations Amendment Bill, 2010 Basic Conditions of Employment Amendment Bill, 2010 Employment Equity Amendment Bill, 2010 Employment Services Bill, 2010. Pretoria: Department of Labour and the Presidency. Benjamin, P. Bhorat, H. and Cheadle, H. (2009). The cost of doing business and labour regulation: The case of South Africa. International Labour Review. 149(1): 73-91. Bhorat, H. (2003). The post-apartheid challenge: Labour demand trends in South African labour market, 1995-1999. DPRU Working Paper 03/82. Cape Town: Development Policy Research Unit, University of Cape Town. Botha, U. (2009). The impact of employment protection legislation and minimum wage regulation on economic growth. A Master thesis. Pretoria: University of Pretoria. Bhorat, H. and Lundall, P. (2003). Employment, wages and skills development: Firm specific effects – Evidence from two firm surveys in South Africa. DPRU Working Paper 02/68. Cape Town: Development Policy Research Unit, University of Cape Town. Blaug, M (1971). The causes of graduate unemployment in India. Economica. 38: 452-454. Bosworth, D.L., Dawkins, P.J. and Stromback, T. (1996). The Economics of the labour market. Edinburgh Gate: Financial Times / Prentice Hall Pearson Education.

85
Branson, N., Leibbrandt, M. and Zuze, T.L. (2009). What are the returns to tertiary education and who benefits? In Cloete, N. (ed.), Responding to the educational needs of post-school youth. Cape Town: Centre for Higher Educational Transformation: 45-60. Brookes, M. and Hinks, T. (2004). The racial employment gap in South Africa. South African Journal of Economics. 72(3): 573 – 597. Burger, R and Jafta, R. (2010). Affirmative action in South Africa; an empirical assessment of the impact on labour market outcomes. CRISE working paper no 76. Centre for Research on Inequality, Human Security and Ethnicity. Burger, R. and Van Der Berg., S. (2011). Modelling cognitive skills, ability and school quality to explain labour market earnings differentials. Stellenbosch: University of Stellenbosch. Carnoy, M. (1987). Higher education and graduate employment in India. HEP Research Report No. 64. Paris: International Institute for Educational Planning. Casale, D. and Posel, D. (2010) English language proficiency and earnings in a developing country: The case of South Africa. Working Paper No. 181. Durban: University of KwaZulu-Natal. Case, A. and Yogo M. (1999). Does school quality matter? Returns to education and the characteristics of schools in South Africa. Cambridge: National Bureau of Economic Research. Chamberlain, D. and Van Der Berg, S. (2002). Earnings functions, labour market discrimination and quality of education in South Africa. Stellenbosch Economic Working Papers 02/2002. Stellenbosch: Stellenbosch University. Chakrabarty, K. (2010). Challenges and opportunities in a trillion dollar economy. Address by Dr K C Chakrabarty, Deputy Governor of the Reserve Bank of India, at the Associated Chambers of Commerce and Industry of India’s (ASSOCHAM) National Banking Conclave, New Delhi. Christensen, B. (2002). Reservation wages, offered wages, and unemployment duration: New empirical evidence. Kiel Working Paper No. 1095. Kiel: Kiel Institute of World Economics. Cornwell, K. and Inder, B. (2008). Language and labour markets in South Africa. Journal of African Economies. 17(3): 490-525. Das, A. (1981). Unemployment of educated youth in Asia: A comparative analysis of the situation in India, Bangladesh and the Philippines. IIEP Occasional Papers No. 60. Paris: International Institute for Educational Planning. Darwin, C. (2010). A critique of the human capital theory. Retrieved from: http://mccaine.org/2010/10/11/a-critique-of-human-capital-theory Department of Education. (2007). Education statistics in South Africa: 2007. Pretoria: Department of Education.

86
De Villiers, A.P. and Nieuwoudt. L. (2010). Shifting trends in higher education funding University of Stellenbosch. Stellenbosch Economic Working Papers 12/2010. Stellenbosch: Stellenbosch University. Dobbs, R (2008). Human capital and screening theories: Implications for human resource development. South African Journal of Economics. 10: 788-801. Drago, R., Perlnan, R. (1989). Microeconomic issues in Labour Economics: New approaches. New Work: Harvester Wheatsheaf. Dube, F. (2009). Skills shortage: An unemployed Black graduate perspective. Cape Town: University of Cape Town. Du Toit, R. (2003). Unemployed youth in South Africa: The distressed generation? Paper presented at the Minnesota International Counselling Institute (MICI). Available: http://intranet.hsrc.ac.za/research/output/outputDocuments/2286_duToit_UnemployedYouthinSA.pdf Ehrenberg, R.G. and Smith, R.S. (2009). Modern labour economics: Theory and public policy. 10th edition. Boston: Addison Wesley. Featherman, D., Hall, M. and Krislov, M. (2010). The next twenty-five years: affirmative action in higher education in the United States and South Africa. Michigan: University of Michigan Press. Fedderke, J. (2005). Technology, human capital and growth. Cape Town: University of Cape Town. Fields, G. (2000). The employment problem in South Africa. New York: Cornell University. Filer, R, Hammermesh, D and Rees, A. (1996). The Economics of work and pay. New York: Harper Collins College Publishers. Griesel, H and Parker, B. (2009). Graduate attributes: a baseline study of South African graduates from the perspective of employers. Pretoria: Higher Education South Africa and The South African Qualifications Authority. Human, D. (2006). Implementation of Affirmative Action and Black Economic Empowerment (BEE) in the construction industry. Bloemfontein: University of the Free State. Ilchman, W. (1969) People in plenty: Educated unemployment in India. Asian Survey. 9(10: 781-795. Kingdon, G. and Knight, J. (2000). The incidence of unemployment in South Africa. Oxford: Centre for the Study of African Economies Economics Department, University of Oxford. Koen, C. (2006). Higher education and work: setting a new research agenda. Cape Town: HSRC Press. Kostoglou, V. and Paloukis, S. (2007). Graduates’ employment in European Union. Alexander Technological Educational Institute of Thessaloniki and Dimitriou Margariti.

87
Koucky, J., Meng, C. and Van der Velden, R. (2007). Reflex country study. Praque: Research Centre for Education and the Labour Market, Maastricht University and The Netherlands Education Policy Centre, Charles University. Kubler, D. and Muller, W. (2006). Job market signaling and screening: An experimental comparison. London: University of London. Lam, D., Leibbrandt, M. and Mlatsheni, C. (2008). Education and youth unemployment in South Africa. SALDRU Working Paper Series Number 22. Cape Town: Southern Africa Labour and Development Research Unit, University of Cape Town. Lee, W., Thakor, A. and Vora, G. (2004). Screening, market signalling, and capital structure theory. The Journal of Finance. 38(5): 1507-1518. Leibbrandt, M., Woolard, I., McEwen, H. and Koep, C. (2010). Better employment to reduce inequality further in South Africa. In Organization for Economic Co-operation and Development (ed.), Tackling inequalities in Brazil, India, China and South Africa: The role of labour market and social policies. Paris: OECD Publishing: 209‐262. Letseka, M., Cosser, M., Breier, M. and Visser, M. (2010). Student retention and graduate destination: Higher education and labour market access and success. Cape Town: HSRC Press. Letseka, M. and Maile, S. (2008). High university drop-out rates: A threat to South Africa’s future. HSRC Policy Brief. Pretoria: Human Sciences Research Council. Levinsohn, J. (2007). Two policies to alleviate unemployment in South Africa. Michigan: Ford School of Public Policy University of Michigan and NBER. Levitt, S. (2004). Testing the theories of discrimination: Evidence from weakest link. Journal of Law and Economics. 47: 431-452. Li, F., Mogan, W. and Ding, X. (2008). The expansion of higher education, employment and over-education in China. International Journal of Educational Development. 28: 687-697. Litao, Z. and Yanjie, H. (2010). Unemployment problem of China’s youth. EAI Background Brief No. 523. Singapore: East Asian Institute, National University of Singapore. Little, B. and Tang, W. (2008). Age differences in graduate employment across Europe. London: Centre for Higher Education Research and Information The Open University. Liu, M. (2009). Graduate unemployment in China: Motivations, results and implications. Maryland: Dartmouth, Ellicott City. Moleke, P. (2006). Finding work: Employment experiences of South African graduates. Cape Town: HSRC Press. National Treasury (2011). Confronting youth unemployment: Policy options for South Africa. Pretoria: National Treasury. Nunez, I. and Livanos, I. (2009). Higher education and unemployment in Europe: An analysis of the academic subject and national effects. Coventry: University of Warwick.
88
Olaniyan, D. and Okemakinde, T. (2008). Human capital theory: Implications for educational development. European Journal of Scientific Research. 24(2): 157-162. Oosthuizen, M. (2006). The post-apartheid labour market: 1995-2004. DPRU Working Paper 06/103. Cape Town: Development Policy Research Unit, University of Cape Town. Bhorat, H. and Oosthuizen, M. (2005). The post-apartheid South African labour market. DPRU Working Paper 05/93. Cape Town: Development Policy Research Unit, University of Cape Town. Partridge, R. and Keng, N. (2008). Tackling graduate unemployment: Enhancing employability amongst students of Chinese universities. A perspective from the UK. Heslington: The University of York. Pederson, P. and Lund, R. (1987). Unemployment: Theory, policy, and structure. Berlin: Walter de Gruyter and Co. Pauw K., Bhorat, H., Goga, S., Ncube, L., Van de Westhuizen, C. (2006). Graduate unemployment in the context of skills shortages, education and training: Findings from a firm survey. Cape Town: Development Policy Research Unit. University of Cape Town. Pollack, M. (1997). Reflections on the use of labour market indicators in designing policies with a gender based approach. Available: http://www.eclac.cl/publicaciones/xml/0/4720/lcl1016eng.pdf Mafiri, M. (2002). Socio-economic impact of employment in South Africa. Pretoria: University of Pretoria. Mannack, M. (2009). South Africa: Young, educated and unemployed. Cape Town: Inter Press Survey. Mlatsheni, C. (2005). The youth labour market: What does it take to succeed? Mimeo. Cape Town: University of Cape Town. Moleke, P. (2005). Finding work: Employment experiences of South African graduates. Pretoria: Employment and Economic Policy Research Programme, Human Sciences Research Council. Moses, E. (2011). Quality of education and the labour market: A conceptual and literature overview. Stellenbosch Economic Working Papers 07/2011. Stellenbosch: Stellenbosch University. Nanping, Y. (2004). Fresh graduates face unemployment: China Perspectives. Volume 51. Nunez, I. and Livanos, I. (2009). Higher education and unemployment in Europe: An analysis of the academic subject and national effects. Coventry: University of Warwick. Pandor, N. (2007). SA: Pandor: South African Colleges Principals' Organisation Conference. A speech addressed by the minister of Education Naledi Pandor during the South African Colleges Principals’ Organisation Conference, 30 August 2007. Johannesburg: Department of Education.

89
Paterson, A. and Arends, F. (2009). Teacher graduate production in South Africa. Cape Town: HSRC Press. Pauw, K., Oosthuizen, M. and Van der Westhuizen, C. (2006). Graduate unemployment in the face of skills shortages: A labour market paradox. DPRU Working Paper 06/114. Cape Town: Development Policy Research Unit. Papier, J. (2006). Youth unemployment and education in South Africa. Paper presented at the Harold Wolpe Memorial Trust and Inset Providers Coalition (IPC) 49th Open Dialogue Event., 2 February 2006, Cape Town. Taylor, S. Van Der Berg, S. Reddy, V. and Van Rensburg., D. (2011). How well do South African schools convert grade eight achievement into Matric outcomes? Stellenbosch Economic Working Papers 13/2011. Stellenbosch: Stellenbosch University. Tilak, J. and Varghese, N. (1991). Financing higher education in India. Higher Education in Developing Countries. 21(1): 83-101. Rankin, N.A. & Roberts, G. (2011). Youth unemployment, firm size and reservation wages in South Africa. South African Journal of Economics. 79(2): 128-145. Riley, G. and College, E. (2006). Labour market discrimination. Available: http://tutor2u.net/economics/revision-notes/a2-micro-labour-market-discrimination.html Schugurensky, D. (2010). Investment in human capital. Department of Adult Education, Community Development and Counselling Psychology, The Ontario Institute for Studies in Education of the University of Toronto (OISE/UT). Sharma, G. and Apte, M. (1976). Graduate unemployment in India. Economic and Political Weekly. 11(25): 915-925. Stone, J. and McCraw, J. (2007). Unemployment: The shocking truth of its causes, its outrageous consequences and what can be done about it. Bloomington: Trafford Publishing. Stroombergen, A., Rose, D. and Nana, G. (2002). Review of the statistical measurement of human capital. Boulevard: Statistics New Zealand. Stryker J.D., Cassim, F, Rajaratnam, B., Bhorat, H., Leibbrandt, M. and Plunkett, D. (2001). Increasing demand for labor in South Africa. Harvard: John F. Kennedy School of Government, Harvard University. Teichler, U. (1997). Higher education and graduate employment in Europe. TSER Research Proposal. Kassel: University of Gesamthochschule. Teichler, U. (2002). Graduate unemployment and work in Europe: Diverse situations and common perceptions. Dordrecht: Kluwer Academic Publishers. Todaro, M. and Smith, S. (2006). Economic Development. 9th edition. London: Pearson-Addison Wesley.

90
The World Bank. (2009). Accelerating catch-up: Tertiary education for growth in Sub-Saharan Africa. Washington: The World Bank. Van Der Berg, S. and Burger, R. (2010). Teacher pay in South Africa. Stellenbosch Economic Working Papers 26/2010. Stellenbosch: Stellenbosch University. Van Der Berg, S. and Shepherd, D. (2010). Signalling performance: Continuous assessment and matriculation examination marks in South African schools. Stellenbosch Economic Working Papers 28/2010. Stellenbosch: Stellenbosch University. Van Der Berg, S. (2006). How effective are poor schools? Poverty and educational outcomes in South Africa. Stellenbosch Economic Working Papers 06/2006. Stellenbosch: Stellenbosch University. Von Fintel, D. and Black, P. (2007). From labour market misperceptions to wage scarring: The long-term impacts of youth unemployment. Paper presented at the ESSA Conference, Johannesburg. Weiss, A. (1995). Human capital vs. Signalling explanations of wages. Journal of Economic Perspectives. 9(4): 133-154. Xiao, J. (2001). Determinants of salary growth in Shenzhen, China: An analysis of formal education, on-the-job training, and adult education with a three-level model. Hong Kong: The Chinese University of Hong Kong. Yu, D. (2009). The comparability of Labour Force Survey (LFS) and Quarterly Labour Force Survey (QLFS). Stellenbosch Economic Working Papers 08/2009. Stellenbosch: Stellenbosch University.