Embed Size (px)
Citation preview
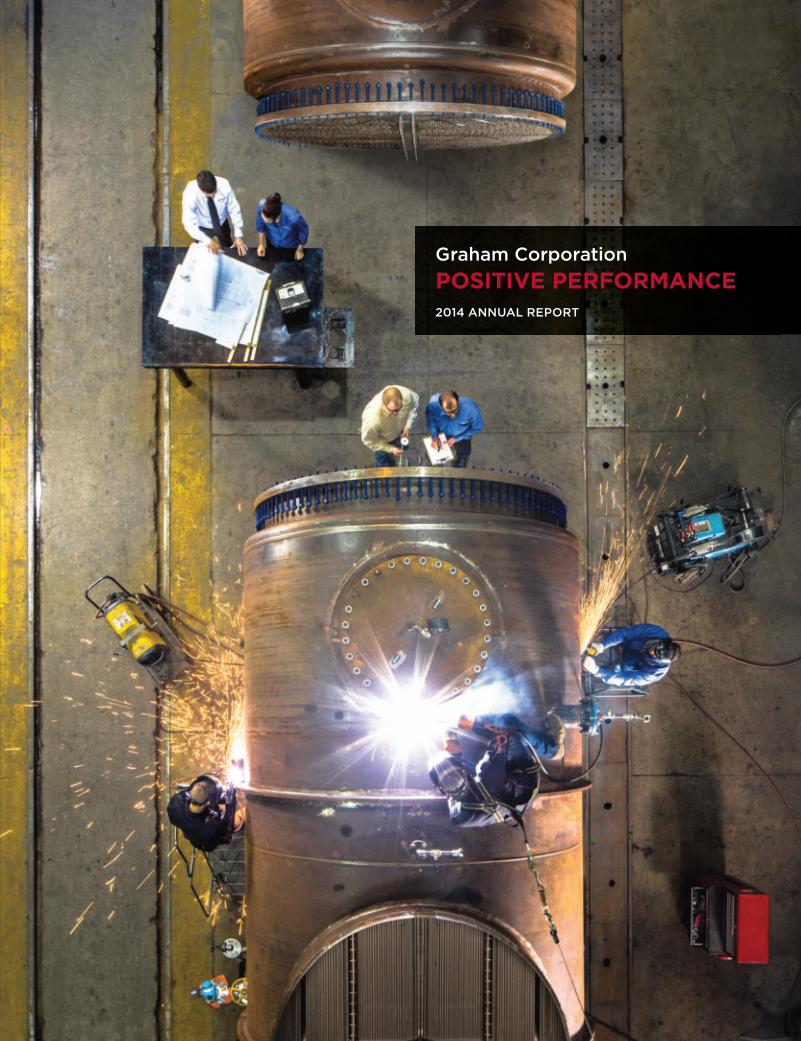
Graham CorporationPOSITIVE PERFORMANCE
FISCAL YEARS ENDED MARCH 31
OPOPERATING PERFORMANCEERATATING PERFORMANCE
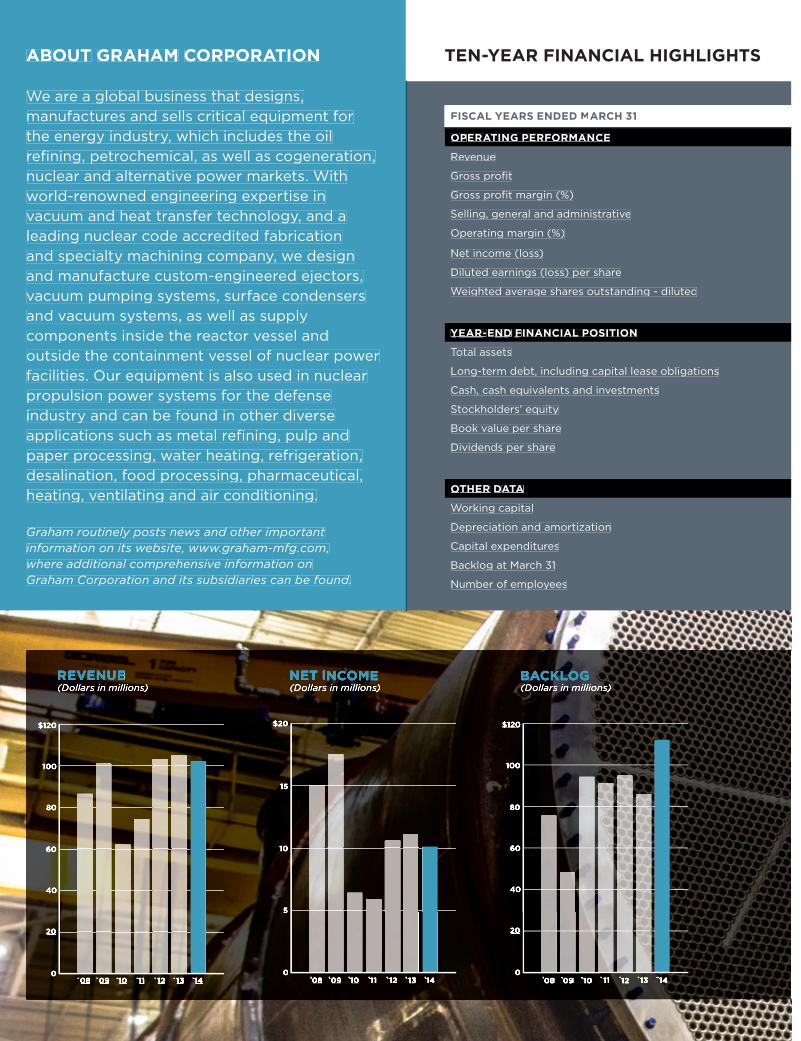
Revenue
Gross profit
Gross profit margin (%)
Selling, general and administrative
Operating margin (%)
Net income (loss)
Diluted earnings (loss) per share
Weighted average shares outstanding - diluted
YEAR-YEAR-EENDND FFINANCIAL POSITIONINANCIAL POSITION
Total assets
Long-term debt, including capital lease obligations
Cash, cash equivalents and investments
Stockholders’ equity
Book value per share
Dividends per share
OOTHERTHER DDATAATATATA
Working capital
Depreciation and amortization
Capital expenditures
Backlog at March 31
Number of employees
TEN-YEAR FINANCIAL HIGHLIGHTSABOUT GRAHAM CORPORATION
We are a global business that designs, manufactures and sells critical equipment for the energy industry, which includes the oilrefining, petrochemical, as well as cogeneration, nuclear and alternative power markets. Withworld-renowned engineering expertise in vacuum and heat transfer technology, and aleading nuclear code accredited fabricationand specialty machining company, we designand manufacture custom-engineered ejectors,vacuum pumping systems, surface condensersand vacuum systems, as well as supply components inside the reactor vessel andoutside the containment vessel of nuclear powerfacilities. Our equipment is also used in nuclear propulsion power systems for the defense industry and can be found in other diverseapplications such as metal refining, pulp andpaper processing, water heating, refrigeration,desalination, food processing, pharmaceutical,heating, ventilating and air conditioning.
Graham routinely posts news and other important information on its website, www.graham-mfg.com,where additional comprehensive information onGraham Corporation and its subsidiaries can be found.
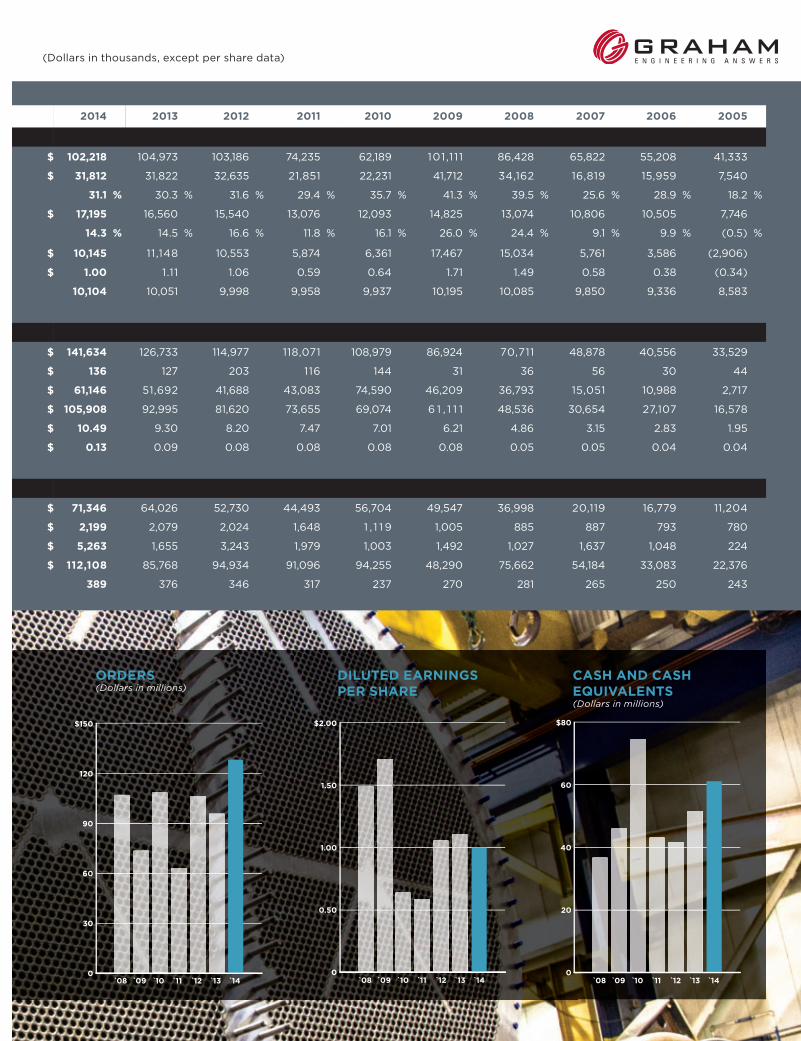
2014 2013 2012 2011 2010 2009 2008 2007 2006 2005
$ 102,218 104,973 103,186 74,235 62,189 101,111 86,428 65,822 55,208 41,333
$ 31,812 31,822 32,635 21,851 22,231 41,712 34,162 16,819 15,959 7,540
31.1 % 30.3 % 31.6 % 29.4 % 35.7 % 41.3 % 39.5 % 25.6 % 28.9 % 18.2 %
$ 17,195 16,560 15,540 13,076 12,093 14,825 13,074 10,806 10,505 7,746
14.3 % 14.5 % 16.6 % 11.8 % 16.1 % 26.0 % 24.4 % 9.1 % 9.9 % (0.5) %
$ 10,145 11,148 10,553 5,874 6,361 17,467 15,034 5,761 3,586 (2,906)
$ 1.00 1.11 1.06 0.59 0.64 1.71 1.49 0.58 0.38 (0.34)
10,104 10,051 9,998 9,958 9,937 10,195 10,085 9,850 9,336 8,583
$ 141,634 126,733 114,977 118,071 108,979 86,924 70,711 48,878 40,556 33,529
$ 136 127 203 116 144 31 36 56 30 44
$ 61,146 51,692 41,688 43,083 74,590 46,209 36,793 15,051 10,988 2,717
$ 105,908 92,995 81,620 73,655 69,074 6 1 , 1 1 1 48,536 30,654 27,107 16,578
$ 10.49 9.30 8.20 7.47 7.01 6.21 4.86 3.15 2.83 1.95
$ 0.13 0.09 0.08 0.08 0.08 0.08 0.05 0.05 0.04 0.04
$ 71,346 64,026 52,730 44,493 56,704 49,547 36,998 20,119 16,779 11,204
$ 2,199 2,079 2,024 1,648 1 , 1 1 9 1,005 885 887 793 780
$ 5,263 1,655 3,243 1,979 1,003 1,492 1,027 1,637 1,048 224
$ 112,108 85,768 94,934 91,096 94,255 48,290 75,662 54,184 33,083 22,376
389 376 346 317 237 270 281 265 250 243
(Dollars in thousands, except per share data)
0
30
60
90
120
$150
`08 `09 1̀0 1̀1 1̀2 1̀3 1̀4 `08 `09 1̀0 1̀1 1̀2 1̀3 1̀40
0.50
1.00
1.50
$2.00
`08 `09 1̀0 1̀1 1̀2 1̀3 1̀40
20
40
60
$80
ORDERS (Dollars in millions)
CASH AND CASH EQUIVALENTS(Dollars in millions)
DILUTED EARNINGS PER SHARE
DEAR FELLOW SHAREHOLDERS,
As I reflect on fiscal 2014, I commend our team for readily adapting to the significant shift in operating conditions we faced between the first and second half of the year. Approximately two-thirds of the $10.1 million in fiscal 2014 net income and record $128.2 million in orders occurred in the first six months. First half net income was generated from the strength and timing of short cycle aftermarket sales in addition to quality projects that were converted from backlog in the period, while order levels reflected our strong pipeline and customer schedules for advancing projects. Margin in the second half reflected the weaker order quality from 12-to-15 months earlier. The team, through these significant swings, performed admirably, and I am certain the investments we made to expand Graham’s capabilities played a significant role in this success.
WE DELIVERED POSITIVE PERFORMANCE FOR THE YEAR
Our fiscal 2014 revenue was $102.2 million, with $1.00 in diluted EPS, and 10% net margin.
We generated $15.2 million in cash from operations.
At fiscal year end, we had $61.1 million in cash, cash equivalents and investments.
In the fourth quarter, we increased our dividend 33%, to $0.16 per share annually, while investing $5.3 million in facilities and equipment for anticipated growth.
We won a record level of orders - 20% higher than our last record.
We ended the year with record backlog of $112.1 million – 50% higher than the peak of the last cycle.
EXPANDED CAPACITY: BUILDING THE TEAM AND PROCESSESWe are strongly committed to earnings expansion. In pursuit of long-term growth, we made investments in fiscal 2014 to position us for the strong growth we anticipate in fiscal 2015, as we work to achieve our goal of over $200 million in sales. In fact, even as our revenue and earnings growth has remained static while our markets moved across the cycle bottom these past three years, we continued to make investments in our people, processes, equipment and facilities. We invested ahead of actual demand to be ready for market expansion; however, we did so prudently and maintained return on sales in the 10% range. Investments made during this three-year period included:
We expanded our workforce by 25% to approximately 400. Production personnel, including welders, machinists and assemblers, increased nearly 40%. I believe rebranding Graham as an employer of choice in our market has positively affected our ability to access and acquire talent.
2 GRAHAM CORPORATION
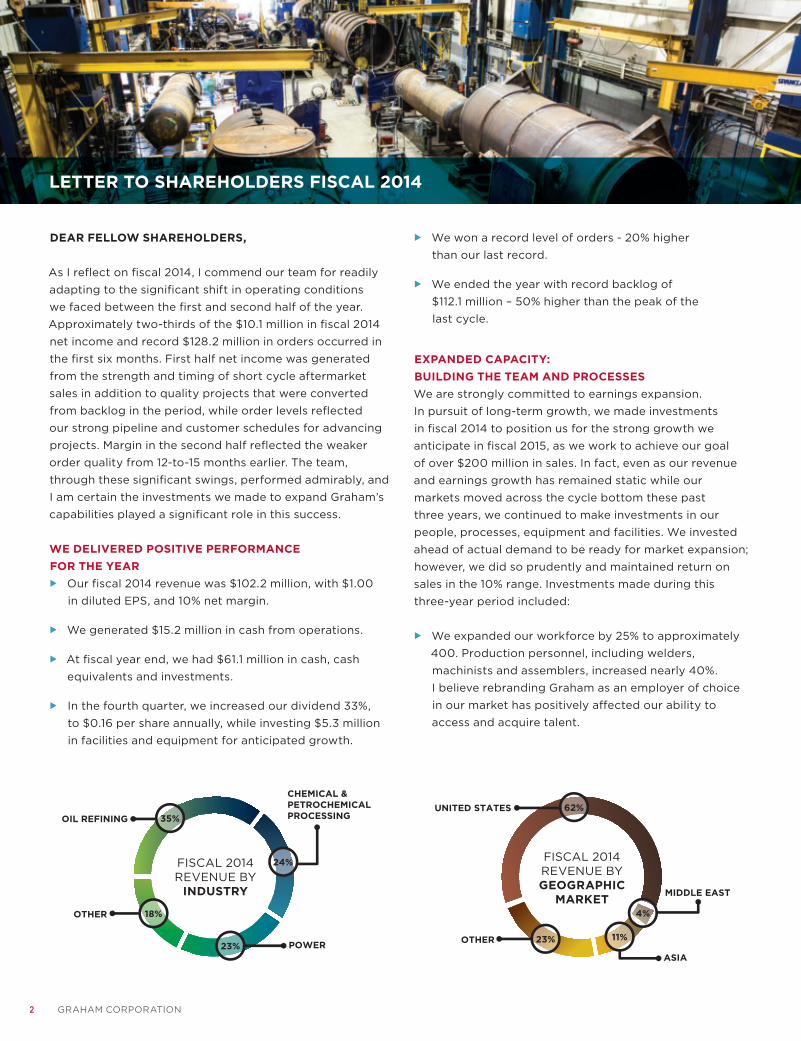
LETTER TO SHAREHOLDERS FISCAL 2014
We dramatically reduced the time necessary to fully train new employees. We advanced our in-house training programs, knowledge transfer processes, process documentation and mentoring programs.
By the end of fiscal 2015, we expect to have invested more than $15 million in equipment, information technology and facilities. Targeted capital investment improved productivity and quality as well as reduced lead time. Purchases included drilling and machining equipment, along with state-of-the-art welding machines. Since roughly 40% of our production is welding, our investments in productive welding processes were vital.
Performance management was sharpened to unlock our employees’ capabilities. In my 30 years with Graham, I have never seen more employee engagement. I believe that our employees are completely aligned with our growth strategy, which serves as the foundation of my confidence in our ability to execute our plan.
I believe proof of the success of our investment efforts occurred when our engineering team effectively executed the $81 million surge in new orders, which was a 50% increase in orders compared with historic levels. Of note, while managing this historic level of orders, we reduced the required time to move a new project through design, drawings, approvals, purchasing and into production by approximately 15%.
MARKET POSITION AND DIVERSITY CREATES AN ADVANTAGEOUS POSITIONSignificant North American investment in chemical and petrochemical processing is the result of technological advances that have led to affordable access to abundant natural gas reserves. This is transforming the chemical industry and has fostered an unprecedented level of planned investment within North America. In fiscal 2014 approximately 35%, or $45 million, of orders were from the chemical and petrochemical industry, of which over 80% was for the U.S. market. In fact, we were awarded
orders to provide our products to three new ethylene facilities, four new ammonia plants, two new methanol operations and a new propane dehydrogenation plant.
Orders of $36 million from our oil refining markets included projects for the U.S., South America, the Middle East and Asia. We took deliberate steps the last few years to enter new markets. Our brand, consultative selling model, complex order management capabilities, custom fabrication operations model and commitment to quality and customer satisfaction allowed us to enter the naval nuclear propulsion and nuclear power generation markets.
In fiscal 2014, we won $16 million in orders for nuclear power generation, representing 80% of our “Power” market orders. We also had substantial wins of$23 million in our “Other” markets category, primarily
as a result of our success with our defense customers.
BUILDING SHAREHOLDER VALUEThese are exciting times for Graham. Our disciplined execution to prepare for growth and the healthy pipeline of active bids - that is 2 to 3 times greater than the last cycle - gives me tremendous assurance that Graham is prepared to enter its next phase of growth. I believe the market has rewarded us for our foresight and discipline. Total shareholder return over the last four years was 79%.
As such, I extend my sincere appreciation to you, our shareholders, for your support and recognition of the value of our strategy and long-term outlook.
Sincerely,
James R. Lines President and CEO
�
32014 ANNUAL REPORT
“I expect fiscal 2014 was an early indication of how substantial investments in the chemical/petrochemical market might be in the coming years.”
James R. Lines President and CEO

2014 EXECUTIVE TEAM
JAMES R. LINESPresident and Chief Executive Officer
JEFFREY F. GLAJCH Vice President-Finance & Administration, Chief Financial Officer and Corporate Secretary
ALAN E. SMITH Vice President of Operations
JENNIFER R. CONDAME Corporate Controller and Chief Accounting Officer
2014 BOARD OF DIRECTORS
JAMES J. BARBER, PH.D 1,2
Director since 2011 Independent Consultant PrincipalBarber Advisors, LLC
HELEN H. BERKELEY 2,3
Director since 1998Private Investor
JERALD D. BIDLACK 1,2,3,4
Chairman of the BoardDirector since 1985President Griffin Automation, Inc.
ALAN FORTIER 1,3,4
Director since 2008President Fortier & Associates, Inc.
JAMES R. LINESPresident and Chief Executive OfficerDirector since 2006
JAMES J. MALVASO 1,3,4
Director since 2003Senior Advisor Toyota Material Handling Group
GERARD T. MAZURKIEWICZ 1,2
Director since 2007Tax Partner Dopkins & Company, LLP
1- Audit Committee2- Employee Benefits Committee3- Compensation Committee4- Nominating and Corporate Governance Committee
STOCK EXCHANGE LISTING NYSE: GHM
ANNUAL MEETING The 2014 Annual Meeting of Stockholders will be held on Thursday, July 31, 2014 at 11:00 a.m., Eastern Time, at the Hilton Garden Inn, Buffalo Airport, 4201 Genesee Street, Buffalo, N.Y. 14225
TRANSFER AGENT AND REGISTRAR ComputershareP.O. Box 30170 College Station, TX 77842-3171
Overnight Delivery211 Quality Circle, Suite 210College Station, TX 77845
U.S. Stockholders: 800-288-9541
TDD U.S. Hearing Impaired: 800-231-5469
International Stockholders: 201-680-6578
TDD International Stockholders: 201-680-6610
www.computershare.com/investor
INVESTOR RELATIONS Investors, stockholders, security analysts and others seeking information about Graham Corporation should contact:
Jeffrey F. Glajch Vice President-Finance & Administration, Chief Financial Officer and Corporate Secretary Phone: (585) 343-2216 Email: [email protected]
Deborah K. Pawlowski Kei Advisors LLC Phone: (716) 843-3908 Email: [email protected]
Karen L. Howard Kei Advisors LLC Phone: (716) 843-3942 Email: [email protected]
Additional information is available on our website at: www.graham-mfg.com. Information on the website is not a part of this Annual Report.
INDEPENDENT AUDITORS Deloitte & Touche LLP 910 Bausch & Lomb Place Rochester, N.Y. 14604
CORPORATE COUNSEL Harter Secrest & Emery LLP 1600 Bausch & Lomb Place Rochester, N.Y. 14604
GRAHAM CORPORATION STOCKHOLDER INFORMATION
Copies of this Annual Report are available free of charge at www.graham-mfg.com
4 GRAHAM CORPORATION

The following Annual Report on Form 10-K for the year ended March 31, 2014was filed with the U.S. Securities and Exchange Commission on June 4, 2014

[THIS PAGE INTENTIONALLY LEFT BLANK]
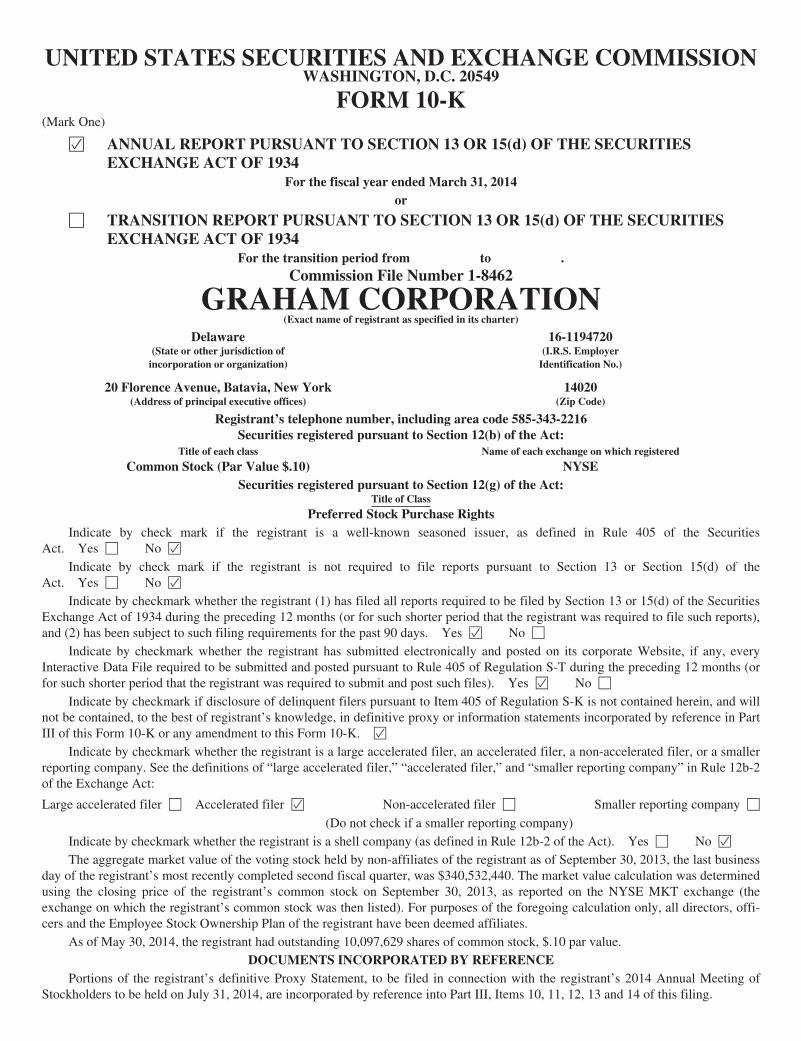
UNITED STATES SECURITIES AND EXCHANGE COMMISSIONWASHINGTON, D.C. 20549
FORM 10-K(Mark One)
Í ANNUAL REPORT PURSUANT TO SECTION 13 OR 15(d) OF THE SECURITIESEXCHANGE ACT OF 1934
For the fiscal year ended March 31, 2014or
‘ TRANSITION REPORT PURSUANT TO SECTION 13 OR 15(d) OF THE SECURITIESEXCHANGE ACT OF 1934
For the transition period from to .Commission File Number 1-8462
GRAHAM CORPORATION(Exact name of registrant as specified in its charter)
Delaware 16-1194720(State or other jurisdiction of
incorporation or organization)(I.R.S. Employer
Identification No.)
20 Florence Avenue, Batavia, New York 14020(Address of principal executive offices) (Zip Code)
Registrant’s telephone number, including area code 585-343-2216Securities registered pursuant to Section 12(b) of the Act:
Title of each class Name of each exchange on which registered
Common Stock (Par Value $.10) NYSESecurities registered pursuant to Section 12(g) of the Act:
Title of Class
Preferred Stock Purchase RightsIndicate by check mark if the registrant is a well-known seasoned issuer, as defined in Rule 405 of the Securities
Act. Yes ‘ No Í
Indicate by check mark if the registrant is not required to file reports pursuant to Section 13 or Section 15(d) of theAct. Yes ‘ No Í
Indicate by checkmark whether the registrant (1) has filed all reports required to be filed by Section 13 or 15(d) of the SecuritiesExchange Act of 1934 during the preceding 12 months (or for such shorter period that the registrant was required to file such reports),and (2) has been subject to such filing requirements for the past 90 days. Yes Í No ‘
Indicate by checkmark whether the registrant has submitted electronically and posted on its corporate Website, if any, everyInteractive Data File required to be submitted and posted pursuant to Rule 405 of Regulation S-T during the preceding 12 months (orfor such shorter period that the registrant was required to submit and post such files). Yes Í No ‘
Indicate by checkmark if disclosure of delinquent filers pursuant to Item 405 of Regulation S-K is not contained herein, and willnot be contained, to the best of registrant’s knowledge, in definitive proxy or information statements incorporated by reference in PartIII of this Form 10-K or any amendment to this Form 10-K. Í
Indicate by checkmark whether the registrant is a large accelerated filer, an accelerated filer, a non-accelerated filer, or a smallerreporting company. See the definitions of “large accelerated filer,” “accelerated filer,” and “smaller reporting company” in Rule 12b-2of the Exchange Act:
Large accelerated filer ‘ Accelerated filer Í Non-accelerated filer ‘ Smaller reporting company ‘
(Do not check if a smaller reporting company)Indicate by checkmark whether the registrant is a shell company (as defined in Rule 12b-2 of the Act). Yes ‘ No Í
The aggregate market value of the voting stock held by non-affiliates of the registrant as of September 30, 2013, the last businessday of the registrant’s most recently completed second fiscal quarter, was $340,532,440. The market value calculation was determinedusing the closing price of the registrant’s common stock on September 30, 2013, as reported on the NYSE MKT exchange (theexchange on which the registrant’s common stock was then listed). For purposes of the foregoing calculation only, all directors, offi-cers and the Employee Stock Ownership Plan of the registrant have been deemed affiliates.
As of May 30, 2014, the registrant had outstanding 10,097,629 shares of common stock, $.10 par value.DOCUMENTS INCORPORATED BY REFERENCE
Portions of the registrant’s definitive Proxy Statement, to be filed in connection with the registrant’s 2014 Annual Meeting ofStockholders to be held on July 31, 2014, are incorporated by reference into Part III, Items 10, 11, 12, 13 and 14 of this filing.
Table of Contents
GRAHAM CORPORATIONAnnual Report on Form 10-KYear Ended March 31, 2014
PAGE
PART IItem 1 Business . . . . . . . . . . . . . . . . . . . . . . . . . . . . . . . . . . . . . . . . . . . . . . . . . . . . . . . . . . . . . . . . . . 1
Item 1A Risk Factors . . . . . . . . . . . . . . . . . . . . . . . . . . . . . . . . . . . . . . . . . . . . . . . . . . . . . . . . . . . . . . . 6
Item 1B Unresolved Staff Comments . . . . . . . . . . . . . . . . . . . . . . . . . . . . . . . . . . . . . . . . . . . . . . . . . . 16
Item 2 Properties . . . . . . . . . . . . . . . . . . . . . . . . . . . . . . . . . . . . . . . . . . . . . . . . . . . . . . . . . . . . . . . . . 16
Item 3 Legal Proceedings . . . . . . . . . . . . . . . . . . . . . . . . . . . . . . . . . . . . . . . . . . . . . . . . . . . . . . . . . . 16
Item 4 Mine Safety Disclosures . . . . . . . . . . . . . . . . . . . . . . . . . . . . . . . . . . . . . . . . . . . . . . . . . . . . . . 16
PART IIItem 5 Market for Registrant’s Common Equity, Related Stockholder Matters and Issuer Purchases
of Equity Securities . . . . . . . . . . . . . . . . . . . . . . . . . . . . . . . . . . . . . . . . . . . . . . . . . . . . . . . . . 16
Item 6 Selected Financial Data . . . . . . . . . . . . . . . . . . . . . . . . . . . . . . . . . . . . . . . . . . . . . . . . . . . . . . 18
Item 7 Management’s Discussion and Analysis of Financial Condition and Results ofOperations . . . . . . . . . . . . . . . . . . . . . . . . . . . . . . . . . . . . . . . . . . . . . . . . . . . . . . . . . . . . . . . . 19
Item 7A Quantitative and Qualitative Disclosures About Market Risk . . . . . . . . . . . . . . . . . . . . . . . . . 32
Item 8 Financial Statements and Supplementary Data . . . . . . . . . . . . . . . . . . . . . . . . . . . . . . . . . . . . 34
Item 9 Changes in and Disagreements with Accountants on Accounting and FinancialDisclosure . . . . . . . . . . . . . . . . . . . . . . . . . . . . . . . . . . . . . . . . . . . . . . . . . . . . . . . . . . . . . . . . . 68
Item 9A Controls and Procedures . . . . . . . . . . . . . . . . . . . . . . . . . . . . . . . . . . . . . . . . . . . . . . . . . . . . . . 68
Item 9B Other Information . . . . . . . . . . . . . . . . . . . . . . . . . . . . . . . . . . . . . . . . . . . . . . . . . . . . . . . . . . . 68
PART IIIItem 10 Directors, Executive Officers and Corporate Governance . . . . . . . . . . . . . . . . . . . . . . . . . . . . 69
Item 11 Executive Compensation . . . . . . . . . . . . . . . . . . . . . . . . . . . . . . . . . . . . . . . . . . . . . . . . . . . . . 69
Item 12 Security Ownership of Certain Beneficial Owners and Management and RelatedStockholder Matters . . . . . . . . . . . . . . . . . . . . . . . . . . . . . . . . . . . . . . . . . . . . . . . . . . . . . . . . . 69
Item 13 Certain Relationships and Related Transactions, and Director Independence . . . . . . . . . . . . . 69
Item 14 Principal Accounting Fees and Services . . . . . . . . . . . . . . . . . . . . . . . . . . . . . . . . . . . . . . . . . 70
PART IVItem 15 Exhibits, Financial Statement Schedules . . . . . . . . . . . . . . . . . . . . . . . . . . . . . . . . . . . . . . . . 70
Note: Portions of the registrant’s definitive Proxy Statement, to be issued in connection with the registrant’s2014 Annual Meeting of Stockholders to be held on July 31, 2014, are incorporated by reference intoPart III, Items 10, 11, 12, 13 and 14 of this Annual Report on Form 10-K.
PART I
(Dollar amounts in thousands except per share data)
Item 1. Business
Graham Corporation (“we,” “us,” “our”) is a global business that designs, manufactures and sells criticalequipment for the energy industry which includes the oil refining, petrochemical, cogeneration, nuclear andalternative power markets. With world-renowned engineering expertise in vacuum and heat transfer technologyand a leading nuclear code accredited fabrication and specialty machining company, we design and manufacturecustom-engineered ejectors, vacuum pumping systems, surface condensers and vacuum systems as well as sup-plies and components for use inside the reactor vessel and outside the containment vessel of nuclear power facili-ties. Our equipment is also used in nuclear propulsion power systems for the defense industry and can be foundin other diverse applications such as metal refining, pulp and paper processing, water heating, refrigeration,desalination, food processing, pharmaceutical, heating, ventilating and air conditioning.
We maintain two wholly-owned subsidiaries, Energy Steel & Supply Co. (“Energy Steel”), located inLapeer, Michigan, and Graham Vacuum and Heat Transfer Technology (Suzhou) Co., Ltd. (“GVHTT”), locatedin Suzhou, China. Energy Steel is a nuclear code accredited fabrication and specialty machining company thatprovides products to the nuclear power generation industry, primarily in the U.S. GVHTT provides sales andengineering support for us in the People’s Republic of China and throughout Asia.
We were incorporated in Delaware in 1983 and are the successor to Graham Manufacturing Co., Inc., whichwas incorporated in New York in 1936. Our corporate headquarters are in Batavia, New York. As of March 31,2014, we had 389 full-time employees.
Unless indicated otherwise, dollar figures in this Annual Report on Form 10-K are reported in thousands.
Our Products, Customers and Markets
Our products are used in a wide range of industrial process applications primarily in energy markets, includ-ing:
• Petroleum Refining
— conventional oil refining
— oil sands extraction
• Chemical and Petrochemical Processing
— fertilizer plants
— ethylene, methanol and nitrogen producing plants
— plastics, resins and fibers plants
— petrochemical intermediate plants
— coal-to-chemicals plants
— gas-to-liquids plants
• Power Generation /Alternative Energy
— nuclear power generation
— fossil fuel plants
— biomass plants
— cogeneration power plants
1
— geothermal power plants
— ethanol plants
• Defense
— propulsion systems for nuclear-powered aircraft carriers and other nuclear- powered vessels
• Other
— soap manufacturing plants
— air conditioning and water heating systems
— food processing plants
— pharmaceutical plants
— liquefied natural gas production facilities
Our principal customers are in the energy markets, chemical, petrochemical, petroleum refining and powergenerating industries. Our customers include end users of our products in their manufacturing, refining andpower generation processes, large engineering companies that build installations for companies in suchindustries, and the original equipment manufacturers, who combine our products with their equipment prior to itssale to end users.
Our products are sold by a team of sales engineers we employ directly as well as by independent sales repre-sentatives located worldwide. There may be short periods of time, a fiscal year for example, where one customermay make up greater than 10% of our business. However, if this occurs in multiple years, it is usually not thesame customer, or the same project, over such a multi-year period.
Approximately 40% to 50% of our revenue is generated from sales where the end use customer is outsidethe United States. We believe that revenue from the sale of our products outside the U.S. will continue to accountfor a significant portion of our total revenue for the foreseeable future. As a result, we have invested significantresources in developing and maintaining our international sales operations and presence, and we intend to con-tinue to make such investments in the future. As a result, we have established through GVHTT a significantpresence in Asia and expect that the Asian market will over time account for a significant portion of our revenue.However, we expect that as our domestic sales to nuclear power facilities and the U.S. Navy continue to grow,that a balance of U.S. to international sales will ultimately result. The mix of domestic and international sales canvary from year to year.
A breakdown of our net sales by geographic area and product class for our fiscal years ended March 31,2014, 2013 and 2012, which we refer to as “fiscal 2014,” “fiscal 2013” and “fiscal 2012”, respectively, is con-tained in Note 14 to our consolidated financial statements included in Item 8 of Part II of this Annual Report onForm 10-K and such breakdown is incorporated into this Item 1 by reference. We refer to our fiscal year endingMarch 31, 2015 as “fiscal 2015”. Our backlog at March 31, 2014 was $112,108, compared with $85,768 atMarch 31, 2013.
Our Strengths
Our core strengths include the following:
• We have strong brand recognition. Over the past 78 years, we believe that we have built a reputation fortop quality, reliable products and high standards of customer service. We have also established a largeinstalled application base. As a result, the Graham name is well known not only by our existing customers,but also by many of our potential customers. We believe that the recognition of the Graham brand allowsus to capitalize on market opportunities in both existing and potential markets. Moreover, our wholly-owned subsidiary, Energy Steel, has a more than 30 year history of providing products and support to itscustomers, especially the U.S. nuclear power industry, and is a recognized brand name in its markets.
2
• We custom engineer and manufacture high quality products and systems that address the particular needsof our customers. With 78 years of engineering expertise, we believe that we are well respected for ourknowledge in vacuum and heat transfer technologies. We maintain strict quality control and manufactur-ing standards in order to manufacture products of the highest quality.
• We have a global presence. Our products are used worldwide, and we have sales representatives locatedin many countries throughout the world.
• We have a strong reputation. We believe that we have a well-deserved reputation for both placing cus-tomers first and for standing behind our products. We believe that our relationships are strong both withour existing customer base as well as with our key suppliers.
• We have a highly trained workforce. We maintain a long-tenured, highly skilled and extremely flexibleworkforce.
• We have a strong balance sheet. We maintain significant cash and investments on hand, and no bankdebt. Our defined benefit pension plan obligations are over funded.
• We have a high quality credit facility. Our credit facilities provide us with a $30,000 borrowing capacitythat is expandable at our option to provide us with up to a total of $55,000 in borrowing capacity.
Our Strategy
Our objectives are to capture more market share within the geographies and industries we serve, expand ourgeographic markets, grow our presence in the energy industry and continually improve our results of operations.
Our strategic focus is to:
• Generate sustainable earnings growth.
• Reduce earnings volatility.
• Improve operating performance.
• Generate strong cash flow from operations.
• Focus on our customers and employees.
To accomplish our objectives and strategic focus, we believe that we must:
• Capitalize on the strength of the Graham and Energy Steel brands in order to both win more business inour traditional markets and enter new markets.
• Identify organic growth opportunities and consummate acquisitions where we believe our brand strengthwill provide us both with the ability to expand and will complement our core businesses. We intend toaccomplish this objective by extending our existing product lines, moving into complementary productlines and expanding our global sales presence in order to further broaden our existing markets and reachadditional markets. Our expansion into the nuclear power market with the acquisition of Energy Steel inDecember 2010 was in furtherance of this portion of our business strategy.
• Expand our market penetration in the domestic nuclear industry. We also intend to identify additionaldomestic and international opportunities to serve the nuclear industry.
• Expand our market presence in the U.S. Navy’s Nuclear Propulsion Program. We plan to demonstrateproficiency in executing complex Nuclear Propulsion Program orders that are currently in our backlog bycontrolling both cost and risk, providing high-quality custom fabrication to exacting military quality con-trol requirements and through disciplined project management. We plan to be a supplier of equipment tothe Nuclear Propulsion Program for both surface and submarine vessels.
• Invest in people and capital equipment to meet the long-term growth in demand for our products in the oilrefining, petrochemical processing and power generating industries, especially in emerging markets.
3
• Deliver the highest quality products and solutions that enable our customers to achieve their operatingobjectives and that differentiate us from our competitors. We believe this allows us to win new ordersbased on value.
In order to effectively implement our strategic focus, we also believe that we must continually work toimprove our company. Among other things, these efforts include:
• Investing in engineering resources and technology in order to advance our vacuum and heat transfer tech-nology market penetration.
• Enhancing our engineering capacity, especially in connection with the design of our products, in order tomore quickly respond to existing and future customer demands.
• Investing in our manufacturing facilities to expand capacity where needed and identifying out-sourcedcapacity to complement internal capacity.
• Accelerating our ability to quickly and efficiently bid on available projects by continuing to implementfront-end bid automation and design processes.
• Expanding our capabilities and penetrating the existing sales channel and customer base in the nuclearmarket.
• Continuing to invest in resources to further serve the U.S. Navy in our core competency areas of engineer-ing and manufacturing, where our commercial capabilities meet U.S. Navy requirements.
• Implementing and expanding upon our operational efficiencies through a flexible manufacturing flowmodel and the achievement of other cost efficiencies.
• Continuing to focus on improving quality to eliminate errors and rework, thereby reducing lead time.
• Developing a cross-trained, flexible workforce able to adjust to variable product demand by our custom-ers.
Competition
Our business is highly competitive. The principal bases on which we compete include technology, price,performance, reputation, delivery, and quality. Our competitors in our primary markets include:
NORTH AMERICAMarket Principal Competitors
Refining vacuum distillation Gardner Denver, Inc.
Chemicals/petrochemicals Croll Reynolds Company, Inc.; Schutte Koerting;Gardner Denver, Inc.
Turbomachinery Original Equipment Manufacturer(“OEM”) — refining, petrochemical
Ambassador; KEMCO; SPX Heat Transfer;DongHwa Entec Co., Ltd..; Oeltechnik GmbH
Turbomachinery OEM — power and power producer Holtec; Thermal Engineering International (USA),Inc.; KEMCO; SPX Heat Transfer; Maarky ThermalSystems
HVAC Alfa Laval AB; APV; Xylem; Ambassador
Nuclear Dubose, Consolidated, Tioga, Nova, Joseph Oats,Energy & Process
Defense DC Fabricators, Triumph Aerospace, Xylem, PCC
4
INTERNATIONAL
Market Principal Competitors
Refining vacuum distillation Gardner Denver, Inc.; GEA Wiegand GmbH;Edwards, Ltd.; Korting Hannover AG
Chemicals/petrochemicals Croll Reynolds Company, Inc.; Schutte Koerting;Gardner Denver, Inc.; GEA Wiegand GmbH; KortingHannover AG; Edwards, Ltd.
Turbomachinery OEM — refining, petrochemical DongHwa Entec Co., Ltd.; Hangzhou TurbineEquipment Co., Ltd.; Chem Process Systems, Mazda(India), Oeltechnik GmbH; KEMCO
Turbomachinery OEM — power and power producer Holtec; Thermal Engineering International; KEMCO;SPX Heat Transfer, Chem Process Systems, Mazda(India)
Intellectual Property
Our success depends in part on our ability to protect our proprietary technology. We rely on a combinationof patent, copyright, trademark, trade secret laws and contractual confidentiality provisions to establish and pro-tect our proprietary rights. We also depend heavily on the brand recognition of the Graham and Energy Steelnames in the marketplace.
Availability of Raw Materials
Historically, we have not been materially adversely impacted by the availability of raw materials.
Working Capital Practices
Our business does not require us to carry significant amounts of inventory or materials beyond what isneeded for work in process. We do not provide rights to return goods, or payment terms to customers that weconsider to be extended in the context of the industries we serve. However, we do provide for warranty claims.
Environmental Matters
We believe that we are in material compliance with applicable existing environmental laws and regulations.We do not anticipate that our compliance with federal, state and local laws regulating the discharge of material inthe environment or otherwise pertaining to the protection of the environment will have a material adverse effectupon our capital expenditures, earnings or competitive position.
Seasonality
No material part of our business is seasonal in nature. However, our business is highly cyclical in nature asit depends on the willingness of our customers to invest in major capital projects.
Research and Development Activities
During fiscal 2014, fiscal 2013 and fiscal 2012, we spent $3,436, $3,579 and $3,197, respectively, onresearch and development activities related to new products and services as well as the improvement of existingproducts and services.
Information Regarding International Sales
The sale of our products outside the U.S. has accounted for a significant portion of our total revenue duringour last three fiscal years. Approximately 38%, 47% and 46% of our revenue in fiscal 2014, fiscal 2013 and fis-cal 2012, respectively, resulted from foreign sales. Sales in Asia constituted approximately 11%, 16% and 17%
5
of our revenue in fiscal 2014, fiscal 2013 and fiscal 2012, respectively. Sales in the Middle East constitutedapproximately 4%, 14% and 16% of our revenue in fiscal 2014, fiscal 2013 and fiscal 2012, respectively. Ourforeign sales and operations are subject to numerous risks, as discussed under the heading “Risk Factors” inItem 1A of Part I and elsewhere in this Annual Report on Form 10-K.
Employees
As of March 31, 2014, we employed approximately 395 persons, including 6 part-time employees. Webelieve that our relationship with our employees is good.
Available Information
We are subject to the informational requirements of the Securities Exchange Act of 1934, as amended.Therefore, we file periodic reports, proxy statements and other information with the Securities and ExchangeCommission (“SEC”). The SEC maintains a website (located at www.sec.gov) that contains reports, proxystatements and other information for registrants that file electronically. Additionally, such reports may be readand copied at the Public Reference Room of the SEC at 100 F Street NE, Washington, D.C. 20549. Informationregarding the SEC’s Public Reference Room can be obtained by calling 1-800-SEC-0330.
We maintain a website located at www.graham-mfg.com. On our website, we provide a link to the SEC’swebsite that contains the reports, proxy statements and other information we file electronically. We do not pro-vide this information on our website because it is more cost effective for us to provide a link to the SEC’s web-site. Copies of all documents we file with the SEC are available in print for any stockholder who makes arequest. Such requests should be made to our Corporate Secretary at our corporate headquarters. The otherinformation found on our website is not part of this or any other report we file with, or furnish to, the SEC.
Item 1A. Risk Factors
Our business and operations are subject to numerous risks, many of which are described below and else-where in this Annual Report on Form 10-K. If any of the events described below or elsewhere in this AnnualReport on Form 10-K occur, our business and results of operations could be harmed. Additional risks anduncertainties that are not presently known to us, or which we currently deem to be immaterial, could also harmour business and results of operations.
Risks related to our business
The industries in which we operate are cyclical, and downturns in such industries may adversely affect ouroperating results.
A substantial portion of our revenue is derived from the sale of our products to companies in the chemical,petrochemical, petroleum refining and power generating industries and to the U.S. Department of Defense, or tofirms that design and construct facilities for these industries. The core industries in which our products are usedare, to varying degrees, highly cyclical and have historically experienced severe downturns. Although we believethat we are in a long-term expansion of demand for our products in the petrochemical, petroleum refining andpower generating industries, there are cyclical downturns which occur periodically. A sustained or renewed dete-rioration in any of the industries we serve would materially harm our business and operating results because ourcustomers would not likely have the resources necessary to purchase our products, nor would they likely have theneed to build additional facilities or improve existing facilities.
The larger markets we serve are the petroleum refining and petrochemical industries which are bothcyclical in nature and dependent on the price of crude oil and natural gas and the relationship between thetwo prices. As a result, volatility in the prices of oil and natural gas may negatively impact our operatingresults.
Although we believe that the global consumption of crude oil and natural gas will increase over the courseof the next 20 years and that such increased consumption will result in a need to continually increase globalcapacity, the prices of crude oil and natural gas have historically been very volatile. Many of our products are
6
purchased in connection with oil refinery construction, revamps and upgrades. The increased supply and reduc-tion of cost of natural gas in North America has also caused a significant change in the global energy markets inthe past few years. During times of significant volatility in the market for crude oil or natural gas, our customersmay refrain from placing orders until the market stabilizes. If our customers refrain from placing orders, ourrevenue would decline and potentially have a material adverse effect on our business and results of operations.
The change in the relationship between various energy sources may affect our business. The relative costsof oil, natural gas, nuclear power, hydro power and numerous forms of alternative energy production mayhave a material adverse impact on our business and operating results.
Global and regional energy supply comes from many sources, including oil, natural gas, coal, hydro,nuclear, solar, wind, geothermal, biomass, among others. A cost or supply shift among these sources could neg-atively impact our business opportunities going forward. A demand shift, where technological advances favor theutilization of one or a few sources of energy may also impact demand for our products. If demand shifts in amanner that increases energy utilization outside of our traditional customer base or expertise, our business andfinancial results could be materially adversely affected.
Our business is highly competitive. If we are unable to successfully implement our business strategy andcompete against entities with greater resources than us or competitors who have a relative cost advantage,we risk losing market share to current and future competitors.
We encounter competition in all of our markets. Some of our present and potential competitors may havesubstantially greater financial, marketing, technical or manufacturing resources. Our competitors may also beable to respond more quickly to new technologies or processes and changes in customer demands and they maybe able to devote greater resources towards the development, promotion and sale of their products than we areable to. Certain of our competitors may also have a cost advantage compared to us, and be able to respond tocustomer needs at lower pricing levels. This may affect our ability to secure business and maintain our level ofprofitability. In addition, our current and potential competitors may make strategic acquisitions or establishcooperative relationships among themselves or with third parties that increase their ability to address the needs ofour customers. Moreover, customer buying patterns can change if customers become more price sensitive andaccepting of lower cost suppliers. If we cannot compete successfully against current or future competitors, ourbusiness will be materially adversely affected.
A change in our end use customers, our markets, or a change in the engineering procurement and con-struction companies serving our markets could harm our business and negatively impact our financialresults.
Although we have long term relationships with many of our end use customers and with many engineering,procurement and construction companies, the project management requirements, pricing levels and costs tosupport each customer and customer type are often different. As our markets continue to grow, and new marketopportunities expand, we could see a shift in pricing and a shift of costs, which may have a material adverseimpact on our results of operations and financial results.
The loss of, or significant reduction or delay in, purchases by our largest customers could reduce our rev-enue and adversely affect our results of operations.
A small number of customers has accounted for a substantial portion of our historical net sales. For exam-ple, sales to our top ten customers accounted for 32%, 41% and 43% of consolidated sales in fiscal 2014, 2013and 2012, respectively. We expect that a limited number of customers will continue to represent a substantialportion of our sales for the foreseeable future. The loss of any of our major customers, a decrease or delay inorders or anticipated spending by such customers or a delay in the production of existing orders could materiallyadversely affect our revenues and results of operations.
7
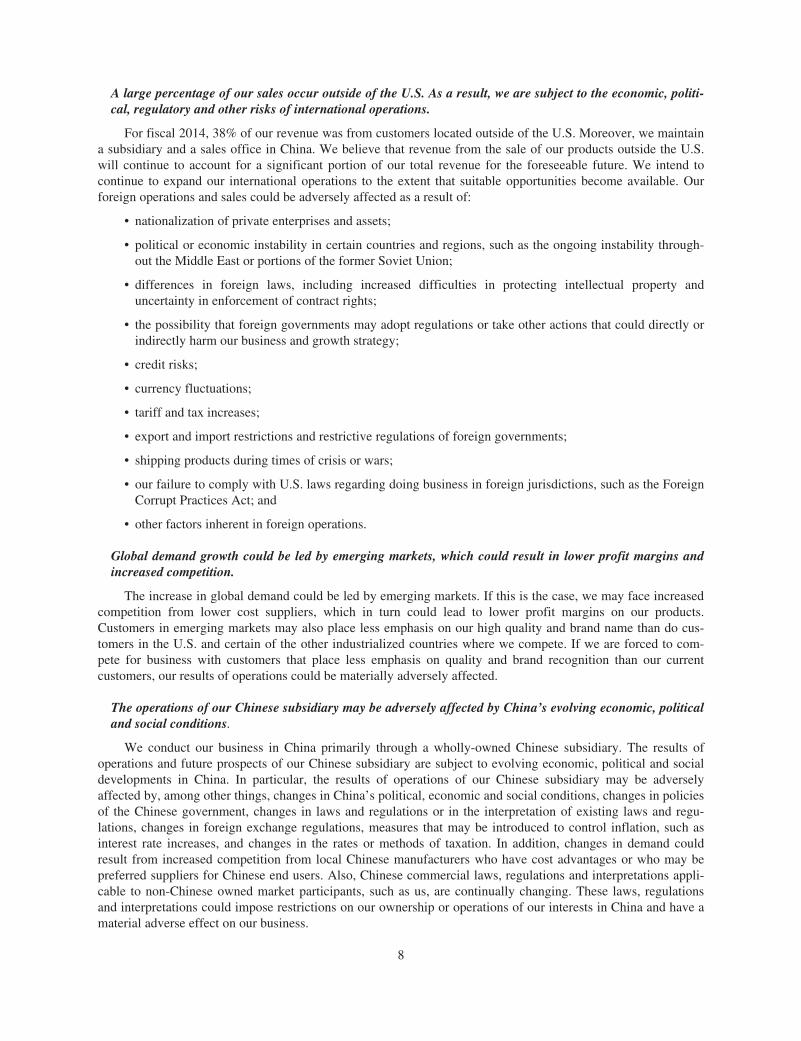
A large percentage of our sales occur outside of the U.S. As a result, we are subject to the economic, politi-cal, regulatory and other risks of international operations.
For fiscal 2014, 38% of our revenue was from customers located outside of the U.S. Moreover, we maintaina subsidiary and a sales office in China. We believe that revenue from the sale of our products outside the U.S.will continue to account for a significant portion of our total revenue for the foreseeable future. We intend tocontinue to expand our international operations to the extent that suitable opportunities become available. Ourforeign operations and sales could be adversely affected as a result of:
• nationalization of private enterprises and assets;
• political or economic instability in certain countries and regions, such as the ongoing instability through-out the Middle East or portions of the former Soviet Union;
• differences in foreign laws, including increased difficulties in protecting intellectual property anduncertainty in enforcement of contract rights;
• the possibility that foreign governments may adopt regulations or take other actions that could directly orindirectly harm our business and growth strategy;
• credit risks;
• currency fluctuations;
• tariff and tax increases;
• export and import restrictions and restrictive regulations of foreign governments;
• shipping products during times of crisis or wars;
• our failure to comply with U.S. laws regarding doing business in foreign jurisdictions, such as the ForeignCorrupt Practices Act; and
• other factors inherent in foreign operations.
Global demand growth could be led by emerging markets, which could result in lower profit margins andincreased competition.
The increase in global demand could be led by emerging markets. If this is the case, we may face increasedcompetition from lower cost suppliers, which in turn could lead to lower profit margins on our products.Customers in emerging markets may also place less emphasis on our high quality and brand name than do cus-tomers in the U.S. and certain of the other industrialized countries where we compete. If we are forced to com-pete for business with customers that place less emphasis on quality and brand recognition than our currentcustomers, our results of operations could be materially adversely affected.
The operations of our Chinese subsidiary may be adversely affected by China’s evolving economic, politicaland social conditions.
We conduct our business in China primarily through a wholly-owned Chinese subsidiary. The results ofoperations and future prospects of our Chinese subsidiary are subject to evolving economic, political and socialdevelopments in China. In particular, the results of operations of our Chinese subsidiary may be adverselyaffected by, among other things, changes in China’s political, economic and social conditions, changes in policiesof the Chinese government, changes in laws and regulations or in the interpretation of existing laws and regu-lations, changes in foreign exchange regulations, measures that may be introduced to control inflation, such asinterest rate increases, and changes in the rates or methods of taxation. In addition, changes in demand couldresult from increased competition from local Chinese manufacturers who have cost advantages or who may bepreferred suppliers for Chinese end users. Also, Chinese commercial laws, regulations and interpretations appli-cable to non-Chinese owned market participants, such as us, are continually changing. These laws, regulationsand interpretations could impose restrictions on our ownership or operations of our interests in China and have amaterial adverse effect on our business.
8
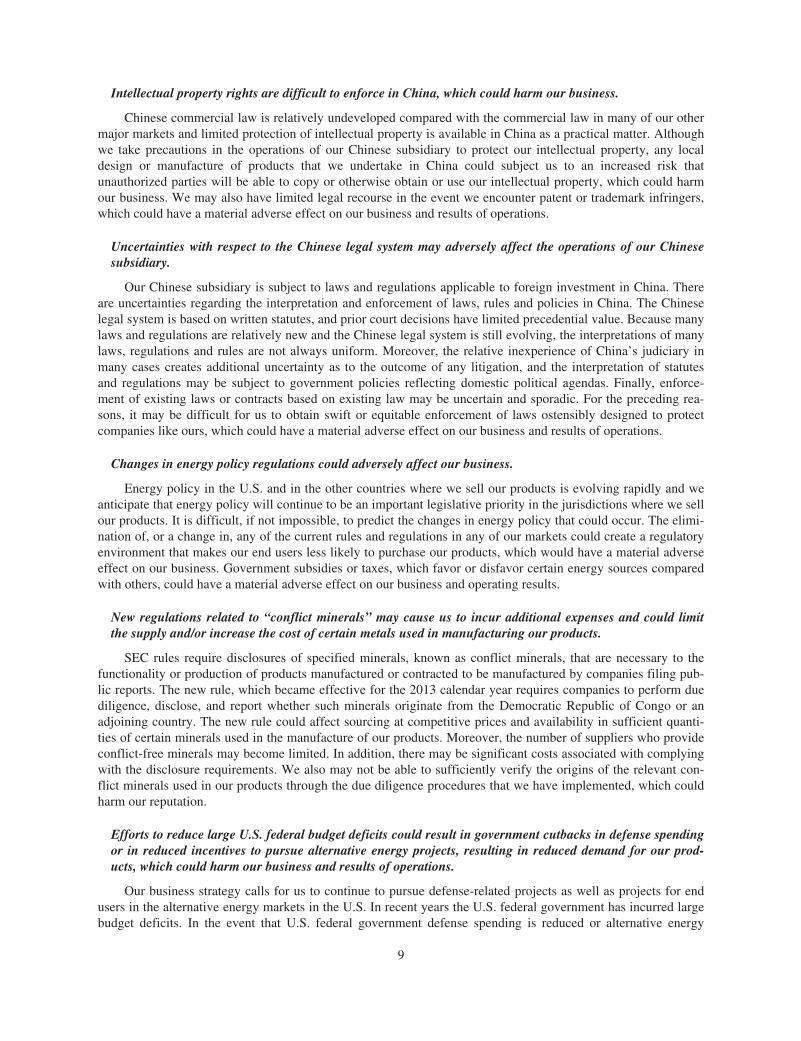
Intellectual property rights are difficult to enforce in China, which could harm our business.
Chinese commercial law is relatively undeveloped compared with the commercial law in many of our othermajor markets and limited protection of intellectual property is available in China as a practical matter. Althoughwe take precautions in the operations of our Chinese subsidiary to protect our intellectual property, any localdesign or manufacture of products that we undertake in China could subject us to an increased risk thatunauthorized parties will be able to copy or otherwise obtain or use our intellectual property, which could harmour business. We may also have limited legal recourse in the event we encounter patent or trademark infringers,which could have a material adverse effect on our business and results of operations.
Uncertainties with respect to the Chinese legal system may adversely affect the operations of our Chinesesubsidiary.
Our Chinese subsidiary is subject to laws and regulations applicable to foreign investment in China. Thereare uncertainties regarding the interpretation and enforcement of laws, rules and policies in China. The Chineselegal system is based on written statutes, and prior court decisions have limited precedential value. Because manylaws and regulations are relatively new and the Chinese legal system is still evolving, the interpretations of manylaws, regulations and rules are not always uniform. Moreover, the relative inexperience of China’s judiciary inmany cases creates additional uncertainty as to the outcome of any litigation, and the interpretation of statutesand regulations may be subject to government policies reflecting domestic political agendas. Finally, enforce-ment of existing laws or contracts based on existing law may be uncertain and sporadic. For the preceding rea-sons, it may be difficult for us to obtain swift or equitable enforcement of laws ostensibly designed to protectcompanies like ours, which could have a material adverse effect on our business and results of operations.
Changes in energy policy regulations could adversely affect our business.
Energy policy in the U.S. and in the other countries where we sell our products is evolving rapidly and weanticipate that energy policy will continue to be an important legislative priority in the jurisdictions where we sellour products. It is difficult, if not impossible, to predict the changes in energy policy that could occur. The elimi-nation of, or a change in, any of the current rules and regulations in any of our markets could create a regulatoryenvironment that makes our end users less likely to purchase our products, which would have a material adverseeffect on our business. Government subsidies or taxes, which favor or disfavor certain energy sources comparedwith others, could have a material adverse effect on our business and operating results.
New regulations related to “conflict minerals” may cause us to incur additional expenses and could limitthe supply and/or increase the cost of certain metals used in manufacturing our products.
SEC rules require disclosures of specified minerals, known as conflict minerals, that are necessary to thefunctionality or production of products manufactured or contracted to be manufactured by companies filing pub-lic reports. The new rule, which became effective for the 2013 calendar year requires companies to perform duediligence, disclose, and report whether such minerals originate from the Democratic Republic of Congo or anadjoining country. The new rule could affect sourcing at competitive prices and availability in sufficient quanti-ties of certain minerals used in the manufacture of our products. Moreover, the number of suppliers who provideconflict-free minerals may become limited. In addition, there may be significant costs associated with complyingwith the disclosure requirements. We also may not be able to sufficiently verify the origins of the relevant con-flict minerals used in our products through the due diligence procedures that we have implemented, which couldharm our reputation.
Efforts to reduce large U.S. federal budget deficits could result in government cutbacks in defense spendingor in reduced incentives to pursue alternative energy projects, resulting in reduced demand for our prod-ucts, which could harm our business and results of operations.
Our business strategy calls for us to continue to pursue defense-related projects as well as projects for endusers in the alternative energy markets in the U.S. In recent years the U.S. federal government has incurred largebudget deficits. In the event that U.S. federal government defense spending is reduced or alternative energy
9
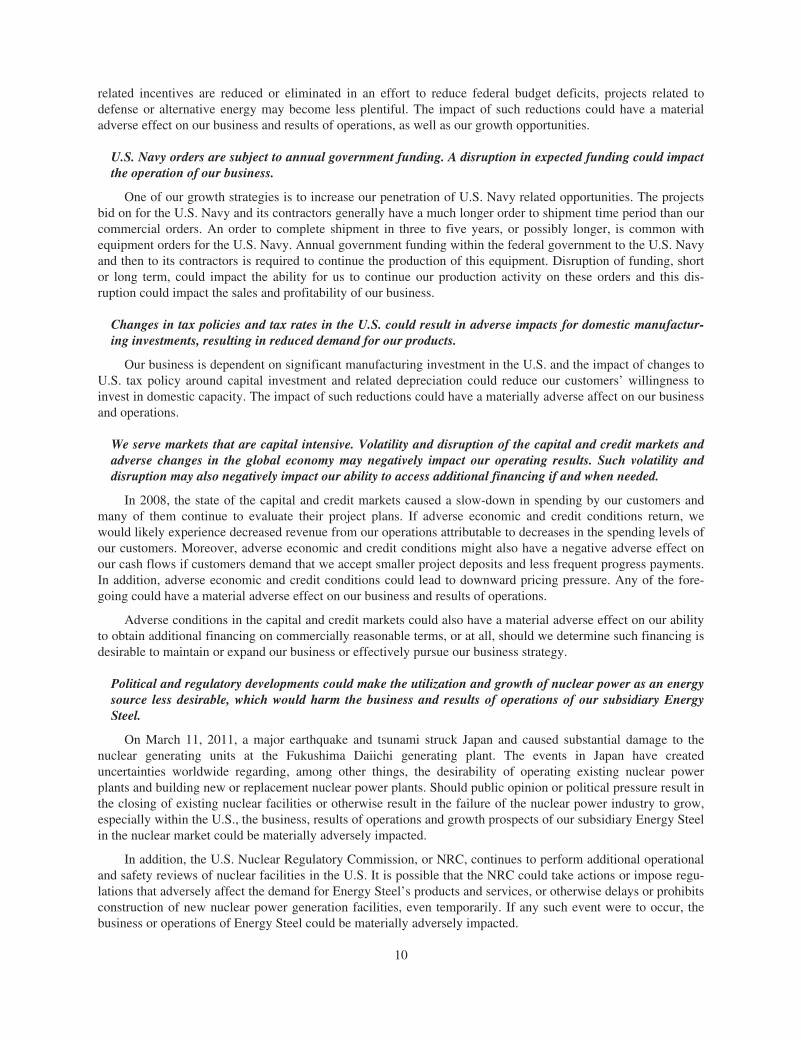
related incentives are reduced or eliminated in an effort to reduce federal budget deficits, projects related todefense or alternative energy may become less plentiful. The impact of such reductions could have a materialadverse effect on our business and results of operations, as well as our growth opportunities.
U.S. Navy orders are subject to annual government funding. A disruption in expected funding could impactthe operation of our business.
One of our growth strategies is to increase our penetration of U.S. Navy related opportunities. The projectsbid on for the U.S. Navy and its contractors generally have a much longer order to shipment time period than ourcommercial orders. An order to complete shipment in three to five years, or possibly longer, is common withequipment orders for the U.S. Navy. Annual government funding within the federal government to the U.S. Navyand then to its contractors is required to continue the production of this equipment. Disruption of funding, shortor long term, could impact the ability for us to continue our production activity on these orders and this dis-ruption could impact the sales and profitability of our business.
Changes in tax policies and tax rates in the U.S. could result in adverse impacts for domestic manufactur-ing investments, resulting in reduced demand for our products.
Our business is dependent on significant manufacturing investment in the U.S. and the impact of changes toU.S. tax policy around capital investment and related depreciation could reduce our customers’ willingness toinvest in domestic capacity. The impact of such reductions could have a materially adverse affect on our businessand operations.
We serve markets that are capital intensive. Volatility and disruption of the capital and credit markets andadverse changes in the global economy may negatively impact our operating results. Such volatility anddisruption may also negatively impact our ability to access additional financing if and when needed.
In 2008, the state of the capital and credit markets caused a slow-down in spending by our customers andmany of them continue to evaluate their project plans. If adverse economic and credit conditions return, wewould likely experience decreased revenue from our operations attributable to decreases in the spending levels ofour customers. Moreover, adverse economic and credit conditions might also have a negative adverse effect onour cash flows if customers demand that we accept smaller project deposits and less frequent progress payments.In addition, adverse economic and credit conditions could lead to downward pricing pressure. Any of the fore-going could have a material adverse effect on our business and results of operations.
Adverse conditions in the capital and credit markets could also have a material adverse effect on our abilityto obtain additional financing on commercially reasonable terms, or at all, should we determine such financing isdesirable to maintain or expand our business or effectively pursue our business strategy.
Political and regulatory developments could make the utilization and growth of nuclear power as an energysource less desirable, which would harm the business and results of operations of our subsidiary EnergySteel.
On March 11, 2011, a major earthquake and tsunami struck Japan and caused substantial damage to thenuclear generating units at the Fukushima Daiichi generating plant. The events in Japan have createduncertainties worldwide regarding, among other things, the desirability of operating existing nuclear powerplants and building new or replacement nuclear power plants. Should public opinion or political pressure result inthe closing of existing nuclear facilities or otherwise result in the failure of the nuclear power industry to grow,especially within the U.S., the business, results of operations and growth prospects of our subsidiary Energy Steelin the nuclear market could be materially adversely impacted.
In addition, the U.S. Nuclear Regulatory Commission, or NRC, continues to perform additional operationaland safety reviews of nuclear facilities in the U.S. It is possible that the NRC could take actions or impose regu-lations that adversely affect the demand for Energy Steel’s products and services, or otherwise delays or prohibitsconstruction of new nuclear power generation facilities, even temporarily. If any such event were to occur, thebusiness or operations of Energy Steel could be materially adversely impacted.
10
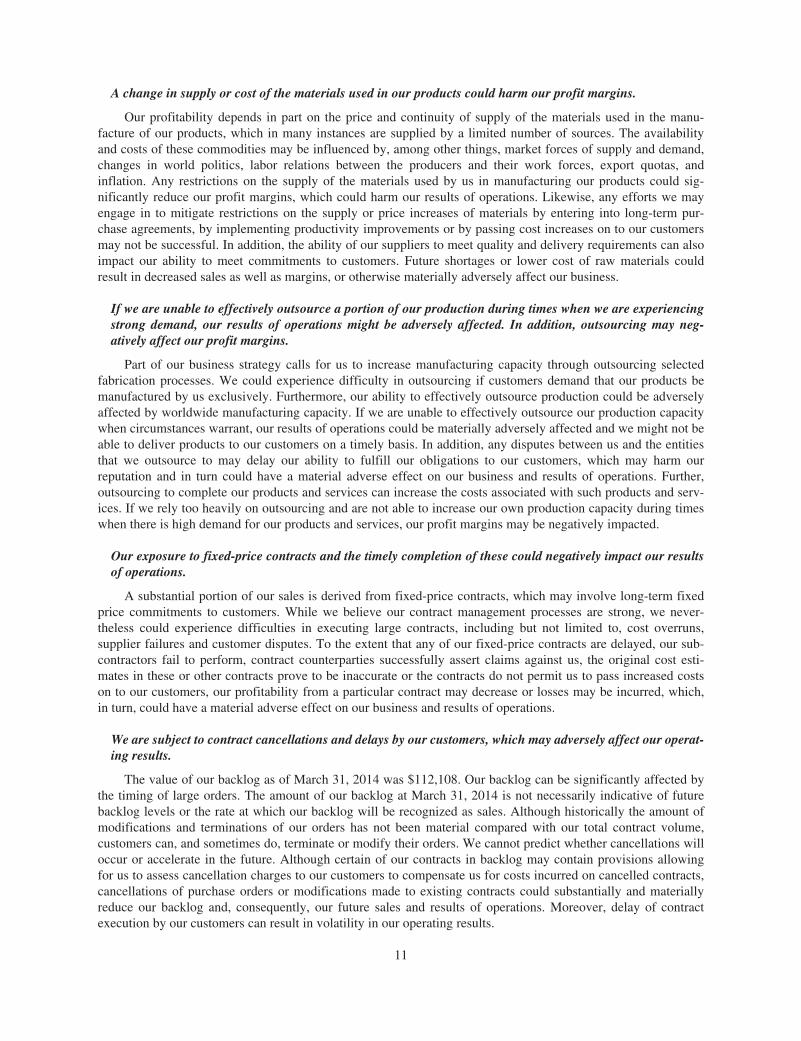
A change in supply or cost of the materials used in our products could harm our profit margins.
Our profitability depends in part on the price and continuity of supply of the materials used in the manu-facture of our products, which in many instances are supplied by a limited number of sources. The availabilityand costs of these commodities may be influenced by, among other things, market forces of supply and demand,changes in world politics, labor relations between the producers and their work forces, export quotas, andinflation. Any restrictions on the supply of the materials used by us in manufacturing our products could sig-nificantly reduce our profit margins, which could harm our results of operations. Likewise, any efforts we mayengage in to mitigate restrictions on the supply or price increases of materials by entering into long-term pur-chase agreements, by implementing productivity improvements or by passing cost increases on to our customersmay not be successful. In addition, the ability of our suppliers to meet quality and delivery requirements can alsoimpact our ability to meet commitments to customers. Future shortages or lower cost of raw materials couldresult in decreased sales as well as margins, or otherwise materially adversely affect our business.
If we are unable to effectively outsource a portion of our production during times when we are experiencingstrong demand, our results of operations might be adversely affected. In addition, outsourcing may neg-atively affect our profit margins.
Part of our business strategy calls for us to increase manufacturing capacity through outsourcing selectedfabrication processes. We could experience difficulty in outsourcing if customers demand that our products bemanufactured by us exclusively. Furthermore, our ability to effectively outsource production could be adverselyaffected by worldwide manufacturing capacity. If we are unable to effectively outsource our production capacitywhen circumstances warrant, our results of operations could be materially adversely affected and we might not beable to deliver products to our customers on a timely basis. In addition, any disputes between us and the entitiesthat we outsource to may delay our ability to fulfill our obligations to our customers, which may harm ourreputation and in turn could have a material adverse effect on our business and results of operations. Further,outsourcing to complete our products and services can increase the costs associated with such products and serv-ices. If we rely too heavily on outsourcing and are not able to increase our own production capacity during timeswhen there is high demand for our products and services, our profit margins may be negatively impacted.
Our exposure to fixed-price contracts and the timely completion of these could negatively impact our resultsof operations.
A substantial portion of our sales is derived from fixed-price contracts, which may involve long-term fixedprice commitments to customers. While we believe our contract management processes are strong, we never-theless could experience difficulties in executing large contracts, including but not limited to, cost overruns,supplier failures and customer disputes. To the extent that any of our fixed-price contracts are delayed, our sub-contractors fail to perform, contract counterparties successfully assert claims against us, the original cost esti-mates in these or other contracts prove to be inaccurate or the contracts do not permit us to pass increased costson to our customers, our profitability from a particular contract may decrease or losses may be incurred, which,in turn, could have a material adverse effect on our business and results of operations.
We are subject to contract cancellations and delays by our customers, which may adversely affect our operat-ing results.
The value of our backlog as of March 31, 2014 was $112,108. Our backlog can be significantly affected bythe timing of large orders. The amount of our backlog at March 31, 2014 is not necessarily indicative of futurebacklog levels or the rate at which our backlog will be recognized as sales. Although historically the amount ofmodifications and terminations of our orders has not been material compared with our total contract volume,customers can, and sometimes do, terminate or modify their orders. We cannot predict whether cancellations willoccur or accelerate in the future. Although certain of our contracts in backlog may contain provisions allowingfor us to assess cancellation charges to our customers to compensate us for costs incurred on cancelled contracts,cancellations of purchase orders or modifications made to existing contracts could substantially and materiallyreduce our backlog and, consequently, our future sales and results of operations. Moreover, delay of contractexecution by our customers can result in volatility in our operating results.
11
Our current backlog contains large orders from the U.S. Navy project and for installation in new U.S.nuclear reactors. In addition, we are continuing to pursue business in these end markets which offer large multi-year projects which have an added risk profile beyond that of our historic customer base. A delay, long termextension or cancellation in any of these projects could have a material adverse effect on our business and resultsof operations.
We utilize percentage of completion accounting on the majority of our sales. Changes in estimates for pro-duction could result in a reduction or elimination of previously reported sales and earnings.
For the majority of our sales, cost of goods sold and operating profit are recognized using percentage ofcompletion method of accounting. This accounting method requires updated recognition of sales and cost foreach project on a quarterly basis. If the portion of a project is under or over-estimated, a correction is required tobe made in the current period. Corrections for large projects could significantly impact short term financialresults. Large revisions could reverse sales, costs and earnings reported in prior periods.
If we lose any member of our management team and we experience difficulty in finding a qualified replace-ment, our business would be harmed.
Competition for qualified management and key technical and sales personnel in our industry is intense.Moreover, our technology is highly specialized and it may be difficult to replace the loss of any of our keytechnical and sales personnel. Many of the companies with which we compete for management and key technicaland sales personnel have greater financial and other resources than we do or are located in geographic areaswhich may be considered by some to be more desirable places to live. If we are not able to retain any of our keymanagement, technical or sales personnel, it could have a material adverse effect on our business and results ofoperations.
During certain high demand periods, there can be a shortage of skilled production workers, especially thosewith high-end welding capabilities. We could experience a difficulty hiring or replacing those individuals,which could adversely affect our business.
Our fabrication processes require highly skilled production workers, especially welders. Welding has notbeen an educational field that has been popular over the past few decades as manufacturing has moved overseas.If we were to be unable to retain, hire or train an adequate number of individuals with high-end welding capa-bility, this could impact our ability to achieve our financial objectives. In addition, if demand for highly skilledproduction workers were to significantly outstrip supply, wages for these skilled workers could dramaticallyincrease in our and related industries and that could affect our financial performance.
Our acquisition strategy may not be successful or may increase business risk.
The success of our acquisition strategy will depend, in part, on our ability to identify suitable companies orbusinesses to purchase and then successfully negotiate and close acquisition transactions. In addition, our successdepends in part on our ability to integrate acquisitions and realize the anticipated benefits from combining theacquisition with our historical business, operations and management. We cannot provide any assurances that wewill be able to complete any acquisitions and then successfully integrate the business and operations of thoseacquisitions without encountering difficulties, including unanticipated costs, difficulty in retaining customers andsupplier or other relationships, failure to retain key employees, diversion of our management’s attention, failureto integrate information and accounting systems or establish and maintain proper internal control over financialreporting. Moreover, as part of the integration process, we must incorporate an acquisition’s existing businessculture and compensation structure with our existing business. If we are not able to efficiently integrate anacquisition’s business and operations into our organization in a timely and efficient manner, or at all, the antici-pated benefits of the acquisition may not be realized, or it may take longer to realize these benefits than we cur-rently expect, either of which could have a material adverse effect on our business or results of operations.
12
Our intangible assets substantially increased as a result of our acquisition of Energy Steel. Should a portionof these intangible assets be impaired, results of operations could be materially adversely affected.
Our balance sheet includes intangible assets, including goodwill and other separately identifiable intangibleassets, primarily as a result of our acquisition of Energy Steel. The value of these intangible assets may increasein the future if we complete additional acquisitions as part of our overall business strategy. We are required toreview our intangible assets for impairment on an annual basis, or more frequently if certain indicators of perma-nent impairment arise. Factors that could indicate that our intangible assets are impaired could include, amongother things, a decline in our stock price and market capitalization, lower than projected operating results andcash flows, and slower than expected growth rates in our markets. If a portion of our intangible assets becomesimpaired as a result of such a review, the impaired portion of such assets would have to be written-off during thatperiod. Such a write-off could have a material adverse effect on our business and results of operations.
If we are unable to make necessary capital investments or respond to pricing pressures, our business may beharmed.
In order to remain competitive, we need to invest continuously in manufacturing, customer service andsupport, research and development and marketing. From time to time we also have to adjust the prices of ourproducts to remain competitive. We may not have available sufficient financial or other resources to continue tomake the investment necessary to lower our production costs and help us maintain our competitive position,which could have a material adverse effect on our business and results of operations.
If we fail to introduce enhancements to our existing products or to keep abreast of technological changes inour markets, our business and results of operations could be adversely affected.
Although technologies in the vacuum and heat transfer areas are well established, we believe our futuresuccess depends, in part, on our ability to enhance our existing products and develop new products in order tocontinue to meet customer demands. Our failure to introduce new or enhanced products on a timely and cost-competitive basis, or the development of processes that make our existing technologies or products obsoletecould have a material adverse effect on our business and results of operations.
If third parties infringe upon our intellectual property or if we were to infringe upon the intellectual prop-erty of third parties, we may expend significant resources enforcing or defending our rights or suffer com-petitive injury.
Our success depends in part on our proprietary technology. We rely on a combination of patent, copyright,trademark, trade secret laws and confidentiality provisions to establish and protect our proprietary rights. If wefail to successfully enforce our intellectual property rights, our competitive position could suffer. We may also berequired to spend significant resources to monitor and police our intellectual property rights. Similarly, if wewere found to have infringed on the intellectual property rights of others, our competitive position could suffer.Furthermore, other companies may develop technologies that are similar or superior to our technologies, dupli-cate or reverse engineer our technologies or design around our proprietary technologies. Any of the foregoingcould have a material adverse effect on our business and results of operations.
In some instances, litigation may be necessary to enforce our intellectual property rights and protect ourproprietary information, or to defend against claims by third parties that our products infringe their intellectualproperty rights. Any litigation or claims brought by or against us, whether with or without merit, could result insubstantial costs to us and divert the attention of our management, which could materially harm our business andresults of operations. In addition, any intellectual property litigation or claims against us could result in the lossor compromise of our intellectual property and proprietary rights, subject us to significant liabilities, require us toseek licenses on unfavorable terms, prevent us from manufacturing or selling certain products or require us toredesign certain products, any of which could have a material adverse effect on our business and results of oper-ations.
13
If we become subject to product liability, warranty or other claims, our results of operations and financialcondition could be adversely affected.
The manufacture and sale of our products exposes us to potential product liability claims, including thosethat may arise from failure to meet product specifications, misuse or malfunction of, design flaws in our prod-ucts, or use of our products with systems not manufactured or sold by us. For example, our equipment is installedin facilities that operate dangerous processes and the misapplication, improper installation or failure of ourequipment may result in exposure to potentially hazardous substances, personal injury or property damage.
Provisions contained in our contracts with customers that attempt to limit our damages may not be enforce-able or may fail to protect us from liability for damages and we may not negotiate such contractual limitations ofliability in certain circumstances. Our insurance may not cover all liabilities nor may our historical experiencereflect any liabilities we may face in the future. We also may not be able to continue to maintain such insuranceat a reasonable cost or on reasonable terms, or at all. Any material liability not covered by provisions in our con-tracts or by insurance could have a material adverse effect on our business and financial condition.
Furthermore, if a customer suffers damage as a result of an event related to one of our products, even if weare not at fault, they may reduce their business with us. We may also incur significant warranty claims, which arenot covered by insurance. In the event a customer ceases doing business with us as a result of a product malfunc-tion or defect, perceived or actual, or if we incur significant warranty costs in the future, there could be a materialadverse effect on our business and results of operations.
We are subject to foreign currency fluctuations which may adversely affect our operating results.
We are exposed to the risk of currency fluctuations between the U.S. dollar and the currencies of the coun-tries in which we sell our products to the extent that such sales are not based on U.S. dollars. Currency move-ments can affect sales in several ways, the foremost being our ability to compete for orders against foreigncompetitors that base their prices on relatively weaker currencies. Business lost due to competition for ordersagainst competitors using a relatively weaker currency cannot be quantified. In addition, cash can be adverselyimpacted by the conversion of sales made by us in a foreign currency to U.S. dollars. While we may enter intocurrency exchange rate hedges from time to time to mitigate these types of fluctuations, we cannot remove allfluctuations or hedge all exposures and our earnings are impacted by changes in currency exchange rates. Inaddition, if the counter-parties to such exchange contracts do not fulfill their obligations to deliver the contractualforeign currencies, we could be at risk for fluctuations, if any, required to settle the obligation. Any of the fore-going could adversely affect our business and results of operations. At March 31, 2014, we held no forward for-eign currency exchange contracts.
Changes in our effective tax rate and tax policies may impact our profitability.
We are subject to income and other taxes in the U.S. and China. A change in tax laws or interpretation of taxlaws, introduction of new tax accounting standards and regulation, our global mix of earnings, the ability to uti-lize deferred tax assets and changes in uncertain positions could affect our effective tax rate and impact thefinancial performance of the company. Changes in tax laws of other jurisdictions could impact the profitability ofour competitors, which could affect our competitive position relative to those competitors.
Security threats and other sophisticated computer intrusions could harm our information systems, which inturn could harm our business and financial results.
We utilize information systems and computer technology throughout our business. We store sensitive data,proprietary information and perform engineering designs and calculations on these systems. Information systemsare subject to threats and sophisticated computer crimes, which pose a risk to the stability and security of ourbusiness. A failure or breach in security could expose our company as well as our customers and suppliers torisks of misuse of information, compromising confidential information and technology, destruction of data, pro-duction disruptions and other business risks which could damage our reputation, competitive position and finan-cial results of our operations. In addition, defending ourselves against these threats may increase costs or slowoperational efficiencies of our business. If any of the foregoing were to occur, it could have a material adverseeffect on our business and results of operations.
14
We face potential liability from asbestos exposure and similar claims that could result in substantial costs tous as well as divert attention of our management, which could have a material adverse effect on our busi-ness and results of operations.
We are a defendant in a number of lawsuits alleging illnesses from exposure to asbestos or asbestos-containing products and seeking unspecified compensatory and punitive damages. We cannot predict with cer-tainty the outcome of these lawsuits or whether we could become subject to any similar, related or additionallawsuits in the future. In addition, because some of our products are used in systems that handle toxic or hazard-ous substances, any failure or alleged failure of our products in the future could result in litigation against us. Forexample, a claim could be made under various regulations for the adverse consequences of environmental con-tamination. Any litigation brought against us, whether with or without merit, could result in substantial costs tous as well as divert the attention of our management, which could have a material adverse effect on our businessand results of operations.
Any failure to comply with the United States Foreign Corrupt Practices Act could adversely impact ourcompetitive position and subject us to penalties and other adverse consequences, which could harm ourbusiness and results of operations.
We are subject to the United States Foreign Corrupt Practices Act, which generally prohibits U.S. compa-nies from engaging in bribery or making other prohibited payments to foreign officials for the purpose of obtain-ing or retaining business. Many foreign companies, including some of our competitors, are not subject to theseprohibitions. Corruption, extortion, bribery, pay-offs, theft and other fraudulent practices occur from time-to-timein certain of the jurisdictions in which we may operate or sell our products. While we strictly prohibit ouremployees and agents from engaging in such conduct and have established procedures, controls and training toprevent such conduct from occurring, it is possible that our employees or agents will engage in such conduct andthat we might be held responsible. If our employees or other agents are alleged or are found to have engaged insuch practices, we could incur significant costs and suffer severe penalties or other consequences that may have amaterial adverse effect on our business, financial condition and results of operations.
Risks related to the ownership of our common stock
Provisions contained in our certificate of incorporation and bylaws could impair or delay stockholders’ abil-ity to change our management and could discourage takeover transactions that our stockholders mightconsider to be in their best interests.
Provisions of our certificate of incorporation and bylaws could impede attempts by our stockholders toremove or replace our management and could discourage others from initiating a potential merger, takeover orother change of control transaction, including a potential transaction at a premium over the market price of ourcommon stock, that our stockholders might consider to be in their best interests. Such provisions include:
• We could issue shares of preferred stock with terms adverse to our common stock. Under our certificateof incorporation, our Board of Directors is authorized to issue shares of preferred stock and to determinethe rights, preferences and privileges of such shares without obtaining any further approval from the hold-ers of our common stock. We could issue shares of preferred stock with voting and conversion rights thatadversely affect the voting power of the holders of our common stock, or that have the effect of delayingor preventing a change in control of our company.
• Only a minority of our directors may be elected in a given year. Our bylaws provide for a classifiedBoard of Directors, with only approximately one-third of our Board elected each year. This provisionmakes it more difficult to effect a change of control because at least two annual stockholder meetings arenecessary to replace a majority of our directors.
• Our bylaws contain advance notice requirements. Our bylaws also provide that any stockholder whowishes to bring business before an annual meeting of our stockholders or to nominate candidates for elec-tion as directors at an annual meeting of our stockholders must deliver advance notice of their proposals tous before the meeting. Such advance notice provisions may have the effect of making it more difficult tointroduce business at stockholder meetings or nominate candidates for election as director.
15
• Our certificate of incorporation requires supermajority voting to approve a change of controltransaction. Seventy-five percent of our outstanding shares entitled to vote are required to approve anymerger, consolidation, sale of all or substantially all of our assets and similar transactions if the other partyto such transaction owns 5% or more of our shares entitled to vote. In addition, a majority of the sharesentitled to vote not owned by such 5% or greater stockholder are also required to approve any such trans-action.
• Amendments to our certificate of incorporation require supermajority voting. Our certificate ofincorporation contains provisions that make its amendment require the affirmative vote of both 75% ofour outstanding shares entitled to vote and a majority of the shares entitled to vote not owned by any per-son who may hold 50% or more of our shares unless the proposed amendment was previously recom-mended to our stockholders by an affirmative vote of 75% of our Board. This provision makes it moredifficult to implement a change to our certificate of incorporation that stockholders might otherwise con-sider to be in their best interests without approval of our Board.
• Amendments to our bylaws require supermajority voting. Although our Board of Directors is permittedto amend our bylaws at any time, our stockholders may only amend our bylaws upon the affirmative voteof both 75% of our outstanding shares entitled to vote and a majority of the shares entitled to vote notowned by any person who owns 50% or more of our shares. This provision makes it more difficult for ourstockholders to implement a change they may consider to be in their best interests without approval of ourBoard.
Item 1B. Unresolved Staff Comments
Not applicable.
Item 2. Properties
Our corporate headquarters, located at 20 Florence Avenue, Batavia, New York, consists of a 45,000 squarefoot building. Our manufacturing facilities, also located in Batavia, consist of approximately 33 acres and containabout 250,000 square feet in several buildings, including 196,000 square feet in manufacturing facilities, 48,000square feet for warehousing and a 6,000 square-foot building for product research and development. We alsolease approximately 15,000 square feet of office space and 45,000 square feet of manufacturing facilities for oursubsidiary, Energy Steel, located in Lapeer, Michigan. Additionally, we lease an approximately 1,500 square footU.S. sales office in Houston, Texas and GVHTT leases an approximately 4,900 square foot sales and engineeringoffice in Suzhou, China.
We believe that our properties are generally in good condition, are well maintained, and are suitable andadequate to carry on our business.
Item 3. Legal Proceedings
The information required by this Item 3 is contained in Note 15 to our consolidated financial statementsincluded in Item 8 of Part II of this Annual Report on Form 10-K and is incorporated herein by reference.
Item 4. Mine Safety Disclosures
Not applicable.
PART II
(Amounts in thousands, except per share data)
Item 5. Market for Registrant’s Common Equity, Related Stockholder Matters and Issuer Purchases ofEquity Securities
Our common stock is traded on the NYSE exchange under the symbol “GHM”. As of May 30, 2014, therewere 10,098 shares of our common stock outstanding that were held by approximately 152 stockholders ofrecord.
16
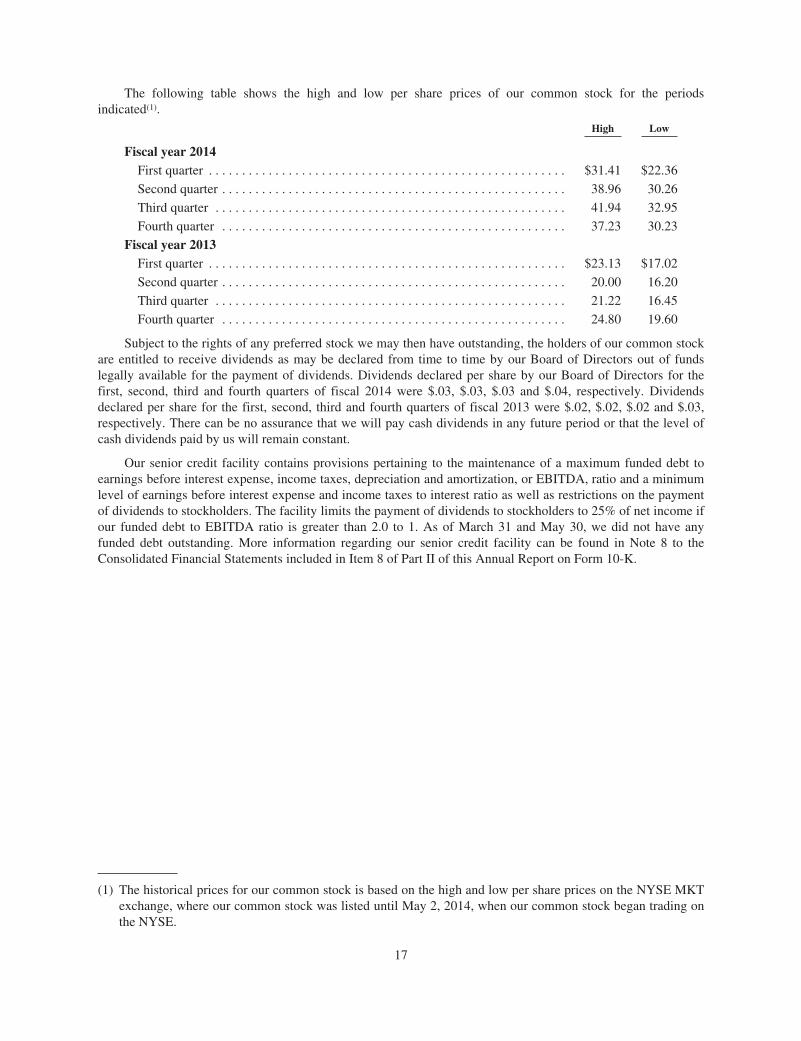
The following table shows the high and low per share prices of our common stock for the periodsindicated(1).
High Low
Fiscal year 2014First quarter . . . . . . . . . . . . . . . . . . . . . . . . . . . . . . . . . . . . . . . . . . . . . . . . . . . . . . $31.41 $22.36
Second quarter . . . . . . . . . . . . . . . . . . . . . . . . . . . . . . . . . . . . . . . . . . . . . . . . . . . . 38.96 30.26
Third quarter . . . . . . . . . . . . . . . . . . . . . . . . . . . . . . . . . . . . . . . . . . . . . . . . . . . . . 41.94 32.95
Fourth quarter . . . . . . . . . . . . . . . . . . . . . . . . . . . . . . . . . . . . . . . . . . . . . . . . . . . . 37.23 30.23
Fiscal year 2013First quarter . . . . . . . . . . . . . . . . . . . . . . . . . . . . . . . . . . . . . . . . . . . . . . . . . . . . . . $23.13 $17.02
Second quarter . . . . . . . . . . . . . . . . . . . . . . . . . . . . . . . . . . . . . . . . . . . . . . . . . . . . 20.00 16.20
Third quarter . . . . . . . . . . . . . . . . . . . . . . . . . . . . . . . . . . . . . . . . . . . . . . . . . . . . . 21.22 16.45
Fourth quarter . . . . . . . . . . . . . . . . . . . . . . . . . . . . . . . . . . . . . . . . . . . . . . . . . . . . 24.80 19.60
Subject to the rights of any preferred stock we may then have outstanding, the holders of our common stockare entitled to receive dividends as may be declared from time to time by our Board of Directors out of fundslegally available for the payment of dividends. Dividends declared per share by our Board of Directors for thefirst, second, third and fourth quarters of fiscal 2014 were $.03, $.03, $.03 and $.04, respectively. Dividendsdeclared per share for the first, second, third and fourth quarters of fiscal 2013 were $.02, $.02, $.02 and $.03,respectively. There can be no assurance that we will pay cash dividends in any future period or that the level ofcash dividends paid by us will remain constant.
Our senior credit facility contains provisions pertaining to the maintenance of a maximum funded debt toearnings before interest expense, income taxes, depreciation and amortization, or EBITDA, ratio and a minimumlevel of earnings before interest expense and income taxes to interest ratio as well as restrictions on the paymentof dividends to stockholders. The facility limits the payment of dividends to stockholders to 25% of net income ifour funded debt to EBITDA ratio is greater than 2.0 to 1. As of March 31 and May 30, we did not have anyfunded debt outstanding. More information regarding our senior credit facility can be found in Note 8 to theConsolidated Financial Statements included in Item 8 of Part II of this Annual Report on Form 10-K.
(1) The historical prices for our common stock is based on the high and low per share prices on the NYSE MKTexchange, where our common stock was listed until May 2, 2014, when our common stock began trading onthe NYSE.
17
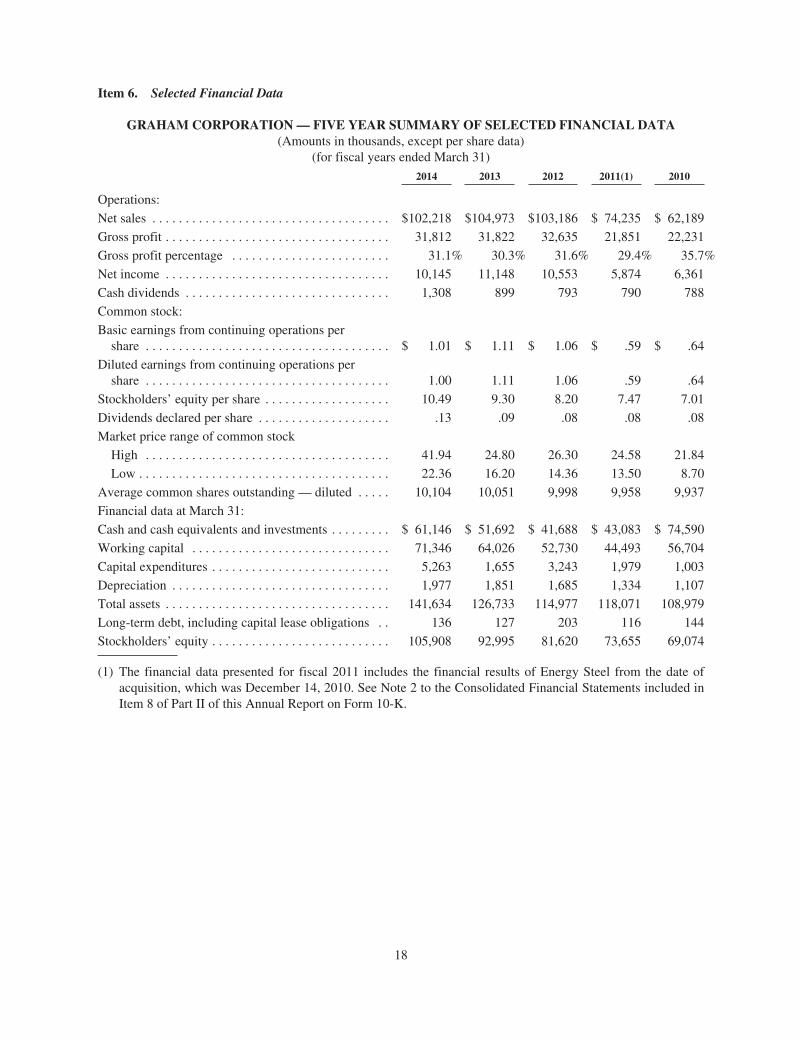
Item 6. Selected Financial Data
GRAHAM CORPORATION — FIVE YEAR SUMMARY OF SELECTED FINANCIAL DATA(Amounts in thousands, except per share data)
(for fiscal years ended March 31)
2014 2013 2012 2011(1) 2010
Operations:
Net sales . . . . . . . . . . . . . . . . . . . . . . . . . . . . . . . . . . . . $102,218 $104,973 $103,186 $ 74,235 $ 62,189
Gross profit . . . . . . . . . . . . . . . . . . . . . . . . . . . . . . . . . . 31,812 31,822 32,635 21,851 22,231
Gross profit percentage . . . . . . . . . . . . . . . . . . . . . . . . 31.1% 30.3% 31.6% 29.4% 35.7%
Net income . . . . . . . . . . . . . . . . . . . . . . . . . . . . . . . . . . 10,145 11,148 10,553 5,874 6,361
Cash dividends . . . . . . . . . . . . . . . . . . . . . . . . . . . . . . . 1,308 899 793 790 788
Common stock:
Basic earnings from continuing operations pershare . . . . . . . . . . . . . . . . . . . . . . . . . . . . . . . . . . . . . $ 1.01 $ 1.11 $ 1.06 $ .59 $ .64
Diluted earnings from continuing operations pershare . . . . . . . . . . . . . . . . . . . . . . . . . . . . . . . . . . . . . 1.00 1.11 1.06 .59 .64
Stockholders’ equity per share . . . . . . . . . . . . . . . . . . . 10.49 9.30 8.20 7.47 7.01
Dividends declared per share . . . . . . . . . . . . . . . . . . . . .13 .09 .08 .08 .08
Market price range of common stock
High . . . . . . . . . . . . . . . . . . . . . . . . . . . . . . . . . . . . . 41.94 24.80 26.30 24.58 21.84
Low . . . . . . . . . . . . . . . . . . . . . . . . . . . . . . . . . . . . . . 22.36 16.20 14.36 13.50 8.70
Average common shares outstanding — diluted . . . . . 10,104 10,051 9,998 9,958 9,937
Financial data at March 31:
Cash and cash equivalents and investments . . . . . . . . . $ 61,146 $ 51,692 $ 41,688 $ 43,083 $ 74,590
Working capital . . . . . . . . . . . . . . . . . . . . . . . . . . . . . . 71,346 64,026 52,730 44,493 56,704
Capital expenditures . . . . . . . . . . . . . . . . . . . . . . . . . . . 5,263 1,655 3,243 1,979 1,003
Depreciation . . . . . . . . . . . . . . . . . . . . . . . . . . . . . . . . . 1,977 1,851 1,685 1,334 1,107
Total assets . . . . . . . . . . . . . . . . . . . . . . . . . . . . . . . . . . 141,634 126,733 114,977 118,071 108,979
Long-term debt, including capital lease obligations . . 136 127 203 116 144
Stockholders’ equity . . . . . . . . . . . . . . . . . . . . . . . . . . . 105,908 92,995 81,620 73,655 69,074
(1) The financial data presented for fiscal 2011 includes the financial results of Energy Steel from the date ofacquisition, which was December 14, 2010. See Note 2 to the Consolidated Financial Statements included inItem 8 of Part II of this Annual Report on Form 10-K.
18
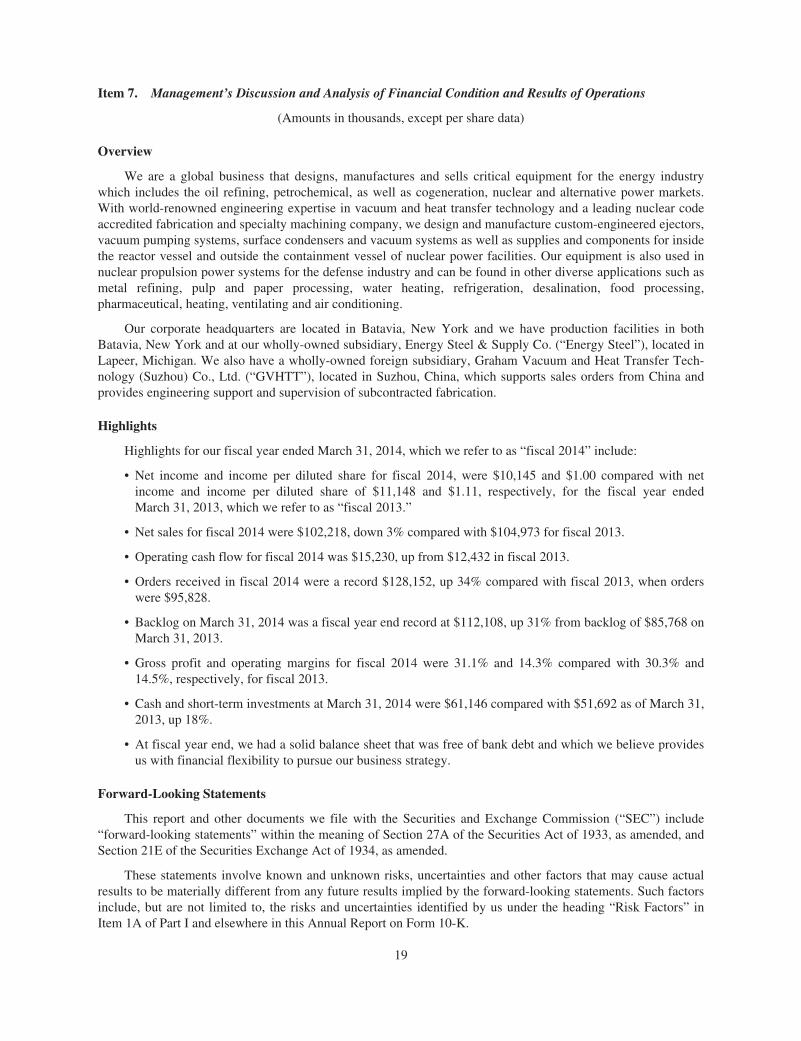
Item 7. Management’s Discussion and Analysis of Financial Condition and Results of Operations
(Amounts in thousands, except per share data)
Overview
We are a global business that designs, manufactures and sells critical equipment for the energy industrywhich includes the oil refining, petrochemical, as well as cogeneration, nuclear and alternative power markets.With world-renowned engineering expertise in vacuum and heat transfer technology and a leading nuclear codeaccredited fabrication and specialty machining company, we design and manufacture custom-engineered ejectors,vacuum pumping systems, surface condensers and vacuum systems as well as supplies and components for insidethe reactor vessel and outside the containment vessel of nuclear power facilities. Our equipment is also used innuclear propulsion power systems for the defense industry and can be found in other diverse applications such asmetal refining, pulp and paper processing, water heating, refrigeration, desalination, food processing,pharmaceutical, heating, ventilating and air conditioning.
Our corporate headquarters are located in Batavia, New York and we have production facilities in bothBatavia, New York and at our wholly-owned subsidiary, Energy Steel & Supply Co. (“Energy Steel”), located inLapeer, Michigan. We also have a wholly-owned foreign subsidiary, Graham Vacuum and Heat Transfer Tech-nology (Suzhou) Co., Ltd. (“GVHTT”), located in Suzhou, China, which supports sales orders from China andprovides engineering support and supervision of subcontracted fabrication.
Highlights
Highlights for our fiscal year ended March 31, 2014, which we refer to as “fiscal 2014” include:
• Net income and income per diluted share for fiscal 2014, were $10,145 and $1.00 compared with netincome and income per diluted share of $11,148 and $1.11, respectively, for the fiscal year endedMarch 31, 2013, which we refer to as “fiscal 2013.”
• Net sales for fiscal 2014 were $102,218, down 3% compared with $104,973 for fiscal 2013.
• Operating cash flow for fiscal 2014 was $15,230, up from $12,432 in fiscal 2013.
• Orders received in fiscal 2014 were a record $128,152, up 34% compared with fiscal 2013, when orderswere $95,828.
• Backlog on March 31, 2014 was a fiscal year end record at $112,108, up 31% from backlog of $85,768 onMarch 31, 2013.
• Gross profit and operating margins for fiscal 2014 were 31.1% and 14.3% compared with 30.3% and14.5%, respectively, for fiscal 2013.
• Cash and short-term investments at March 31, 2014 were $61,146 compared with $51,692 as of March 31,2013, up 18%.
• At fiscal year end, we had a solid balance sheet that was free of bank debt and which we believe providesus with financial flexibility to pursue our business strategy.
Forward-Looking Statements
This report and other documents we file with the Securities and Exchange Commission (“SEC”) include“forward-looking statements” within the meaning of Section 27A of the Securities Act of 1933, as amended, andSection 21E of the Securities Exchange Act of 1934, as amended.
These statements involve known and unknown risks, uncertainties and other factors that may cause actualresults to be materially different from any future results implied by the forward-looking statements. Such factorsinclude, but are not limited to, the risks and uncertainties identified by us under the heading “Risk Factors” inItem 1A of Part I and elsewhere in this Annual Report on Form 10-K.
19
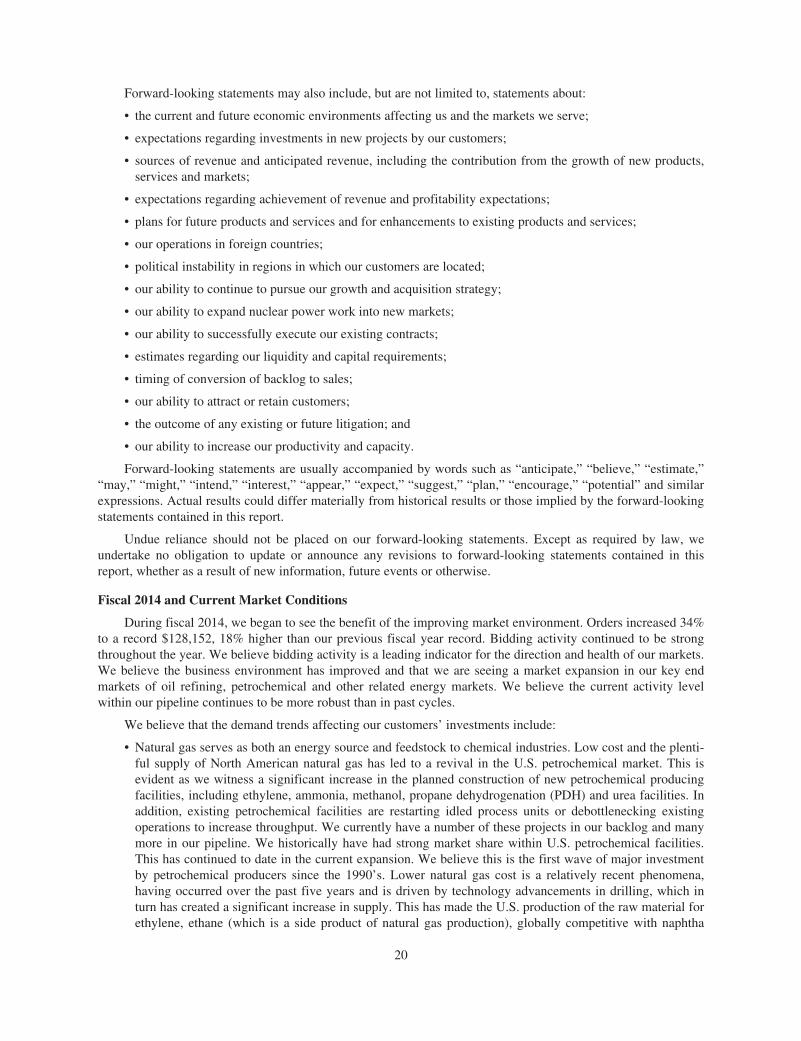
Forward-looking statements may also include, but are not limited to, statements about:
• the current and future economic environments affecting us and the markets we serve;
• expectations regarding investments in new projects by our customers;
• sources of revenue and anticipated revenue, including the contribution from the growth of new products,services and markets;
• expectations regarding achievement of revenue and profitability expectations;
• plans for future products and services and for enhancements to existing products and services;
• our operations in foreign countries;
• political instability in regions in which our customers are located;
• our ability to continue to pursue our growth and acquisition strategy;
• our ability to expand nuclear power work into new markets;
• our ability to successfully execute our existing contracts;
• estimates regarding our liquidity and capital requirements;
• timing of conversion of backlog to sales;
• our ability to attract or retain customers;
• the outcome of any existing or future litigation; and
• our ability to increase our productivity and capacity.
Forward-looking statements are usually accompanied by words such as “anticipate,” “believe,” “estimate,”“may,” “might,” “intend,” “interest,” “appear,” “expect,” “suggest,” “plan,” “encourage,” “potential” and similarexpressions. Actual results could differ materially from historical results or those implied by the forward-lookingstatements contained in this report.
Undue reliance should not be placed on our forward-looking statements. Except as required by law, weundertake no obligation to update or announce any revisions to forward-looking statements contained in thisreport, whether as a result of new information, future events or otherwise.
Fiscal 2014 and Current Market Conditions
During fiscal 2014, we began to see the benefit of the improving market environment. Orders increased 34%to a record $128,152, 18% higher than our previous fiscal year record. Bidding activity continued to be strongthroughout the year. We believe bidding activity is a leading indicator for the direction and health of our markets.We believe the business environment has improved and that we are seeing a market expansion in our key endmarkets of oil refining, petrochemical and other related energy markets. We believe the current activity levelwithin our pipeline continues to be more robust than in past cycles.
We believe that the demand trends affecting our customers’ investments include:
• Natural gas serves as both an energy source and feedstock to chemical industries. Low cost and the plenti-ful supply of North American natural gas has led to a revival in the U.S. petrochemical market. This isevident as we witness a significant increase in the planned construction of new petrochemical producingfacilities, including ethylene, ammonia, methanol, propane dehydrogenation (PDH) and urea facilities. Inaddition, existing petrochemical facilities are restarting idled process units or debottlenecking existingoperations to increase throughput. We currently have a number of these projects in our backlog and manymore in our pipeline. We historically have had strong market share within U.S. petrochemical facilities.This has continued to date in the current expansion. We believe this is the first wave of major investmentby petrochemical producers since the 1990’s. Lower natural gas cost is a relatively recent phenomena,having occurred over the past five years and is driven by technology advancements in drilling, which inturn has created a significant increase in supply. This has made the U.S. production of the raw material forethylene, ethane (which is a side product of natural gas production), globally competitive with naphtha
20
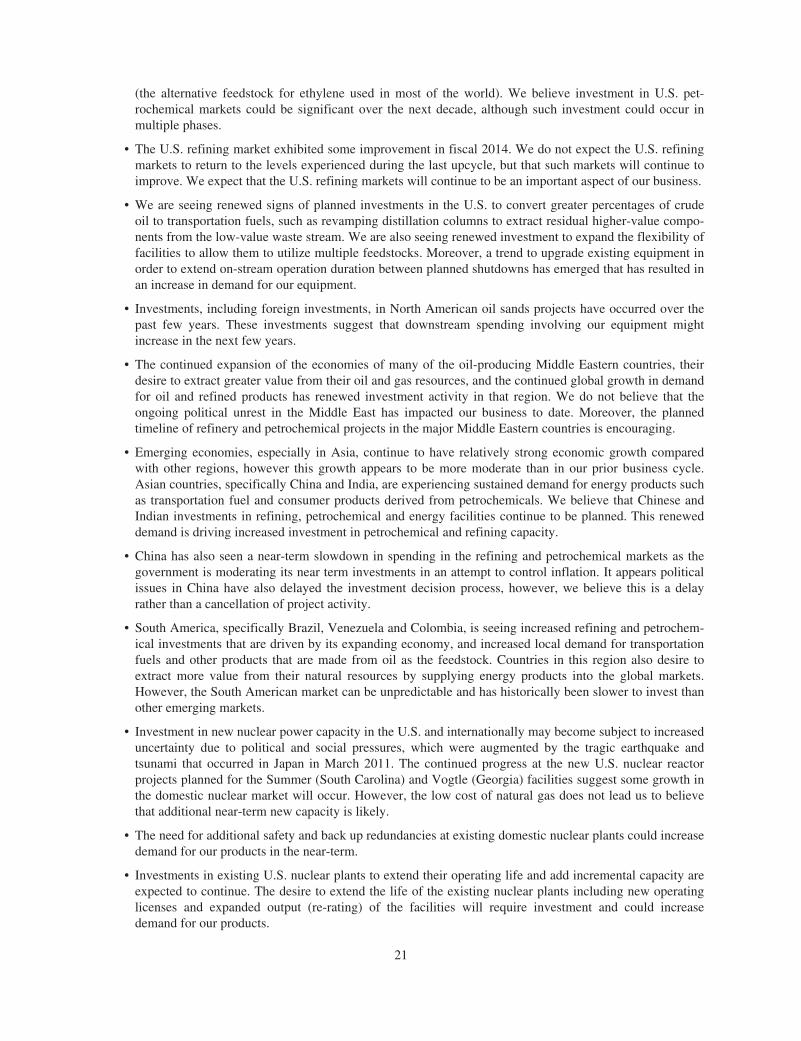
(the alternative feedstock for ethylene used in most of the world). We believe investment in U.S. pet-rochemical markets could be significant over the next decade, although such investment could occur inmultiple phases.
• The U.S. refining market exhibited some improvement in fiscal 2014. We do not expect the U.S. refiningmarkets to return to the levels experienced during the last upcycle, but that such markets will continue toimprove. We expect that the U.S. refining markets will continue to be an important aspect of our business.
• We are seeing renewed signs of planned investments in the U.S. to convert greater percentages of crudeoil to transportation fuels, such as revamping distillation columns to extract residual higher-value compo-nents from the low-value waste stream. We are also seeing renewed investment to expand the flexibility offacilities to allow them to utilize multiple feedstocks. Moreover, a trend to upgrade existing equipment inorder to extend on-stream operation duration between planned shutdowns has emerged that has resulted inan increase in demand for our equipment.
• Investments, including foreign investments, in North American oil sands projects have occurred over thepast few years. These investments suggest that downstream spending involving our equipment mightincrease in the next few years.
• The continued expansion of the economies of many of the oil-producing Middle Eastern countries, theirdesire to extract greater value from their oil and gas resources, and the continued global growth in demandfor oil and refined products has renewed investment activity in that region. We do not believe that theongoing political unrest in the Middle East has impacted our business to date. Moreover, the plannedtimeline of refinery and petrochemical projects in the major Middle Eastern countries is encouraging.
• Emerging economies, especially in Asia, continue to have relatively strong economic growth comparedwith other regions, however this growth appears to be more moderate than in our prior business cycle.Asian countries, specifically China and India, are experiencing sustained demand for energy products suchas transportation fuel and consumer products derived from petrochemicals. We believe that Chinese andIndian investments in refining, petrochemical and energy facilities continue to be planned. This reneweddemand is driving increased investment in petrochemical and refining capacity.
• China has also seen a near-term slowdown in spending in the refining and petrochemical markets as thegovernment is moderating its near term investments in an attempt to control inflation. It appears politicalissues in China have also delayed the investment decision process, however, we believe this is a delayrather than a cancellation of project activity.
• South America, specifically Brazil, Venezuela and Colombia, is seeing increased refining and petrochem-ical investments that are driven by its expanding economy, and increased local demand for transportationfuels and other products that are made from oil as the feedstock. Countries in this region also desire toextract more value from their natural resources by supplying energy products into the global markets.However, the South American market can be unpredictable and has historically been slower to invest thanother emerging markets.
• Investment in new nuclear power capacity in the U.S. and internationally may become subject to increaseduncertainty due to political and social pressures, which were augmented by the tragic earthquake andtsunami that occurred in Japan in March 2011. The continued progress at the new U.S. nuclear reactorprojects planned for the Summer (South Carolina) and Vogtle (Georgia) facilities suggest some growth inthe domestic nuclear market will occur. However, the low cost of natural gas does not lead us to believethat additional near-term new capacity is likely.
• The need for additional safety and back up redundancies at existing domestic nuclear plants could increasedemand for our products in the near-term.
• Investments in existing U.S. nuclear plants to extend their operating life and add incremental capacity areexpected to continue. The desire to extend the life of the existing nuclear plants including new operatinglicenses and expanded output (re-rating) of the facilities will require investment and could increasedemand for our products.
21
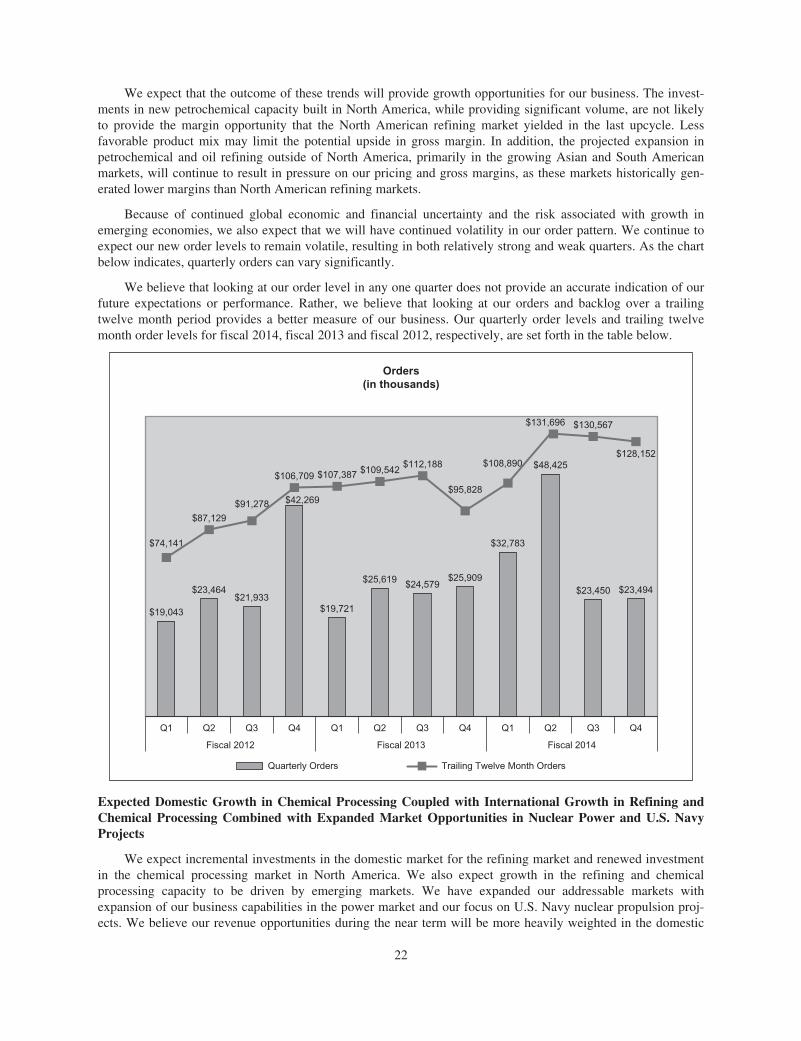
We expect that the outcome of these trends will provide growth opportunities for our business. The invest-ments in new petrochemical capacity built in North America, while providing significant volume, are not likelyto provide the margin opportunity that the North American refining market yielded in the last upcycle. Lessfavorable product mix may limit the potential upside in gross margin. In addition, the projected expansion inpetrochemical and oil refining outside of North America, primarily in the growing Asian and South Americanmarkets, will continue to result in pressure on our pricing and gross margins, as these markets historically gen-erated lower margins than North American refining markets.
Because of continued global economic and financial uncertainty and the risk associated with growth inemerging economies, we also expect that we will have continued volatility in our order pattern. We continue toexpect our new order levels to remain volatile, resulting in both relatively strong and weak quarters. As the chartbelow indicates, quarterly orders can vary significantly.
We believe that looking at our order level in any one quarter does not provide an accurate indication of ourfuture expectations or performance. Rather, we believe that looking at our orders and backlog over a trailingtwelve month period provides a better measure of our business. Our quarterly order levels and trailing twelvemonth order levels for fiscal 2014, fiscal 2013 and fiscal 2012, respectively, are set forth in the table below.
Fiscal 2012 Fiscal 2013 Fiscal 2014
Orders(in thousands)
Q1 Q2 Q3 Q4 Q1 Q2 Q3 Q4 Q1 Q2 Q3 Q4
Quarterly Orders Trailing Twelve Month Orders
$19,043
$74,141
$87,129
$91,278
$106,709 $107,387$112,188
$109,542
$95,828
$108,890
$131,696 $130,567
$128,152
$23,464$21,933
$19,721
$42,269
$25,619$23,450 $23,494
$24,579
$48,425
$25,909
$32,783
Expected Domestic Growth in Chemical Processing Coupled with International Growth in Refining andChemical Processing Combined with Expanded Market Opportunities in Nuclear Power and U.S. NavyProjects
We expect incremental investments in the domestic market for the refining market and renewed investmentin the chemical processing market in North America. We also expect growth in the refining and chemicalprocessing capacity to be driven by emerging markets. We have expanded our addressable markets withexpansion of our business capabilities in the power market and our focus on U.S. Navy nuclear propulsion proj-ects. We believe our revenue opportunities during the near term will be more heavily weighted in the domestic
22
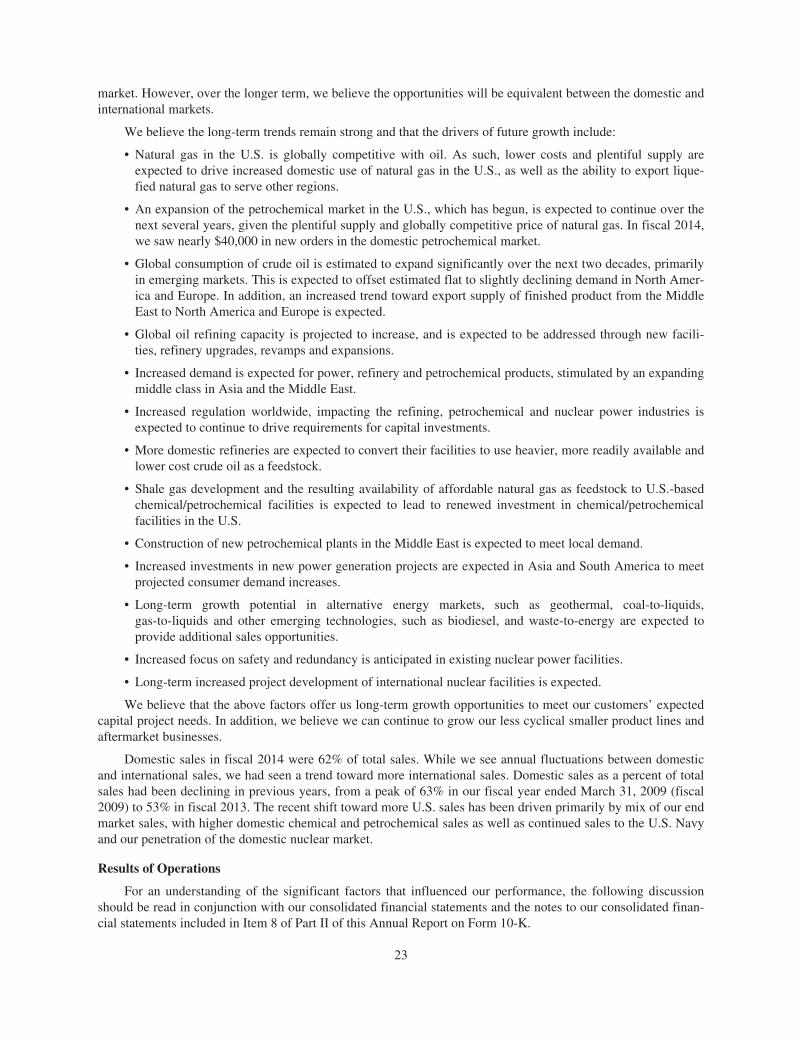
market. However, over the longer term, we believe the opportunities will be equivalent between the domestic andinternational markets.
We believe the long-term trends remain strong and that the drivers of future growth include:
• Natural gas in the U.S. is globally competitive with oil. As such, lower costs and plentiful supply areexpected to drive increased domestic use of natural gas in the U.S., as well as the ability to export lique-fied natural gas to serve other regions.
• An expansion of the petrochemical market in the U.S., which has begun, is expected to continue over thenext several years, given the plentiful supply and globally competitive price of natural gas. In fiscal 2014,we saw nearly $40,000 in new orders in the domestic petrochemical market.
• Global consumption of crude oil is estimated to expand significantly over the next two decades, primarilyin emerging markets. This is expected to offset estimated flat to slightly declining demand in North Amer-ica and Europe. In addition, an increased trend toward export supply of finished product from the MiddleEast to North America and Europe is expected.
• Global oil refining capacity is projected to increase, and is expected to be addressed through new facili-ties, refinery upgrades, revamps and expansions.
• Increased demand is expected for power, refinery and petrochemical products, stimulated by an expandingmiddle class in Asia and the Middle East.
• Increased regulation worldwide, impacting the refining, petrochemical and nuclear power industries isexpected to continue to drive requirements for capital investments.
• More domestic refineries are expected to convert their facilities to use heavier, more readily available andlower cost crude oil as a feedstock.
• Shale gas development and the resulting availability of affordable natural gas as feedstock to U.S.-basedchemical/petrochemical facilities is expected to lead to renewed investment in chemical/petrochemicalfacilities in the U.S.
• Construction of new petrochemical plants in the Middle East is expected to meet local demand.
• Increased investments in new power generation projects are expected in Asia and South America to meetprojected consumer demand increases.
• Long-term growth potential in alternative energy markets, such as geothermal, coal-to-liquids,gas-to-liquids and other emerging technologies, such as biodiesel, and waste-to-energy are expected toprovide additional sales opportunities.
• Increased focus on safety and redundancy is anticipated in existing nuclear power facilities.
• Long-term increased project development of international nuclear facilities is expected.
We believe that the above factors offer us long-term growth opportunities to meet our customers’ expectedcapital project needs. In addition, we believe we can continue to grow our less cyclical smaller product lines andaftermarket businesses.
Domestic sales in fiscal 2014 were 62% of total sales. While we see annual fluctuations between domesticand international sales, we had seen a trend toward more international sales. Domestic sales as a percent of totalsales had been declining in previous years, from a peak of 63% in our fiscal year ended March 31, 2009 (fiscal2009) to 53% in fiscal 2013. The recent shift toward more U.S. sales has been driven primarily by mix of our endmarket sales, with higher domestic chemical and petrochemical sales as well as continued sales to the U.S. Navyand our penetration of the domestic nuclear market.
Results of Operations
For an understanding of the significant factors that influenced our performance, the following discussionshould be read in conjunction with our consolidated financial statements and the notes to our consolidated finan-cial statements included in Item 8 of Part II of this Annual Report on Form 10-K.
23
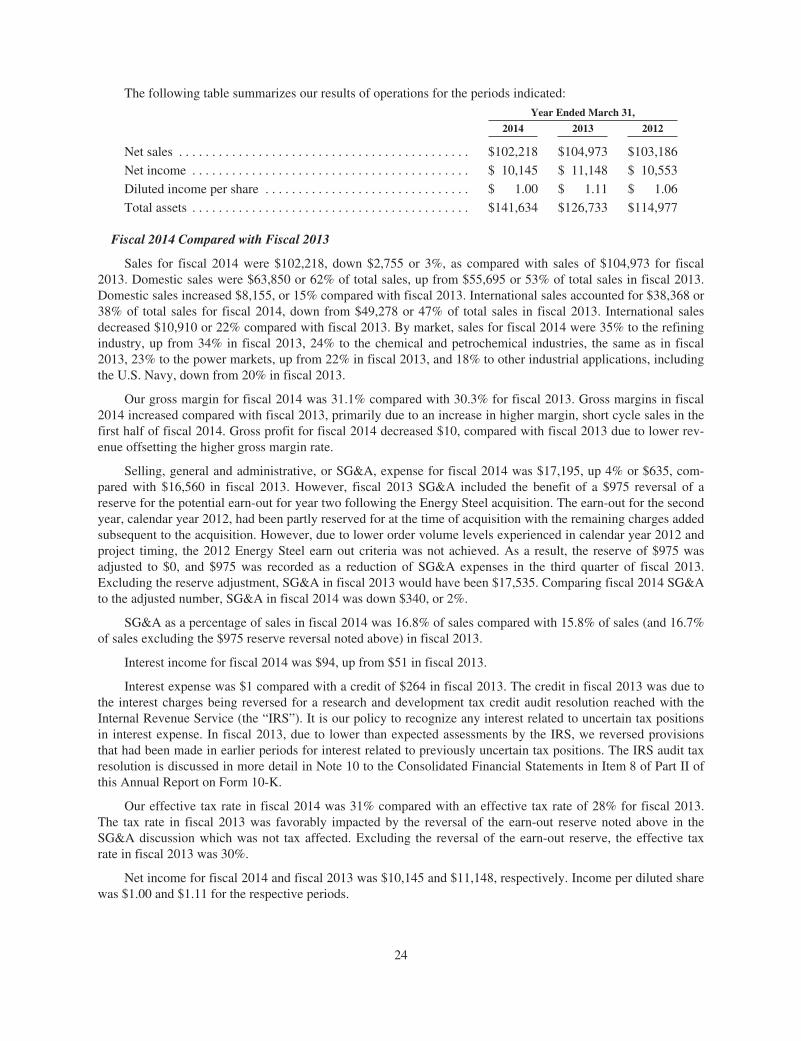
The following table summarizes our results of operations for the periods indicated:
Year Ended March 31,
2014 2013 2012
Net sales . . . . . . . . . . . . . . . . . . . . . . . . . . . . . . . . . . . . . . . . . . . . $102,218 $104,973 $103,186
Net income . . . . . . . . . . . . . . . . . . . . . . . . . . . . . . . . . . . . . . . . . . $ 10,145 $ 11,148 $ 10,553
Diluted income per share . . . . . . . . . . . . . . . . . . . . . . . . . . . . . . . $ 1.00 $ 1.11 $ 1.06
Total assets . . . . . . . . . . . . . . . . . . . . . . . . . . . . . . . . . . . . . . . . . . $141,634 $126,733 $114,977
Fiscal 2014 Compared with Fiscal 2013
Sales for fiscal 2014 were $102,218, down $2,755 or 3%, as compared with sales of $104,973 for fiscal2013. Domestic sales were $63,850 or 62% of total sales, up from $55,695 or 53% of total sales in fiscal 2013.Domestic sales increased $8,155, or 15% compared with fiscal 2013. International sales accounted for $38,368 or38% of total sales for fiscal 2014, down from $49,278 or 47% of total sales in fiscal 2013. International salesdecreased $10,910 or 22% compared with fiscal 2013. By market, sales for fiscal 2014 were 35% to the refiningindustry, up from 34% in fiscal 2013, 24% to the chemical and petrochemical industries, the same as in fiscal2013, 23% to the power markets, up from 22% in fiscal 2013, and 18% to other industrial applications, includingthe U.S. Navy, down from 20% in fiscal 2013.
Our gross margin for fiscal 2014 was 31.1% compared with 30.3% for fiscal 2013. Gross margins in fiscal2014 increased compared with fiscal 2013, primarily due to an increase in higher margin, short cycle sales in thefirst half of fiscal 2014. Gross profit for fiscal 2014 decreased $10, compared with fiscal 2013 due to lower rev-enue offsetting the higher gross margin rate.
Selling, general and administrative, or SG&A, expense for fiscal 2014 was $17,195, up 4% or $635, com-pared with $16,560 in fiscal 2013. However, fiscal 2013 SG&A included the benefit of a $975 reversal of areserve for the potential earn-out for year two following the Energy Steel acquisition. The earn-out for the secondyear, calendar year 2012, had been partly reserved for at the time of acquisition with the remaining charges addedsubsequent to the acquisition. However, due to lower order volume levels experienced in calendar year 2012 andproject timing, the 2012 Energy Steel earn out criteria was not achieved. As a result, the reserve of $975 wasadjusted to $0, and $975 was recorded as a reduction of SG&A expenses in the third quarter of fiscal 2013.Excluding the reserve adjustment, SG&A in fiscal 2013 would have been $17,535. Comparing fiscal 2014 SG&Ato the adjusted number, SG&A in fiscal 2014 was down $340, or 2%.
SG&A as a percentage of sales in fiscal 2014 was 16.8% of sales compared with 15.8% of sales (and 16.7%of sales excluding the $975 reserve reversal noted above) in fiscal 2013.
Interest income for fiscal 2014 was $94, up from $51 in fiscal 2013.
Interest expense was $1 compared with a credit of $264 in fiscal 2013. The credit in fiscal 2013 was due tothe interest charges being reversed for a research and development tax credit audit resolution reached with theInternal Revenue Service (the “IRS”). It is our policy to recognize any interest related to uncertain tax positionsin interest expense. In fiscal 2013, due to lower than expected assessments by the IRS, we reversed provisionsthat had been made in earlier periods for interest related to previously uncertain tax positions. The IRS audit taxresolution is discussed in more detail in Note 10 to the Consolidated Financial Statements in Item 8 of Part II ofthis Annual Report on Form 10-K.
Our effective tax rate in fiscal 2014 was 31% compared with an effective tax rate of 28% for fiscal 2013.The tax rate in fiscal 2013 was favorably impacted by the reversal of the earn-out reserve noted above in theSG&A discussion which was not tax affected. Excluding the reversal of the earn-out reserve, the effective taxrate in fiscal 2013 was 30%.
Net income for fiscal 2014 and fiscal 2013 was $10,145 and $11,148, respectively. Income per diluted sharewas $1.00 and $1.11 for the respective periods.
24
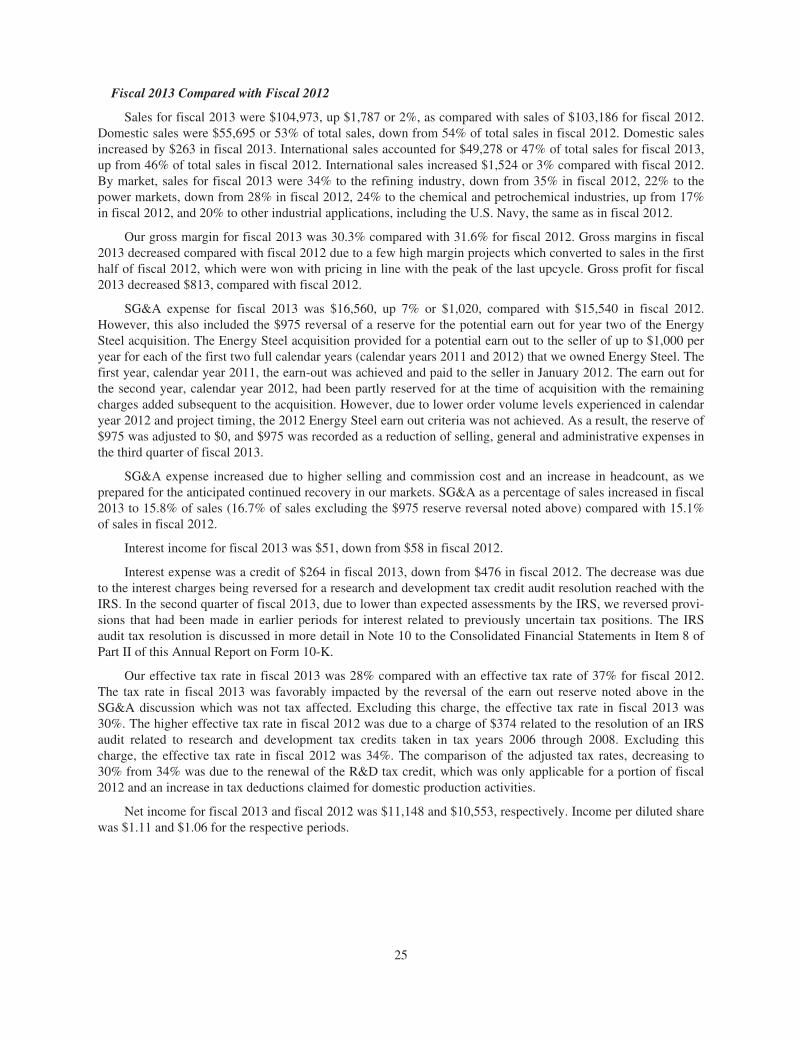
Fiscal 2013 Compared with Fiscal 2012
Sales for fiscal 2013 were $104,973, up $1,787 or 2%, as compared with sales of $103,186 for fiscal 2012.Domestic sales were $55,695 or 53% of total sales, down from 54% of total sales in fiscal 2012. Domestic salesincreased by $263 in fiscal 2013. International sales accounted for $49,278 or 47% of total sales for fiscal 2013,up from 46% of total sales in fiscal 2012. International sales increased $1,524 or 3% compared with fiscal 2012.By market, sales for fiscal 2013 were 34% to the refining industry, down from 35% in fiscal 2012, 22% to thepower markets, down from 28% in fiscal 2012, 24% to the chemical and petrochemical industries, up from 17%in fiscal 2012, and 20% to other industrial applications, including the U.S. Navy, the same as in fiscal 2012.
Our gross margin for fiscal 2013 was 30.3% compared with 31.6% for fiscal 2012. Gross margins in fiscal2013 decreased compared with fiscal 2012 due to a few high margin projects which converted to sales in the firsthalf of fiscal 2012, which were won with pricing in line with the peak of the last upcycle. Gross profit for fiscal2013 decreased $813, compared with fiscal 2012.
SG&A expense for fiscal 2013 was $16,560, up 7% or $1,020, compared with $15,540 in fiscal 2012.However, this also included the $975 reversal of a reserve for the potential earn out for year two of the EnergySteel acquisition. The Energy Steel acquisition provided for a potential earn out to the seller of up to $1,000 peryear for each of the first two full calendar years (calendar years 2011 and 2012) that we owned Energy Steel. Thefirst year, calendar year 2011, the earn-out was achieved and paid to the seller in January 2012. The earn out forthe second year, calendar year 2012, had been partly reserved for at the time of acquisition with the remainingcharges added subsequent to the acquisition. However, due to lower order volume levels experienced in calendaryear 2012 and project timing, the 2012 Energy Steel earn out criteria was not achieved. As a result, the reserve of$975 was adjusted to $0, and $975 was recorded as a reduction of selling, general and administrative expenses inthe third quarter of fiscal 2013.
SG&A expense increased due to higher selling and commission cost and an increase in headcount, as weprepared for the anticipated continued recovery in our markets. SG&A as a percentage of sales increased in fiscal2013 to 15.8% of sales (16.7% of sales excluding the $975 reserve reversal noted above) compared with 15.1%of sales in fiscal 2012.
Interest income for fiscal 2013 was $51, down from $58 in fiscal 2012.
Interest expense was a credit of $264 in fiscal 2013, down from $476 in fiscal 2012. The decrease was dueto the interest charges being reversed for a research and development tax credit audit resolution reached with theIRS. In the second quarter of fiscal 2013, due to lower than expected assessments by the IRS, we reversed provi-sions that had been made in earlier periods for interest related to previously uncertain tax positions. The IRSaudit tax resolution is discussed in more detail in Note 10 to the Consolidated Financial Statements in Item 8 ofPart II of this Annual Report on Form 10-K.
Our effective tax rate in fiscal 2013 was 28% compared with an effective tax rate of 37% for fiscal 2012.The tax rate in fiscal 2013 was favorably impacted by the reversal of the earn out reserve noted above in theSG&A discussion which was not tax affected. Excluding this charge, the effective tax rate in fiscal 2013 was30%. The higher effective tax rate in fiscal 2012 was due to a charge of $374 related to the resolution of an IRSaudit related to research and development tax credits taken in tax years 2006 through 2008. Excluding thischarge, the effective tax rate in fiscal 2012 was 34%. The comparison of the adjusted tax rates, decreasing to30% from 34% was due to the renewal of the R&D tax credit, which was only applicable for a portion of fiscal2012 and an increase in tax deductions claimed for domestic production activities.
Net income for fiscal 2013 and fiscal 2012 was $11,148 and $10,553, respectively. Income per diluted sharewas $1.11 and $1.06 for the respective periods.
25
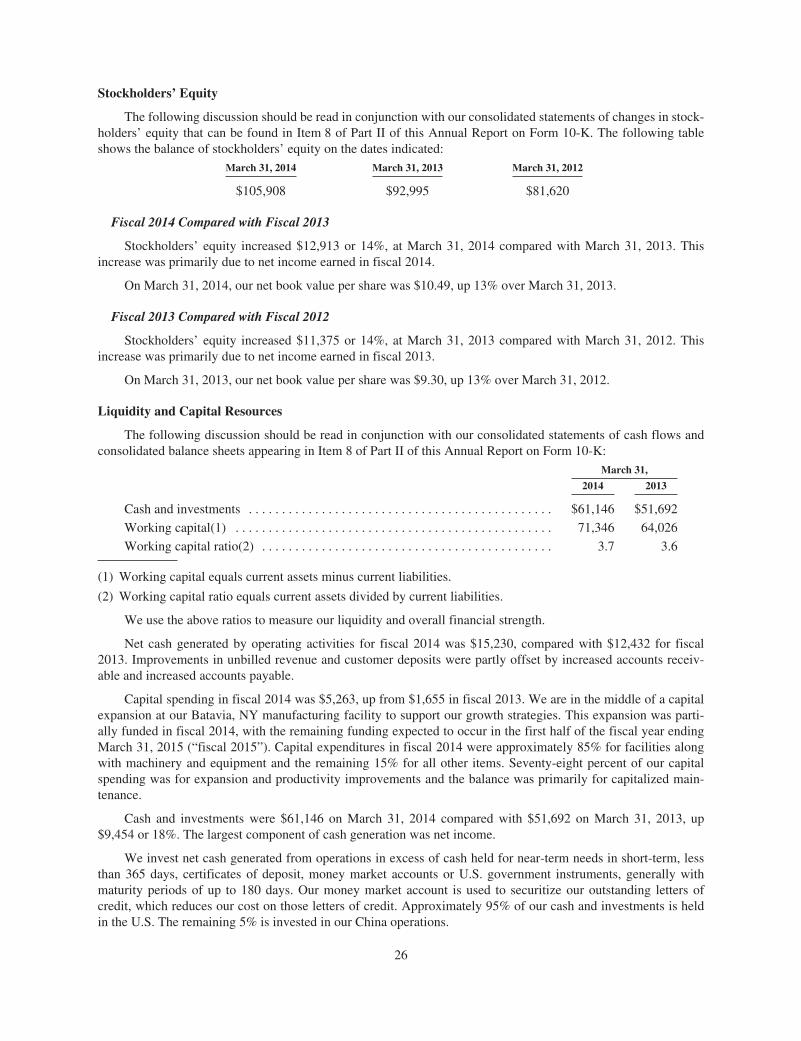
Stockholders’ Equity
The following discussion should be read in conjunction with our consolidated statements of changes in stock-holders’ equity that can be found in Item 8 of Part II of this Annual Report on Form 10-K. The following tableshows the balance of stockholders’ equity on the dates indicated:
March 31, 2014 March 31, 2013 March 31, 2012
$105,908 $92,995 $81,620
Fiscal 2014 Compared with Fiscal 2013
Stockholders’ equity increased $12,913 or 14%, at March 31, 2014 compared with March 31, 2013. Thisincrease was primarily due to net income earned in fiscal 2014.
On March 31, 2014, our net book value per share was $10.49, up 13% over March 31, 2013.
Fiscal 2013 Compared with Fiscal 2012
Stockholders’ equity increased $11,375 or 14%, at March 31, 2013 compared with March 31, 2012. Thisincrease was primarily due to net income earned in fiscal 2013.
On March 31, 2013, our net book value per share was $9.30, up 13% over March 31, 2012.
Liquidity and Capital Resources
The following discussion should be read in conjunction with our consolidated statements of cash flows andconsolidated balance sheets appearing in Item 8 of Part II of this Annual Report on Form 10-K:
March 31,
2014 2013
Cash and investments . . . . . . . . . . . . . . . . . . . . . . . . . . . . . . . . . . . . . . . . . . . . . . $61,146 $51,692
Working capital(1) . . . . . . . . . . . . . . . . . . . . . . . . . . . . . . . . . . . . . . . . . . . . . . . . 71,346 64,026
Working capital ratio(2) . . . . . . . . . . . . . . . . . . . . . . . . . . . . . . . . . . . . . . . . . . . . 3.7 3.6
(1) Working capital equals current assets minus current liabilities.
(2) Working capital ratio equals current assets divided by current liabilities.
We use the above ratios to measure our liquidity and overall financial strength.
Net cash generated by operating activities for fiscal 2014 was $15,230, compared with $12,432 for fiscal2013. Improvements in unbilled revenue and customer deposits were partly offset by increased accounts receiv-able and increased accounts payable.
Capital spending in fiscal 2014 was $5,263, up from $1,655 in fiscal 2013. We are in the middle of a capitalexpansion at our Batavia, NY manufacturing facility to support our growth strategies. This expansion was parti-ally funded in fiscal 2014, with the remaining funding expected to occur in the first half of the fiscal year endingMarch 31, 2015 (“fiscal 2015”). Capital expenditures in fiscal 2014 were approximately 85% for facilities alongwith machinery and equipment and the remaining 15% for all other items. Seventy-eight percent of our capitalspending was for expansion and productivity improvements and the balance was primarily for capitalized main-tenance.
Cash and investments were $61,146 on March 31, 2014 compared with $51,692 on March 31, 2013, up$9,454 or 18%. The largest component of cash generation was net income.
We invest net cash generated from operations in excess of cash held for near-term needs in short-term, lessthan 365 days, certificates of deposit, money market accounts or U.S. government instruments, generally withmaturity periods of up to 180 days. Our money market account is used to securitize our outstanding letters ofcredit, which reduces our cost on those letters of credit. Approximately 95% of our cash and investments is heldin the U.S. The remaining 5% is invested in our China operations.
26
Capital expenditures for fiscal 2015 are expected to be between approximately $5,500 and $6,000. Approx-imately 60% of this spending will support the completion of the Batavia, NY capacity expansion we initiated infiscal 2014. Approximately 90% of our fiscal 2015 capital expenditures are expected to be for machinery andequipment, with the remaining amounts expected to be used for information technology and other items.
Our revolving credit facility with Bank of America, N.A. provides us with a line of credit of $25,000, includ-ing letters of credit and bank guarantees. In addition, the Bank of America agreement allows us to increase theline of credit, at our discretion, up to another $25,000, for total availability of $50,000. Borrowings under ourcredit facility are secured by all of our assets. We also have a $5,000 unsecured line of credit with HSBC, N.A.Letters of credit outstanding under our credit facilities on March 31, 2014 and 2013 were $15,473 and $12,354,respectively. There were no other amounts outstanding on either of our credit facilities at March 31, 2014 and2013. Our borrowing rate for our Bank of America facility as of March 31, 2014 was the bank’s prime rate, or3.25%. Availability under the Bank of America and HSBC lines of credit were $9,527 and $5,000, respectively,at March 31, 2014. We believe that cash generated from operations, combined with our investments and availablefinancing capacity under our credit facility, will be adequate to meet our cash needs for the immediate future andto support our growth strategies.
Contractual Obligations
As of March 31, 2014, our contractual and commercial obligations for the next five fiscal years endingMarch 31 and thereafter were as follows:
Total
Payments Due by Period
Less Than1 Year
1 – 3Years
3 – 5Years Thereafter
Capital lease obligations(1) . . . . . . . . . . . . . . . . . $ 239 $ 90 $ 97 $ 52 $ —
Operating leases(1) . . . . . . . . . . . . . . . . . . . . . . . . 1,139 588 484 67 —
Pension and postretirement benefits(2) . . . . . . . . . 98 98 — — —
Accrued compensation . . . . . . . . . . . . . . . . . . . . . 315 157 158 — —
Accrued pension liability . . . . . . . . . . . . . . . . . . . . 298 26 52 52 168
Total . . . . . . . . . . . . . . . . . . . . . . . . . . . . . . . . . . . . $2,089 $959 $791 $171 $168
(1) For additional information, see Note 7 to the consolidated financial statements in Item 8 of Part II of thisAnnual Report on Form 10-K.
(2) Amounts represent anticipated contributions during fiscal 2015 to our postretirement medical benefit plan,which provides healthcare benefits for eligible retirees and eligible survivors of retirees. On February 4,2003, we terminated postretirement healthcare benefits for our U.S. employees. Benefits payable to retireesof record on April 1, 2003 remained unchanged. We expect to be required to make cash contributions inconnection with these plans beyond one year, but such amounts cannot be estimated. No contributions areexpected to be made to our defined benefit pension plan for fiscal 2015.
Orders and Backlog
Orders in fiscal 2014 increased 34% to $128,152 from $95,828, in fiscal 2013. Orders represent communica-tions received from customers requesting us to supply products and services. Revenue is recognized on ordersreceived in accordance with our revenue recognition policy included in Note 1 to the consolidated financialstatements contained in Item 8 of Part II of this Annual Report on Form 10-K.
Domestic orders were 72%, or $92,838, and international orders were 28%, or $35,314, of our total orders infiscal 2014. This compared to domestic orders of $52,273 or 55%, and international orders of $43,555 or 45% ofour total orders in fiscal 2013. Domestic orders increased by $40,565, or 78% due to increased demand in thepetrochemical processing industries. International orders decreased by $8,241, or 19%, due to lower orders inCanada and Asia, partially offset by increased orders in the Middle East and South America.
Backlog was $112,108 at March 31, 2014, up 31% compared with $85,768 at March 31, 2013. Backlog isdefined by us as the total dollar value of orders received for which revenue has not yet been recognized. All
27
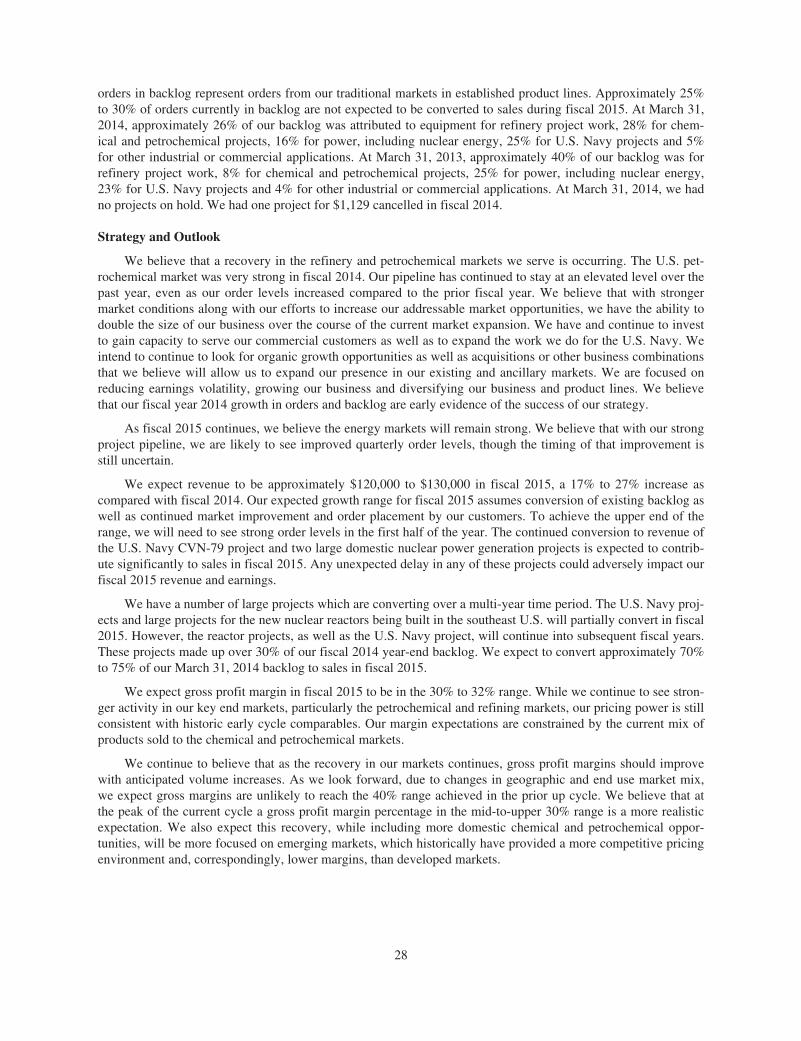
orders in backlog represent orders from our traditional markets in established product lines. Approximately 25%to 30% of orders currently in backlog are not expected to be converted to sales during fiscal 2015. At March 31,2014, approximately 26% of our backlog was attributed to equipment for refinery project work, 28% for chem-ical and petrochemical projects, 16% for power, including nuclear energy, 25% for U.S. Navy projects and 5%for other industrial or commercial applications. At March 31, 2013, approximately 40% of our backlog was forrefinery project work, 8% for chemical and petrochemical projects, 25% for power, including nuclear energy,23% for U.S. Navy projects and 4% for other industrial or commercial applications. At March 31, 2014, we hadno projects on hold. We had one project for $1,129 cancelled in fiscal 2014.
Strategy and Outlook
We believe that a recovery in the refinery and petrochemical markets we serve is occurring. The U.S. pet-rochemical market was very strong in fiscal 2014. Our pipeline has continued to stay at an elevated level over thepast year, even as our order levels increased compared to the prior fiscal year. We believe that with strongermarket conditions along with our efforts to increase our addressable market opportunities, we have the ability todouble the size of our business over the course of the current market expansion. We have and continue to investto gain capacity to serve our commercial customers as well as to expand the work we do for the U.S. Navy. Weintend to continue to look for organic growth opportunities as well as acquisitions or other business combinationsthat we believe will allow us to expand our presence in our existing and ancillary markets. We are focused onreducing earnings volatility, growing our business and diversifying our business and product lines. We believethat our fiscal year 2014 growth in orders and backlog are early evidence of the success of our strategy.
As fiscal 2015 continues, we believe the energy markets will remain strong. We believe that with our strongproject pipeline, we are likely to see improved quarterly order levels, though the timing of that improvement isstill uncertain.
We expect revenue to be approximately $120,000 to $130,000 in fiscal 2015, a 17% to 27% increase ascompared with fiscal 2014. Our expected growth range for fiscal 2015 assumes conversion of existing backlog aswell as continued market improvement and order placement by our customers. To achieve the upper end of therange, we will need to see strong order levels in the first half of the year. The continued conversion to revenue ofthe U.S. Navy CVN-79 project and two large domestic nuclear power generation projects is expected to contrib-ute significantly to sales in fiscal 2015. Any unexpected delay in any of these projects could adversely impact ourfiscal 2015 revenue and earnings.
We have a number of large projects which are converting over a multi-year time period. The U.S. Navy proj-ects and large projects for the new nuclear reactors being built in the southeast U.S. will partially convert in fiscal2015. However, the reactor projects, as well as the U.S. Navy project, will continue into subsequent fiscal years.These projects made up over 30% of our fiscal 2014 year-end backlog. We expect to convert approximately 70%to 75% of our March 31, 2014 backlog to sales in fiscal 2015.
We expect gross profit margin in fiscal 2015 to be in the 30% to 32% range. While we continue to see stron-ger activity in our key end markets, particularly the petrochemical and refining markets, our pricing power is stillconsistent with historic early cycle comparables. Our margin expectations are constrained by the current mix ofproducts sold to the chemical and petrochemical markets.
We continue to believe that as the recovery in our markets continues, gross profit margins should improvewith anticipated volume increases. As we look forward, due to changes in geographic and end use market mix,we expect gross margins are unlikely to reach the 40% range achieved in the prior up cycle. We believe that atthe peak of the current cycle a gross profit margin percentage in the mid-to-upper 30% range is a more realisticexpectation. We also expect this recovery, while including more domestic chemical and petrochemical oppor-tunities, will be more focused on emerging markets, which historically have provided a more competitive pricingenvironment and, correspondingly, lower margins, than developed markets.
28
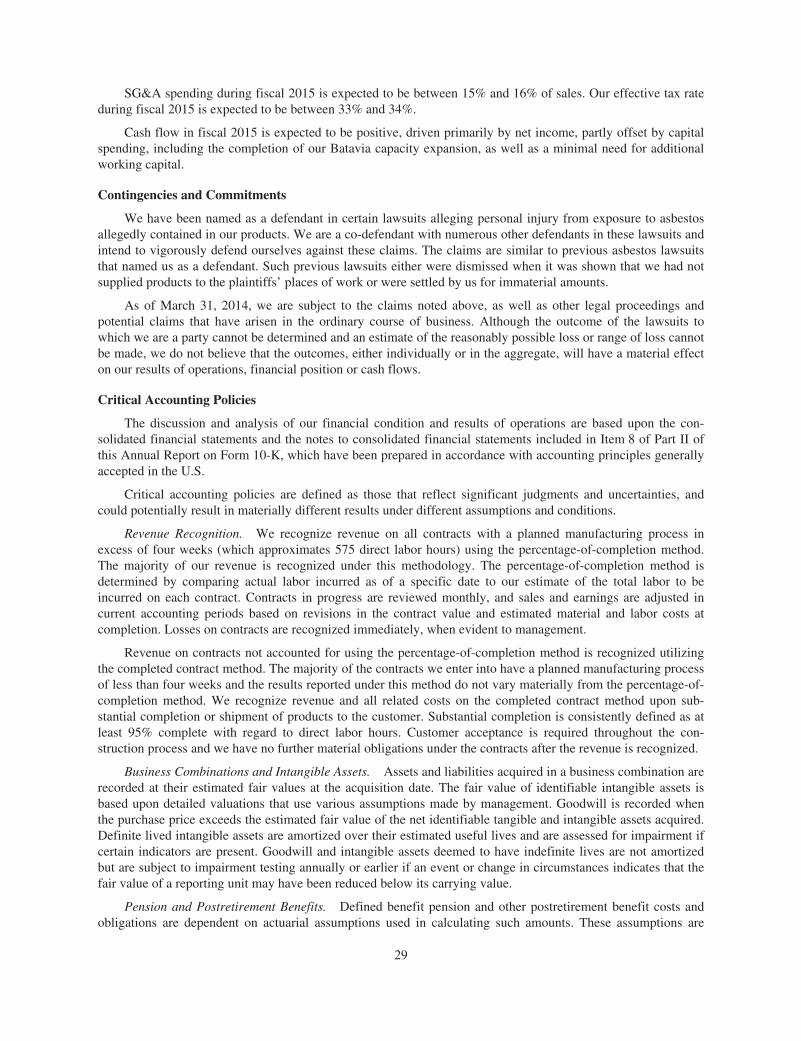
SG&A spending during fiscal 2015 is expected to be between 15% and 16% of sales. Our effective tax rateduring fiscal 2015 is expected to be between 33% and 34%.
Cash flow in fiscal 2015 is expected to be positive, driven primarily by net income, partly offset by capitalspending, including the completion of our Batavia capacity expansion, as well as a minimal need for additionalworking capital.
Contingencies and Commitments
We have been named as a defendant in certain lawsuits alleging personal injury from exposure to asbestosallegedly contained in our products. We are a co-defendant with numerous other defendants in these lawsuits andintend to vigorously defend ourselves against these claims. The claims are similar to previous asbestos lawsuitsthat named us as a defendant. Such previous lawsuits either were dismissed when it was shown that we had notsupplied products to the plaintiffs’ places of work or were settled by us for immaterial amounts.
As of March 31, 2014, we are subject to the claims noted above, as well as other legal proceedings andpotential claims that have arisen in the ordinary course of business. Although the outcome of the lawsuits towhich we are a party cannot be determined and an estimate of the reasonably possible loss or range of loss cannotbe made, we do not believe that the outcomes, either individually or in the aggregate, will have a material effecton our results of operations, financial position or cash flows.
Critical Accounting Policies
The discussion and analysis of our financial condition and results of operations are based upon the con-solidated financial statements and the notes to consolidated financial statements included in Item 8 of Part II ofthis Annual Report on Form 10-K, which have been prepared in accordance with accounting principles generallyaccepted in the U.S.
Critical accounting policies are defined as those that reflect significant judgments and uncertainties, andcould potentially result in materially different results under different assumptions and conditions.
Revenue Recognition. We recognize revenue on all contracts with a planned manufacturing process inexcess of four weeks (which approximates 575 direct labor hours) using the percentage-of-completion method.The majority of our revenue is recognized under this methodology. The percentage-of-completion method isdetermined by comparing actual labor incurred as of a specific date to our estimate of the total labor to beincurred on each contract. Contracts in progress are reviewed monthly, and sales and earnings are adjusted incurrent accounting periods based on revisions in the contract value and estimated material and labor costs atcompletion. Losses on contracts are recognized immediately, when evident to management.
Revenue on contracts not accounted for using the percentage-of-completion method is recognized utilizingthe completed contract method. The majority of the contracts we enter into have a planned manufacturing processof less than four weeks and the results reported under this method do not vary materially from the percentage-of-completion method. We recognize revenue and all related costs on the completed contract method upon sub-stantial completion or shipment of products to the customer. Substantial completion is consistently defined as atleast 95% complete with regard to direct labor hours. Customer acceptance is required throughout the con-struction process and we have no further material obligations under the contracts after the revenue is recognized.
Business Combinations and Intangible Assets. Assets and liabilities acquired in a business combination arerecorded at their estimated fair values at the acquisition date. The fair value of identifiable intangible assets isbased upon detailed valuations that use various assumptions made by management. Goodwill is recorded whenthe purchase price exceeds the estimated fair value of the net identifiable tangible and intangible assets acquired.Definite lived intangible assets are amortized over their estimated useful lives and are assessed for impairment ifcertain indicators are present. Goodwill and intangible assets deemed to have indefinite lives are not amortizedbut are subject to impairment testing annually or earlier if an event or change in circumstances indicates that thefair value of a reporting unit may have been reduced below its carrying value.
Pension and Postretirement Benefits. Defined benefit pension and other postretirement benefit costs andobligations are dependent on actuarial assumptions used in calculating such amounts. These assumptions are
29
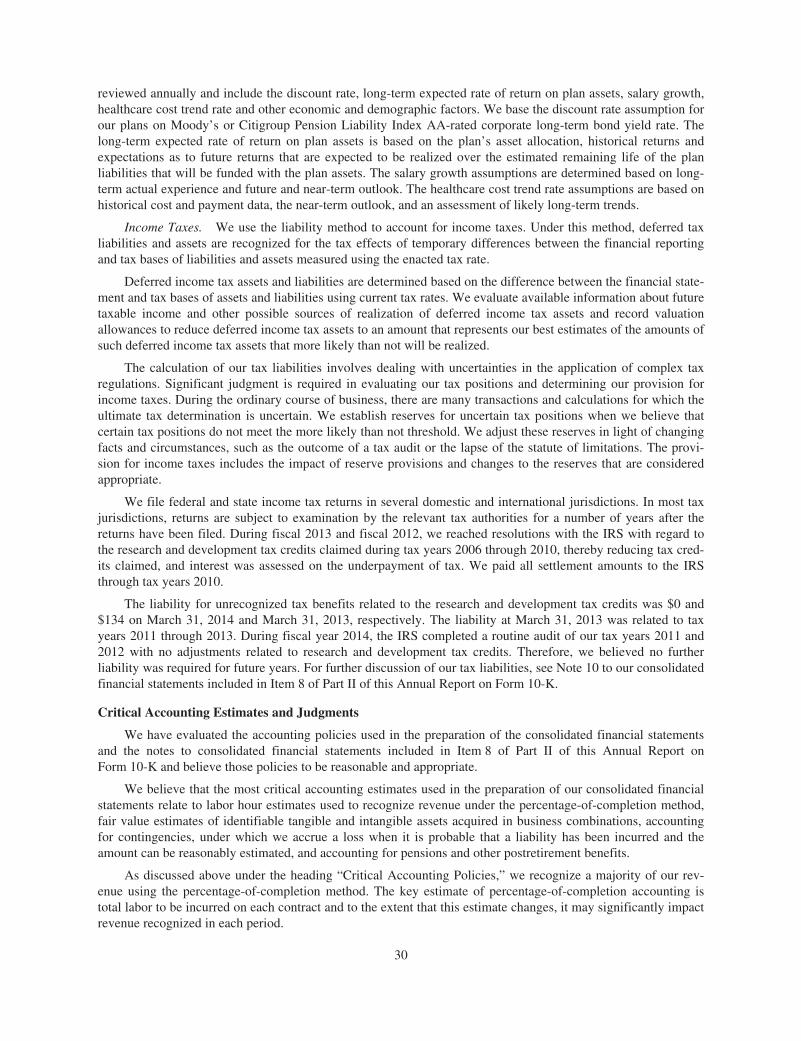
reviewed annually and include the discount rate, long-term expected rate of return on plan assets, salary growth,healthcare cost trend rate and other economic and demographic factors. We base the discount rate assumption forour plans on Moody’s or Citigroup Pension Liability Index AA-rated corporate long-term bond yield rate. Thelong-term expected rate of return on plan assets is based on the plan’s asset allocation, historical returns andexpectations as to future returns that are expected to be realized over the estimated remaining life of the planliabilities that will be funded with the plan assets. The salary growth assumptions are determined based on long-term actual experience and future and near-term outlook. The healthcare cost trend rate assumptions are based onhistorical cost and payment data, the near-term outlook, and an assessment of likely long-term trends.
Income Taxes. We use the liability method to account for income taxes. Under this method, deferred taxliabilities and assets are recognized for the tax effects of temporary differences between the financial reportingand tax bases of liabilities and assets measured using the enacted tax rate.
Deferred income tax assets and liabilities are determined based on the difference between the financial state-ment and tax bases of assets and liabilities using current tax rates. We evaluate available information about futuretaxable income and other possible sources of realization of deferred income tax assets and record valuationallowances to reduce deferred income tax assets to an amount that represents our best estimates of the amounts ofsuch deferred income tax assets that more likely than not will be realized.
The calculation of our tax liabilities involves dealing with uncertainties in the application of complex taxregulations. Significant judgment is required in evaluating our tax positions and determining our provision forincome taxes. During the ordinary course of business, there are many transactions and calculations for which theultimate tax determination is uncertain. We establish reserves for uncertain tax positions when we believe thatcertain tax positions do not meet the more likely than not threshold. We adjust these reserves in light of changingfacts and circumstances, such as the outcome of a tax audit or the lapse of the statute of limitations. The provi-sion for income taxes includes the impact of reserve provisions and changes to the reserves that are consideredappropriate.
We file federal and state income tax returns in several domestic and international jurisdictions. In most taxjurisdictions, returns are subject to examination by the relevant tax authorities for a number of years after thereturns have been filed. During fiscal 2013 and fiscal 2012, we reached resolutions with the IRS with regard tothe research and development tax credits claimed during tax years 2006 through 2010, thereby reducing tax cred-its claimed, and interest was assessed on the underpayment of tax. We paid all settlement amounts to the IRSthrough tax years 2010.
The liability for unrecognized tax benefits related to the research and development tax credits was $0 and$134 on March 31, 2014 and March 31, 2013, respectively. The liability at March 31, 2013 was related to taxyears 2011 through 2013. During fiscal year 2014, the IRS completed a routine audit of our tax years 2011 and2012 with no adjustments related to research and development tax credits. Therefore, we believed no furtherliability was required for future years. For further discussion of our tax liabilities, see Note 10 to our consolidatedfinancial statements included in Item 8 of Part II of this Annual Report on Form 10-K.
Critical Accounting Estimates and Judgments
We have evaluated the accounting policies used in the preparation of the consolidated financial statementsand the notes to consolidated financial statements included in Item 8 of Part II of this Annual Report onForm 10-K and believe those policies to be reasonable and appropriate.
We believe that the most critical accounting estimates used in the preparation of our consolidated financialstatements relate to labor hour estimates used to recognize revenue under the percentage-of-completion method,fair value estimates of identifiable tangible and intangible assets acquired in business combinations, accountingfor contingencies, under which we accrue a loss when it is probable that a liability has been incurred and theamount can be reasonably estimated, and accounting for pensions and other postretirement benefits.
As discussed above under the heading “Critical Accounting Policies,” we recognize a majority of our rev-enue using the percentage-of-completion method. The key estimate of percentage-of-completion accounting istotal labor to be incurred on each contract and to the extent that this estimate changes, it may significantly impactrevenue recognized in each period.
30
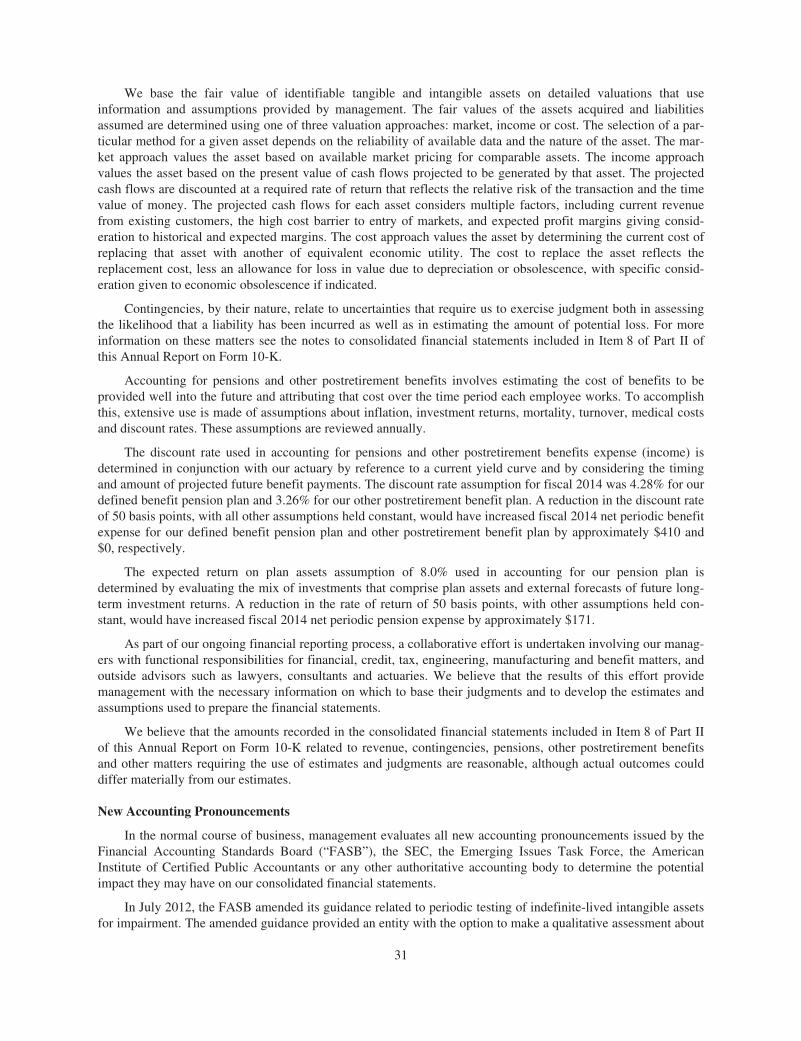
We base the fair value of identifiable tangible and intangible assets on detailed valuations that useinformation and assumptions provided by management. The fair values of the assets acquired and liabilitiesassumed are determined using one of three valuation approaches: market, income or cost. The selection of a par-ticular method for a given asset depends on the reliability of available data and the nature of the asset. The mar-ket approach values the asset based on available market pricing for comparable assets. The income approachvalues the asset based on the present value of cash flows projected to be generated by that asset. The projectedcash flows are discounted at a required rate of return that reflects the relative risk of the transaction and the timevalue of money. The projected cash flows for each asset considers multiple factors, including current revenuefrom existing customers, the high cost barrier to entry of markets, and expected profit margins giving consid-eration to historical and expected margins. The cost approach values the asset by determining the current cost ofreplacing that asset with another of equivalent economic utility. The cost to replace the asset reflects thereplacement cost, less an allowance for loss in value due to depreciation or obsolescence, with specific consid-eration given to economic obsolescence if indicated.
Contingencies, by their nature, relate to uncertainties that require us to exercise judgment both in assessingthe likelihood that a liability has been incurred as well as in estimating the amount of potential loss. For moreinformation on these matters see the notes to consolidated financial statements included in Item 8 of Part II ofthis Annual Report on Form 10-K.
Accounting for pensions and other postretirement benefits involves estimating the cost of benefits to beprovided well into the future and attributing that cost over the time period each employee works. To accomplishthis, extensive use is made of assumptions about inflation, investment returns, mortality, turnover, medical costsand discount rates. These assumptions are reviewed annually.
The discount rate used in accounting for pensions and other postretirement benefits expense (income) isdetermined in conjunction with our actuary by reference to a current yield curve and by considering the timingand amount of projected future benefit payments. The discount rate assumption for fiscal 2014 was 4.28% for ourdefined benefit pension plan and 3.26% for our other postretirement benefit plan. A reduction in the discount rateof 50 basis points, with all other assumptions held constant, would have increased fiscal 2014 net periodic benefitexpense for our defined benefit pension plan and other postretirement benefit plan by approximately $410 and$0, respectively.
The expected return on plan assets assumption of 8.0% used in accounting for our pension plan isdetermined by evaluating the mix of investments that comprise plan assets and external forecasts of future long-term investment returns. A reduction in the rate of return of 50 basis points, with other assumptions held con-stant, would have increased fiscal 2014 net periodic pension expense by approximately $171.
As part of our ongoing financial reporting process, a collaborative effort is undertaken involving our manag-ers with functional responsibilities for financial, credit, tax, engineering, manufacturing and benefit matters, andoutside advisors such as lawyers, consultants and actuaries. We believe that the results of this effort providemanagement with the necessary information on which to base their judgments and to develop the estimates andassumptions used to prepare the financial statements.
We believe that the amounts recorded in the consolidated financial statements included in Item 8 of Part IIof this Annual Report on Form 10-K related to revenue, contingencies, pensions, other postretirement benefitsand other matters requiring the use of estimates and judgments are reasonable, although actual outcomes coulddiffer materially from our estimates.
New Accounting Pronouncements
In the normal course of business, management evaluates all new accounting pronouncements issued by theFinancial Accounting Standards Board (“FASB”), the SEC, the Emerging Issues Task Force, the AmericanInstitute of Certified Public Accountants or any other authoritative accounting body to determine the potentialimpact they may have on our consolidated financial statements.
In July 2012, the FASB amended its guidance related to periodic testing of indefinite-lived intangible assetsfor impairment. The amended guidance provided an entity with the option to make a qualitative assessment about
31

the likelihood that an indefinite-lived intangible asset is impaired to determine whether it should perform aquantitative impairment test. The guidance also enhanced the consistency of impairment testing among long-lived asset categories by permitting an entity to assess qualitative factors to determine whether it is necessary tocalculate the asset’s fair value when testing an indefinite-lived intangible asset for impairment, which is equiv-alent to the impairment testing requirements for other long-lived assets. In accordance with the guidance, anentity has an option not to calculate annually the fair value of an indefinite-lived intangible asset if the entitydetermines that it is not more-likely-than-not that the asset is impaired. The provisions of the amended guidancewere effective for annual and interim impairment tests performed for fiscal years beginning after September 15,2012. We did not elect the option to perform a qualitative assessment for impairment testing. Therefore, theamended guidance did not have an impact on our consolidated financial statements.
In February 2013, the FASB issued guidance related to the disclosure of amounts reclassified out of accumu-lated other comprehensive income. This guidance added new disclosure requirements either in a single note orparenthetically on the face of the financial statements, the effect of significant amounts reclassified from eachcomponent of accumulated other comprehensive income (“AOCI”) based on its source and the income statementline items affected by the reclassification. This guidance gave companies the flexibility to present the informationeither in the notes or parenthetically on the face of the financial statements provided that all of the requiredinformation is presented in a single location. This guidance was effective prospectively for annual and interimreporting periods beginning after December 15, 2012. The adoption of this guidance did not have a materialimpact on our consolidated financial statements as it only changed the disclosures surrounding AOCI.
We do not expect any other recently issued accounting pronouncements, which have not already been adopt-ed, to have a material impact on our consolidated financial statements.
Off Balance Sheet Arrangements
We did not have any off balance sheet arrangements as of March 31, 2014 or March 31, 2013, other thanoperating leases and letters of credit incurred in the ordinary course of business.
Item 7A. Quantitative and Qualitative Disclosures About Market Risk
The principal market risks (i.e., the risk of loss arising from market changes) to which we are exposed areforeign currency exchange rates, price risk and project cancellation risk.
The assumptions applied in preparing the following qualitative and quantitative disclosures regarding for-eign currency exchange rate, price risk and project cancellation risk are based upon volatility ranges experiencedby us in relevant historical periods, our current knowledge of the marketplace, and our judgment of the proba-bility of future volatility based upon the historical trends and economic conditions of the markets in which weoperate.
Foreign Currency
International consolidated sales for fiscal 2014 were 38% of total sales, down from 47% of sales in fiscal2013. Operating in markets throughout the world exposes us to movements in currency exchange rates. Currencymovements can affect sales in several ways, the foremost being our ability to compete for orders against foreigncompetitors that base their prices on relatively weaker currencies. Business lost due to competition for ordersagainst competitors using a relatively weaker currency cannot be quantified. In addition, cash can be adverselyimpacted by the conversion of sales made by us in a foreign currency to U.S. dollars. In each of fiscal 2014, fis-cal 2013, and fiscal 2012, all sales for which we or our subsidiaries were paid were denominated in the localcurrency (U.S. dollars or Chinese RMB).
We have limited exposure to foreign currency purchases. In each of fiscal 2014, fiscal 2013 and fiscal 2012,our purchases in foreign currencies represented 1% of the cost of products sold. At certain times, we may enterinto forward foreign currency exchange agreements to hedge our exposure against potential unfavorable changesin foreign currency values on significant sales and purchase contracts negotiated in foreign currencies. Forwardforeign currency exchange contracts were not used in fiscal 2014 or fiscal 2013, and as of March 31, 2014 and2013, respectively, we held no forward foreign currency contracts.
32
Price Risk
Operating in a global marketplace requires us to compete with other global manufacturers which, in someinstances, benefit from lower production costs and more favorable economic conditions. Although we believethat our customers differentiate our products on the basis of our manufacturing quality and engineering experi-ence and excellence, among other things, such lower production costs and more favorable economic conditionsmean that certain of our competitors are able to offer products similar to ours at lower prices. Moreover, the costof metals and other materials used in our products have experienced significant volatility. Such factors, in addi-tion to the global effects of the recent volatility and disruption of the capital and credit markets, have resulted indownward demand and pricing pressure on our products.
Project Cancellation and Project Continuation Risk
Adverse economic or specific project conditions can lead to a project being placed on hold or cancelled byour customers. At March 31, 2014, we had no projects on hold. We attempt to mitigate the risk of cancellation bystructuring contracts with our customers to maximize the likelihood that progress payments made to us forindividual projects cover the costs we have incurred. As a result, we do not believe we have a significant cashexposure to projects which may be cancelled.
Open orders are reviewed continuously through communications with customers. If it becomes evident to usthat a project is delayed well beyond its original shipment date, management will move the project into “placedon hold” (i.e., suspended) category. Furthermore, if a project is cancelled by our customer, it is removed from ourbacklog.
33
Item 8. Financial Statements and Supplementary Data
INDEX TO FINANCIAL STATEMENTS
Graham Corporation Page
Consolidated Financial Statements:Consolidated Statements of Operations for the years ended March 31, 2014, 2013 and 2012 . . . . . . . . . . 35
Consolidated Statements of Comprehensive Income for the years ended March 31, 2014, 2013, and2012 . . . . . . . . . . . . . . . . . . . . . . . . . . . . . . . . . . . . . . . . . . . . . . . . . . . . . . . . . . . . . . . . . . . . . . . . . . . . . 36
Consolidated Balance Sheets as of March 31, 2014 and 2013 . . . . . . . . . . . . . . . . . . . . . . . . . . . . . . . . . . . 37
Consolidated Statements of Cash Flows for the years ended March 31, 2014, 2013 and 2012 . . . . . . . . . . 38
Consolidated Statements of Changes in Stockholders’ Equity for the years ended March 31, 2014, 2013and 2012 . . . . . . . . . . . . . . . . . . . . . . . . . . . . . . . . . . . . . . . . . . . . . . . . . . . . . . . . . . . . . . . . . . . . . . . . . . 39
Notes to Consolidated Financial Statements . . . . . . . . . . . . . . . . . . . . . . . . . . . . . . . . . . . . . . . . . . . . . . . . 40
Reports of Independent Registered Public Accounting Firm . . . . . . . . . . . . . . . . . . . . . . . . . . . . . . . . . . . . 66
34
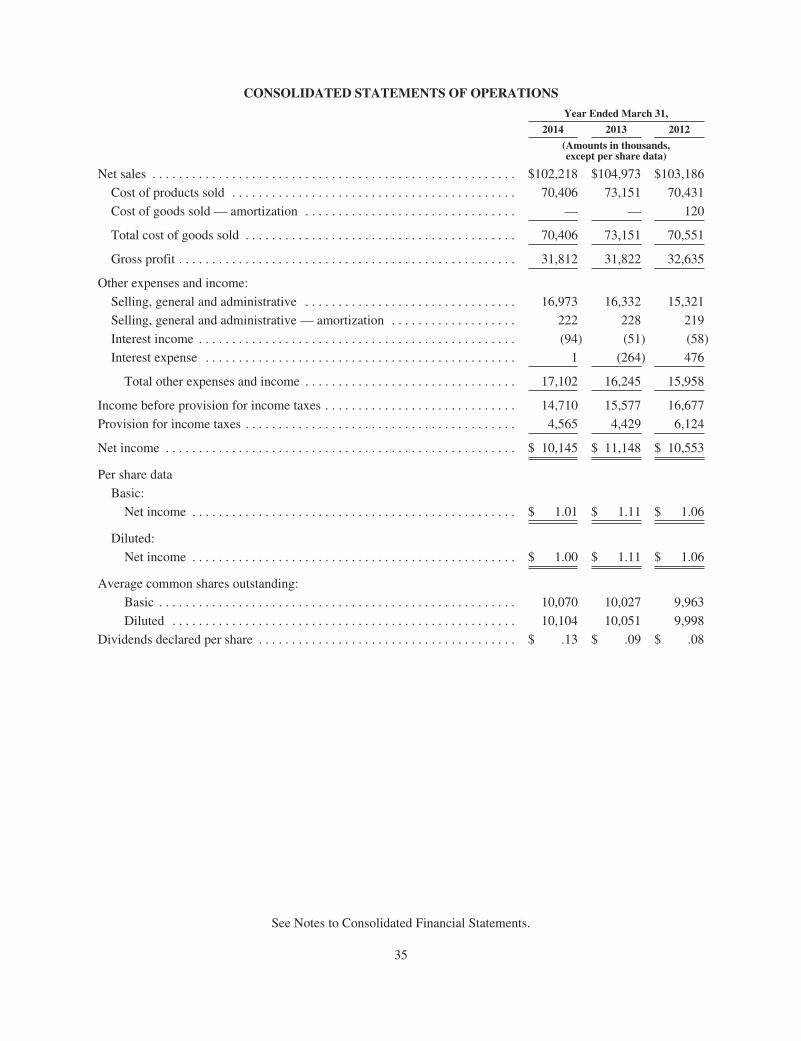
CONSOLIDATED STATEMENTS OF OPERATIONS
Year Ended March 31,
2014 2013 2012
(Amounts in thousands,except per share data)
Net sales . . . . . . . . . . . . . . . . . . . . . . . . . . . . . . . . . . . . . . . . . . . . . . . . . . . . . . . $102,218 $104,973 $103,186
Cost of products sold . . . . . . . . . . . . . . . . . . . . . . . . . . . . . . . . . . . . . . . . . . . 70,406 73,151 70,431
Cost of goods sold — amortization . . . . . . . . . . . . . . . . . . . . . . . . . . . . . . . . — — 120
Total cost of goods sold . . . . . . . . . . . . . . . . . . . . . . . . . . . . . . . . . . . . . . . . . 70,406 73,151 70,551
Gross profit . . . . . . . . . . . . . . . . . . . . . . . . . . . . . . . . . . . . . . . . . . . . . . . . . . . 31,812 31,822 32,635
Other expenses and income:
Selling, general and administrative . . . . . . . . . . . . . . . . . . . . . . . . . . . . . . . . 16,973 16,332 15,321
Selling, general and administrative — amortization . . . . . . . . . . . . . . . . . . . 222 228 219
Interest income . . . . . . . . . . . . . . . . . . . . . . . . . . . . . . . . . . . . . . . . . . . . . . . . (94) (51) (58)
Interest expense . . . . . . . . . . . . . . . . . . . . . . . . . . . . . . . . . . . . . . . . . . . . . . . 1 (264) 476
Total other expenses and income . . . . . . . . . . . . . . . . . . . . . . . . . . . . . . . . 17,102 16,245 15,958
Income before provision for income taxes . . . . . . . . . . . . . . . . . . . . . . . . . . . . . 14,710 15,577 16,677
Provision for income taxes . . . . . . . . . . . . . . . . . . . . . . . . . . . . . . . . . . . . . . . . . 4,565 4,429 6,124
Net income . . . . . . . . . . . . . . . . . . . . . . . . . . . . . . . . . . . . . . . . . . . . . . . . . . . . . $ 10,145 $ 11,148 $ 10,553
Per share data
Basic:
Net income . . . . . . . . . . . . . . . . . . . . . . . . . . . . . . . . . . . . . . . . . . . . . . . . . $ 1.01 $ 1.11 $ 1.06
Diluted:
Net income . . . . . . . . . . . . . . . . . . . . . . . . . . . . . . . . . . . . . . . . . . . . . . . . . $ 1.00 $ 1.11 $ 1.06
Average common shares outstanding:
Basic . . . . . . . . . . . . . . . . . . . . . . . . . . . . . . . . . . . . . . . . . . . . . . . . . . . . . . 10,070 10,027 9,963
Diluted . . . . . . . . . . . . . . . . . . . . . . . . . . . . . . . . . . . . . . . . . . . . . . . . . . . . 10,104 10,051 9,998
Dividends declared per share . . . . . . . . . . . . . . . . . . . . . . . . . . . . . . . . . . . . . . . $ .13 $ .09 $ .08
See Notes to Consolidated Financial Statements.
35
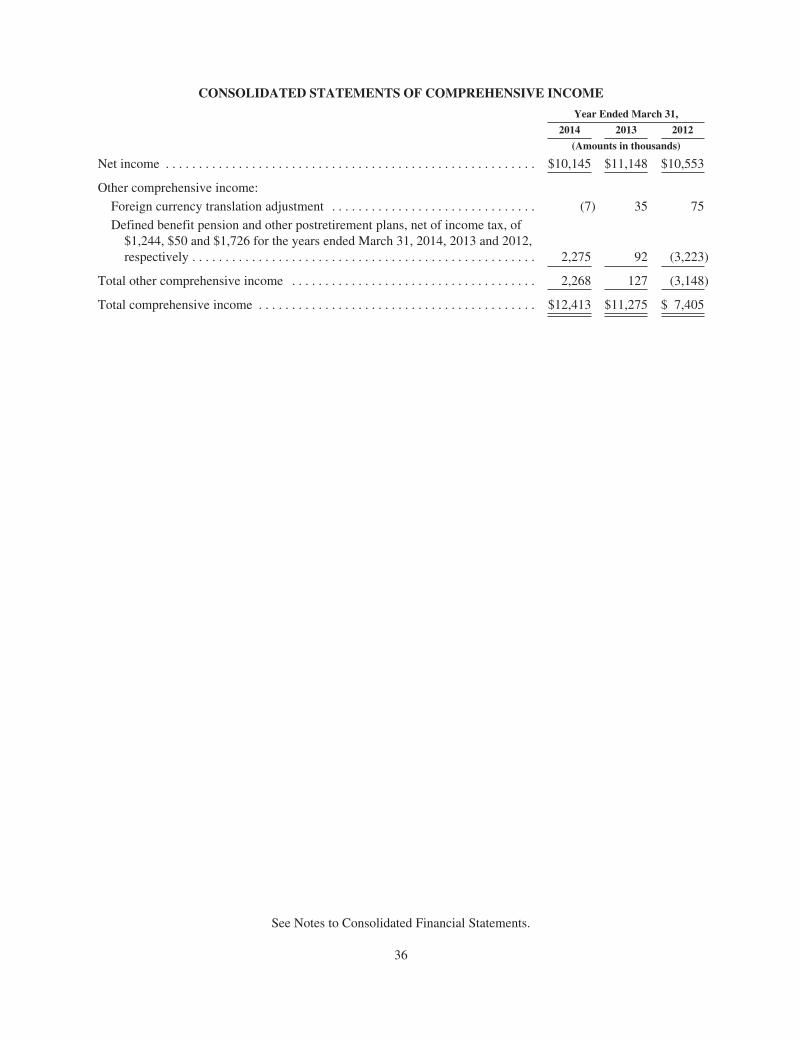
CONSOLIDATED STATEMENTS OF COMPREHENSIVE INCOME
Year Ended March 31,
2014 2013 2012
(Amounts in thousands)
Net income . . . . . . . . . . . . . . . . . . . . . . . . . . . . . . . . . . . . . . . . . . . . . . . . . . . . . . . . $10,145 $11,148 $10,553
Other comprehensive income:
Foreign currency translation adjustment . . . . . . . . . . . . . . . . . . . . . . . . . . . . . . . (7) 35 75
Defined benefit pension and other postretirement plans, net of income tax, of$1,244, $50 and $1,726 for the years ended March 31, 2014, 2013 and 2012,respectively . . . . . . . . . . . . . . . . . . . . . . . . . . . . . . . . . . . . . . . . . . . . . . . . . . . . 2,275 92 (3,223)
Total other comprehensive income . . . . . . . . . . . . . . . . . . . . . . . . . . . . . . . . . . . . . 2,268 127 (3,148)
Total comprehensive income . . . . . . . . . . . . . . . . . . . . . . . . . . . . . . . . . . . . . . . . . . $12,413 $11,275 $ 7,405
See Notes to Consolidated Financial Statements.
36
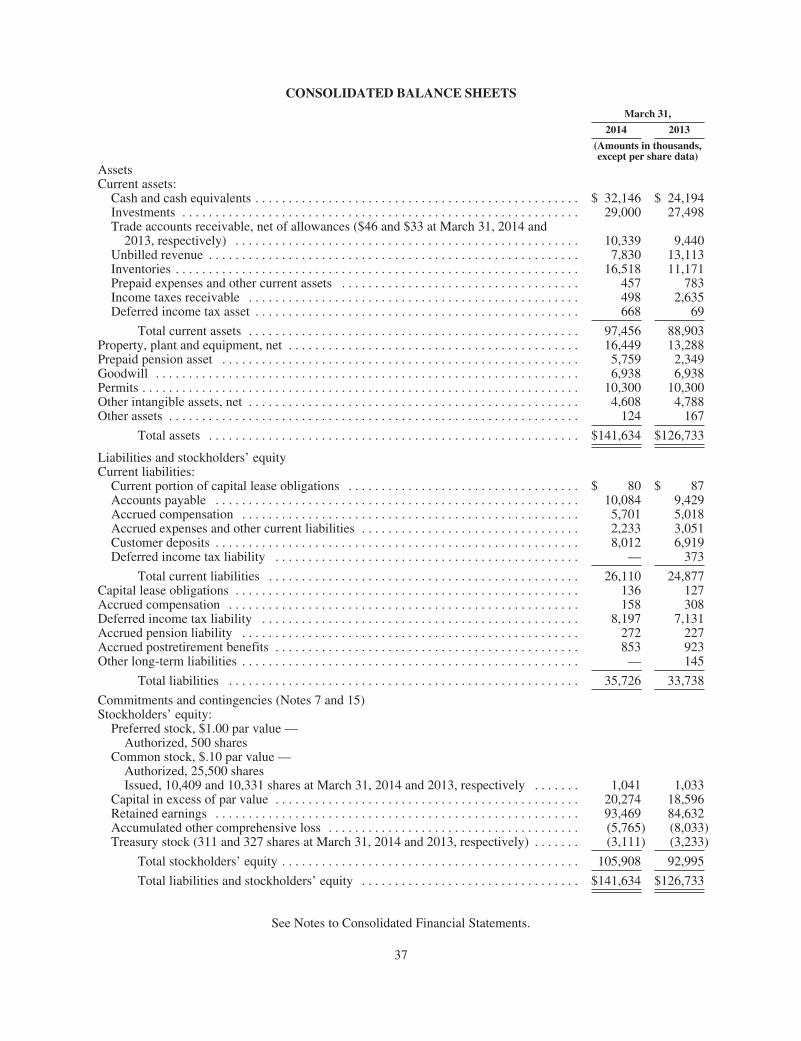
CONSOLIDATED BALANCE SHEETS
March 31,
2014 2013
(Amounts in thousands,except per share data)
AssetsCurrent assets:
Cash and cash equivalents . . . . . . . . . . . . . . . . . . . . . . . . . . . . . . . . . . . . . . . . . . . . . . . . . $ 32,146 $ 24,194Investments . . . . . . . . . . . . . . . . . . . . . . . . . . . . . . . . . . . . . . . . . . . . . . . . . . . . . . . . . . . . 29,000 27,498Trade accounts receivable, net of allowances ($46 and $33 at March 31, 2014 and
2013, respectively) . . . . . . . . . . . . . . . . . . . . . . . . . . . . . . . . . . . . . . . . . . . . . . . . . . . . 10,339 9,440Unbilled revenue . . . . . . . . . . . . . . . . . . . . . . . . . . . . . . . . . . . . . . . . . . . . . . . . . . . . . . . . 7,830 13,113Inventories . . . . . . . . . . . . . . . . . . . . . . . . . . . . . . . . . . . . . . . . . . . . . . . . . . . . . . . . . . . . . 16,518 11,171Prepaid expenses and other current assets . . . . . . . . . . . . . . . . . . . . . . . . . . . . . . . . . . . . 457 783Income taxes receivable . . . . . . . . . . . . . . . . . . . . . . . . . . . . . . . . . . . . . . . . . . . . . . . . . . 498 2,635Deferred income tax asset . . . . . . . . . . . . . . . . . . . . . . . . . . . . . . . . . . . . . . . . . . . . . . . . . 668 69
Total current assets . . . . . . . . . . . . . . . . . . . . . . . . . . . . . . . . . . . . . . . . . . . . . . . . . . 97,456 88,903Property, plant and equipment, net . . . . . . . . . . . . . . . . . . . . . . . . . . . . . . . . . . . . . . . . . . . . 16,449 13,288Prepaid pension asset . . . . . . . . . . . . . . . . . . . . . . . . . . . . . . . . . . . . . . . . . . . . . . . . . . . . . . 5,759 2,349Goodwill . . . . . . . . . . . . . . . . . . . . . . . . . . . . . . . . . . . . . . . . . . . . . . . . . . . . . . . . . . . . . . . . 6,938 6,938Permits . . . . . . . . . . . . . . . . . . . . . . . . . . . . . . . . . . . . . . . . . . . . . . . . . . . . . . . . . . . . . . . . . . 10,300 10,300Other intangible assets, net . . . . . . . . . . . . . . . . . . . . . . . . . . . . . . . . . . . . . . . . . . . . . . . . . . 4,608 4,788Other assets . . . . . . . . . . . . . . . . . . . . . . . . . . . . . . . . . . . . . . . . . . . . . . . . . . . . . . . . . . . . . . 124 167
Total assets . . . . . . . . . . . . . . . . . . . . . . . . . . . . . . . . . . . . . . . . . . . . . . . . . . . . . . . . $141,634 $126,733
Liabilities and stockholders’ equityCurrent liabilities:
Current portion of capital lease obligations . . . . . . . . . . . . . . . . . . . . . . . . . . . . . . . . . . . $ 80 $ 87Accounts payable . . . . . . . . . . . . . . . . . . . . . . . . . . . . . . . . . . . . . . . . . . . . . . . . . . . . . . . 10,084 9,429Accrued compensation . . . . . . . . . . . . . . . . . . . . . . . . . . . . . . . . . . . . . . . . . . . . . . . . . . . 5,701 5,018Accrued expenses and other current liabilities . . . . . . . . . . . . . . . . . . . . . . . . . . . . . . . . . 2,233 3,051Customer deposits . . . . . . . . . . . . . . . . . . . . . . . . . . . . . . . . . . . . . . . . . . . . . . . . . . . . . . . 8,012 6,919Deferred income tax liability . . . . . . . . . . . . . . . . . . . . . . . . . . . . . . . . . . . . . . . . . . . . . . — 373
Total current liabilities . . . . . . . . . . . . . . . . . . . . . . . . . . . . . . . . . . . . . . . . . . . . . . . 26,110 24,877Capital lease obligations . . . . . . . . . . . . . . . . . . . . . . . . . . . . . . . . . . . . . . . . . . . . . . . . . . . . 136 127Accrued compensation . . . . . . . . . . . . . . . . . . . . . . . . . . . . . . . . . . . . . . . . . . . . . . . . . . . . . 158 308Deferred income tax liability . . . . . . . . . . . . . . . . . . . . . . . . . . . . . . . . . . . . . . . . . . . . . . . . 8,197 7,131Accrued pension liability . . . . . . . . . . . . . . . . . . . . . . . . . . . . . . . . . . . . . . . . . . . . . . . . . . . 272 227Accrued postretirement benefits . . . . . . . . . . . . . . . . . . . . . . . . . . . . . . . . . . . . . . . . . . . . . . 853 923Other long-term liabilities . . . . . . . . . . . . . . . . . . . . . . . . . . . . . . . . . . . . . . . . . . . . . . . . . . . — 145
Total liabilities . . . . . . . . . . . . . . . . . . . . . . . . . . . . . . . . . . . . . . . . . . . . . . . . . . . . . 35,726 33,738
Commitments and contingencies (Notes 7 and 15)Stockholders’ equity:
Preferred stock, $1.00 par value —Authorized, 500 shares
Common stock, $.10 par value —Authorized, 25,500 sharesIssued, 10,409 and 10,331 shares at March 31, 2014 and 2013, respectively . . . . . . . 1,041 1,033
Capital in excess of par value . . . . . . . . . . . . . . . . . . . . . . . . . . . . . . . . . . . . . . . . . . . . . . 20,274 18,596Retained earnings . . . . . . . . . . . . . . . . . . . . . . . . . . . . . . . . . . . . . . . . . . . . . . . . . . . . . . . 93,469 84,632Accumulated other comprehensive loss . . . . . . . . . . . . . . . . . . . . . . . . . . . . . . . . . . . . . . (5,765) (8,033)Treasury stock (311 and 327 shares at March 31, 2014 and 2013, respectively) . . . . . . . (3,111) (3,233)
Total stockholders’ equity . . . . . . . . . . . . . . . . . . . . . . . . . . . . . . . . . . . . . . . . . . . . . 105,908 92,995
Total liabilities and stockholders’ equity . . . . . . . . . . . . . . . . . . . . . . . . . . . . . . . . . $141,634 $126,733
See Notes to Consolidated Financial Statements.
37
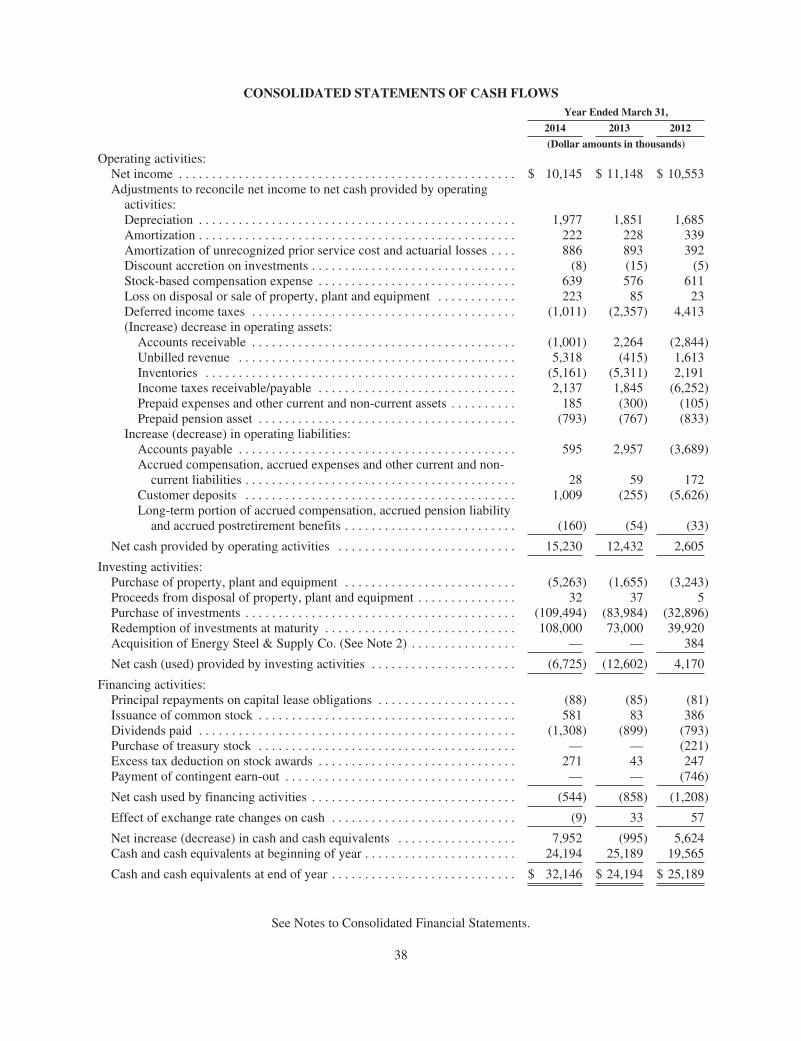
CONSOLIDATED STATEMENTS OF CASH FLOWSYear Ended March 31,
2014 2013 2012
(Dollar amounts in thousands)Operating activities:
Net income . . . . . . . . . . . . . . . . . . . . . . . . . . . . . . . . . . . . . . . . . . . . . . . . . . . $ 10,145 $ 11,148 $ 10,553Adjustments to reconcile net income to net cash provided by operating
activities:Depreciation . . . . . . . . . . . . . . . . . . . . . . . . . . . . . . . . . . . . . . . . . . . . . . . . 1,977 1,851 1,685Amortization . . . . . . . . . . . . . . . . . . . . . . . . . . . . . . . . . . . . . . . . . . . . . . . . 222 228 339Amortization of unrecognized prior service cost and actuarial losses . . . . 886 893 392Discount accretion on investments . . . . . . . . . . . . . . . . . . . . . . . . . . . . . . . (8) (15) (5)Stock-based compensation expense . . . . . . . . . . . . . . . . . . . . . . . . . . . . . . 639 576 611Loss on disposal or sale of property, plant and equipment . . . . . . . . . . . . 223 85 23Deferred income taxes . . . . . . . . . . . . . . . . . . . . . . . . . . . . . . . . . . . . . . . . (1,011) (2,357) 4,413(Increase) decrease in operating assets:
Accounts receivable . . . . . . . . . . . . . . . . . . . . . . . . . . . . . . . . . . . . . . . . (1,001) 2,264 (2,844)Unbilled revenue . . . . . . . . . . . . . . . . . . . . . . . . . . . . . . . . . . . . . . . . . . 5,318 (415) 1,613Inventories . . . . . . . . . . . . . . . . . . . . . . . . . . . . . . . . . . . . . . . . . . . . . . . (5,161) (5,311) 2,191Income taxes receivable/payable . . . . . . . . . . . . . . . . . . . . . . . . . . . . . . 2,137 1,845 (6,252)Prepaid expenses and other current and non-current assets . . . . . . . . . . 185 (300) (105)Prepaid pension asset . . . . . . . . . . . . . . . . . . . . . . . . . . . . . . . . . . . . . . . (793) (767) (833)
Increase (decrease) in operating liabilities:Accounts payable . . . . . . . . . . . . . . . . . . . . . . . . . . . . . . . . . . . . . . . . . . 595 2,957 (3,689)Accrued compensation, accrued expenses and other current and non-
current liabilities . . . . . . . . . . . . . . . . . . . . . . . . . . . . . . . . . . . . . . . . . 28 59 172Customer deposits . . . . . . . . . . . . . . . . . . . . . . . . . . . . . . . . . . . . . . . . . 1,009 (255) (5,626)Long-term portion of accrued compensation, accrued pension liability
and accrued postretirement benefits . . . . . . . . . . . . . . . . . . . . . . . . . . (160) (54) (33)
Net cash provided by operating activities . . . . . . . . . . . . . . . . . . . . . . . . . . . 15,230 12,432 2,605
Investing activities:Purchase of property, plant and equipment . . . . . . . . . . . . . . . . . . . . . . . . . . (5,263) (1,655) (3,243)Proceeds from disposal of property, plant and equipment . . . . . . . . . . . . . . . 32 37 5Purchase of investments . . . . . . . . . . . . . . . . . . . . . . . . . . . . . . . . . . . . . . . . . (109,494) (83,984) (32,896)Redemption of investments at maturity . . . . . . . . . . . . . . . . . . . . . . . . . . . . . 108,000 73,000 39,920Acquisition of Energy Steel & Supply Co. (See Note 2) . . . . . . . . . . . . . . . . — — 384
Net cash (used) provided by investing activities . . . . . . . . . . . . . . . . . . . . . . (6,725) (12,602) 4,170
Financing activities:Principal repayments on capital lease obligations . . . . . . . . . . . . . . . . . . . . . (88) (85) (81)Issuance of common stock . . . . . . . . . . . . . . . . . . . . . . . . . . . . . . . . . . . . . . . 581 83 386Dividends paid . . . . . . . . . . . . . . . . . . . . . . . . . . . . . . . . . . . . . . . . . . . . . . . . (1,308) (899) (793)Purchase of treasury stock . . . . . . . . . . . . . . . . . . . . . . . . . . . . . . . . . . . . . . . — — (221)Excess tax deduction on stock awards . . . . . . . . . . . . . . . . . . . . . . . . . . . . . . 271 43 247Payment of contingent earn-out . . . . . . . . . . . . . . . . . . . . . . . . . . . . . . . . . . . — — (746)
Net cash used by financing activities . . . . . . . . . . . . . . . . . . . . . . . . . . . . . . . (544) (858) (1,208)
Effect of exchange rate changes on cash . . . . . . . . . . . . . . . . . . . . . . . . . . . . (9) 33 57
Net increase (decrease) in cash and cash equivalents . . . . . . . . . . . . . . . . . . 7,952 (995) 5,624Cash and cash equivalents at beginning of year . . . . . . . . . . . . . . . . . . . . . . . 24,194 25,189 19,565
Cash and cash equivalents at end of year . . . . . . . . . . . . . . . . . . . . . . . . . . . . $ 32,146 $ 24,194 $ 25,189
See Notes to Consolidated Financial Statements.
38
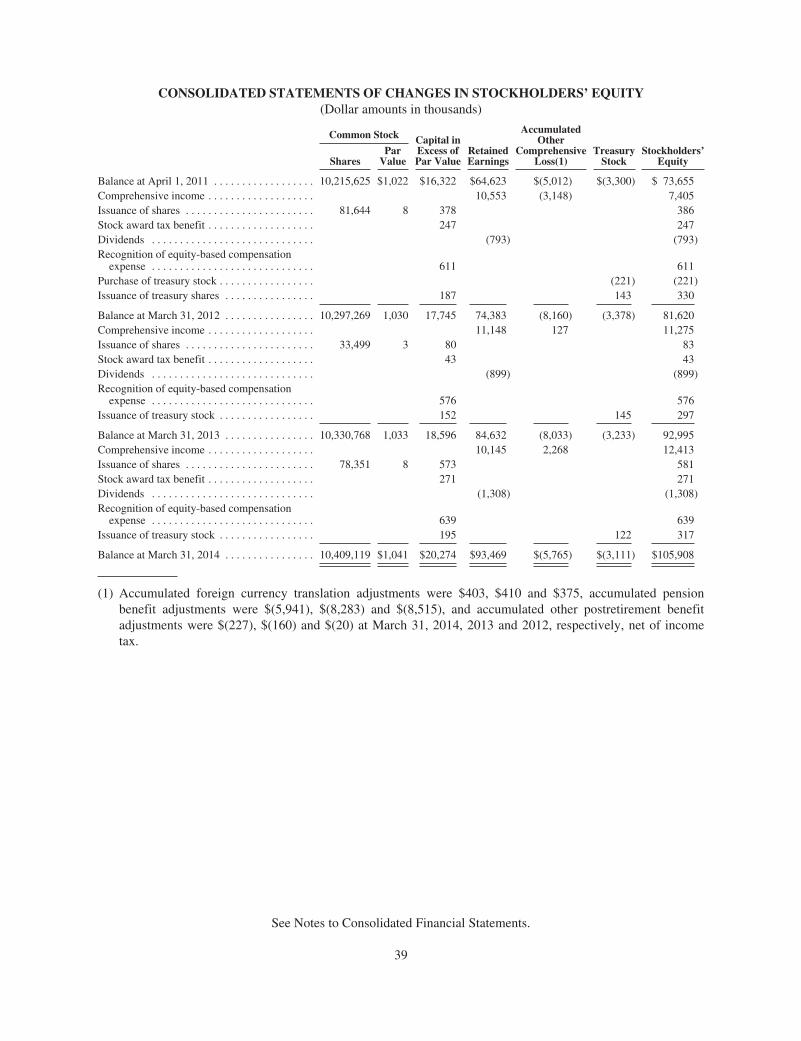
CONSOLIDATED STATEMENTS OF CHANGES IN STOCKHOLDERS’ EQUITY(Dollar amounts in thousands)
Common Stock Capital inExcess ofPar Value
RetainedEarnings
AccumulatedOther
ComprehensiveLoss(1)
TreasuryStock
Stockholders’EquityShares
ParValue
Balance at April 1, 2011 . . . . . . . . . . . . . . . . . . 10,215,625 $1,022 $16,322 $64,623 $(5,012) $(3,300) $ 73,655Comprehensive income . . . . . . . . . . . . . . . . . . . 10,553 (3,148) 7,405Issuance of shares . . . . . . . . . . . . . . . . . . . . . . . 81,644 8 378 386Stock award tax benefit . . . . . . . . . . . . . . . . . . . 247 247Dividends . . . . . . . . . . . . . . . . . . . . . . . . . . . . . (793) (793)Recognition of equity-based compensation
expense . . . . . . . . . . . . . . . . . . . . . . . . . . . . . 611 611Purchase of treasury stock . . . . . . . . . . . . . . . . . (221) (221)Issuance of treasury shares . . . . . . . . . . . . . . . . 187 143 330
Balance at March 31, 2012 . . . . . . . . . . . . . . . . 10,297,269 1,030 17,745 74,383 (8,160) (3,378) 81,620Comprehensive income . . . . . . . . . . . . . . . . . . . 11,148 127 11,275Issuance of shares . . . . . . . . . . . . . . . . . . . . . . . 33,499 3 80 83Stock award tax benefit . . . . . . . . . . . . . . . . . . . 43 43Dividends . . . . . . . . . . . . . . . . . . . . . . . . . . . . . (899) (899)Recognition of equity-based compensation
expense . . . . . . . . . . . . . . . . . . . . . . . . . . . . . 576 576Issuance of treasury stock . . . . . . . . . . . . . . . . . 152 145 297
Balance at March 31, 2013 . . . . . . . . . . . . . . . . 10,330,768 1,033 18,596 84,632 (8,033) (3,233) 92,995Comprehensive income . . . . . . . . . . . . . . . . . . . 10,145 2,268 12,413Issuance of shares . . . . . . . . . . . . . . . . . . . . . . . 78,351 8 573 581Stock award tax benefit . . . . . . . . . . . . . . . . . . . 271 271Dividends . . . . . . . . . . . . . . . . . . . . . . . . . . . . . (1,308) (1,308)Recognition of equity-based compensation
expense . . . . . . . . . . . . . . . . . . . . . . . . . . . . . 639 639Issuance of treasury stock . . . . . . . . . . . . . . . . . 195 122 317
Balance at March 31, 2014 . . . . . . . . . . . . . . . . 10,409,119 $1,041 $20,274 $93,469 $(5,765) $(3,111) $105,908
(1) Accumulated foreign currency translation adjustments were $403, $410 and $375, accumulated pensionbenefit adjustments were $(5,941), $(8,283) and $(8,515), and accumulated other postretirement benefitadjustments were $(227), $(160) and $(20) at March 31, 2014, 2013 and 2012, respectively, net of incometax.
See Notes to Consolidated Financial Statements.
39
NOTES TO CONSOLIDATED FINANCIAL STATEMENTS
(Amounts in thousands, except per share data)
Note 1 — The Company and Its Accounting Policies:
Graham Corporation (the “Company”), and its operating subsidiaries, is a global designer, manufacturer andsupplier of vacuum and heat transfer equipment used in the chemical, petrochemical, petroleum refining, andelectric power generating industries. Energy Steel & Supply Co. (“Energy Steel”), a wholly-owned subsidiary, isa nuclear code accredited fabrication and specialty machining company which provides products to the nuclearindustry. The Company’s significant accounting policies are set forth below.
The Company’s fiscal years ended March 31, 2014, 2013 and 2012 are referred to as fiscal 2014, fiscal 2013and fiscal 2012, respectively.
Principles of consolidation and use of estimates in the preparation of financial statements
The consolidated financial statements include the accounts of the Company and its wholly-owned sub-sidiaries, Energy Steel, located in Lapeer, Michigan, and Graham Vacuum and Heat Transfer Technology(Suzhou) Co., Ltd., located in China. All intercompany balances, transactions and profits are eliminated in con-solidation.
The preparation of consolidated financial statements in conformity with accounting principles generallyaccepted in the U.S. (“GAAP”) requires management to make estimates and assumptions that affect the reportedamounts of assets and liabilities and disclosure of contingent assets and liabilities at the date of the financialstatements, as well as the related revenues and expenses during the reporting period. Actual amounts could differfrom those estimated.
Translation of foreign currencies
Assets and liabilities of the Company’s foreign subsidiary are translated into U.S. dollars at currencyexchange rates in effect at year-end and revenues and expenses are translated at average exchange rates in effectfor the year. Gains and losses resulting from foreign currency transactions are included in results of operations.The Company’s sales and purchases in foreign currencies are minimal. Therefore, foreign currency transactiongains and losses are not significant. Gains and losses resulting from translation of foreign subsidiary balancesheets are included in a separate component of stockholders’ equity. Translation adjustments are not adjusted forincome taxes since they relate to an investment, which is permanent in nature.
Revenue recognition
Percentage-of-Completion Method
The Company recognizes revenue on all contracts with a planned manufacturing process in excess of fourweeks (which approximates 575 direct labor hours) using the percentage-of-completion method. The majority ofthe Company’s revenue is recognized under this methodology. The Company has established the systems andprocedures essential to developing the estimates required to account for contracts using the percentage-of-completion method. The percentage-of-completion method is determined by comparing actual labor incurred to aspecific date to management’s estimate of the total labor to be incurred on each contract.
Contracts in progress are reviewed monthly, and sales and earnings are adjusted in current accounting peri-ods based on revisions in the contract value and estimated costs at completion. Losses on contracts are recog-nized immediately when evident to management. Revenue recognized on contracts accounted for utilizingpercentage-of-completion are presented in net sales in the Consolidated Statement of Operations and unbilledrevenue in the Consolidated Balance Sheets to the extent that the revenue recognized exceeds the amounts billedto customers. See “Inventories” below.
40
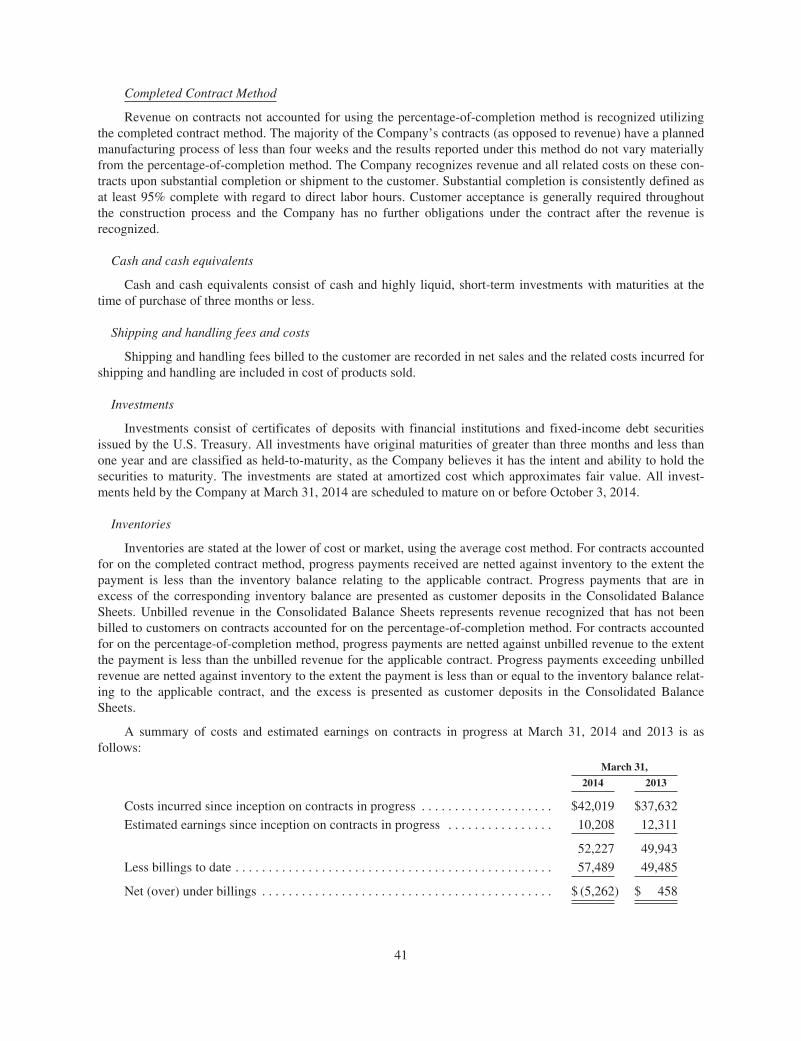
Completed Contract Method
Revenue on contracts not accounted for using the percentage-of-completion method is recognized utilizingthe completed contract method. The majority of the Company’s contracts (as opposed to revenue) have a plannedmanufacturing process of less than four weeks and the results reported under this method do not vary materiallyfrom the percentage-of-completion method. The Company recognizes revenue and all related costs on these con-tracts upon substantial completion or shipment to the customer. Substantial completion is consistently defined asat least 95% complete with regard to direct labor hours. Customer acceptance is generally required throughoutthe construction process and the Company has no further obligations under the contract after the revenue isrecognized.
Cash and cash equivalents
Cash and cash equivalents consist of cash and highly liquid, short-term investments with maturities at thetime of purchase of three months or less.
Shipping and handling fees and costs
Shipping and handling fees billed to the customer are recorded in net sales and the related costs incurred forshipping and handling are included in cost of products sold.
Investments
Investments consist of certificates of deposits with financial institutions and fixed-income debt securitiesissued by the U.S. Treasury. All investments have original maturities of greater than three months and less thanone year and are classified as held-to-maturity, as the Company believes it has the intent and ability to hold thesecurities to maturity. The investments are stated at amortized cost which approximates fair value. All invest-ments held by the Company at March 31, 2014 are scheduled to mature on or before October 3, 2014.
Inventories
Inventories are stated at the lower of cost or market, using the average cost method. For contracts accountedfor on the completed contract method, progress payments received are netted against inventory to the extent thepayment is less than the inventory balance relating to the applicable contract. Progress payments that are inexcess of the corresponding inventory balance are presented as customer deposits in the Consolidated BalanceSheets. Unbilled revenue in the Consolidated Balance Sheets represents revenue recognized that has not beenbilled to customers on contracts accounted for on the percentage-of-completion method. For contracts accountedfor on the percentage-of-completion method, progress payments are netted against unbilled revenue to the extentthe payment is less than the unbilled revenue for the applicable contract. Progress payments exceeding unbilledrevenue are netted against inventory to the extent the payment is less than or equal to the inventory balance relat-ing to the applicable contract, and the excess is presented as customer deposits in the Consolidated BalanceSheets.
A summary of costs and estimated earnings on contracts in progress at March 31, 2014 and 2013 is asfollows:
March 31,
2014 2013
Costs incurred since inception on contracts in progress . . . . . . . . . . . . . . . . . . . . $42,019 $37,632
Estimated earnings since inception on contracts in progress . . . . . . . . . . . . . . . . 10,208 12,311
52,227 49,943
Less billings to date . . . . . . . . . . . . . . . . . . . . . . . . . . . . . . . . . . . . . . . . . . . . . . . . 57,489 49,485
Net (over) under billings . . . . . . . . . . . . . . . . . . . . . . . . . . . . . . . . . . . . . . . . . . . . $ (5,262) $ 458
41
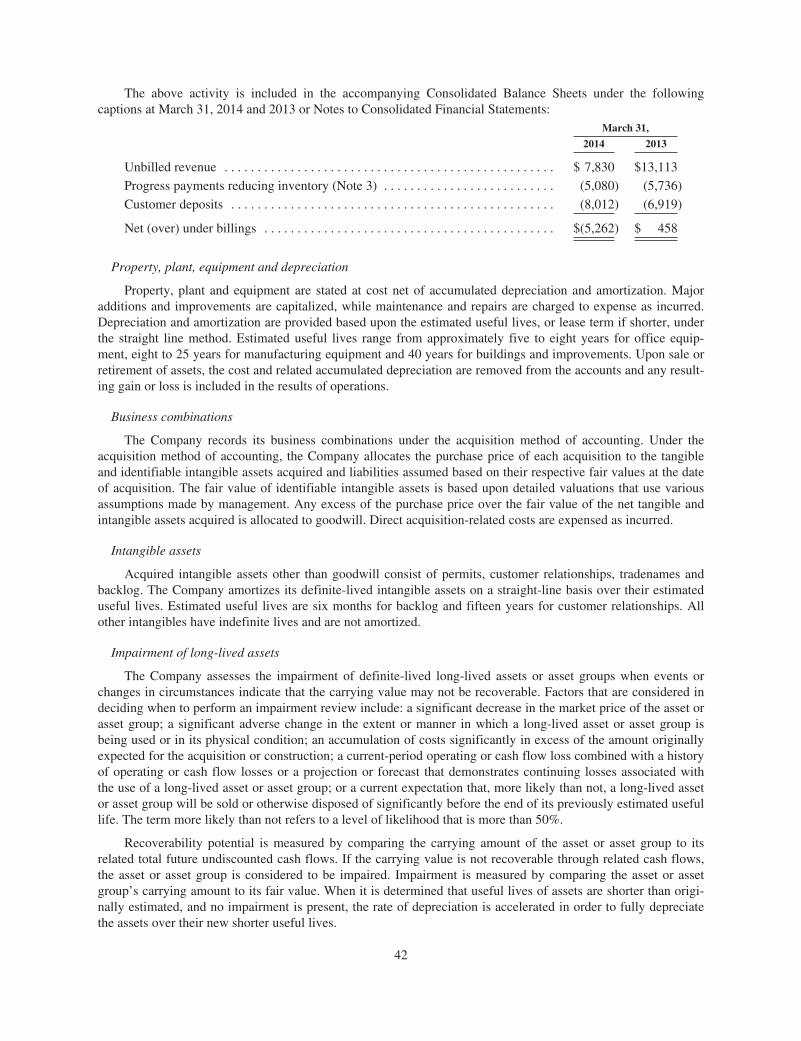
The above activity is included in the accompanying Consolidated Balance Sheets under the followingcaptions at March 31, 2014 and 2013 or Notes to Consolidated Financial Statements:
March 31,
2014 2013
Unbilled revenue . . . . . . . . . . . . . . . . . . . . . . . . . . . . . . . . . . . . . . . . . . . . . . . . . . $ 7,830 $13,113
Progress payments reducing inventory (Note 3) . . . . . . . . . . . . . . . . . . . . . . . . . . (5,080) (5,736)
Customer deposits . . . . . . . . . . . . . . . . . . . . . . . . . . . . . . . . . . . . . . . . . . . . . . . . . (8,012) (6,919)
Net (over) under billings . . . . . . . . . . . . . . . . . . . . . . . . . . . . . . . . . . . . . . . . . . . . $(5,262) $ 458
Property, plant, equipment and depreciation
Property, plant and equipment are stated at cost net of accumulated depreciation and amortization. Majoradditions and improvements are capitalized, while maintenance and repairs are charged to expense as incurred.Depreciation and amortization are provided based upon the estimated useful lives, or lease term if shorter, underthe straight line method. Estimated useful lives range from approximately five to eight years for office equip-ment, eight to 25 years for manufacturing equipment and 40 years for buildings and improvements. Upon sale orretirement of assets, the cost and related accumulated depreciation are removed from the accounts and any result-ing gain or loss is included in the results of operations.
Business combinations
The Company records its business combinations under the acquisition method of accounting. Under theacquisition method of accounting, the Company allocates the purchase price of each acquisition to the tangibleand identifiable intangible assets acquired and liabilities assumed based on their respective fair values at the dateof acquisition. The fair value of identifiable intangible assets is based upon detailed valuations that use variousassumptions made by management. Any excess of the purchase price over the fair value of the net tangible andintangible assets acquired is allocated to goodwill. Direct acquisition-related costs are expensed as incurred.
Intangible assets
Acquired intangible assets other than goodwill consist of permits, customer relationships, tradenames andbacklog. The Company amortizes its definite-lived intangible assets on a straight-line basis over their estimateduseful lives. Estimated useful lives are six months for backlog and fifteen years for customer relationships. Allother intangibles have indefinite lives and are not amortized.
Impairment of long-lived assets
The Company assesses the impairment of definite-lived long-lived assets or asset groups when events orchanges in circumstances indicate that the carrying value may not be recoverable. Factors that are considered indeciding when to perform an impairment review include: a significant decrease in the market price of the asset orasset group; a significant adverse change in the extent or manner in which a long-lived asset or asset group isbeing used or in its physical condition; an accumulation of costs significantly in excess of the amount originallyexpected for the acquisition or construction; a current-period operating or cash flow loss combined with a historyof operating or cash flow losses or a projection or forecast that demonstrates continuing losses associated withthe use of a long-lived asset or asset group; or a current expectation that, more likely than not, a long-lived assetor asset group will be sold or otherwise disposed of significantly before the end of its previously estimated usefullife. The term more likely than not refers to a level of likelihood that is more than 50%.
Recoverability potential is measured by comparing the carrying amount of the asset or asset group to itsrelated total future undiscounted cash flows. If the carrying value is not recoverable through related cash flows,the asset or asset group is considered to be impaired. Impairment is measured by comparing the asset or assetgroup’s carrying amount to its fair value. When it is determined that useful lives of assets are shorter than origi-nally estimated, and no impairment is present, the rate of depreciation is accelerated in order to fully depreciatethe assets over their new shorter useful lives.
42
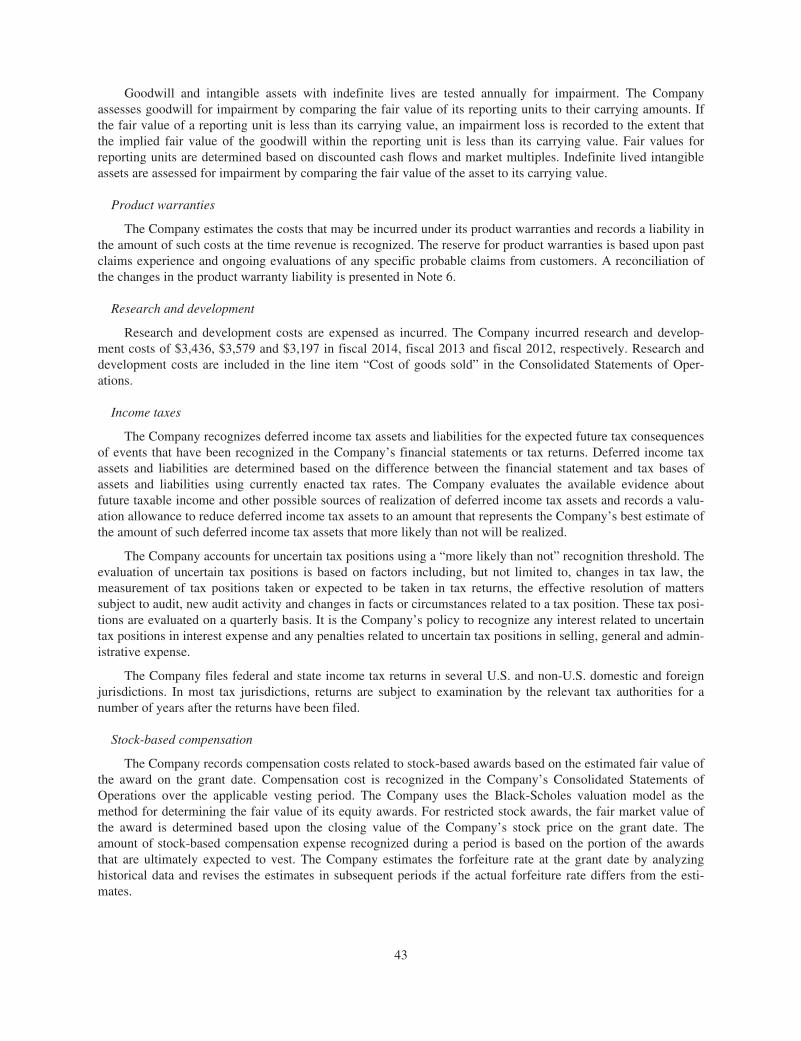
Goodwill and intangible assets with indefinite lives are tested annually for impairment. The Companyassesses goodwill for impairment by comparing the fair value of its reporting units to their carrying amounts. Ifthe fair value of a reporting unit is less than its carrying value, an impairment loss is recorded to the extent thatthe implied fair value of the goodwill within the reporting unit is less than its carrying value. Fair values forreporting units are determined based on discounted cash flows and market multiples. Indefinite lived intangibleassets are assessed for impairment by comparing the fair value of the asset to its carrying value.
Product warranties
The Company estimates the costs that may be incurred under its product warranties and records a liability inthe amount of such costs at the time revenue is recognized. The reserve for product warranties is based upon pastclaims experience and ongoing evaluations of any specific probable claims from customers. A reconciliation ofthe changes in the product warranty liability is presented in Note 6.
Research and development
Research and development costs are expensed as incurred. The Company incurred research and develop-ment costs of $3,436, $3,579 and $3,197 in fiscal 2014, fiscal 2013 and fiscal 2012, respectively. Research anddevelopment costs are included in the line item “Cost of goods sold” in the Consolidated Statements of Oper-ations.
Income taxes
The Company recognizes deferred income tax assets and liabilities for the expected future tax consequencesof events that have been recognized in the Company’s financial statements or tax returns. Deferred income taxassets and liabilities are determined based on the difference between the financial statement and tax bases ofassets and liabilities using currently enacted tax rates. The Company evaluates the available evidence aboutfuture taxable income and other possible sources of realization of deferred income tax assets and records a valu-ation allowance to reduce deferred income tax assets to an amount that represents the Company’s best estimate ofthe amount of such deferred income tax assets that more likely than not will be realized.
The Company accounts for uncertain tax positions using a “more likely than not” recognition threshold. Theevaluation of uncertain tax positions is based on factors including, but not limited to, changes in tax law, themeasurement of tax positions taken or expected to be taken in tax returns, the effective resolution of matterssubject to audit, new audit activity and changes in facts or circumstances related to a tax position. These tax posi-tions are evaluated on a quarterly basis. It is the Company’s policy to recognize any interest related to uncertaintax positions in interest expense and any penalties related to uncertain tax positions in selling, general and admin-istrative expense.
The Company files federal and state income tax returns in several U.S. and non-U.S. domestic and foreignjurisdictions. In most tax jurisdictions, returns are subject to examination by the relevant tax authorities for anumber of years after the returns have been filed.
Stock-based compensation
The Company records compensation costs related to stock-based awards based on the estimated fair value ofthe award on the grant date. Compensation cost is recognized in the Company’s Consolidated Statements ofOperations over the applicable vesting period. The Company uses the Black-Scholes valuation model as themethod for determining the fair value of its equity awards. For restricted stock awards, the fair market value ofthe award is determined based upon the closing value of the Company’s stock price on the grant date. Theamount of stock-based compensation expense recognized during a period is based on the portion of the awardsthat are ultimately expected to vest. The Company estimates the forfeiture rate at the grant date by analyzinghistorical data and revises the estimates in subsequent periods if the actual forfeiture rate differs from the esti-mates.
43
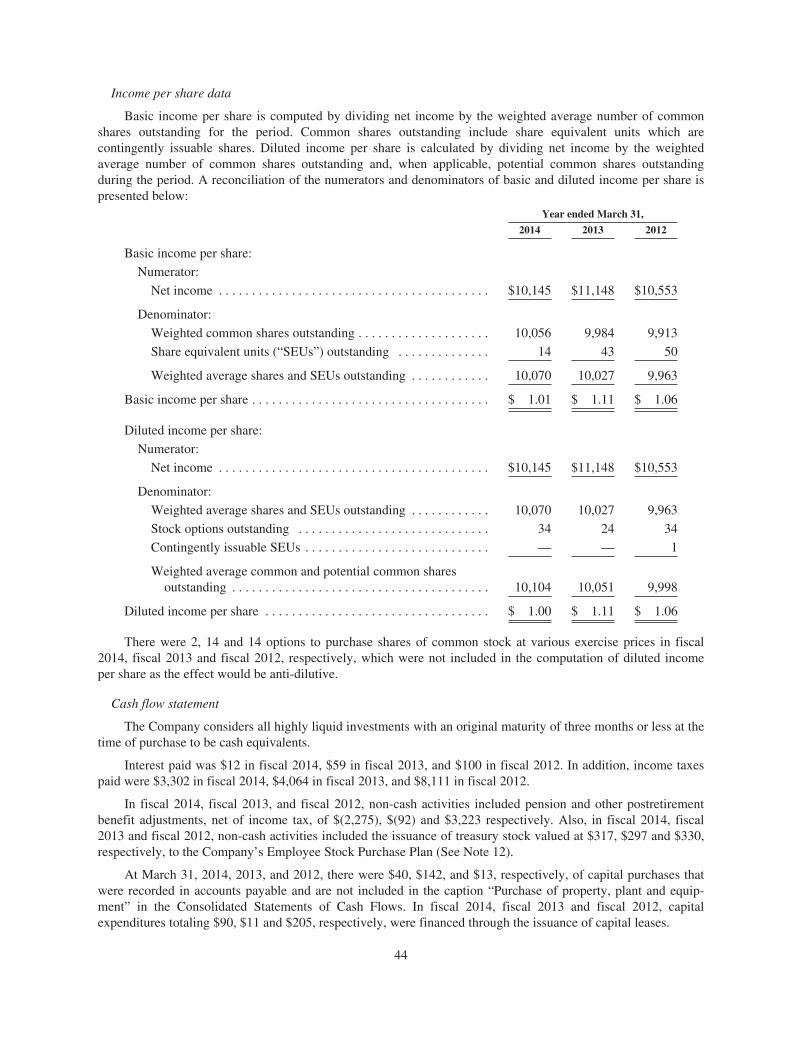
Income per share data
Basic income per share is computed by dividing net income by the weighted average number of commonshares outstanding for the period. Common shares outstanding include share equivalent units which arecontingently issuable shares. Diluted income per share is calculated by dividing net income by the weightedaverage number of common shares outstanding and, when applicable, potential common shares outstandingduring the period. A reconciliation of the numerators and denominators of basic and diluted income per share ispresented below:
Year ended March 31,
2014 2013 2012
Basic income per share:
Numerator:
Net income . . . . . . . . . . . . . . . . . . . . . . . . . . . . . . . . . . . . . . . . . $10,145 $11,148 $10,553
Denominator:
Weighted common shares outstanding . . . . . . . . . . . . . . . . . . . . 10,056 9,984 9,913
Share equivalent units (“SEUs”) outstanding . . . . . . . . . . . . . . 14 43 50
Weighted average shares and SEUs outstanding . . . . . . . . . . . . 10,070 10,027 9,963
Basic income per share . . . . . . . . . . . . . . . . . . . . . . . . . . . . . . . . . . . . $ 1.01 $ 1.11 $ 1.06
Diluted income per share:
Numerator:
Net income . . . . . . . . . . . . . . . . . . . . . . . . . . . . . . . . . . . . . . . . . $10,145 $11,148 $10,553
Denominator:
Weighted average shares and SEUs outstanding . . . . . . . . . . . . 10,070 10,027 9,963
Stock options outstanding . . . . . . . . . . . . . . . . . . . . . . . . . . . . . 34 24 34
Contingently issuable SEUs . . . . . . . . . . . . . . . . . . . . . . . . . . . . — — 1
Weighted average common and potential common sharesoutstanding . . . . . . . . . . . . . . . . . . . . . . . . . . . . . . . . . . . . . . . 10,104 10,051 9,998
Diluted income per share . . . . . . . . . . . . . . . . . . . . . . . . . . . . . . . . . . $ 1.00 $ 1.11 $ 1.06
There were 2, 14 and 14 options to purchase shares of common stock at various exercise prices in fiscal2014, fiscal 2013 and fiscal 2012, respectively, which were not included in the computation of diluted incomeper share as the effect would be anti-dilutive.
Cash flow statement
The Company considers all highly liquid investments with an original maturity of three months or less at thetime of purchase to be cash equivalents.
Interest paid was $12 in fiscal 2014, $59 in fiscal 2013, and $100 in fiscal 2012. In addition, income taxespaid were $3,302 in fiscal 2014, $4,064 in fiscal 2013, and $8,111 in fiscal 2012.
In fiscal 2014, fiscal 2013, and fiscal 2012, non-cash activities included pension and other postretirementbenefit adjustments, net of income tax, of $(2,275), $(92) and $3,223 respectively. Also, in fiscal 2014, fiscal2013 and fiscal 2012, non-cash activities included the issuance of treasury stock valued at $317, $297 and $330,respectively, to the Company’s Employee Stock Purchase Plan (See Note 12).
At March 31, 2014, 2013, and 2012, there were $40, $142, and $13, respectively, of capital purchases thatwere recorded in accounts payable and are not included in the caption “Purchase of property, plant and equip-ment” in the Consolidated Statements of Cash Flows. In fiscal 2014, fiscal 2013 and fiscal 2012, capitalexpenditures totaling $90, $11 and $205, respectively, were financed through the issuance of capital leases.
44
Accumulated other comprehensive income (loss)
Comprehensive income is comprised of net income and other comprehensive income or loss items, whichare accumulated as a separate component of stockholders’ equity. For the Company, other comprehensiveincome or loss items include a foreign currency translation adjustment and pension and other postretirementbenefit adjustments.
Fair value measurements
Fair value is defined as the price that would be received to sell an asset or paid to transfer a liability (i.e. the“exit price”) in an orderly transaction between market participants at the measurement date. The accountingstandards for fair value establishes a hierarchy for inputs used in measuring fair value that maximizes the use ofobservable inputs and minimizes the use of unobservable inputs by requiring that the most observable inputs beused when available. Observable inputs are inputs that market participants would use in pricing the asset orliability developed based on market data obtained from sources independent of the Company. Unobservableinputs are inputs that reflect the Company’s assumptions about the assumptions market participants would use inpricing the asset or liability developed based on the best information available in the circumstances. The hier-archy is broken down into three levels based on the reliability of inputs as follows:
Level 1 — Valuations based on quoted prices in active markets for identical assets or liabilities that theCompany has the ability to access. Since valuations are based on quoted prices that are readily and regularlyavailable in an active market, valuation of these products does not entail a significant degree of judgment.
Level 2 — Valuation is determined from quoted prices for similar assets or liabilities in active markets,quoted prices for identical instruments in markets that are not active or by model-based techniques in whichall significant inputs are observable in the market.
Level 3 — Valuations based on inputs that are unobservable and significant to the overall fair valuemeasurement. The degree of judgment exercised in determining fair value is greatest for instruments catego-rized in Level 3.
The availability of observable inputs can vary and is affected by a wide variety of factors, including, thetype of asset/liability, whether the asset/liability is established in the marketplace, and other characteristicsparticular to the transaction. To the extent that valuation is based on models or inputs that are less observable orunobservable in the market, the determination of fair value requires more judgment. In certain cases, the inputsused to measure fair value may fall into different levels of the fair value hierarchy. In such cases, for disclosurepurposes the level in the fair value hierarchy within which the fair value measurement in its entirety falls isdetermined based on the lowest level input that is significant to the fair value measurement in its entirety.
Fair value is a market-based measure considered from the perspective of a market participant rather than anentity-specific measure. Therefore, even when market assumptions are not readily available, assumptions arerequired to reflect those that market participants would use in pricing the asset or liability at the measurementdate.
Use of Estimates
The preparation of financial statements in conformity with GAAP requires management to make estimatesand assumptions that affect the reported amounts of assets and liabilities and disclosure of contingent assets andliabilities at the date of the financial statements and reported amounts of sales and expenses during the reportingperiod. Actual results could differ materially from those estimates.
Accounting and reporting changes
In the normal course of business, management evaluates all new accounting pronouncements issued by theFinancial Accounting Standards Board (“FASB”), the Securities and Exchange Commission (“SEC”), theEmerging Issues Task Force, the American Institute of Certified Public Accountants or any other authoritativeaccounting body to determine the potential impact they may have on the Company’s consolidated financialstatements.
45
In July 2012, the FASB amended its guidance related to periodic testing of indefinite-lived intangible assetsfor impairment. The amended guidance provided an entity with the option to make a qualitative assessment aboutthe likelihood that an indefinite-lived intangible asset is impaired to determine whether it should perform aquantitative impairment test. The guidance also enhanced the consistency of impairment testing among long-lived asset categories by permitting an entity to assess qualitative factors to determine whether it is necessary tocalculate the asset’s fair value when testing an indefinite-lived intangible asset for impairment, which is equiv-alent to the impairment testing requirements for other long-lived assets. In accordance with the guidance, anentity has an option not to calculate annually the fair value of an indefinite-lived intangible asset if the entitydetermines that it is not more-likely-than-not that the asset is impaired. The provisions of the amended guidancewere effective for annual and interim impairment tests performed for fiscal years beginning after September 15,2012. The Company did not elect the option to perform a qualitative assessment for impairment testing. There-fore, the adoption of the amended guidance did not have an impact on the Company’s consolidated financialstatements.
In February 2013, the FASB issued guidance related to the disclosure of amounts reclassified out of accumu-lated other comprehensive income (“AOCI”). This guidance added new disclosure requirements either in a singlenote or parenthetically on the face of the financial statements, the effect of significant amounts reclassified fromeach component of AOCI based on its source and the income statement line items affected by the reclassification.This guidance gave companies the flexibility to present the information either in the notes or parenthetically onthe face of the financial statements provided that all of the required information is presented in a single location.This guidance was effective prospectively for annual and interim reporting periods beginning after December 15,2012. The adoption of this guidance did not have a material impact on the Company’s consolidated financialstatements as it only changed the disclosures surrounding AOCI. (See Note 13).
Management does not expect any other recently issued accounting pronouncements, which have not alreadybeen adopted, to have a material impact on the Company’s consolidated financial statements.
Note 2 — Acquisition:
On December 14, 2010, the Company acquired Energy Steel, a nuclear code accredited fabrication and spe-cialty machining company located in Lapeer, Michigan dedicated primarily to the nuclear power industry.
This transaction was accounted for under the acquisition method of accounting. Accordingly, the results ofEnergy Steel were included in the Company’s Consolidated Financial Statements from the date of acquisition.The purchase price was $17,899 in cash, subject to the adjustments described below. Acquisition-related costs of$676 were expensed in fiscal 2011 and were included in selling, general and administrative expenses in theConsolidated Statement of Operations. During fiscal 2012, the Company received $384 from the seller due to areduction in purchase price based upon the final determination of the working capital acquired in accordancewith the purchase agreement.
The purchase agreement also included a contingent earn-out, which ranged from $0 to $2,000, dependentupon Energy Steel’s earnings performance in calendar years 2011 and 2012. In fiscal 2012, $1,000 of the earn-out was paid. Energy Steel did not achieve the earnings performance requirements in calendar year 2012. There-fore, the liability recorded for the remaining contingent earn-out of $975 was reversed. The ConsolidatedStatements of Operations for fiscal 2013 and fiscal 2012 include $(975) and $230 in selling, general and admin-istrative expense and $44 and $204 in interest expense, respectively, for adjustments related to the contingentearn-out liability.
Also on December 14, 2010, the Company and Energy Steel entered into a five-year lease agreement withESSC Investments, LLC for Energy Steel’s manufacturing and office facilities located in Lapeer, Michigan,which lease includes an option to renew for an additional five year term. ESSC Investments, LLC is partly ownedby the former sole shareholder of Energy Steel.
46
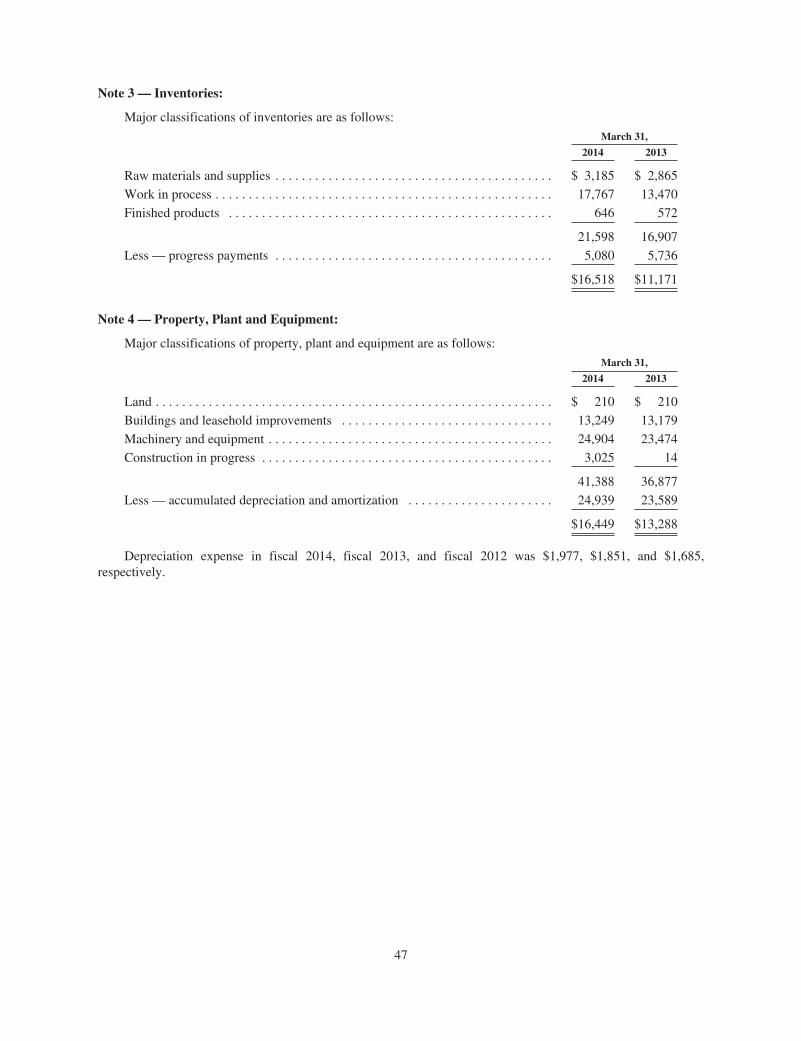
Note 3 — Inventories:
Major classifications of inventories are as follows:
March 31,
2014 2013
Raw materials and supplies . . . . . . . . . . . . . . . . . . . . . . . . . . . . . . . . . . . . . . . . . . $ 3,185 $ 2,865
Work in process . . . . . . . . . . . . . . . . . . . . . . . . . . . . . . . . . . . . . . . . . . . . . . . . . . . 17,767 13,470
Finished products . . . . . . . . . . . . . . . . . . . . . . . . . . . . . . . . . . . . . . . . . . . . . . . . . 646 572
21,598 16,907
Less — progress payments . . . . . . . . . . . . . . . . . . . . . . . . . . . . . . . . . . . . . . . . . . 5,080 5,736
$16,518 $11,171
Note 4 — Property, Plant and Equipment:
Major classifications of property, plant and equipment are as follows:
March 31,
2014 2013
Land . . . . . . . . . . . . . . . . . . . . . . . . . . . . . . . . . . . . . . . . . . . . . . . . . . . . . . . . . . . . $ 210 $ 210
Buildings and leasehold improvements . . . . . . . . . . . . . . . . . . . . . . . . . . . . . . . . 13,249 13,179
Machinery and equipment . . . . . . . . . . . . . . . . . . . . . . . . . . . . . . . . . . . . . . . . . . . 24,904 23,474
Construction in progress . . . . . . . . . . . . . . . . . . . . . . . . . . . . . . . . . . . . . . . . . . . . 3,025 14
41,388 36,877
Less — accumulated depreciation and amortization . . . . . . . . . . . . . . . . . . . . . . 24,939 23,589
$16,449 $13,288
Depreciation expense in fiscal 2014, fiscal 2013, and fiscal 2012 was $1,977, $1,851, and $1,685,respectively.
47
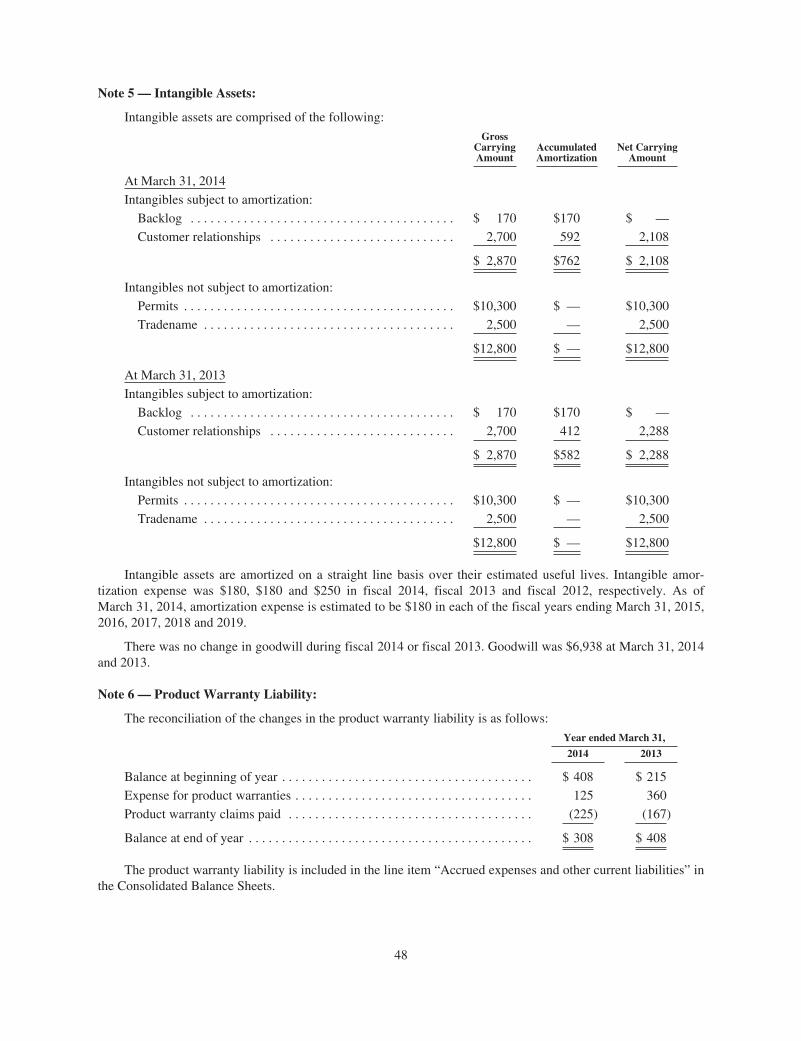
Note 5 — Intangible Assets:
Intangible assets are comprised of the following:
GrossCarryingAmount
AccumulatedAmortization
Net CarryingAmount
At March 31, 2014
Intangibles subject to amortization:
Backlog . . . . . . . . . . . . . . . . . . . . . . . . . . . . . . . . . . . . . . . . $ 170 $170 $ —
Customer relationships . . . . . . . . . . . . . . . . . . . . . . . . . . . . 2,700 592 2,108
$ 2,870 $762 $ 2,108
Intangibles not subject to amortization:
Permits . . . . . . . . . . . . . . . . . . . . . . . . . . . . . . . . . . . . . . . . . $10,300 $ — $10,300
Tradename . . . . . . . . . . . . . . . . . . . . . . . . . . . . . . . . . . . . . . 2,500 — 2,500
$12,800 $ — $12,800
At March 31, 2013
Intangibles subject to amortization:
Backlog . . . . . . . . . . . . . . . . . . . . . . . . . . . . . . . . . . . . . . . . $ 170 $170 $ —
Customer relationships . . . . . . . . . . . . . . . . . . . . . . . . . . . . 2,700 412 2,288
$ 2,870 $582 $ 2,288
Intangibles not subject to amortization:
Permits . . . . . . . . . . . . . . . . . . . . . . . . . . . . . . . . . . . . . . . . . $10,300 $ — $10,300
Tradename . . . . . . . . . . . . . . . . . . . . . . . . . . . . . . . . . . . . . . 2,500 — 2,500
$12,800 $ — $12,800
Intangible assets are amortized on a straight line basis over their estimated useful lives. Intangible amor-tization expense was $180, $180 and $250 in fiscal 2014, fiscal 2013 and fiscal 2012, respectively. As ofMarch 31, 2014, amortization expense is estimated to be $180 in each of the fiscal years ending March 31, 2015,2016, 2017, 2018 and 2019.
There was no change in goodwill during fiscal 2014 or fiscal 2013. Goodwill was $6,938 at March 31, 2014and 2013.
Note 6 — Product Warranty Liability:
The reconciliation of the changes in the product warranty liability is as follows:
Year ended March 31,
2014 2013
Balance at beginning of year . . . . . . . . . . . . . . . . . . . . . . . . . . . . . . . . . . . . . . $ 408 $ 215
Expense for product warranties . . . . . . . . . . . . . . . . . . . . . . . . . . . . . . . . . . . . 125 360
Product warranty claims paid . . . . . . . . . . . . . . . . . . . . . . . . . . . . . . . . . . . . . (225) (167)
Balance at end of year . . . . . . . . . . . . . . . . . . . . . . . . . . . . . . . . . . . . . . . . . . . $ 308 $ 408
The product warranty liability is included in the line item “Accrued expenses and other current liabilities” inthe Consolidated Balance Sheets.
48
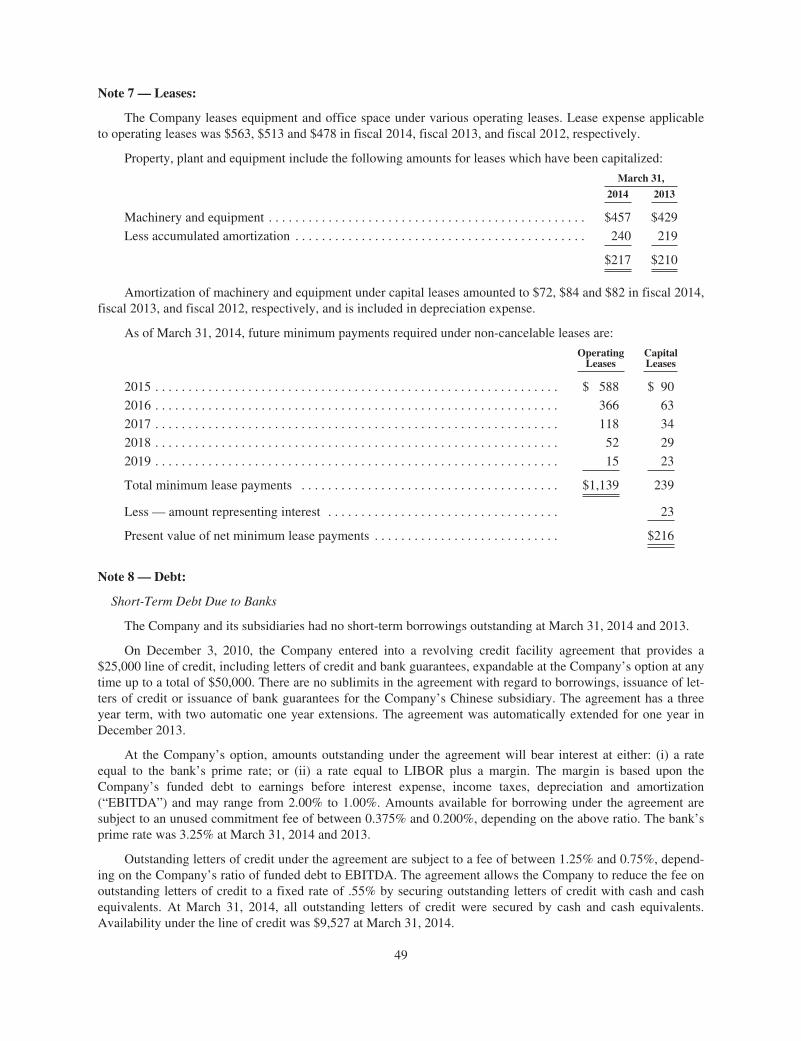
Note 7 — Leases:
The Company leases equipment and office space under various operating leases. Lease expense applicableto operating leases was $563, $513 and $478 in fiscal 2014, fiscal 2013, and fiscal 2012, respectively.
Property, plant and equipment include the following amounts for leases which have been capitalized:
March 31,
2014 2013
Machinery and equipment . . . . . . . . . . . . . . . . . . . . . . . . . . . . . . . . . . . . . . . . . . . . . . . . $457 $429
Less accumulated amortization . . . . . . . . . . . . . . . . . . . . . . . . . . . . . . . . . . . . . . . . . . . . 240 219
$217 $210
Amortization of machinery and equipment under capital leases amounted to $72, $84 and $82 in fiscal 2014,fiscal 2013, and fiscal 2012, respectively, and is included in depreciation expense.
As of March 31, 2014, future minimum payments required under non-cancelable leases are:
OperatingLeases
CapitalLeases
2015 . . . . . . . . . . . . . . . . . . . . . . . . . . . . . . . . . . . . . . . . . . . . . . . . . . . . . . . . . . . . . $ 588 $ 90
2016 . . . . . . . . . . . . . . . . . . . . . . . . . . . . . . . . . . . . . . . . . . . . . . . . . . . . . . . . . . . . . 366 63
2017 . . . . . . . . . . . . . . . . . . . . . . . . . . . . . . . . . . . . . . . . . . . . . . . . . . . . . . . . . . . . . 118 34
2018 . . . . . . . . . . . . . . . . . . . . . . . . . . . . . . . . . . . . . . . . . . . . . . . . . . . . . . . . . . . . . 52 29
2019 . . . . . . . . . . . . . . . . . . . . . . . . . . . . . . . . . . . . . . . . . . . . . . . . . . . . . . . . . . . . . 15 23
Total minimum lease payments . . . . . . . . . . . . . . . . . . . . . . . . . . . . . . . . . . . . . . . $1,139 239
Less — amount representing interest . . . . . . . . . . . . . . . . . . . . . . . . . . . . . . . . . . . 23
Present value of net minimum lease payments . . . . . . . . . . . . . . . . . . . . . . . . . . . . $216
Note 8 — Debt:
Short-Term Debt Due to Banks
The Company and its subsidiaries had no short-term borrowings outstanding at March 31, 2014 and 2013.
On December 3, 2010, the Company entered into a revolving credit facility agreement that provides a$25,000 line of credit, including letters of credit and bank guarantees, expandable at the Company’s option at anytime up to a total of $50,000. There are no sublimits in the agreement with regard to borrowings, issuance of let-ters of credit or issuance of bank guarantees for the Company’s Chinese subsidiary. The agreement has a threeyear term, with two automatic one year extensions. The agreement was automatically extended for one year inDecember 2013.
At the Company’s option, amounts outstanding under the agreement will bear interest at either: (i) a rateequal to the bank’s prime rate; or (ii) a rate equal to LIBOR plus a margin. The margin is based upon theCompany’s funded debt to earnings before interest expense, income taxes, depreciation and amortization(“EBITDA”) and may range from 2.00% to 1.00%. Amounts available for borrowing under the agreement aresubject to an unused commitment fee of between 0.375% and 0.200%, depending on the above ratio. The bank’sprime rate was 3.25% at March 31, 2014 and 2013.
Outstanding letters of credit under the agreement are subject to a fee of between 1.25% and 0.75%, depend-ing on the Company’s ratio of funded debt to EBITDA. The agreement allows the Company to reduce the fee onoutstanding letters of credit to a fixed rate of .55% by securing outstanding letters of credit with cash and cashequivalents. At March 31, 2014, all outstanding letters of credit were secured by cash and cash equivalents.Availability under the line of credit was $9,527 at March 31, 2014.
49
Under the Company’s revolving credit facility, the Company covenants to maintain a maximum funded debtto EBITDA ratio, as defined in such credit facility, of 3.5 to 1.0 and a minimum earnings before interest expenseand income taxes (“EBIT”) to interest ratio, as defined in such credit facility, of 4.0 to 1.0. The agreement alsoprovides that the Company is permitted to pay dividends without limitation if it maintains a funded debt toEBITDA ratio equal to or less than 2.0 to 1.0 and permits the Company to pay dividends in an amount equal to25% of net income if it maintains a funded debt to EBITDA ratio of greater than 2.0 to 1.0. The Company was incompliance with all such provisions as of and for the year ended March 31, 2014. Assets with a book value of$104,451 have been pledged to secure borrowings under the credit facility.
On March 24, 2014, the Company entered into a letter of credit facility agreement to further support its inter-national operations. The agreement provides a $5,000 line of credit to be used for the issuance of letters of credit.Under the agreement, the Company incurs an annual facility fee of 0.375% of the maximum amount availableunder the facility and outstanding letters of credit are subject to a fee of between 1.25% and 0.75%, depending onthe Company’s ratio of funded debt to EBITDA, as defined in such credit facility. The facility requires theCompany to maintain a maximum funded debt to EBITDA ratio of 3.5 to 1.0 and a minimum EBIT to interestratio, as defined in such credit facility, of 4.0 to 1.0. Availability under the letter of credit facility was $5,000 atMarch 31, 2014.
Long-Term Debt
The Company and its subsidiaries had long-term capital lease obligations outstanding as follows:March 31,
2014 2013
Capital lease obligations (Note 7) . . . . . . . . . . . . . . . . . . . . . . . . . . . . . . . . . . . . . . . . . . $216 $214
Less: current amounts . . . . . . . . . . . . . . . . . . . . . . . . . . . . . . . . . . . . . . . . . . . . . . . . . . . 80 87
Total . . . . . . . . . . . . . . . . . . . . . . . . . . . . . . . . . . . . . . . . . . . . . . . . . . . . . . . . . . . . . . $136 $127
With the exception of capital leases, there are no long-term debt payment requirements over the next fiveyears as of March 31, 2014.
Note 9 — Financial Instruments and Derivative Financial Instruments:
Concentrations of Credit Risk
Financial instruments that potentially subject the Company to concentrations of credit risk consist princi-pally of cash, cash equivalents, investments, and trade accounts receivable. The Company places its cash, cashequivalents, and investments with high credit quality financial institutions, and evaluates the credit worthiness ofthese financial institutions on a regular basis. Concentrations of credit risk with respect to trade accounts receiv-able are limited due to the large number of customers comprising the Company’s customer base and their geo-graphic dispersion. At March 31, 2014 and 2013, the Company had no significant concentrations of credit risk.
At March 31, 2014, two customers comprised 13% and 12% of backlog. At March 31, 2013, two customerscomprised 21% and 12% of backlog.
Letters of Credit
The Company has entered into standby letter of credit agreements with financial institutions relating to theguarantee of future performance on certain contracts. At March 31, 2014 and 2013, the Company was con-tingently liable on outstanding standby letters of credit aggregating $15,473 and $12,354, respectively. (SeeNote 8).
Foreign Exchange Risk Management
The Company, as a result of its global operating and financial activities, is exposed to market risks fromchanges in foreign exchange rates. In seeking to minimize the risks and/or costs associated with such activities,the Company may utilize foreign exchange forward contracts with fixed dates of maturity and exchange rates.
50
The Company does not hold or issue financial instruments for trading or other speculative purposes and onlyholds contracts with high quality financial institutions. If the counter-parties to any such exchange contracts donot fulfill their obligations to deliver the contracted foreign currencies, the Company could be at risk for fluctua-tions, if any, required to settle the obligation. At March 31, 2014 and 2013, there were no foreign exchange for-ward contracts held by the Company.
Fair Value of Financial Instruments
The estimates of the fair value of financial instruments are summarized as follows:
Cash and cash equivalents: The carrying amount of cash and cash equivalents approximates fair value dueto the short-term maturity of these instruments and are considered Level 1 assets in the fair value hierarchy.
Investments: The fair value of investments at March 31, 2014 and 2013 approximated the carrying valueand are considered Level 2 assets in the fair value hierarchy.
Note 10 — Income Taxes:
An analysis of the components of income before income taxes is presented below:
Year ended March 31,
2014 2013 2012
United States . . . . . . . . . . . . . . . . . . . . . . . . . . . . . . . . . . . . . . . . . . . $14,127 $14,597 $16,708
China . . . . . . . . . . . . . . . . . . . . . . . . . . . . . . . . . . . . . . . . . . . . . . . . . 583 980 (31)
$14,710 $15,577 $16,677
The provision for income taxes related to income before income taxes consists of:
Year ended March 31,
2014 2013 2012
Current:
Federal . . . . . . . . . . . . . . . . . . . . . . . . . . . . . . . . . . . . . . . . . . . . . . . . $ 5,146 $ 6,721 $1,744
State . . . . . . . . . . . . . . . . . . . . . . . . . . . . . . . . . . . . . . . . . . . . . . . . . . 68 65 (19)
Foreign . . . . . . . . . . . . . . . . . . . . . . . . . . . . . . . . . . . . . . . . . . . . . . . . 362 — (14)
5,576 6,786 1,711
Deferred:
Federal . . . . . . . . . . . . . . . . . . . . . . . . . . . . . . . . . . . . . . . . . . . . . . . . (761) (2,538) 4,521
State . . . . . . . . . . . . . . . . . . . . . . . . . . . . . . . . . . . . . . . . . . . . . . . . . . (184) (223) (140)
Foreign . . . . . . . . . . . . . . . . . . . . . . . . . . . . . . . . . . . . . . . . . . . . . . . . (240) 260 18
Changes in valuation allowance . . . . . . . . . . . . . . . . . . . . . . . . . . . . 174 144 14
(1,011) (2,357) 4,413
Total provision for income taxes . . . . . . . . . . . . . . . . . . . . . . . . . . . . . . $ 4,565 $ 4,429 $6,124
51
The reconciliation of the provision calculated using the U.S. federal tax rate with the provision for incometaxes presented in the consolidated financial statements is as follows:
Year ended March 31,
2014 2013 2012
Provision for income taxes at federal rate . . . . . . . . . . . . . . . . . . . . . . . . $5,149 $5,452 $5,670
State taxes . . . . . . . . . . . . . . . . . . . . . . . . . . . . . . . . . . . . . . . . . . . . . . . . . (139) (173) (100)
Charges not deductible for income tax purposes . . . . . . . . . . . . . . . . . . . 59 78 281
Recognition of tax benefit generated by qualified production activitiesdeduction . . . . . . . . . . . . . . . . . . . . . . . . . . . . . . . . . . . . . . . . . . . . . . . (403) (417) (77)
Research and development tax credits . . . . . . . . . . . . . . . . . . . . . . . . . . . (80) (307) (134)
Valuation allowance . . . . . . . . . . . . . . . . . . . . . . . . . . . . . . . . . . . . . . . . . 174 144 14
Uncertain tax positions . . . . . . . . . . . . . . . . . . . . . . . . . . . . . . . . . . . . . . . (134) 90 428
Contingent earn-out . . . . . . . . . . . . . . . . . . . . . . . . . . . . . . . . . . . . . . . . . — (326) —
Other . . . . . . . . . . . . . . . . . . . . . . . . . . . . . . . . . . . . . . . . . . . . . . . . . . . . . (61) (112) 42
Provision for income taxes . . . . . . . . . . . . . . . . . . . . . . . . . . . . . . . . . . . . $4,565 $4,429 $6,124
The net deferred income tax liability recorded in the Consolidated Balance Sheets results from differencesbetween financial statement and tax reporting of income and deductions. A summary of the composition of theCompany’s net deferred income tax liability follows:
March 31,
2014 2013
Depreciation . . . . . . . . . . . . . . . . . . . . . . . . . . . . . . . . . . . . . . . . . . . . . . . . . . . . . . $(2,207) $(2,212)
Accrued compensation . . . . . . . . . . . . . . . . . . . . . . . . . . . . . . . . . . . . . . . . . . . . . . 201 200
Prepaid pension asset . . . . . . . . . . . . . . . . . . . . . . . . . . . . . . . . . . . . . . . . . . . . . . . (2,026) (831)
Accrued pension liability . . . . . . . . . . . . . . . . . . . . . . . . . . . . . . . . . . . . . . . . . . . . 105 90
Accrued postretirement benefits . . . . . . . . . . . . . . . . . . . . . . . . . . . . . . . . . . . . . . . 336 364
Compensated absences . . . . . . . . . . . . . . . . . . . . . . . . . . . . . . . . . . . . . . . . . . . . . . 584 584
Inventories . . . . . . . . . . . . . . . . . . . . . . . . . . . . . . . . . . . . . . . . . . . . . . . . . . . . . . . (101) (968)
Warranty liability . . . . . . . . . . . . . . . . . . . . . . . . . . . . . . . . . . . . . . . . . . . . . . . . . . 109 144
Accrued expenses . . . . . . . . . . . . . . . . . . . . . . . . . . . . . . . . . . . . . . . . . . . . . . . . . . 329 219
Stock-based compensation . . . . . . . . . . . . . . . . . . . . . . . . . . . . . . . . . . . . . . . . . . . 419 459
Intangible assets . . . . . . . . . . . . . . . . . . . . . . . . . . . . . . . . . . . . . . . . . . . . . . . . . . . (5,294) (5,353)
Net operating loss carryforwards . . . . . . . . . . . . . . . . . . . . . . . . . . . . . . . . . . . . . . — 151
New York State investment tax credit . . . . . . . . . . . . . . . . . . . . . . . . . . . . . . . . . . 738 564
Other . . . . . . . . . . . . . . . . . . . . . . . . . . . . . . . . . . . . . . . . . . . . . . . . . . . . . . . . . . . . 24 (132)
(6,783) (6,721)
Less: Valuation allowance . . . . . . . . . . . . . . . . . . . . . . . . . . . . . . . . . . . . . . . . . . . (738) (564)
Total . . . . . . . . . . . . . . . . . . . . . . . . . . . . . . . . . . . . . . . . . . . . . . . . . . . . . . . . . . $(7,521) $(7,285)
52
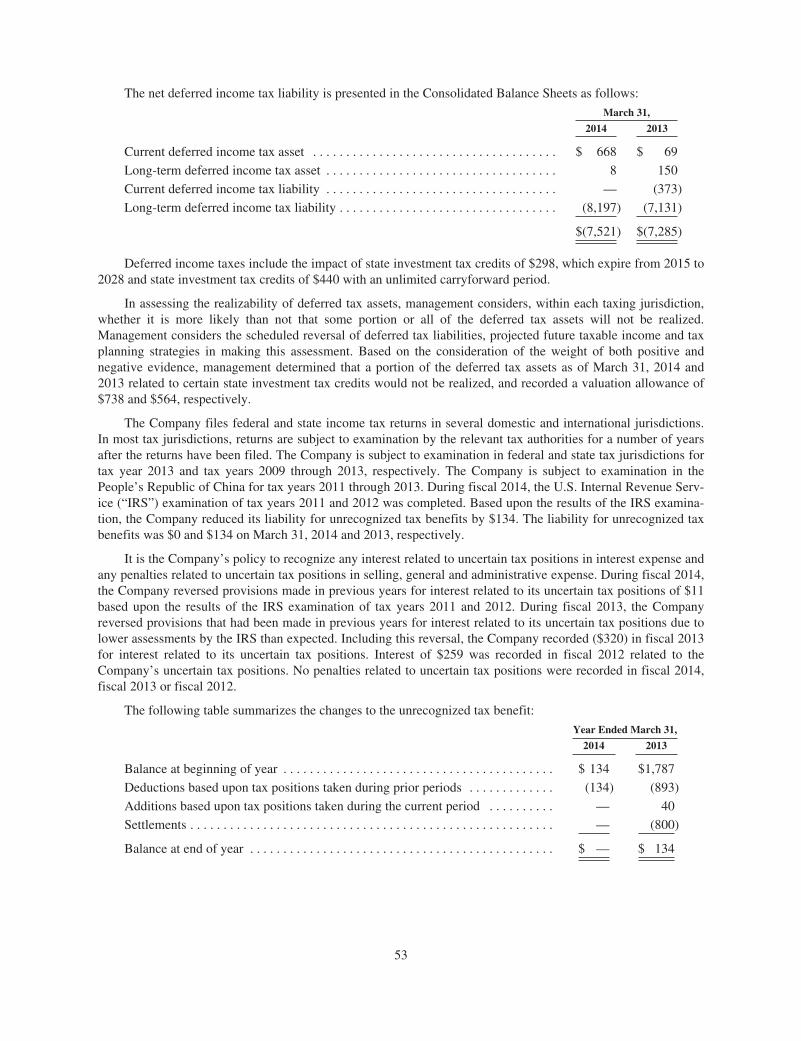
The net deferred income tax liability is presented in the Consolidated Balance Sheets as follows:
March 31,
2014 2013
Current deferred income tax asset . . . . . . . . . . . . . . . . . . . . . . . . . . . . . . . . . . . . . $ 668 $ 69
Long-term deferred income tax asset . . . . . . . . . . . . . . . . . . . . . . . . . . . . . . . . . . . 8 150
Current deferred income tax liability . . . . . . . . . . . . . . . . . . . . . . . . . . . . . . . . . . . — (373)
Long-term deferred income tax liability . . . . . . . . . . . . . . . . . . . . . . . . . . . . . . . . . (8,197) (7,131)
$(7,521) $(7,285)
Deferred income taxes include the impact of state investment tax credits of $298, which expire from 2015 to2028 and state investment tax credits of $440 with an unlimited carryforward period.
In assessing the realizability of deferred tax assets, management considers, within each taxing jurisdiction,whether it is more likely than not that some portion or all of the deferred tax assets will not be realized.Management considers the scheduled reversal of deferred tax liabilities, projected future taxable income and taxplanning strategies in making this assessment. Based on the consideration of the weight of both positive andnegative evidence, management determined that a portion of the deferred tax assets as of March 31, 2014 and2013 related to certain state investment tax credits would not be realized, and recorded a valuation allowance of$738 and $564, respectively.
The Company files federal and state income tax returns in several domestic and international jurisdictions.In most tax jurisdictions, returns are subject to examination by the relevant tax authorities for a number of yearsafter the returns have been filed. The Company is subject to examination in federal and state tax jurisdictions fortax year 2013 and tax years 2009 through 2013, respectively. The Company is subject to examination in thePeople’s Republic of China for tax years 2011 through 2013. During fiscal 2014, the U.S. Internal Revenue Serv-ice (“IRS”) examination of tax years 2011 and 2012 was completed. Based upon the results of the IRS examina-tion, the Company reduced its liability for unrecognized tax benefits by $134. The liability for unrecognized taxbenefits was $0 and $134 on March 31, 2014 and 2013, respectively.
It is the Company’s policy to recognize any interest related to uncertain tax positions in interest expense andany penalties related to uncertain tax positions in selling, general and administrative expense. During fiscal 2014,the Company reversed provisions made in previous years for interest related to its uncertain tax positions of $11based upon the results of the IRS examination of tax years 2011 and 2012. During fiscal 2013, the Companyreversed provisions that had been made in previous years for interest related to its uncertain tax positions due tolower assessments by the IRS than expected. Including this reversal, the Company recorded ($320) in fiscal 2013for interest related to its uncertain tax positions. Interest of $259 was recorded in fiscal 2012 related to theCompany’s uncertain tax positions. No penalties related to uncertain tax positions were recorded in fiscal 2014,fiscal 2013 or fiscal 2012.
The following table summarizes the changes to the unrecognized tax benefit:
Year Ended March 31,
2014 2013
Balance at beginning of year . . . . . . . . . . . . . . . . . . . . . . . . . . . . . . . . . . . . . . . . . $ 134 $1,787
Deductions based upon tax positions taken during prior periods . . . . . . . . . . . . . (134) (893)
Additions based upon tax positions taken during the current period . . . . . . . . . . — 40
Settlements . . . . . . . . . . . . . . . . . . . . . . . . . . . . . . . . . . . . . . . . . . . . . . . . . . . . . . . — (800)
Balance at end of year . . . . . . . . . . . . . . . . . . . . . . . . . . . . . . . . . . . . . . . . . . . . . . $ — $ 134
53
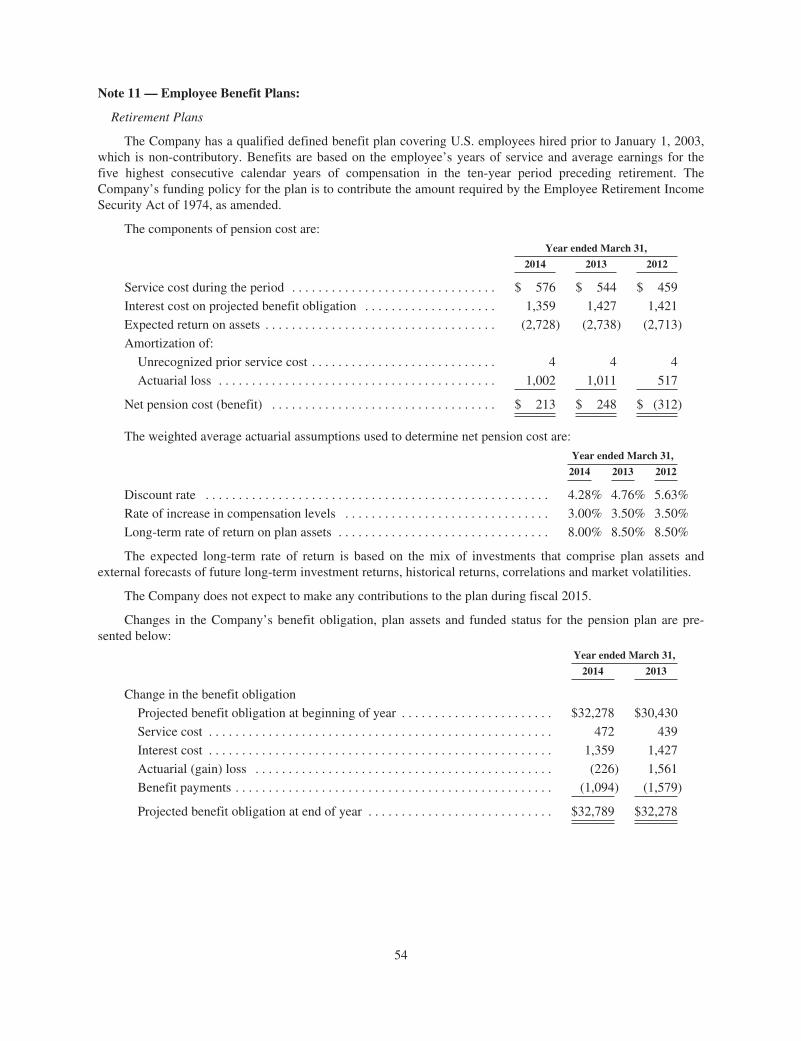
Note 11 — Employee Benefit Plans:
Retirement Plans
The Company has a qualified defined benefit plan covering U.S. employees hired prior to January 1, 2003,which is non-contributory. Benefits are based on the employee’s years of service and average earnings for thefive highest consecutive calendar years of compensation in the ten-year period preceding retirement. TheCompany’s funding policy for the plan is to contribute the amount required by the Employee Retirement IncomeSecurity Act of 1974, as amended.
The components of pension cost are:
Year ended March 31,
2014 2013 2012
Service cost during the period . . . . . . . . . . . . . . . . . . . . . . . . . . . . . . . $ 576 $ 544 $ 459
Interest cost on projected benefit obligation . . . . . . . . . . . . . . . . . . . . 1,359 1,427 1,421
Expected return on assets . . . . . . . . . . . . . . . . . . . . . . . . . . . . . . . . . . . (2,728) (2,738) (2,713)
Amortization of:
Unrecognized prior service cost . . . . . . . . . . . . . . . . . . . . . . . . . . . . 4 4 4
Actuarial loss . . . . . . . . . . . . . . . . . . . . . . . . . . . . . . . . . . . . . . . . . . 1,002 1,011 517
Net pension cost (benefit) . . . . . . . . . . . . . . . . . . . . . . . . . . . . . . . . . . $ 213 $ 248 $ (312)
The weighted average actuarial assumptions used to determine net pension cost are:
Year ended March 31,
2014 2013 2012
Discount rate . . . . . . . . . . . . . . . . . . . . . . . . . . . . . . . . . . . . . . . . . . . . . . . . . . . . 4.28% 4.76% 5.63%
Rate of increase in compensation levels . . . . . . . . . . . . . . . . . . . . . . . . . . . . . . . 3.00% 3.50% 3.50%
Long-term rate of return on plan assets . . . . . . . . . . . . . . . . . . . . . . . . . . . . . . . . 8.00% 8.50% 8.50%
The expected long-term rate of return is based on the mix of investments that comprise plan assets andexternal forecasts of future long-term investment returns, historical returns, correlations and market volatilities.
The Company does not expect to make any contributions to the plan during fiscal 2015.
Changes in the Company’s benefit obligation, plan assets and funded status for the pension plan are pre-sented below:
Year ended March 31,
2014 2013
Change in the benefit obligation
Projected benefit obligation at beginning of year . . . . . . . . . . . . . . . . . . . . . . . $32,278 $30,430
Service cost . . . . . . . . . . . . . . . . . . . . . . . . . . . . . . . . . . . . . . . . . . . . . . . . . . . . 472 439
Interest cost . . . . . . . . . . . . . . . . . . . . . . . . . . . . . . . . . . . . . . . . . . . . . . . . . . . . 1,359 1,427
Actuarial (gain) loss . . . . . . . . . . . . . . . . . . . . . . . . . . . . . . . . . . . . . . . . . . . . . (226) 1,561
Benefit payments . . . . . . . . . . . . . . . . . . . . . . . . . . . . . . . . . . . . . . . . . . . . . . . . (1,094) (1,579)
Projected benefit obligation at end of year . . . . . . . . . . . . . . . . . . . . . . . . . . . . $32,789 $32,278
54
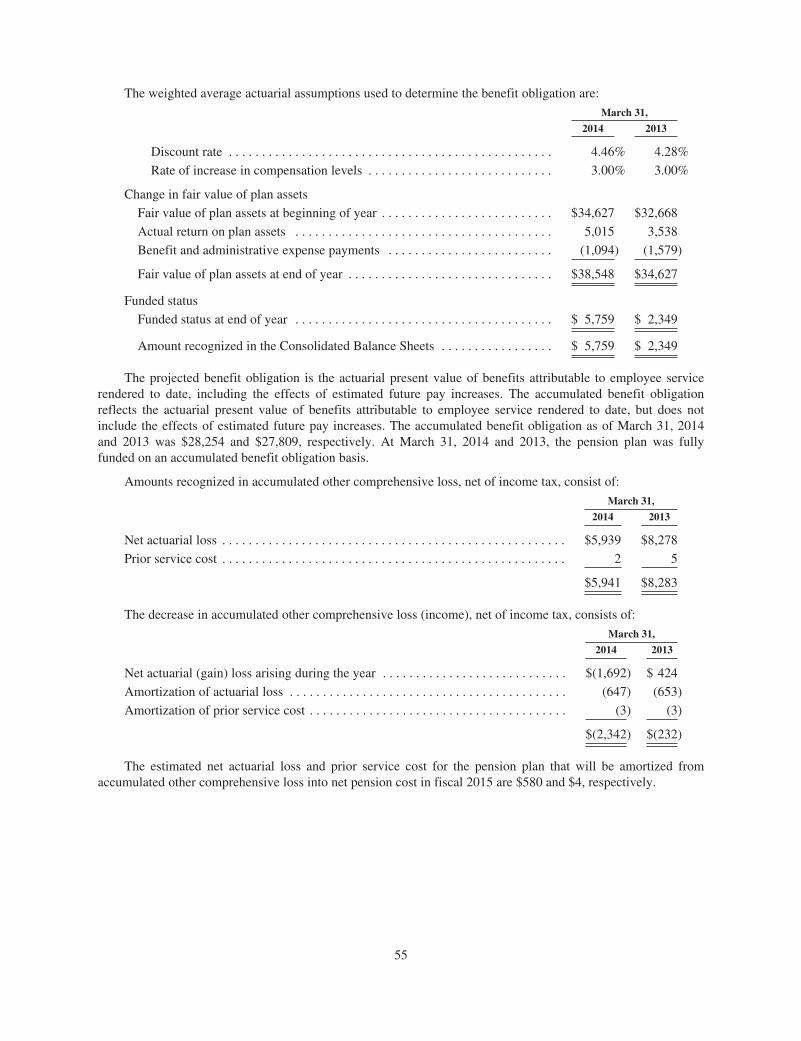
The weighted average actuarial assumptions used to determine the benefit obligation are:
March 31,
2014 2013
Discount rate . . . . . . . . . . . . . . . . . . . . . . . . . . . . . . . . . . . . . . . . . . . . . . . . . 4.46% 4.28%
Rate of increase in compensation levels . . . . . . . . . . . . . . . . . . . . . . . . . . . . 3.00% 3.00%
Change in fair value of plan assets
Fair value of plan assets at beginning of year . . . . . . . . . . . . . . . . . . . . . . . . . . $34,627 $32,668
Actual return on plan assets . . . . . . . . . . . . . . . . . . . . . . . . . . . . . . . . . . . . . . . 5,015 3,538
Benefit and administrative expense payments . . . . . . . . . . . . . . . . . . . . . . . . . (1,094) (1,579)
Fair value of plan assets at end of year . . . . . . . . . . . . . . . . . . . . . . . . . . . . . . . $38,548 $34,627
Funded status
Funded status at end of year . . . . . . . . . . . . . . . . . . . . . . . . . . . . . . . . . . . . . . . $ 5,759 $ 2,349
Amount recognized in the Consolidated Balance Sheets . . . . . . . . . . . . . . . . . $ 5,759 $ 2,349
The projected benefit obligation is the actuarial present value of benefits attributable to employee servicerendered to date, including the effects of estimated future pay increases. The accumulated benefit obligationreflects the actuarial present value of benefits attributable to employee service rendered to date, but does notinclude the effects of estimated future pay increases. The accumulated benefit obligation as of March 31, 2014and 2013 was $28,254 and $27,809, respectively. At March 31, 2014 and 2013, the pension plan was fullyfunded on an accumulated benefit obligation basis.
Amounts recognized in accumulated other comprehensive loss, net of income tax, consist of:
March 31,
2014 2013
Net actuarial loss . . . . . . . . . . . . . . . . . . . . . . . . . . . . . . . . . . . . . . . . . . . . . . . . . . . . $5,939 $8,278
Prior service cost . . . . . . . . . . . . . . . . . . . . . . . . . . . . . . . . . . . . . . . . . . . . . . . . . . . . 2 5
$5,941 $8,283
The decrease in accumulated other comprehensive loss (income), net of income tax, consists of:
March 31,
2014 2013
Net actuarial (gain) loss arising during the year . . . . . . . . . . . . . . . . . . . . . . . . . . . . $(1,692) $ 424
Amortization of actuarial loss . . . . . . . . . . . . . . . . . . . . . . . . . . . . . . . . . . . . . . . . . . (647) (653)
Amortization of prior service cost . . . . . . . . . . . . . . . . . . . . . . . . . . . . . . . . . . . . . . . (3) (3)
$(2,342) $(232)
The estimated net actuarial loss and prior service cost for the pension plan that will be amortized fromaccumulated other comprehensive loss into net pension cost in fiscal 2015 are $580 and $4, respectively.
55
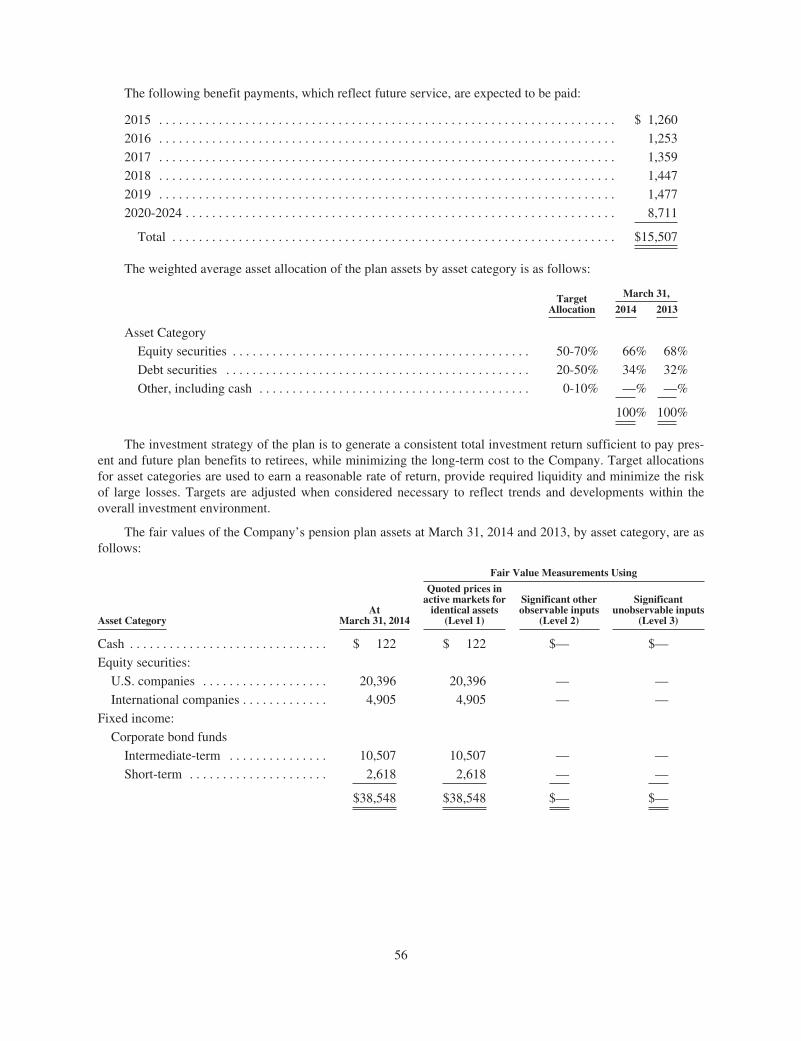
The following benefit payments, which reflect future service, are expected to be paid:
2015 . . . . . . . . . . . . . . . . . . . . . . . . . . . . . . . . . . . . . . . . . . . . . . . . . . . . . . . . . . . . . . . . . . . . . $ 1,260
2016 . . . . . . . . . . . . . . . . . . . . . . . . . . . . . . . . . . . . . . . . . . . . . . . . . . . . . . . . . . . . . . . . . . . . . 1,253
2017 . . . . . . . . . . . . . . . . . . . . . . . . . . . . . . . . . . . . . . . . . . . . . . . . . . . . . . . . . . . . . . . . . . . . . 1,359
2018 . . . . . . . . . . . . . . . . . . . . . . . . . . . . . . . . . . . . . . . . . . . . . . . . . . . . . . . . . . . . . . . . . . . . . 1,447
2019 . . . . . . . . . . . . . . . . . . . . . . . . . . . . . . . . . . . . . . . . . . . . . . . . . . . . . . . . . . . . . . . . . . . . . 1,477
2020-2024 . . . . . . . . . . . . . . . . . . . . . . . . . . . . . . . . . . . . . . . . . . . . . . . . . . . . . . . . . . . . . . . . . 8,711
Total . . . . . . . . . . . . . . . . . . . . . . . . . . . . . . . . . . . . . . . . . . . . . . . . . . . . . . . . . . . . . . . . . . . $15,507
The weighted average asset allocation of the plan assets by asset category is as follows:
TargetAllocation
March 31,
2014 2013
Asset Category
Equity securities . . . . . . . . . . . . . . . . . . . . . . . . . . . . . . . . . . . . . . . . . . . . . 50-70% 66% 68%
Debt securities . . . . . . . . . . . . . . . . . . . . . . . . . . . . . . . . . . . . . . . . . . . . . . 20-50% 34% 32%
Other, including cash . . . . . . . . . . . . . . . . . . . . . . . . . . . . . . . . . . . . . . . . . 0-10% —% —%
100% 100%
The investment strategy of the plan is to generate a consistent total investment return sufficient to pay pres-ent and future plan benefits to retirees, while minimizing the long-term cost to the Company. Target allocationsfor asset categories are used to earn a reasonable rate of return, provide required liquidity and minimize the riskof large losses. Targets are adjusted when considered necessary to reflect trends and developments within theoverall investment environment.
The fair values of the Company’s pension plan assets at March 31, 2014 and 2013, by asset category, are asfollows:
Fair Value Measurements Using
Asset CategoryAt
March 31, 2014
Quoted prices inactive markets for
identical assets(Level 1)
Significant otherobservable inputs
(Level 2)
Significantunobservable inputs
(Level 3)
Cash . . . . . . . . . . . . . . . . . . . . . . . . . . . . . . $ 122 $ 122 $— $—
Equity securities:
U.S. companies . . . . . . . . . . . . . . . . . . . 20,396 20,396 — —
International companies . . . . . . . . . . . . . 4,905 4,905 — —
Fixed income:
Corporate bond funds
Intermediate-term . . . . . . . . . . . . . . . 10,507 10,507 — —
Short-term . . . . . . . . . . . . . . . . . . . . . 2,618 2,618 — —
$38,548 $38,548 $— $—
56
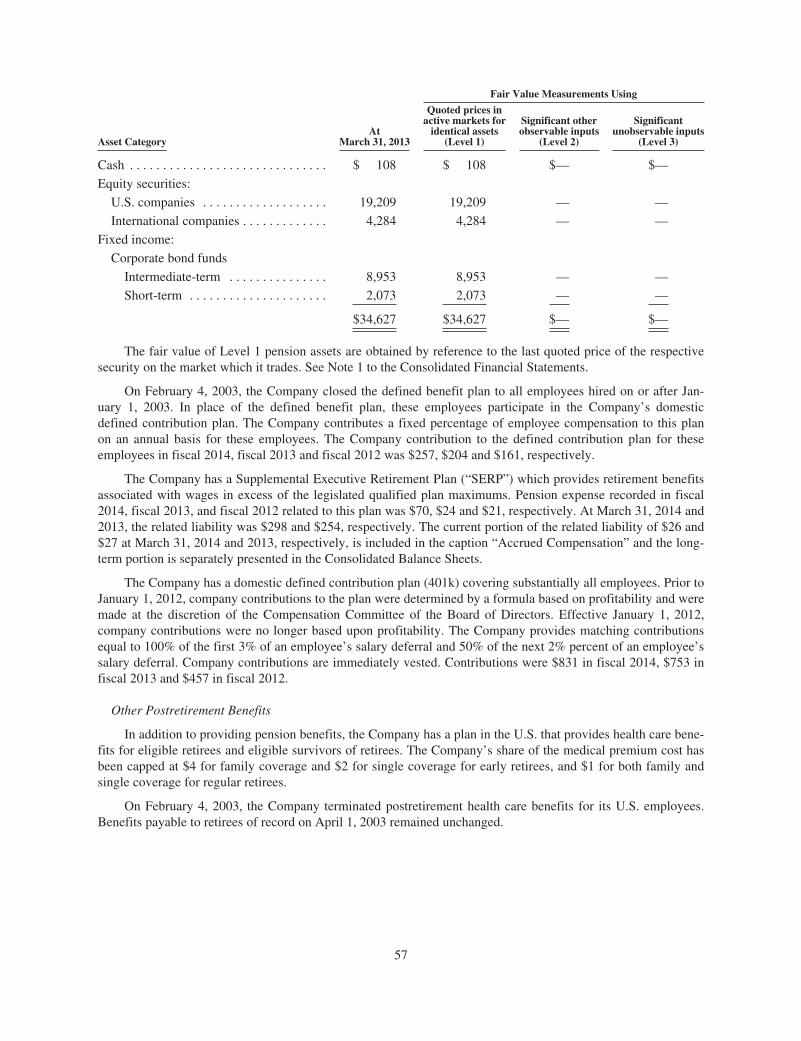
Fair Value Measurements Using
Asset CategoryAt
March 31, 2013
Quoted prices inactive markets for
identical assets(Level 1)
Significant otherobservable inputs
(Level 2)
Significantunobservable inputs
(Level 3)
Cash . . . . . . . . . . . . . . . . . . . . . . . . . . . . . . $ 108 $ 108 $— $—
Equity securities:
U.S. companies . . . . . . . . . . . . . . . . . . . 19,209 19,209 — —
International companies . . . . . . . . . . . . . 4,284 4,284 — —
Fixed income:
Corporate bond funds
Intermediate-term . . . . . . . . . . . . . . . 8,953 8,953 — —
Short-term . . . . . . . . . . . . . . . . . . . . . 2,073 2,073 — —
$34,627 $34,627 $— $—
The fair value of Level 1 pension assets are obtained by reference to the last quoted price of the respectivesecurity on the market which it trades. See Note 1 to the Consolidated Financial Statements.
On February 4, 2003, the Company closed the defined benefit plan to all employees hired on or after Jan-uary 1, 2003. In place of the defined benefit plan, these employees participate in the Company’s domesticdefined contribution plan. The Company contributes a fixed percentage of employee compensation to this planon an annual basis for these employees. The Company contribution to the defined contribution plan for theseemployees in fiscal 2014, fiscal 2013 and fiscal 2012 was $257, $204 and $161, respectively.
The Company has a Supplemental Executive Retirement Plan (“SERP”) which provides retirement benefitsassociated with wages in excess of the legislated qualified plan maximums. Pension expense recorded in fiscal2014, fiscal 2013, and fiscal 2012 related to this plan was $70, $24 and $21, respectively. At March 31, 2014 and2013, the related liability was $298 and $254, respectively. The current portion of the related liability of $26 and$27 at March 31, 2014 and 2013, respectively, is included in the caption “Accrued Compensation” and the long-term portion is separately presented in the Consolidated Balance Sheets.
The Company has a domestic defined contribution plan (401k) covering substantially all employees. Prior toJanuary 1, 2012, company contributions to the plan were determined by a formula based on profitability and weremade at the discretion of the Compensation Committee of the Board of Directors. Effective January 1, 2012,company contributions were no longer based upon profitability. The Company provides matching contributionsequal to 100% of the first 3% of an employee’s salary deferral and 50% of the next 2% percent of an employee’ssalary deferral. Company contributions are immediately vested. Contributions were $831 in fiscal 2014, $753 infiscal 2013 and $457 in fiscal 2012.
Other Postretirement Benefits
In addition to providing pension benefits, the Company has a plan in the U.S. that provides health care bene-fits for eligible retirees and eligible survivors of retirees. The Company’s share of the medical premium cost hasbeen capped at $4 for family coverage and $2 for single coverage for early retirees, and $1 for both family andsingle coverage for regular retirees.
On February 4, 2003, the Company terminated postretirement health care benefits for its U.S. employees.Benefits payable to retirees of record on April 1, 2003 remained unchanged.
57
The components of postretirement benefit income are:
Year ended March 31,
2014 2013 2012
Interest cost on accumulated benefit obligation . . . . . . . . . . . . . . . . . . . . . . $ 33 $ 39 $ 45
Amortization of prior service benefit . . . . . . . . . . . . . . . . . . . . . . . . . . . . . . (166) (166) (166)
Amortization of actuarial loss . . . . . . . . . . . . . . . . . . . . . . . . . . . . . . . . . . . . 46 44 37
Net postretirement benefit income . . . . . . . . . . . . . . . . . . . . . . . . . . . . . . . . $ (87) $ (83) $ (84)
The weighted average discount rate used to develop the net postretirement benefit cost were 3.26%, 3.96%and 4.69% in fiscal 2014, fiscal 2013 and fiscal 2012, respectively.
Changes in the Company’s benefit obligation, plan assets and funded status for the plan are as follows:
Year ended March 31,
2014 2013
Change in the benefit obligation
Projected benefit obligation at beginning of year . . . . . . . . . . . . . . . . . . . . . . . $1,030 $ 999
Interest cost . . . . . . . . . . . . . . . . . . . . . . . . . . . . . . . . . . . . . . . . . . . . . . . . . . . . 33 39
Actuarial (gain) loss . . . . . . . . . . . . . . . . . . . . . . . . . . . . . . . . . . . . . . . . . . . . . . (16) 95
Benefit payments . . . . . . . . . . . . . . . . . . . . . . . . . . . . . . . . . . . . . . . . . . . . . . . . (96) (103)
Projected benefit obligation at end of year . . . . . . . . . . . . . . . . . . . . . . . . . . . . $ 951 $1,030
The weighted average actuarial assumptions used to develop the accrued postretirement benefit obligationwere:
March 31,
2014 2013
Discount rate . . . . . . . . . . . . . . . . . . . . . . . . . . . . . . . . . . . . . . . . . . . . . . . . . . . . . . . . . . . 3.59% 3.26%
Medical care cost trend rate . . . . . . . . . . . . . . . . . . . . . . . . . . . . . . . . . . . . . . . . . . . . . . . 8.00% 8.00%
The medical care cost trend rate used in the actuarial computation ultimately reduces to 5% in 2020 andsubsequent years. This was accomplished using .5% decrements for the years ended March 31, 2014 through2020.
Year ended March 31,
2014 2013
Change in fair value of plan assets
Fair value of plan assets at beginning of year . . . . . . . . . . . . . . . . . . . . . . . . . . $ — $ —
Employer contribution . . . . . . . . . . . . . . . . . . . . . . . . . . . . . . . . . . . . . . . . . . . . 96 103
Benefit payments . . . . . . . . . . . . . . . . . . . . . . . . . . . . . . . . . . . . . . . . . . . . . . . . (96) (103)
Fair value of plan assets at end of year . . . . . . . . . . . . . . . . . . . . . . . . . . . . . . . $ — $ —
Funded status
Funded status at end of year . . . . . . . . . . . . . . . . . . . . . . . . . . . . . . . . . . . . . . . $(951) $(1,030)
Amount recognized in the Consolidated Balance Sheets . . . . . . . . . . . . . . . . . . . $(951) $(1,030)
58
The current portion of the accrued postretirement benefit obligation of $98 and $107, at March 31, 2014 and2013, respectively, is included in the caption “Accrued Compensation” and the long-term portion is separatelypresented in the Consolidated Balance Sheets.
Amounts recognized in accumulated other comprehensive loss, net of income tax, consist of:
March 31,
2014 2013
Net actuarial loss . . . . . . . . . . . . . . . . . . . . . . . . . . . . . . . . . . . . . . . . . . . . . . . . . . . . . . $295 $ 336
Prior service cost . . . . . . . . . . . . . . . . . . . . . . . . . . . . . . . . . . . . . . . . . . . . . . . . . . . . . . (68) (176)
$227 $ 160
The increase in accumulated other comprehensive loss, net of income tax, consists of:
March 31,
2014 2013
Net actuarial (gain) loss arising during the year . . . . . . . . . . . . . . . . . . . . . . . . . . . . . . . $ (10) $ 61
Amortization of actuarial loss . . . . . . . . . . . . . . . . . . . . . . . . . . . . . . . . . . . . . . . . . . . . . (30) (28)
Amortization of prior service cost . . . . . . . . . . . . . . . . . . . . . . . . . . . . . . . . . . . . . . . . . . 107 107
$ 67 $140
The estimated net actuarial loss and prior service cost for the other postretirement benefit plan that will beamortized from accumulated other comprehensive loss (income) into net postretirement benefit income in fiscal2015 are $40 and $(106), respectively.
The following benefit payments are expected to be paid during the fiscal years ending March 31:
2015 . . . . . . . . . . . . . . . . . . . . . . . . . . . . . . . . . . . . . . . . . . . . . . . . . . . . . . . . . . . . . . . . . . . . . . . . $ 98
2016 . . . . . . . . . . . . . . . . . . . . . . . . . . . . . . . . . . . . . . . . . . . . . . . . . . . . . . . . . . . . . . . . . . . . . . . . 93
2017 . . . . . . . . . . . . . . . . . . . . . . . . . . . . . . . . . . . . . . . . . . . . . . . . . . . . . . . . . . . . . . . . . . . . . . . . 88
2018 . . . . . . . . . . . . . . . . . . . . . . . . . . . . . . . . . . . . . . . . . . . . . . . . . . . . . . . . . . . . . . . . . . . . . . . . 82
2019 . . . . . . . . . . . . . . . . . . . . . . . . . . . . . . . . . . . . . . . . . . . . . . . . . . . . . . . . . . . . . . . . . . . . . . . . 77
2020-2024 . . . . . . . . . . . . . . . . . . . . . . . . . . . . . . . . . . . . . . . . . . . . . . . . . . . . . . . . . . . . . . . . . . . 309
Total . . . . . . . . . . . . . . . . . . . . . . . . . . . . . . . . . . . . . . . . . . . . . . . . . . . . . . . . . . . . . . . . . . . . . $747
Assumed medical care cost trend rates could have a significant effect on the amounts reported for the post-retirement benefit plan. However, due to the caps imposed on the Company’s share of the premium costs, a onepercentage point change in assumed medical care cost trend rates would not have a significant effect on the totalservice and interest cost components or the postretirement benefit obligation.
Employee Stock Ownership Plan
The Company has a noncontributory Employee Stock Ownership Plan (“ESOP”) that covers substantiallyall employees in the U.S. There were 252 and 279 shares in the ESOP at March 31, 2014 and 2013, respectively.There were no Company contributions to the ESOP in fiscal 2014, fiscal 2013 or fiscal 2012. Dividends paid onallocated shares accumulate for the benefit of the employees who participate in the ESOP.
Self-Insured Medical Plan
Effective January 1, 2014, the Company commenced self-funding the medical insurance coverage providedto its U.S. based employees. The Company has obtained a stop loss insurance policy in an effort to limit itsexposure to claims. The Company has specific stop loss coverage per employee for claims incurred during the
59
year exceeding $100 per employee with annual maximum aggregate stop loss coverage per employee of $1,000.The Company also has total plan annual maximum aggregate stop loss coverage of $3,707. The liability of $221on March 31, 2014 related to the self-insured medical plan is primarily based upon claim history and is includedin the caption “Accrued Compensation” in the Consolidated Balance Sheet.
Note 12 — Stock Compensation Plans:
The Amended and Restated 2000 Graham Corporation Incentive Plan to Increase Shareholder Value pro-vides for the issuance of up to 1,375 shares of common stock in connection with grants of incentive stockoptions, non-qualified stock options, stock awards and performance awards to officers, key employees and out-side directors; provided, however, that no more than 250 shares of common stock may be used for awards otherthan stock options. Stock options may be granted at prices not less than the fair market value at the date of grantand expire no later than ten years after the date of grant.
During fiscal 2013 and fiscal 2012, 49 and 9 stock options, respectively, each with a term of ten years fromthe date of grant were awarded to officers and key employees. No stock options were awarded in fiscal 2014. Thestock option awards granted in fiscal 2013 and fiscal 2012 vest 331⁄3% per year over a three-year term. TheCompany has elected to use the straight-line method to recognize compensation costs related to such awards.
In fiscal 2014, fiscal 2013 and fiscal 2012, 32, 26 and 32 shares, respectively, of restricted stock wereawarded. Restricted shares of 14, 18 and 16 granted to officers in fiscal 2014, fiscal 2013 and fiscal 2012,respectively, vest 100% on the third anniversary of the grant date subject to the satisfaction of the performancemetrics for the applicable three-year period. Restricted shares of 12 granted to officers and key employees infiscal 2014 vest 331⁄3% per year over a three-year term. Restricted shares of 7 granted to officers in fiscal 2012vest 50% on the second anniversary of the grant date and 50% on the fourth anniversary of the grant date. Therestricted shares granted to directors of 6, 8 and 9 in fiscal 2014, fiscal 2013 and fiscal 2012, respectively, vest100% on the anniversary of the grant date. The Company recognizes compensation cost over the period theshares vest.
During fiscal 2014, fiscal 2013, and fiscal 2012, the Company recognized $582, $524, and $556,respectively, of stock-based compensation cost related to stock option and restricted stock awards, and $205,$184 and $198, respectively, of related tax benefits.
The weighted average fair value of options granted during fiscal 2013 and fiscal 2012 was $4.97 and $9.51,respectively, using the Black-Scholes option-pricing model with the following weighted average assumptions:
Year ended March 31,
2013 2012
Expected life . . . . . . . . . . . . . . . . . . . . . . . . . . . . . . . . . . . . . . . . . . . . . . . . . . . . . 3 years 3 years
Volatility . . . . . . . . . . . . . . . . . . . . . . . . . . . . . . . . . . . . . . . . . . . . . . . . . . . . . . . . 43.17% 75.86%
Risk-free interest rate . . . . . . . . . . . . . . . . . . . . . . . . . . . . . . . . . . . . . . . . . . . . . . . .38% .83%
Dividend yield . . . . . . . . . . . . . . . . . . . . . . . . . . . . . . . . . . . . . . . . . . . . . . . . . . . . .38% .47%
The expected life represents an estimate of the weighted average period of time that options are expected toremain outstanding given consideration to vesting schedules and the Company’s historical exercise patterns.Expected volatility is estimated based on the historical closing prices of the Company’s common stock over theexpected life of the options. The risk free interest rate is estimated based on the U.S. Federal Reserve’s historicaldata for the maturity of nominal treasury instruments that corresponds to the expected term of the option.Expected dividend yield is based on historical trends.
The Company received cash proceeds from the exercise of stock options of $581, $83 and $386 in fiscal2014, fiscal 2013 and fiscal 2012, respectively. In fiscal 2014, fiscal 2013 and fiscal 2012, the Company recog-nized a $268, $41 and $244, respectively, increase in capital in excess of par value for the income tax benefitrealized upon exercise of stock options and vesting of restricted shares in excess of the tax benefit amount recog-nized pertaining to the fair value of stock awards treated as compensation expense.
60
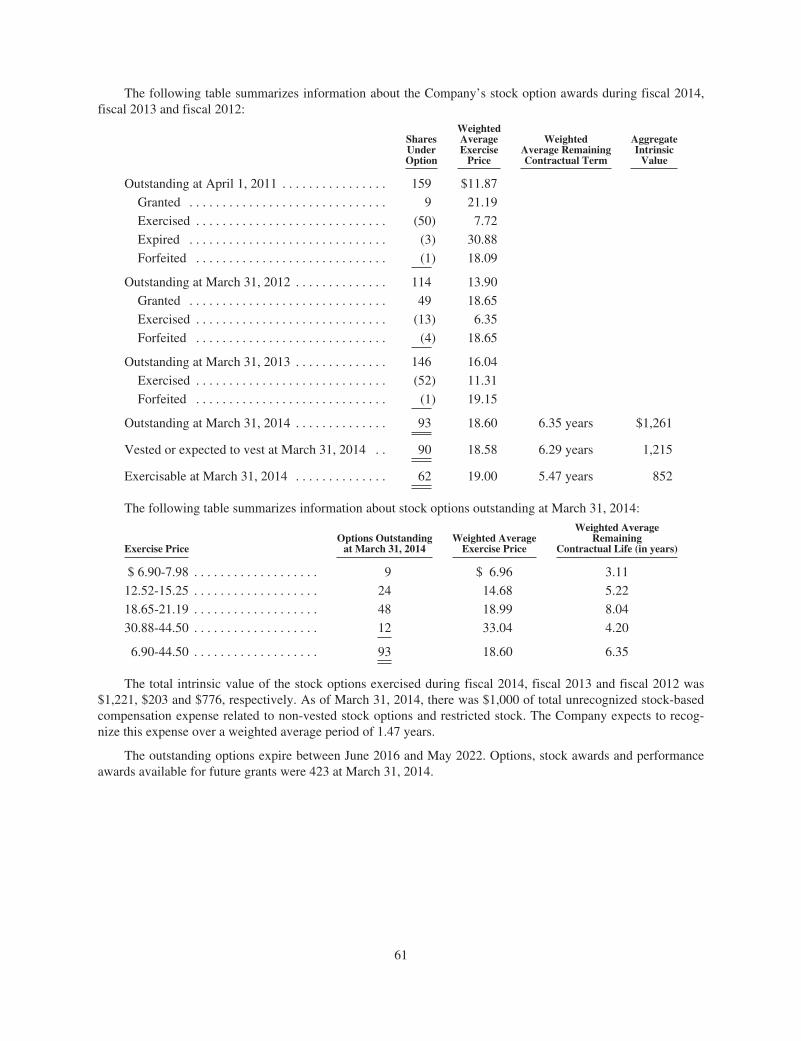
The following table summarizes information about the Company’s stock option awards during fiscal 2014,fiscal 2013 and fiscal 2012:
SharesUnderOption
WeightedAverageExercise
Price
WeightedAverage RemainingContractual Term
AggregateIntrinsic
Value
Outstanding at April 1, 2011 . . . . . . . . . . . . . . . . 159 $11.87
Granted . . . . . . . . . . . . . . . . . . . . . . . . . . . . . . 9 21.19
Exercised . . . . . . . . . . . . . . . . . . . . . . . . . . . . . (50) 7.72
Expired . . . . . . . . . . . . . . . . . . . . . . . . . . . . . . (3) 30.88
Forfeited . . . . . . . . . . . . . . . . . . . . . . . . . . . . . (1) 18.09
Outstanding at March 31, 2012 . . . . . . . . . . . . . . 114 13.90
Granted . . . . . . . . . . . . . . . . . . . . . . . . . . . . . . 49 18.65
Exercised . . . . . . . . . . . . . . . . . . . . . . . . . . . . . (13) 6.35
Forfeited . . . . . . . . . . . . . . . . . . . . . . . . . . . . . (4) 18.65
Outstanding at March 31, 2013 . . . . . . . . . . . . . . 146 16.04
Exercised . . . . . . . . . . . . . . . . . . . . . . . . . . . . . (52) 11.31
Forfeited . . . . . . . . . . . . . . . . . . . . . . . . . . . . . (1) 19.15
Outstanding at March 31, 2014 . . . . . . . . . . . . . . 93 18.60 6.35 years $1,261
Vested or expected to vest at March 31, 2014 . . 90 18.58 6.29 years 1,215
Exercisable at March 31, 2014 . . . . . . . . . . . . . . 62 19.00 5.47 years 852
The following table summarizes information about stock options outstanding at March 31, 2014:
Exercise PriceOptions Outstanding
at March 31, 2014Weighted Average
Exercise Price
Weighted AverageRemaining
Contractual Life (in years)
$ 6.90-7.98 . . . . . . . . . . . . . . . . . . . 9 $ 6.96 3.11
12.52-15.25 . . . . . . . . . . . . . . . . . . . 24 14.68 5.22
18.65-21.19 . . . . . . . . . . . . . . . . . . . 48 18.99 8.04
30.88-44.50 . . . . . . . . . . . . . . . . . . . 12 33.04 4.20
6.90-44.50 . . . . . . . . . . . . . . . . . . . 93 18.60 6.35
The total intrinsic value of the stock options exercised during fiscal 2014, fiscal 2013 and fiscal 2012 was$1,221, $203 and $776, respectively. As of March 31, 2014, there was $1,000 of total unrecognized stock-basedcompensation expense related to non-vested stock options and restricted stock. The Company expects to recog-nize this expense over a weighted average period of 1.47 years.
The outstanding options expire between June 2016 and May 2022. Options, stock awards and performanceawards available for future grants were 423 at March 31, 2014.
61
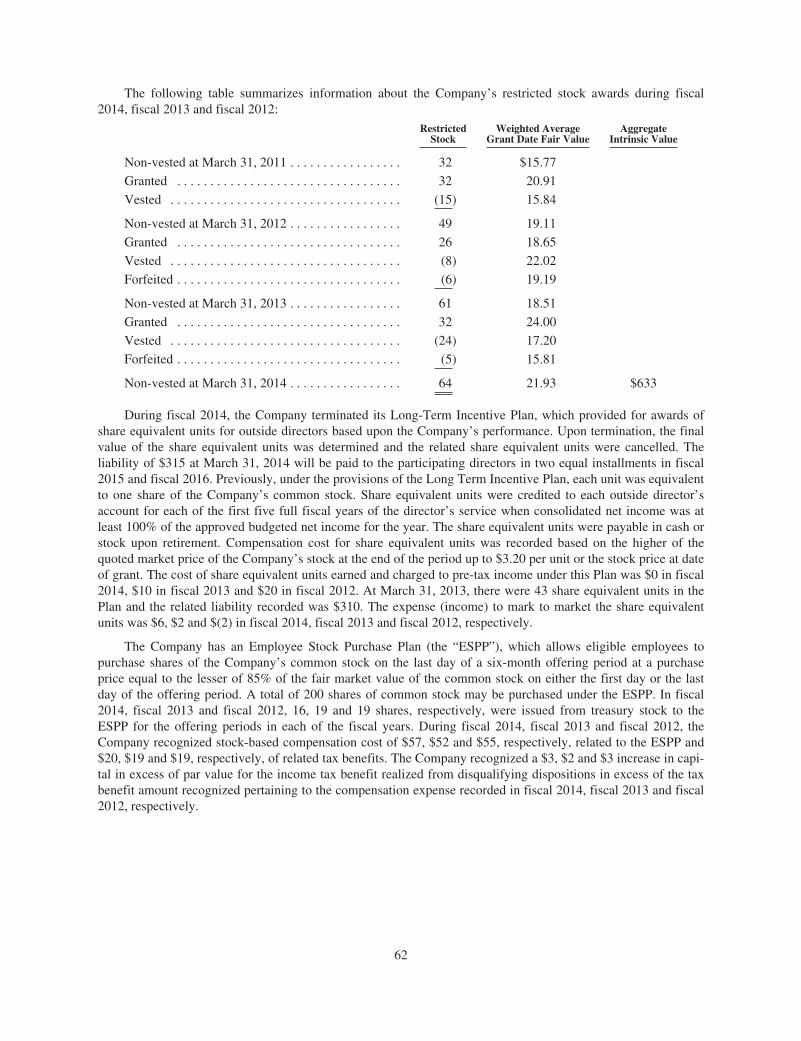
The following table summarizes information about the Company’s restricted stock awards during fiscal2014, fiscal 2013 and fiscal 2012:
RestrictedStock
Weighted AverageGrant Date Fair Value
AggregateIntrinsic Value
Non-vested at March 31, 2011 . . . . . . . . . . . . . . . . . 32 $15.77
Granted . . . . . . . . . . . . . . . . . . . . . . . . . . . . . . . . . . 32 20.91
Vested . . . . . . . . . . . . . . . . . . . . . . . . . . . . . . . . . . . (15) 15.84
Non-vested at March 31, 2012 . . . . . . . . . . . . . . . . . 49 19.11
Granted . . . . . . . . . . . . . . . . . . . . . . . . . . . . . . . . . . 26 18.65
Vested . . . . . . . . . . . . . . . . . . . . . . . . . . . . . . . . . . . (8) 22.02
Forfeited . . . . . . . . . . . . . . . . . . . . . . . . . . . . . . . . . . (6) 19.19
Non-vested at March 31, 2013 . . . . . . . . . . . . . . . . . 61 18.51
Granted . . . . . . . . . . . . . . . . . . . . . . . . . . . . . . . . . . 32 24.00
Vested . . . . . . . . . . . . . . . . . . . . . . . . . . . . . . . . . . . (24) 17.20
Forfeited . . . . . . . . . . . . . . . . . . . . . . . . . . . . . . . . . . (5) 15.81
Non-vested at March 31, 2014 . . . . . . . . . . . . . . . . . 64 21.93 $633
During fiscal 2014, the Company terminated its Long-Term Incentive Plan, which provided for awards ofshare equivalent units for outside directors based upon the Company’s performance. Upon termination, the finalvalue of the share equivalent units was determined and the related share equivalent units were cancelled. Theliability of $315 at March 31, 2014 will be paid to the participating directors in two equal installments in fiscal2015 and fiscal 2016. Previously, under the provisions of the Long Term Incentive Plan, each unit was equivalentto one share of the Company’s common stock. Share equivalent units were credited to each outside director’saccount for each of the first five full fiscal years of the director’s service when consolidated net income was atleast 100% of the approved budgeted net income for the year. The share equivalent units were payable in cash orstock upon retirement. Compensation cost for share equivalent units was recorded based on the higher of thequoted market price of the Company’s stock at the end of the period up to $3.20 per unit or the stock price at dateof grant. The cost of share equivalent units earned and charged to pre-tax income under this Plan was $0 in fiscal2014, $10 in fiscal 2013 and $20 in fiscal 2012. At March 31, 2013, there were 43 share equivalent units in thePlan and the related liability recorded was $310. The expense (income) to mark to market the share equivalentunits was $6, $2 and $(2) in fiscal 2014, fiscal 2013 and fiscal 2012, respectively.
The Company has an Employee Stock Purchase Plan (the “ESPP”), which allows eligible employees topurchase shares of the Company’s common stock on the last day of a six-month offering period at a purchaseprice equal to the lesser of 85% of the fair market value of the common stock on either the first day or the lastday of the offering period. A total of 200 shares of common stock may be purchased under the ESPP. In fiscal2014, fiscal 2013 and fiscal 2012, 16, 19 and 19 shares, respectively, were issued from treasury stock to theESPP for the offering periods in each of the fiscal years. During fiscal 2014, fiscal 2013 and fiscal 2012, theCompany recognized stock-based compensation cost of $57, $52 and $55, respectively, related to the ESPP and$20, $19 and $19, respectively, of related tax benefits. The Company recognized a $3, $2 and $3 increase in capi-tal in excess of par value for the income tax benefit realized from disqualifying dispositions in excess of the taxbenefit amount recognized pertaining to the compensation expense recorded in fiscal 2014, fiscal 2013 and fiscal2012, respectively.
62
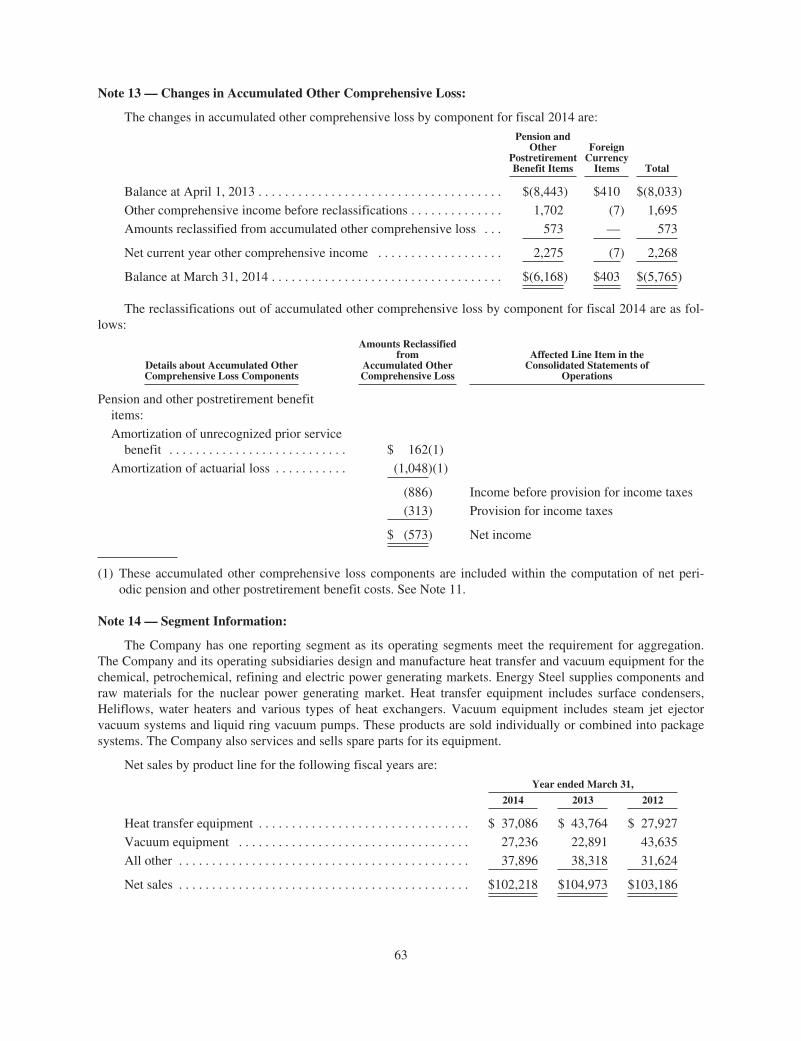
Note 13 — Changes in Accumulated Other Comprehensive Loss:
The changes in accumulated other comprehensive loss by component for fiscal 2014 are:
Pension andOther
PostretirementBenefit Items
ForeignCurrency
Items Total
Balance at April 1, 2013 . . . . . . . . . . . . . . . . . . . . . . . . . . . . . . . . . . . . . $(8,443) $410 $(8,033)
Other comprehensive income before reclassifications . . . . . . . . . . . . . . 1,702 (7) 1,695
Amounts reclassified from accumulated other comprehensive loss . . . 573 — 573
Net current year other comprehensive income . . . . . . . . . . . . . . . . . . . 2,275 (7) 2,268
Balance at March 31, 2014 . . . . . . . . . . . . . . . . . . . . . . . . . . . . . . . . . . . $(6,168) $403 $(5,765)
The reclassifications out of accumulated other comprehensive loss by component for fiscal 2014 are as fol-lows:
Details about Accumulated OtherComprehensive Loss Components
Amounts Reclassifiedfrom
Accumulated OtherComprehensive Loss
Affected Line Item in theConsolidated Statements of
Operations
Pension and other postretirement benefititems:
Amortization of unrecognized prior servicebenefit . . . . . . . . . . . . . . . . . . . . . . . . . . . $ 162(1)
Amortization of actuarial loss . . . . . . . . . . . (1,048)(1)
(886) Income before provision for income taxes
(313) Provision for income taxes
$ (573) Net income
(1) These accumulated other comprehensive loss components are included within the computation of net peri-odic pension and other postretirement benefit costs. See Note 11.
Note 14 — Segment Information:
The Company has one reporting segment as its operating segments meet the requirement for aggregation.The Company and its operating subsidiaries design and manufacture heat transfer and vacuum equipment for thechemical, petrochemical, refining and electric power generating markets. Energy Steel supplies components andraw materials for the nuclear power generating market. Heat transfer equipment includes surface condensers,Heliflows, water heaters and various types of heat exchangers. Vacuum equipment includes steam jet ejectorvacuum systems and liquid ring vacuum pumps. These products are sold individually or combined into packagesystems. The Company also services and sells spare parts for its equipment.
Net sales by product line for the following fiscal years are:
Year ended March 31,
2014 2013 2012
Heat transfer equipment . . . . . . . . . . . . . . . . . . . . . . . . . . . . . . . . $ 37,086 $ 43,764 $ 27,927
Vacuum equipment . . . . . . . . . . . . . . . . . . . . . . . . . . . . . . . . . . . 27,236 22,891 43,635
All other . . . . . . . . . . . . . . . . . . . . . . . . . . . . . . . . . . . . . . . . . . . . 37,896 38,318 31,624
Net sales . . . . . . . . . . . . . . . . . . . . . . . . . . . . . . . . . . . . . . . . . . . . $102,218 $104,973 $103,186
63
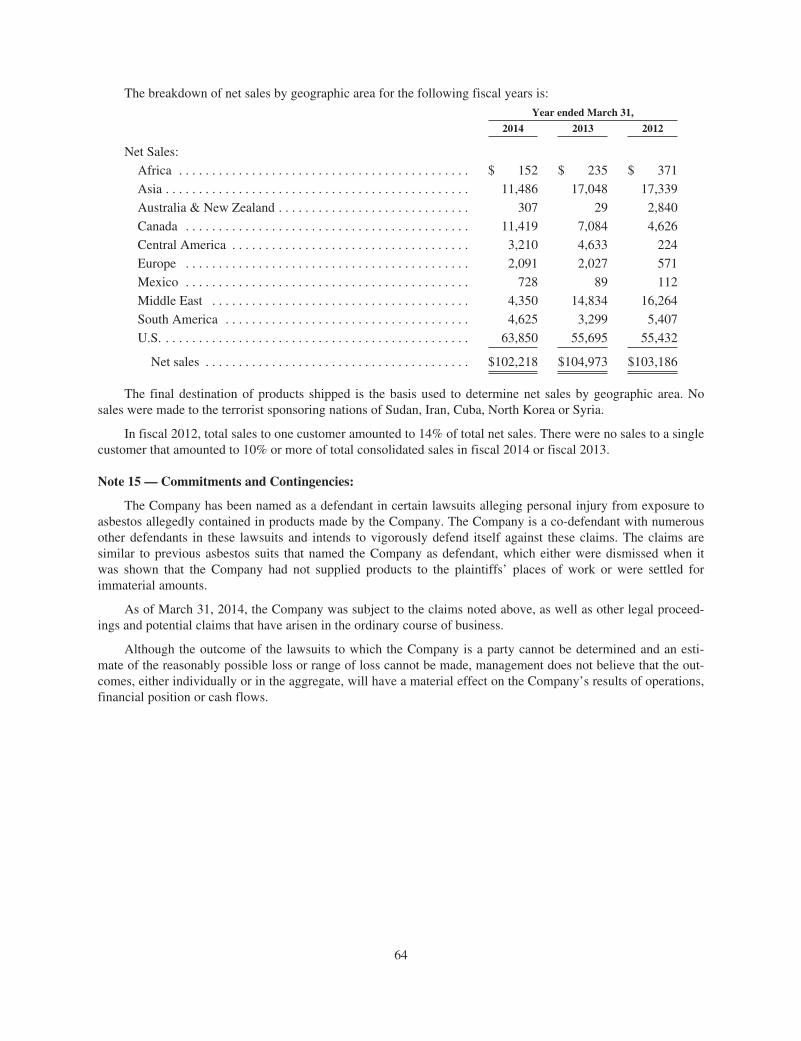
The breakdown of net sales by geographic area for the following fiscal years is:
Year ended March 31,
2014 2013 2012
Net Sales:
Africa . . . . . . . . . . . . . . . . . . . . . . . . . . . . . . . . . . . . . . . . . . . . $ 152 $ 235 $ 371
Asia . . . . . . . . . . . . . . . . . . . . . . . . . . . . . . . . . . . . . . . . . . . . . . 11,486 17,048 17,339
Australia & New Zealand . . . . . . . . . . . . . . . . . . . . . . . . . . . . . 307 29 2,840
Canada . . . . . . . . . . . . . . . . . . . . . . . . . . . . . . . . . . . . . . . . . . . 11,419 7,084 4,626
Central America . . . . . . . . . . . . . . . . . . . . . . . . . . . . . . . . . . . . 3,210 4,633 224
Europe . . . . . . . . . . . . . . . . . . . . . . . . . . . . . . . . . . . . . . . . . . . 2,091 2,027 571
Mexico . . . . . . . . . . . . . . . . . . . . . . . . . . . . . . . . . . . . . . . . . . . 728 89 112
Middle East . . . . . . . . . . . . . . . . . . . . . . . . . . . . . . . . . . . . . . . 4,350 14,834 16,264
South America . . . . . . . . . . . . . . . . . . . . . . . . . . . . . . . . . . . . . 4,625 3,299 5,407
U.S. . . . . . . . . . . . . . . . . . . . . . . . . . . . . . . . . . . . . . . . . . . . . . . 63,850 55,695 55,432
Net sales . . . . . . . . . . . . . . . . . . . . . . . . . . . . . . . . . . . . . . . . $102,218 $104,973 $103,186
The final destination of products shipped is the basis used to determine net sales by geographic area. Nosales were made to the terrorist sponsoring nations of Sudan, Iran, Cuba, North Korea or Syria.
In fiscal 2012, total sales to one customer amounted to 14% of total net sales. There were no sales to a singlecustomer that amounted to 10% or more of total consolidated sales in fiscal 2014 or fiscal 2013.
Note 15 — Commitments and Contingencies:
The Company has been named as a defendant in certain lawsuits alleging personal injury from exposure toasbestos allegedly contained in products made by the Company. The Company is a co-defendant with numerousother defendants in these lawsuits and intends to vigorously defend itself against these claims. The claims aresimilar to previous asbestos suits that named the Company as defendant, which either were dismissed when itwas shown that the Company had not supplied products to the plaintiffs’ places of work or were settled forimmaterial amounts.
As of March 31, 2014, the Company was subject to the claims noted above, as well as other legal proceed-ings and potential claims that have arisen in the ordinary course of business.
Although the outcome of the lawsuits to which the Company is a party cannot be determined and an esti-mate of the reasonably possible loss or range of loss cannot be made, management does not believe that the out-comes, either individually or in the aggregate, will have a material effect on the Company’s results of operations,financial position or cash flows.
64
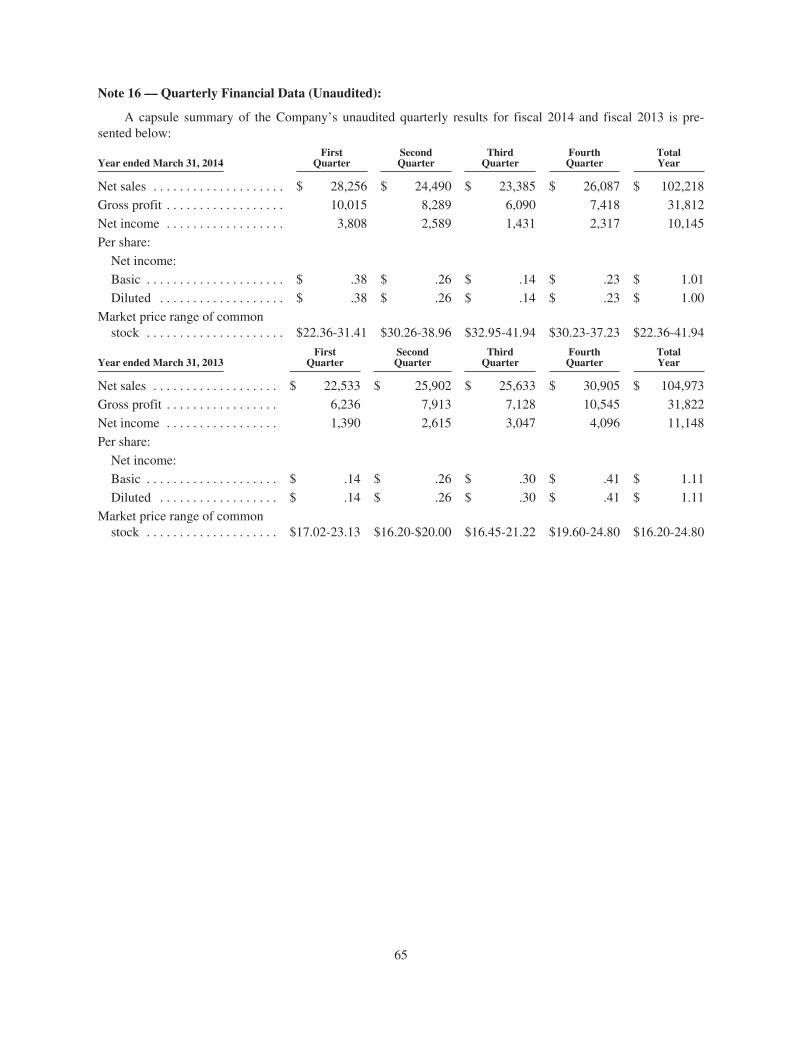
Note 16 — Quarterly Financial Data (Unaudited):
A capsule summary of the Company’s unaudited quarterly results for fiscal 2014 and fiscal 2013 is pre-sented below:
Year ended March 31, 2014First
QuarterSecondQuarter
ThirdQuarter
FourthQuarter
TotalYear
Net sales . . . . . . . . . . . . . . . . . . . . $ 28,256 $ 24,490 $ 23,385 $ 26,087 $ 102,218
Gross profit . . . . . . . . . . . . . . . . . . 10,015 8,289 6,090 7,418 31,812
Net income . . . . . . . . . . . . . . . . . . 3,808 2,589 1,431 2,317 10,145
Per share:
Net income:
Basic . . . . . . . . . . . . . . . . . . . . . $ .38 $ .26 $ .14 $ .23 $ 1.01
Diluted . . . . . . . . . . . . . . . . . . . $ .38 $ .26 $ .14 $ .23 $ 1.00
Market price range of commonstock . . . . . . . . . . . . . . . . . . . . . $22.36-31.41 $30.26-38.96 $32.95-41.94 $30.23-37.23 $22.36-41.94
Year ended March 31, 2013First
QuarterSecondQuarter
ThirdQuarter
FourthQuarter
TotalYear
Net sales . . . . . . . . . . . . . . . . . . . $ 22,533 $ 25,902 $ 25,633 $ 30,905 $ 104,973
Gross profit . . . . . . . . . . . . . . . . . 6,236 7,913 7,128 10,545 31,822
Net income . . . . . . . . . . . . . . . . . 1,390 2,615 3,047 4,096 11,148
Per share:
Net income:
Basic . . . . . . . . . . . . . . . . . . . . $ .14 $ .26 $ .30 $ .41 $ 1.11
Diluted . . . . . . . . . . . . . . . . . . $ .14 $ .26 $ .30 $ .41 $ 1.11
Market price range of commonstock . . . . . . . . . . . . . . . . . . . . $17.02-23.13 $16.20-$20.00 $16.45-21.22 $19.60-24.80 $16.20-24.80
65
REPORT OF INDEPENDENT REGISTERED PUBLIC ACCOUNTING FIRM
To the Board of Directors and Stockholders ofGraham CorporationBatavia, New York
We have audited the accompanying consolidated balance sheets of Graham Corporation and subsidiaries(the “Company”) as of March 31, 2014 and 2013, and the related consolidated statements of operations, compre-hensive income, changes in stockholders’ equity and cash flows for each of the three years in the period endedMarch 31, 2014. These consolidated financial statements are the responsibility of the Company’s management.Our responsibility is to express an opinion on these consolidated financial statements based on our audits.
We conducted our audits in accordance with the standards of the Public Company Accounting OversightBoard (United States). Those standards require that we plan and perform the audit to obtain reasonable assuranceabout whether the financial statements are free of material misstatement. An audit includes examining, on a testbasis, evidence supporting the amounts and disclosures in the financial statements. An audit also includes assess-ing the accounting principles used and significant estimates made by management, as well as evaluating theoverall financial statement presentation. We believe that our audits provide a reasonable basis for our opinion.
In our opinion, such consolidated financial statements present fairly, in all material respects, the financialposition of Graham Corporation and subsidiaries as of March 31, 2014 and 2013, and the results of their oper-ations and their cash flows for each of the three years in the period ended March 31, 2014, in conformity withaccounting principles generally accepted in the United States of America.
We have also audited, in accordance with the standards of the Public Company Accounting Oversight Board(United States), the Company’s internal control over financial reporting as of March 31, 2014, based on the cri-teria established in Internal Control — Integrated Framework (1992) issued by the Committee of SponsoringOrganizations of the Treadway Commission and our report dated June 4, 2014 expressed an unqualified opinionon the Company’s internal control over financial reporting.
/s/ Deloitte & Touche LLPDeloitte & Touche LLPRochester, New YorkJune 4, 2014
66
REPORT OF INDEPENDENT REGISTERED PUBLIC ACCOUNTING FIRM
To the Board of Directors and Stockholders ofGraham CorporationBatavia, New York
We have audited the internal control over financial reporting of Graham Corporation and subsidiaries (the“Company”) as of March 31, 2014, based on criteria established in Internal Control — Integrated Framework(1992) issued by the Committee of Sponsoring Organizations of the Treadway Commission. The Company’smanagement is responsible for maintaining effective internal control over financial reporting and for its assess-ment of the effectiveness of internal control over financial reporting, included in the accompanying Manage-ment’s Annual Report on Internal Control over Financial Reporting appearing under Item 9A of its AnnualReport on Form 10-K for the year ended March 31, 2014. Our responsibility is to express an opinion on theCompany’s internal control over financial reporting based on our audit.
We conducted our audit in accordance with the standards of the Public Company Accounting OversightBoard (United States). Those standards require that we plan and perform the audit to obtain reasonable assuranceabout whether effective internal control over financial reporting was maintained in all material respects. Ouraudit included obtaining an understanding of internal control over financial reporting, assessing the risk that amaterial weakness exists, testing and evaluating the design and operating effectiveness of internal control basedon the assessed risk, and performing such other procedures as we considered necessary in the circumstances. Webelieve that our audit provides a reasonable basis for our opinion.
A company’s internal control over financial reporting is a process designed by, or under the supervision of,the company’s principal executive and principal financial officers, or persons performing similar functions, andeffected by the company’s board of directors, management, and other personnel to provide reasonable assuranceregarding the reliability of financial reporting and the preparation of financial statements for external purposes inaccordance with generally accepted accounting principles. A company’s internal control over financial reportingincludes those policies and procedures that (1) pertain to the maintenance of records that, in reasonable detail,accurately and fairly reflect the transactions and dispositions of the assets of the company; (2) provide reasonableassurance that transactions are recorded as necessary to permit preparation of financial statements in accordancewith generally accepted accounting principles, and that receipts and expenditures of the company are being madeonly in accordance with authorizations of management and directors of the company; and (3) provide reasonableassurance regarding prevention or timely detection of unauthorized acquisition, use, or disposition of the compa-ny’s assets that could have a material effect on the financial statements.
Because of the inherent limitations of internal control over financial reporting, including the possibility ofcollusion or improper management override of controls, material misstatements due to error or fraud may not beprevented or detected on a timely basis. Also, projections of any evaluation of the effectiveness of the internalcontrol over financial reporting to future periods are subject to the risk that the controls may become inadequatebecause of changes in conditions, or that the degree of compliance with the policies or procedures may deterio-rate.
In our opinion, the Company maintained, in all material respects, effective internal control over financialreporting as of March 31, 2014, based on the criteria established in Internal Control — Integrated Framework(1992) issued by the Committee of Sponsoring Organizations of the Treadway Commission.
We have also audited, in accordance with the standards of the Public Company Accounting Oversight Board(United States), the consolidated financial statements and consolidated financial statement schedule as of and forthe year ended March 31, 2014 of the Company and our reports dated June 4, 2014 expressed an unqualifiedopinion on those consolidated financial statements and consolidated financial statement schedule.
/s/ Deloitte & Touche LLPDeloitte & Touche LLPRochester, New YorkJune 4, 2014
67
Item 9. Changes in and Disagreements with Accountants on Accounting and Financial Disclosure
Not applicable.
Item 9A. Controls and Procedures
Conclusion Regarding Disclosure Controls and Procedures
Management, including our President and Chief Executive Officer (principal executive officer) and VicePresident-Finance & Administration and Chief Financial Officer (principal financial officer), has evaluated theeffectiveness of the design and operation of our disclosure controls and procedures as of the end of the periodcovered by this Annual Report on Form 10-K. Based upon, and as of the date of that evaluation, our Presidentand Chief Executive Officer and Vice President-Finance & Administration and Chief Financial Officer con-cluded that the disclosure controls and procedures were effective, in all material respects, to ensure thatinformation required to be disclosed in the reports we file and submit under the Securities Exchange Act of 1934,as amended (the “Exchange Act”), is (i) recorded, processed, summarized and reported as and when required and(ii) is accumulated and communicated to our management, including our President and Chief Executive Officerand Vice President-Finance & Administration and Chief Financial Officer, as appropriate, to allow timely deci-sions regarding required disclosure.
Changes in Internal Control Over Financial Reporting
There has been no change to our internal control over financial reporting during the fourth quarter of thefiscal year covered by this Annual Report on Form 10-K that has materially affected, or that is reasonably likelyto materially affect our internal control over financial reporting.
Management’s Annual Report on Internal Control over Financial Reporting
Management is responsible for establishing and maintaining adequate internal control over financial report-ing, as such term is defined in Exchange Act Rule 13a-15(f). A control system, no matter how well conceivedand operated, can provide only reasonable, not absolute, assurance that the objectives of the control system aremet. Because of the inherent limitations in all control systems, no evaluation of controls can provide absoluteassurance that all control issues and instances of fraud, if any, within our organization have been detected. Theseinherent limitations include the realities that judgments in decision-making can be faulty, and that breakdownscan occur because of simple error or mistake. Additionally, controls can be circumvented by the individual actsof some persons, by collusion of two or more people, or by management override. The design of any system ofcontrols is also based in part upon certain assumptions about the likelihood of future events, and there can be noassurance that any design will succeed in achieving our stated goals under all potential future conditions. More-over, over time controls may become inadequate because of changes in conditions, or the degree of compliancewith the policies or procedures may deteriorate. Because of the inherent limitations in the design of an internalcontrol system, misstatements due to error or fraud may occur and not be detected. However, these inherent limi-tations are known features of the financial reporting process. Therefore, it is possible to design into the processsafeguards to reduce, though not eliminate, this risk.
Under the supervision and with the participation of management, including our President and Chief Execu-tive Officer (principal executive officer) and Vice President — Finance & Administration and Chief FinancialOfficer (principal financial officer), we conducted an assessment of the effectiveness of its internal control overfinancial reporting based on the framework in Internal Control — Integrated Framework (1992) issued by theCommittee of Sponsoring Organizations of the Treadway Commission. Based on the assessment under thisframework, management concluded that our internal control over financial reporting was effective as ofMarch 31, 2014.
Deloitte & Touche LLP, the independent registered public accounting firm that audited the financial state-ments included in this Annual Report on Form 10-K, has issued an attestation report on our internal control overfinancial reporting.
Item 9B. Other Information
Not applicable.
68
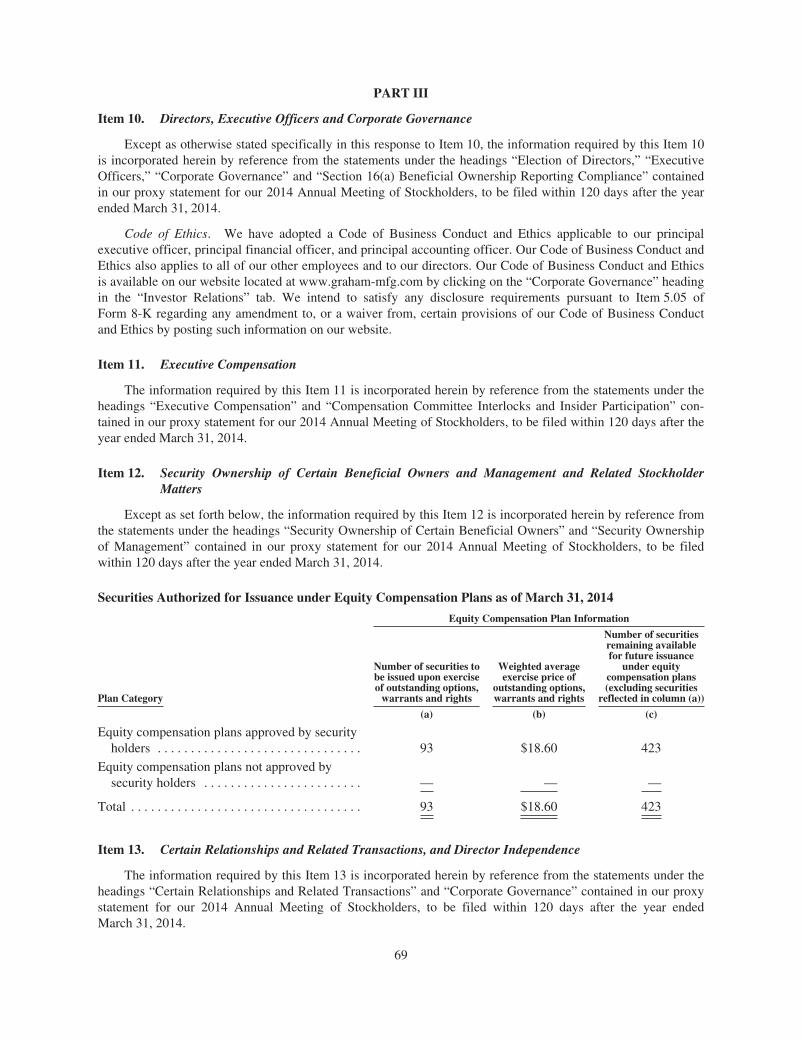
PART III
Item 10. Directors, Executive Officers and Corporate Governance
Except as otherwise stated specifically in this response to Item 10, the information required by this Item 10is incorporated herein by reference from the statements under the headings “Election of Directors,” “ExecutiveOfficers,” “Corporate Governance” and “Section 16(a) Beneficial Ownership Reporting Compliance” containedin our proxy statement for our 2014 Annual Meeting of Stockholders, to be filed within 120 days after the yearended March 31, 2014.
Code of Ethics. We have adopted a Code of Business Conduct and Ethics applicable to our principalexecutive officer, principal financial officer, and principal accounting officer. Our Code of Business Conduct andEthics also applies to all of our other employees and to our directors. Our Code of Business Conduct and Ethicsis available on our website located at www.graham-mfg.com by clicking on the “Corporate Governance” headingin the “Investor Relations” tab. We intend to satisfy any disclosure requirements pursuant to Item 5.05 ofForm 8-K regarding any amendment to, or a waiver from, certain provisions of our Code of Business Conductand Ethics by posting such information on our website.
Item 11. Executive Compensation
The information required by this Item 11 is incorporated herein by reference from the statements under theheadings “Executive Compensation” and “Compensation Committee Interlocks and Insider Participation” con-tained in our proxy statement for our 2014 Annual Meeting of Stockholders, to be filed within 120 days after theyear ended March 31, 2014.
Item 12. Security Ownership of Certain Beneficial Owners and Management and Related StockholderMatters
Except as set forth below, the information required by this Item 12 is incorporated herein by reference fromthe statements under the headings “Security Ownership of Certain Beneficial Owners” and “Security Ownershipof Management” contained in our proxy statement for our 2014 Annual Meeting of Stockholders, to be filedwithin 120 days after the year ended March 31, 2014.
Securities Authorized for Issuance under Equity Compensation Plans as of March 31, 2014
Equity Compensation Plan Information
Plan Category
Number of securities tobe issued upon exerciseof outstanding options,
warrants and rights
Weighted averageexercise price of
outstanding options,warrants and rights
Number of securitiesremaining availablefor future issuance
under equitycompensation plans(excluding securities
reflected in column (a))
(a) (b) (c)
Equity compensation plans approved by securityholders . . . . . . . . . . . . . . . . . . . . . . . . . . . . . . . 93 $18.60 423
Equity compensation plans not approved bysecurity holders . . . . . . . . . . . . . . . . . . . . . . . . — — —
Total . . . . . . . . . . . . . . . . . . . . . . . . . . . . . . . . . . . 93 $18.60 423
Item 13. Certain Relationships and Related Transactions, and Director Independence
The information required by this Item 13 is incorporated herein by reference from the statements under theheadings “Certain Relationships and Related Transactions” and “Corporate Governance” contained in our proxystatement for our 2014 Annual Meeting of Stockholders, to be filed within 120 days after the year endedMarch 31, 2014.
69
Item 14. Principal Accounting Fees and Services
The information required by this Item 14 is incorporated herein by reference from the statements under theheading “Ratification of the Selection of our Independent Registered Public Accounting Firm” contained in ourproxy statement for our 2014 Annual Meeting of Stockholders, to be filed within 120 days after the year endedMarch 31, 2014.
Part IV
Item 15. Exhibits, Financial Statement Schedules
We have filed our Consolidated Financial Statements in Part II, Item 8 of this Annual Report on Form 10-Kand have listed such financial statements in the Index to Financial Statements included in Item 8. In addition, thefinancial statement schedule entitled “Schedule II — Valuation and Qualifying Accounts” is filed as part of thisAnnual Report on Form 10-K under this Item 15.
All other schedules have been omitted since the required information is not present or is not present inamounts sufficient to require submission of the schedule, or because the information required is included in theConsolidated Financial Statements and notes thereto.
The exhibits filed as part of this Annual Report on Form 10-K are listed in the Index to Exhibits followingthe signature page of this Form 10-K.
70
REPORT OF INDEPENDENT REGISTERED PUBLIC ACCOUNTING FIRM
To the Board of Directors and Stockholders ofGraham CorporationBatavia, New York
We have audited the consolidated financial statements of Graham Corporation and subsidiaries (the“Company”) as of March 31, 2014 and 2013, and for each of the three years in the period ended March 31, 2014,and the Company’s internal control over financial reporting as of March 31, 2014, and have issued our reportsthereon dated June 4, 2014; such consolidated financial statements and reports are included in this Form 10-K.Our audits also included the consolidated financial statement schedule of the Company listed in Item 15. Thisconsolidated financial statement schedule is the responsibility of the Company’s management. Our responsibilityis to express an opinion based on our audits. In our opinion, such consolidated financial statement schedule,when considered in relation to the basic consolidated financial statements taken as a whole, presents fairly, in allmaterial respects, the information set forth therein.
/s/Deloitte & Touche LLPDeloitte & Touche LLPRochester, New YorkJune 4, 2014
71
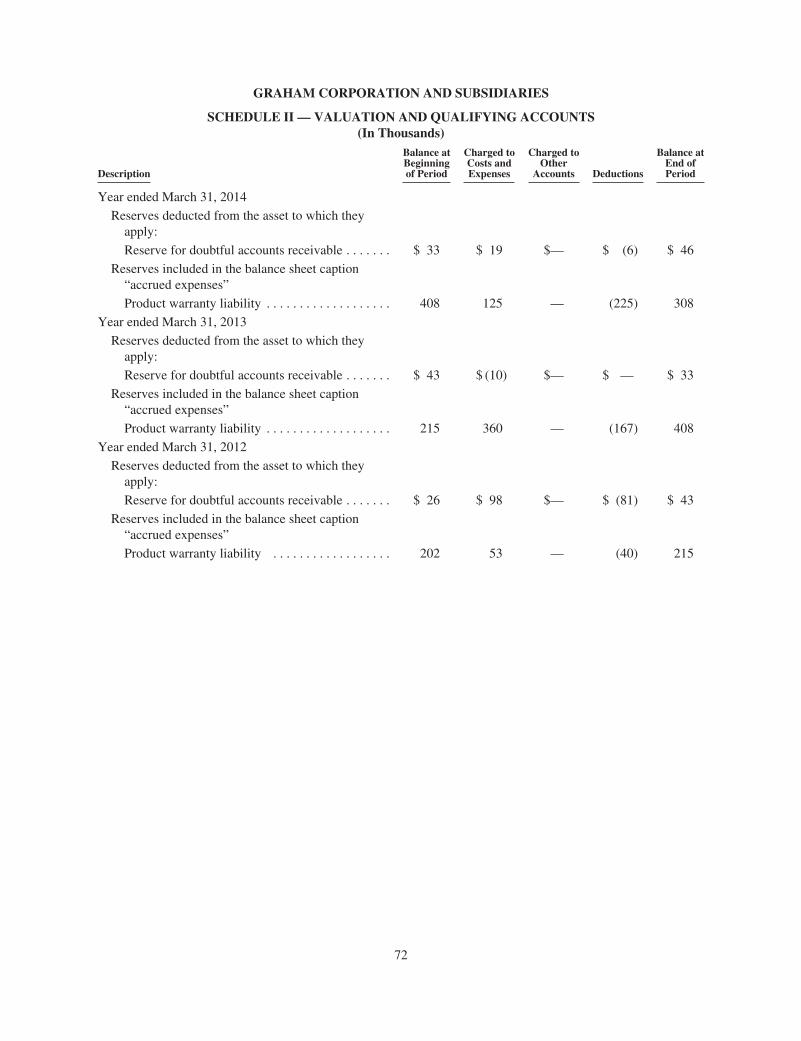
GRAHAM CORPORATION AND SUBSIDIARIES
SCHEDULE II — VALUATION AND QUALIFYING ACCOUNTS(In Thousands)
Description
Balance atBeginningof Period
Charged toCosts andExpenses
Charged toOther
Accounts Deductions
Balance atEnd ofPeriod
Year ended March 31, 2014
Reserves deducted from the asset to which theyapply:
Reserve for doubtful accounts receivable . . . . . . . $ 33 $ 19 $— $ (6) $ 46
Reserves included in the balance sheet caption“accrued expenses”
Product warranty liability . . . . . . . . . . . . . . . . . . . 408 125 — (225) 308
Year ended March 31, 2013
Reserves deducted from the asset to which theyapply:
Reserve for doubtful accounts receivable . . . . . . . $ 43 $ (10) $— $ — $ 33
Reserves included in the balance sheet caption“accrued expenses”
Product warranty liability . . . . . . . . . . . . . . . . . . . 215 360 — (167) 408
Year ended March 31, 2012
Reserves deducted from the asset to which theyapply:
Reserve for doubtful accounts receivable . . . . . . . $ 26 $ 98 $— $ (81) $ 43
Reserves included in the balance sheet caption“accrued expenses”
Product warranty liability . . . . . . . . . . . . . . . . . . 202 53 — (40) 215
72
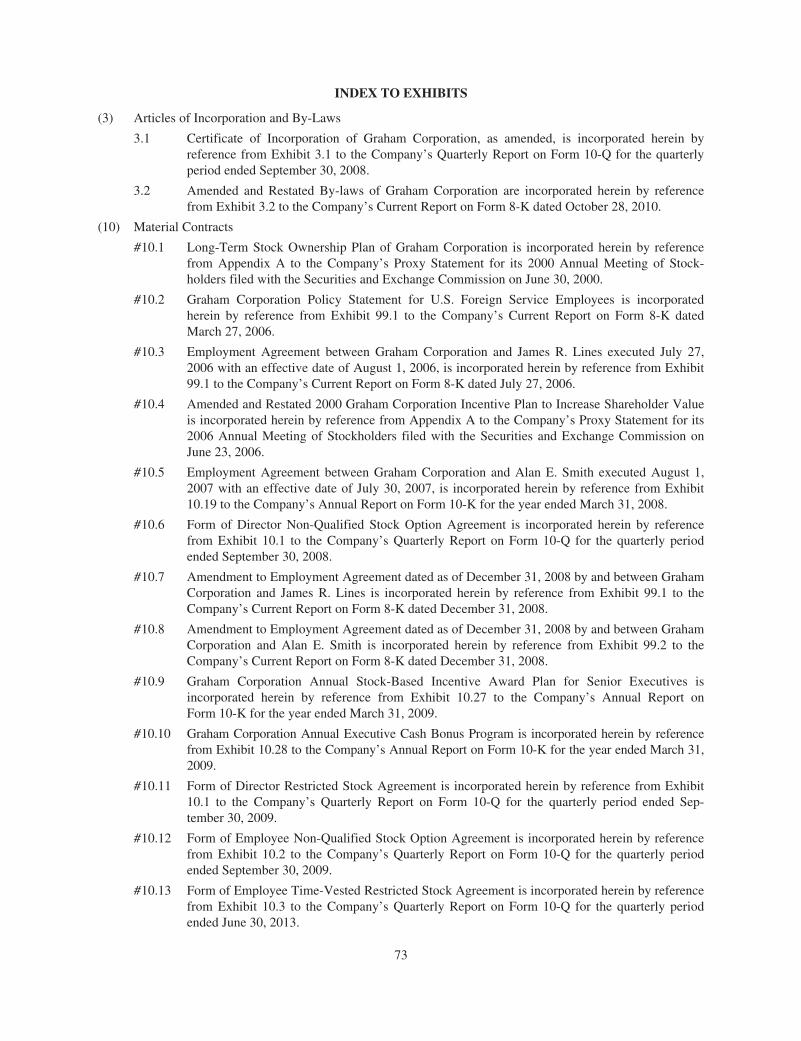
INDEX TO EXHIBITS
(3) Articles of Incorporation and By-Laws
3.1 Certificate of Incorporation of Graham Corporation, as amended, is incorporated herein byreference from Exhibit 3.1 to the Company’s Quarterly Report on Form 10-Q for the quarterlyperiod ended September 30, 2008.
3.2 Amended and Restated By-laws of Graham Corporation are incorporated herein by referencefrom Exhibit 3.2 to the Company’s Current Report on Form 8-K dated October 28, 2010.
(10) Material Contracts
#10.1 Long-Term Stock Ownership Plan of Graham Corporation is incorporated herein by referencefrom Appendix A to the Company’s Proxy Statement for its 2000 Annual Meeting of Stock-holders filed with the Securities and Exchange Commission on June 30, 2000.
#10.2 Graham Corporation Policy Statement for U.S. Foreign Service Employees is incorporatedherein by reference from Exhibit 99.1 to the Company’s Current Report on Form 8-K datedMarch 27, 2006.
#10.3 Employment Agreement between Graham Corporation and James R. Lines executed July 27,2006 with an effective date of August 1, 2006, is incorporated herein by reference from Exhibit99.1 to the Company’s Current Report on Form 8-K dated July 27, 2006.
#10.4 Amended and Restated 2000 Graham Corporation Incentive Plan to Increase Shareholder Valueis incorporated herein by reference from Appendix A to the Company’s Proxy Statement for its2006 Annual Meeting of Stockholders filed with the Securities and Exchange Commission onJune 23, 2006.
#10.5 Employment Agreement between Graham Corporation and Alan E. Smith executed August 1,2007 with an effective date of July 30, 2007, is incorporated herein by reference from Exhibit10.19 to the Company’s Annual Report on Form 10-K for the year ended March 31, 2008.
#10.6 Form of Director Non-Qualified Stock Option Agreement is incorporated herein by referencefrom Exhibit 10.1 to the Company’s Quarterly Report on Form 10-Q for the quarterly periodended September 30, 2008.
#10.7 Amendment to Employment Agreement dated as of December 31, 2008 by and between GrahamCorporation and James R. Lines is incorporated herein by reference from Exhibit 99.1 to theCompany’s Current Report on Form 8-K dated December 31, 2008.
#10.8 Amendment to Employment Agreement dated as of December 31, 2008 by and between GrahamCorporation and Alan E. Smith is incorporated herein by reference from Exhibit 99.2 to theCompany’s Current Report on Form 8-K dated December 31, 2008.
#10.9 Graham Corporation Annual Stock-Based Incentive Award Plan for Senior Executives isincorporated herein by reference from Exhibit 10.27 to the Company’s Annual Report onForm 10-K for the year ended March 31, 2009.
#10.10 Graham Corporation Annual Executive Cash Bonus Program is incorporated herein by referencefrom Exhibit 10.28 to the Company’s Annual Report on Form 10-K for the year ended March 31,2009.
#10.11 Form of Director Restricted Stock Agreement is incorporated herein by reference from Exhibit10.1 to the Company’s Quarterly Report on Form 10-Q for the quarterly period ended Sep-tember 30, 2009.
#10.12 Form of Employee Non-Qualified Stock Option Agreement is incorporated herein by referencefrom Exhibit 10.2 to the Company’s Quarterly Report on Form 10-Q for the quarterly periodended September 30, 2009.
#10.13 Form of Employee Time-Vested Restricted Stock Agreement is incorporated herein by referencefrom Exhibit 10.3 to the Company’s Quarterly Report on Form 10-Q for the quarterly periodended June 30, 2013.
73
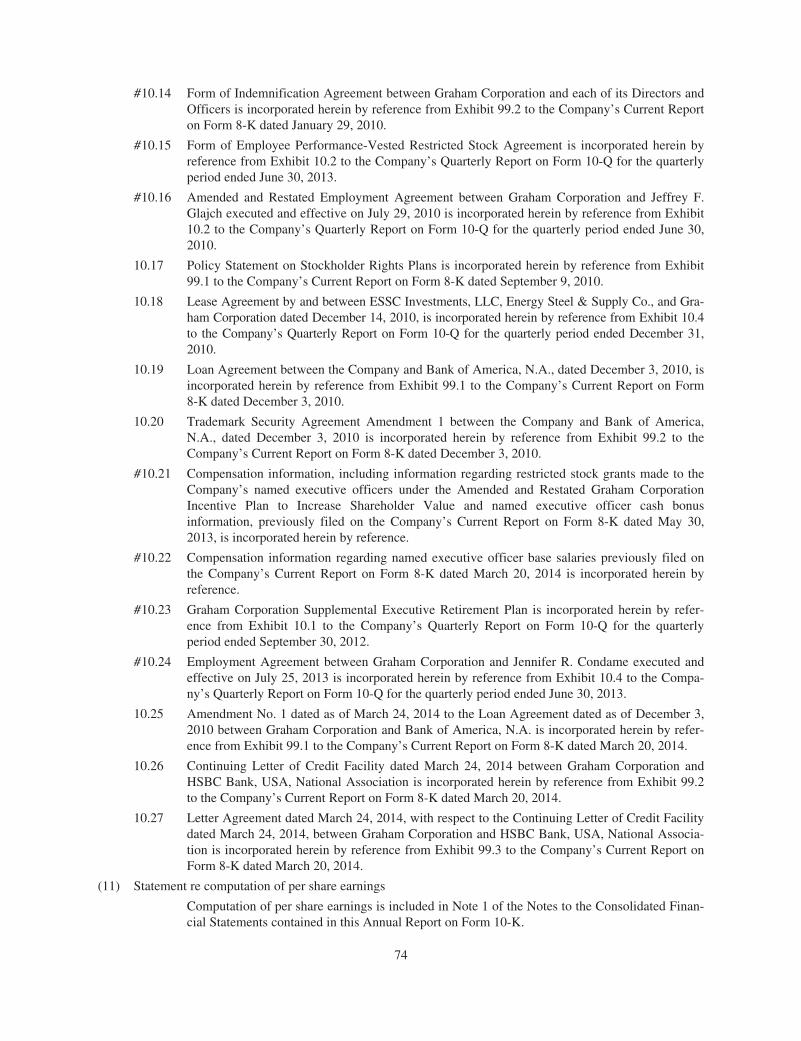
#10.14 Form of Indemnification Agreement between Graham Corporation and each of its Directors andOfficers is incorporated herein by reference from Exhibit 99.2 to the Company’s Current Reporton Form 8-K dated January 29, 2010.
#10.15 Form of Employee Performance-Vested Restricted Stock Agreement is incorporated herein byreference from Exhibit 10.2 to the Company’s Quarterly Report on Form 10-Q for the quarterlyperiod ended June 30, 2013.
#10.16 Amended and Restated Employment Agreement between Graham Corporation and Jeffrey F.Glajch executed and effective on July 29, 2010 is incorporated herein by reference from Exhibit10.2 to the Company’s Quarterly Report on Form 10-Q for the quarterly period ended June 30,2010.
10.17 Policy Statement on Stockholder Rights Plans is incorporated herein by reference from Exhibit99.1 to the Company’s Current Report on Form 8-K dated September 9, 2010.
10.18 Lease Agreement by and between ESSC Investments, LLC, Energy Steel & Supply Co., and Gra-ham Corporation dated December 14, 2010, is incorporated herein by reference from Exhibit 10.4to the Company’s Quarterly Report on Form 10-Q for the quarterly period ended December 31,2010.
10.19 Loan Agreement between the Company and Bank of America, N.A., dated December 3, 2010, isincorporated herein by reference from Exhibit 99.1 to the Company’s Current Report on Form8-K dated December 3, 2010.
10.20 Trademark Security Agreement Amendment 1 between the Company and Bank of America,N.A., dated December 3, 2010 is incorporated herein by reference from Exhibit 99.2 to theCompany’s Current Report on Form 8-K dated December 3, 2010.
#10.21 Compensation information, including information regarding restricted stock grants made to theCompany’s named executive officers under the Amended and Restated Graham CorporationIncentive Plan to Increase Shareholder Value and named executive officer cash bonusinformation, previously filed on the Company’s Current Report on Form 8-K dated May 30,2013, is incorporated herein by reference.
#10.22 Compensation information regarding named executive officer base salaries previously filed onthe Company’s Current Report on Form 8-K dated March 20, 2014 is incorporated herein byreference.
#10.23 Graham Corporation Supplemental Executive Retirement Plan is incorporated herein by refer-ence from Exhibit 10.1 to the Company’s Quarterly Report on Form 10-Q for the quarterlyperiod ended September 30, 2012.
#10.24 Employment Agreement between Graham Corporation and Jennifer R. Condame executed andeffective on July 25, 2013 is incorporated herein by reference from Exhibit 10.4 to the Compa-ny’s Quarterly Report on Form 10-Q for the quarterly period ended June 30, 2013.
10.25 Amendment No. 1 dated as of March 24, 2014 to the Loan Agreement dated as of December 3,2010 between Graham Corporation and Bank of America, N.A. is incorporated herein by refer-ence from Exhibit 99.1 to the Company’s Current Report on Form 8-K dated March 20, 2014.
10.26 Continuing Letter of Credit Facility dated March 24, 2014 between Graham Corporation andHSBC Bank, USA, National Association is incorporated herein by reference from Exhibit 99.2to the Company’s Current Report on Form 8-K dated March 20, 2014.
10.27 Letter Agreement dated March 24, 2014, with respect to the Continuing Letter of Credit Facilitydated March 24, 2014, between Graham Corporation and HSBC Bank, USA, National Associa-tion is incorporated herein by reference from Exhibit 99.3 to the Company’s Current Report onForm 8-K dated March 20, 2014.
(11) Statement re computation of per share earnings
Computation of per share earnings is included in Note 1 of the Notes to the Consolidated Finan-cial Statements contained in this Annual Report on Form 10-K.
74
(14) Code of Ethics
*14.1 Graham Corporation Code of Business Conduct and Ethics, as amended and restated, effectiveMay 2, 2014.
(21) Subsidiaries of the registrant
*21.1 Subsidiaries of the registrant
(23) Consents of Experts and Counsel
*23.1 Consent of Deloitte & Touche LLP
(31) Rule 13a-14(a)/15d-14(a) Certifications
*31.1 Certification of Principal Executive Officer*31.2 Certification of Principal Financial Officer
(32) Section 1350 Certifications
*32.1 Section 1350 Certifications
(101) Interactive Date File
*101.INS XBRL Instance Document
*101.SCH XBRL Taxonomy Extension Schema Document
*101.CAL XBRL Taxonomy Extension Calculation Linkbase Document
*101.DEF XBRL Taxonomy Definitions Linkbase Document
*101.LAB XBRL Taxonomy Extension Label Linkbase Document
*101.PRE XBRL Taxonomy Extension Presentation Linkbase Document
* Exhibits filed with this report.
# Management contract or compensatory plan.
75
SIGNATURES
Pursuant to the requirements of Section 13 or 15(d) of the Securities Exchange Act of 1934, the registranthas duly caused this annual report to be signed on its behalf by the undersigned, thereunto duly authorized.
GRAHAM CORPORATION
June 4, 2014 By: /s/ JEFFREY F. GLAJCH
Jeffrey F. GlajchVice President-Finance & Administration,
Chief Financial Officer and Corporate Secretary
Pursuant to the requirements of the Securities Exchange Act of 1934, this report has been signed below bythe following persons on behalf of the registrant and in the capacities and on the dates indicated.
Signature
/S/ JAMES R. LINES President and Chief Executive Officer andDirector (Principal Executive Officer)
June 4, 2014
James R. Lines
/S/ JEFFREY F. GLAJCH Vice President-Finance & Administration,Chief Financial Officer and CorporateSecretary (Principal Financial Officer)
June 4, 2014
Jeffrey F. Glajch
/S/ JENNIFER R. CONDAME Chief Accounting Officer(Principal Accounting Officer)
June 4, 2014
Jennifer R. Condame
/S/ JAMES J. BARBER Director June 4, 2014
James J. Barber
/S/ HELEN H. BERKELEY Director June 4, 2014
Helen H. Berkeley
/S/ JERALD D. BIDLACK Director and Chairman of the Board June 4, 2014
Jerald D. Bidlack
/S/ ALAN FORTIER Director June 4, 2014
Alan Fortier
/S/ JAMES J. MALVASO Director June 4, 2014
James J. Malvaso
/S/ GERARD T. MAZURKIEWICZ Director June 4, 2014
Gerard T. Mazurkiewicz
76
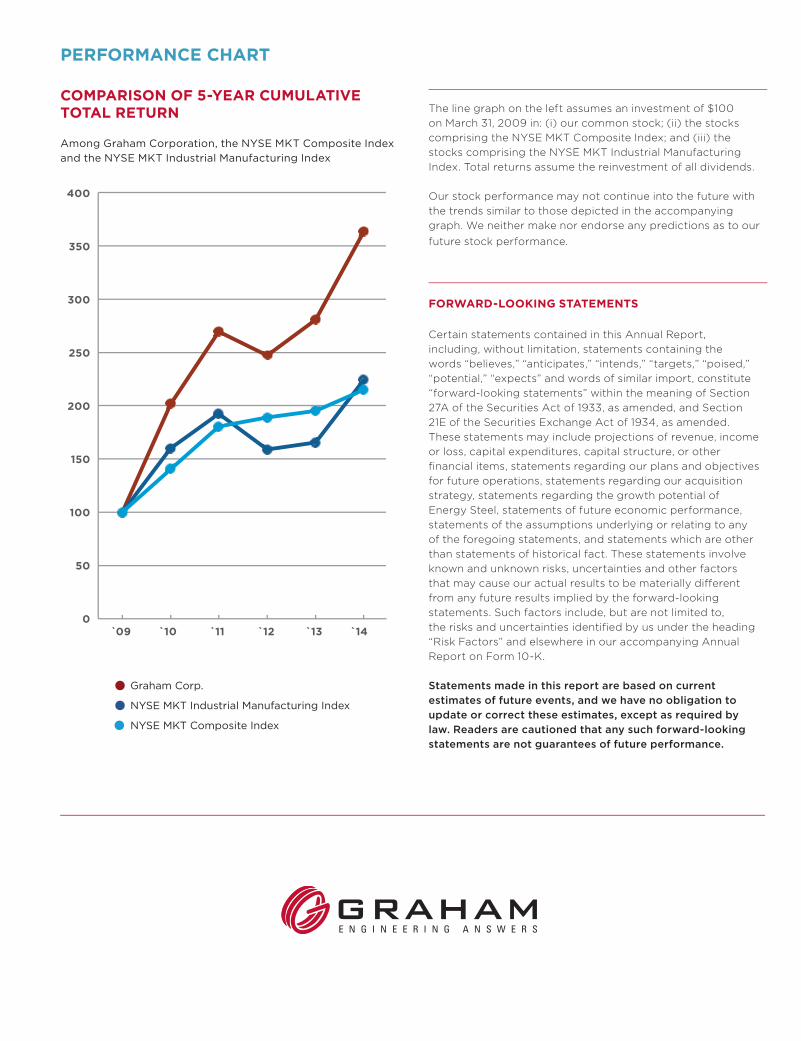
PERFORMANCE CHART
COMPARISON OF 5-YEAR CUMULATIVE TOTAL RETURN
Among Graham Corporation, the NYSE MKT Composite Index and the NYSE MKT Industrial Manufacturing Index
The line graph on the left assumes an investment of $100
on March 31, 2009 in: (i) our common stock; (ii) the stocks
comprising the NYSE MKT Composite Index; and (iii) the
stocks comprising the NYSE MKT Industrial Manufacturing
Index. Total returns assume the reinvestment of all dividends.
Our stock performance may not continue into the future with
the trends similar to those depicted in the accompanying
graph. We neither make nor endorse any predictions as to our
future stock performance.
FORWARD-LOOKING STATEMENTS
Certain statements contained in this Annual Report,
including, without limitation, statements containing the
words “believes,” “anticipates,” “intends,” “targets,” “poised,”
“potential,” “expects” and words of similar import, constitute
“forward-looking statements” within the meaning of Section
27A of the Securities Act of 1933, as amended, and Section
21E of the Securities Exchange Act of 1934, as amended.
These statements may include projections of revenue, income
or loss, capital expenditures, capital structure, or other
financial items, statements regarding our plans and objectives
for future operations, statements regarding our acquisition
strategy, statements regarding the growth potential of
Energy Steel, statements of future economic performance,
statements of the assumptions underlying or relating to any
of the foregoing statements, and statements which are other
than statements of historical fact. These statements involve
known and unknown risks, uncertainties and other factors
that may cause our actual results to be materially different
from any future results implied by the forward-looking
statements. Such factors include, but are not limited to,
the risks and uncertainties identified by us under the heading
“Risk Factors” and elsewhere in our accompanying Annual
Report on Form 10-K.
Graham Corp.
NYSE MKT Industrial Manufacturing Index
NYSE MKT Composite Index
`09 `10 `11 `12 `13 `14
400
350
300
250
200
150
100
50
0