Embed Size (px)
Citation preview
General rights Copyright and moral rights for the publications made accessible in the public portal are retained by the authors and/or other copyright owners and it is a condition of accessing publications that users recognise and abide by the legal requirements associated with these rights.
• Users may download and print one copy of any publication from the public portal for the purpose of private study or research. • You may not further distribute the material or use it for any profit-making activity or commercial gain • You may freely distribute the URL identifying the publication in the public portal
If you believe that this document breaches copyright please contact us providing details, and we will remove access to the work immediately and investigate your claim.
Downloaded from orbit.dtu.dk on: Jul 04, 2018
Grain boundary mediated hydriding phase transformations in individual polycrystallinemetal nanoparticles
Alekseeva, Svetlana; Bastos da Silva Fanta, Alice; Iandolo, Beniamino; Antosiewicz, Tomasz J.;Nugroho, Ferry Anggoro Ardy; Wagner, Jakob Birkedal; Burrows, Andrew; Zhdanov, Vladimir P.;Langhammer, ChristophPublished in:Nature Communications
Link to article, DOI:10.1038/s41467-017-00879-9
Publication date:2017
Document VersionPublisher's PDF, also known as Version of record
Link back to DTU Orbit
Citation (APA):Alekseeva, S., Bastos da Silva Fanta, A., Iandolo, B., Antosiewicz, T. J., Nugroho, F. A. A., Wagner, J. B., ...Langhammer, C. (2017). Grain boundary mediated hydriding phase transformations in individual polycrystallinemetal nanoparticles. Nature Communications, 8(1), [1084]. DOI: 10.1038/s41467-017-00879-9
ARTICLE
Grain boundary mediated hydriding phasetransformations in individual polycrystallinemetal nanoparticlesSvetlana Alekseeva1, Alice Bastos da Silva Fanta2, Beniamino Iandolo2,5, Tomasz J. Antosiewicz 1,3,
Ferry Anggoro Ardy Nugroho 1, Jakob B. Wagner2, Andrew Burrows2, Vladimir P. Zhdanov1,4
& Christoph Langhammer 1
Grain boundaries separate crystallites in solids and influence material properties, as widely
documented for bulk materials. In nanomaterials, however, investigations of grain boundaries
are very challenging and just beginning. Here, we report the systematic mapping of the role of
grain boundaries in the hydrogenation phase transformation in individual Pd nanoparticles.
Employing multichannel single-particle plasmonic nanospectroscopy, we observe large var-
iation in particle-specific hydride-formation pressure, which is absent in hydride decom-
position. Transmission Kikuchi diffraction suggests direct correlation between length and
type of grain boundaries and hydride-formation pressure. This correlation is consistent with
tensile lattice strain induced by hydrogen localized near grain boundaries as the dominant
factor controlling the phase transition during hydrogen absorption. In contrast, such corre-
lation is absent for hydride decomposition, suggesting a different phase-transition pathway.
In a wider context, our experimental setup represents a powerful platform to unravel
microstructure–function correlations at the individual-nanoparticle level.
DOI: 10.1038/s41467-017-00879-9 OPEN
1 Department of Physics, Chalmers University of Technology, Göteborg 412 96, Sweden. 2 Center for Electron Nanoscopy, Technical University of Denmark,Fysikvej, 2800 Kgs Lyngby, Denmark. 3 Centre of New Technologies, University of Warsaw, Banacha 2c, Warsaw 02-097, Poland. 4 Boreskov Institute ofCatalysis, Russian Academy of Sciences, Novosibirsk 630090, Russia. 5Present address: Department of Microtechnology and Nanotechnology, TechnicalUniversity of Denmark, Ørsteds Pl., 2800 Kgs Lyngby, Denmark. Correspondence and requests for materials should be addressed toC.L. (email: [email protected])
NATURE COMMUNICATIONS |8: 1084 |DOI: 10.1038/s41467-017-00879-9 |www.nature.com/naturecommunications 1

Phase transformations in solids are of broad technologicalrelevance in various applications including fabrication ofmetal alloys1, 2, and also in numerous other contexts such
as lithium ion batteries3, 4 and hydrogen storage systems5.Mechanistically, such transformations typically are induced bysorption of solute atoms that results in the decrease of free energy.In such processes, grain boundaries are very important becausethey may enhance diffusion inside a polycrystal6, act as sinks forthe accumulation of impurities or segregated elements due totheir different energetics7, 8, and serve as mediators for plasticdeformation9, 10. The corresponding experimental and theoreticalstudies focused on bulk materials can be tracked for many dec-ades. In nanomaterials science, however, this subject is very littleexplored for two reasons. First of all, in very small nanoparticlesthe particle structure tends to relax to the single-crystal state.Second, for larger structures, where polycrystallinity is morelikely, the investigation of grain boundaries is very challenging,despite the availability of high-resolution electron microscopy11,X-ray imaging, and diffraction12–14 techniques.
A particular field where grain boundaries are expected to beimportant mediators for both thermodynamic15, 16 and kinetic6
properties is hydrogen in metals and hydride formation. Thisphenomenon is traditionally associated with hydrogen embrit-tlement17 and hydrogen storage5, as well as the use of metalhydrides as hydrogen sensors18. To this end, the interplaybetween lattice coherency strain and dislocation nucleation in theparticle-size dependence of hydride formation has recently beeninvestigated for single-crystal Pd nanoparticles11, 12, 14, 19–22.
Here we address a different but equally important aspect ofsolute-induced phase transitions by mapping out the role of grainboundaries and grain size in polycrystalline nanoparticles withnanosized grains, at the single-nanoparticle level. In such systems,grain boundaries are expected to be of significant importance dueto the relative abundance of grain boundary sites compared tobulk materials with larger grains16, 23–27. We employ a multi-channel variant of plasmonic nanospectroscopy20, which enables
measurements of the individual response from up to 10 nano-particles simultaneously, during both hydrogen absorption anddesorption, and combine it with transmission electron micro-scopy (TEM) and transmission Kikuchi diffraction (TKD)28. Thisis an advance compared with the state of the art11, 14, 19, 20, 22, 29,30, where only sequential measurements of individual nano-particles are possible, meaning that artifacts due to measurement-to-measurement variations cannot be avoided. At the same timewe also highlight that in plasmonic nanospectroscopy, theobtained information is spatially averaged over the entire particle,in contrast to the recent electron energy loss spectroscopy and X-ray studies, where the hydride-formation process can be spatiallyresolved inside a single nanoparticle11, 14.
Employing this platform, we reveal the details of Pdnanoparticle-grain-boundary structure, type and orientation, andfind correlation between length and type of grain boundaries inindividual nanoparticles, and their hydride-formation pressure.Using an analytical model, we identify tensile lattice strain,induced by hydrogen atoms near grain boundaries, as the mainfactor controlling the phase transition during hydrogen absorp-tion. This indicates that polycrystalline nanoparticles can beunderstood as agglomerate of single crystallites that exhibitsimilar characteristics to “free” nanocrystals, whose interaction ismediated by the grain boundaries.
ResultsPlasmonic nanospectroscopy–electron microscopy correlation.Electron back-scatter diffraction (EBSD) is often the first choicewhen grain boundary microstructure characterization of materi-als is required31–34.
However, it lacks the spatial resolution necessary for studyingnanocrystalline materials35–37. Since the recent seminal work ofKeller and Geiss on the sister technique TKD28, this limitationhas been ameliorated, and a spatial resolution on the scale of 5nm can be achieved38. Furthermore, TKD does not require flatbulk specimens, as it is the case for EBSD, which enables the
c
ba
ed
Fig. 1 Experimental platform. Plasmonic nanospectroscopy is combined with transmission Kikuchi diffraction (TKD) and transmission electron microscopy(TEM). a Artist’s rendition of the TEM-window platform with a Cr mirror layer grown beneath the membrane. This mirror layer enables multichannelsingle-particle plasmonic nanospectroscopy based on enhanced visible light back-scattering under dark-field illumination conditions, using the slit of aspectrometer (indicated as the two dark rectangles) to select the desired sample area. b CCD image through the spectrometer slit, showing a set ofindividual Pd nanoparticles as bright dots on the TEM membrane with Cr mirror underneath. Employing the slit to select a region on the sample, it becomespossible to image and spectroscopically address up to 10 single nanoparticles simultaneously, provided all are well-separated along the slit axis. The scalebar is 20 μm. c Artist’s rendition of the TEM-window platform in “electron microscopy mode” after removal of the Cr mirror layer to enhance electron-transparency of the specimen. In TKD, using a state-of-the-art Bruker OPTIMUSTM detector, the electron beam enters the specimen from the backside andthe detector collects the Kikuchi diffraction pattern in transmission mode. d TEM image and e corresponding TKD grain orientation map of a single Pdnanoparticle (see Fig. 5 for corresponding grain orientation legend), which can be directly correlated with the plasmonic nanospectroscopy experiment byidentifying the same nanoparticles in both experiments. The scale bar is 50 nm
ARTICLE NATURE COMMUNICATIONS | DOI: 10.1038/s41467-017-00879-9
2 NATURE COMMUNICATIONS |8: 1084 |DOI: 10.1038/s41467-017-00879-9 |www.nature.com/naturecommunications

investigation of nanoparticles (Supplementary Fig. 1). However,TKD has yet to be explored in this field (SupplementaryDiscussion). Like TEM, it requires an electron-transparentspecimen, as experiments are done in a transmission configura-tion. Conventional TEM grids or membranes are, however,problematic for plasmonic nanospectroscopy because ofthe relatively small grid spacing or etched cavities in themembranes, which cause stray light scattering or block some ofthe incoming/scattered light at the low angles that are typicallyrequired.
To overcome these limitations, we have developed a solutionbased on TEM “windows” that consist of a 40 nm electron-transparent amorphous Si3N4 membrane39, combined with thereversible physical vapor deposition of a 10 nm Cr layer on thebackside of the membrane, to enable TKD and plasmonicnanospectroscopy from the same sample (Fig. 1). As finitedifference time-domain (FDTD) simulations of the light scatter-ing by a single Pd nanodisk reveal, the Cr layer acts as a mirrorthat creates interference effects (Fig. 2a, b; Supplementary Figs. 2and 3). These effects enhance the intensity of light back-scatteredfrom the Pd nanoparticles (which generally are poor scatterers40),and thus make them visible on a CCD-chip. After the experiment,the Cr mirror layer is removed by wet etching from the backside(assuring that the etch does not interact with the nanoparticles) totransform the sample to its electron microscopy compatible state.This facilitates TKD and TEM analysis on the same single
nanoparticles as those probed in operando by the plasmonicnanospectroscopy. The cycle can be repeated multiple times bysubsequently growing and removing the Cr layer.
Plasmonic nanospectroscopy of hydrogen sorption. Plasmonicnanospectroscopy of hydrogen sorption relies on the fact that thelocalized surface plasmon resonance (LSPR) frequency of ahydride-forming metal nanoparticle is proportional to thehydrogen uptake throughout the α-phase region at low-hydrogenpartial pressure where hydrogen is diluted at low concentration ina solid solution; the α + β-phase-coexistence region (“plateau”) atthe first-order phase transition to and from the hydride (β-phase);and finally, the pure β-phase region at high-hydrogen partialpressure18, 41, 42. For our specific system, this concept has beencorroborated by employing again FDTD simulations, whichpredict a distinct decrease of the Pd nanoparticle LSPR peak-scattering intensity, ΔPI, and a spectral shift, Δλmax, of the LSPRpeak to the blue upon transition from the metallic to the hydridestate (Fig. 2c). This agrees well with the experimentally observedresponse of a single Pd nanodisk upon hydride formation(Fig. 2d) and thus confirms that tracking the ΔPI or Δλmax signalmakes it possible to record optical pressure-composition p-Cisotherms of single nanoparticles. As these two signals are pro-portional (Supplementary Fig. 4), we will use these two readoutsinterchangeably.
� (nm)
Sca
tterin
g (a
. u.)
In α-phaseIn β-phaseS
catte
ring
into
NA
= 0
.6 (
a.u.
)
Pd on TEM/Cr
PdH0.667 on TEM/Cr
� (nm)
420 460 500 540 460 500 540 580
Si3N4
Cr
k
EMonitor for far-fieldpropagation
Pd/PdH disk
0
0.1
0.2
0.3
0.4
0.5
0.6
0.7
400 500 600 700 800 900
Nea
r−fie
ld s
catte
ring
(a.u
.)
Top, Si3N4
Bottom, Si3N4
Top, Si3N4/Cr
Bottom, Si3N4/Cr
� (nm)
a b
c d
Fig. 2 Finite difference time domain (FDTD) simulations. a Artist’s rendition of the simulation scheme, where a Pd/PdHx nanodisk is placed on top of a 40nm silicon nitride layer with a 10 nm Cr mirror below. A broadband Gaussian beam with TM polarization is incident onto the disk at 55° to mimic the dark-field illumination conditions of the plasmonic nanospectroscopy experiment. A combined scattered and reflected signal is collected above the structure andthe Gaussian source, and then propagated into the far field, where it is analyzed. The reflected Gaussian beam is subtracted to obtain the scattered signal,which is integrated in the conical angle set by the numerical aperture of the collection lens and constitutes the “measured” signal in simulations.b Calculated backward and forward-directed scattering from a Pd nanodisk (diameter 140 nm, thickness 30 nm) placed on a TEM window in presence andabsence of the Cr mirror layer underneath the membrane. The placement of the Cr mirror increases the backward/forward scattering ratio by a factor ofca. 6. c Calculated backward scattering into an objective with N.A.= 0.6 of a Pd nanodisk in the metallic (blue line) and fully hydrided (red line) state locatedon a TEM window with Cr mirror layer. d Corresponding experimentally measured dark-field scattering spectra of a Pd nanodisk located on a TEM windowwith Cr mirror layer in the metallic (blue line) and fully hydrided (red line) state. The scale bar in the inset TEM image of the Pd nanodisk is 20 nm.See Supplementary Discussion for further details
NATURE COMMUNICATIONS | DOI: 10.1038/s41467-017-00879-9 ARTICLE
NATURE COMMUNICATIONS |8: 1084 |DOI: 10.1038/s41467-017-00879-9 |www.nature.com/naturecommunications 3
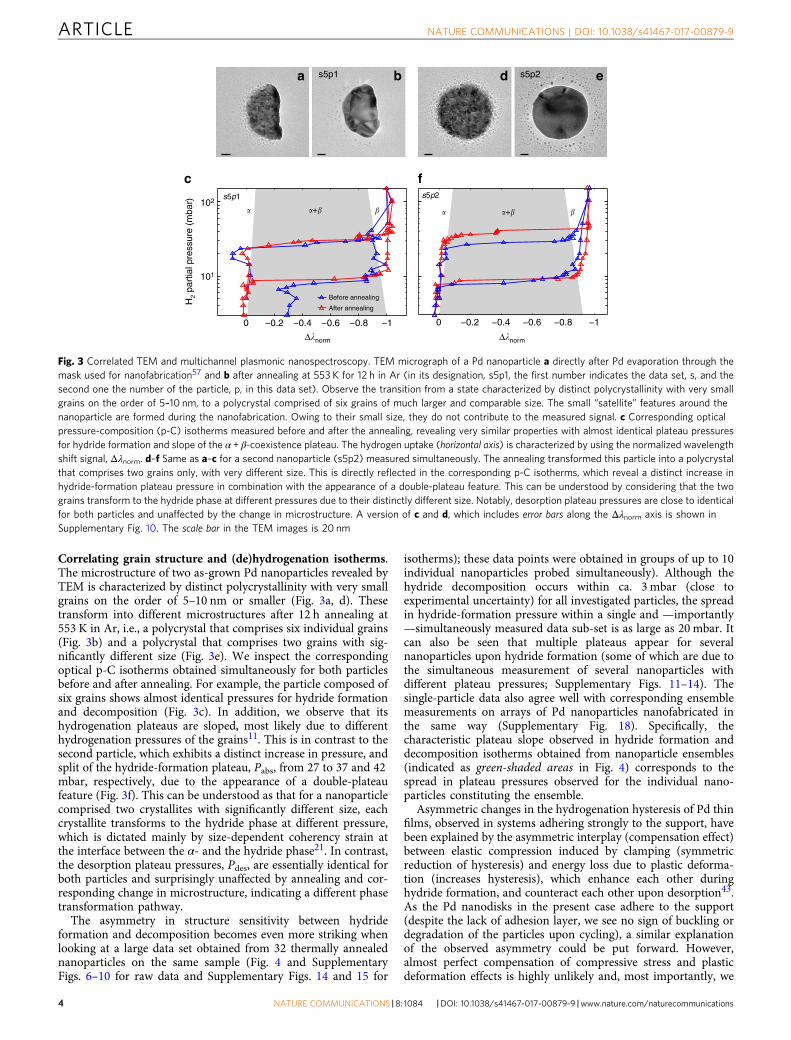
Correlating grain structure and (de)hydrogenation isotherms.The microstructure of two as-grown Pd nanoparticles revealed byTEM is characterized by distinct polycrystallinity with very smallgrains on the order of 5–10 nm or smaller (Fig. 3a, d). Thesetransform into different microstructures after 12 h annealing at553 K in Ar, i.e., a polycrystal that comprises six individual grains(Fig. 3b) and a polycrystal that comprises two grains with sig-nificantly different size (Fig. 3e). We inspect the correspondingoptical p-C isotherms obtained simultaneously for both particlesbefore and after annealing. For example, the particle composed ofsix grains shows almost identical pressures for hydride formationand decomposition (Fig. 3c). In addition, we observe that itshydrogenation plateaus are sloped, most likely due to differenthydrogenation pressures of the grains11. This is in contrast to thesecond particle, which exhibits a distinct increase in pressure, andsplit of the hydride-formation plateau, Pabs, from 27 to 37 and 42mbar, respectively, due to the appearance of a double-plateaufeature (Fig. 3f). This can be understood as that for a nanoparticlecomprised two crystallites with significantly different size, eachcrystallite transforms to the hydride phase at different pressure,which is dictated mainly by size-dependent coherency strain atthe interface between the α- and the hydride phase21. In contrast,the desorption plateau pressures, Pdes, are essentially identical forboth particles and surprisingly unaffected by annealing and cor-responding change in microstructure, indicating a different phasetransformation pathway.
The asymmetry in structure sensitivity between hydrideformation and decomposition becomes even more striking whenlooking at a large data set obtained from 32 thermally annealednanoparticles on the same sample (Fig. 4 and SupplementaryFigs. 6–10 for raw data and Supplementary Figs. 14 and 15 for
isotherms); these data points were obtained in groups of up to 10individual nanoparticles probed simultaneously). Although thehydride decomposition occurs within ca. 3 mbar (close toexperimental uncertainty) for all investigated particles, the spreadin hydride-formation pressure within a single and —importantly—simultaneously measured data sub-set is as large as 20 mbar. Itcan also be seen that multiple plateaus appear for severalnanoparticles upon hydride formation (some of which are due tothe simultaneous measurement of several nanoparticles withdifferent plateau pressures; Supplementary Figs. 11–14). Thesingle-particle data also agree well with corresponding ensemblemeasurements on arrays of Pd nanoparticles nanofabricated inthe same way (Supplementary Fig. 18). Specifically, thecharacteristic plateau slope observed in hydride formation anddecomposition isotherms obtained from nanoparticle ensembles(indicated as green-shaded areas in Fig. 4) corresponds to thespread in plateau pressures observed for the individual nano-particles constituting the ensemble.
Asymmetric changes in the hydrogenation hysteresis of Pd thinfilms, observed in systems adhering strongly to the support, havebeen explained by the asymmetric interplay (compensation effect)between elastic compression induced by clamping (symmetricreduction of hysteresis) and energy loss due to plastic deforma-tion (increases hysteresis), which enhance each other duringhydride formation, and counteract each other upon desorption43.As the Pd nanodisks in the present case adhere to the support(despite the lack of adhesion layer, we see no sign of buckling ordegradation of the particles upon cycling), a similar explanationof the observed asymmetry could be put forward. However,almost perfect compensation of compressive stress and plasticdeformation effects is highly unlikely and, most importantly, we
101
102
Δ�norm Δ�norm
H2
part
ial p
ress
ure
(mba
r)
a b
c
d e
f
−0.8−0.6−0.4−0.20−1−0.8−0.6−0.4−0.20 −1
After annealing
Before annealing
s5p1 s5p2
s5p1 s5p2
�+� �+�� �� �
Fig. 3 Correlated TEM and multichannel plasmonic nanospectroscopy. TEM micrograph of a Pd nanoparticle a directly after Pd evaporation through themask used for nanofabrication57 and b after annealing at 553 K for 12 h in Ar (in its designation, s5p1, the first number indicates the data set, s, and thesecond one the number of the particle, p, in this data set). Observe the transition from a state characterized by distinct polycrystallinity with very smallgrains on the order of 5–10 nm, to a polycrystal comprised of six grains of much larger and comparable size. The small “satellite” features around thenanoparticle are formed during the nanofabrication. Owing to their small size, they do not contribute to the measured signal. c Corresponding opticalpressure-composition (p-C) isotherms measured before and after the annealing, revealing very similar properties with almost identical plateau pressuresfor hydride formation and slope of the α + β-coexistence plateau. The hydrogen uptake (horizontal axis) is characterized by using the normalized wavelengthshift signal, Δλnorm. d–f Same as a–c for a second nanoparticle (s5p2) measured simultaneously. The annealing transformed this particle into a polycrystalthat comprises two grains only, with very different size. This is directly reflected in the corresponding p-C isotherms, which reveal a distinct increase inhydride-formation plateau pressure in combination with the appearance of a double-plateau feature. This can be understood by considering that the twograins transform to the hydride phase at different pressures due to their distinctly different size. Notably, desorption plateau pressures are close to identicalfor both particles and unaffected by the change in microstructure. A version of c and d, which includes error bars along the Δλnorm axis is shown inSupplementary Fig. 10. The scale bar in the TEM images is 20 nm
ARTICLE NATURE COMMUNICATIONS | DOI: 10.1038/s41467-017-00879-9
4 NATURE COMMUNICATIONS |8: 1084 |DOI: 10.1038/s41467-017-00879-9 |www.nature.com/naturecommunications

have also observed the same asymmetry in structure sensitivity ofthe two hysteresis branches for single-crystalline colloidalnanoparticles of different size and shape, which are not clampedby the support20. Therefore, we argue that the reason for theasymmetry is related to not only the thermodynamics but, evenmore importantly at the present relatively low temperatures, tothe kinetics of dislocation formation. For example, the metalatom mass-transport during plastic deformation is expected to bedifferent in the metal and hydride phases, due to, for example,spatial constraints induced by the presence of hydrogen atoms inthe hydride phase and/or the difference in spatial localization ofthe hydride–gas, metal–gas, and hydride–metal interfaces. Con-sequently, dislocation formation is expected to be governed bydifferent kinetics during hydride formation and decomposition,constituting a reason for the observed asymmetry. However, atpresent the understanding of dislocation formation kinetics ingeneral, and especially in nanoparticles and during hydrideformation/decomposition, is very limited44–46, preventing a morerigorous and quantitative analysis beyond the recent work byGriessen et al.21, which is in good agreement with our data.
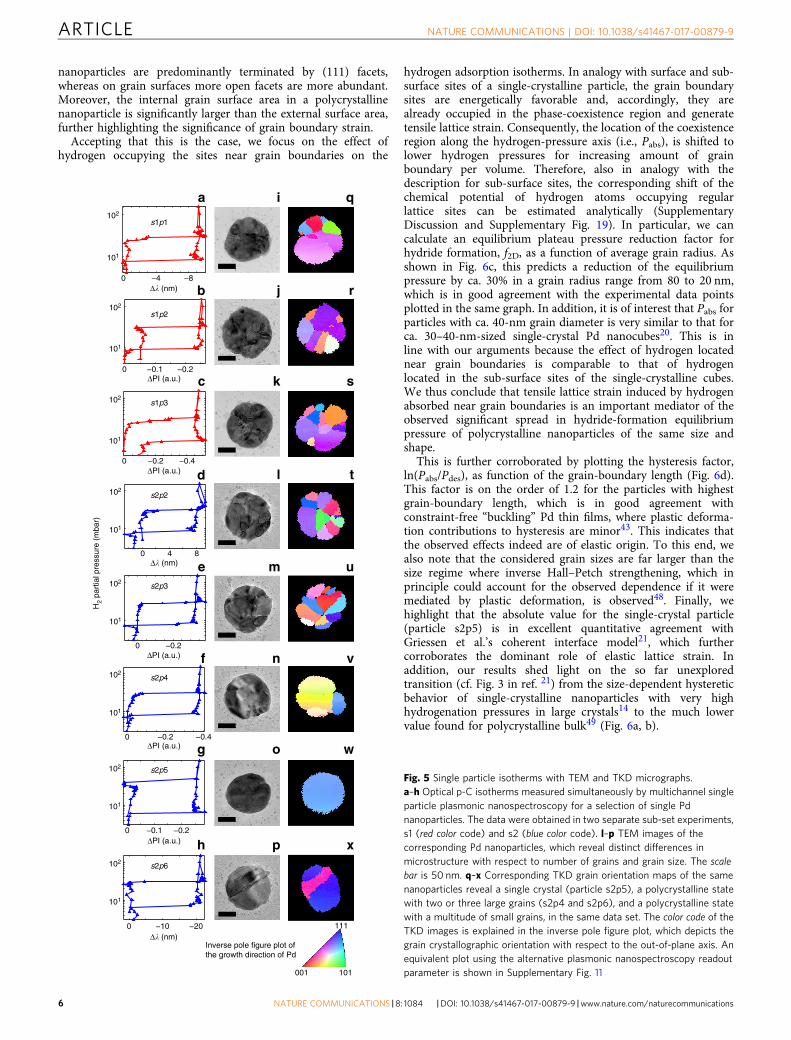
Role of grain boundaries in hydriding phase transformations.To investigate the origin of the single-nanoparticle-specifichydrogenation characteristics identified in Fig. 4, we show inFig. 5 a selection (the remaining isotherms are presented inSupplementary Figs. 12 and 13) of optical single particle p-Cisotherms from data sets 1 and 2, together with correspondingTEM images and TKD grain orientation maps. Furthermore,high-resolution TEM images reveal lattice fringes for eachnanoparticle (Supplementary Fig. 17), in agreement withcolumnar grains stretching from the substrate through the entireparticle. However, they also show that the disk surfaces are notterminated with well-defined large facets with a specific orienta-tion. From TKD, significant differences in microstructure char-acteristics become apparent at the individual-nanoparticle level,both in terms of number of grains, grain size, and grain orien-tation. For example, in data set 2, nanoparticle s2p2 is a poly-crystal with 12 grains, whereas s2p5 is a single crystal. Comparingtheir p-C isotherms reveals significantly wider hysteresis for thesingle crystal. We therefore employ the unique opportunitiesoffered by TKD to further characterize the microstructure of theindividual nanoparticles by extracting quantitative descriptorssuch as total number of grains, average grain size, grain boundarylength and fraction of high-angle grain boundaries (HAGB—defined as grains with lattice orientation mismatch >15°), and oftwin boundaries. We then correlate these data with the infor-mation obtained from the plasmonic nanospectroscopy.
As the first descriptor, we chose the number of grains presentin a nanoparticle as identified by TKD and plot it for allnanoparticles included in data sets 1 and 2 as a function of thehydride-formation plateau pressure (Fig. 6a). For comparison, wealso include one data point from an unannealed Pd nanodisk(s5p2) as an example of the limit where grain boundaries anddefects are highly abundant (grains of 10 nm or smaller). We finda clear correlation between number of grains and plateaupressure, Pabs, with the single crystal (particle s2p5 in Fig. 5)exhibiting the highest Pabs value. For a larger number of grainsPabs appears to asymptotically approach a value on the order of25 mbar. This trend is even more accentuated when plotting Pabsvs. the total grain-boundary length present in the nanoparticles(Fig. 6b).
Grain-boundary tension. To rationalize the results obtained sofar, we recall that hydride formation in single-crystalline Pdnanoparticles can be understood in terms of hydrogen–hydrogeninteractions, lattice strain, surface tension, sub-surface hydrogen,and the energetics of dislocation formation14, 19–22. These factorsare significant for particles in the 1–1000 nm regime, very muchdepending on the specific effect. In bulk polycrystalline Pd, thegrain size is typically much larger, and therefore an influence ofgrain boundaries on hydrogen sorption isotherms is not wellmanifested, except that hydrogen diffusion has been reported tobe influenced6, 16 and that for nanosized grains the phase-coexistence region has been observed to shrink23, 24.
Focusing on polycrystalline nanoparticles, in analogy with theparticle surface and sub-surface regions of a single crystal, grainboundaries possess boundary tension that induces intrinsic latticestrain and provides energetically favorable sites for hydrogen tooccupy. Under comparable conditions, the grain-boundarytension is expected to be smaller than the particle size-relatedsurface tension of a single-crystal nanoparticle because themetal–metal bonds at the grain boundaries are more saturated.In contrast, the number of energetically favorable sites (per unitarea) for hydrogen at grain boundaries, and thus their relativeimportance, is larger (due to the specifics of their structure47)than at the nanoparticle surface because the surfaces of
5
10
15
20
25
30
35
40
45
50
Set 1 Set 2 Set 3 Set 4 Set 5
P (
mba
r)
p2p1p8p7p1 p2 p3 p4 p1 p2 p3 p4 p5 p6 p7 p9 p10 p1 p2 p3 p4 p5 p6 p7 p8 p1 p2 p3 p4 p6p5
Fig. 4 (De)hydrogenation pressures of single Pd nanoparticles. The α + βequilibrium plateau pressures for hydrogen absorption (crosses in the upperpart) and desorption (crosses in the lower part) were determined from thecorresponding hydrogenation traces (Supplementary Figs. 6–10) measuredat 303 K for different single particles in data sub-sets s1, 2, 3, 4, and 5. Themeasurements on the particles in each sub-set were performed at the sametime using multichannel single particle plasmonic nanospectroscopy. Sub-set 1 and 2 were located on the membrane region of the sample, whereassub-set 3 and 4 were located on the bulk-area of the TEM-windowsubstrate, adjacent to the membrane area (Supplementary Fig. 5). Sub-set5 was on a separate sample. Particles in sub-sets s1–4 were annealed for 12h at 743 K in Ar, and the particles in sub-set 5 were annealed for 12 h at553 K in Ar. The green-shaded areas indicate the plateau slope observed inhydride formation and decomposition isotherms obtained from nanoparticleensembles nanofabricated using the same procedure (SupplementaryFig. 18). Clearly, the slope coincides with the spread in plateau pressuresobserved for individual nanoparticles. The error bars (or small dots fordesorption) represent the difference in pressure between the low and highpressure end of the plateau at the phase transition in the single-particleexperiments [20]. However, in cases where the plateau spans directlybetween two data points, the true plateau width is expected to be lower andthus not resolved in our experiment (the single-crystalline particle s2p5 is agood example)
NATURE COMMUNICATIONS | DOI: 10.1038/s41467-017-00879-9 ARTICLE
NATURE COMMUNICATIONS |8: 1084 |DOI: 10.1038/s41467-017-00879-9 |www.nature.com/naturecommunications 5
nanoparticles are predominantly terminated by (111) facets,whereas on grain surfaces more open facets are more abundant.Moreover, the internal grain surface area in a polycrystallinenanoparticle is significantly larger than the external surface area,further highlighting the significance of grain boundary strain.
Accepting that this is the case, we focus on the effect ofhydrogen occupying the sites near grain boundaries on the
hydrogen adsorption isotherms. In analogy with surface and sub-surface sites of a single-crystalline particle, the grain boundarysites are energetically favorable and, accordingly, they arealready occupied in the phase-coexistence region and generatetensile lattice strain. Consequently, the location of the coexistenceregion along the hydrogen-pressure axis (i.e., Pabs), is shifted tolower hydrogen pressures for increasing amount of grainboundary per volume. Therefore, also in analogy with thedescription for sub-surface sites, the corresponding shift of thechemical potential of hydrogen atoms occupying regularlattice sites can be estimated analytically (SupplementaryDiscussion and Supplementary Fig. 19). In particular, we cancalculate an equilibrium plateau pressure reduction factor forhydride formation, f2D, as a function of average grain radius. Asshown in Fig. 6c, this predicts a reduction of the equilibriumpressure by ca. 30% in a grain radius range from 80 to 20 nm,which is in good agreement with the experimental data pointsplotted in the same graph. In addition, it is of interest that Pabs forparticles with ca. 40-nm grain diameter is very similar to that forca. 30–40-nm-sized single-crystal Pd nanocubes20. This is inline with our arguments because the effect of hydrogen locatednear grain boundaries is comparable to that of hydrogenlocated in the sub-surface sites of the single-crystalline cubes.We thus conclude that tensile lattice strain induced by hydrogenabsorbed near grain boundaries is an important mediator of theobserved significant spread in hydride-formation equilibriumpressure of polycrystalline nanoparticles of the same size andshape.
This is further corroborated by plotting the hysteresis factor,ln(Pabs/Pdes), as function of the grain-boundary length (Fig. 6d).This factor is on the order of 1.2 for the particles with highestgrain-boundary length, which is in good agreement withconstraint-free “buckling” Pd thin films, where plastic deforma-tion contributions to hysteresis are minor43. This indicates thatthe observed effects indeed are of elastic origin. To this end, wealso note that the considered grain sizes are far larger than thesize regime where inverse Hall–Petch strengthening, which inprinciple could account for the observed dependence if it weremediated by plastic deformation, is observed48. Finally, wehighlight that the absolute value for the single-crystal particle(particle s2p5) is in excellent quantitative agreement withGriessen et al.’s coherent interface model21, which furthercorroborates the dominant role of elastic lattice strain. Inaddition, our results shed light on the so far unexploredtransition (cf. Fig. 3 in ref. 21) from the size-dependent hystereticbehavior of single-crystalline nanoparticles with very highhydrogenation pressures in large crystals14 to the much lowervalue found for polycrystalline bulk49 (Fig. 6a, b).
Fig. 5 Single particle isotherms with TEM and TKD micrographs.a–h Optical p-C isotherms measured simultaneously by multichannel singleparticle plasmonic nanospectroscopy for a selection of single Pdnanoparticles. The data were obtained in two separate sub-set experiments,s1 (red color code) and s2 (blue color code). l–p TEM images of thecorresponding Pd nanoparticles, which reveal distinct differences inmicrostructure with respect to number of grains and grain size. The scalebar is 50 nm. q–x Corresponding TKD grain orientation maps of the samenanoparticles reveal a single crystal (particle s2p5), a polycrystalline statewith two or three large grains (s2p4 and s2p6), and a polycrystalline statewith a multitude of small grains, in the same data set. The color code of theTKD images is explained in the inverse pole figure plot, which depicts thegrain crystallographic orientation with respect to the out-of-plane axis. Anequivalent plot using the alternative plasmonic nanospectroscopy readoutparameter is shown in Supplementary Fig. 11
−8−40
s1p1
101
102
101
102
101
102
101
102
101
102
101
102
101
102
H2
part
ial p
ress
ure
(mba
r)
Δ� (nm)
−0.2−0.10
s1p2
ΔPI (a.u.)
−0.4−0.20
s1p3
ΔPI (a.u.)
0 4 8
s2p2
Δ� (nm)
−0.20
s2p3
ΔPI (a.u.)
−0.4−0.20
s2p4
ΔPI (a.u.)
−0.2−0.10
s2p5
ΔPI (a.u.)
−20−100
s2p6
101
102
Δ� (nm)
q
r
s
u
t
v
w
x
111
001 101
Inverse pole figure plot of the growth direction of Pd
a
b
c
e
d
f
g
h
i
j
k
m
l
n
o
p
ARTICLE NATURE COMMUNICATIONS | DOI: 10.1038/s41467-017-00879-9
6 NATURE COMMUNICATIONS |8: 1084 |DOI: 10.1038/s41467-017-00879-9 |www.nature.com/naturecommunications

Another aspect of grain boundaries that has been observed innanocrystalline films16, 23 is a characteristic narrowing of themiscibility gap. Inspection of our data in this respect does notreveal a significant correlation between grain-boundary lengthand width of the miscibility gap. We argue that the reason is theuncertainty of the Δλ readout parameter, which is on the order ofa few nm in the present case, and caused by the spectrally broadpeak of the LSPR in Pd due to interband-damping50. Thisresolution is not enough to resolve this effect in the presentregime of particles being comprised of 1–15 grains, where it is notexpected to be very pronounced. However, we also note that, forparticle s5p2 (Fig. 3f), where the change in microstructure fromthe before to after annealing state is much more drastic, there is aquite clear indication of a widening of the miscibility gap afterannealing, when the sample comprises two grains only.
Role of grain boundary type. As the last step we further deepenour analysis by distinguishing two grain boundary types, i.e., twinboundaries (fulfilling the twin relationship of 60° lattice
misorientation about the (111) axis, which is most common in fccmaterials) and HAGBs with lattice mismatch >15°. Low-anglegrain boundaries are either completely lacking or <1% abundantand thus ignored. Figure 6e shows the corresponding TKDimages for our single nanoparticles for data sets 1 and 2, with thegrain boundaries highlighted and categorized in these two classes.Clearly, the relative abundance of the respective class varieswidely from particle to particle. From a hydrogen sorptionenergetics point of view, this is relevant because twin boundariesare more close-packed than HAGBs and thus energetically moresimilar to bulk sites inside the grain. Hence, within the frameworkoutlined above, the presence of twin boundaries is expected toinfluence the hydride-formation equilibrium pressure to a lesserextent than HAGBs. When plotting the HAGB length normalizedby the total length of all grain boundaries, we indeed observe atrend towards larger reduction of the equilibrium pressure for theparticles where the HAGBs are most abundant (Fig. 6f). Finally,we mention that a competing contribution of dislocation for-mation inside the individual (single crystalline) grains as
0 5 10 15 many
Number of grains0 200 400 600 800 Large
Grain boundary length (nm)
0.7
0.8
0.9
1
f 2D
Singless1p4
s2p1s2p10s5p2
Grain radius (nm)
0 10 20 30 40 50 60 70 80
0 200 400 600 800 Large1
1.2
1.4
1.6
1.8
2
Grain boundary length (nm)
s5p2 before annealing
a b c
d
Pab
s (m
bar)
f
0 0.1 0.2 0.3 0.4 0.5 0.6 0.7 0.826
28
30
32
34
36
38
HAGB length/total GB lengthHigh-angle grain boundaries (HAGB)
Twin boundaries
s2p2
s2p6
s2p3 s2p4
s1p1 s1p2 s1p3
s2p7 s2p9
20
25
30
35
40
45
50P
abs
(mba
r)
Bulk
ln (P
abs/P
des)
e
Fig. 6 Grain structure–hydrogenation pressure correlations. The data forming the basis of this figure are summarized in Supplementary Table 1. a Theequilibrium plateau pressure upon hydride formation measured by plasmonic nanospectroscopy plotted as a function of number of grains. The red circlescorrespond to data points obtained from single nanoparticles (cf. Fig. 5 and Supplementary Fig. 12). The magenta crosses correspond to the disk-shapedparticle shown in Fig. 3d and e, before and after annealing (particle s5p2). The blue, black, and turquoise stars represent averaged plateau pressures for datapoints corresponding to multiple particles (cf. Supplementary Fig. 13), i.e., particles not resolved in the plasmonic nanospectroscopy experiment. The greenstar depicts the hydrogenation pressure for bulk Pd obtained by Lässer and Klatt49. We refer also to Supplementary Fig. 20 for an alternative representationof the same data. b Equilibrium hydrogenation plateau pressure as a function of grain-boundary length. c Hydrogenation plateau pressure as a function ofaverage grain radius (left y axis). The grain radius was calculated from the TKD images by determining the area of a grain and then taking the radius of acircle with the same area. In the same graph, we also plot the theoretically calculated equilibrium plateau pressure reduction factor for hydride formation,f2D, (right y axis) as a function of average grain radius. d Hysteresis factor, ln(Pabs/Pdes), as a function of grain boundary length. e TKD images of the samenanoparticles shown in Fig. 5, but with grain boundaries highlighted and categorized into high-angle grain boundaries (HAGBs—black lines) and twinboundaries (red lines). f Corresponding plot of HAGB fraction of total grain boundary length vs. equilibrium hydrogenation plateau pressure. Thecorresponding plots for absolute HAGB length and twin-boundary length are shown in Supplementary Fig. 21
NATURE COMMUNICATIONS | DOI: 10.1038/s41467-017-00879-9 ARTICLE
NATURE COMMUNICATIONS |8: 1084 |DOI: 10.1038/s41467-017-00879-9 |www.nature.com/naturecommunications 7

mediator for the observed variations of hydrogenation pressure ishighly unlikely in view of the fact that our grains, with grain radiiof 45 nm or below (Fig. 6c), are significantly smaller that thecritical size for dislocation formation identified by Ulvestadet al14.
Concerning the hydride decomposition, it occurs from thestate when the entire lattice is occupied by hydrogen and whenlattice expansion is caused primarily by hydrogen at regularinterstitial sites inside the grain. Accordingly, the role of grain-boundary sites, and thus of grain boundaries, on Pdes is expectedto be (much) less important. This may explain why thedistribution of Pdes (Fig. 4) is very narrow and microstructureindependent.
In summary, multichannel plasmonic nanospectroscopy iseffective for probing up to 10 individual functional nanoparticlesin situ and simultaneously. In this way, ensemble averaging andexperiment-to-experiment uncertainty are eliminated, and unam-biguous identification and quantification of single particle-specificeffects are firmly possible. TKD enables characterization ofmicrostructure and grain boundaries in structural materials ingeneral and nanoparticles in particular, with nanometer resolu-tion. We have combined these two techniques, together withTEM imaging, to investigate in detail, at the single-particle level,the role of grain boundaries in the hydrogen-induced phasetransition during hydride formation and decomposition in a largeset of identically sized polycrystalline Pd nanoparticles. As themain results, we find distinct asymmetry in the dependence of thehydride formation and decomposition equilibrium pressures onthe microstructure of individual nanoparticles. The correspond-ing pressure for hydride formation directly correlates with grain-boundary length and grain-boundary type in each particle. Incontrast, microstructure–phase transformation pressure correla-tion is absent for hydride decomposition. Using an analyticalmodel, we identify tensile lattice strain induced by hydrogenabsorption near the grain boundaries as the dominant factorcontrolling the adsorption branch of the phase transition. Thisfinding also implies that, within each grain, the phase transition iscoherent, that is, no sharp phase boundaries between α-and β-phases exist. Thus, it also corroborates an earlier TEM study oncoherent β-phase precipitation in Pd foil51. Furthermore ourdetailed TKD analysis shows that high-angle grain boundaries arethe main contributor, and that twin boundaries are lessimportant. The observed structure-insensitivity of the hydridedecomposition, which we also have observed for single-crystallinenanoparticles20, suggests a different phase-transition pathway,most likely via an incoherent unloading process involving plasticdeformation, as recently proposed by Griessen et al.21 Thus, ourresults indicate that polycrystalline nanoparticles during ahydriding phase transformation can be conceptually understoodas agglomerate of single crystallites exhibiting similar character-istics to “free” nanocrystals, whose interaction is mediated by thegrain boundaries. Moreover, they shed light on the transitionfrom the size-dependent hysteretic behavior of single-crystallinenanoparticles to the much lower hydrogenation pressuresobserved for polycrystalline bulk.
In a wider perspective, we predict that our general approachcan be used to scrutinize the role of grains and grain boundariesin essentially any metal hydride system based on the fact thatnumerous plasmonic sensing studies on ensembles of differenthydride-forming metal nanoparticle systems already exist (e.g.,AuPd alloys52, Mg53, 54, Y55). Furthermore, it can be easilyexpanded to other processes of interest in metallic nanostructureswhere oxidation and reduction are a prominent example. Owingto sizeable mismatch of the lattice spacing between metal andoxide, the formation of grains in the oxide is nearly inevitable andhas long been expected to have a key role in oxidation/reduction
processes (see, e.g., ref. 56 and references therein). The underlyingphysics is, however, still far from clear, especially on the nm scale.
MethodsSample preparation. The Pd nanodisks were fabricated by hole-mask colloidallithography57 using a highly diluted (10−4 wt%) polystyrene sphere (sulfate latex,Interfacial Dynamics Corporation, size 140 nm, evaporated Pd thickness 30 nm)solution and a short incubation time of 10 s, to achieve the low particle densitynecessary for plasmonic nanospectroscopy. The particles were fabricated on square,150 × 150 μm, 40-nm-thick Si3N4 membranes supported by bulk silicon on all foursides39. To facilitate plasmonic nanospectroscopy from the membrane region, a 10nm Cr mirror layer was electron beam evaporated on the backside of the TEMwindows (evaporation rate of 1 Å/s in a Lesker PVD 225 Evaporator, base pressure<5×10⁻⁷ Torr). To transfer the sample into its electron microscopy compatiblestate, the Cr film was removed by applying Cr etch for 2 min (Sunchem AB, NiCretchant 650095, composition: ceric ammonium nitrate 10−15%, nitric acid 15−20%, DI water 60−70%) to the backside of the TEM window.
Single particle dark-field scattering spectroscopy. For the hydrogen sorptionexperiments, the samples were placed in a temperature-controlled and gas-tightmicroscope stage (Linkam, THMS600) that was connected to a set of mass flowcontrollers (Bronkhorst, Low-ΔP-flow and EL-flow) to supply the desired gas flowand concentration to the sample. We used Ar as carrier gas (6.0 purity) and mixedit at different concentrations with 100% H2 gas (6.0 purity), and operated thesystem at atmospheric pressure. After identifying a set of particles aligned with thespectrometer slit (opened 1000 μm, Andor Shamrock SR303i) using an uprightoptical microscope (Nikon Eclipse LV100, Nikon 50 × BD objective) the lightscattered from the particles was dispersed onto a grating (150 lines/mm, blazewavelength 800 nm) from which it was analyzed by a thermoelectrically cooledCCD camera (Andor Newton 920). This limits the maximal number of particlespossible to analyze simultaneously to something between 10 and 25 (the highernumber could be achieved by using electron-beam lithography to nanofabricateparticles aligned in a single row). However, employing concepts like hyperspectralimaging, significantly more particles can be analyzed simultaneously at the cost ofsignificantly decreased data acquisition speed58, 59. The illumination source of themicroscope was a 50W halogen lamp (Nikon LV-HL50W LL). Normalized-scattering spectra Isc from individual nanoantennas were obtained as a function ofwavelength λ using the relation Isc(λ) = (S−D)/CRS, where S is the collected signalfrom an area with nanoantenna, D is the signal from the nearby area withoutnanoantenna (dark signal for background correction taken from an area withidentical pixel width but without particles), and CRS is the signal collected from thediffuse white certified reflectance standard (Labsphere SRS-99-020). CRS is used tocorrect the signal for the lamp spectrum. The acquisition time for each spectrumwas 10 s. Multiple spectra were collected simultaneously by using the Newton CCDcamera in the multi-track readout mode. The obtained single-particle-scatteringspectra were fitted with a Lorentzian function (±50 nm from the peak position) toderive information about the temporal evolution of the peak position and peakintensity. As was previously shown42, 60, the changes in peak position are pro-portional to the hydrogen concentration in the probed Pd particle.
TEM imaging. Bright field TEM images of nanodisks were acquired from the“windows” mentioned earlier, using a Titan 80–300 TEM (FEI) operated at anaccelerating voltage of 300 kV.
TKD analysis. The 40 nm silicon nitride TEM window with the Pd nanoparticleswas mounted on a TKD sample clamp holder with the nanoparticles facingdownward. The holder was installed on a FEI Nova Nano lab 600 stage and thesample was positioned in the microscope in horizontal position (0° tilt) at aworking distance of 5 mm. The microscope was equipped with the recentlyintroduced Bruker OPTIMUSTM TKD detector61 and operated at an accelerationvoltage of 30 kV and a beam current of 6.7 nA, using a 30 µm aperture. Thedetector was positioned in such a way that the smallest distance between theelectron-beam focusing point at the specimen surface and the camera was 15 mm.All measurements were performed in low vacuum mode with a water vaporpressure of 50 Pa using a low vacuum detector placed at the microscope pole piece.Low vacuum was chosen to reduce sample drift. The TKD orientation maps werecollected for each particle with a pattern resolution of 800 × 600 pixels (2 × 2binning), exposure time of 20 ms and step size of 3 nm. Before the data analysis, theraw data were processed to remove uncertain data points and to define a grain.A grain was defined as an area containing at least 3 data points with a mis-orientation larger than 5° with respect to its neighbor. All data sets containing <3points were removed from the raw orientation map. Data analysis was performedusing CrystAlign Bruker and OIM TSL softwares.
FDTD simulations. Calculation of the scattering spectra was done using FDTDSolutions from Lumerical, Inc. A Pd or PdH0.667 disk (140 nm diameter, 30 nmthick) was placed on top of a 40 nm substrate with refractive index 2. Whererelevant, a bottom 10 nm Cr layer was added. The permittivities of metals were
ARTICLE NATURE COMMUNICATIONS | DOI: 10.1038/s41467-017-00879-9
8 NATURE COMMUNICATIONS |8: 1084 |DOI: 10.1038/s41467-017-00879-9 |www.nature.com/naturecommunications
taken from Silkin et al.62 and Palik63 for Pd/PdHx and Cr, respectively. Thestructure was illuminated by a broad Gaussian beam incident at 55° (transverse-magnetic (TM) polarization so both longitudinal and transverse resonances of thedisk can be excited), an angle within the illumination angle band of the dark-fieldsetup. The beam’s axis coincided with the center of the disk. Scattered and reflectedlight was collected across a wide monitor for further propagation into the far fieldto account for the numerical aperture of the collection objective (NA = 0.6). Thescattered light was obtained by subtracting the light reflected from the appropriatesubstrates. The mesh around the disk and in the substrates directly below wasrefined to a size of 1 nm what assured converged results.
Additional calculations were conducted for a plane wave incident source withscattering measurements taken in the intermediate field ca. 150 nm from thegeometrical center of the disk.
Data availability. The data that support the findings of this study are availablefrom the corresponding author upon request.
Received: 10 April 2017 Accepted: 2 August 2017
References1. Smith, T. M. et al. Phase transformation strengthening of high-temperature
superalloys. Nat. Commun. 7, 13434 (2016).2. Li, Z., Pradeep, K. G., Deng, Y., Raabe, D. & Tasan, C. C. Metastable high-
entropy dual-phase alloys overcome the strength–ductility trade-off. Nature534, 227–230 (2016).
3. Li, L. et al. Visualization of electrochemically driven solid-state phasetransformations using operando hard X-ray spectro-imaging. Nat. Commun. 6,6883 (2015).
4. Hu, Y.-Y. et al. Origin of additional capacities in metal oxide lithium-ionbattery electrodes. Nat. Mater. 12, 1130–1136 (2013).
5. Schlapbach, L. & Zuttel, A. Hydrogen-storage materials for mobile applications.Nature 414, 353–358 (2001).
6. Delmelle, R. et al. Effect of structural defects on the hydriding kinetics ofnanocrystalline Pd thin films. Int. J. Hydrogen Energy 40, 7335–7347 (2015).
7. Herbig, M. et al. Atomic-scale quantification of grain boundary segregation innanocrystalline material. Phys. Rev. Lett. 112, 126103 (2014).
8. Frolov, T., Divinski, S. V., Asta, M. & Mishin, Y. Effect of interface phasetransformations on diffusion and segregation in high-angle grain boundaries.Phys. Rev. Lett. 110, 255502 (2013).
9. Yamakov, V., Wolf, D., Phillpot, S. R. & Gleiter, H. Grain-boundary diffusioncreep in nanocrystalline palladium by molecular-dynamics simulation. ActaMater. 50, 61–73 (2002).
10. Yamakov, V., Wolf, D., Phillpot, S. R., Mukherjee, A. K. & Gleiter, H.Dislocation processes in the deformation of nanocrystalline aluminium bymolecular-dynamics simulation. Nat. Mater. 1, 45–49 (2002).
11. Narayan, T. C., Baldi, A., Koh, A. L., Sinclair, R. & Dionne, J. A. Reconstructingsolute-induced phase transformations within individual nanocrystals. Nat.Mater. 15, 768–774 (2016).
12. Ulvestad, A. et al. Avalanching strain dynamics during the hydriding phasetransformation in individual palladium nanoparticles. Nat. Commun. 6, 10092(2015).
13. Hruszkewycz, S. O. et al. High-resolution three-dimensional structuralmicroscopy by single-angle Bragg ptychography. Nat. Mater. 16, 244–251(2016).
14. Ulvestad, A. et al. Three-dimensional imaging of dislocation dynamics duringthe hydriding phase transformation. Nat. Mater. 16, 565–571 (2017).
15. Kirchheim, R. et al. Hydrogen in amorphous and nanocrystalline metals.Mater.Sci. Eng. 99, 457–462 (1988).
16. Mutschele, T. & Kirchheim, R. Segregation and diffusion of hydrogen in grain-boundaries of palladium. Scripta Metall. 21, 135–140 (1987).
17. Fukai Y. The Metal-Hydrogen System: Basic Bulk Properties (Springer, 2005).18. Wadell, C., Syrenova, S. & Langhammer, C. Plasmonic hydrogen sensing with
nanostructured metal hydrides. ACS Nano 8, 11925–11940 (2014).19. Baldi, A., Narayan, T. C., Koh, A. L. & Dionne, J. A. In situ detection of
hydrogen-induced phase transitions in individual palladium nanocrystals. Nat.Mater. 13, 1143–1148 (2014).
20. Syrenova, S. et al. Hydride formation thermodynamics and hysteresis inindividual Pd nanocrystals with different size and shape. Nat. Mater. 14,1236–1244 (2015).
21. Griessen, R., Strohfeldt, N. & Giessen, H. Thermodynamics of the hybridinteraction of hydrogen with palladium nanoparticles. Nat. Mater. 15, 311–317(2016).
22. Narayan, T. C. et al. Direct visualization of hydrogen absorption dynamics inindividual palladium nanoparticles. Nat. Commun. 8, 14020 (2017).
23. Mutschele, T. & Kirchheim, R. Hydrogen as a probe for the average thickness ofa grain boundary. Scripta Metall. 21, 1101–1104 (1987).
24. Eastman, J. A., Thompson, L. J. & Kestel, B. J. Narrowing of the palladium-hydrogen miscibility gap in nanocrystalline palladium. Phys. Rev. B 48, 84–92 (1993).
25. Natter, H., Wettmann, B., Heisel, B. & Hempelmann, R. Hydrogen innanocrystalline palladium. J. Alloys Compd. 253–254, 84–86 (1997).
26. Weissmuller, J. & Lemier, C. Lattice constants of solid solution microstructures:the case of nanocrystalline Pd-H. Phys. Rev. Lett. 82, 213–216 (1999).
27. Lemier, C. & Weissmüller, J. Grain boundary segregation, stress and stretch:effects on hydrogen absorption in nanocrystalline palladium. Acta Mater. 55,1241–1254 (2007).
28. Keller, R. R. & Geiss, R. H. Transmission EBSD from 10 nm domains in ascanning electron microscope. J. Microsc. 245, 245–251 (2012).
29. Liu, N., Tang, M. L., Hentschel, M., Giessen, H. & Alivisatos, A. P.Nanoantenna-enhanced gas sensing in a single tailored nanofocus. Nat. Mater.10, 631–636 (2011).
30. Tang, M. L., Liu, N., Dionne, J. A. & Alivisatos, A. P. Observations of shape-dependent hydrogen uptake trajectories from single nanocrystals. J. Am. Chem.Soc. 133, 13220–13223 (2011).
31. Cayron, C. Quantification of multiple twinning in face centred cubic materials.Acta Mater. 59, 252–262 (2011).
32. Orme, A. D. et al. Insights into twinning in Mg AZ31: a combined EBSD andmachine learning study. Comput. Mater. Sci. 124, 353–363 (2016).
33. Randle, V. Grain boundary engineering: an overview after 25 years. Mater. Sci.Technol. 26, 253–261 (2010).
34. Wright, S. I. & Larsen, R. J. Extracting twins from orientation imagingmicroscopy scan data. J. Microsc. 205, 245–252 (2002).
35. Bastos, A., Zaefferer, S., Raabe, D. & Schuh, C. Characterization of themicrostructure and texture of nanostructured electrodeposited NiCo usingelectron backscatter diffraction (EBSD). Acta Mater. 54, 2451–2462 (2006).
36. Steinmetz, D. R. & Zaefferer, S. Towards ultrahigh resolution EBSD by lowaccelerating voltage. Mater. Sci. Technol. 26, 640–645 (2010).
37. Zaefferer, S. On the formation mechanisms, spatial resolution and intensity ofbackscatter Kikuchi patterns. Ultramicroscopy 107, 254–266 (2007).
38. Trimby, P. W. Orientation mapping of nanostructured materials usingtransmission Kikuchi diffraction in the scanning electron microscope.Ultramicroscopy 120, 16–24 (2012).
39. Grant, A. W., Hu, Q.-H. & Kasemo, B. Transmission electron microscopy‘Windows’ for nanofabricated structures. Nanotechnology 15, 1175 (2004).
40. Langhammer, C., Kasemo, B. & Zoric, I. Absorption and scattering of light byPt, Pd, Ag, and Au nanodisks: absolute cross sections and branching ratios.J. Chem. Phys. 126, 194702 (2007).
41. Zoric, I., Larsson, E. M., Kasemo, B. & Langhammer, C. Localized surfaceplasmons shed light on nanoscale metal hydrides. Adv. Mater. 22, 4628–4633(2010).
42. Ameen Poyli, M. et al. Plasmonic sensing of hydrogen uptake in palladiumnanodisks. J. Phys. Chem. Lett. 3, 2556–2561 (2012).
43. Pivak, Y., Schreuders, H., Slaman, M., Griessen, R. & Dam, B.Thermodynamics, stress release and hysteresis behavior in highly adhesivePd–H films. Int. J. Hydrogen Energy 36, 4056–4067 (2011).
44. Clark, J. N. et al. Three-dimensional imaging of dislocation propagation duringcrystal growth and dissolution. Nat. Mater. 14, 780–784 (2015).
45. Chen, L. Y., He, M.-r., Shin, J., Richter, G. & Gianola, D. S. Measuring surfacedislocation nucleation in defect-scarce nanostructures. Nat. Mater. 14, 707–713(2015).
46. El-Awady, J. A. Unravelling the physics of size-dependent dislocation-mediatedplasticity. Nat. Commun. 6, 5926 (2015).
47. Frolov, T., Olmsted, D. L., Asta, M. & Mishin, Y. Structural phasetransformations in metallic grain boundaries. Nat. Commun. 4, 1899 (2013).
48. Yamakov, V., Wolf, D., Phillpot, S. R., Mukherjee, A. K. & Gleiter, H.Deformation-mechanism map for nanocrystalline metals by molecular-dynamics simulation. Nat. Mater. 3, 43–47 (2004).
49. Lässer, R. & Klatt, K. H. Solubility of hydrogen isotopes in palladium. Phys. Rev.B 28, 748–758 (1983).
50. Zoric, I., Zäch, M., Kasemo, B. & Langhammer, C. Gold, platinum, andaluminum nanodisk plasmons: material independence, subradiance, anddamping mechanisms. ACS Nano 5, 2535–2546 (2011).
51. Ho, E., Goldberg, H. A., Weatherly, G. C. & Manchester, F. D. An in situelectron microscope study of precipitation in palladium-hydrogen alloys. ActaMetall. 27, 841–853 (1979).
52. Wadell, C. et al. Hysteresis-free nanoplasmonic Pd–Au alloy hydrogen sensors.Nano Lett. 15, 3563–3570 (2015).
53. Shegai, T. & Langhammer, C. Hydride formation in single palladium andmagnesium nanoparticles studied by nanoplasmonic dark-field scatteringspectroscopy. Adv. Mater. 23, 4409–4414 (2011).
54. Sterl, F. et al. Magnesium as novel material for active plasmonics in the visiblewavelength range. Nano Lett. 15, 7949–7955 (2015).
55. Strohfeldt, N. et al. Yttrium hydride nanoantennas for active plasmonics. NanoLett. 14, 1140–1147 (2014).
56. Zhdanov, V. P. Oxidation of metal nanoparticles with the grain growth in theoxide. Chem. Phys. Lett. 674, 136–140 (2017).
NATURE COMMUNICATIONS | DOI: 10.1038/s41467-017-00879-9 ARTICLE
NATURE COMMUNICATIONS |8: 1084 |DOI: 10.1038/s41467-017-00879-9 |www.nature.com/naturecommunications 9

57. Fredriksson, H. et al. Hole-mask colloidal lithography. Adv. Mater. 19,4297–4302 (2007).
58. Zopf, D. et al. Hyperspectral imaging of plasmon resonances in metallicnanoparticles. Biosens. Bioelectron. 81, 287–293 (2016).
59. Chen, S., Svedendahl, M., Antosiewicz, T. J. & Käll, M. Plasmon-enhancedenzyme-linked immunosorbent assay on large arrays of individual particlesmade by electron beam lithography. ACS Nano 7, 8824–8832 (2013).
60. Langhammer, C., Larsson, E. M., Kasemo, B. & Zoric,́ I. Indirectnanoplasmonic sensing: ultrasensitive experimental platform for nanomaterialsscience and optical nanocalorimetry. Nano Lett. 10, 3529–3538 (2010).
61. Fundenberger, J. J. et al. Orientation mapping by transmission-SEM with anon-axis detector. Ultramicroscopy 161, 17–22 (2016).
62. Silkin, V. M., Muiño, R. D., Chernov, I. P., Chulkov, E. V. & Echenique, P. M.Tuning the plasmon energy of palladium–hydrogen systems by varying thehydrogen concentration. J. Phys. Condens. Matter 24, 104021 (2012).
63. Palik E. D. Handbook of Optical Constants of Solids (Elsevier, 1997).
AcknowledgementsWe acknowledge financial support from the ERC StG 678941“SINCAT” (C.L.), the Knutand Alice Wallenberg Foundation Project 2015.0057 (C.L.), the Chalmers Areas ofAdvance Nanoscience and Nanotechnology (S.S. and C.L.), the Swedish Foundation forStrategic Research Framework Program RMA11–0037 (F.A.A.N.) the Polish NationalScience Center via the project 2012/07/D/ST3/02152 (T.J.A.) and the Russian FederalAgency for Scientific Organizations (project 0303-2016-0001; V.P.Z.). The researchleading to these results has also received funding from the People Programme (MarieCurie Actions) of the European Union’s Seventh Framework Programme (FP7/2007–2013) under REA Grant Agreement No. 609405 (COFUNDPostdocDTU) (B.I.).We also gratefully acknowledge Bruker Nano GmbH (BNA) for the use of the OPTI-MUSTM TKD detector, P. Tabib Zadeh Adibi for the help with the first TEM char-acterizations, and Daniel Goran from BNA and I. Zorić for useful discussions.
Author contributionsC.L. and S.A. planned the experiments, analyzed the data, and wrote the paper. S.A.nanofabricated the samples and performed the single-particle nanospectroscopy
measurements. A.B., B.I. and A.B.d.S.F. designed the TKD experiments. A.B.d.S.F. per-formed the TKD experiments and analyzed the TKD data. B.I. and J.B.W. planned theTEM experiments. B.I. carried out the TEM experiments. F.A.A.N. performed theensemble measurements. T.J.A. performed the FDTD simulations. V.P.Z. analyzed the-oretically the effect of grain boundaries on absorption isotherms. C.L. conceived thegeneral approach and coordinated the project.
Additional informationSupplementary Information accompanies this paper at doi:10.1038/s41467-017-00879-9.
Competing interest: The authors declare no competing financial interests.
Reprints and permission information is available online at http://npg.nature.com/reprintsandpermissions/
Publisher's note: Springer Nature remains neutral with regard to jurisdictional claims inpublished maps and institutional affiliations.
Open Access This article is licensed under a Creative CommonsAttribution 4.0 International License, which permits use, sharing,
adaptation, distribution and reproduction in any medium or format, as long as you giveappropriate credit to the original author(s) and the source, provide a link to the CreativeCommons license, and indicate if changes were made. The images or other third partymaterial in this article are included in the article’s Creative Commons license, unlessindicated otherwise in a credit line to the material. If material is not included in thearticle’s Creative Commons license and your intended use is not permitted by statutoryregulation or exceeds the permitted use, you will need to obtain permission directly fromthe copyright holder. To view a copy of this license, visit http://creativecommons.org/licenses/by/4.0/.
© The Author(s) 2017
ARTICLE NATURE COMMUNICATIONS | DOI: 10.1038/s41467-017-00879-9
10 NATURE COMMUNICATIONS |8: 1084 |DOI: 10.1038/s41467-017-00879-9 |www.nature.com/naturecommunications