Embed Size (px)
Citation preview
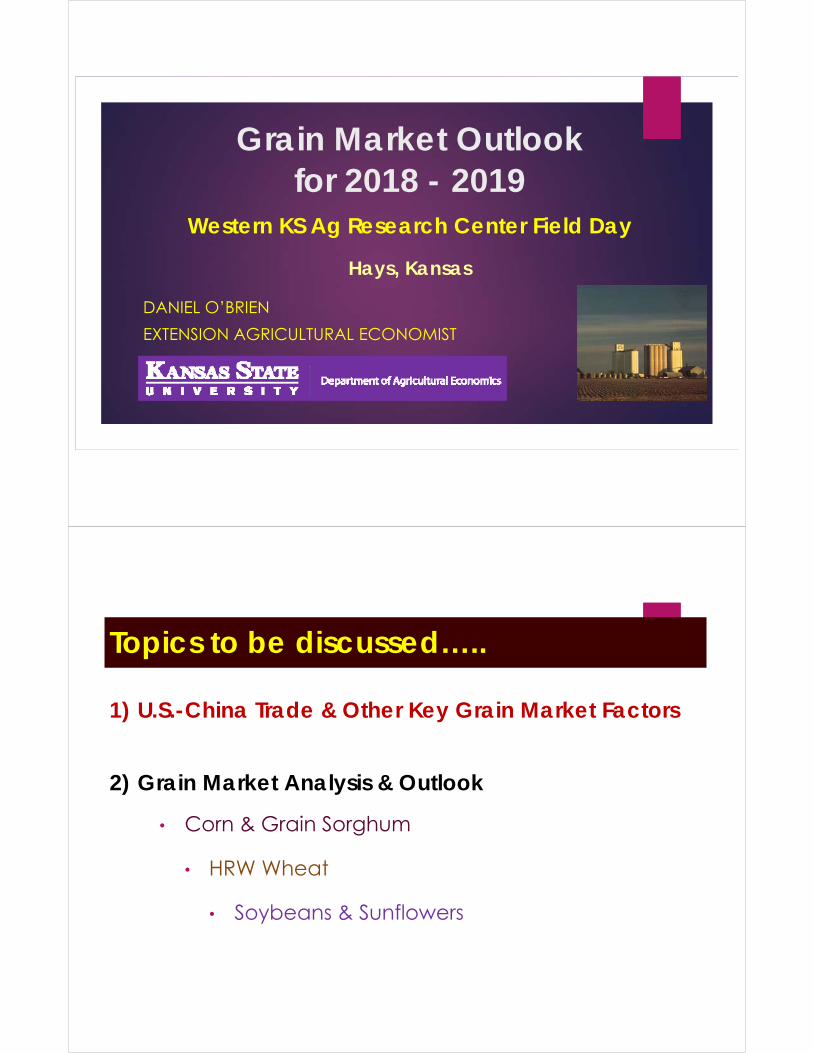
Grain Market Outlook for 2018 - 2019
Western KS Ag Research Center Field Day
Hays, Kansas
DANIEL O’BRIEN
EXTENSION AGRICULTURAL ECONOMIST
Topics to be discussed…..
1) U.S.-China Trade & Other Key Grain Market Factors
2) Grain Market Analysis & Outlook
• Corn & Grain Sorghum
• HRW Wheat
• Soybeans & Sunflowers
Unpredictable Grain Markets in 2018-19
The “Ups & Downs” of U.S. Trade Tensions
• U.S. Abandonment of the Trans Pacific Partnership (TPP)o Potential impact on U.S. wheat exports vs TPP Countries
• U.S. vs China o Soybeans & Sorghum (Need of both “With” & “Without” Scenarios)
• NAFTA (U.S.-Mexico-Canada)o Mexico grain purchases from the U.S.
o Canada grain export competition vs U.S. (Wheat, Oilseeds)
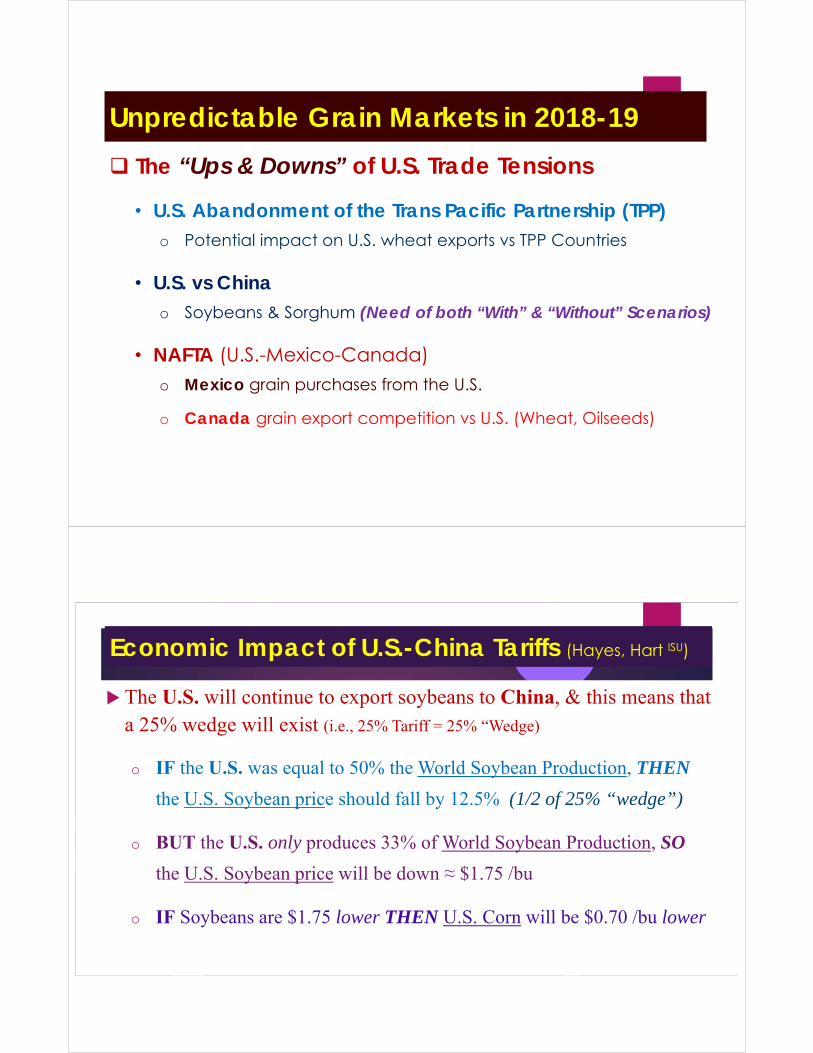
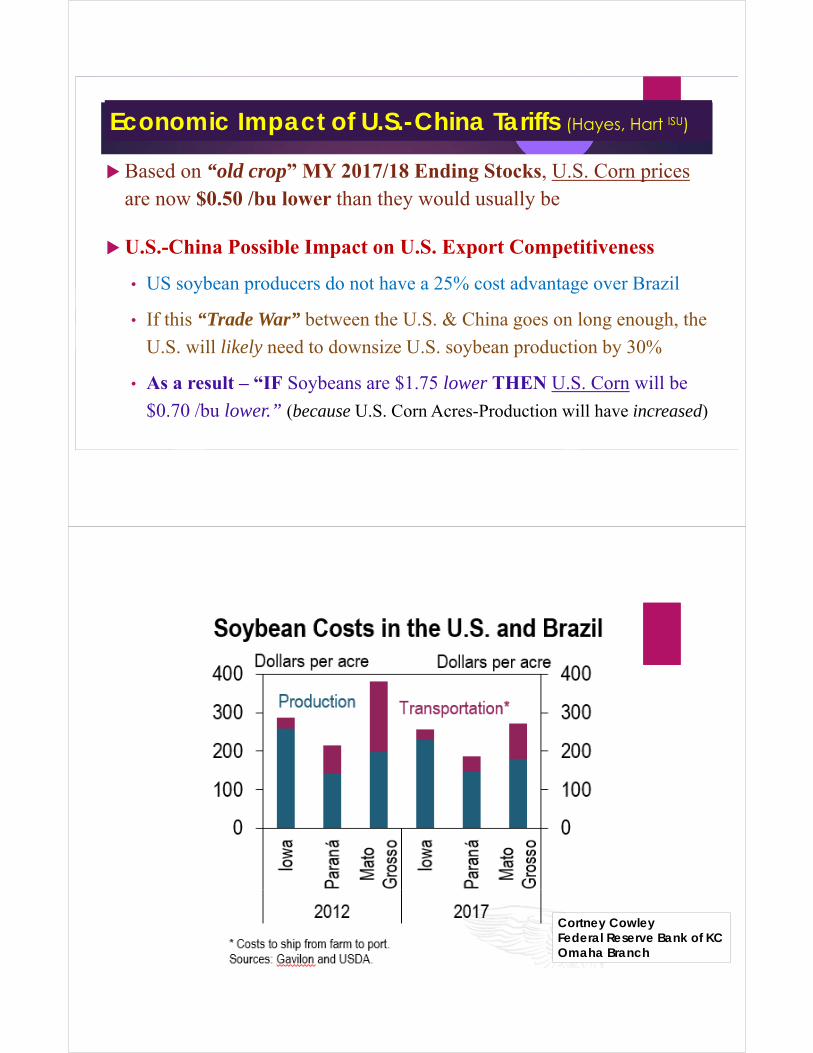
Economic Impact of U.S.-China Tariffs (Hayes, Hart ISU)
The U.S. will continue to export soybeans to China, & this means that a 25% wedge will exist (i.e., 25% Tariff = 25% “Wedge)
o IF the U.S. was equal to 50% the World Soybean Production, THEN
the U.S. Soybean price should fall by 12.5% (1/2 of 25% “wedge”)
o BUT the U.S. only produces 33% of World Soybean Production, SO
the U.S. Soybean price will be down ≈ $1.75 /bu
o IF Soybeans are $1.75 lower THEN U.S. Corn will be $0.70 /bu lower
Economic Impact of U.S.-China Tariffs (Hayes, Hart ISU)
Based on “old crop” MY 2017/18 Ending Stocks, U.S. Corn pricesare now $0.50 /bu lower than they would usually be
U.S.-China Possible Impact on U.S. Export Competitiveness
• US soybean producers do not have a 25% cost advantage over Brazil
• If this “Trade War” between the U.S. & China goes on long enough, the
U.S. will likely need to downsize U.S. soybean production by 30%
• As a result – “IF Soybeans are $1.75 lower THEN U.S. Corn will be
$0.70 /bu lower.” (because U.S. Corn Acres-Production will have increased)
Cortney CowleyFederal Reserve Bank of KCOmaha Branch
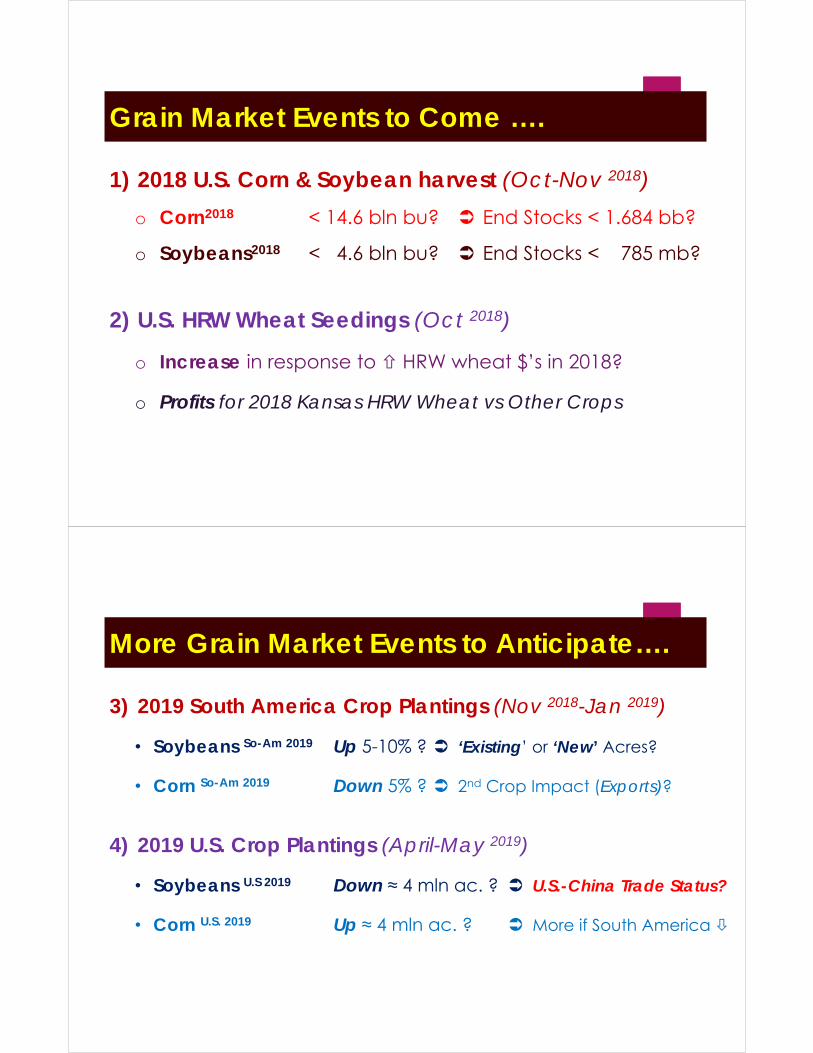
Grain Market Events to Come ….
1) 2018 U.S. Corn & Soybean harvest (Oct-Nov 2018)
o Corn2018 < 14.6 bln bu? End Stocks < 1.684 bb?
o Soybeans2018 < 4.6 bln bu? End Stocks < 785 mb?
2) U.S. HRW Wheat Seedings (Oct 2018)
o Increase in response to HRW wheat $’s in 2018?
o Profits for 2018 Kansas HRW Wheat vs Other Crops
More Grain Market Events to Anticipate….
3) 2019 South America Crop Plantings (Nov 2018-Jan 2019)
• Soybeans So-Am 2019 Up 5-10% ? ‘Existing’ or ‘New’ Acres?
• Corn So-Am 2019 Down 5% ? 2nd Crop Impact (Exports)?
4) 2019 U.S. Crop Plantings (April-May 2019)
• Soybeans U.S 2019 Down ≈ 4 mln ac. ? U.S.-China Trade Status?
• Corn U.S. 2019 Up ≈ 4 mln ac. ? More if South America
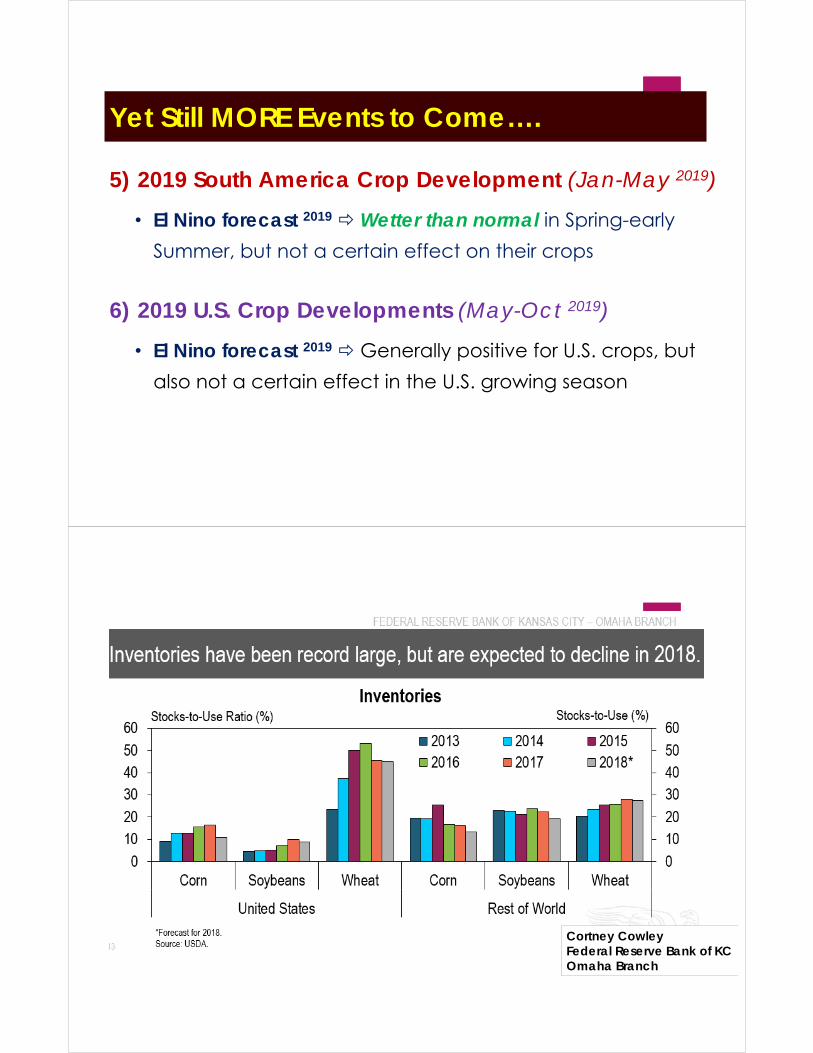
Yet Still MORE Events to Come….
5) 2019 South America Crop Development (Jan-May 2019)
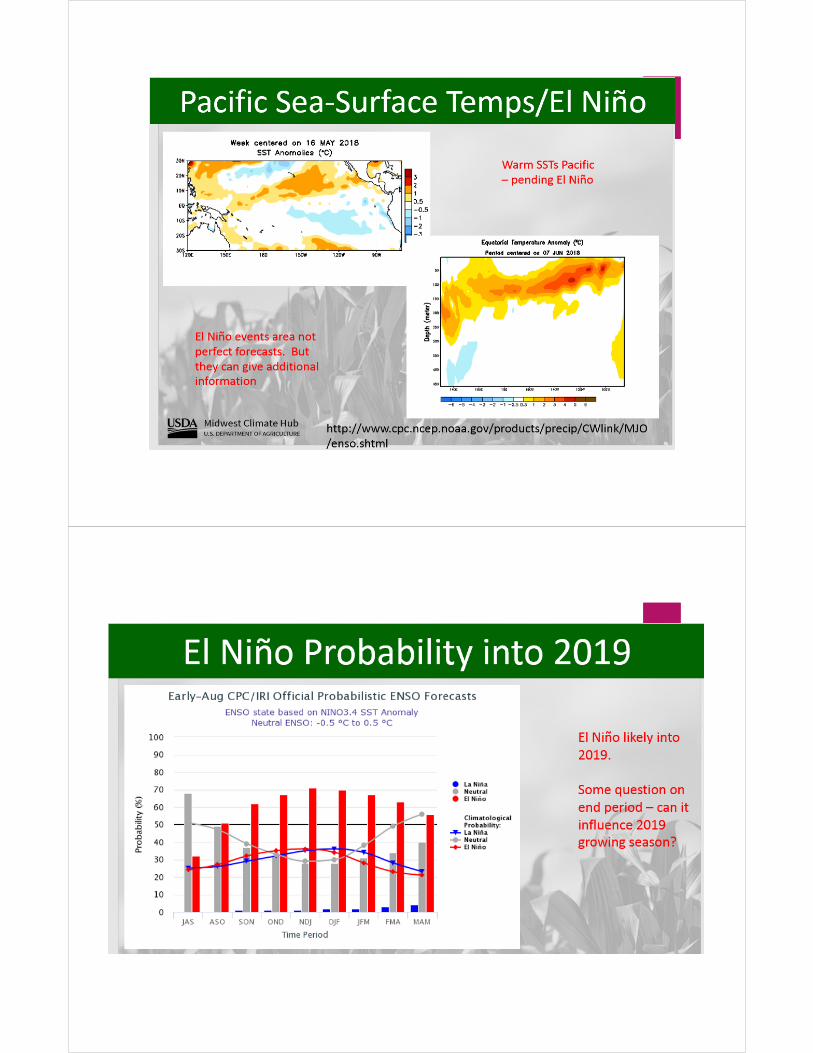
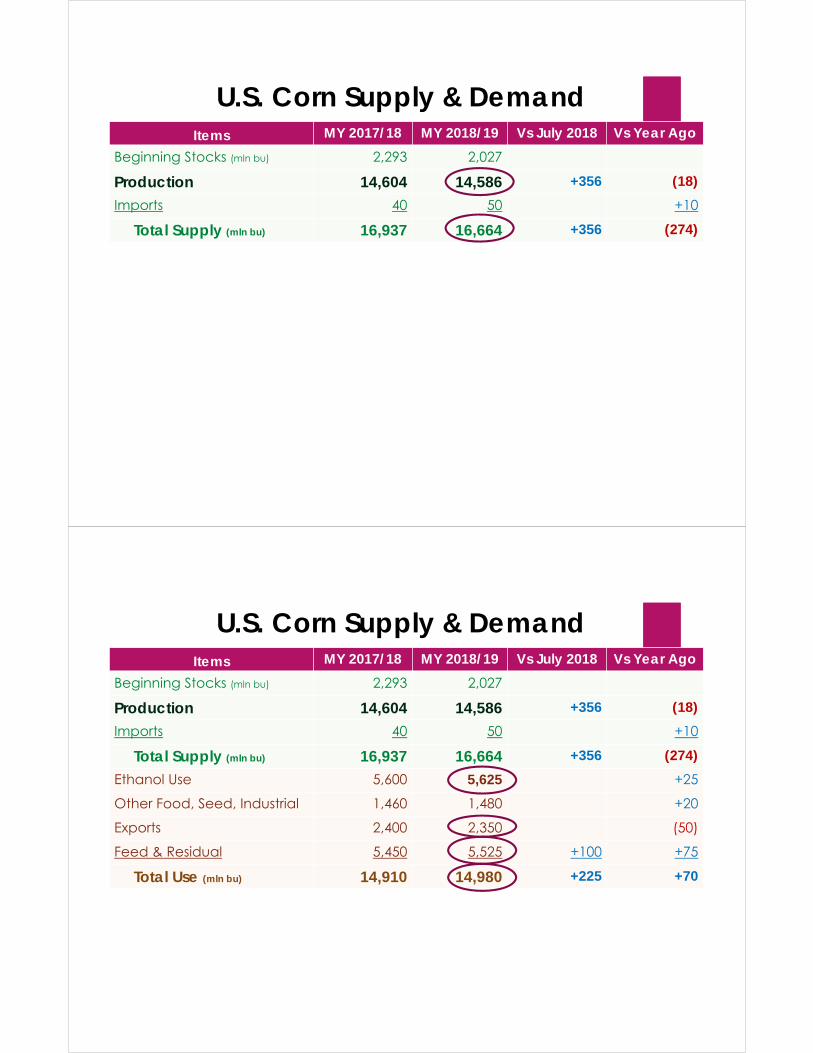
• El Nino forecast 2019 Wetter than normal in Spring-early
Summer, but not a certain effect on their crops
6) 2019 U.S. Crop Developments (May-Oct 2019)
• El Nino forecast 2019 Generally positive for U.S. crops, but
also not a certain effect in the U.S. growing season
Cortney CowleyFederal Reserve Bank of KCOmaha Branch
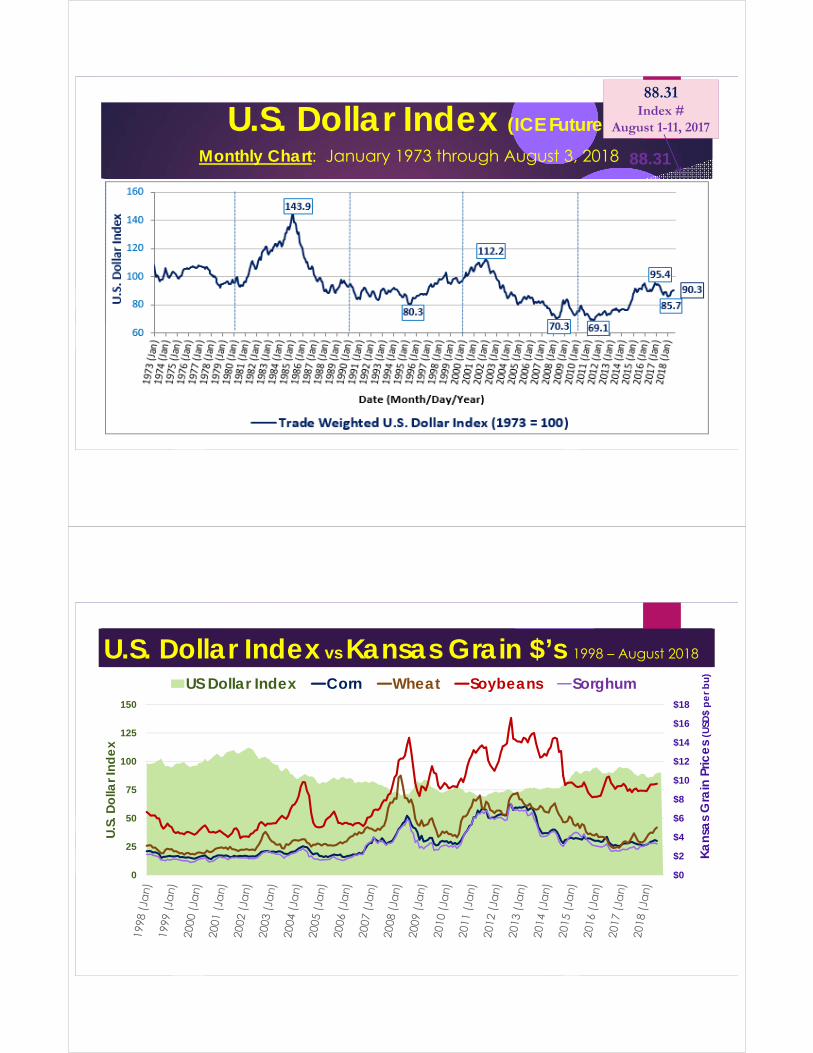
U.S. Dollar Index (ICE Futures)
Monthly Chart: January 1973 through August 3, 2018 88.31
88.31Index #
August 1-11, 2017
U.S. Dollar Index vs Kansas Grain $’s 1998 – August 2018
$0
$2
$4
$6
$8
$10
$12
$14
$16
$18
0
25
50
75
100
125
150K
ans
as
Gra
in P
rice
s (U
SD$
pe
r bu)
U.S
. Do
llar I
nde
x
US Dollar Index Corn Wheat Soybeans Sorghum
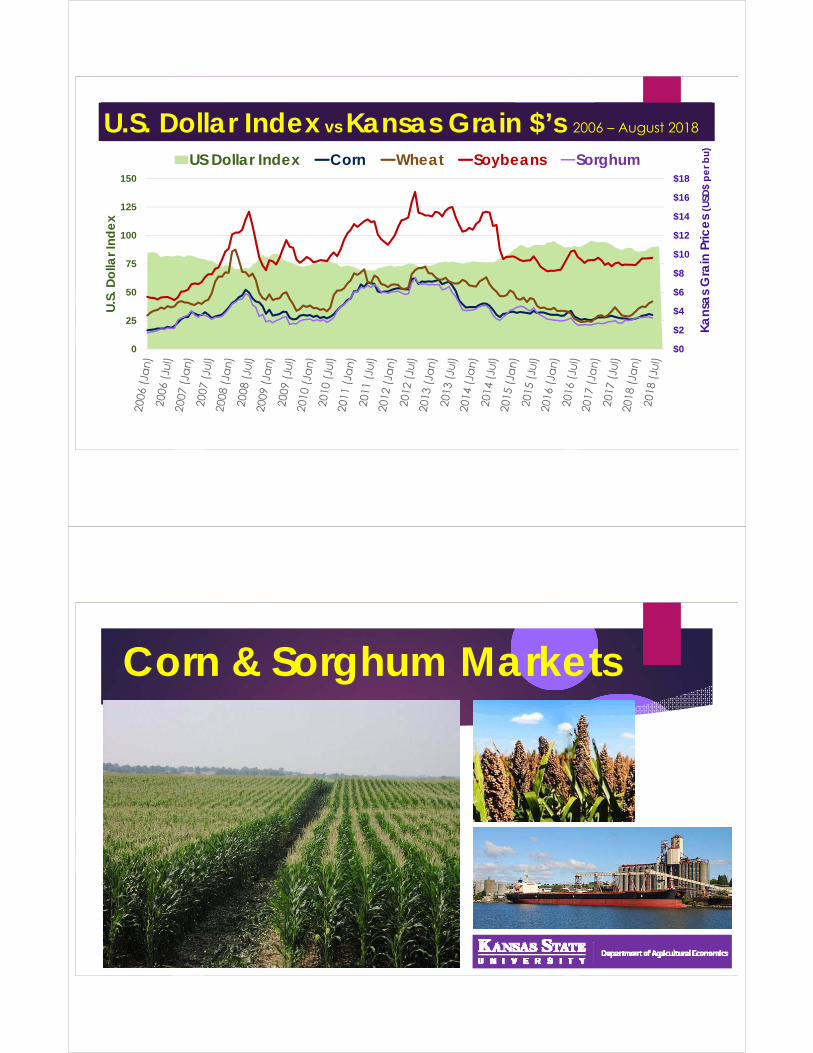
U.S. Dollar Index vs Kansas Grain $’s 2006 – August 2018
$0
$2
$4
$6
$8
$10
$12
$14
$16
$18
0
25
50
75
100
125
150
Ka
nsa
s G
rain
Pric
es
(USD
$ p
er b
u)
U.S
. Do
llar I
nde
x
US Dollar Index Corn Wheat Soybeans Sorghum
Corn & Sorghum Markets
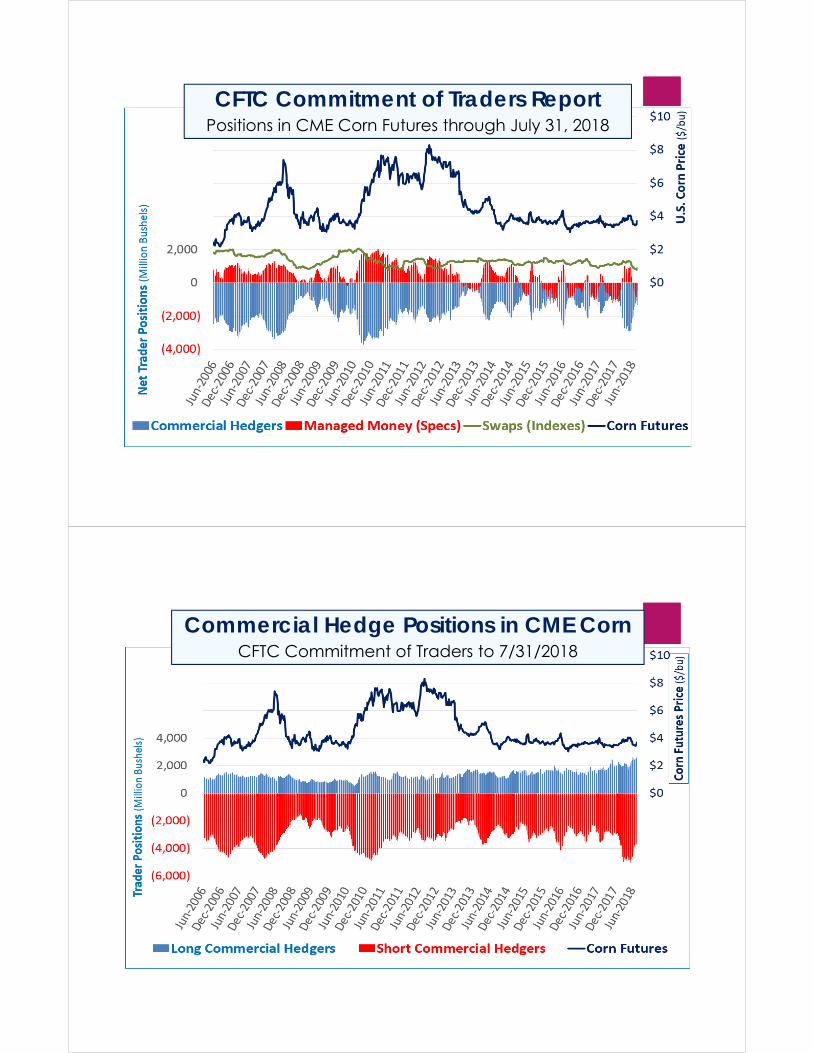
CFTC Commitment of Traders ReportPositions in CME Corn Futures through July 31, 2018
Commercial Hedge Positions in CME CornCFTC Commitment of Traders to 7/31/2018
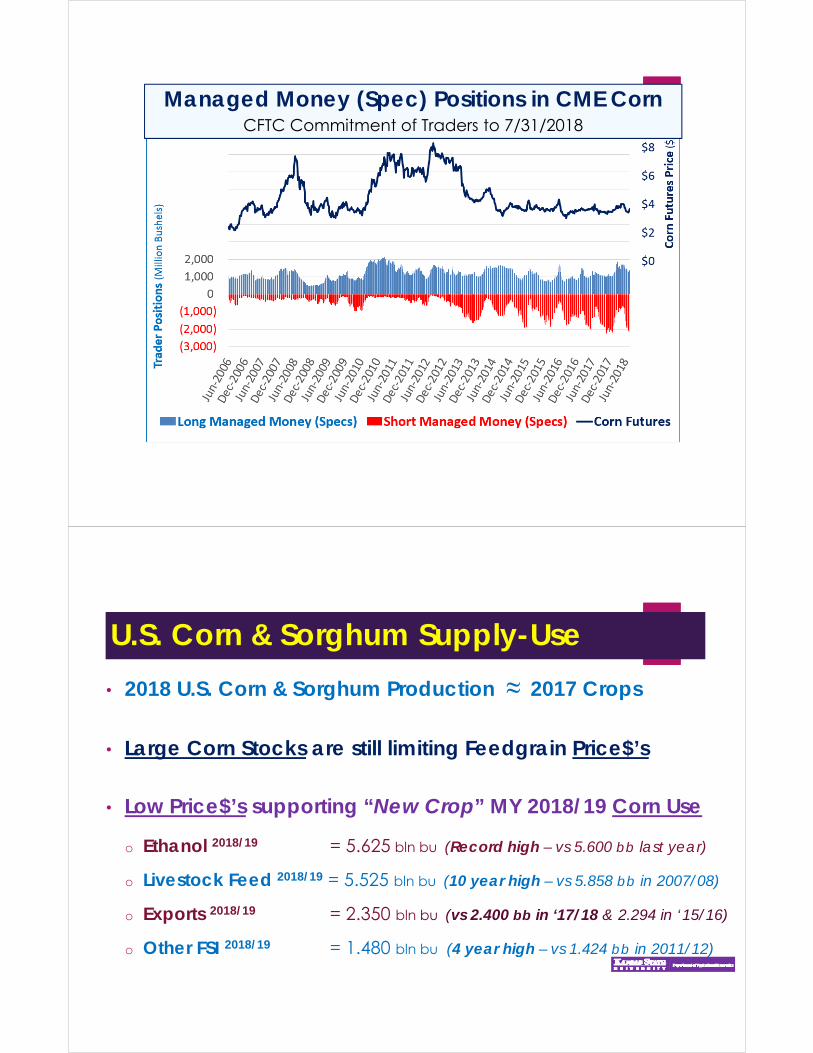
Managed Money (Spec) Positions in CME CornCFTC Commitment of Traders to 7/31/2018
U.S. Corn & Sorghum Supply-Use
• 2018 U.S. Corn & Sorghum Production ≈ 2017 Crops
• Large Corn Stocks are still limiting Feedgrain Price$’s
• Low Price$’s supporting “New Crop” MY 2018/19 Corn Use
o Ethanol 2018/19 = 5.625 bln bu (Record high – vs 5.600 bb last year)
o Livestock Feed 2018/19 = 5.525 bln bu (10 year high – vs 5.858 bb in 2007/08)
o Exports 2018/19 = 2.350 bln bu (vs 2.400 bb in ‘17/18 & 2.294 in ‘15/16)
o Other FSI 2018/19 = 1.480 bln bu (4 year high – vs 1.424 bb in 2011/12)
U.S. Corn & Sorghum Stocks…..
• Corn: “Moderate” Stocks & % S/U
o End Stocks 2018/19 1.684 bln bu (vs 2.027 bb last year)
o % Stocks/Use 2018/19 11.2% S/U (vs 13.6% S/U last year)
• Grain Sorghum: “Low” Price$’s (Exports hurt by trade issues)
o End Stocks 2018/19 40 mln bu ( Exports & Ethanol Use)
o % Stocks/Use 2018/19 10.5% S/U ( vs 12.4% S/U last year)
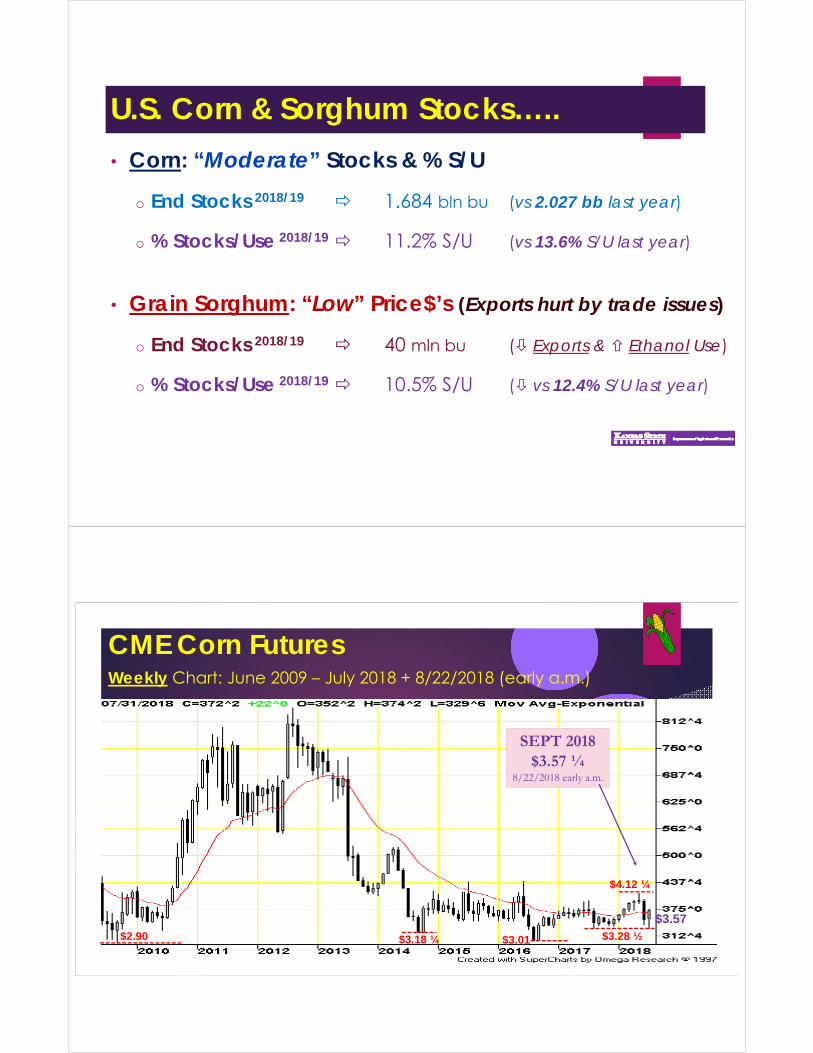
CME Corn FuturesWeekly Chart: June 2009 – July 2018 + 8/22/2018 (early a.m.)
$3.57
$3.01 $3.28 ½ $3.18 ¼
$4.12 ¼
$2.90
SEPT 2018$3.57 ¼
8/22/2018 early a.m.
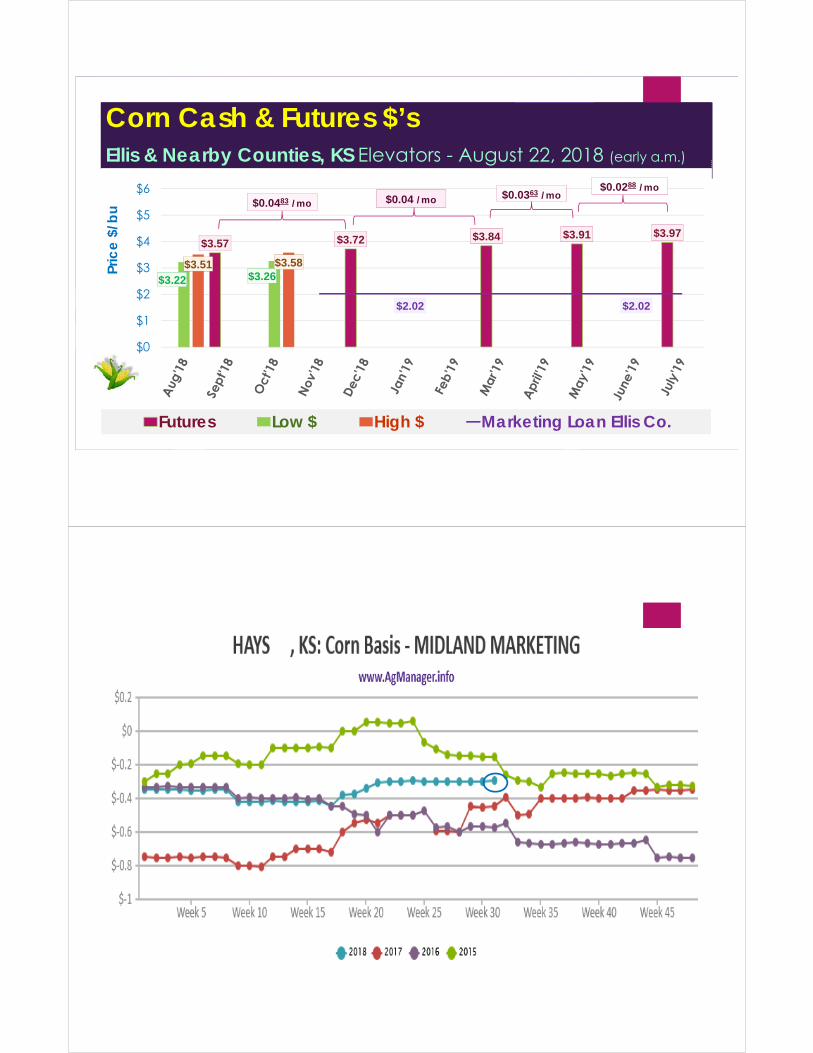
Corn Cash & Futures $’sEllis & Nearby Counties, KS Elevators - August 22, 2018 (early a.m.)
$3.57 $3.72 $3.84 $3.91 $3.97
$3.22 $3.26$3.51 $3.58
$2.02 $2.02
$0
$1
$2
$3
$4
$5
$6
Pric
e $
/bu
Futures Low $ High $ Marketing Loan Ellis Co.
$0.0483 /mo $0.04 /mo $0.0363 /mo$0.0288 /mo
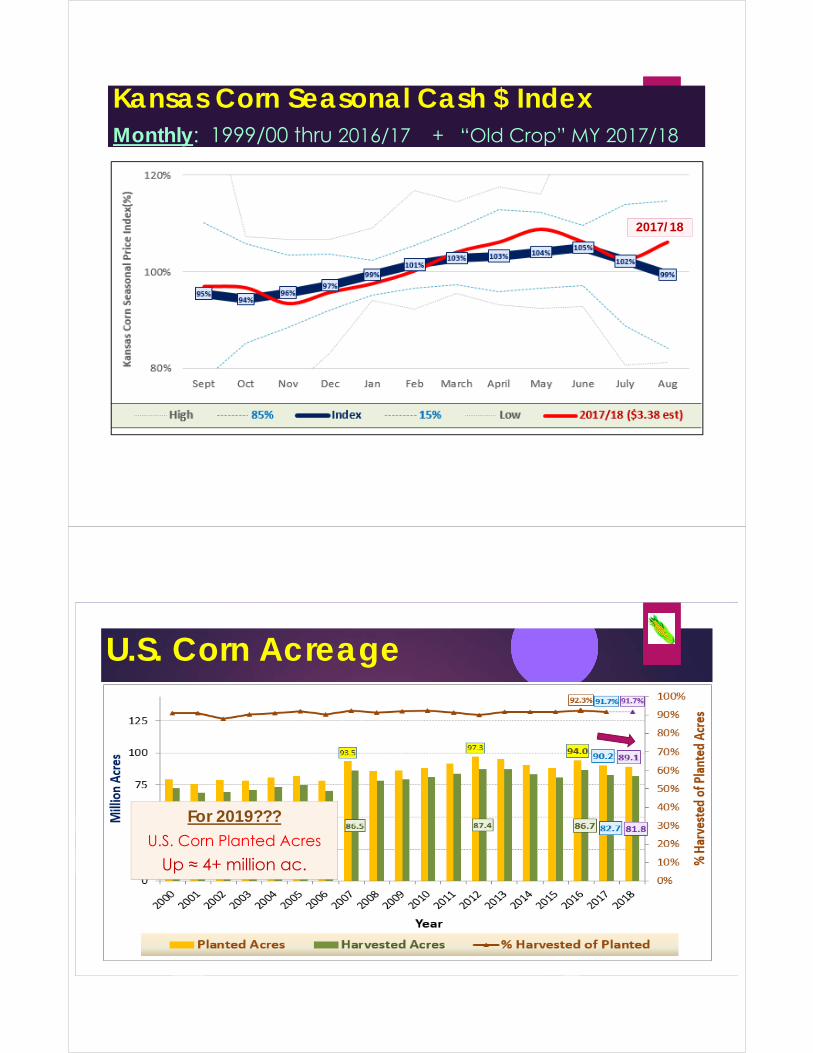
Kansas Corn Seasonal Cash $ IndexMonthly: 1999/00 thru 2016/17 + “Old Crop” MY 2017/18
2017/18
U.S. Corn Acreage
For 2019???U.S. Corn Planted Acres
Up ≈ 4+ million ac.
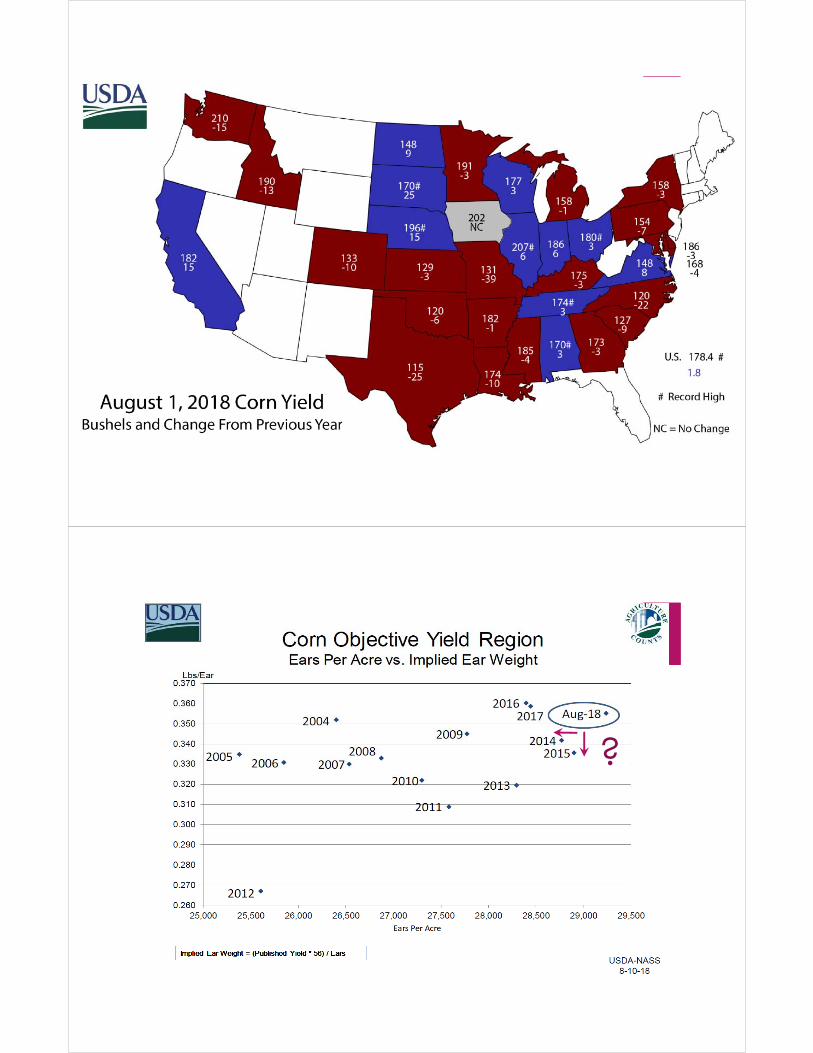
U.S. Corn YieldsUSDA 2017 USDA Forecast = 178.4 bu/ac
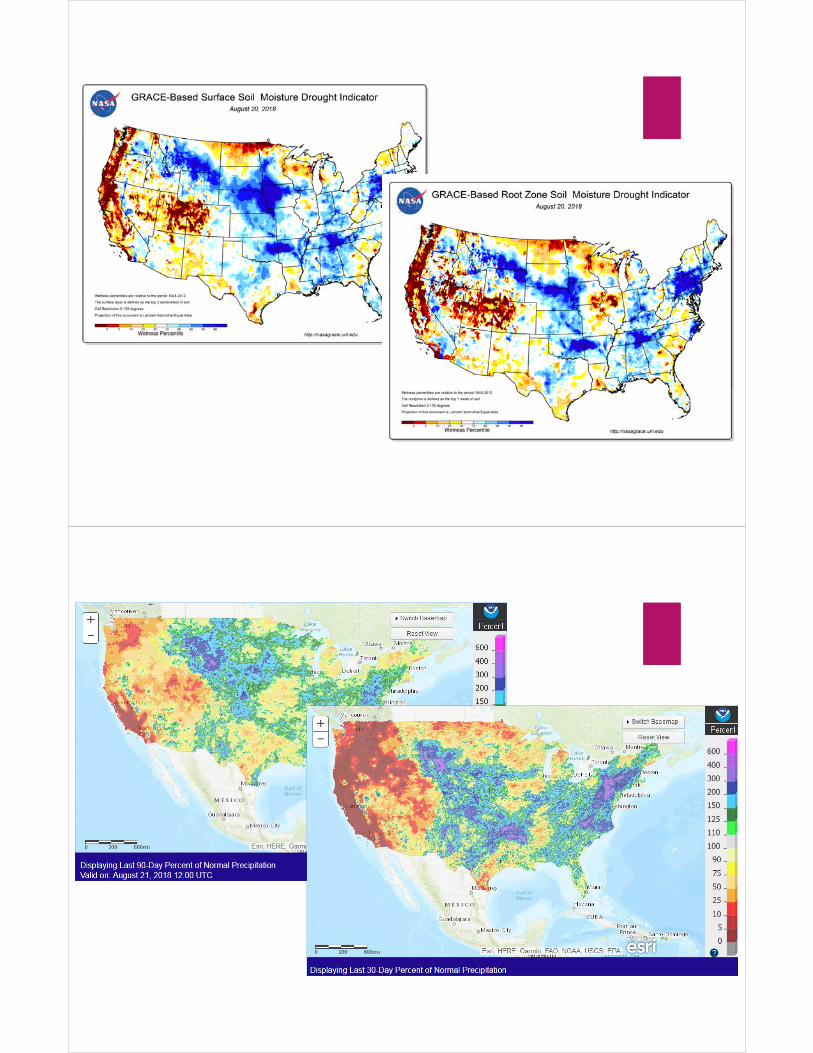
Final 2018???Drought Impact in MO, IA, IL, KS
173-176 bu/ac is possible
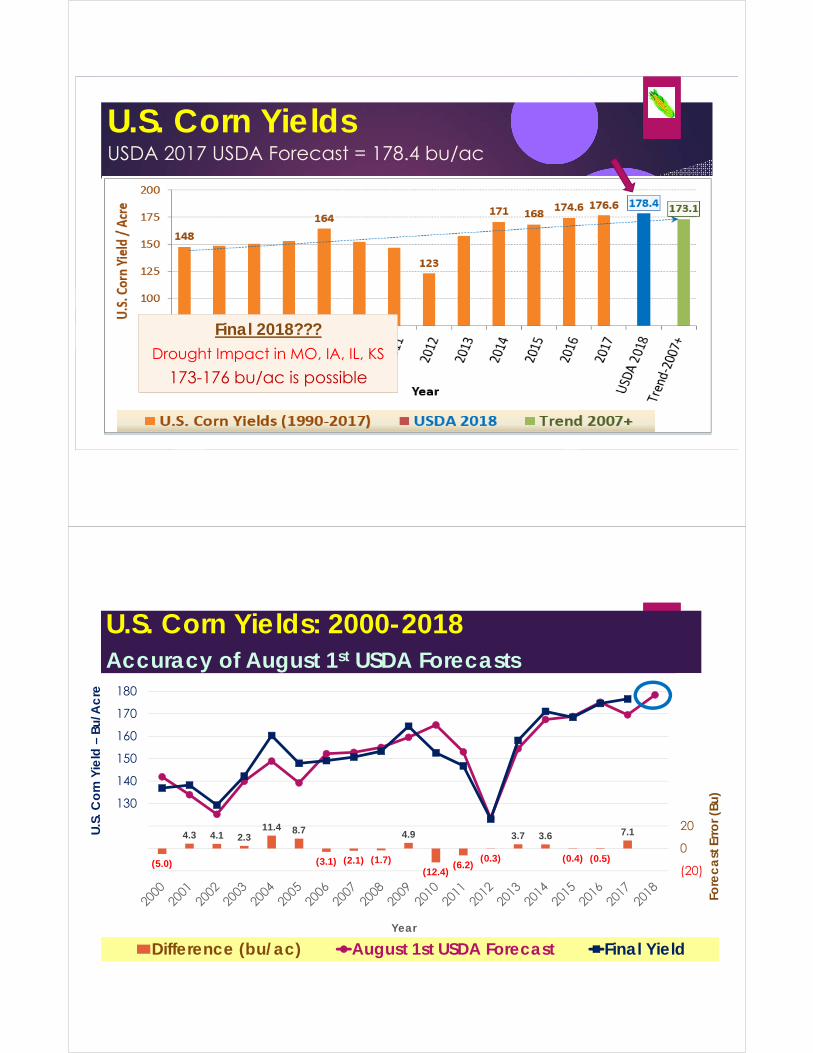
U.S. Corn Yields: 2000-2018Accuracy of August 1st USDA Forecasts
(5.0)
4.3 4.1 2.3 11.4 8.7
(3.1) (2.1) (1.7)
4.9
(12.4)(6.2)
(0.3)
3.7 3.6
(0.4) (0.5)
7.1
(20)
0
20
40
60
80
100
120
140
100
110
120
130
140
150
160
170
180
Fore
ca
st E
rro
r (Bu
)
U.S
. Co
rn Y
ield
–Bu
/Ac
re
Year
Difference (bu/ac) August 1st USDA Forecast Final Yield
?
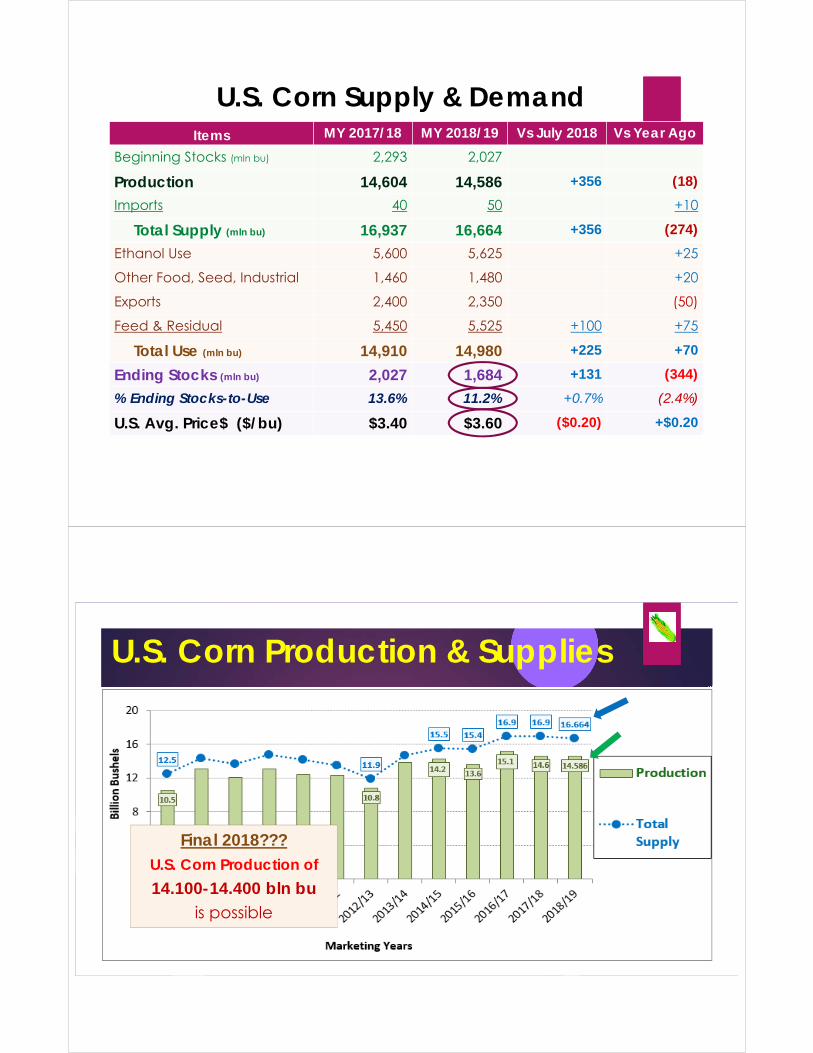
U.S. Corn Supply & DemandItems MY 2017/18 MY 2018/19 Vs July 2018 Vs Year Ago
Beginning Stocks (mln bu) 2,293 2,027
Production 14,604 14,586 +356 (18)
Imports 40 50 +10
Total Supply (mln bu) 16,937 16,664 +356 (274)
U.S. Corn Supply & DemandItems MY 2017/18 MY 2018/19 Vs July 2018 Vs Year Ago
Beginning Stocks (mln bu) 2,293 2,027
Production 14,604 14,586 +356 (18)
Imports 40 50 +10
Total Supply (mln bu) 16,937 16,664 +356 (274)
Ethanol Use 5,600 5,625 +25
Other Food, Seed, Industrial 1,460 1,480 +20
Exports 2,400 2,350 (50)
Feed & Residual 5,450 5,525 +100 +75
Total Use (mln bu) 14,910 14,980 +225 +70
Ending Stocks (mln bu) 2,027 1,684 +131 (344)
% Ending Stocks-to-Use 13.6% 11.2% +0.7% (2.4%)
U.S. Avg. Price$ ($/bu) $3.40 $3.60 ($0.20) +$0.20
U.S. Corn Production & Supplies
Final 2018???U.S. Corn Production of
14.100-14.400 bln buis possible
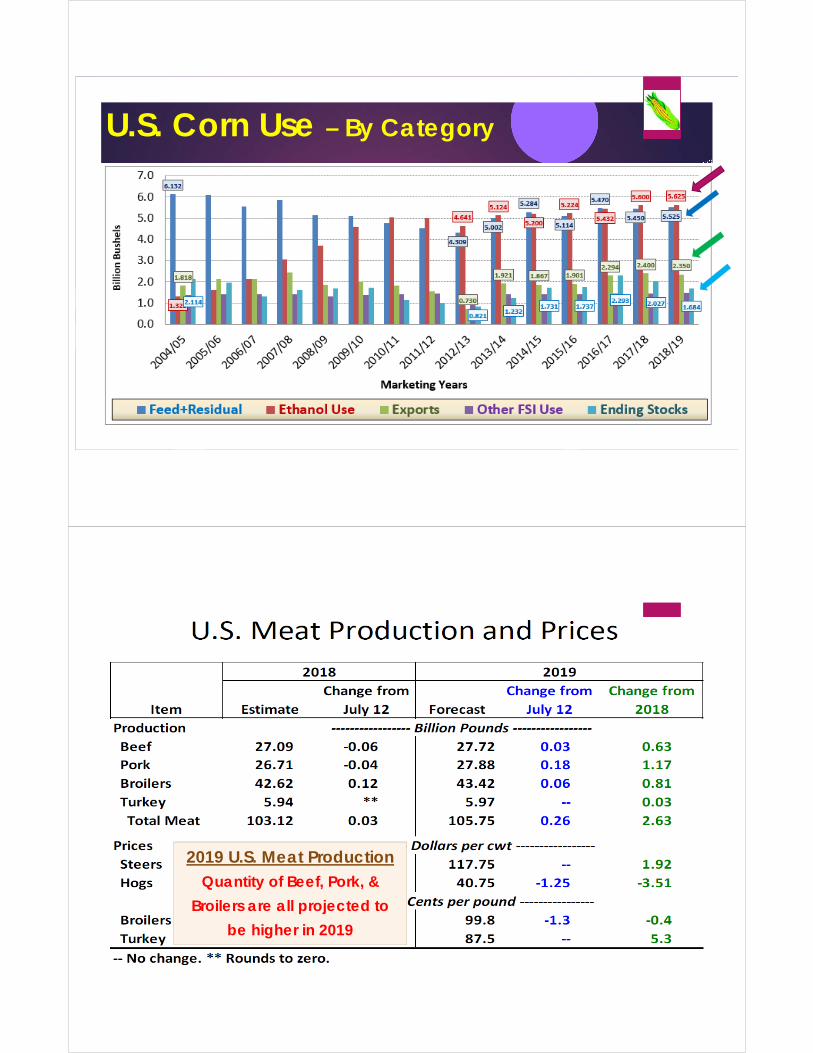
U.S. Corn Use – By Category
2019 U.S. Meat ProductionQuantity of Beef, Pork, &
Broilers are all projected to
be higher in 2019
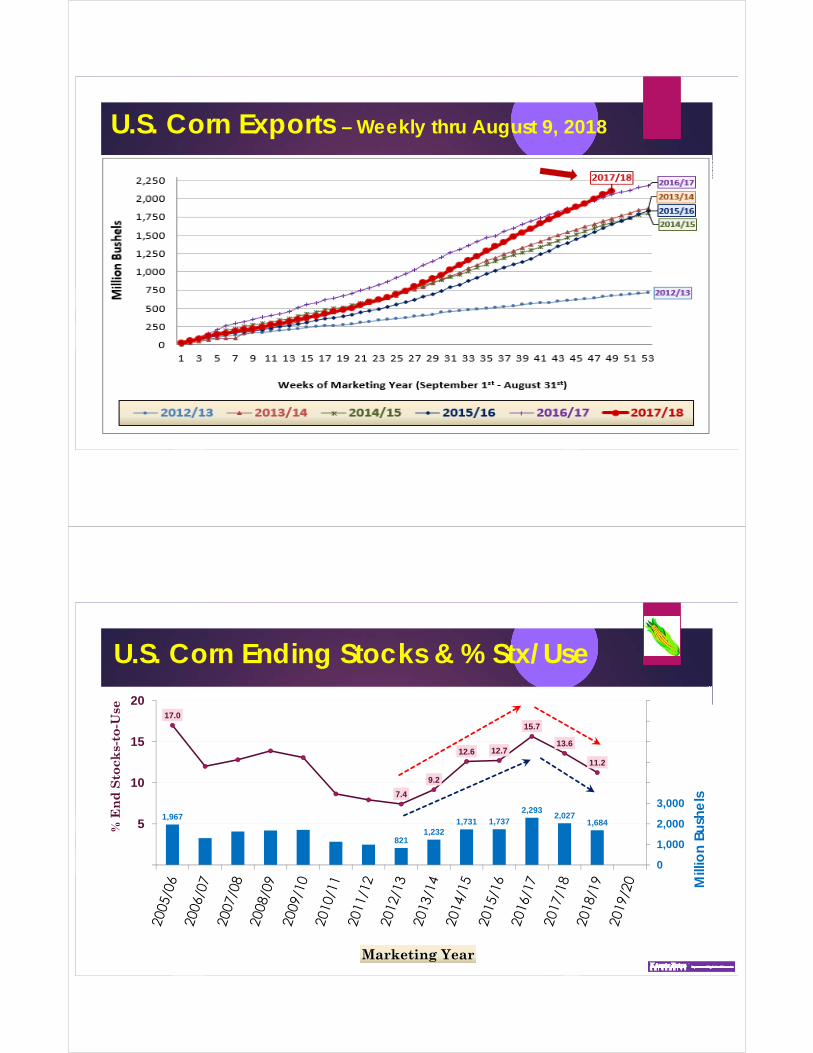
U.S. Corn Exports – Weekly thru August 9, 2018
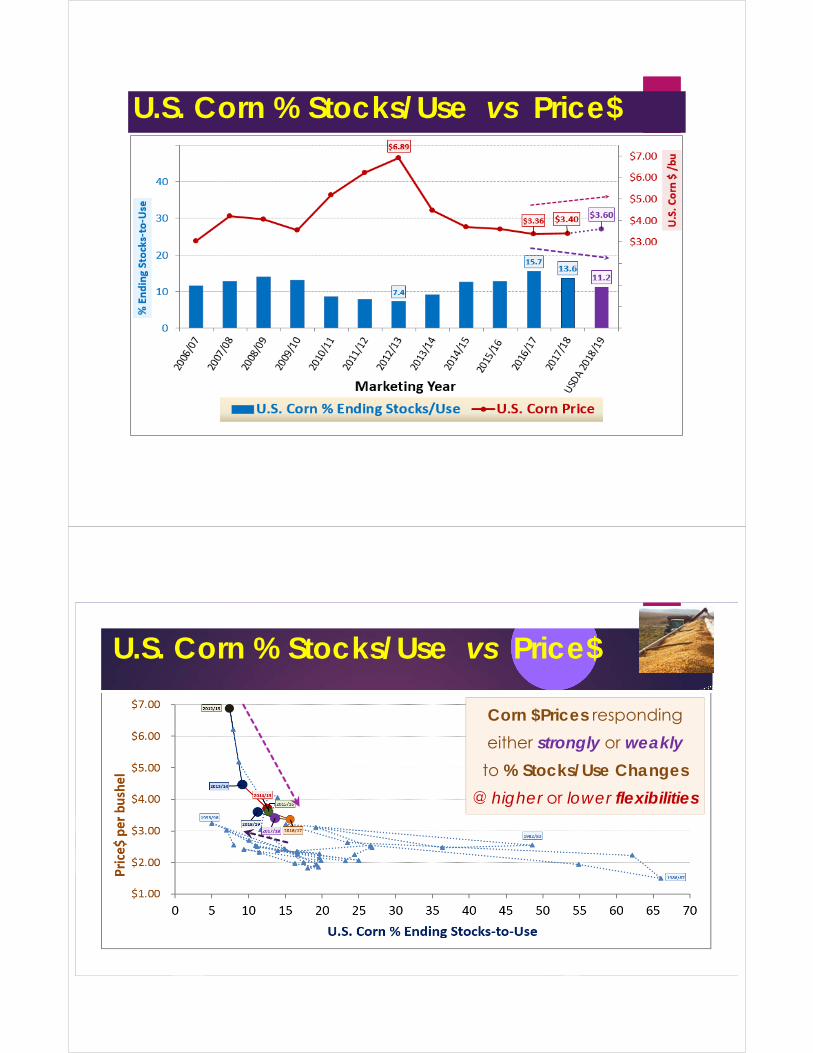
U.S. Corn Ending Stocks & % Stx/Use
1,967
8211,232
1,731 1,7372,293
2,0271,684
17.0
7.4
9.2
12.6 12.7
15.7
13.6
11.2
0
1,000
2,000
3,000
4,000
5,000
6,000
7,000
8,000
0
5
10
15
20M
illio
n Bu
she
ls
% E
nd
Sto
cks-
to-U
se
Marketing Year
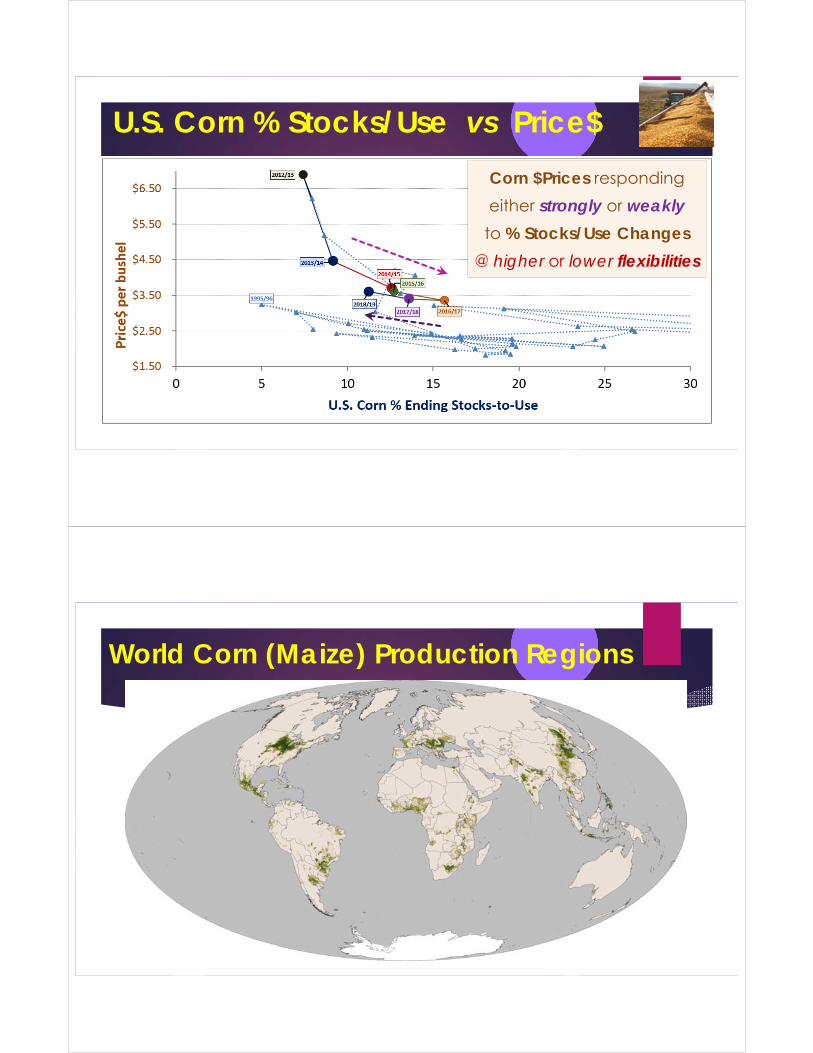
U.S. Corn % Stocks/Use vs Price$
U.S. Corn % Stocks/Use vs Price$
Corn $Prices responding
either strongly or weakly
to % Stocks/Use Changes
@ higher or lower flexibilities
U.S. Corn % Stocks/Use vs Price$
Corn $Prices responding
either strongly or weakly
to % Stocks/Use Changes
@ higher or lower flexibilities
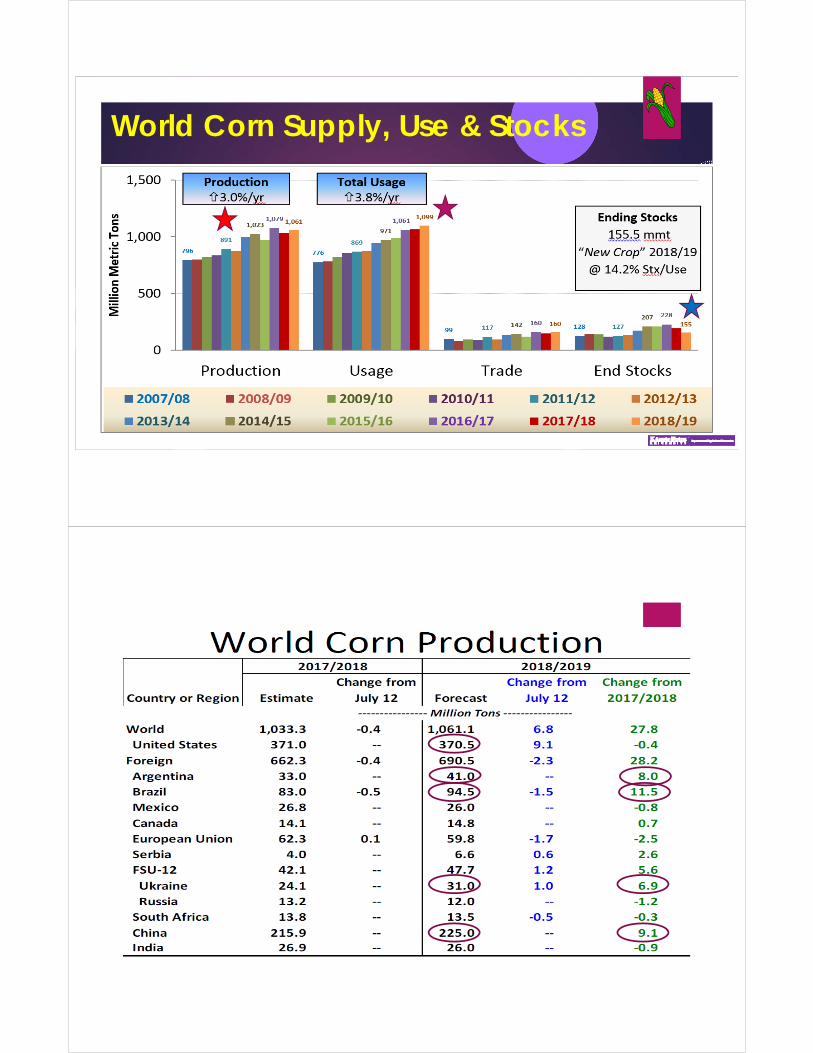
World Corn (Maize) Production Regions
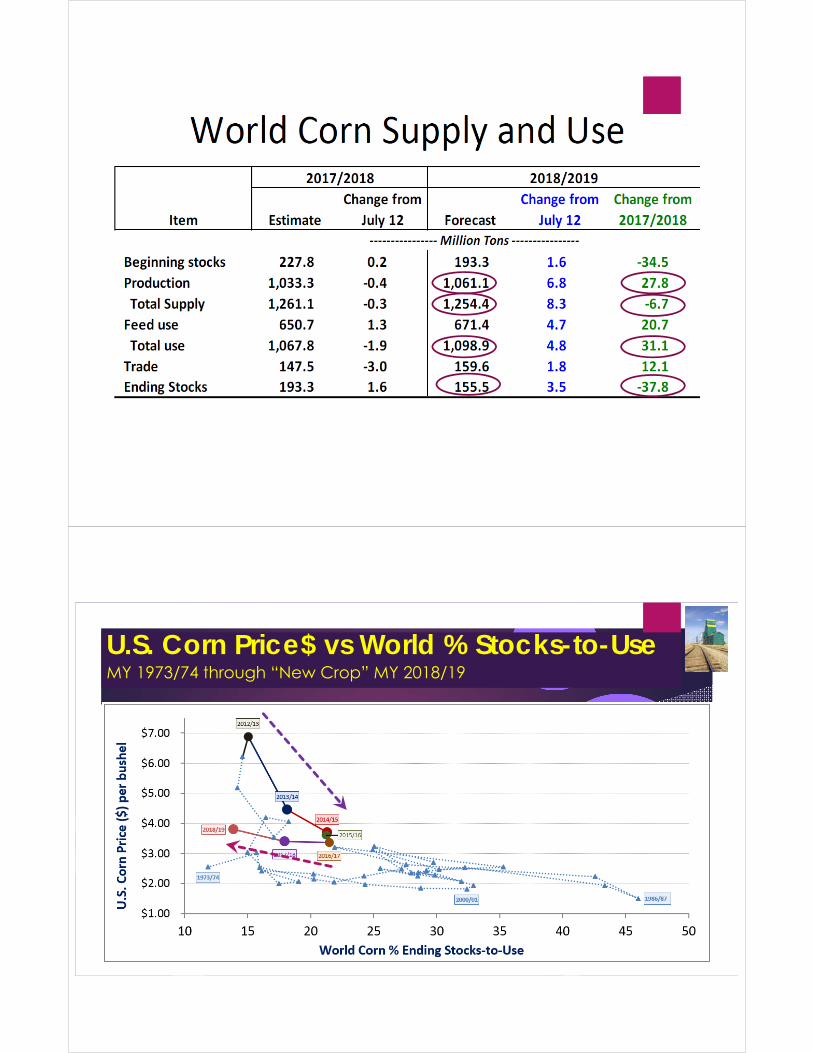
World Corn Supply, Use & Stocks
U.S. Corn Price$ vs World % Stocks-to-UseMY 1973/74 through “New Crop” MY 2018/19
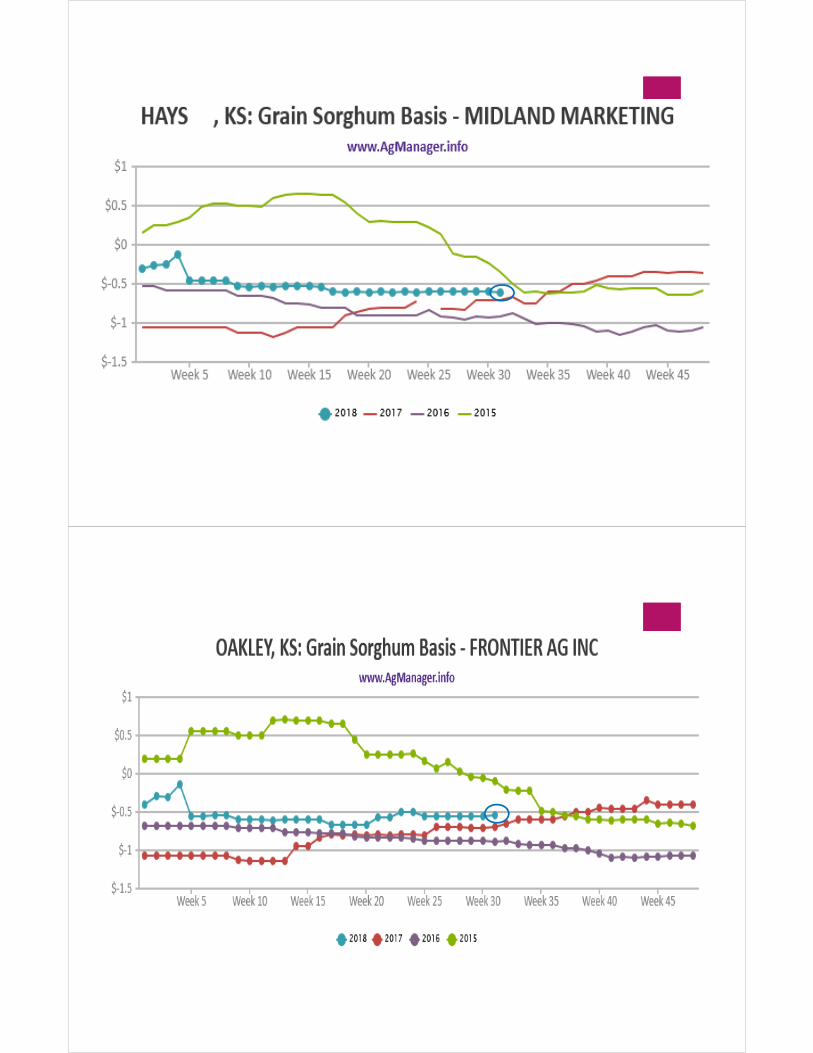
U.S. Grain Sorghum
Production Regions
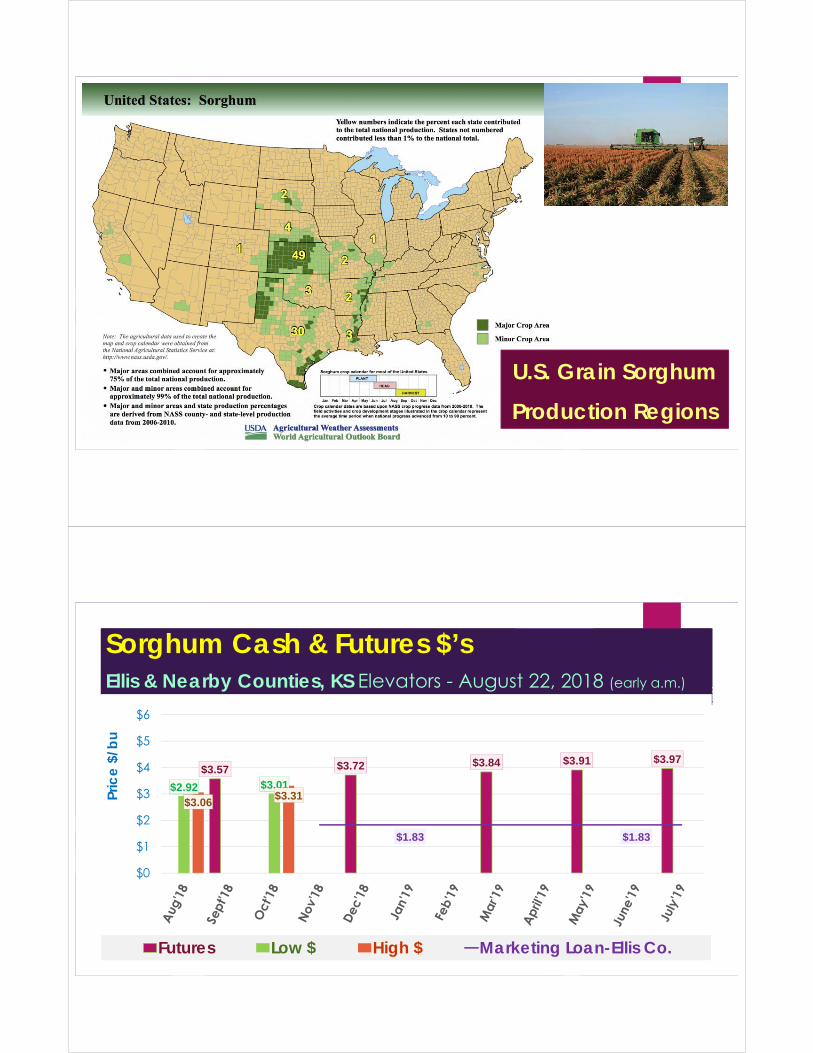
Sorghum Cash & Futures $’sEllis & Nearby Counties, KS Elevators - August 22, 2018 (early a.m.)
$3.57 $3.72 $3.84 $3.91 $3.97
$2.92 $3.01
$3.06 $3.31
$1.83 $1.83
$0
$1
$2
$3
$4
$5
$6
Pric
e $
/bu
Futures Low $ High $ Marketing Loan-Ellis Co.
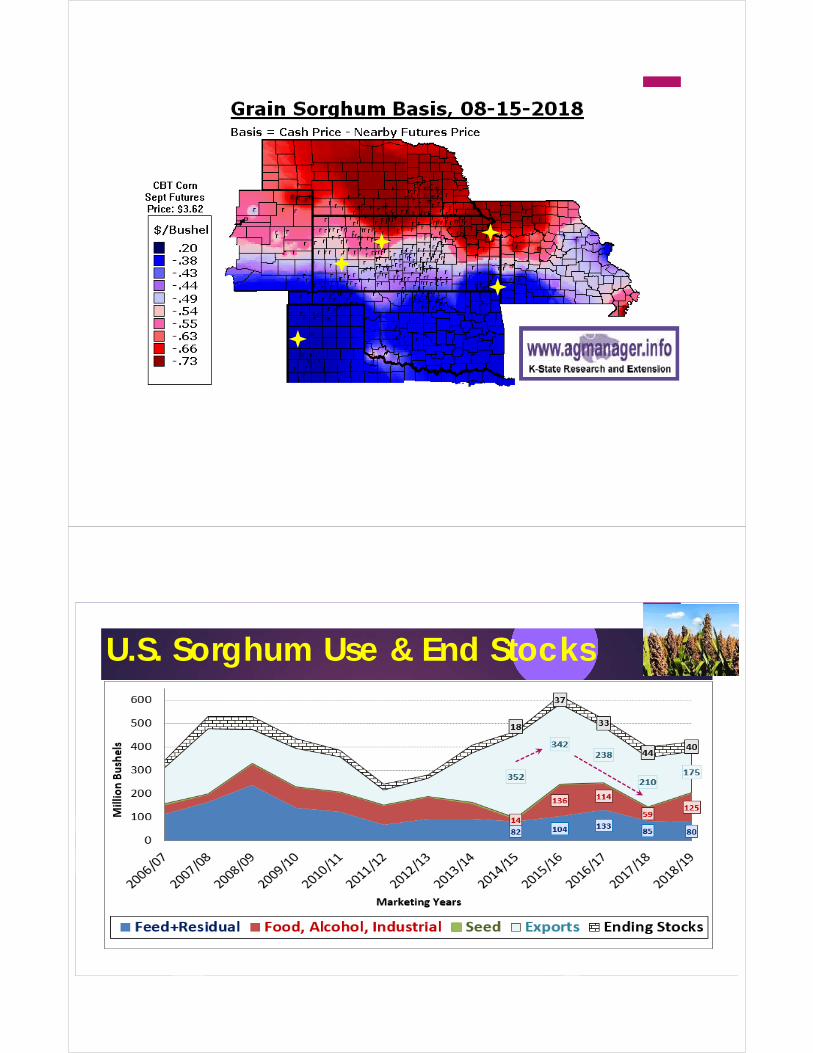
U.S. Sorghum Use & End Stocks
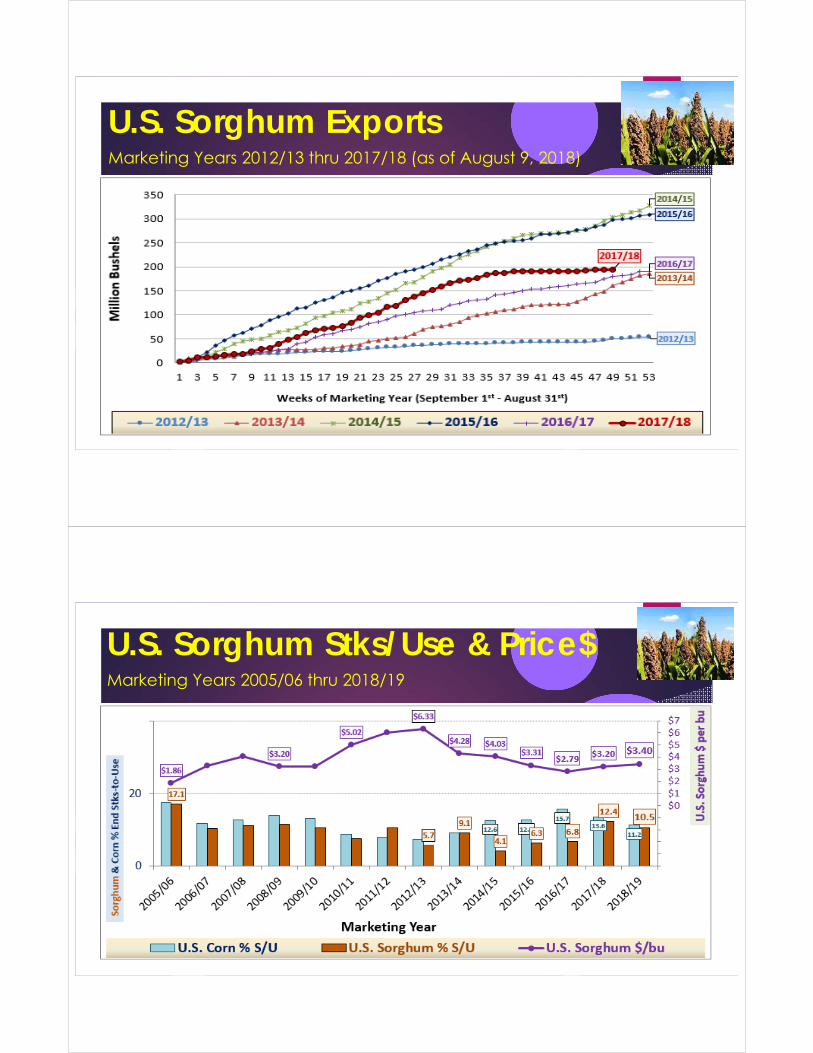
U.S. Sorghum ExportsMarketing Years 2012/13 thru 2017/18 (as of August 9, 2018)
U.S. Sorghum Stks/Use & Price$Marketing Years 2005/06 thru 2018/19
Wheat Markets
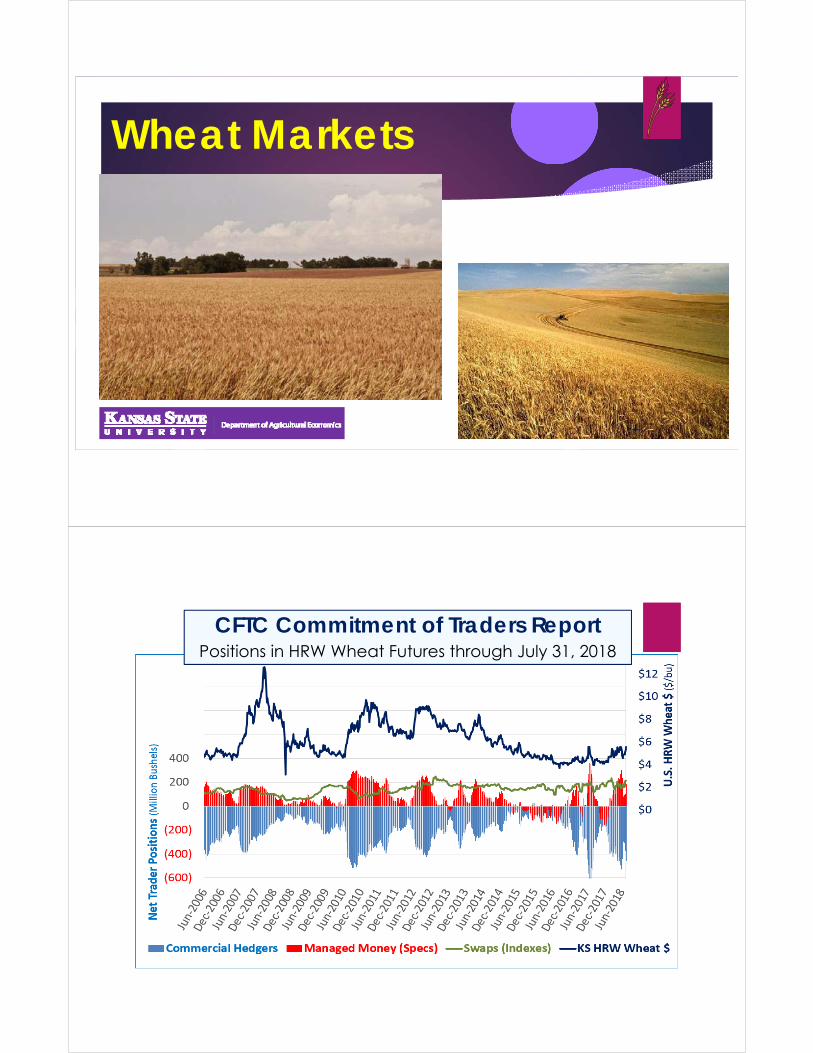
CFTC Commitment of Traders ReportPositions in HRW Wheat Futures through July 31, 2018
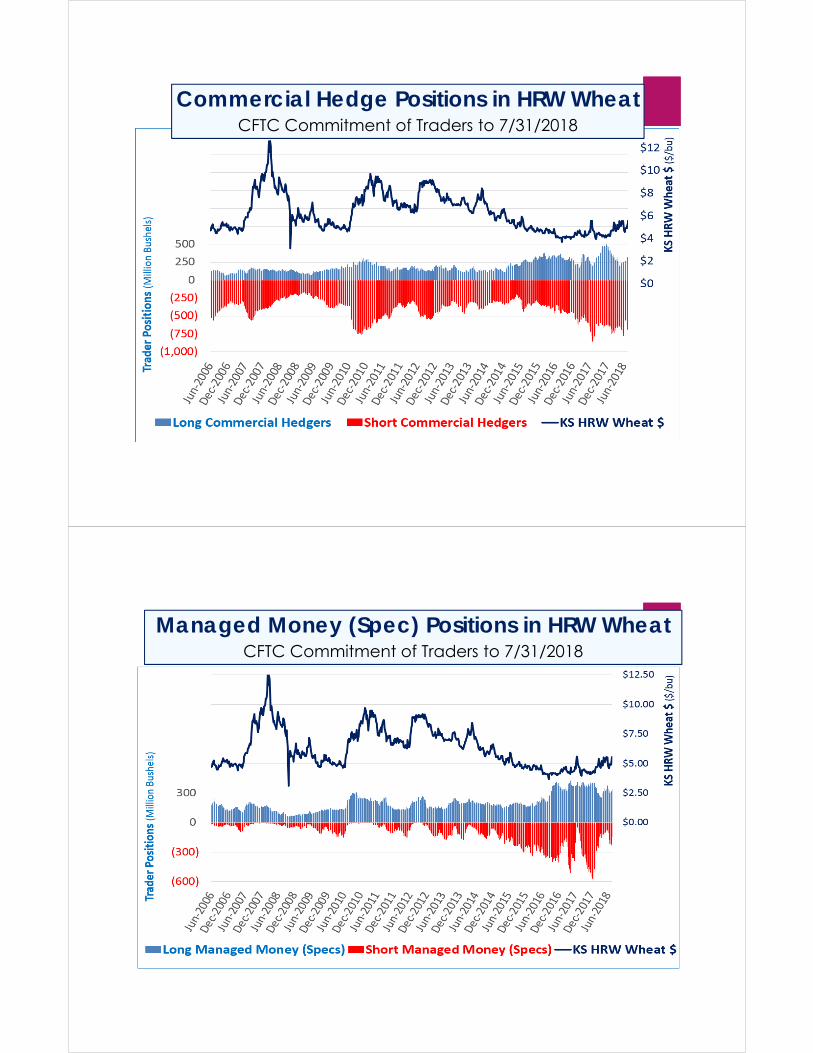
Commercial Hedge Positions in HRW WheatCFTC Commitment of Traders to 7/31/2018
Managed Money (Spec) Positions in HRW WheatCFTC Commitment of Traders to 7/31/2018
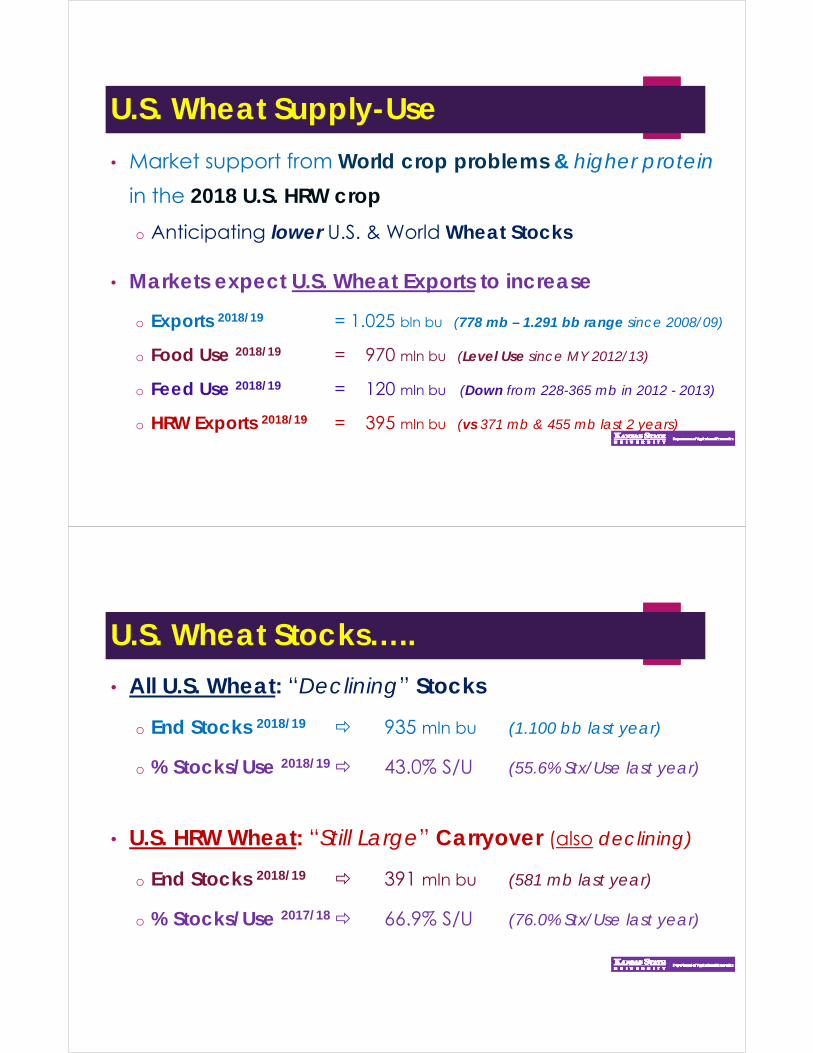
U.S. Wheat Supply-Use
• Market support from World crop problems & higher protein
in the 2018 U.S. HRW crop
o Anticipating lower U.S. & World Wheat Stocks
• Markets expect U.S. Wheat Exports to increase
o Exports 2018/19 = 1.025 bln bu (778 mb – 1.291 bb range since 2008/09)
o Food Use 2018/19 = 970 mln bu (Level Use since MY 2012/13)
o Feed Use 2018/19 = 120 mln bu (Down from 228-365 mb in 2012 - 2013)
o HRW Exports 2018/19 = 395 mln bu (vs 371 mb & 455 mb last 2 years)
U.S. Wheat Stocks…..
• All U.S. Wheat: “Declining” Stocks
o End Stocks 2018/19 935 mln bu (1.100 bb last year)
o % Stocks/Use 2018/19 43.0% S/U (55.6% Stx/Use last year)
• U.S. HRW Wheat: “Still Large” Carryover (also declining)
o End Stocks 2018/19 391 mln bu (581 mb last year)
o % Stocks/Use 2017/18 66.9% S/U (76.0% Stx/Use last year)
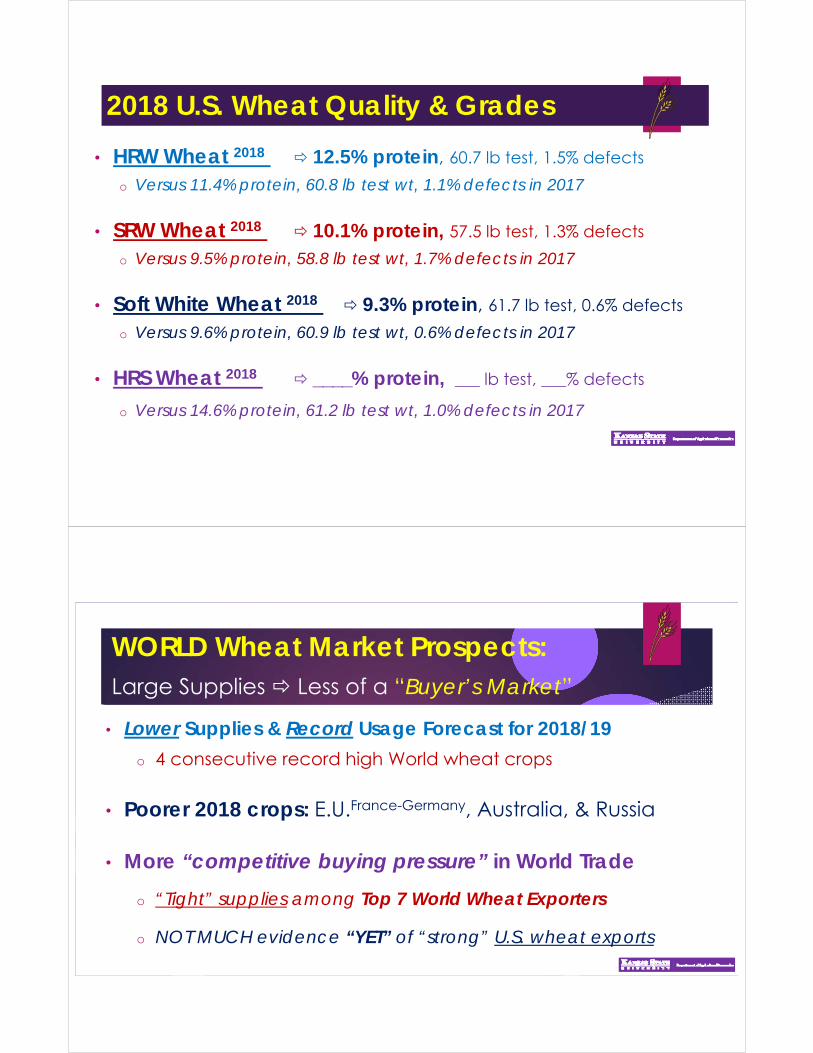
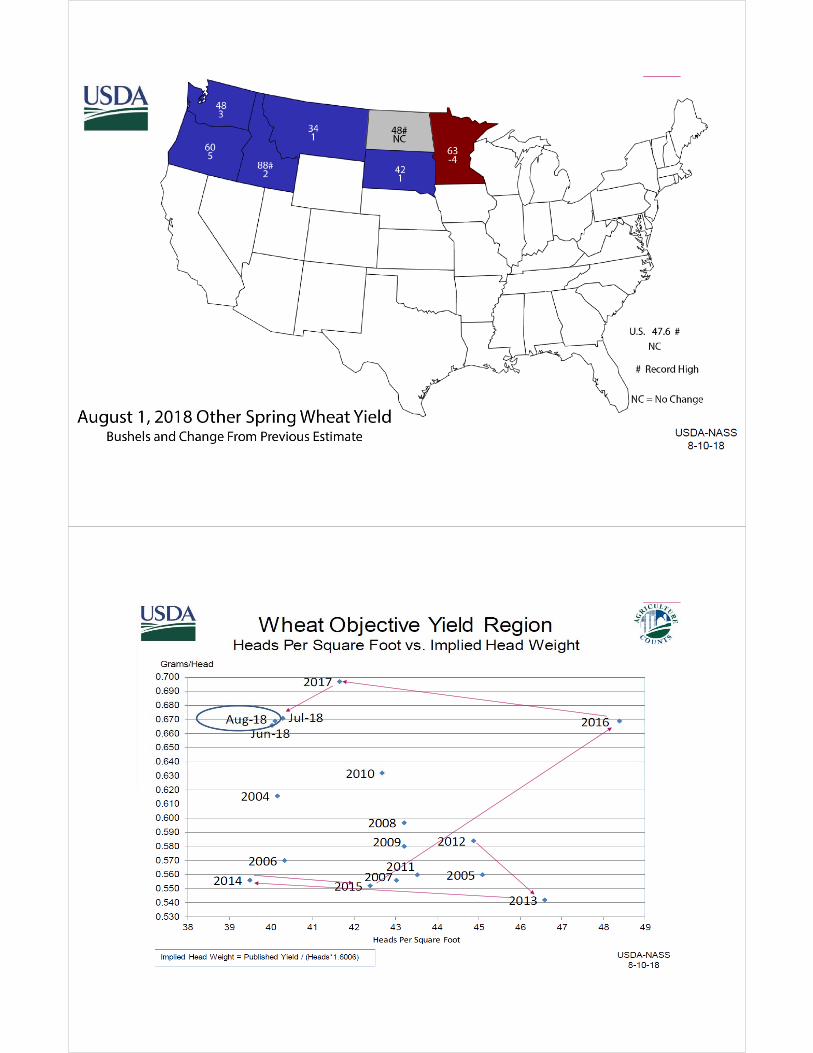
2018 U.S. Wheat Quality & Grades
• HRW Wheat 2018 12.5% protein, 60.7 lb test, 1.5% defects
o Versus 11.4% protein, 60.8 lb test wt, 1.1% defects in 2017
• SRW Wheat 2018 10.1% protein, 57.5 lb test, 1.3% defects
o Versus 9.5% protein, 58.8 lb test wt, 1.7% defects in 2017
• Soft White Wheat 2018 9.3% protein, 61.7 lb test, 0.6% defects
o Versus 9.6% protein, 60.9 lb test wt, 0.6% defects in 2017
• HRS Wheat 2018 ____% protein, ___ lb test, ___% defects
o Versus 14.6% protein, 61.2 lb test wt, 1.0% defects in 2017
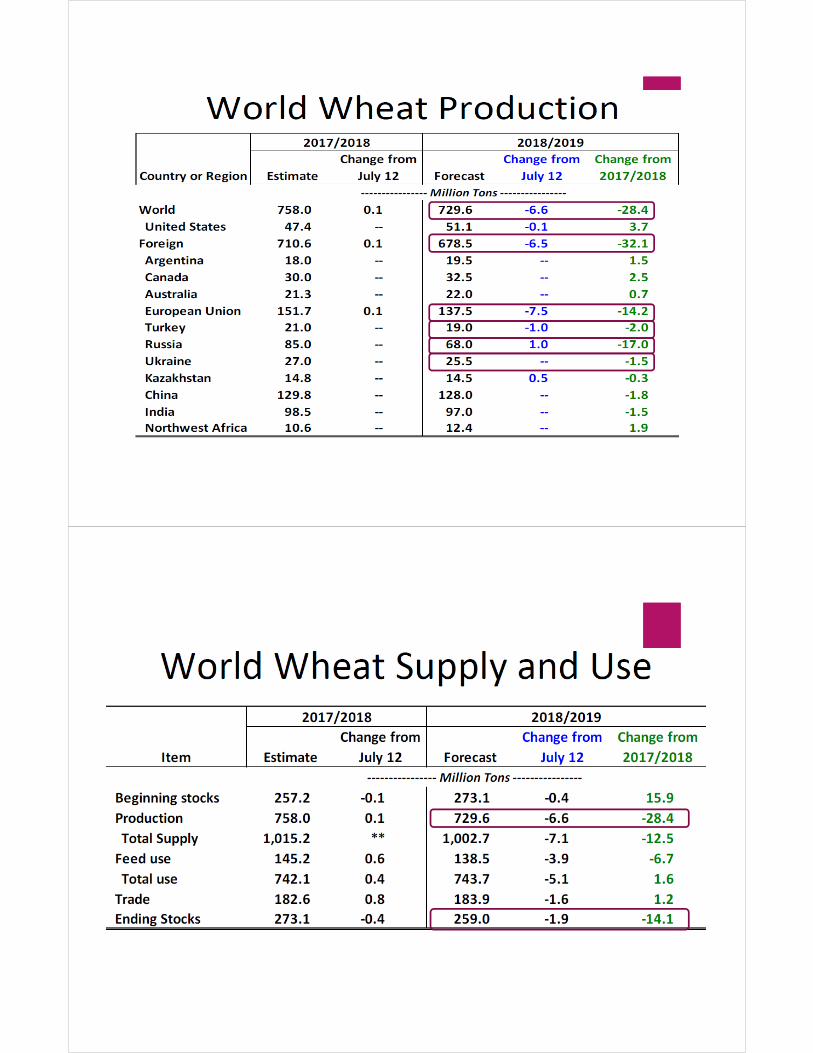
WORLD Wheat Market Prospects:Large Supplies Less of a “Buyer’s Market”
• Lower Supplies & Record Usage Forecast for 2018/19
o 4 consecutive record high World wheat crops
• Poorer 2018 crops: E.U.France-Germany, Australia, & Russia
• More “competitive buying pressure” in World Trade
o “Tight” supplies among Top 7 World Wheat Exporters
o NOT MUCH evidence “YET” of “strong” U.S. wheat exports
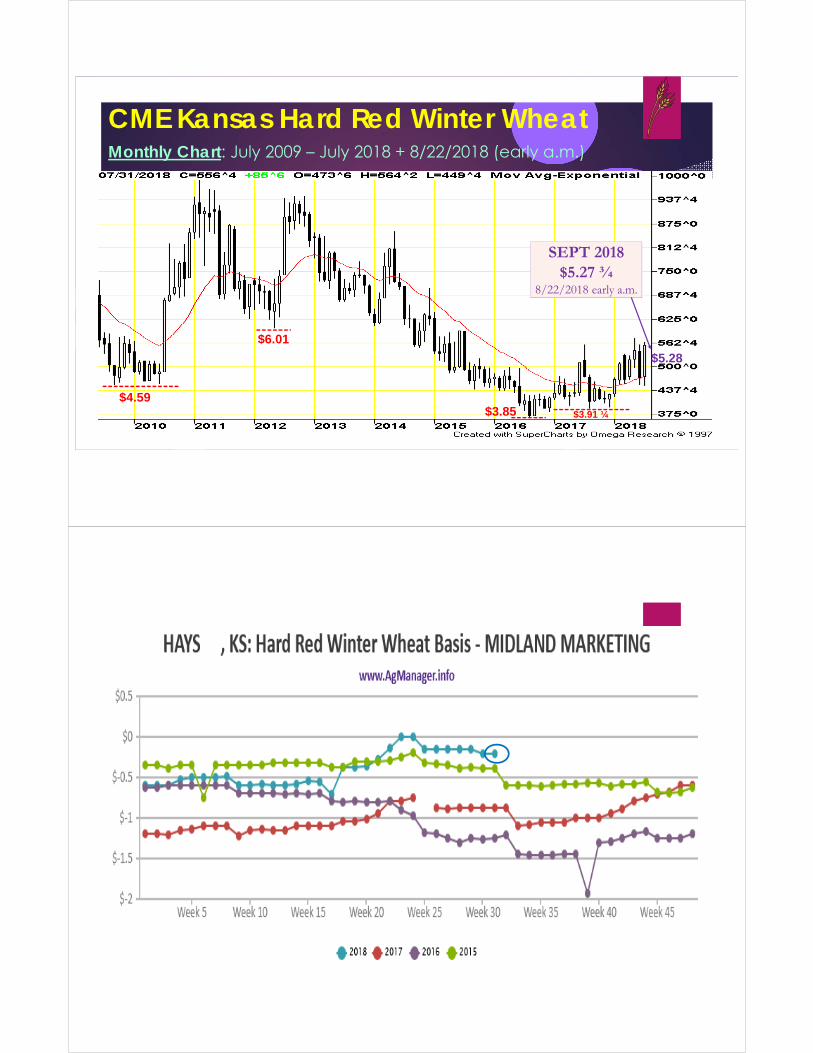
CME Kansas Hard Red Winter WheatMonthly Chart: July 2009 – July 2018 + 8/22/2018 (early a.m.)
$5.28
SEPT 2018$5.27 ¾
8/22/2018 early a.m.
$3.85
$6.01
$4.59$3.91 ¼
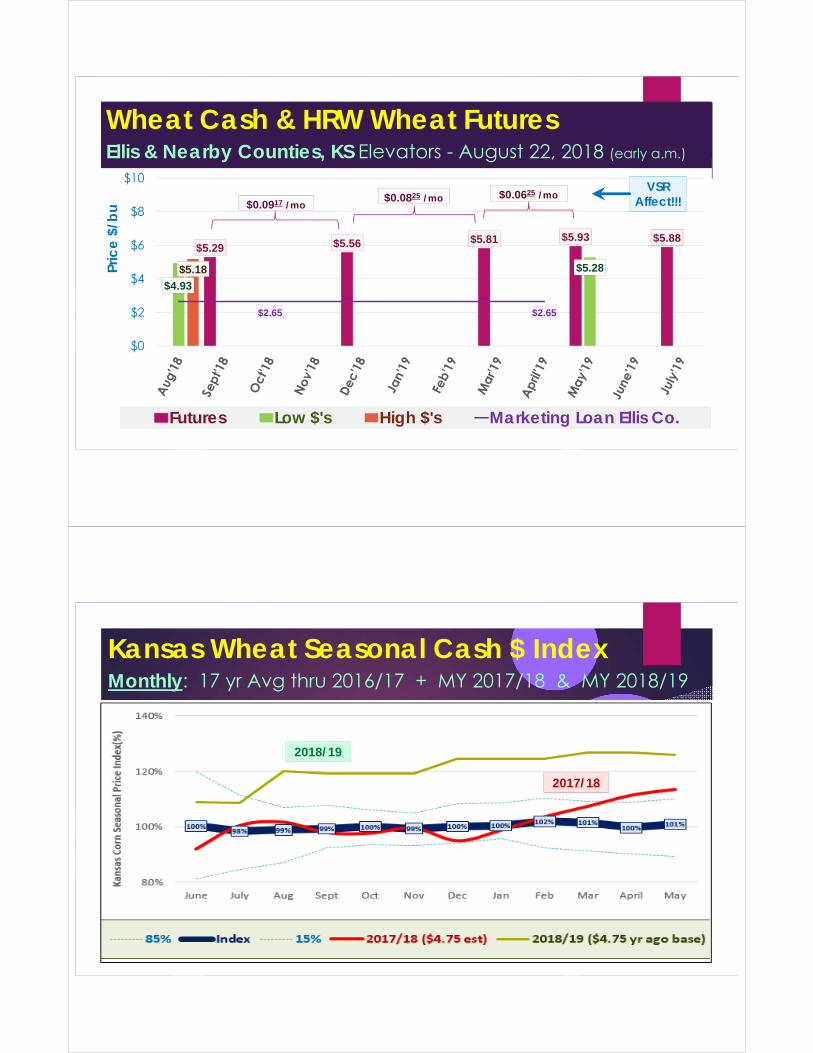
Wheat Cash & HRW Wheat FuturesEllis & Nearby Counties, KS Elevators - August 22, 2018 (early a.m.)
$5.29 $5.56 $5.81 $5.93 $5.88
$4.93
$5.28$5.18
$2.65 $2.65
$0
$2
$4
$6
$8
$10
Pric
e $
/bu
Futures Low $'s High $'s Marketing Loan Ellis Co.
$0.0917 /mo$0.0825 /mo $0.0625 /mo
VSR Affect!!!
Kansas Wheat Seasonal Cash $ IndexMonthly: 17 yr Avg thru 2016/17 + MY 2017/18 & MY 2018/19
2017/18
2018/19
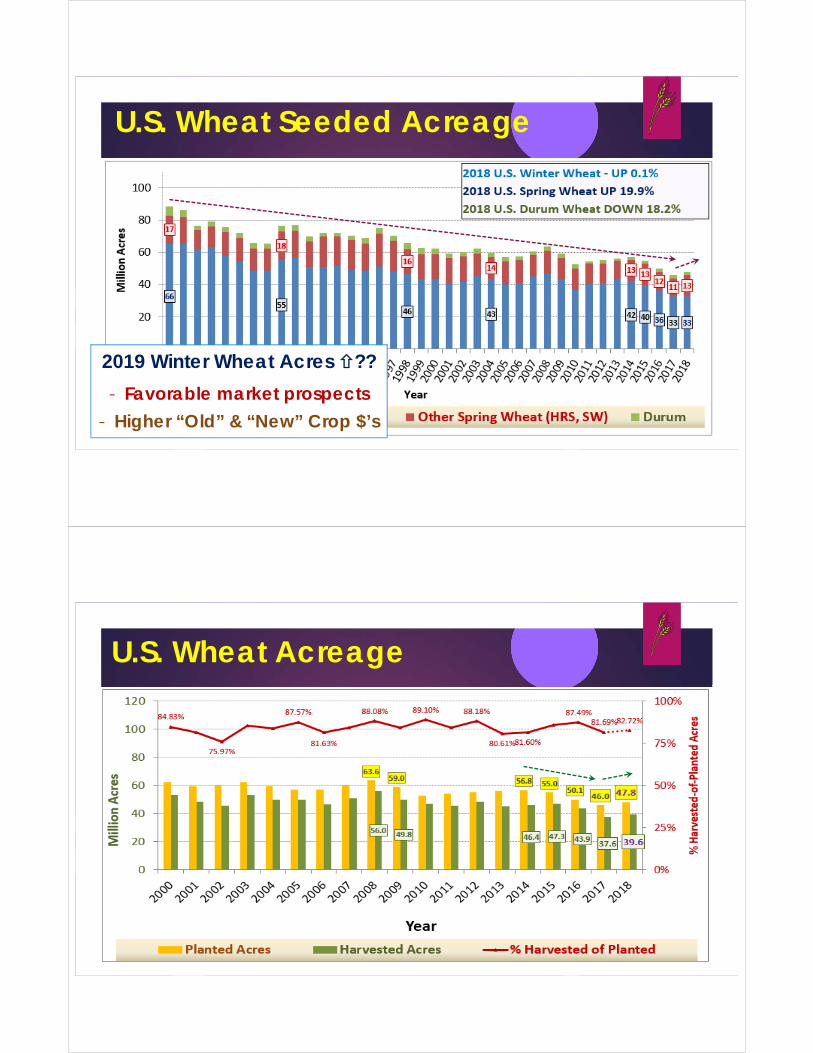
U.S. Wheat Seeded Acreage
2019 Winter Wheat Acres ??
- Favorable market prospects
- Higher “Old” & “New” Crop $’s
U.S. Wheat Acreage
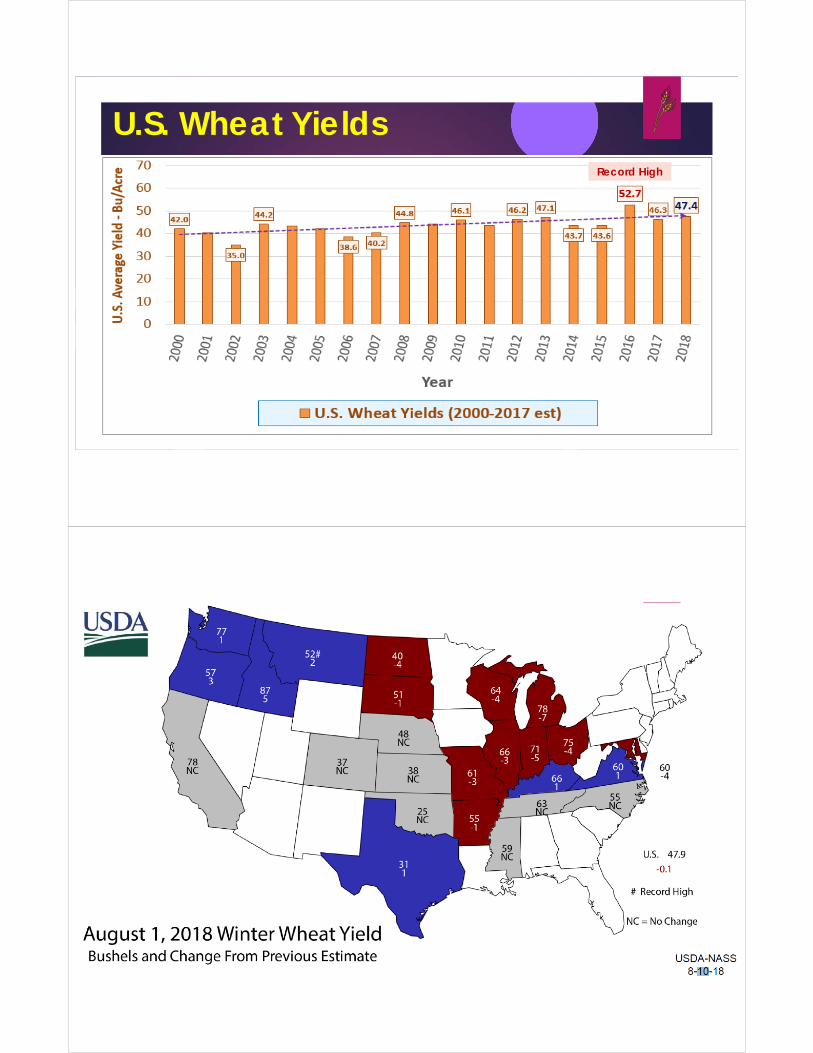
U.S. Wheat YieldsRecord High

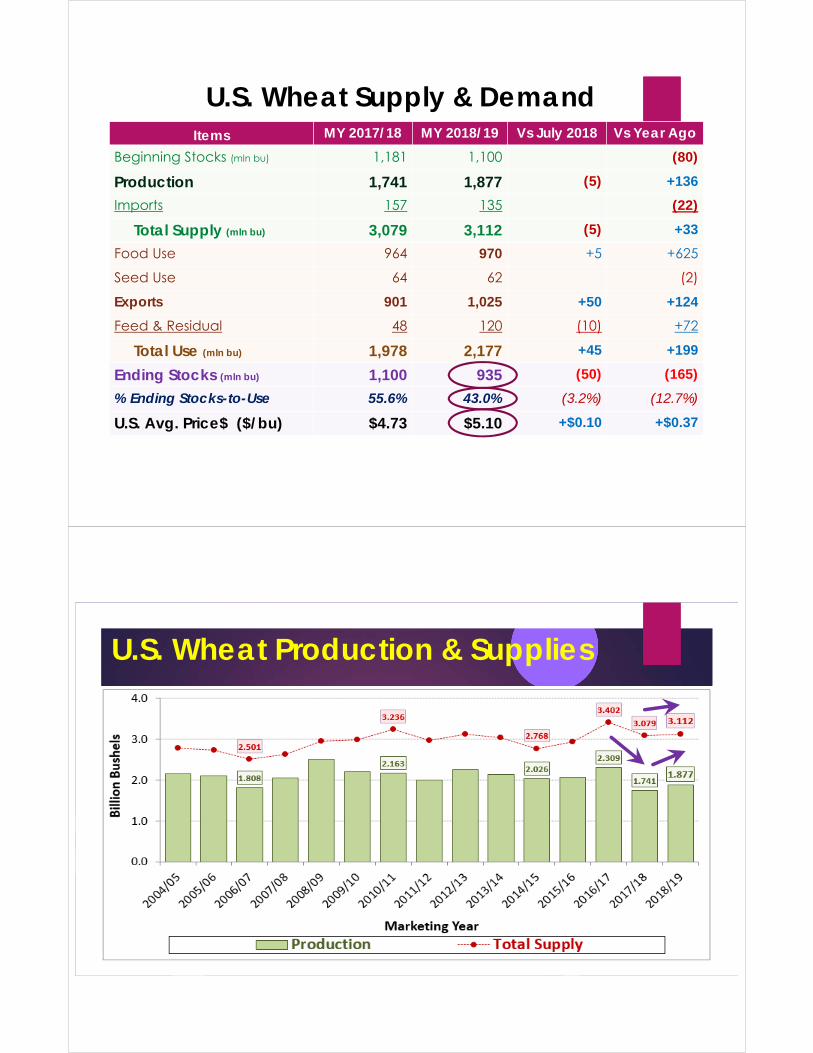
U.S. Wheat Supply & DemandItems MY 2017/18 MY 2018/19 Vs July 2018 Vs Year Ago
Beginning Stocks (mln bu) 1,181 1,100 (80)
Production 1,741 1,877 (5) +136
Imports 157 135 (22)
Total Supply (mln bu) 3,079 3,112 (5) +33
U.S. Wheat Supply & DemandItems MY 2017/18 MY 2018/19 Vs July 2018 Vs Year Ago
Beginning Stocks (mln bu) 1,181 1,100 (80)
Production 1,741 1,877 (5) +136
Imports 157 135 (22)
Total Supply (mln bu) 3,079 3,112 (5) +33
Food Use 964 970 +5 +625
Seed Use 64 62 (2)
Exports 901 1,025 +50 +124
Feed & Residual 48 120 (10) +72
Total Use (mln bu) 1,978 2,177 +45 +199
Ending Stocks (mln bu) 1,100 935 (50) (165)
% Ending Stocks-to-Use 55.6% 43.0% (3.2%) (12.7%)
U.S. Avg. Price$ ($/bu) $4.73 $5.10 +$0.10 +$0.37
U.S. Wheat Production & Supplies
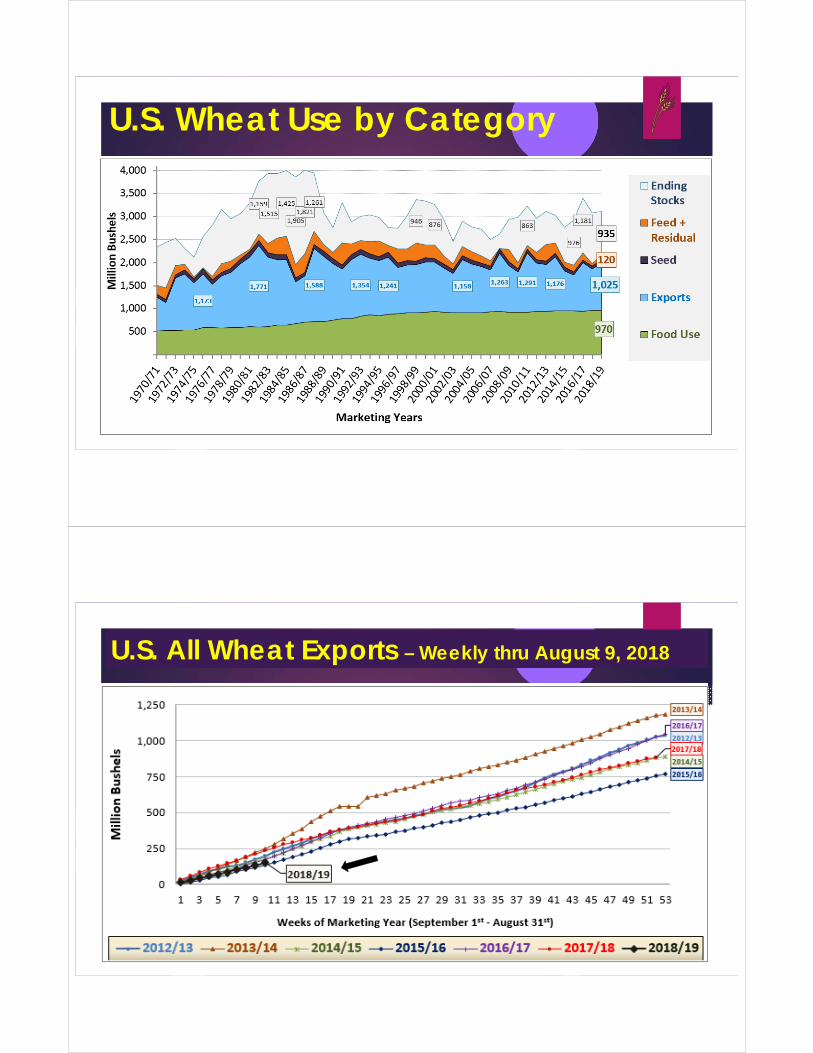
U.S. Wheat Use by Category
U.S. All Wheat Exports – Weekly thru August 9, 2018
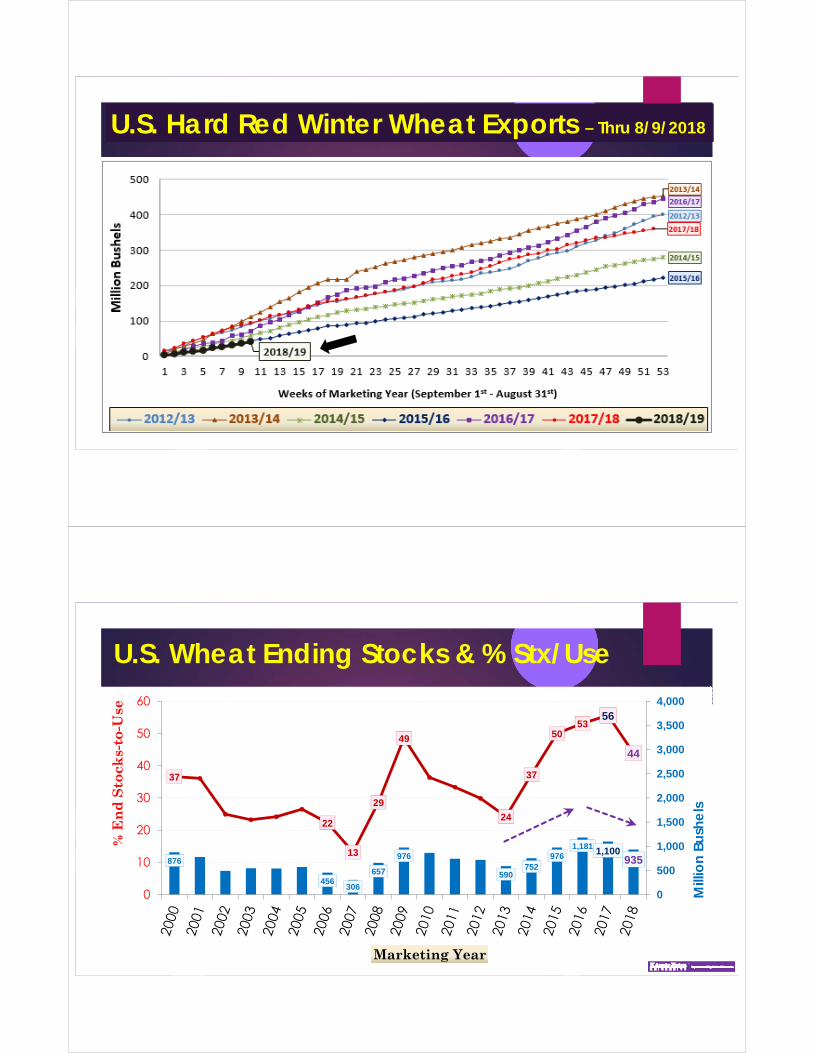
U.S. Hard Red Winter Wheat Exports – Thru 8/9/2018
U.S. Wheat Ending Stocks & % Stx/Use
876
456306
657
976
590752
9761,181 1,100
935
37
22
13
29
49
24
37
5053
56
44
0
500
1,000
1,500
2,000
2,500
3,000
3,500
4,000
0
10
20
30
40
50
60M
illio
n Bu
she
ls
% E
nd
Sto
cks-
to-U
se
Marketing Year
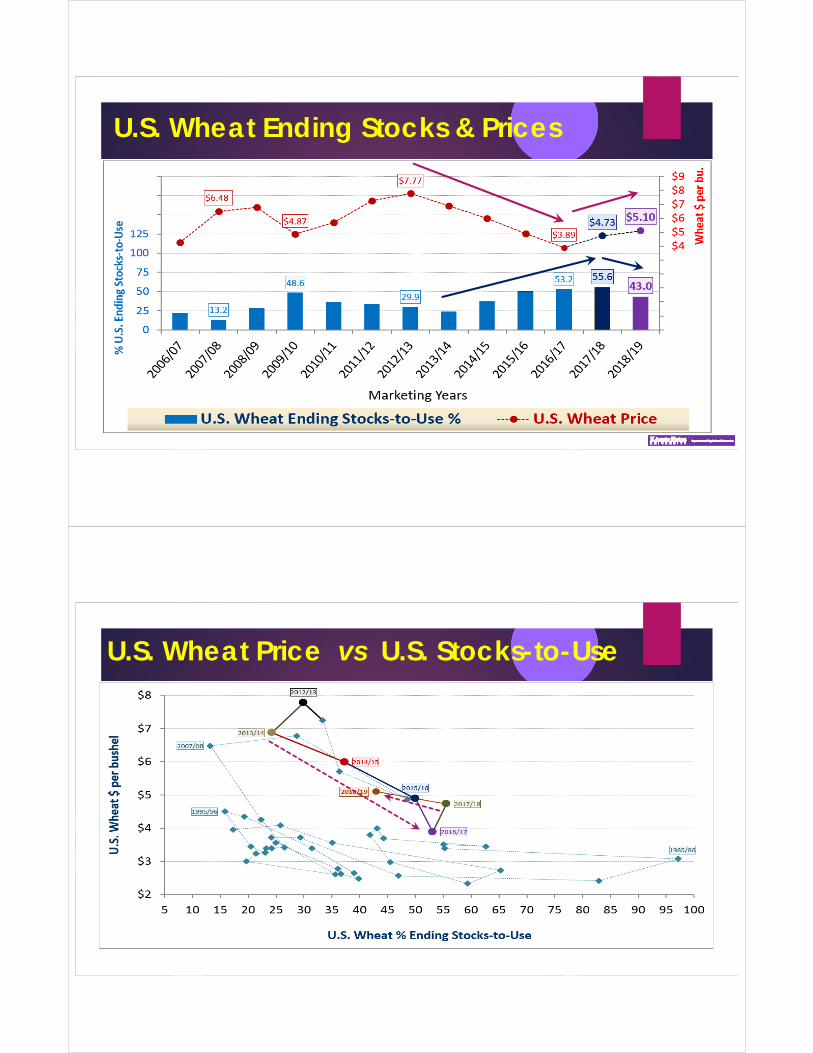
U.S. Wheat Ending Stocks & Prices
U.S. Wheat Price vs U.S. Stocks-to-Use
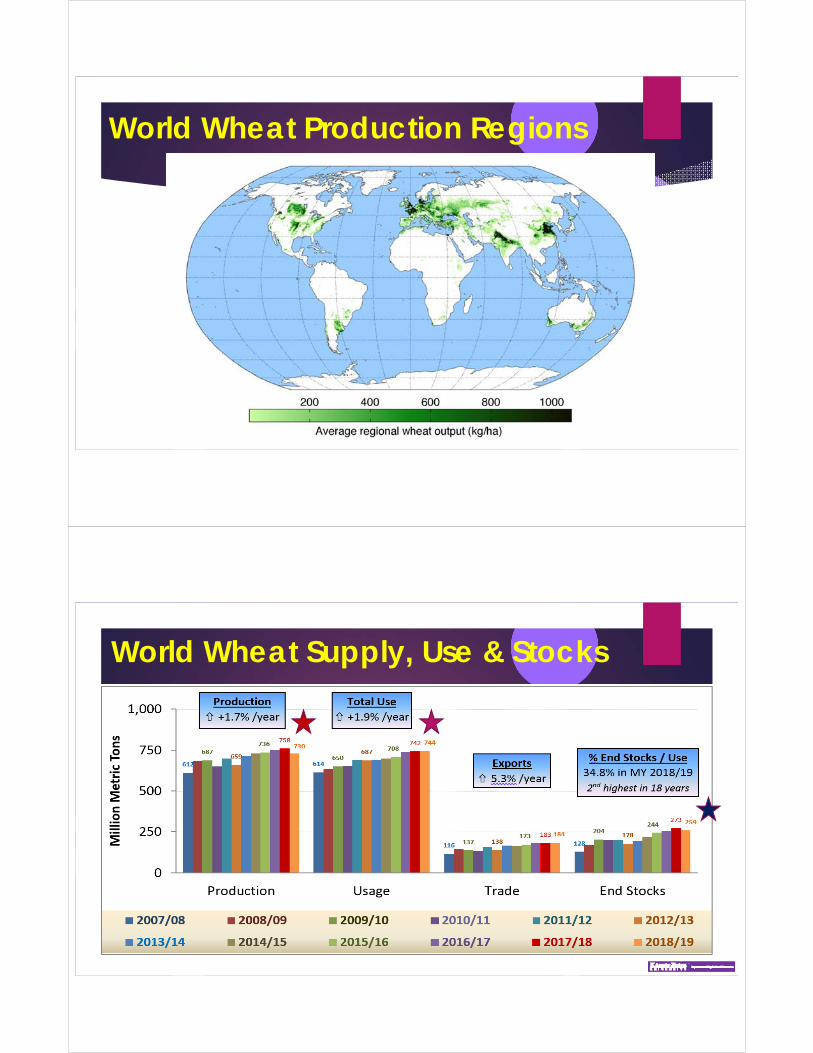
World Wheat Production Regions
World Wheat Supply, Use & Stocks
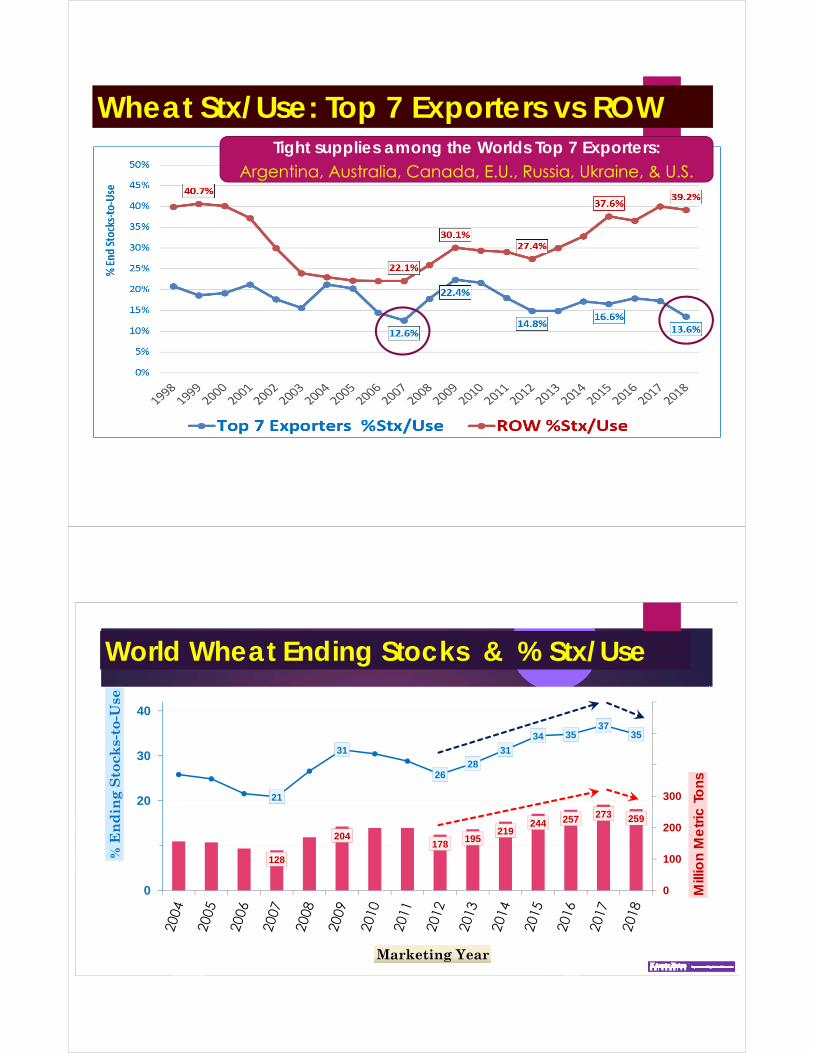
Wheat Stx/Use: Top 7 Exporters vs ROWTight supplies among the Worlds Top 7 Exporters:
Argentina, Australia, Canada, E.U., Russia, Ukraine, & U.S.
World Wheat Ending Stocks & % Stx/Use
128
204178 195
219244 257 273 259
21
31
2628
3134 35
3735
0
100
200
300
400
500
600
0
10
20
30
40M
illio
n M
etr
ic T
ons
% E
nd
ing
Sto
cks-
to-U
se
Marketing Year
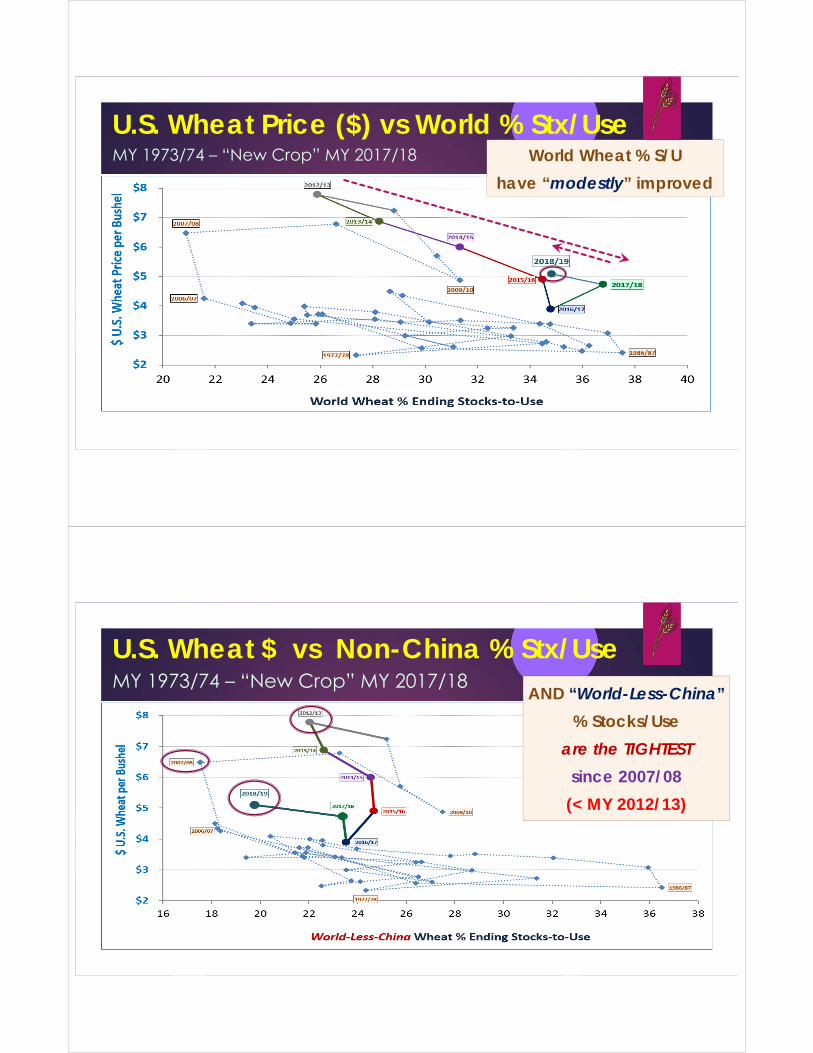
U.S. Wheat Price ($) vs World % Stx/UseMY 1973/74 – “New Crop” MY 2017/18 World Wheat % S/U
have “modestly” improved
U.S. Wheat $ vs Non-China % Stx/UseMY 1973/74 – “New Crop” MY 2017/18
AND “World-Less-China”
% Stocks/Use
are the TIGHTEST
since 2007/08
(< MY 2012/13)
Soybean & Sunflower Markets
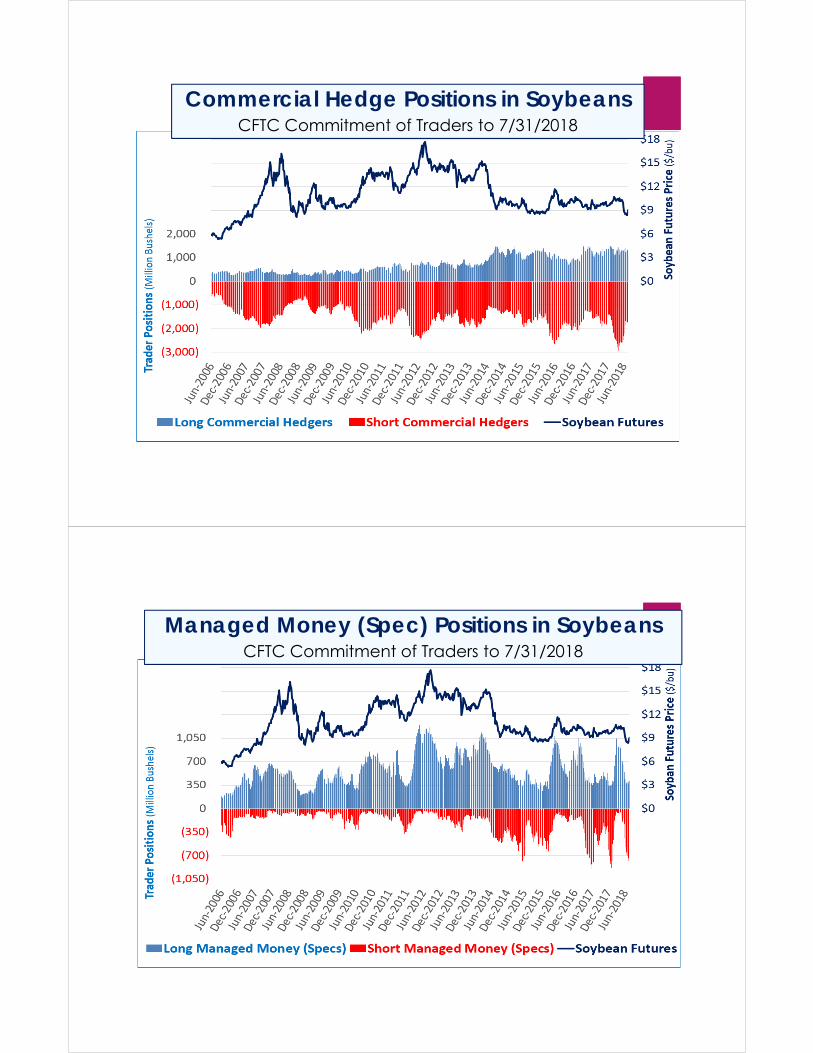
CFTC Commitment of Traders ReportPositions in CME Soybean Futures through July 31, 2018
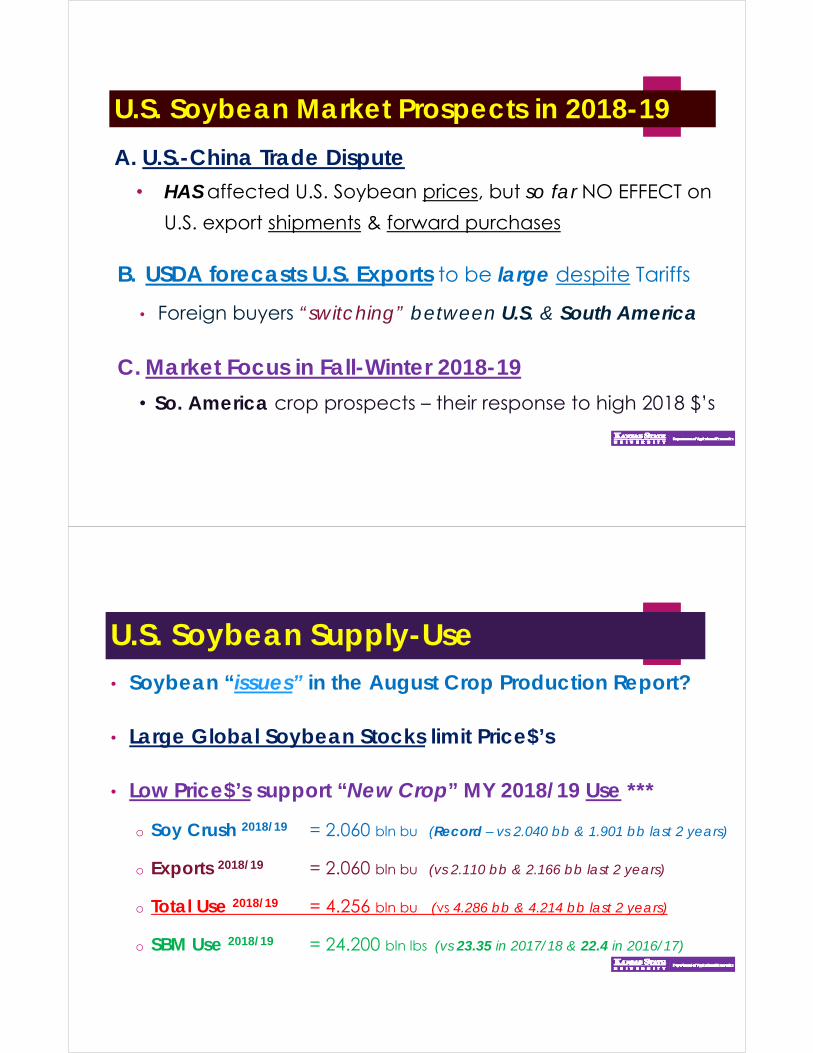
Commercial Hedge Positions in SoybeansCFTC Commitment of Traders to 7/31/2018
Managed Money (Spec) Positions in SoybeansCFTC Commitment of Traders to 7/31/2018
U.S. Soybean Market Prospects in 2018-19
A. U.S.-China Trade Dispute • HAS affected U.S. Soybean prices, but so far NO EFFECT on
U.S. export shipments & forward purchases
B. USDA forecasts U.S. Exports to be large despite Tariffs
• Foreign buyers “switching” between U.S. & South America
C. Market Focus in Fall-Winter 2018-19
• So. America crop prospects – their response to high 2018 $’s
U.S. Soybean Supply-Use• Soybean “issues” in the August Crop Production Report?
• Large Global Soybean Stocks limit Price$’s
• Low Price$’s support “New Crop” MY 2018/19 Use ***
o Soy Crush 2018/19 = 2.060 bln bu (Record – vs 2.040 bb & 1.901 bb last 2 years)
o Exports 2018/19 = 2.060 bln bu (vs 2.110 bb & 2.166 bb last 2 years)
o Total Use 2018/19 = 4.256 bln bu (vs 4.286 bb & 4.214 bb last 2 years)
o SBM Use 2018/19 = 24.200 bln lbs (vs 23.35 in 2017/18 & 22.4 in 2016/17)
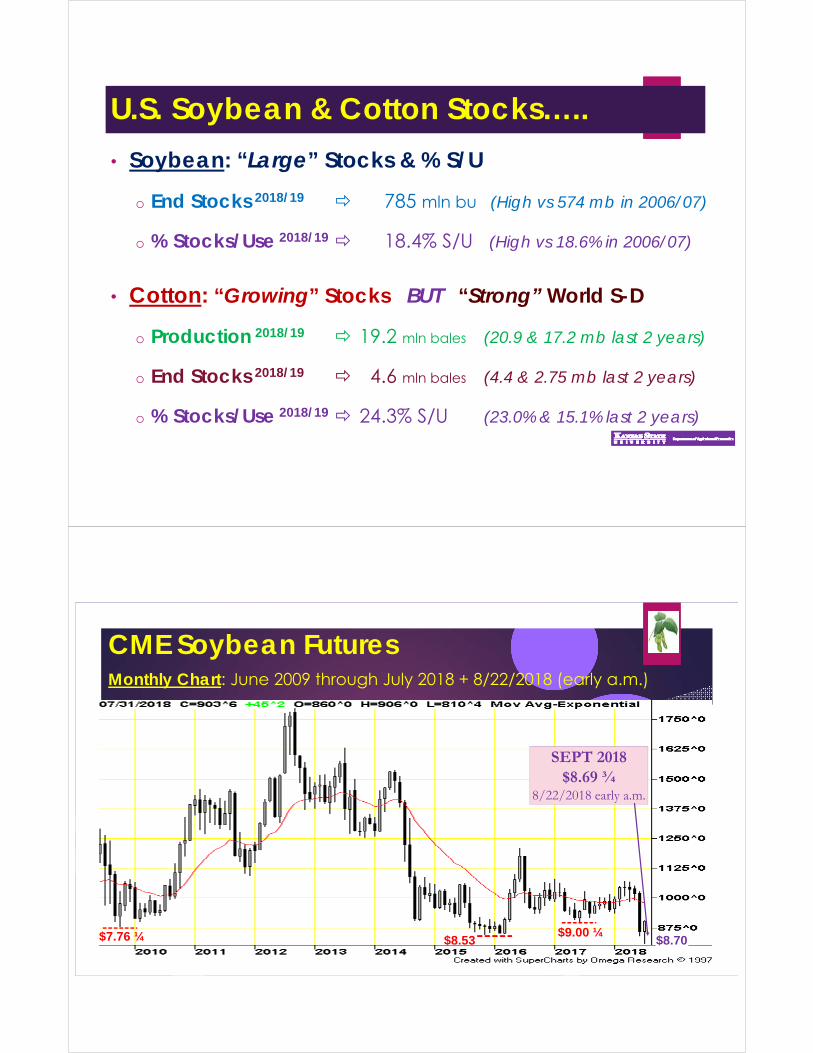
U.S. Soybean & Cotton Stocks…..
• Soybean: “Large” Stocks & % S/U
o End Stocks 2018/19 785 mln bu (High vs 574 mb in 2006/07)
o % Stocks/Use 2018/19 18.4% S/U (High vs 18.6% in 2006/07)
• Cotton: “Growing” Stocks BUT “Strong” World S-D
o Production 2018/19 19.2 mln bales (20.9 & 17.2 mb last 2 years)
o End Stocks 2018/19 4.6 mln bales (4.4 & 2.75 mb last 2 years)
o % Stocks/Use 2018/19 24.3% S/U (23.0% & 15.1% last 2 years)
CME Soybean Futures Monthly Chart: June 2009 through July 2018 + 8/22/2018 (early a.m.)
$7.76 ¼ $8.53 $9.00 ¼
$8.70
SEPT 2018$8.69 ¾
8/22/2018 early a.m.
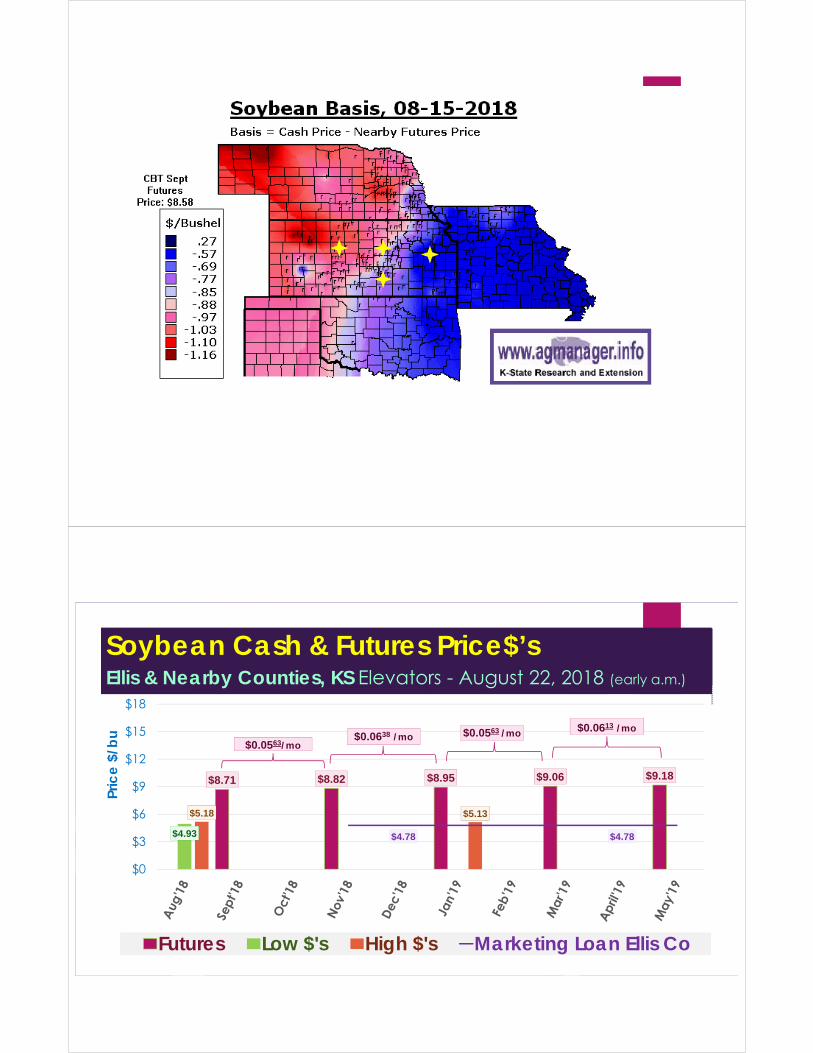
Soybean Cash & Futures Price$’sEllis & Nearby Counties, KS Elevators - August 22, 2018 (early a.m.)
$8.71 $8.82 $8.95 $9.06 $9.18
$4.93
$5.18 $5.13
$4.78 $4.78
$0
$3
$6
$9
$12
$15
$18
Pric
e $
/bu
Futures Low $'s High $'s Marketing Loan Ellis Co
$0.0563/mo$0.0638 /mo $0.0563 /mo $0.0613 /mo
Kansas Soybean Seasonal Cash $ IndexMonthly Prices: 1999/00 – 2016/17 + “Old Crop” MY 2017/18
2017/18
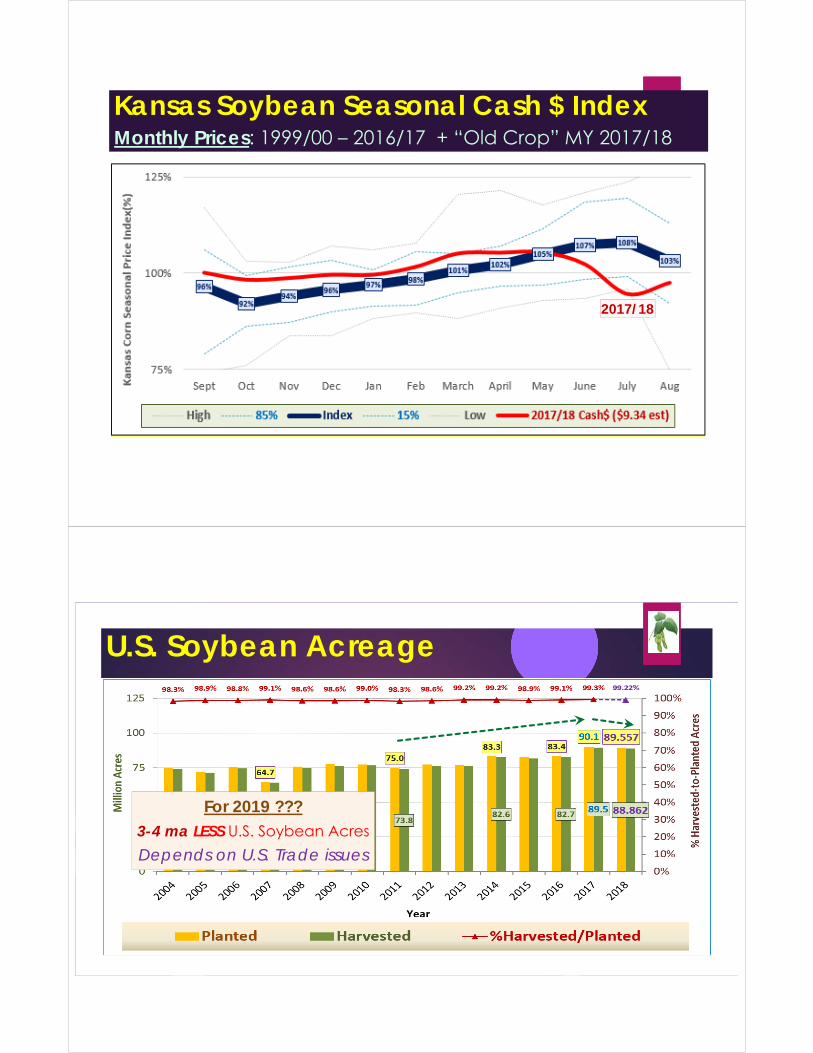
U.S. Soybean Acreage
For 2019 ???3-4 ma LESS U.S. Soybean Acres
Depends on U.S. Trade issues
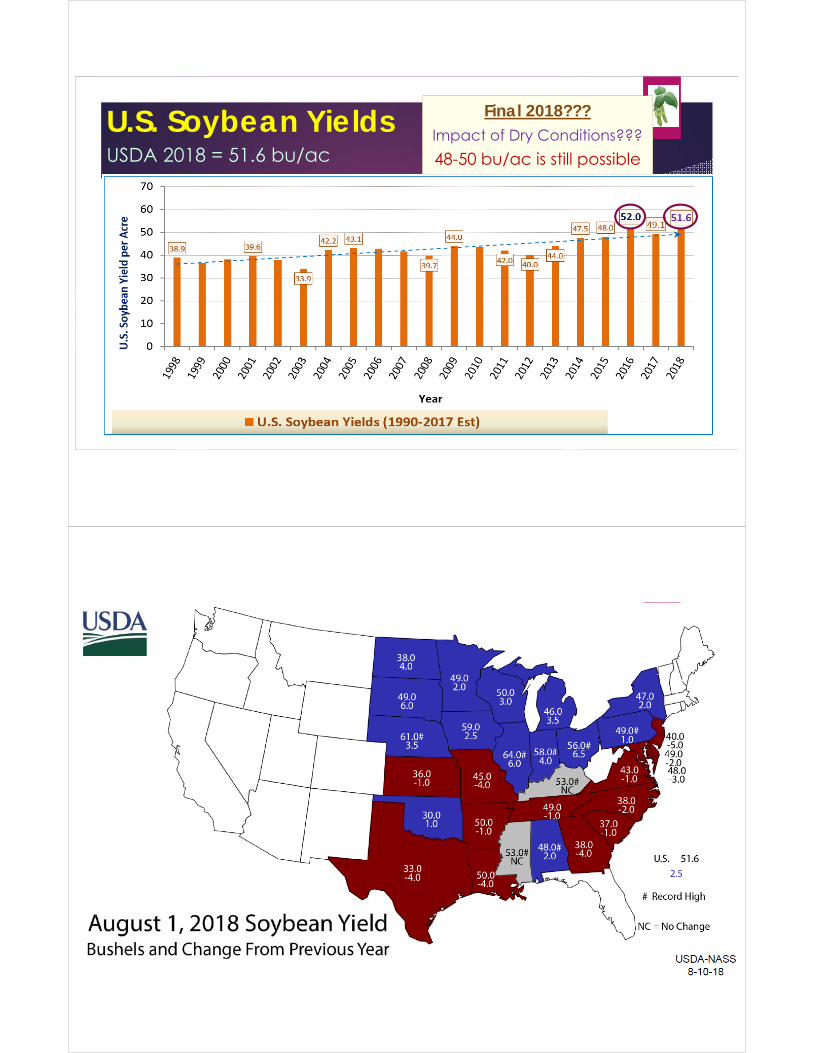
U.S. Soybean YieldsUSDA 2018 = 51.6 bu/ac
Final 2018???Impact of Dry Conditions???
48-50 bu/ac is still possible
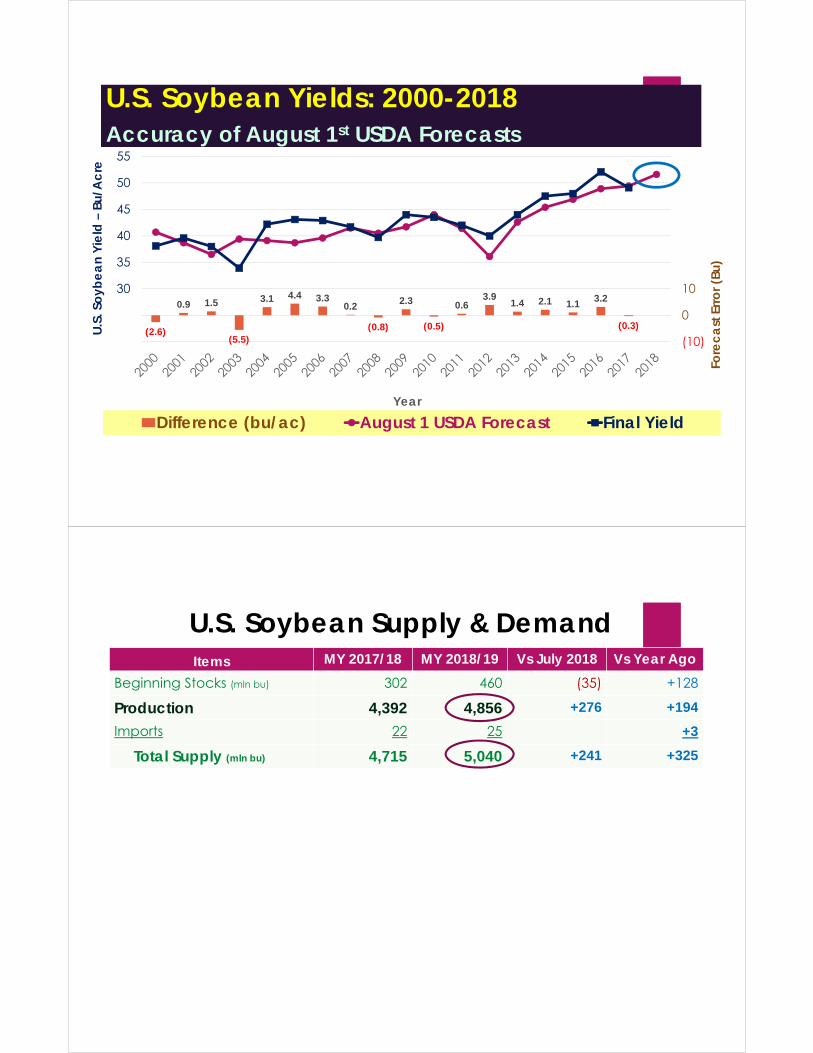
U.S. Soybean Yields: 2000-2018Accuracy of August 1st USDA Forecasts
(2.6)
0.9 1.5
(5.5)
3.1 4.4 3.3 0.2
(0.8)
2.3
(0.5)
0.6 3.9
1.4 2.1 1.1 3.2
(0.3)
(10)
0
10
20
30
40
50
60
20
25
30
35
40
45
50
55
Fore
ca
st E
rro
r (Bu
)
U.S
. So
ybe
an
Yie
ld –
Bu/A
cre
Year
Difference (bu/ac) August 1 USDA Forecast Final Yield
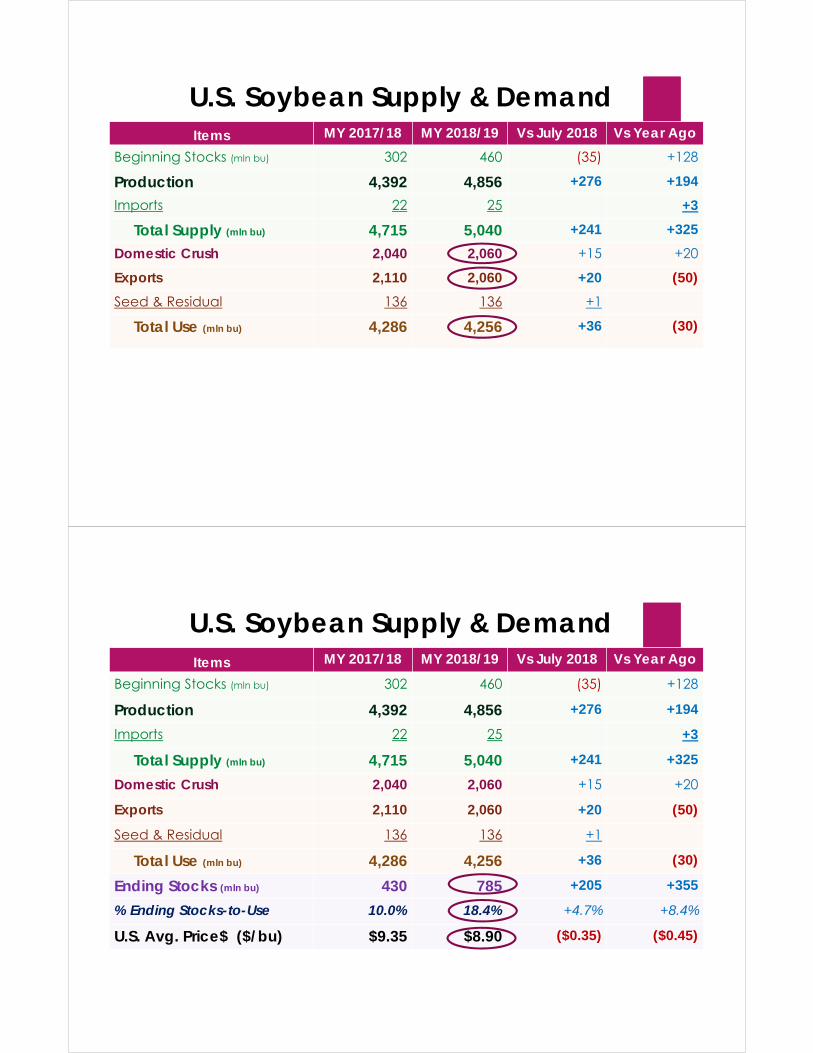
U.S. Soybean Supply & DemandItems MY 2017/18 MY 2018/19 Vs July 2018 Vs Year Ago
Beginning Stocks (mln bu) 302 460 (35) +128
Production 4,392 4,856 +276 +194
Imports 22 25 +3
Total Supply (mln bu) 4,715 5,040 +241 +325
U.S. Soybean Supply & DemandItems MY 2017/18 MY 2018/19 Vs July 2018 Vs Year Ago
Beginning Stocks (mln bu) 302 460 (35) +128
Production 4,392 4,856 +276 +194
Imports 22 25 +3
Total Supply (mln bu) 4,715 5,040 +241 +325
Domestic Crush 2,040 2,060 +15 +20
Exports 2,110 2,060 +20 (50)
Seed & Residual 136 136 +1
Total Use (mln bu) 4,286 4,256 +36 (30)
Ending Stocks (mln bu) 430 785 +205 +355
% Ending Stocks-to-Use 10.0% 18.4% +4.7% +8.4%
U.S. Avg. Price$ ($/bu) $9.35 $8.90 ($0.35) ($0.45)
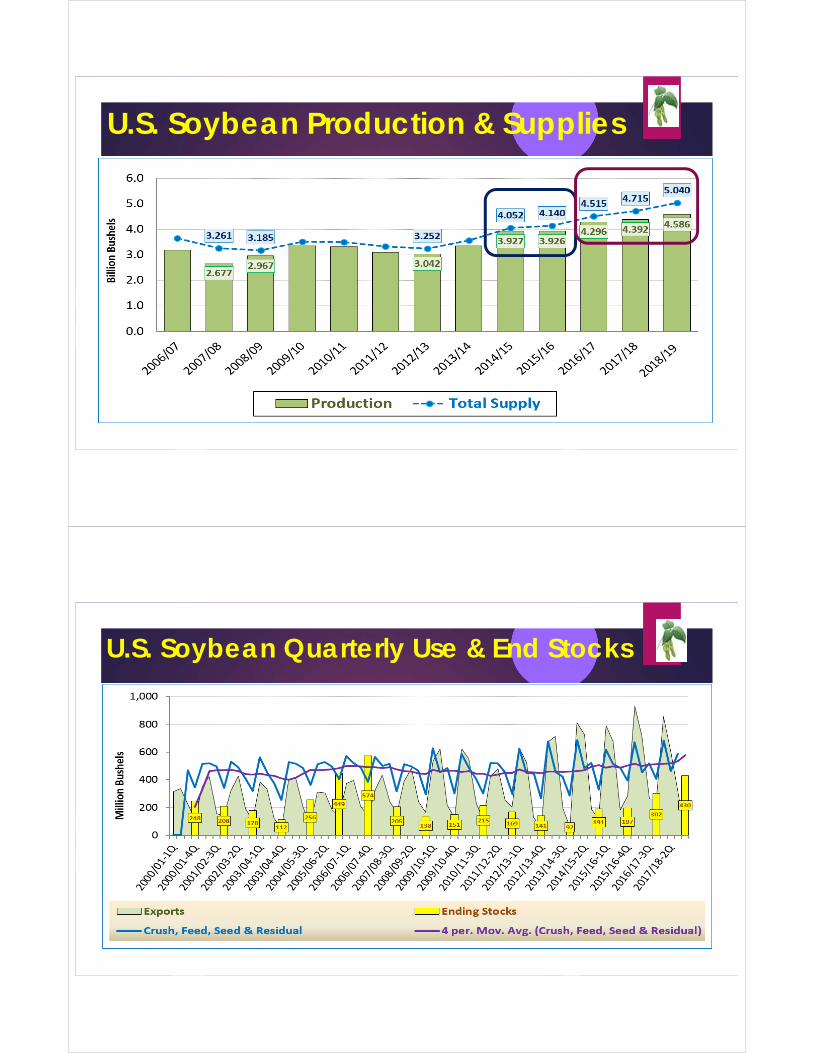
U.S. Soybean Production & Supplies
U.S. Soybean Quarterly Use & End Stocks
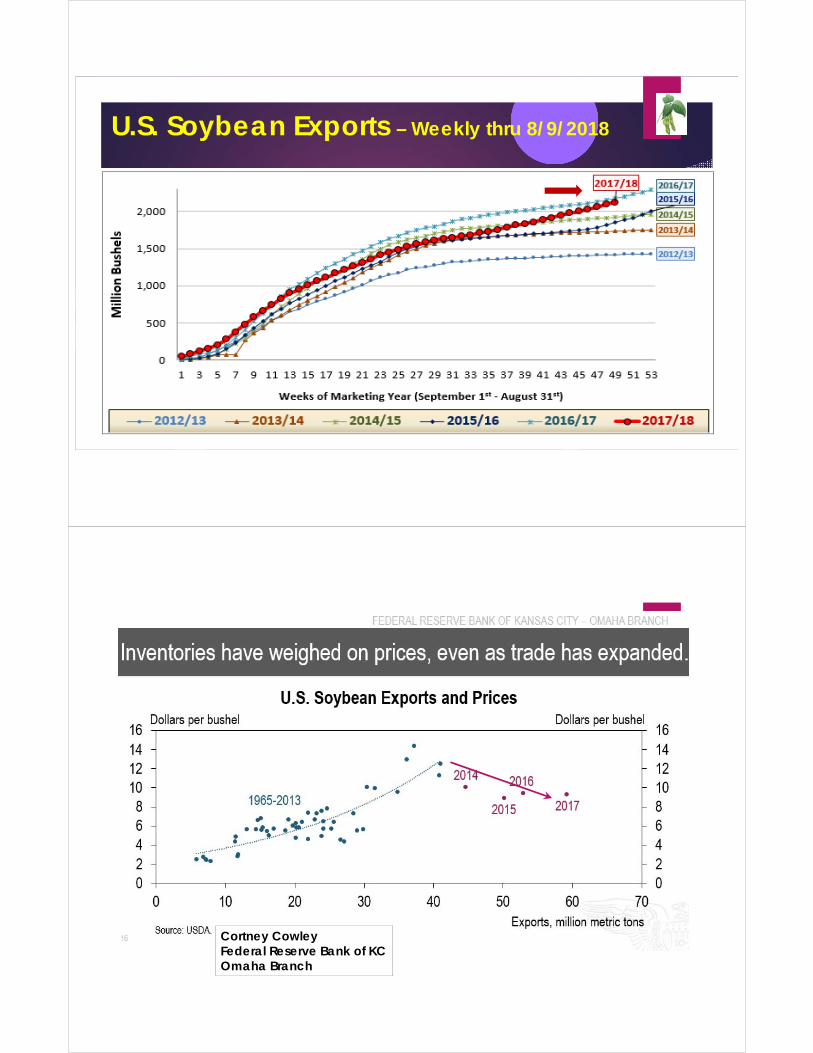
U.S. Soybean Exports – Weekly thru 8/9/2018
Cortney CowleyFederal Reserve Bank of KCOmaha Branch

U.S. Soybean Use & End Stocks
U.S. Soybean Ending Stocks & % Stx/Use
205 138 151 215 169 141 92191 197
302430
7856.7%
4.5% 4.5%
6.6%5.4%
4.5%
2.6%
5.0% 5.0%
7.2%
10.0%
18.4%
0
500
1,000
1,500
2,000
2,500
3,000
0%
4%
8%
12%
16%
20%
Mill
ion
Bu.
% E
nd
Sto
cks-
to-U
se
Marketing Year
U.S. Soybean Ending Stocks are growing at a
rate that likely will cause extreme oversupply &
“@ Cost of Production-level” prices
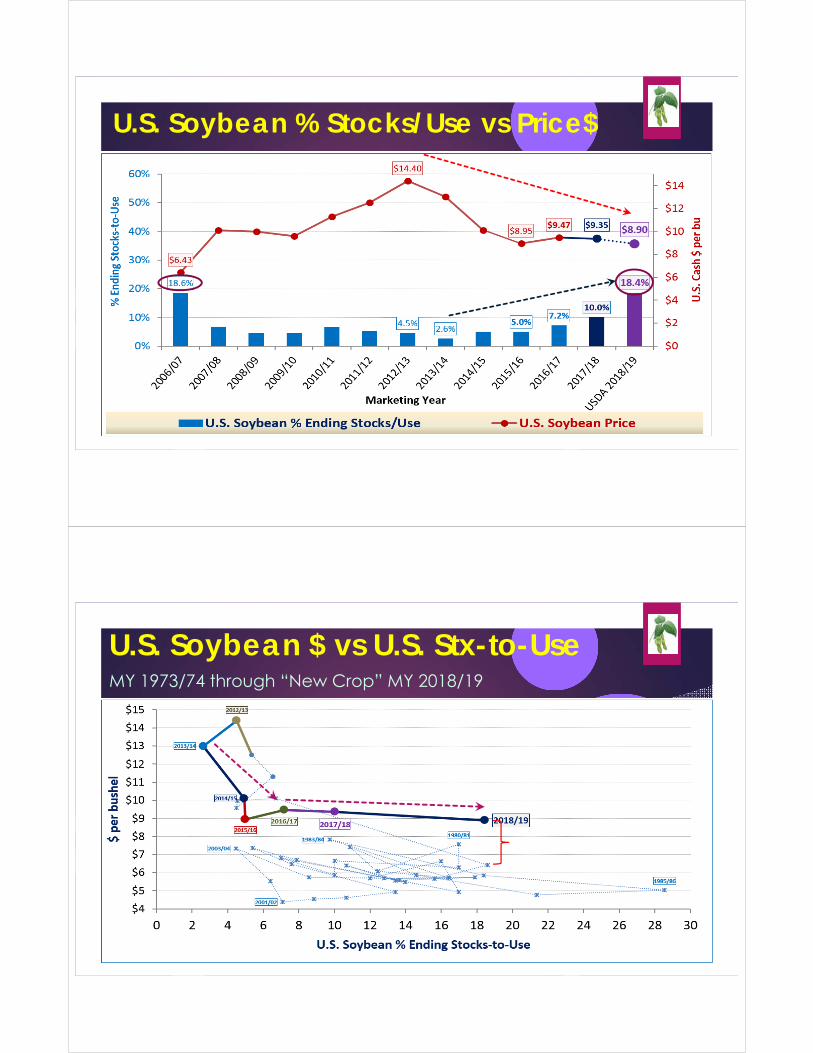
U.S. Soybean % Stocks/Use vs Price$
U.S. Soybean $ vs U.S. Stx-to-UseMY 1973/74 through “New Crop” MY 2018/19
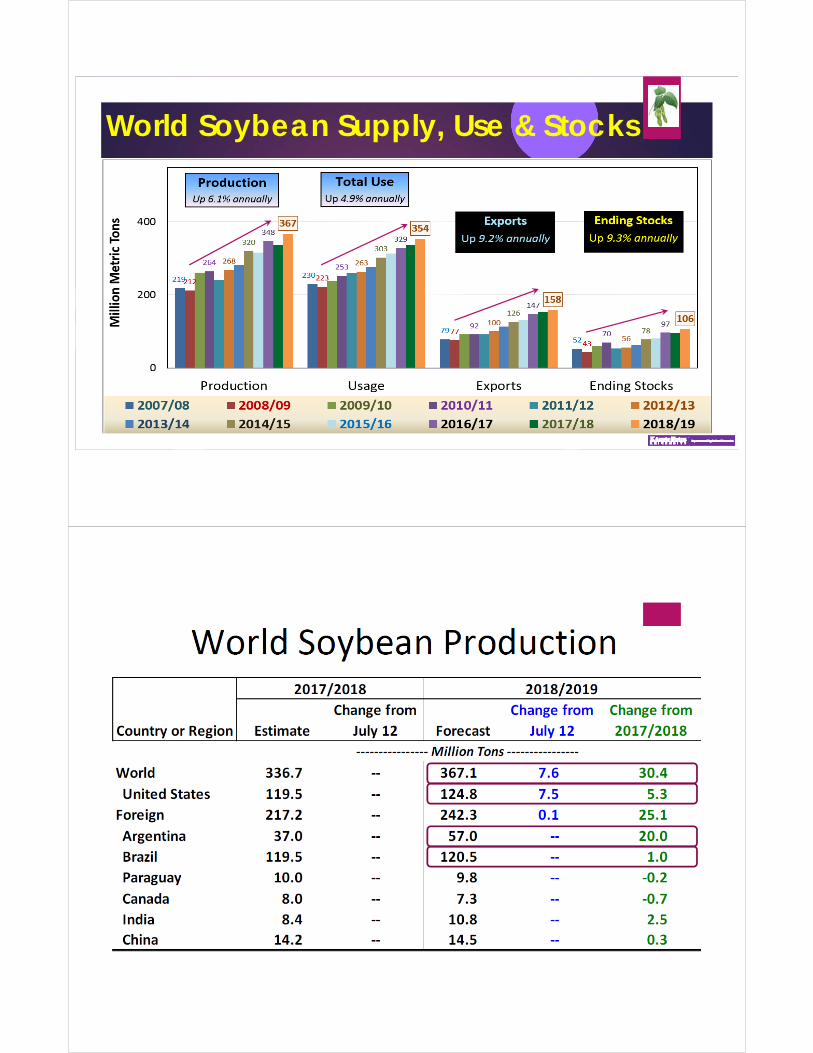
World Soybean Supply, Use & Stocks
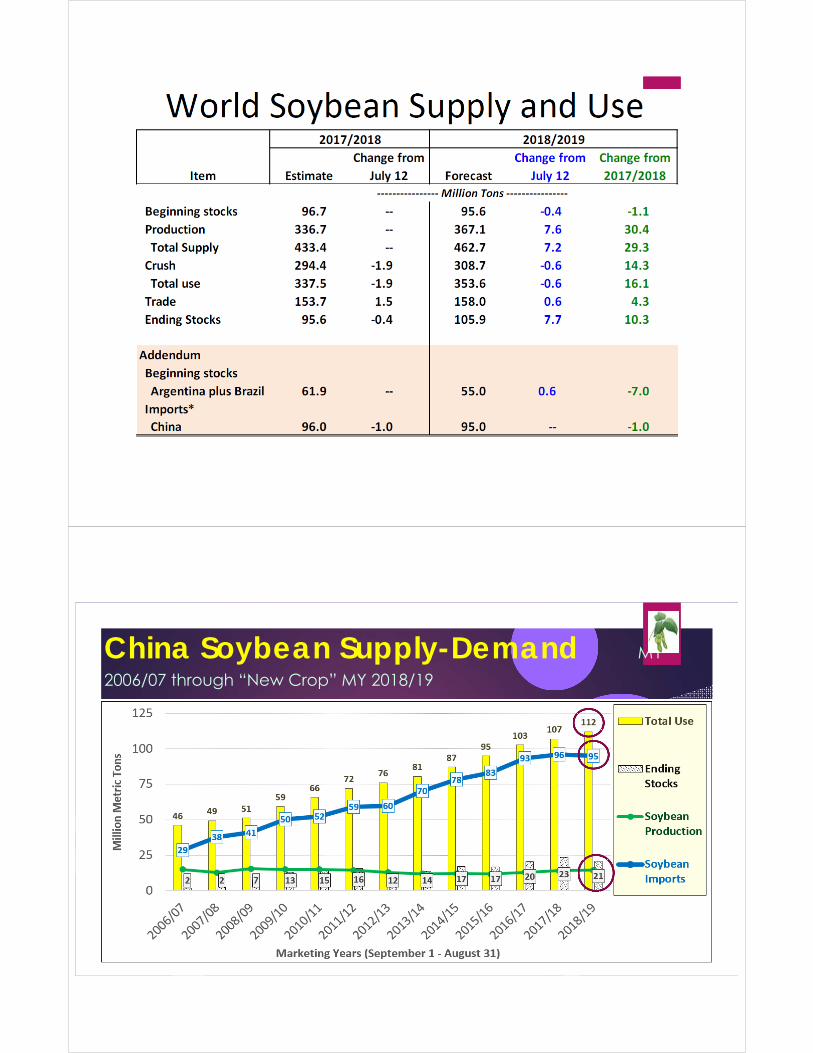
China Soybean Supply-Demand MY
2006/07 through “New Crop” MY 2018/19
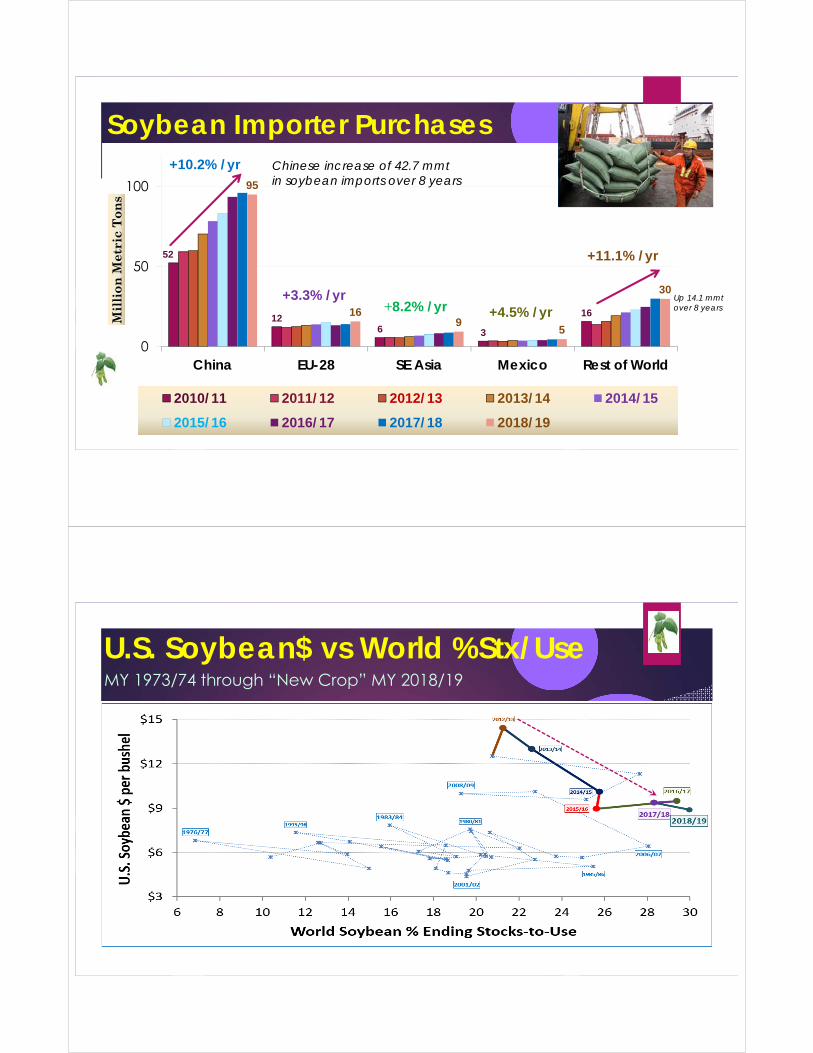
Soybean Importer Purchases
52
126 3
16
95
169
5
30
0
50
100
China EU-28 SE Asia Mexico Rest of World
Mil
lio
n M
etri
c T
on
s
2010/11 2011/12 2012/13 2013/14 2014/15
2015/16 2016/17 2017/18 2018/19
+10.2% /yr
+3.3% /yr+8.2% /yr +4.5% /yr
+11.1% /yr
Chinese increase of 42.7 mmtin soybean imports over 8 years
Up 14.1 mmtover 8 years
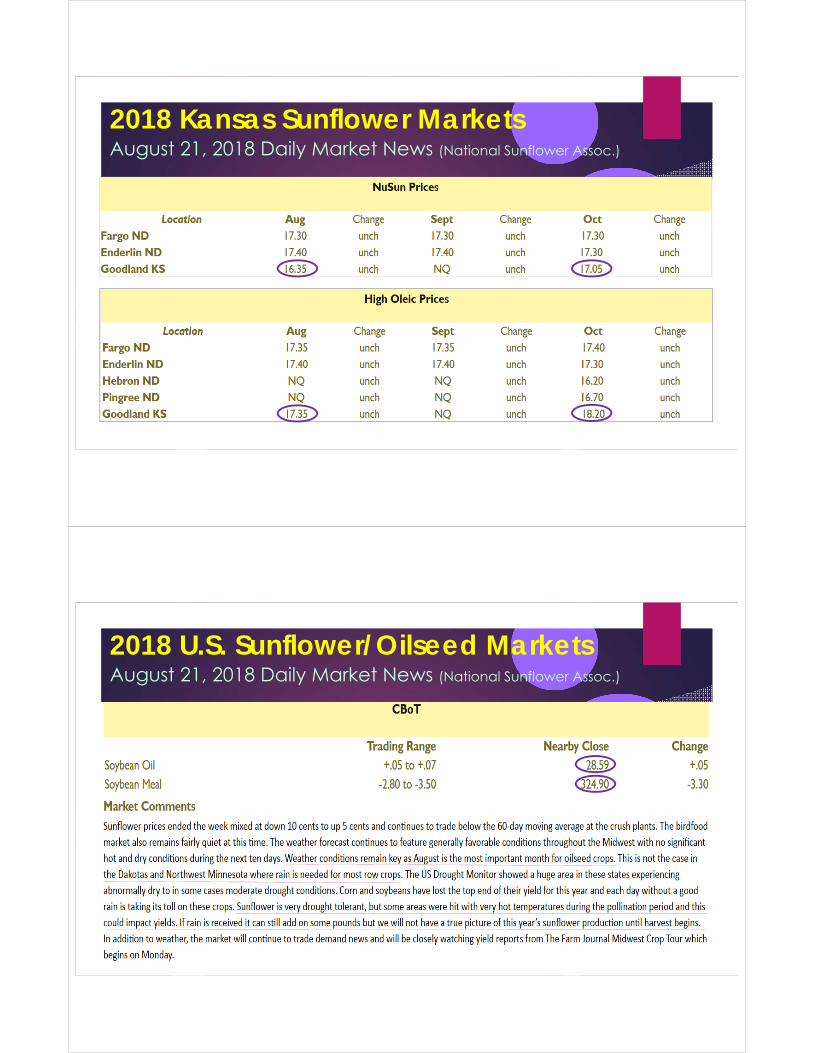
U.S. Soybean$ vs World %Stx/Use MY 1973/74 through “New Crop” MY 2018/19
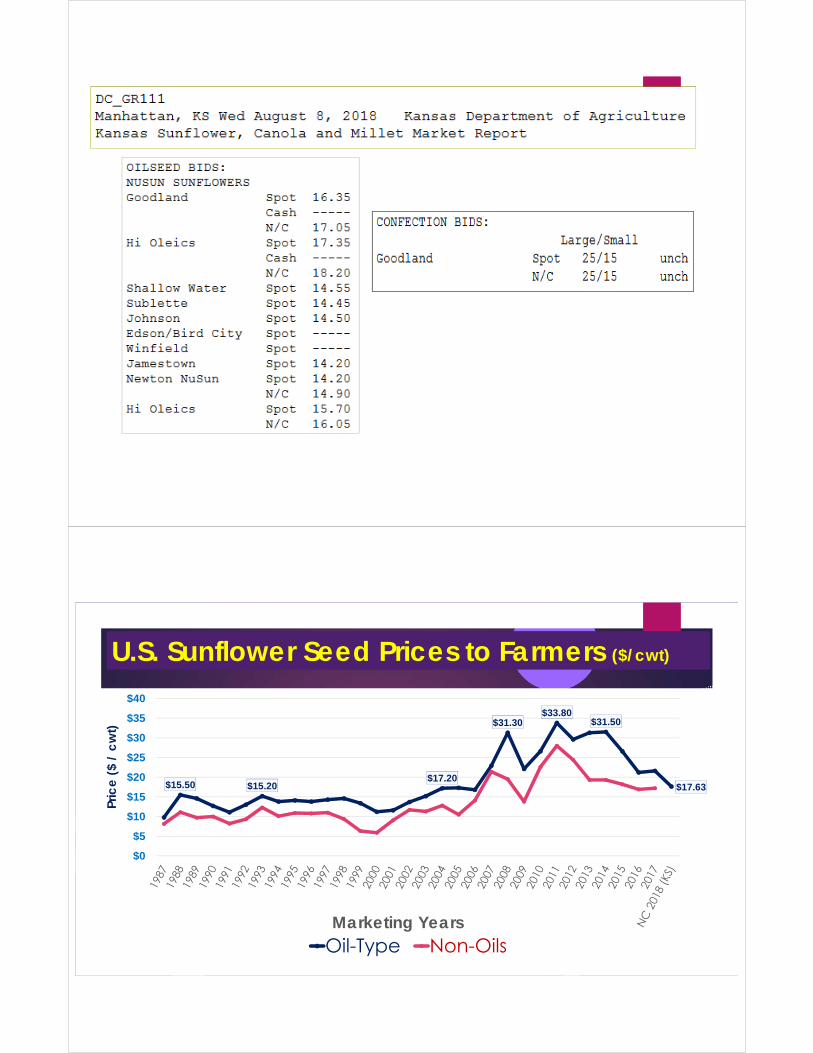
2018 Kansas Sunflower MarketsAugust 21, 2018 Daily Market News (National Sunflower Assoc.)
2018 U.S. Sunflower/Oilseed MarketsAugust 21, 2018 Daily Market News (National Sunflower Assoc.)
U.S. Sunflower Seed Prices to Farmers ($/cwt)
$15.50 $15.20$17.20
$31.30$33.80
$31.50
$17.63
$0
$5
$10
$15
$20
$25
$30
$35
$40
Pric
e (
$ /
cw
t)
Marketing YearsOil-Type Non-Oils
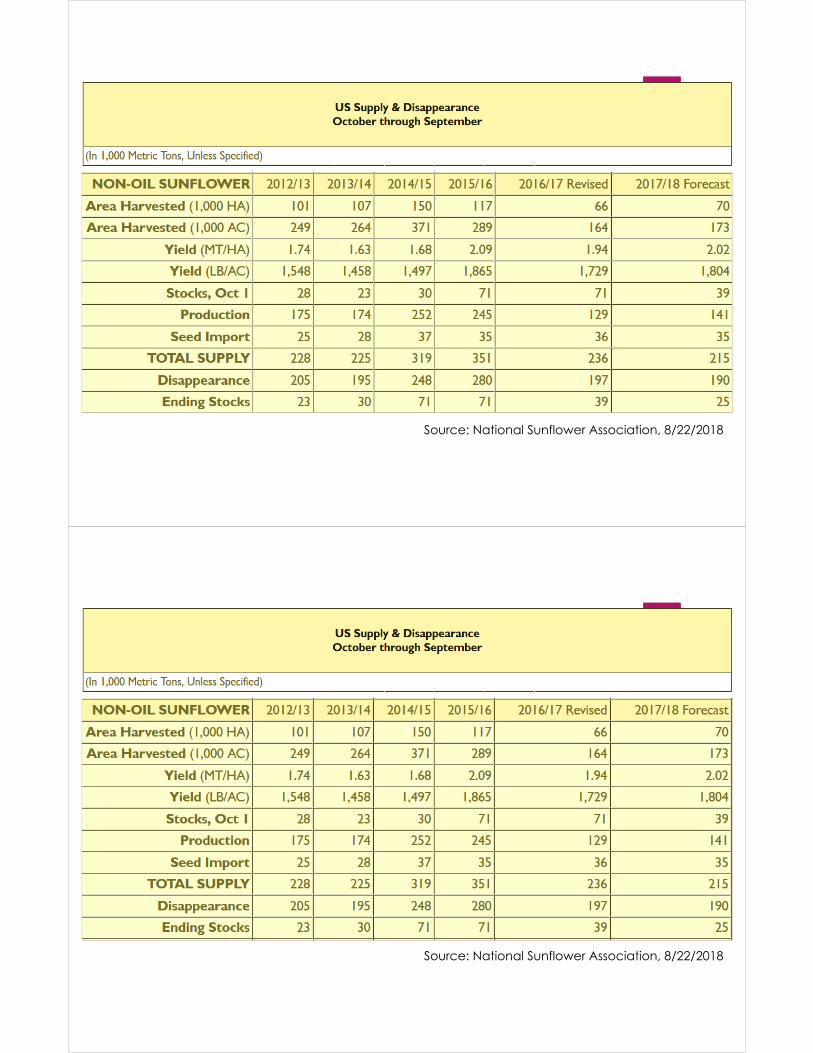
Source: National Sunflower Association, 8/22/2018
Source: National Sunflower Association, 8/22/2018

Questions?
Daniel O’Brien – Extension Ag Economist
Blog: www.ksugrains.wordpress.com
KSUGrains on Twitter & Facebook
www.AgManager.info


![Old Behind Bars [HRW]](https://img.pdfslide.net/doc/110x75/577cdb8f1a28ab9e78a883a7/old-behind-bars-hrw.jpg)