Embed Size (px)
Citation preview
2/12/2018
1
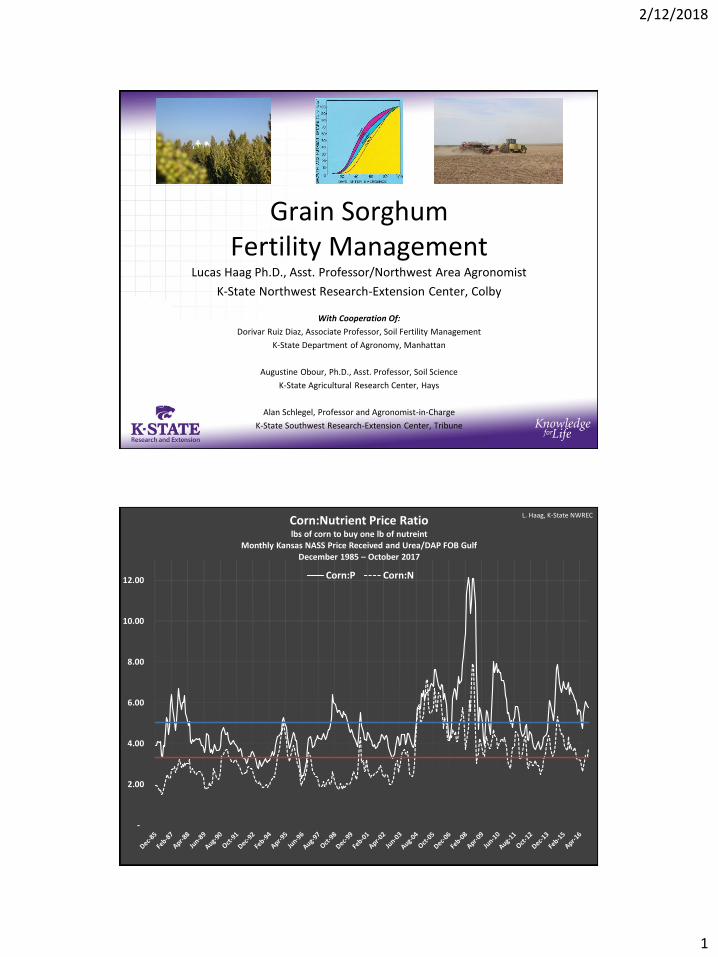
Grain Sorghum Fertility Management
Lucas Haag Ph.D., Asst. Professor/Northwest Area Agronomist
K-State Northwest Research-Extension Center, Colby
With Cooperation Of:
Dorivar Ruiz Diaz, Associate Professor, Soil Fertility Management
K-State Department of Agronomy, Manhattan
Augustine Obour, Ph.D., Asst. Professor, Soil Science
K-State Agricultural Research Center, Hays
Alan Schlegel, Professor and Agronomist-in-Charge
K-State Southwest Research-Extension Center, Tribune
2016 Sorghum U - Dodge City
-
2.00
4.00
6.00
8.00
10.00
12.00
Corn:Nutrient Price Ratiolbs of corn to buy one lb of nutreint
Monthly Kansas NASS Price Received and Urea/DAP FOB GulfDecember 1985 – October 2017
Corn:P Corn:N
L. Haag, K-State NWREC
2/12/2018
2
Soil Fertility Essentials
2016 Sorghum U - Dodge City
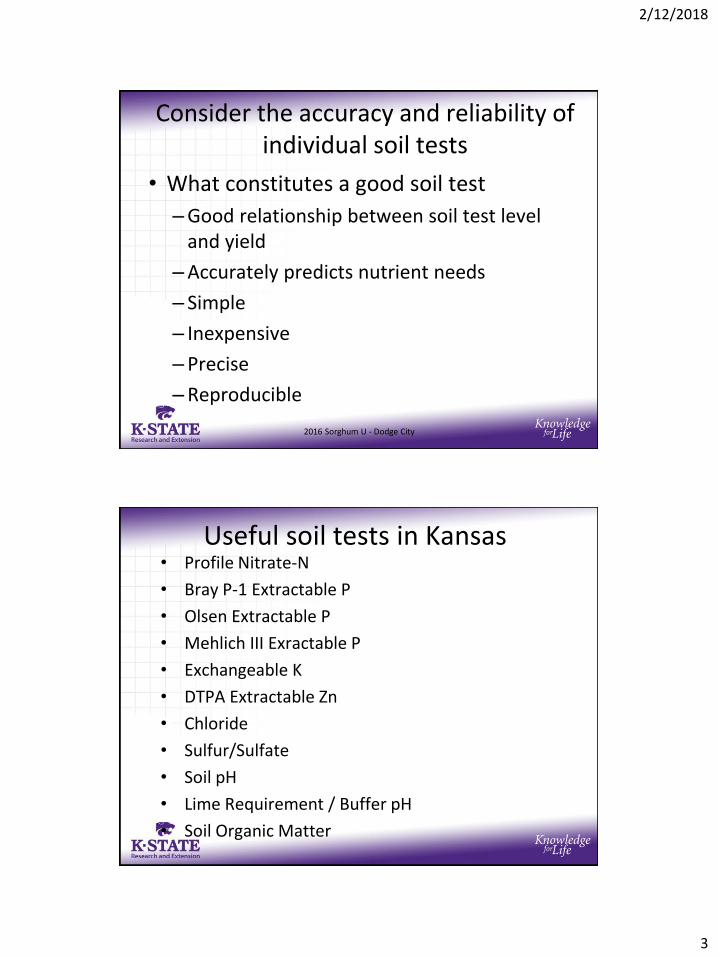
In Nutrient Management, the Primary Objectives of Soil Testing are:
• Determine the fertility and pH status of an area, field or farm, with the goal of removing fertility as a yield limitation
• Predict where fertilizer responses will or will not occur
– Increase the return on our fertilizer investment
– Increase the efficiency of fertilizer use
– Reduce the potential for environmental injury
2016 Sorghum U - Dodge City
2/12/2018
3
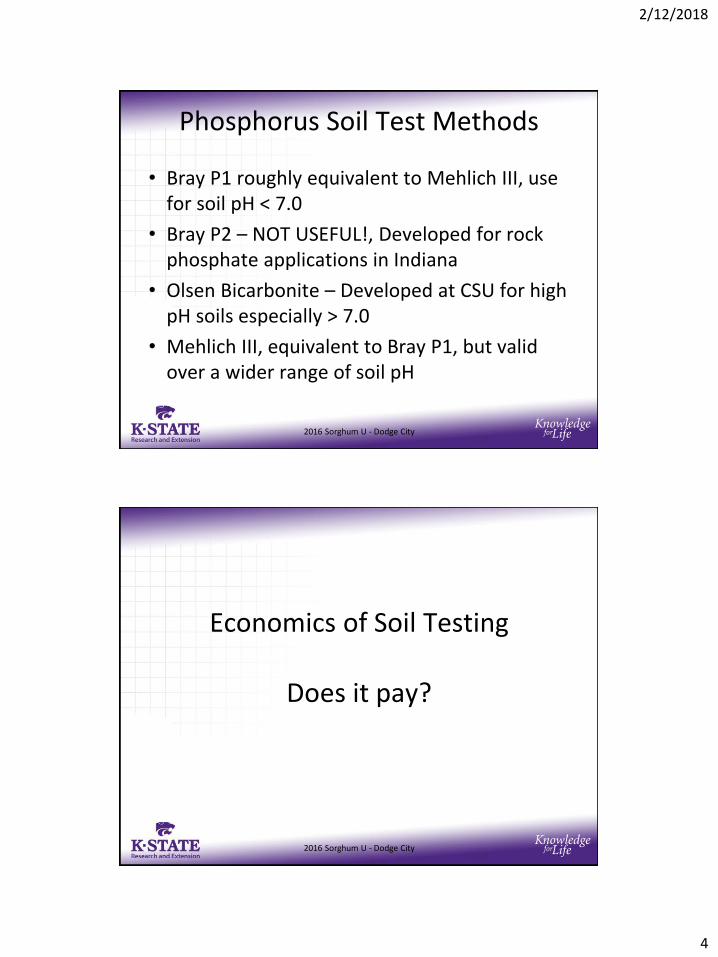
Consider the accuracy and reliability of individual soil tests
• What constitutes a good soil test
–Good relationship between soil test level and yield
–Accurately predicts nutrient needs
– Simple
– Inexpensive
–Precise
–Reproducible
2016 Sorghum U - Dodge City
Useful soil tests in Kansas• Profile Nitrate-N
• Bray P-1 Extractable P
• Olsen Extractable P
• Mehlich III Exractable P
• Exchangeable K
• DTPA Extractable Zn
• Chloride
• Sulfur/Sulfate
• Soil pH
• Lime Requirement / Buffer pH
• Soil Organic Matter
2/12/2018
4
Phosphorus Soil Test Methods
• Bray P1 roughly equivalent to Mehlich III, use for soil pH < 7.0
• Bray P2 – NOT USEFUL!, Developed for rock phosphate applications in Indiana
• Olsen Bicarbonite – Developed at CSU for high pH soils especially > 7.0
• Mehlich III, equivalent to Bray P1, but valid over a wider range of soil pH
2016 Sorghum U - Dodge City
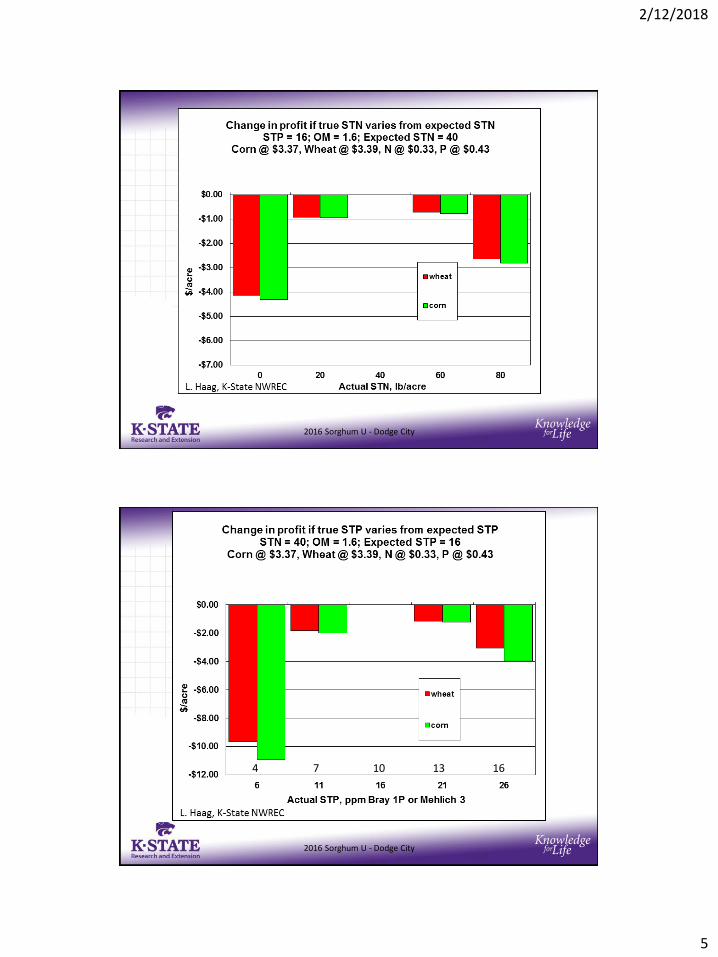
Economics of Soil Testing
Does it pay?
2016 Sorghum U - Dodge City
2/12/2018
5
2016 Sorghum U - Dodge City
2016 Sorghum U - Dodge City
4 7 10 13 16
2/12/2018
6
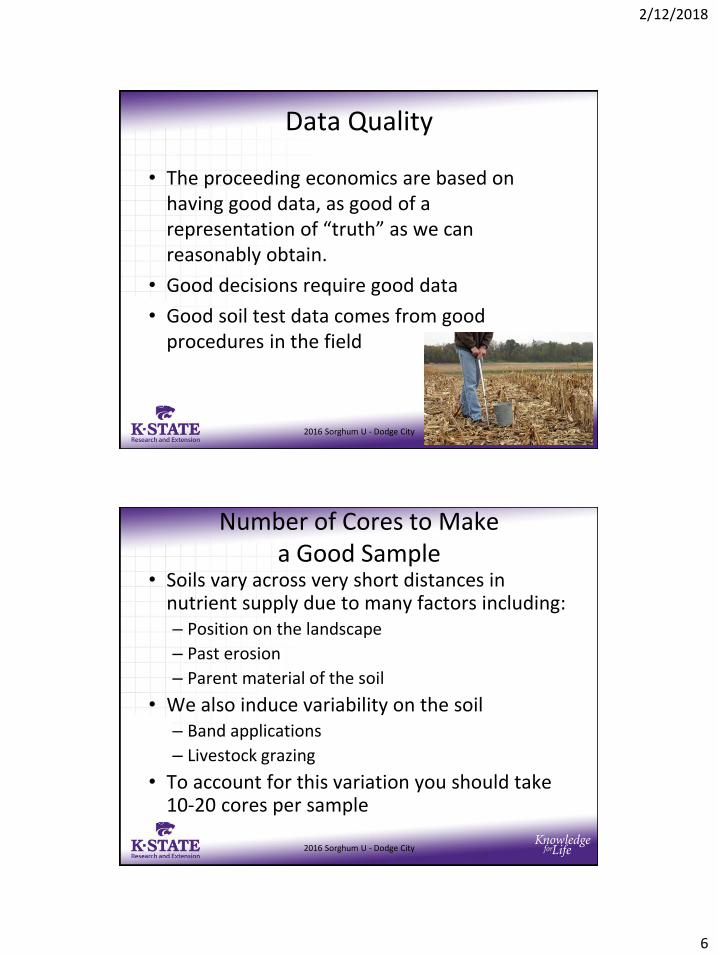
Data Quality
• The proceeding economics are based on having good data, as good of a representation of “truth” as we can reasonably obtain.
• Good decisions require good data
• Good soil test data comes from good procedures in the field
2016 Sorghum U - Dodge City
Number of Cores to Make a Good Sample
• Soils vary across very short distances in nutrient supply due to many factors including:– Position on the landscape
– Past erosion
– Parent material of the soil
• We also induce variability on the soil– Band applications
– Livestock grazing
• To account for this variation you should take 10-20 cores per sample
2016 Sorghum U - Dodge City
2/12/2018
7
NUMBER OF CORES PER SAMPLE
0 5 10 15 20 25 30 35 40 45 500
1
2
3
4
5
6
7
8
9
10
11
12
13
14
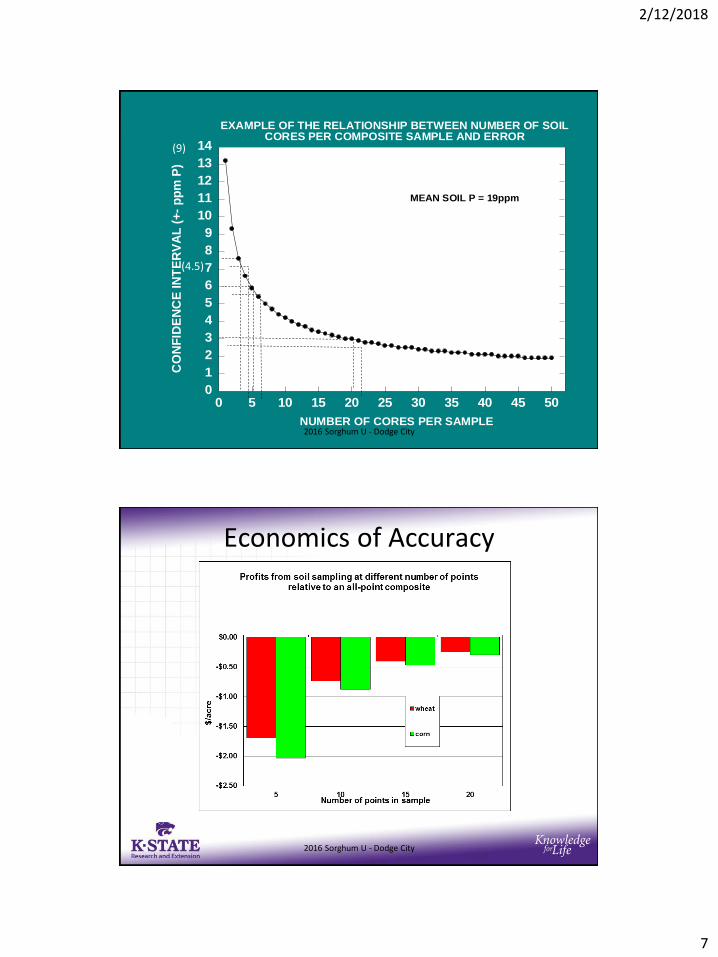
EXAMPLE OF THE RELATIONSHIP BETWEEN NUMBER OF SOILCORES PER COMPOSITE SAMPLE AND ERROR
CO
NF
IDE
NC
E I
NT
ER
VA
L (
+-
pp
m P
)
MEAN SOIL P = 19ppm
2016 Sorghum U - Dodge City
(9)
(4.5)
Economics of Accuracy
2016 Sorghum U - Dodge City
2/12/2018
8
Sampling Depths for Mobile Nutrients
• While P and K are relatively immobile in soils and accumulate in the surface few inches, Nitrate-N, Sulfur (S) and Chloride (Cl) are mobile and move through the soil profile.
• We recommend a 24” Profile Soil Sample to test for mobile nutrients such as nitrate-N in the soil. 10-15 cores are still needed to give a high quality sample
2016 Sorghum U - Dodge City
When to Take Soil Samples
• P, K, Zn and pH always the same time.
• Focus on times when soil conditions are good, long enough before planting to really use the information.
• Be consistent.
• Late fall, winter and early spring-November through March are good.
2016 Sorghum U - Dodge City
2/12/2018
9
When to Take Soil Samples
• For N, S and Cl
• Summer crops: after harvest in the fall, but before the soil warms in the spring.
• Fall crops: before planting in the fall.
– Spring or winter samples to predict topdress N needs don’t work real well.
2016 Sorghum U - Dodge City
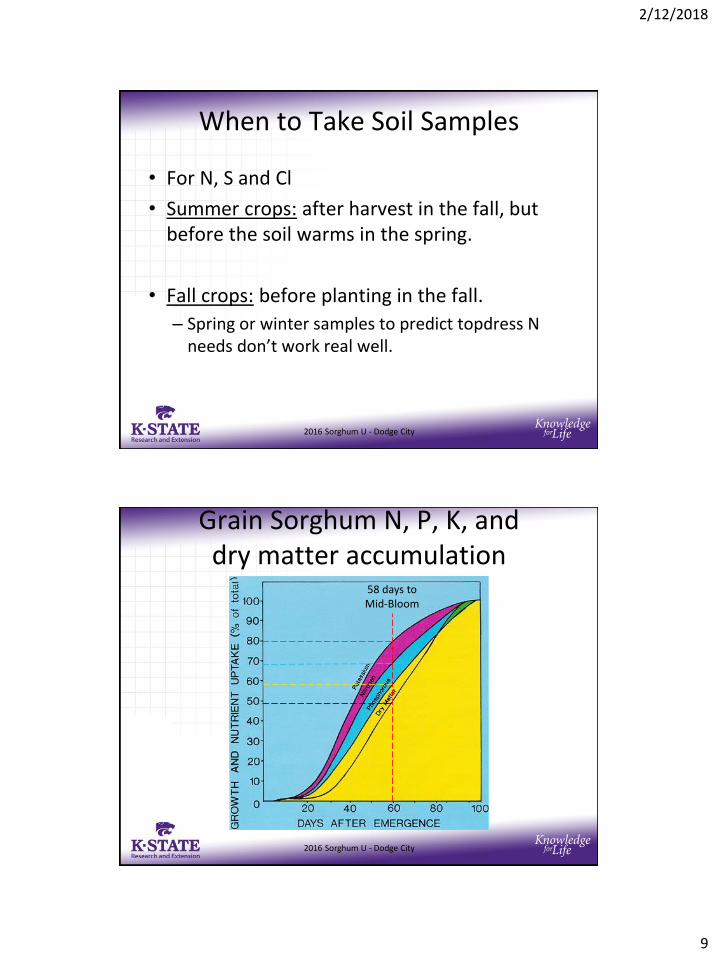
Grain Sorghum N, P, K, and dry matter accumulation
2016 Sorghum U - Dodge City
58 days to Mid-Bloom
2/12/2018
10
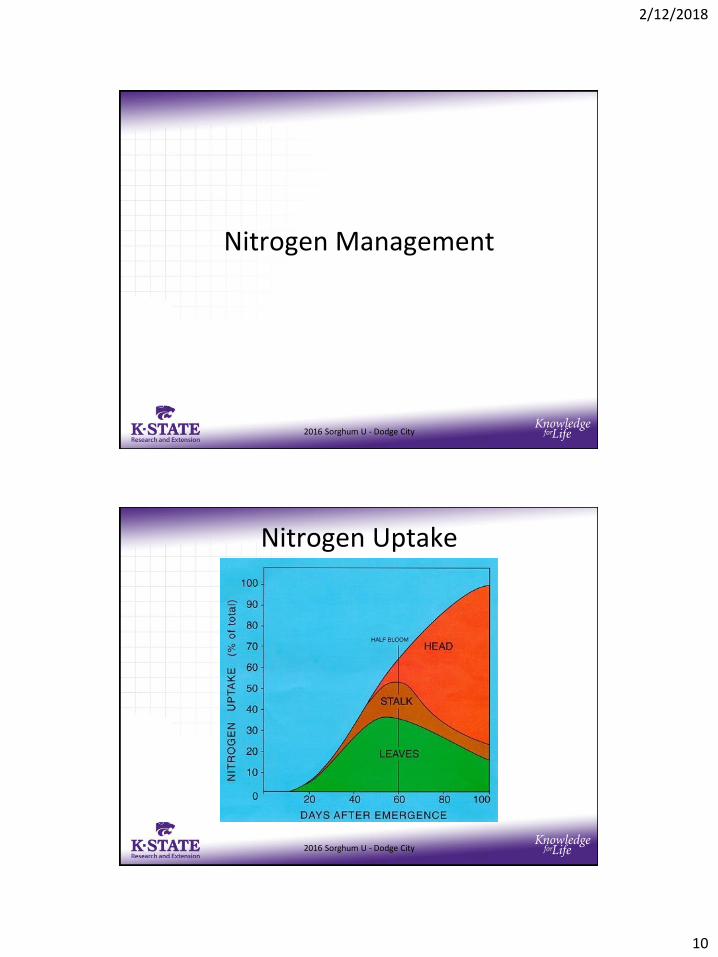
Nitrogen Management
2016 Sorghum U - Dodge City
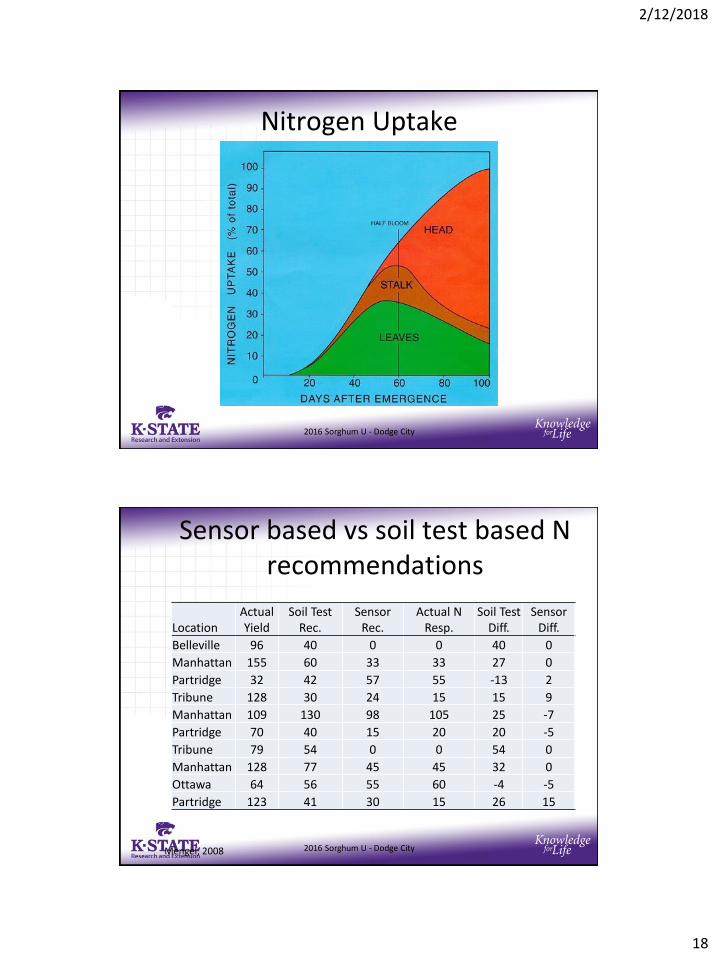
Nitrogen Uptake
2016 Sorghum U - Dodge City
2/12/2018
11
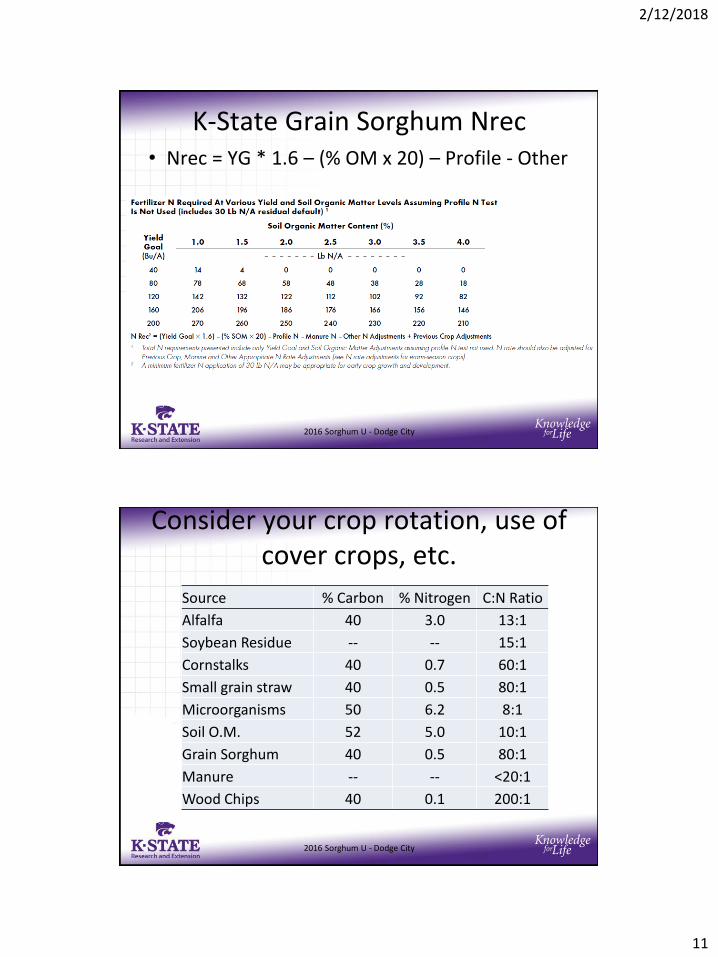
K-State Grain Sorghum Nrec• Nrec = YG * 1.6 – (% OM x 20) – Profile - Other
2016 Sorghum U - Dodge City
Consider your crop rotation, use of cover crops, etc.
2016 Sorghum U - Dodge City
Source % Carbon % Nitrogen C:N Ratio
Alfalfa 40 3.0 13:1
Soybean Residue -- -- 15:1
Cornstalks 40 0.7 60:1
Small grain straw 40 0.5 80:1
Microorganisms 50 6.2 8:1
Soil O.M. 52 5.0 10:1
Grain Sorghum 40 0.5 80:1
Manure -- -- <20:1
Wood Chips 40 0.1 200:1
2/12/2018
12
2016 Sorghum U - Dodge City
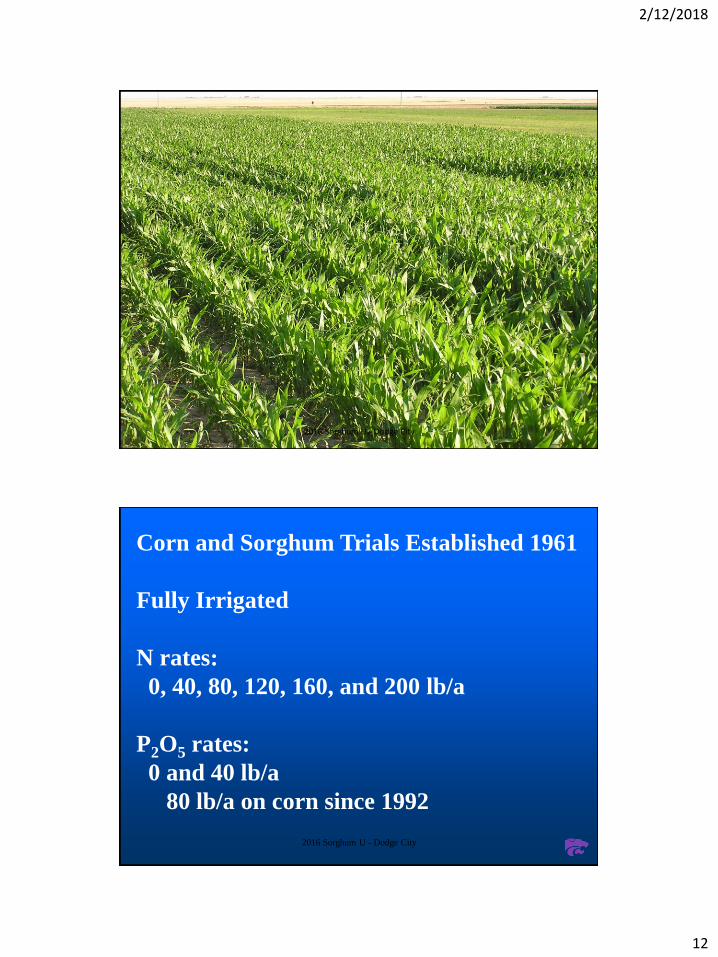
Corn and Sorghum Trials Established 1961
Fully Irrigated
N rates:
0, 40, 80, 120, 160, and 200 lb/a
P2O5 rates:
0 and 40 lb/a
80 lb/a on corn since 1992
2016 Sorghum U - Dodge City
2/12/2018
13
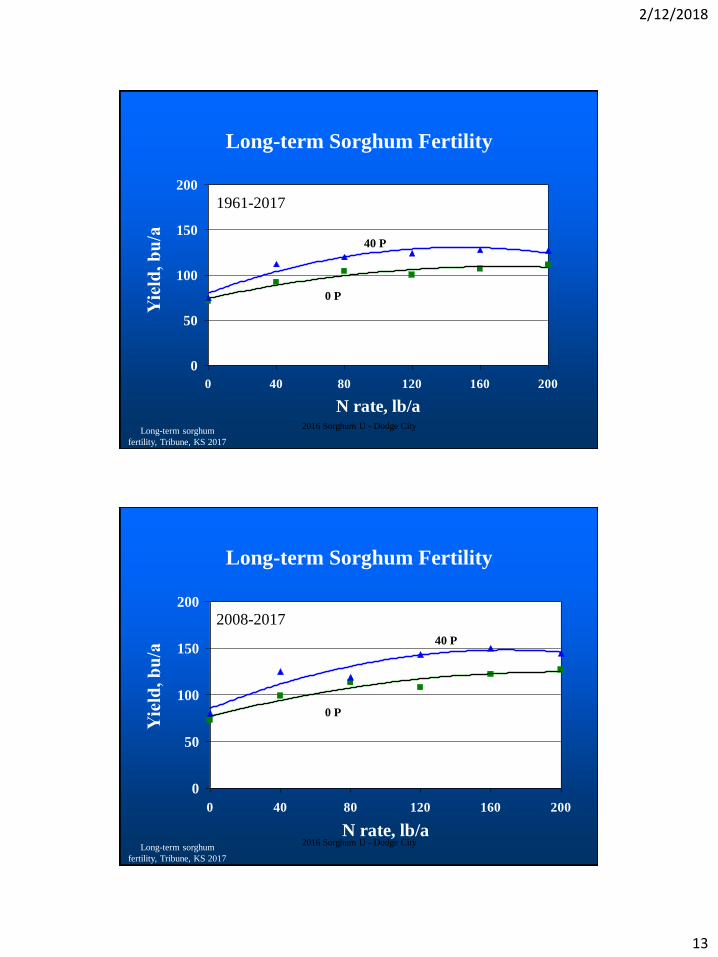
Long-term Sorghum Fertility
0
50
100
150
200
0 40 80 120 160 200
N rate, lb/a
Long-term sorghum
fertility, Tribune, KS 2017
40 P
0 P
1961-2017
2016 Sorghum U - Dodge City
Long-term Sorghum Fertility
0
50
100
150
200
0 40 80 120 160 200
N rate, lb/aLong-term sorghum
fertility, Tribune, KS 2017
40 P
0 P
2008-2017
2016 Sorghum U - Dodge City
2/12/2018
14
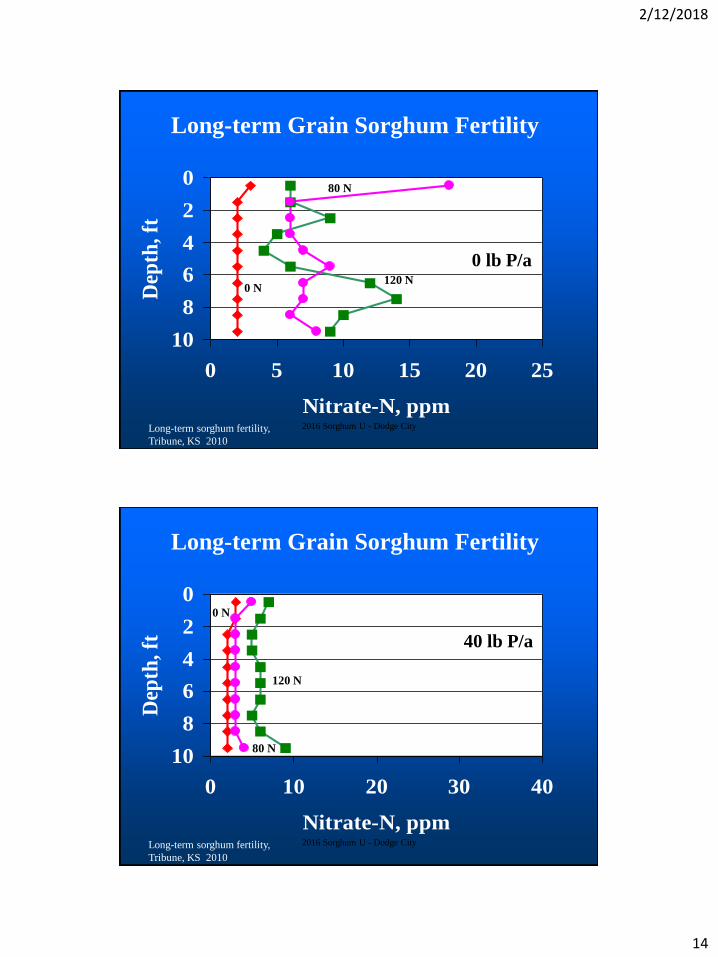
Long-term Grain Sorghum Fertility
0
2
4
6
8
10
0 5 10 15 20 25
Nitrate-N, ppm
Dep
th,
ft
120 N0 N
Long-term sorghum fertility,
Tribune, KS 2010
0 lb P/a
80 N
2016 Sorghum U - Dodge City
Long-term Grain Sorghum Fertility
0
2
4
6
8
10
0 10 20 30 40
Nitrate-N, ppm
Dep
th,
ft
120 N
0 N
Long-term sorghum fertility,
Tribune, KS 2010
40 lb P/a
80 N
2016 Sorghum U - Dodge City
2/12/2018
15
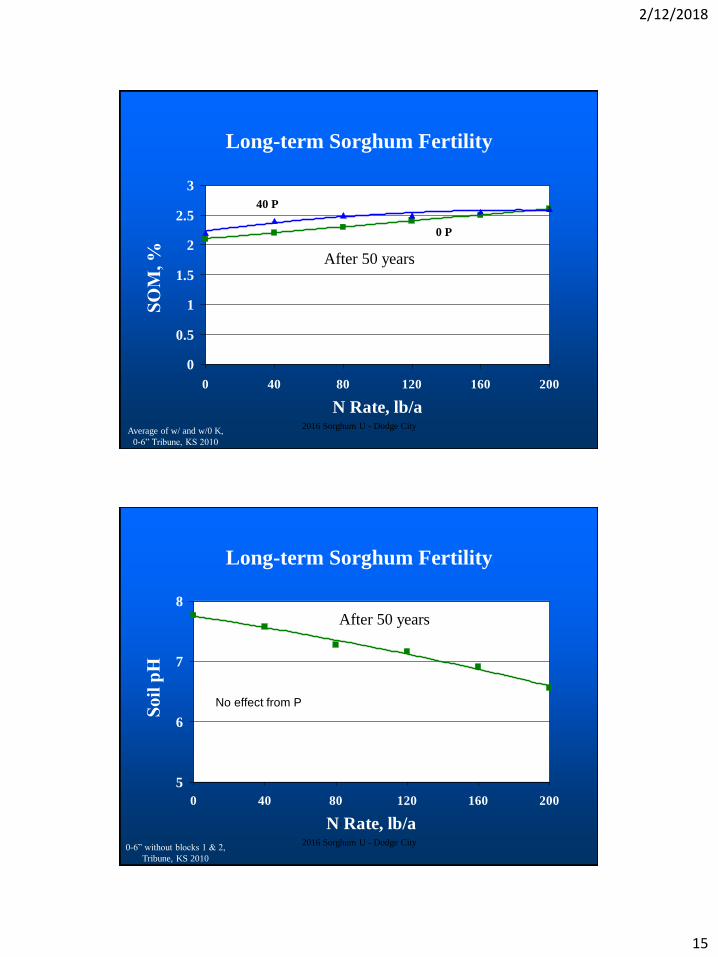
Long-term Sorghum Fertility
0
0.5
1
1.5
2
2.5
3
0 40 80 120 160 200
N Rate, lb/a
Average of w/ and w/0 K,
0-6” Tribune, KS 2010
40 P
0 P
After 50 years
2016 Sorghum U - Dodge City
Long-term Sorghum Fertility
5
6
7
8
0 40 80 120 160 200
N Rate, lb/a
0-6” without blocks 1 & 2,
Tribune, KS 2010
After 50 years
No effect from P
2016 Sorghum U - Dodge City
2/12/2018
16
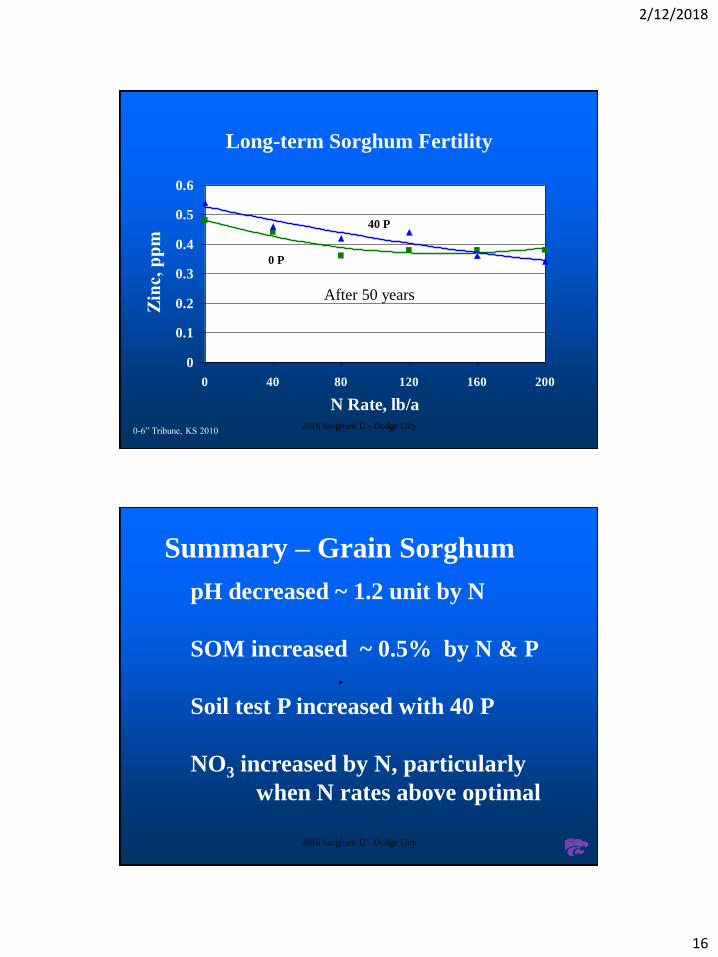
Long-term Sorghum Fertility
0
0.1
0.2
0.3
0.4
0.5
0.6
0 40 80 120 160 200
N Rate, lb/a
0-6” Tribune, KS 2010
40 P
0 P
After 50 years
2016 Sorghum U - Dodge City
Summary – Grain Sorghum
pH decreased ~ 1.2 unit by N
SOM increased ~ 0.5% by N & P
Soil test P increased with 40 P
NO3 increased by N, particularly
when N rates above optimal
2016 Sorghum U - Dodge City
2/12/2018
17
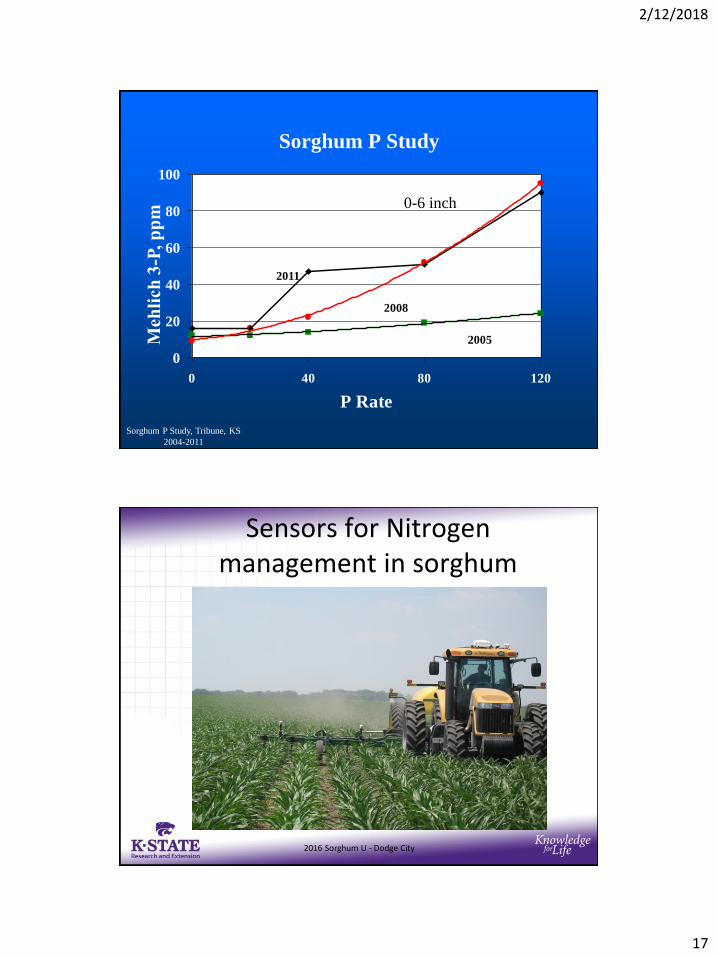
Sorghum P Study
0
20
40
60
80
100
0 40 80 120
P Rate
Sorghum P Study, Tribune, KS
2004-2011
2005
2008
0-6 inch
2011
Sensors for Nitrogenmanagement in sorghum
2016 Sorghum U - Dodge City
2/12/2018
18
Nitrogen Uptake
2016 Sorghum U - Dodge City
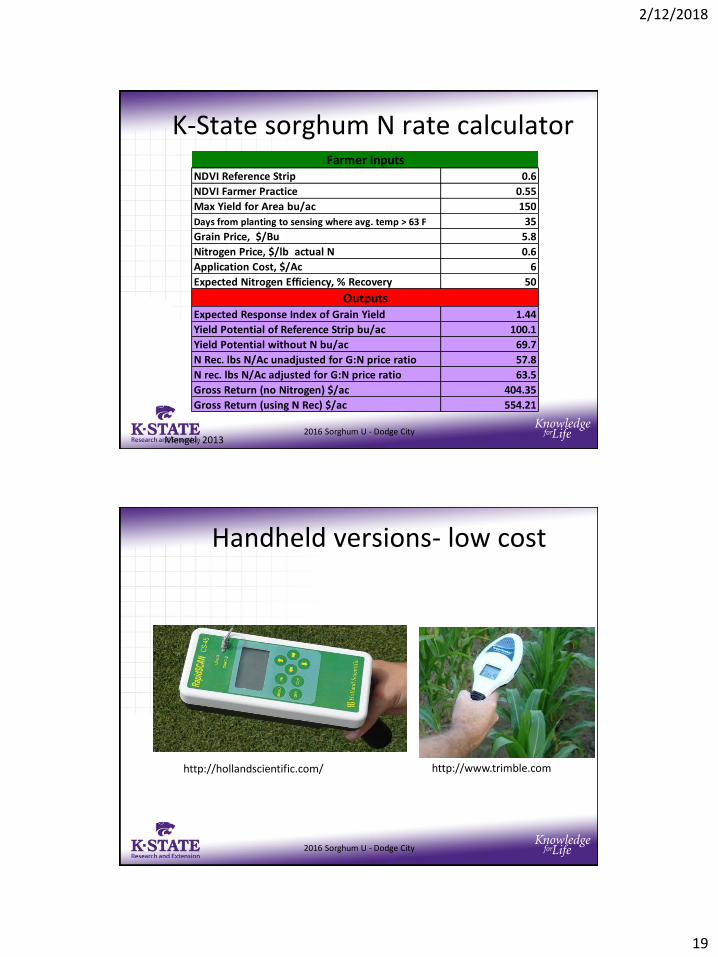
Sensor based vs soil test based N recommendations
Mengel, 2008
LocationActual Yield
Soil Test Rec.
Sensor Rec.
Actual N Resp.
Soil Test Diff.
Sensor Diff.
Belleville 96 40 0 0 40 0
Manhattan 155 60 33 33 27 0
Partridge 32 42 57 55 -13 2
Tribune 128 30 24 15 15 9
Manhattan 109 130 98 105 25 -7
Partridge 70 40 15 20 20 -5
Tribune 79 54 0 0 54 0
Manhattan 128 77 45 45 32 0
Ottawa 64 56 55 60 -4 -5
Partridge 123 41 30 15 26 15
2016 Sorghum U - Dodge City
2/12/2018
19
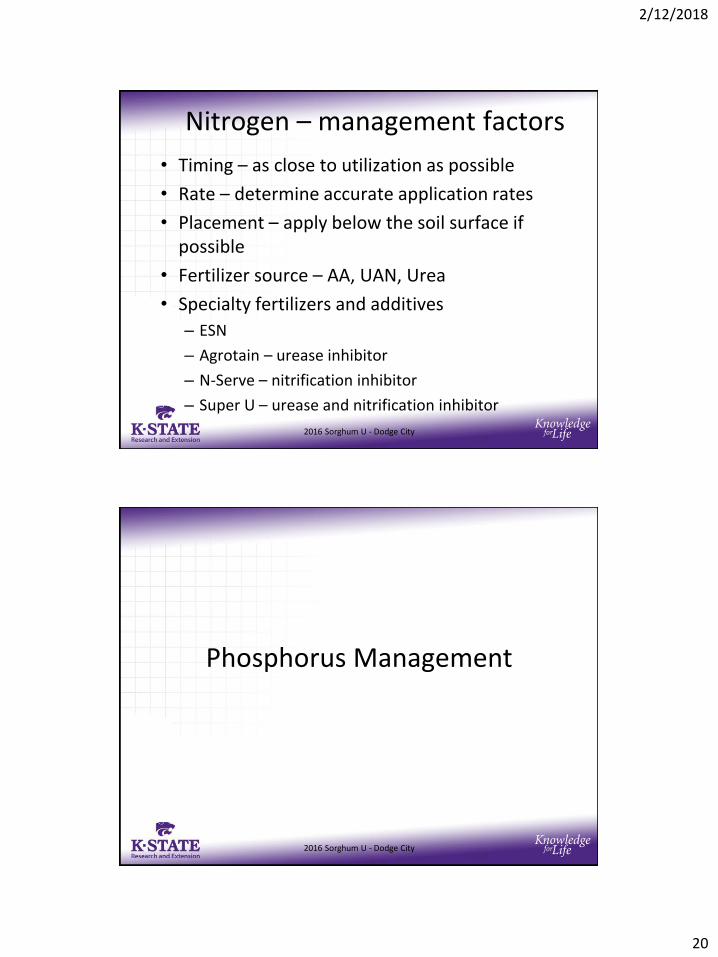
K-State sorghum N rate calculator
NDVI Reference Strip 0.6
NDVI Farmer Practice 0.55
Max Yield for Area bu/ac 150
Days from planting to sensing where avg. temp > 63 F 35
Grain Price, $/Bu 5.8
Nitrogen Price, $/lb actual N 0.6
Application Cost, $/Ac 6
Expected Nitrogen Efficiency, % Recovery 50
Expected Response Index of Grain Yield 1.44
Yield Potential of Reference Strip bu/ac 100.1
Yield Potential without N bu/ac 69.7
N Rec. lbs N/Ac unadjusted for G:N price ratio 57.8
N rec. lbs N/Ac adjusted for G:N price ratio 63.5
Gross Return (no Nitrogen) $/ac 404.35
Gross Return (using N Rec) $/ac 554.21
Farmer Inputs
Outputs
Mengel, 20132016 Sorghum U - Dodge City
Handheld versions- low cost
http://hollandscientific.com/ http://www.trimble.com
2016 Sorghum U - Dodge City
2/12/2018
20
Nitrogen – management factors
• Timing – as close to utilization as possible
• Rate – determine accurate application rates
• Placement – apply below the soil surface if possible
• Fertilizer source – AA, UAN, Urea
• Specialty fertilizers and additives
– ESN
– Agrotain – urease inhibitor
– N-Serve – nitrification inhibitor
– Super U – urease and nitrification inhibitor
2016 Sorghum U - Dodge City
Phosphorus Management
2016 Sorghum U - Dodge City
2/12/2018
21
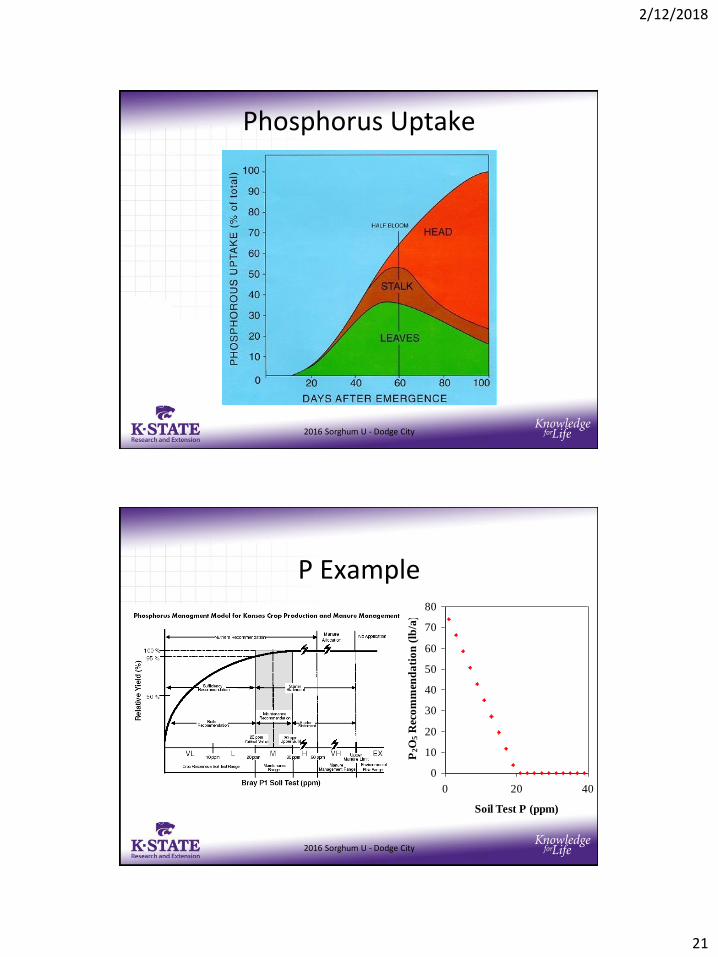
Phosphorus Uptake
2016 Sorghum U - Dodge City
P Example
0
10
20
30
40
50
60
70
80
0 20 40
Soil Test P (ppm)
P2O
5 R
eco
mm
end
ati
on
(lb
/a)
2016 Sorghum U - Dodge City
2/12/2018
22
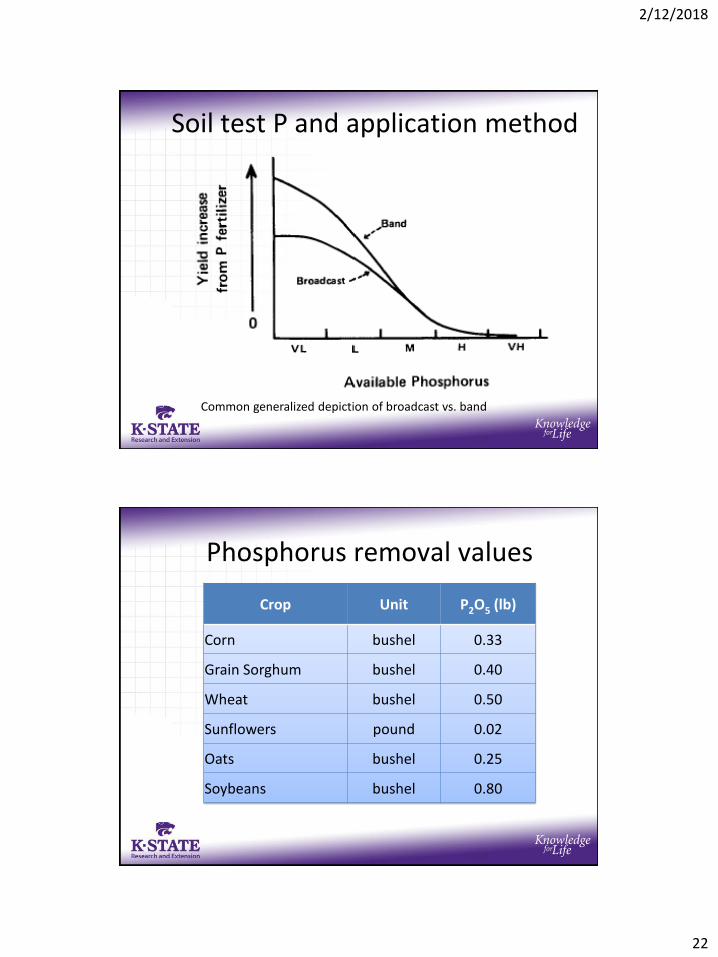
Soil test P and application method
Common generalized depiction of broadcast vs. band
Phosphorus removal values
Crop Unit P2O5 (lb)
Corn bushel 0.33
Grain Sorghum bushel 0.40
Wheat bushel 0.50
Sunflowers pound 0.02
Oats bushel 0.25
Soybeans bushel 0.80
2/12/2018
23
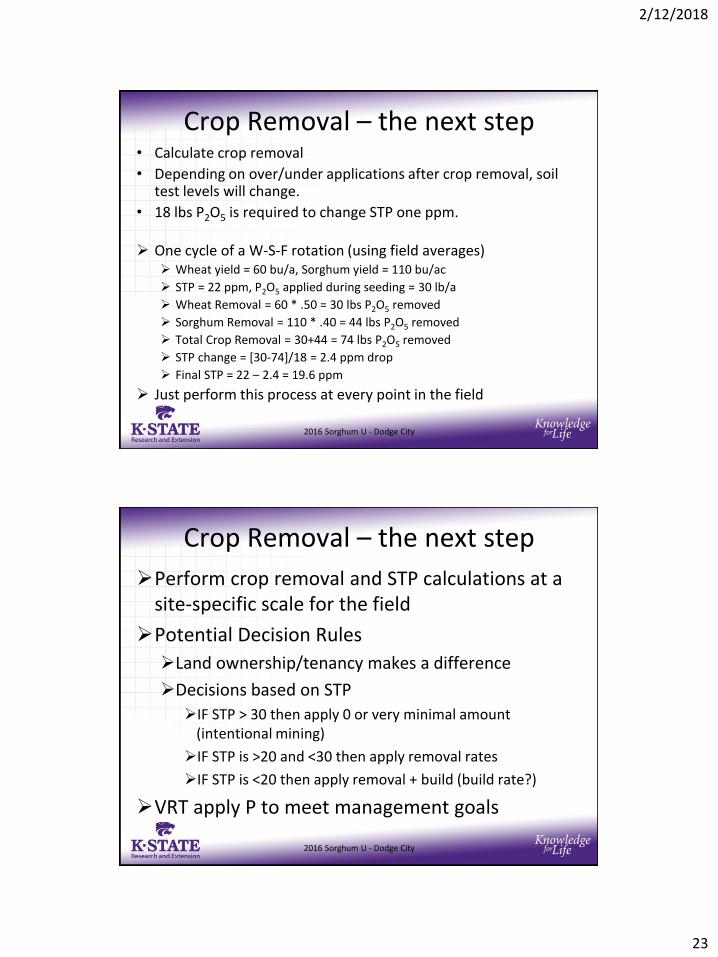
Crop Removal – the next step• Calculate crop removal
• Depending on over/under applications after crop removal, soil test levels will change.
• 18 lbs P2O5 is required to change STP one ppm.
One cycle of a W-S-F rotation (using field averages) Wheat yield = 60 bu/a, Sorghum yield = 110 bu/ac
STP = 22 ppm, P2O5 applied during seeding = 30 lb/a
Wheat Removal = 60 * .50 = 30 lbs P2O5 removed
Sorghum Removal = 110 * .40 = 44 lbs P2O5 removed
Total Crop Removal = 30+44 = 74 lbs P2O5 removed
STP change = [30-74]/18 = 2.4 ppm drop
Final STP = 22 – 2.4 = 19.6 ppm
Just perform this process at every point in the field
2016 Sorghum U - Dodge City
Crop Removal – the next step
Perform crop removal and STP calculations at a site-specific scale for the field
Potential Decision Rules
Land ownership/tenancy makes a difference
Decisions based on STP
IF STP > 30 then apply 0 or very minimal amount (intentional mining)
IF STP is >20 and <30 then apply removal rates
IF STP is <20 then apply removal + build (build rate?)
VRT apply P to meet management goals
2016 Sorghum U - Dodge City
2/12/2018
24
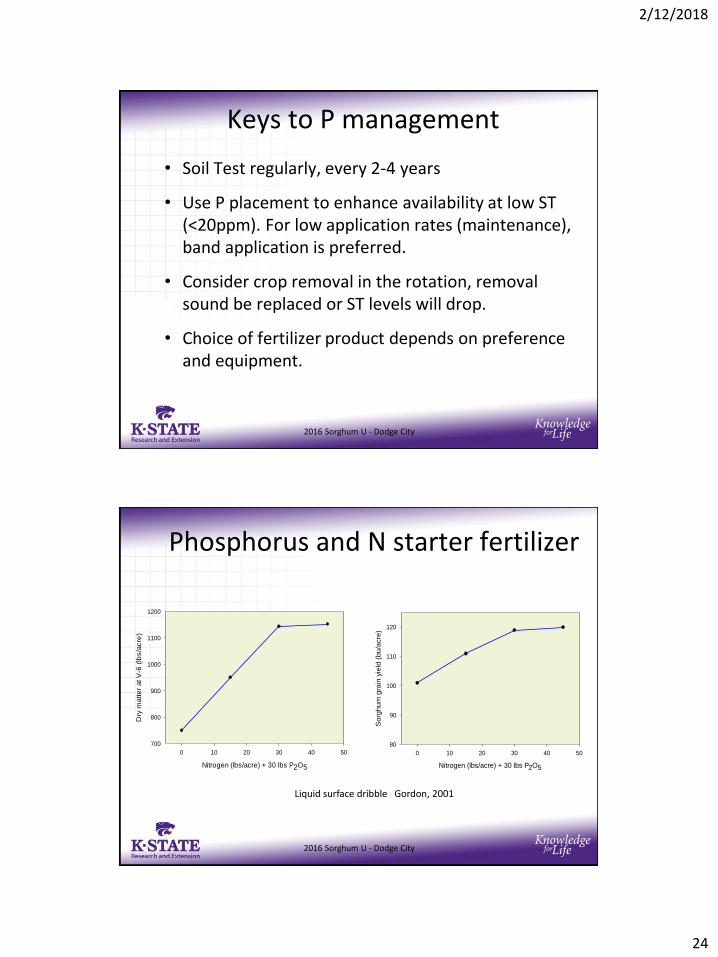
Keys to P management
• Soil Test regularly, every 2-4 years
• Use P placement to enhance availability at low ST (<20ppm). For low application rates (maintenance), band application is preferred.
• Consider crop removal in the rotation, removal sound be replaced or ST levels will drop.
• Choice of fertilizer product depends on preference and equipment.
2016 Sorghum U - Dodge City
Phosphorus and N starter fertilizer
Gordon, 2001Liquid surface dribble
Nitrogen (lbs/acre) + 30 lbs P2O5
0 10 20 30 40 50
So
rgh
um
gra
in y
ield
(b
u/a
cre
)
80
90
100
110
120
Nitrogen (lbs/acre) + 30 lbs P2O5
0 10 20 30 40 50
Dry
matte
r at V
-6 (
lbs/a
cre
)
700
800
900
1000
1100
1200
2016 Sorghum U - Dodge City
2/12/2018
25
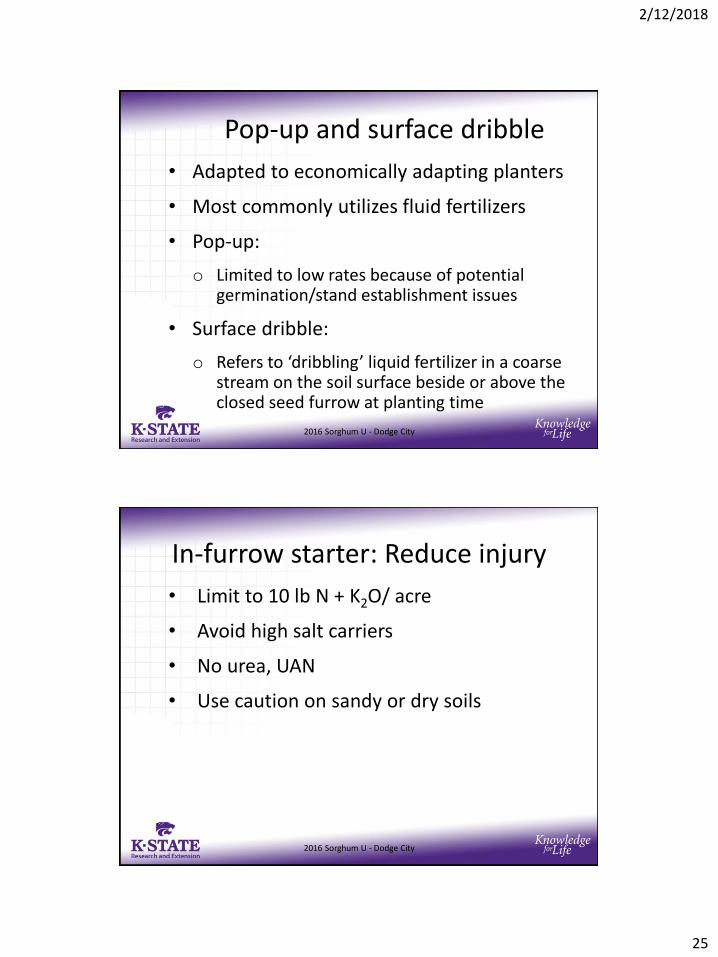
Pop-up and surface dribble
• Adapted to economically adapting planters
• Most commonly utilizes fluid fertilizers
• Pop-up:
o Limited to low rates because of potential germination/stand establishment issues
• Surface dribble:
o Refers to ‘dribbling’ liquid fertilizer in a coarse stream on the soil surface beside or above the closed seed furrow at planting time
2016 Sorghum U - Dodge City
In-furrow starter: Reduce injury
• Limit to 10 lb N + K2O/ acre
• Avoid high salt carriers
• No urea, UAN
• Use caution on sandy or dry soils
2016 Sorghum U - Dodge City
2/12/2018
26
Micros
2016 Sorghum U - Dodge City
Secondary and micronutrients for sorghum
• The most common issues in Kansas are iron, zinc and sulfur.
• Research have shown response to chloride in low testing soils.
• Zn, S, and Cl have good reliable soil tests that translate well into anticipated yield response.
2016 Sorghum U - Dodge City
2/12/2018
27
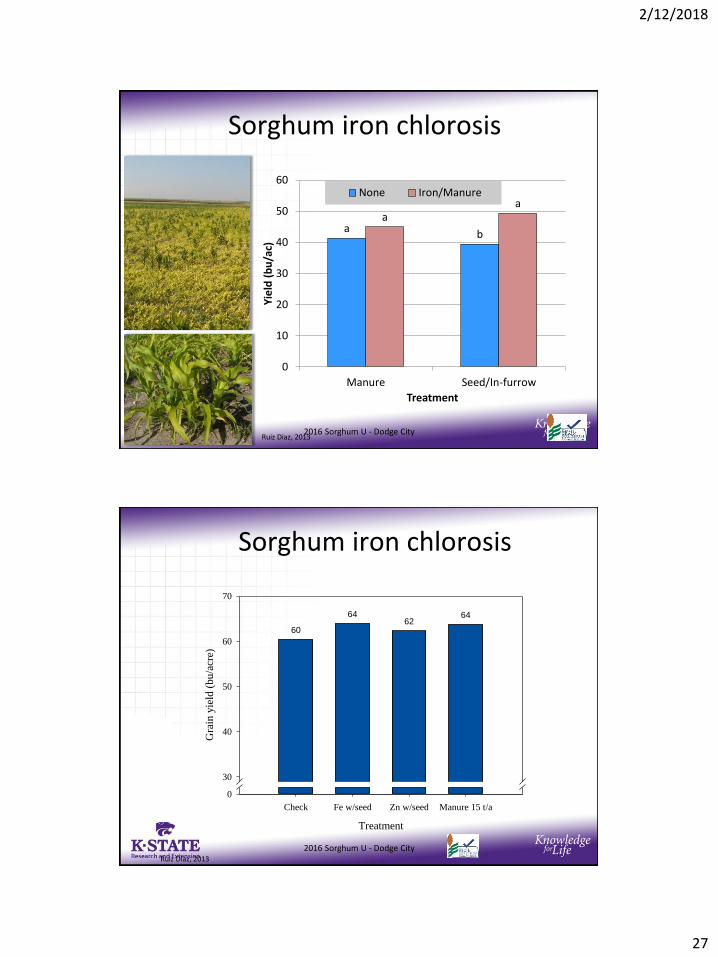
Sorghum iron chlorosis
a b
aa
0
10
20
30
40
50
60
Manure Seed/In-furrow
Yie
ld (
bu
/ac)
Treatment
None Iron/Manure
Ruiz Diaz, 20132016 Sorghum U - Dodge City
Sorghum iron chlorosis
Treatment
Check Fe w/seed Zn w/seed Manure 15 t/a
Gra
in y
ield
(b
u/a
cre)
0
30
40
50
60
70
60
6462
64
Ruiz Diaz, 2013
2016 Sorghum U - Dodge City
2/12/2018
28
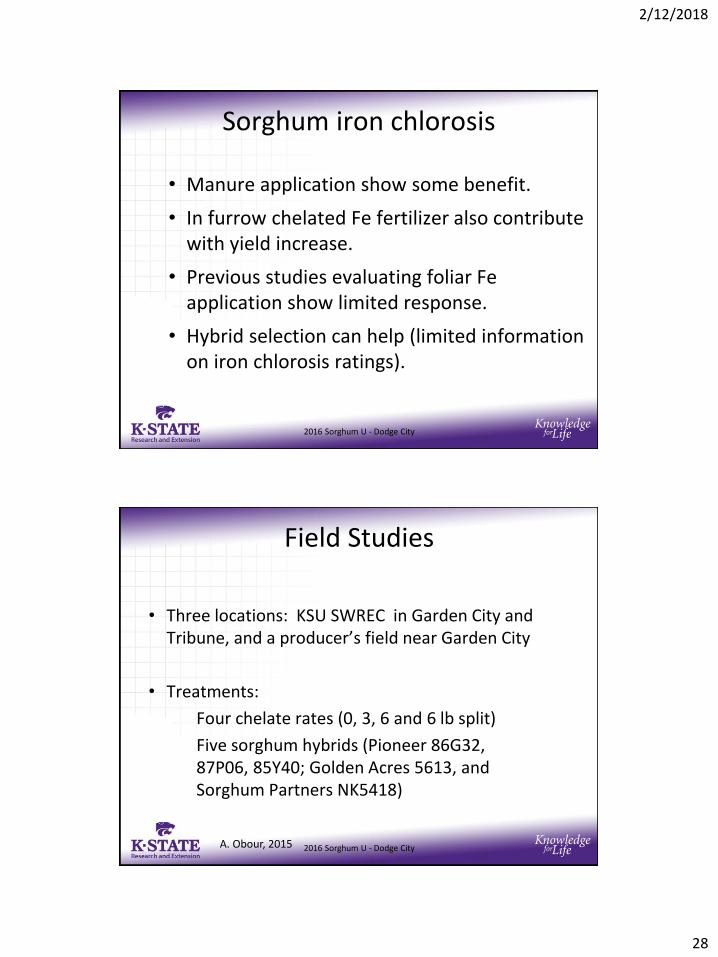
Sorghum iron chlorosis
• Manure application show some benefit.
• In furrow chelated Fe fertilizer also contribute with yield increase.
• Previous studies evaluating foliar Fe application show limited response.
• Hybrid selection can help (limited information on iron chlorosis ratings).
2016 Sorghum U - Dodge City
Field Studies
• Three locations: KSU SWREC in Garden City and Tribune, and a producer’s field near Garden City
• Treatments:
Four chelate rates (0, 3, 6 and 6 lb split)
Five sorghum hybrids (Pioneer 86G32, 87P06, 85Y40; Golden Acres 5613, and Sorghum Partners NK5418)
A. Obour, 2015 2016 Sorghum U - Dodge City
2/12/2018
29
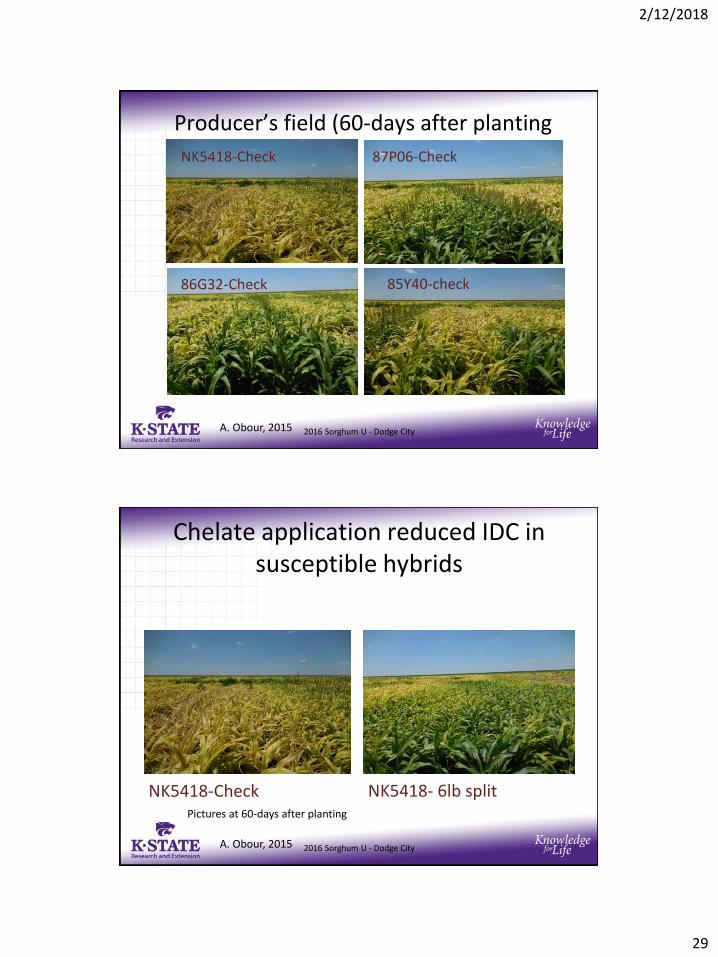
Producer’s field (60-days after planting
NK5418-Check 87P06-Check
85Y40-check86G32-Check
A. Obour, 2015 2016 Sorghum U - Dodge City
Chelate application reduced IDC in susceptible hybrids
NK5418-Check NK5418- 6lb splitPictures at 60-days after planting
A. Obour, 2015 2016 Sorghum U - Dodge City
2/12/2018
30
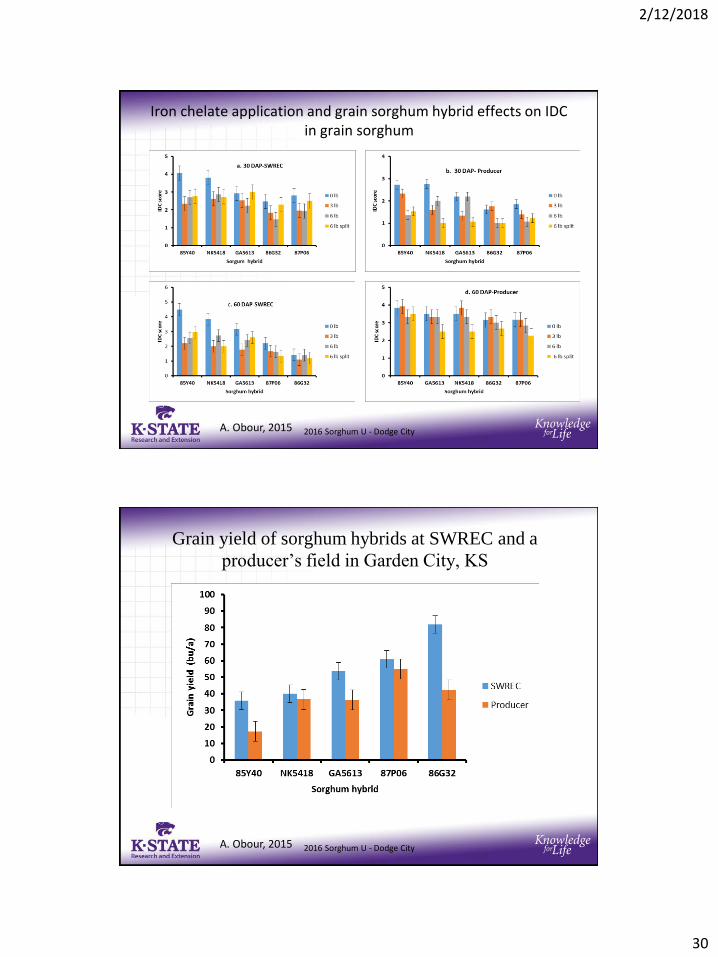
Iron chelate application and grain sorghum hybrid effects on IDC in grain sorghum
A. Obour, 2015 2016 Sorghum U - Dodge City
Grain yield of sorghum hybrids at SWREC and a
producer’s field in Garden City, KS
A. Obour, 2015 2016 Sorghum U - Dodge City
2/12/2018
31
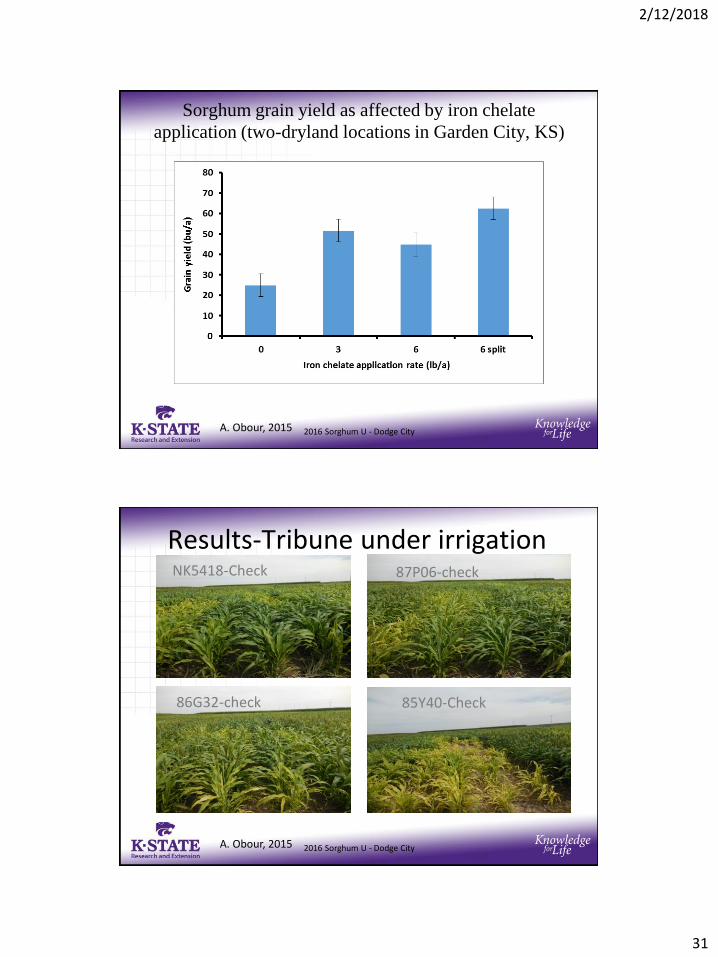
Sorghum grain yield as affected by iron chelate
application (two-dryland locations in Garden City, KS)
A. Obour, 2015 2016 Sorghum U - Dodge City
Results-Tribune under irrigation
87P06-Check
85Y40-check
NK5418-Check 87P06-check
85Y40-Check86G32-check
A. Obour, 2015 2016 Sorghum U - Dodge City
2/12/2018
32
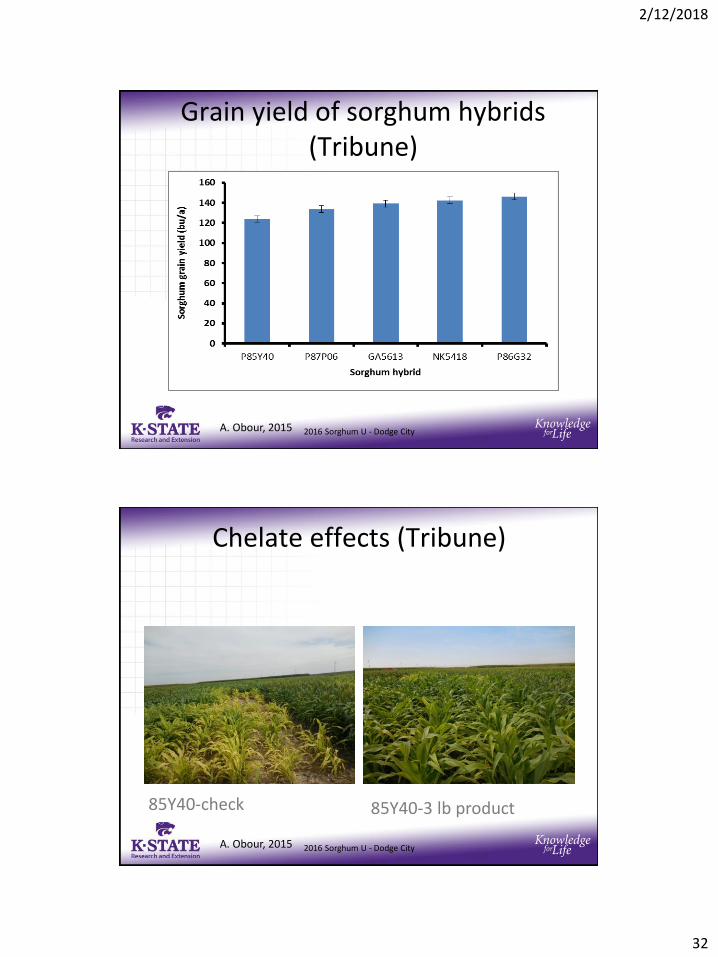
Grain yield of sorghum hybrids (Tribune)
A. Obour, 2015 2016 Sorghum U - Dodge City
Chelate effects (Tribune)
85Y40-check 85Y40-3 lb product
A. Obour, 2015 2016 Sorghum U - Dodge City
2/12/2018
33
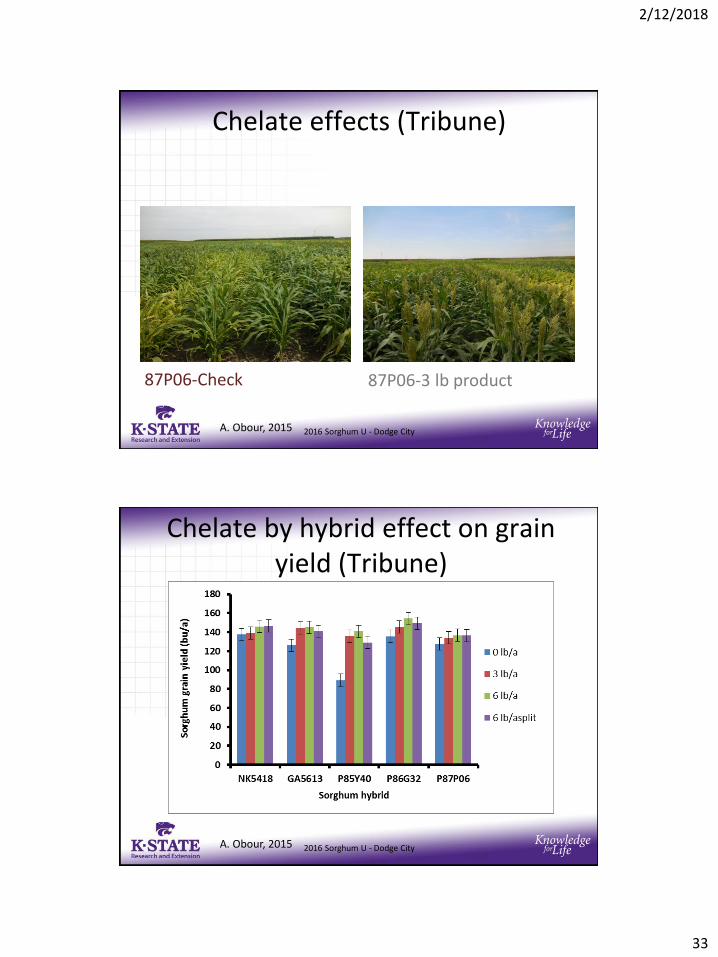
Chelate effects (Tribune)
87P06-Check 87P06-3 lb product
A. Obour, 2015 2016 Sorghum U - Dodge City
Chelate by hybrid effect on grain yield (Tribune)
A. Obour, 2015 2016 Sorghum U - Dodge City
2/12/2018
34
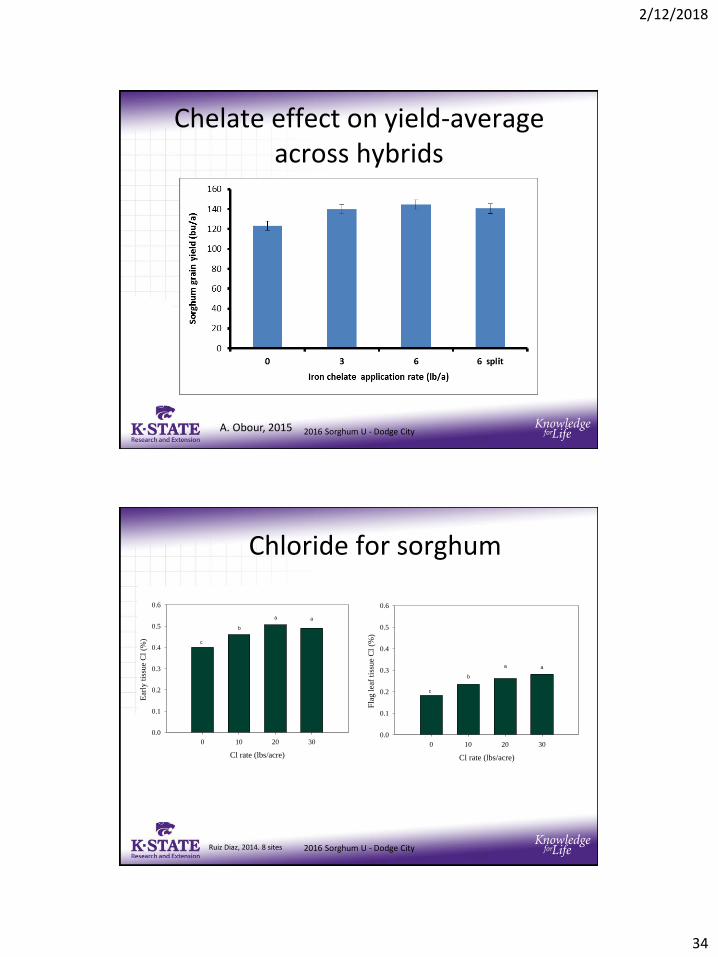
Chelate effect on yield-average across hybrids
A. Obour, 2015 2016 Sorghum U - Dodge City
Chloride for sorghum
Cl rate (lbs/acre)
0 10 20 30
Ear
ly t
issu
e C
l (%
)
0.0
0.1
0.2
0.3
0.4
0.5
0.6
aa
b
c
Cl rate (lbs/acre)
0 10 20 30
Fla
g l
eaf
tiss
ue
Cl
(%)
0.0
0.1
0.2
0.3
0.4
0.5
0.6
aa
b
c
Ruiz Diaz, 2014. 8 sites 2016 Sorghum U - Dodge City
2/12/2018
35
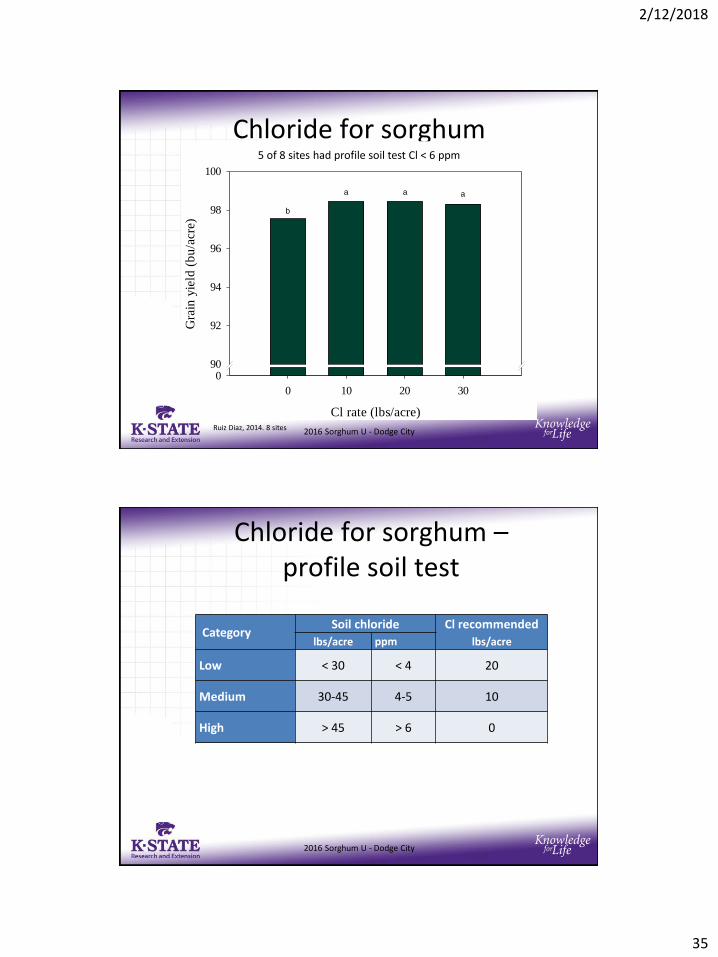
Chloride for sorghum
Cl rate (lbs/acre)
0 10 20 30
Gra
in y
ield
(b
u/a
cre)
090
92
94
96
98
100
aaa
b
Ruiz Diaz, 2014. 8 sites
5 of 8 sites had profile soil test Cl < 6 ppm
2016 Sorghum U - Dodge City
Chloride for sorghum –profile soil test
CategorySoil chloride Cl recommended
lbs/acrelbs/acre ppm
Low < 30 < 4 20
Medium 30-45 4-5 10
High > 45 > 6 0
2016 Sorghum U - Dodge City
2/12/2018
36
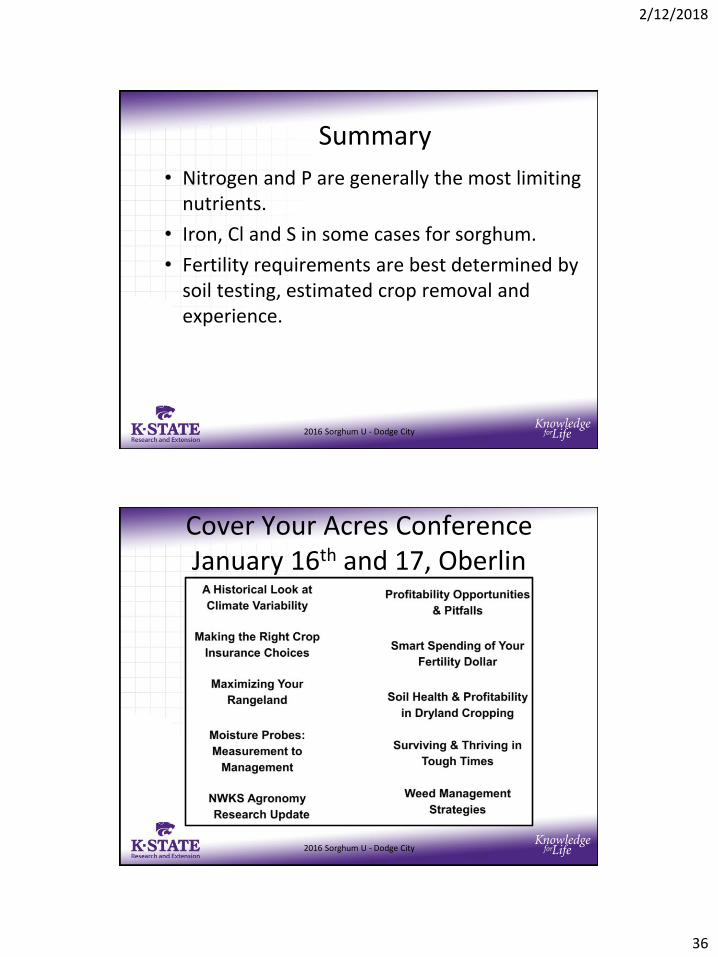
Summary
• Nitrogen and P are generally the most limiting nutrients.
• Iron, Cl and S in some cases for sorghum.
• Fertility requirements are best determined by soil testing, estimated crop removal and experience.
2016 Sorghum U - Dodge City
Cover Your Acres ConferenceJanuary 16th and 17, Oberlin
2016 Sorghum U - Dodge City
2/12/2018
37
[email protected], 785.462.6281www.northwest.ksu.edu/agronomy
Clump planted sorghum studyStanton County, KS 2009
2016 Sorghum U - Dodge City