Embed Size (px)
DESCRIPTION
Older people's experiences of dignity and nutrition during hospital stays EMERGING FINDINGS Secondary data analysis using the Adult Inpatient Survey Polly Vizard and Tania Burchardt. Grant reference ES/K004018/1. Motivation. - PowerPoint PPT Presentation
Citation preview
Grant reference ES/K004018/1
Older people's experiences of dignity and nutrition during hospital stays
EMERGING FINDINGS
Secondary data analysis using the Adult Inpatient Survey
Polly Vizard and Tania Burchardt

Motivation
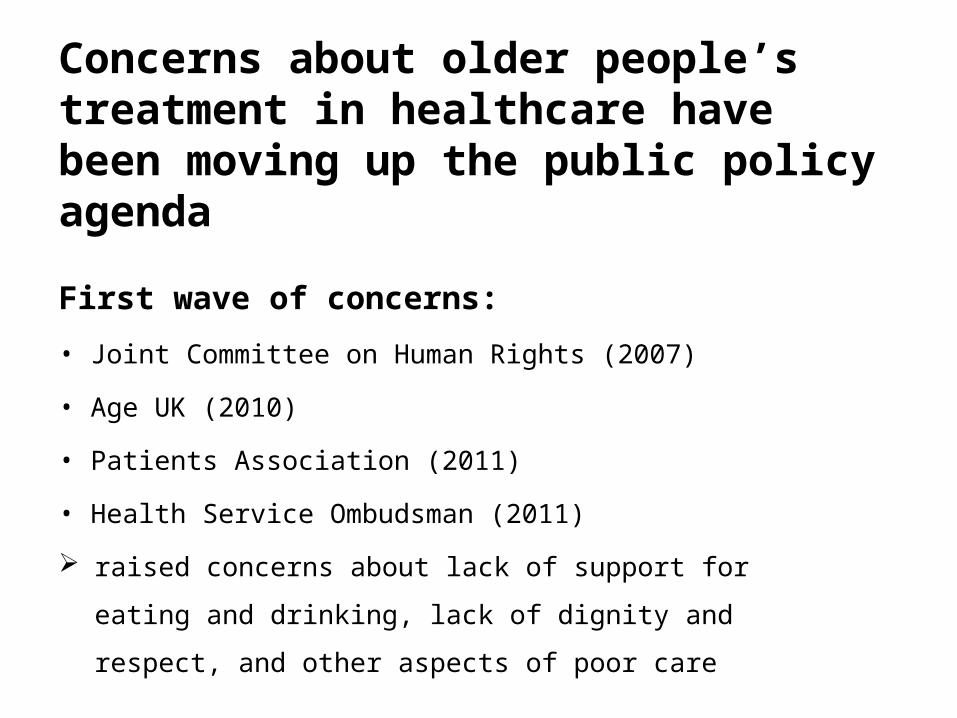
First wave of concerns:
• Joint Committee on Human Rights (2007)
• Age UK (2010)
• Patients Association (2011)
• Health Service Ombudsman (2011)
raised concerns about lack of support for eating and drinking, lack of
dignity and respect, and other aspects of poor care
Concerns about older people’s treatment in healthcare have been moving up the public policy agenda
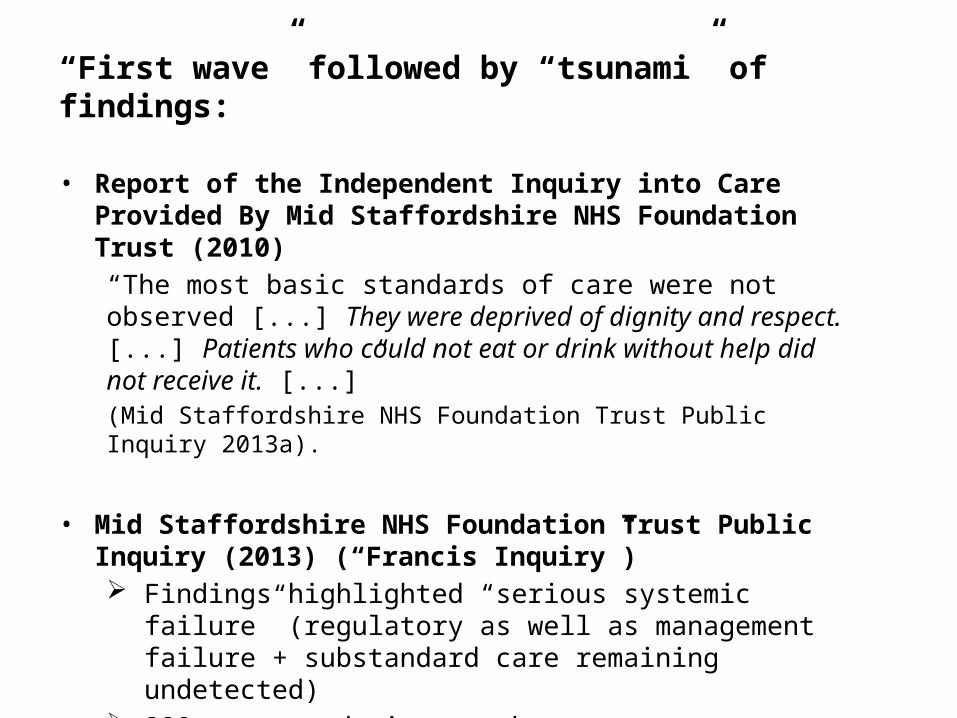
“First wave” followed by “tsunami” of findings:
• Report of the Independent Inquiry into Care Provided By Mid Staffordshire NHS Foundation Trust (2010) “The most basic standards of care were not observed [...] They were deprived of dignity and respect. [...] Patients who could not eat or drink without help did not receive it. [...]” (Mid Staffordshire NHS Foundation Trust Public Inquiry 2013a).
• Mid Staffordshire NHS Foundation Trust Public Inquiry (2013) (“Francis Inquiry”) Findings highlighted “serious systemic failure” (regulatory as well
as management failure + substandard care remaining undetected)
290 recommendations on how to ensure improved systems of monitoring, inspection and regulation in the future
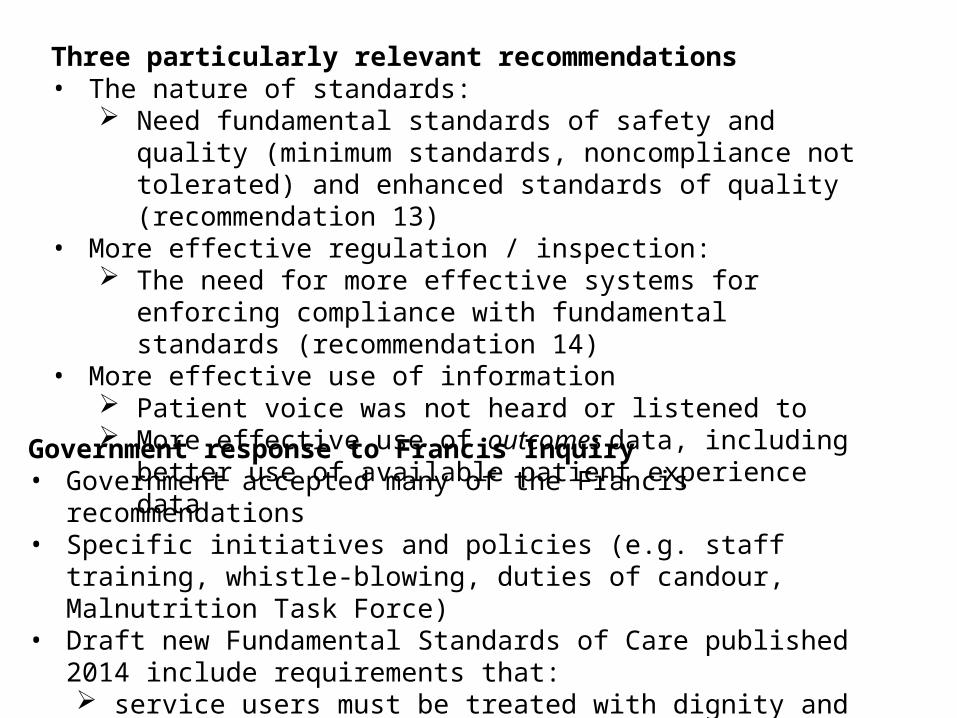
Government response to Francis Inquiry• Government accepted many of the Francis recommendations• Specific initiatives and policies (e.g. staff training, whistle-blowing, duties
of candour, Malnutrition Task Force)• Draft new Fundamental Standards of Care published 2014 include
requirements that: service users must be treated with dignity and respect (5.1) the nutritional needs of service users must be met (9.1)
Three particularly relevant recommendations• The nature of standards:
Need fundamental standards of safety and quality (minimum standards, noncompliance not tolerated) and enhanced standards of quality (recommendation 13)
• More effective regulation / inspection: The need for more effective systems for enforcing compliance with
fundamental standards (recommendation 14)• More effective use of information
Patient voice was not heard or listened to More effective use of outcomes data, including better use of
available patient experience data
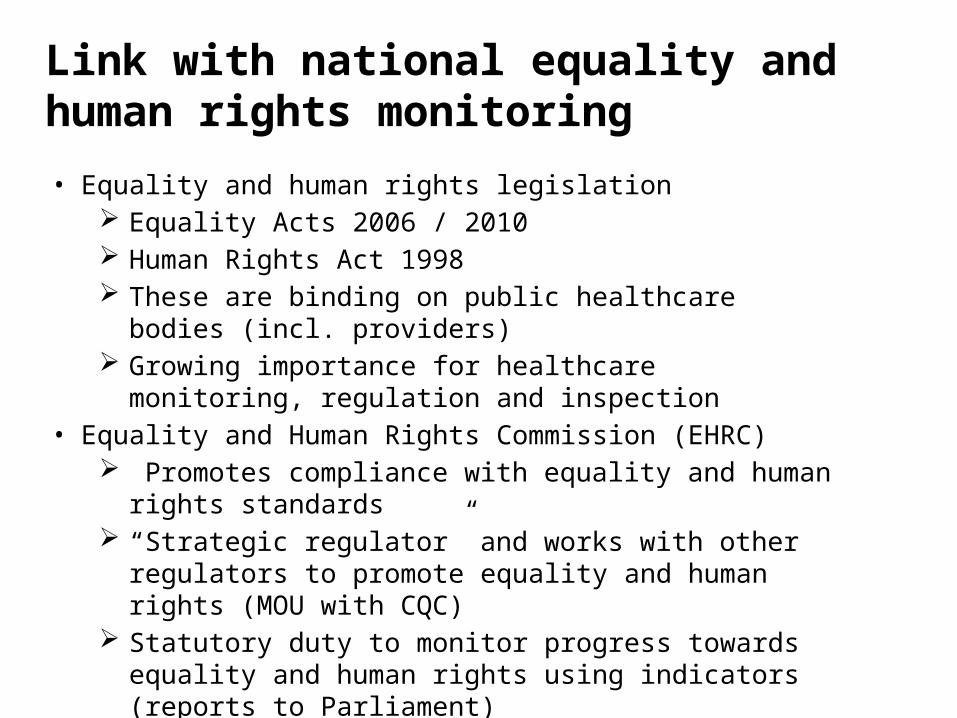
• Equality and human rights legislation Equality Acts 2006 / 2010 Human Rights Act 1998 These are binding on public healthcare bodies (incl. providers) Growing importance for healthcare monitoring, regulation and
inspection • Equality and Human Rights Commission (EHRC)
Promotes compliance with equality and human rights standards “Strategic regulator” and works with other regulators to promote
equality and human rights (MOU with CQC) Statutory duty to monitor progress towards equality and human
rights using indicators (reports to Parliament) Discharges this duty using the EHRC Measurement Framework
Link with national equality and human rights monitoring
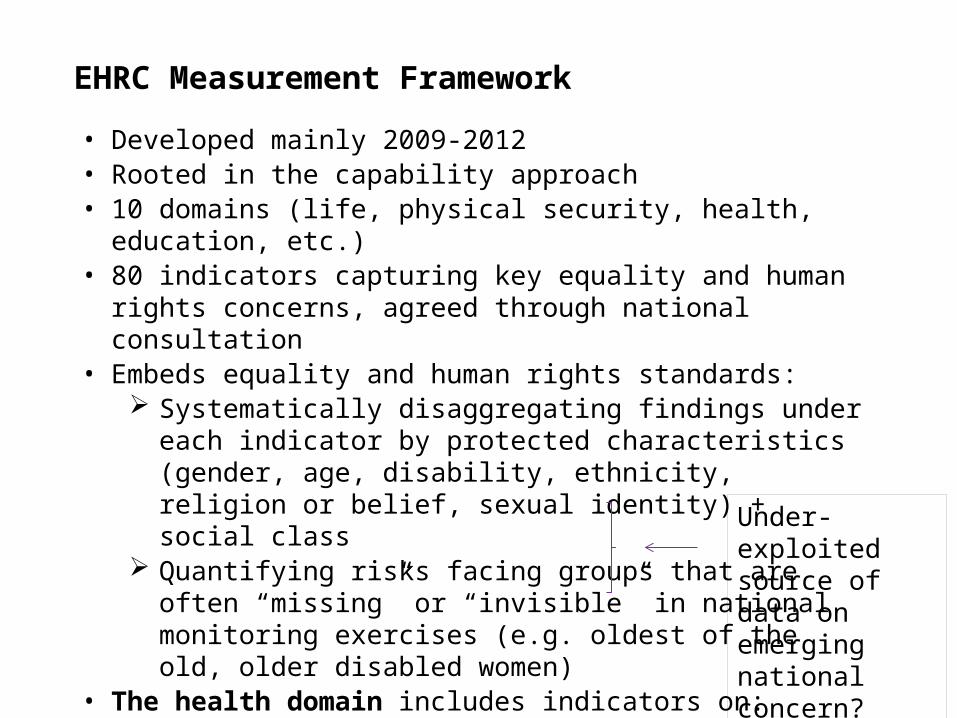
EHRC Measurement Framework
• Developed mainly 2009-2012• Rooted in the capability approach• 10 domains (life, physical security, health, education, etc.) • 80 indicators capturing key equality and human rights concerns,
agreed through national consultation• Embeds equality and human rights standards:
Systematically disaggregating findings under each indicator by protected characteristics (gender, age, disability, ethnicity, religion or belief, sexual identity) + social class
Quantifying risks facing groups that are often “missing” or “invisible” in national monitoring exercises (e.g. oldest of the old, older disabled women)
• The health domain includes indicators on: treatment with dignity and respect help with eating, during hospital stays
[overviews in Burchardt and Vizard 2011, Vizard 2012]
Under-exploited source of data on emerging national concern?

What did we do?
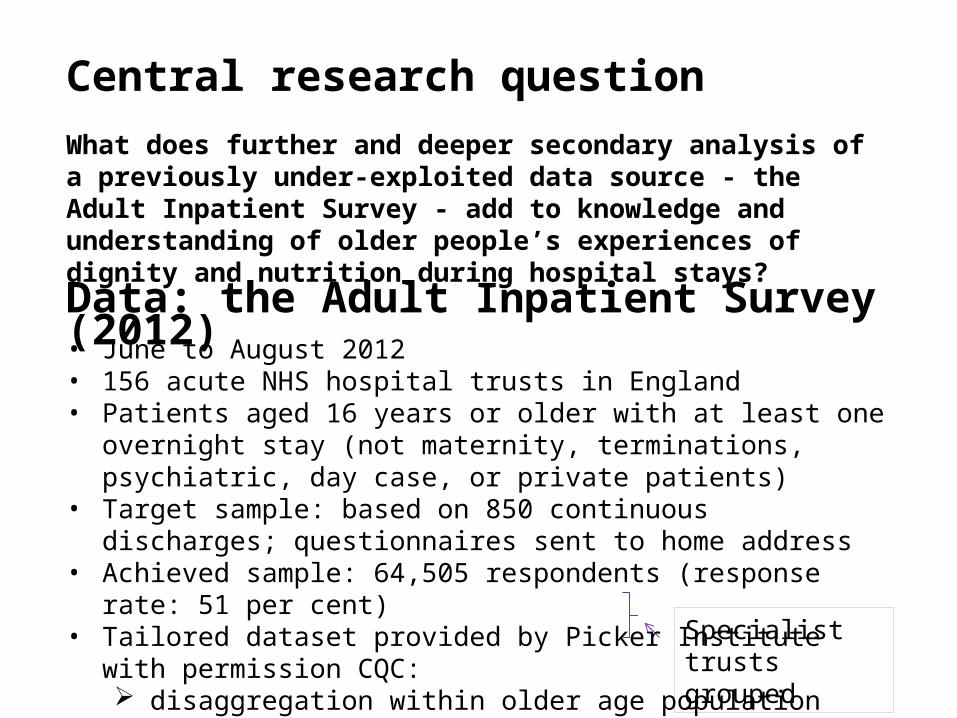
• June to August 2012• 156 acute NHS hospital trusts in England• Patients aged 16 years or older with at least one overnight stay (not
maternity, terminations, psychiatric, day case, or private patients)• Target sample: based on 850 continuous discharges; questionnaires sent
to home address• Achieved sample: 64,505 respondents (response rate: 51 per cent)• Tailored dataset provided by Picker Institute with permission CQC:
disaggregation within older age population disability+ ethnicity
Central research question
What does further and deeper secondary analysis of a previously under-exploited data source - the Adult Inpatient Survey - add to knowledge and understanding of older people’s experiences of dignity and nutrition during hospital stays?
Data: the Adult Inpatient Survey (2012)
Specialist trusts grouped
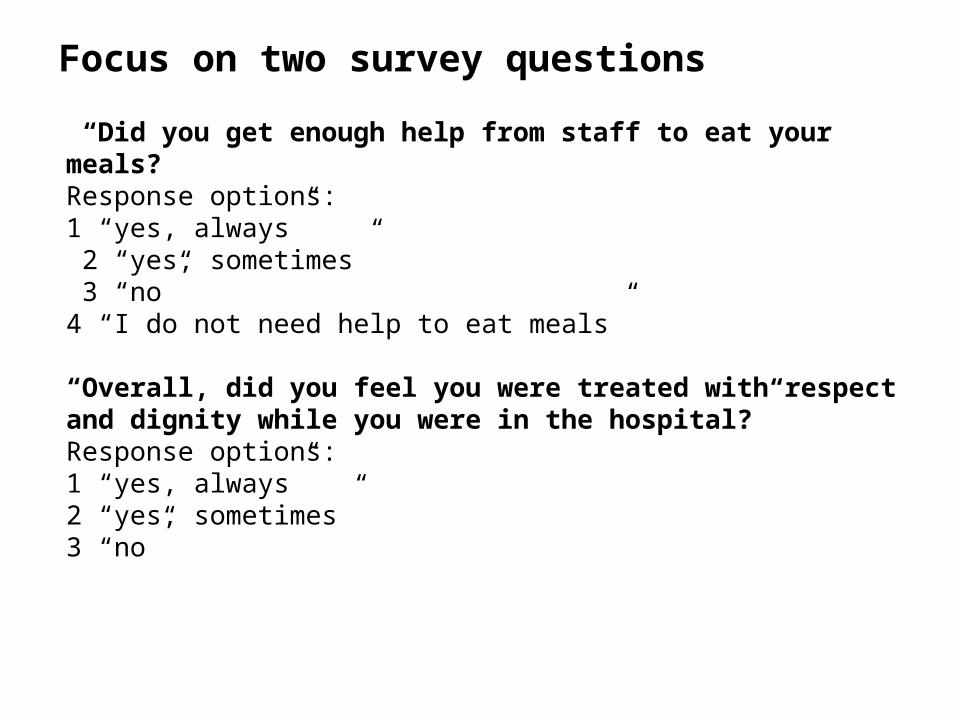
“Did you get enough help from staff to eat your meals? Response options:1 “yes, always” 2 “yes, sometimes” 3 “no” 4 “I do not need help to eat meals” “Overall, did you feel you were treated with respect and dignity while you were in the hospital?”Response options: 1 “yes, always”2 “yes, sometimes”3 “no”
Focus on two survey questions
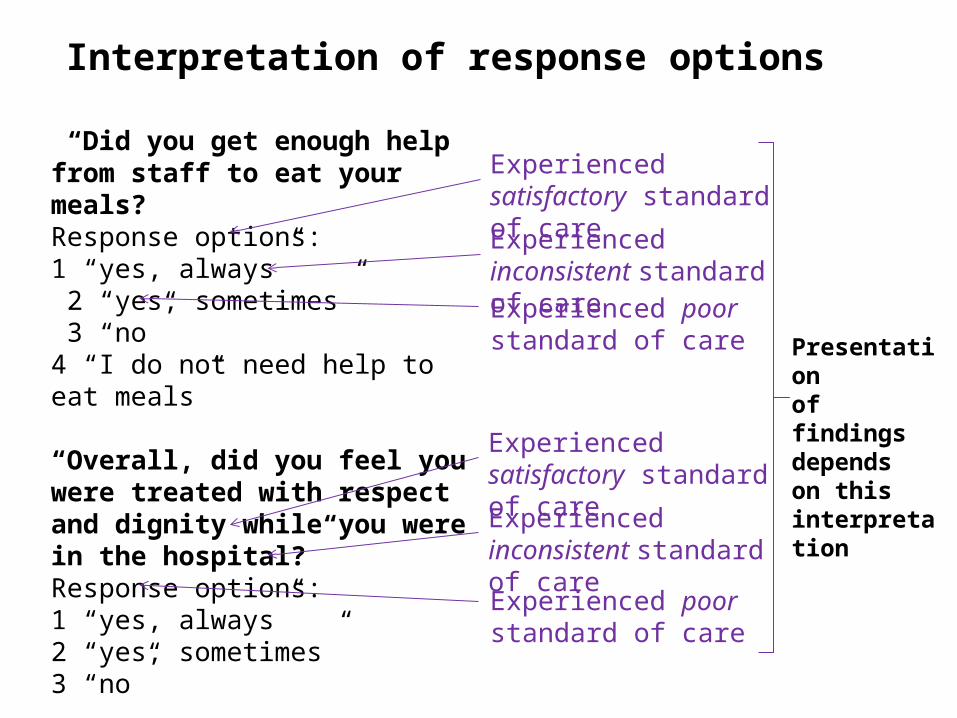
Interpretation of response options
“Did you get enough help from staff to eat your meals? Response options:1 “yes, always” 2 “yes, sometimes” 3 “no” 4 “I do not need help to eat meals” “Overall, did you feel you were treated with respect and dignity while you were in the hospital?”Response options: 1 “yes, always”2 “yes, sometimes”3 “no”
Experienced inconsistent standard of care
Experienced satisfactory standard of care
Experienced poor standard of care
Experienced satisfactory standard of care
Experienced inconsistent standard of care
Experienced poor standard of care
Presentation of findings depends on this interpretation
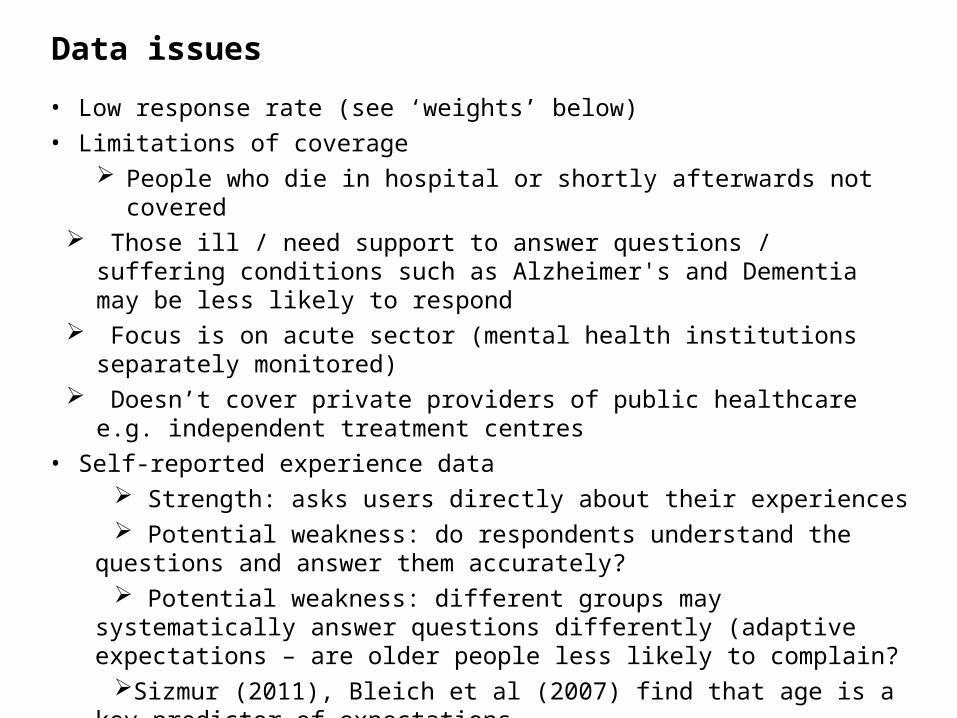
• Low response rate (see ‘weights’ below)• Limitations of coverage
People who die in hospital or shortly afterwards not covered Those ill / need support to answer questions / suffering conditions such as
Alzheimer's and Dementia may be less likely to respond Focus is on acute sector (mental health institutions separately monitored) Doesn’t cover private providers of public healthcare e.g. independent treatment
centres• Self-reported experience data
Strength: asks users directly about their experiences Potential weakness: do respondents understand the questions and answer
them accurately? Potential weakness: different groups may systematically answer questions
differently (adaptive expectations – are older people less likely to complain? Sizmur (2011), Bleich et al (2007) find that age is a key predictor of expectations
• No objective information about context (eg numbers of nurses on wards)
Data issues
Findings
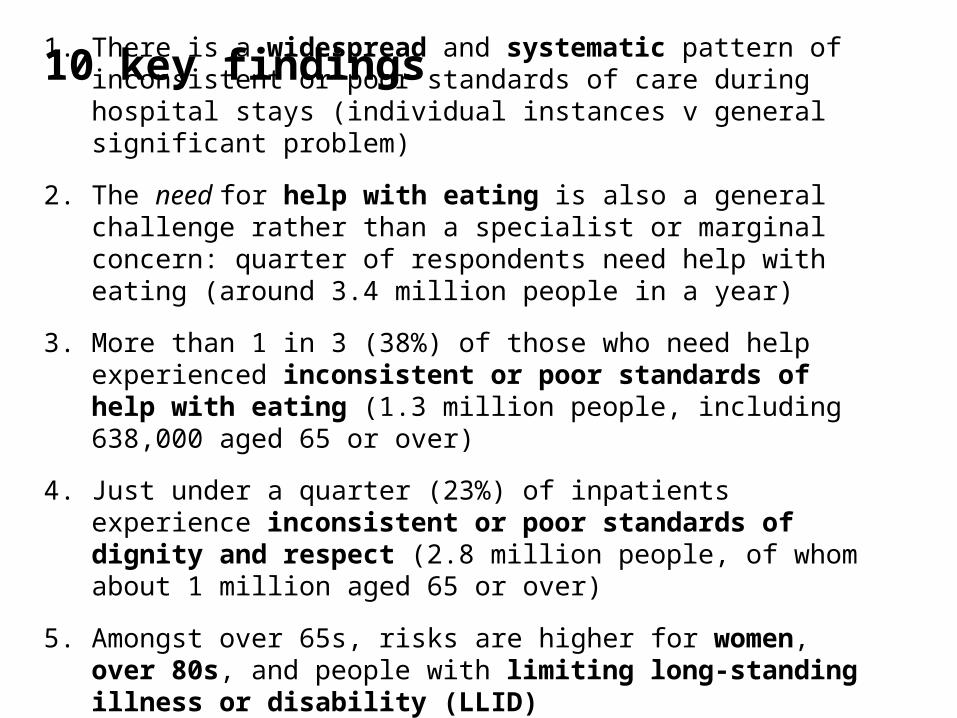
1. There is a widespread and systematic pattern of inconsistent or poor standards of care during hospital stays (individual instances v general significant problem)
2. The need for help with eating is also a general challenge rather than a specialist or marginal concern: quarter of respondents need help with eating (around 3.4 million people in a year)
3. More than 1 in 3 (38%) of those who need help experienced inconsistent or poor standards of help with eating (1.3 million people, including 638,000 aged 65 or over)
4. Just under a quarter (23%) of inpatients experience inconsistent or poor standards of dignity and respect (2.8 million people, of whom about 1 million aged 65 or over)
5. Amongst over 65s, risks are higher for women, over 80s, and people with limiting long-standing illness or disability (LLID)
10 key findings
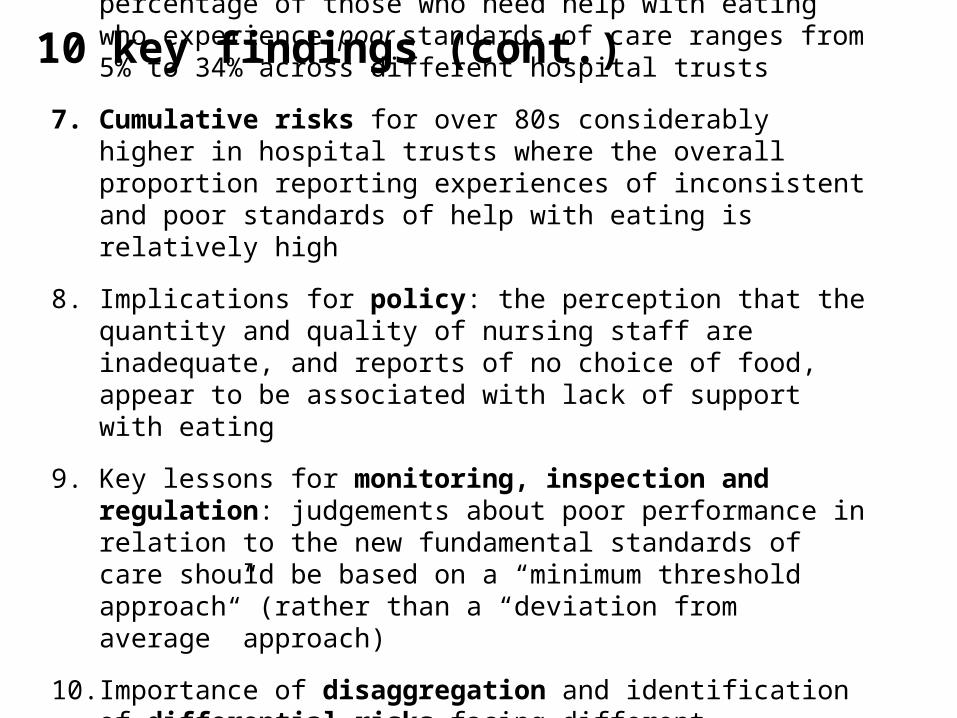
6. Variation by hospital trust is important: percentage of those who need help with eating who experience poor standards of care ranges from 5% to 34% across different hospital trusts
7. Cumulative risks for over 80s considerably higher in hospital trusts where the overall proportion reporting experiences of inconsistent and poor standards of help with eating is relatively high
8. Implications for policy: the perception that the quantity and quality of nursing staff are inadequate, and reports of no choice of food, appear to be associated with lack of support with eating
9. Key lessons for monitoring, inspection and regulation: judgements about poor performance in relation to the new fundamental standards of care should be based on a “minimum threshold approach” (rather than a “deviation from average” approach)
10. Importance of disaggregation and identification of differential risks facing different population subgroups, not relying on population averages
10 key findings (cont.)
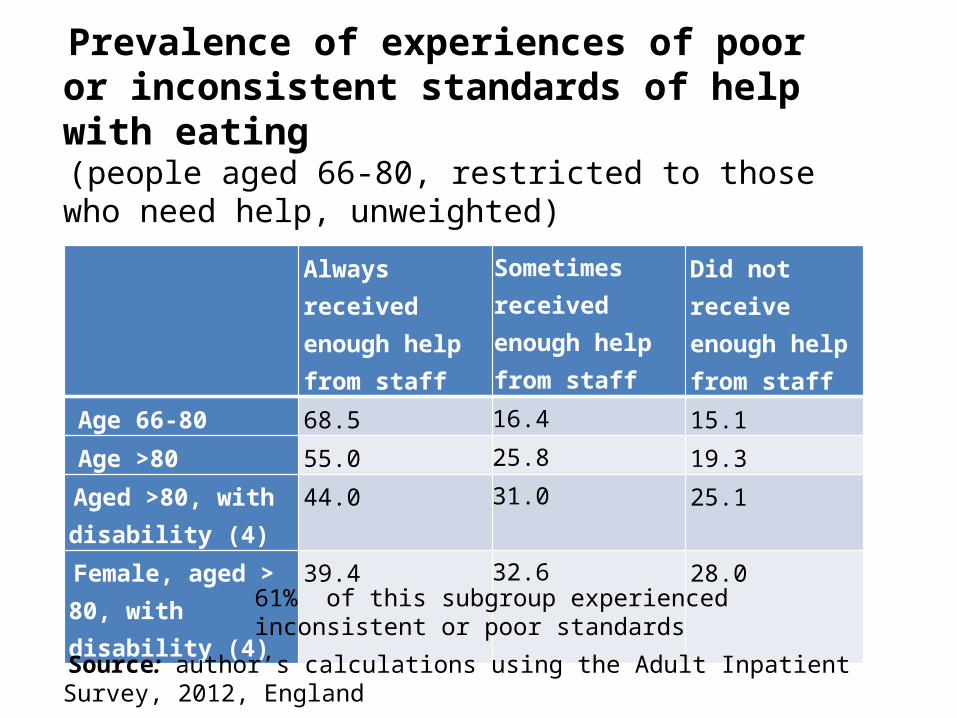
Always received enough help from staff
Sometimes received enough help from staff
Did not receive enough help from staff
Age 66-80 68.5 16.4 15.1 Age >80 55.0 25.8 19.3Aged >80, with disability (4)
44.0 31.0 25.1
Female, aged > 80, with disability (4)
39.4 32.6 28.0
Prevalence of experiences of poor or inconsistent standards of help with eating (people aged 66-80, restricted to those who need help, unweighted)
Source: author’s calculations using the Adult Inpatient Survey, 2012, England
61% of this subgroup experienced inconsistent or poor standards
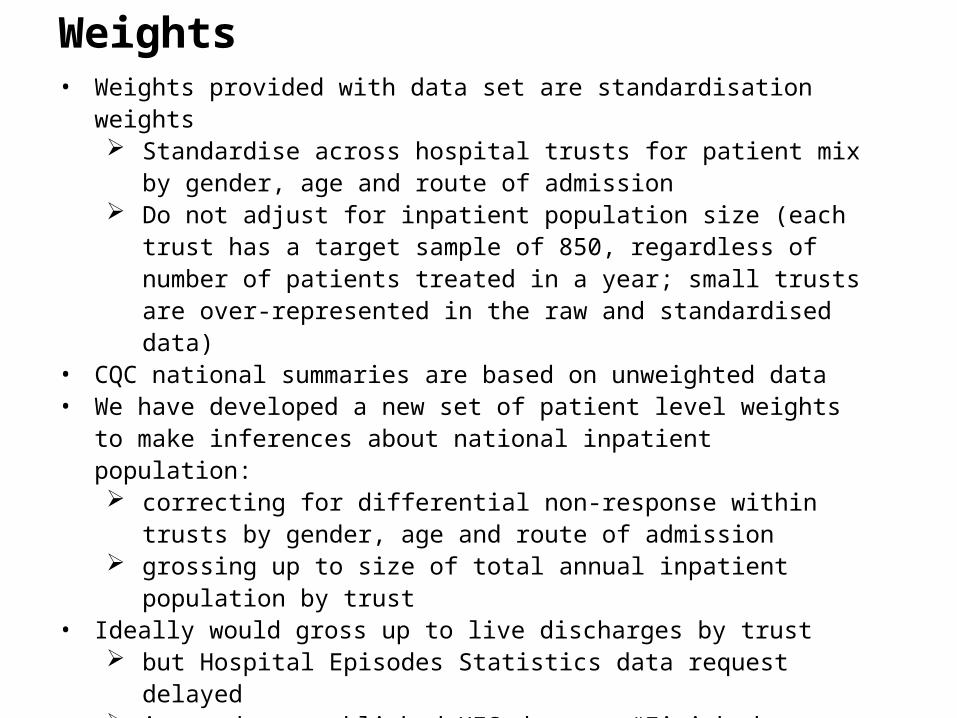
• Weights provided with data set are standardisation weights Standardise across hospital trusts for patient mix by gender, age and
route of admission Do not adjust for inpatient population size (each trust has a target sample
of 850, regardless of number of patients treated in a year; small trusts are over-represented in the raw and standardised data)
• CQC national summaries are based on unweighted data • We have developed a new set of patient level weights to make inferences
about national inpatient population: correcting for differential non-response within trusts by gender, age and
route of admission grossing up to size of total annual inpatient population by trust
• Ideally would gross up to live discharges by trust but Hospital Episodes Statistics data request delayed instead use published HES data on “Finished Consultant Episodes”,
adjusted to take account of national ratio of FCEs to live discharges• Applying these weights allows us to produce estimates of the number of
inpatients who have experienced inconsistent and poor standards of care nationally over the course of a year
Weights
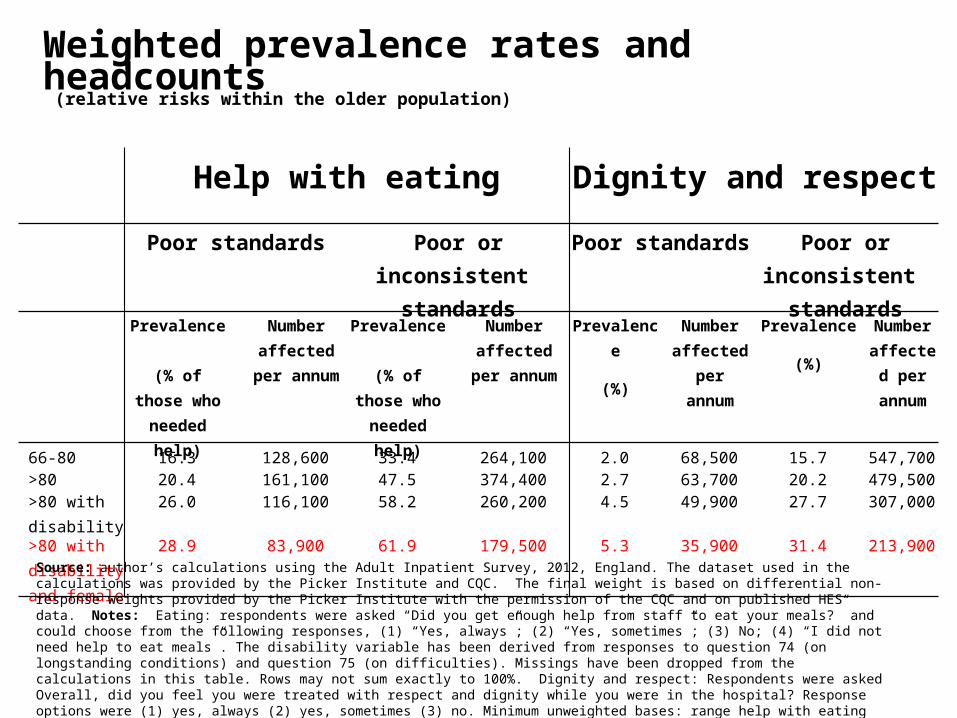
Weighted prevalence rates and headcounts
Help with eating Dignity and respect
Poor standards Poor or inconsistent standards
Poor standards Poor or inconsistent standards
Prevalence
(% of those who needed
help)
Number affected per
annum
Prevalence
(% of those who needed
help)
Number affected per
annum
Prevalence
(%)
Number affected per
annum
Prevalence
(%)
Number affected
per annum
66-80 16.3 128,600 33.4 264,100 2.0 68,500 15.7 547,700
>80 20.4 161,100 47.5 374,400 2.7 63,700 20.2 479,500
>80 with disability
26.0 116,100 58.2 260,200 4.5 49,900 27.7 307,000
>80 with disability and female
28.9 83,900 61.9 179,500 5.3 35,900 31.4 213,900
(relative risks within the older population)
Source: author’s calculations using the Adult Inpatient Survey, 2012, England. The dataset used in the calculations was provided by the Picker Institute and CQC. The final weight is based on differential non-response weights provided by the Picker Institute with the permission of the CQC and on published HES data. Notes: Eating: respondents were asked “Did you get enough help from staff to eat your meals?” and could choose from the following responses, (1) “Yes, always”; (2) “Yes, sometimes”; (3) No; (4) “I did not need help to eat meals”. The disability variable has been derived from responses to question 74 (on longstanding conditions) and question 75 (on difficulties). Missings have been dropped from the calculations in this table. Rows may not sum exactly to 100%. Dignity and respect: Respondents were asked Overall, did you feel you were treated with respect and dignity while you were in the hospital? Response options were (1) yes, always (2) yes, sometimes (3) no. Minimum unweighted bases: range help with eating 776-112; range dignity and respect 3382-138. Numbers affected rounded to the nearest 100 individuals.
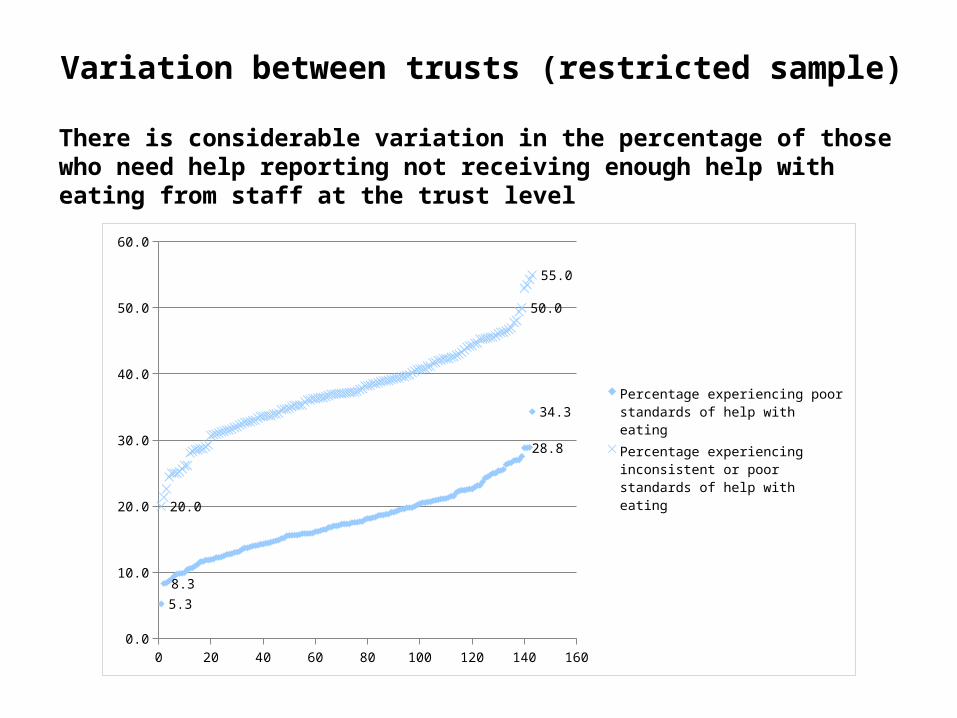
0 20 40 60 80 100 120 140 1600.0
10.0
20.0
30.0
40.0
50.0
60.0
20.0
50.0
55.0
5.3
8.3
28.8
34.3Percentage experiencing poor standards of help with eatingPercentage experiencing inconsistent or poor standards of help with eating
There is considerable variation in the percentage of those who need help reporting not receiving enough help with eating from staff at the trust level
Variation between trusts (restricted sample)
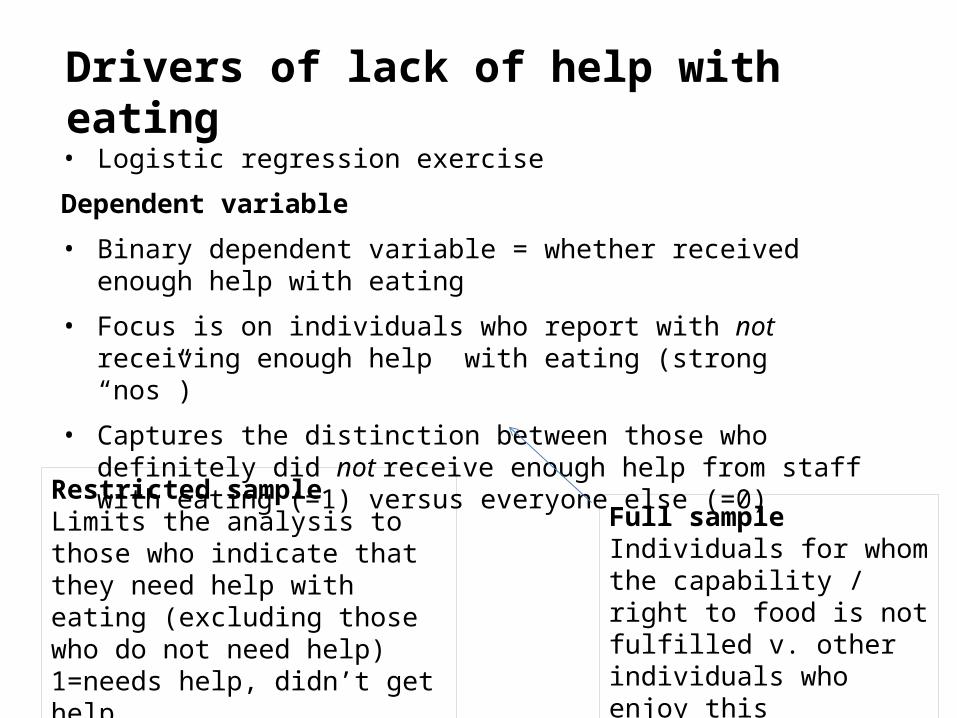
• Logistic regression exercise
Dependent variable
• Binary dependent variable = whether received enough help with eating
• Focus is on individuals who report with not receiving enough help with eating (strong “nos”)
• Captures the distinction between those who definitely did not receive enough help from staff with eating (=1) versus everyone else (=0)
Drivers of lack of help with eating
Restricted sample Limits the analysis to those who indicate that they need help with eating (excluding those who do not need help)1=needs help, didn’t get help0=needs help, did get help
Full sample Individuals for whom the capability / right to food is not fulfilled v. other individuals who enjoy this capability / right
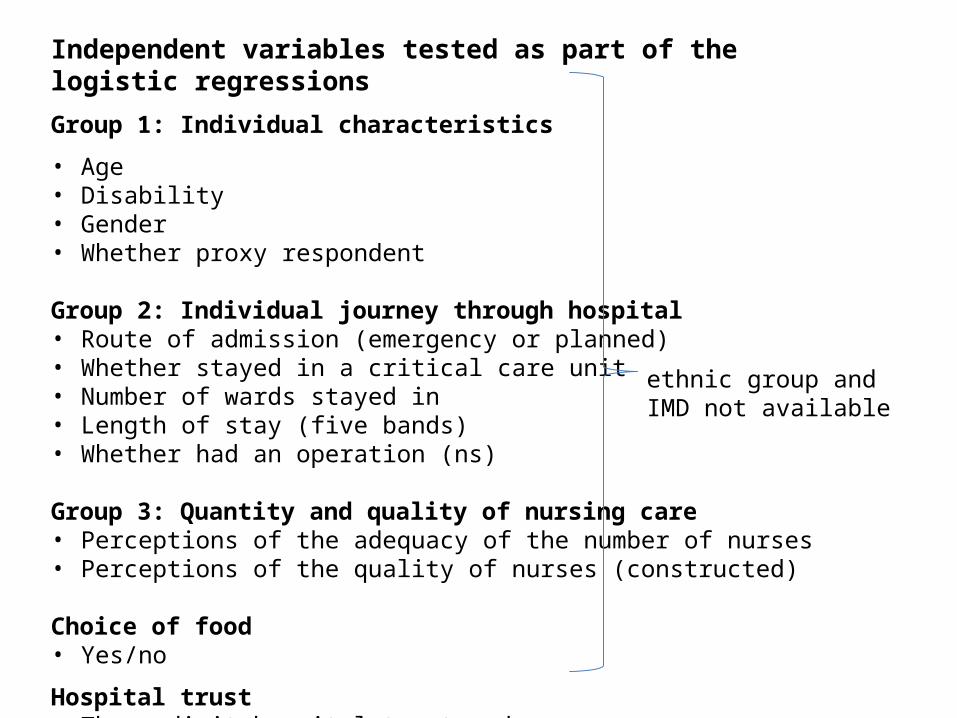
Independent variables tested as part of the logistic regressions
Group 1: Individual characteristics
• Age• Disability• Gender• Whether proxy respondent
Group 2: Individual journey through hospital• Route of admission (emergency or planned)• Whether stayed in a critical care unit• Number of wards stayed in• Length of stay (five bands)• Whether had an operation (ns)
Group 3: Quantity and quality of nursing care • Perceptions of the adequacy of the number of nurses • Perceptions of the quality of nurses (constructed)
Choice of food • Yes/no
Hospital trust • Three-digit hospital trust code
ethnic group and IMD not available
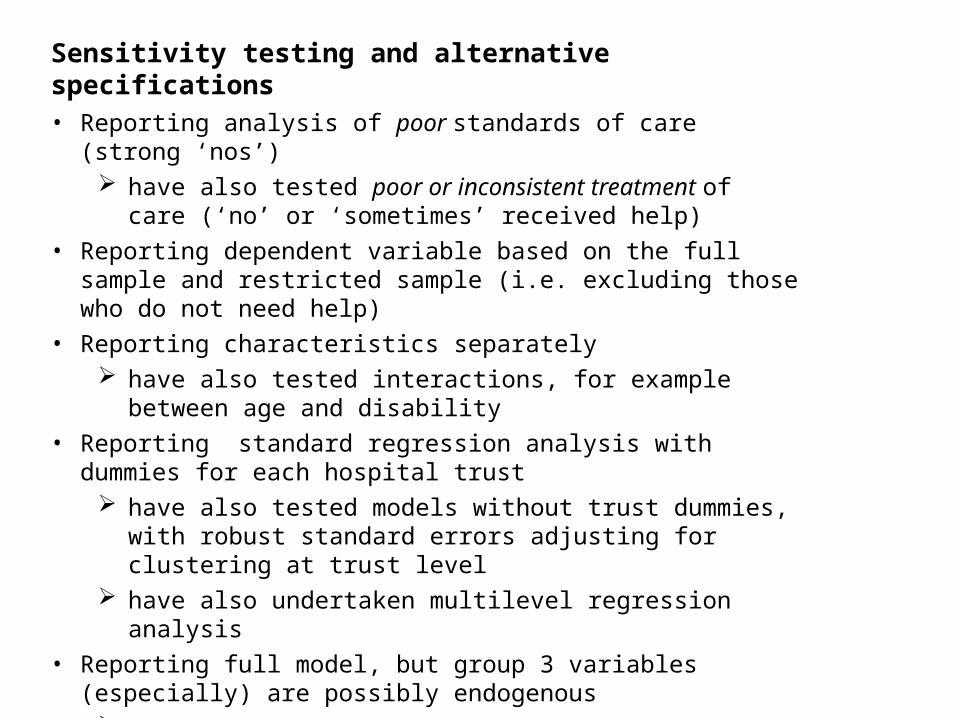
Sensitivity testing and alternative specifications
• Reporting analysis of poor standards of care (strong ‘nos’) have also tested poor or inconsistent treatment of care (‘no’ or
‘sometimes’ received help)• Reporting dependent variable based on the full sample and restricted
sample (i.e. excluding those who do not need help)• Reporting characteristics separately
have also tested interactions, for example between age and disability• Reporting standard regression analysis with dummies for each hospital
trust have also tested models without trust dummies, with robust
standard errors adjusting for clustering at trust level have also undertaken multilevel regression analysis
• Reporting full model, but group 3 variables (especially) are possibly endogenous
model built up in stages bringing in the different groups of variables (esp. inclusion / exclusion of group 3 variables)
findings should be interpreted cautiously
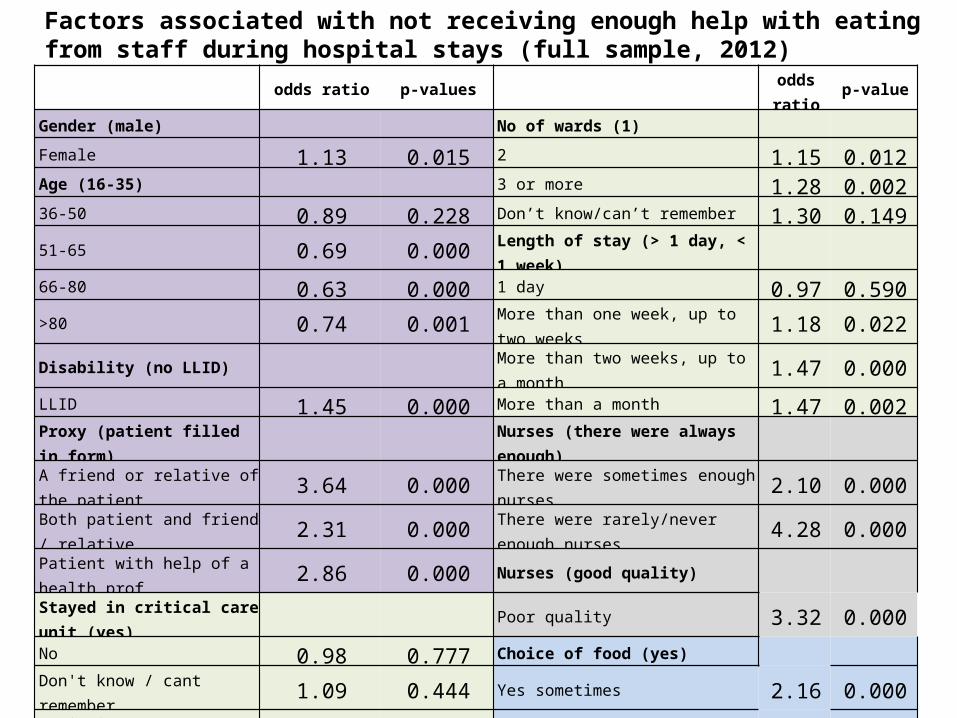
Factors associated with not receiving enough help with eating from staff during hospital stays (full sample, 2012)
odds ratio p-valuesodds ratio
p-value
Gender (male) No of wards (1)
Female 1.13 0.015 2 1.15 0.012Age (16-35) 3 or more 1.28 0.00236-50 0.89 0.228 Don’t know/can’t remember 1.30 0.149
51-65 0.69 0.000 Length of stay (> 1 day, < 1 week)
66-80 0.63 0.000 1 day 0.97 0.590>80 0.74 0.001 More than one week, up to two weeks 1.18 0.022Disability (no LLID) More than two weeks, up to a month 1.47 0.000LLID 1.45 0.000 More than a month 1.47 0.002
Proxy (patient filled in form) Nurses (there were always enough)
A friend or relative of the patient 3.64 0.000 There were sometimes enough nurses 2.10 0.000Both patient and friend / relative 2.31 0.000 There were rarely/never enough nurses 4.28 0.000
Patient with help of a health prof 2.86 0.000 Nurses (good quality)
Stayed in critical care unit (yes) Poor quality 3.32 0.000
No 0.98 0.777 Choice of food (yes)
Don't know / cant remember 1.09 0.444 Yes sometimes 2.16 0.000Admission route (emergency) No 3.73 0.000Waiting list or planned in advance 1.00 0.993 Trust (average)
Other 0.90 0.465 No trusts sig higher odds ratio; 19 trusts sig lower odds ratio
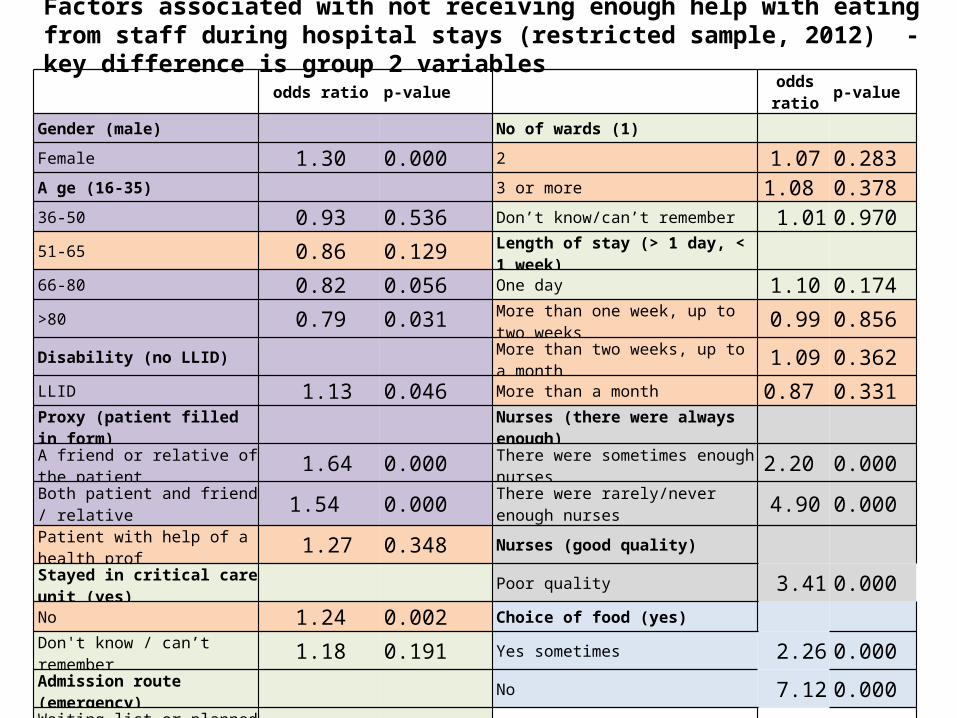
Factors associated with not receiving enough help with eating from staff during hospital stays (restricted sample, 2012) - key difference is group 2 variables
odds ratio p-valueodds ratio
p-value
Gender (male) No of wards (1)
Female 1.30 0.000 2 1.07 0.283 A ge (16-35) 3 or more 1.08 0.37836-50 0.93 0.536 Don’t know/can’t remember 1.01 0.970 51-65 0.86 0.129 Length of stay (> 1 day, < 1 week) 66-80 0.82 0.056 One day 1.10 0.174>80 0.79 0.031 More than one week, up to two weeks 0.99 0.856 Disability (no LLID) More than two weeks, up to a month 1.09 0.362 LLID 1.13 0.046 More than a month 0.87 0.331 Proxy (patient filled in form) Nurses (there were always enough)
A friend or relative of the patient 1.64 0.000 There were sometimes enough nurses 2.20 0.000
Both patient and friend / relative 1.54 0.000 There were rarely/never enough nurses 4.90 0.000
Patient with help of a health prof 1.27 0.348 Nurses (good quality)
Stayed in critical care unit (yes) Poor quality 3.41 0.000No 1.24 0.002 Choice of food (yes)
Don't know / can’t remember 1.18 0.191 Yes sometimes 2.26 0.000Admission route (emergency) No 7.12 0.000Waiting list or planned in advance 0.95 0.430 Trust (average)
Other 0.89 0.436 No trust sig higher odds ratio; 3 trusts sig lower odds ratio
Policy implications and key lessons for monitoring, regulation and inspection
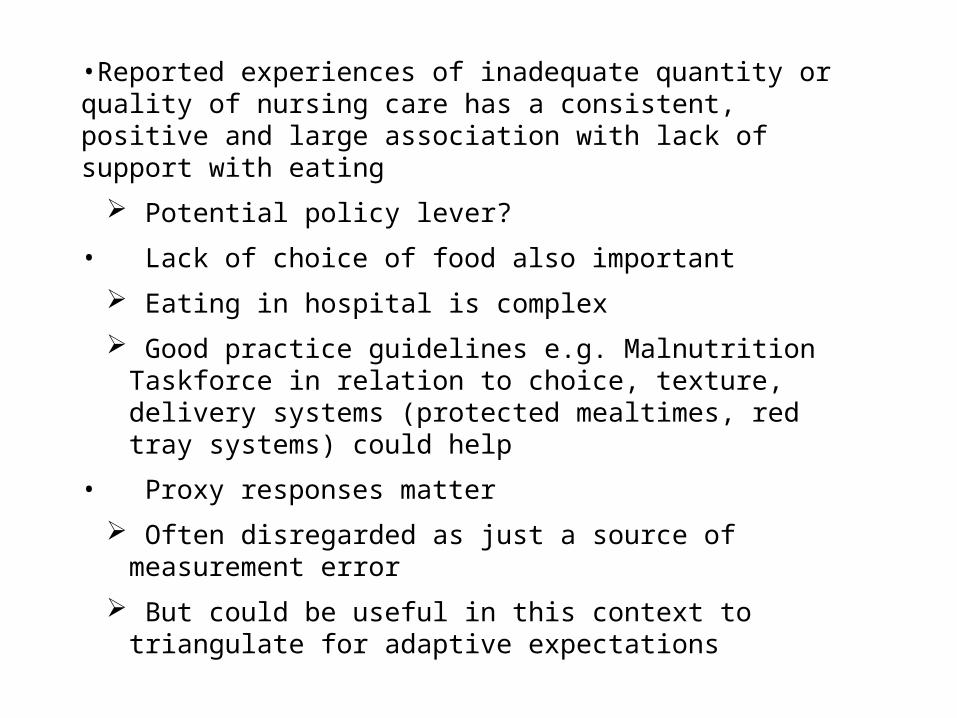
•Reported experiences of inadequate quantity or quality of nursing care has a consistent, positive and large association with lack of support with eating
Potential policy lever?
• Lack of choice of food also important
Eating in hospital is complex
Good practice guidelines e.g. Malnutrition Taskforce in relation to choice, texture, delivery systems (protected mealtimes, red tray systems) could help
• Proxy responses matter
Often disregarded as just a source of measurement error
But could be useful in this context to triangulate for adaptive expectations
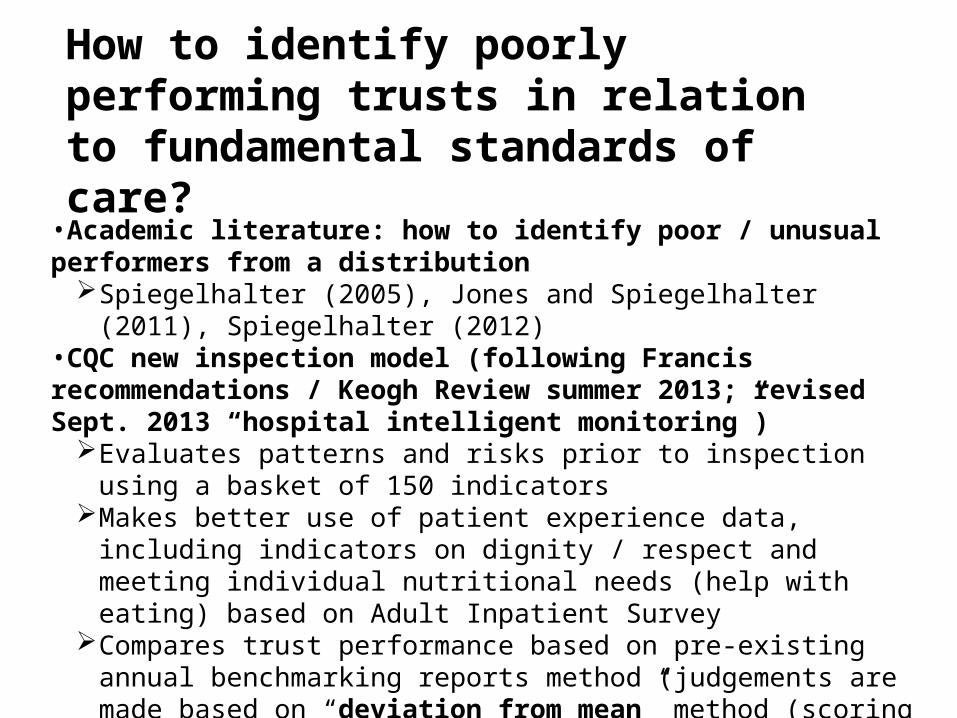
•Academic literature: how to identify poor / unusual performers from a distribution
Spiegelhalter (2005), Jones and Spiegelhalter (2011), Spiegelhalter (2012)•CQC new inspection model (following Francis recommendations / Keogh Review summer 2013; revised Sept. 2013 “hospital intelligent monitoring”)
Evaluates patterns and risks prior to inspection using a basket of 150 indicators
Makes better use of patient experience data, including indicators on dignity / respect and meeting individual nutritional needs (help with eating) based on Adult Inpatient Survey
Compares trust performance based on pre-existing annual benchmarking reports method (judgements are made based on “deviation from mean” method (scoring system, standardisation weight, overdispersion adjustment, no adjustment for inpatient size)
How to identify poorly performing trusts in relation to fundamental standards of care?
0
10
20
30
40
50 100 150 200
trustcode
Sign. 5%
Sign. .2%
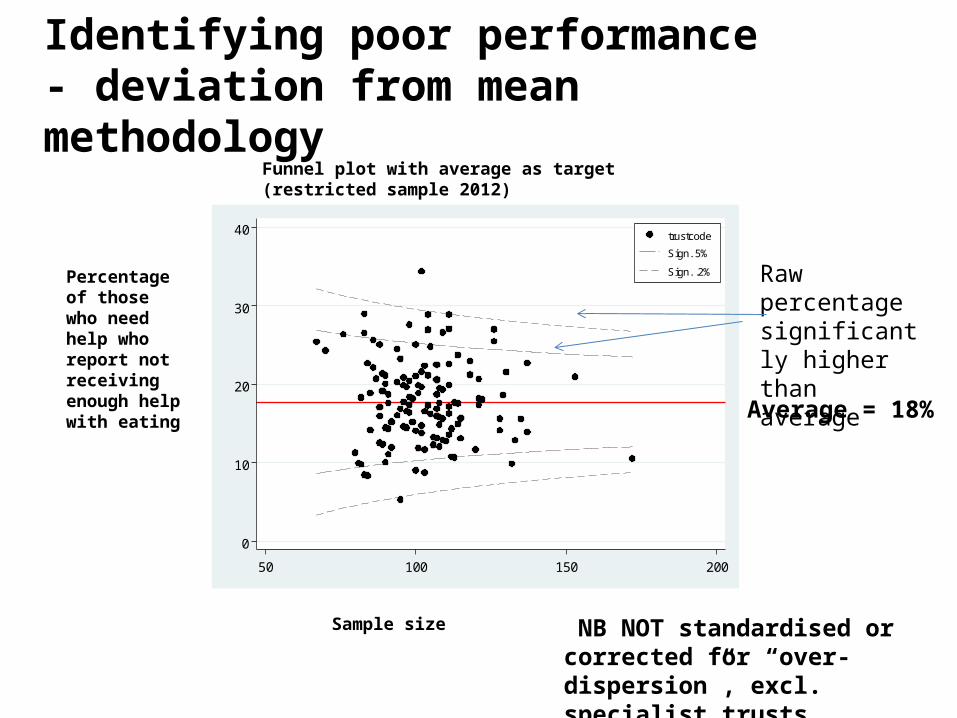
Funnel plot with average as target (restricted sample 2012)
Sample size
Percentage of those who need help who report not receiving enough help with eating Average = 18%
Raw percentage significantly higher than average
Identifying poor performance - deviation from mean methodology
NB NOT standardised or corrected for “over-dispersion”, excl. specialist trusts
•If average TOO HIGH, danger of under-identification of poor performance? (average 18% for lack of help with eating too high??) •Systematic review of 160 individual data packs produced for trusts under “hospital intelligent monitoring” model only a few trusts identified as “risk” or “elevated risk on the ‘help with
eating’ indicator – surprising?? •Monitoring compliance with fundamental standards of care requires a different methodology to evaluating variation in hospital standardised mortality ratios (hsmrs) (where “deviation from average” method might be more legitimate??) Judgements about poor performance should be based on a “minimum
threshold approach” RATHER THAN a “deviation from average” approach (focussing on relative trust performance)
In line with the concept of a minimum standard, relevant minimum threshold (target / expectation) = zero experiences of lack of support with eating?
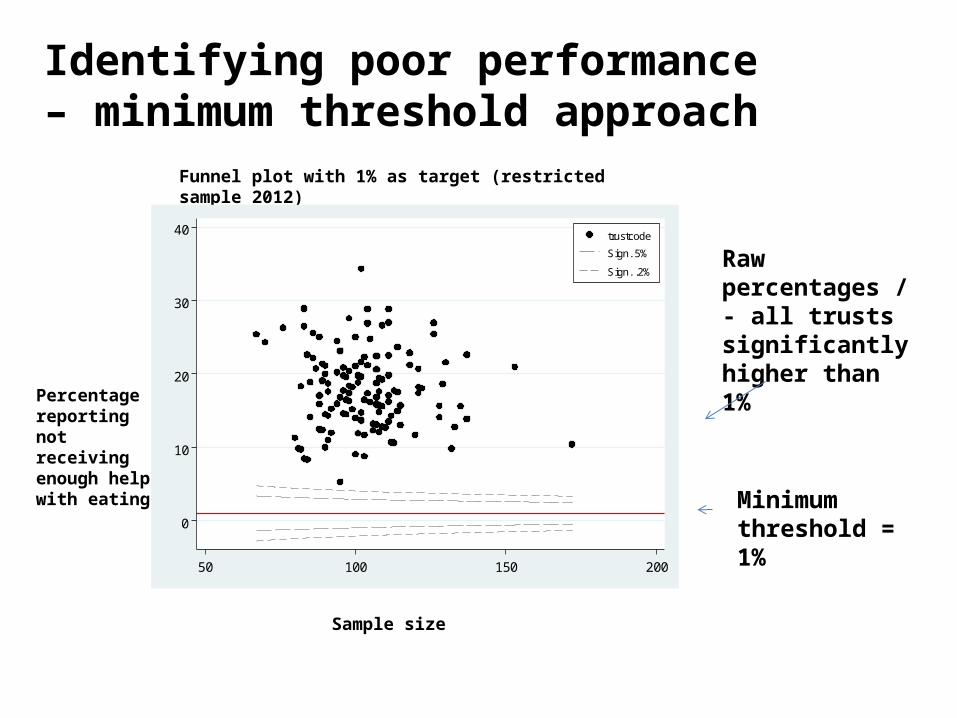
Funnel plot with 1% as target (restricted sample 2012)
Sample size
Percentage reporting not receiving enough help with eating
Raw percentages / - all trusts significantly higher than 1%
Identifying poor performance – minimum threshold approach
0
10
20
30
40
50 100 150 200
trustcode
Sign. 5%
Sign. .2%
Minimum threshold = 1%
And finally, importance of looking at disaggregated risks
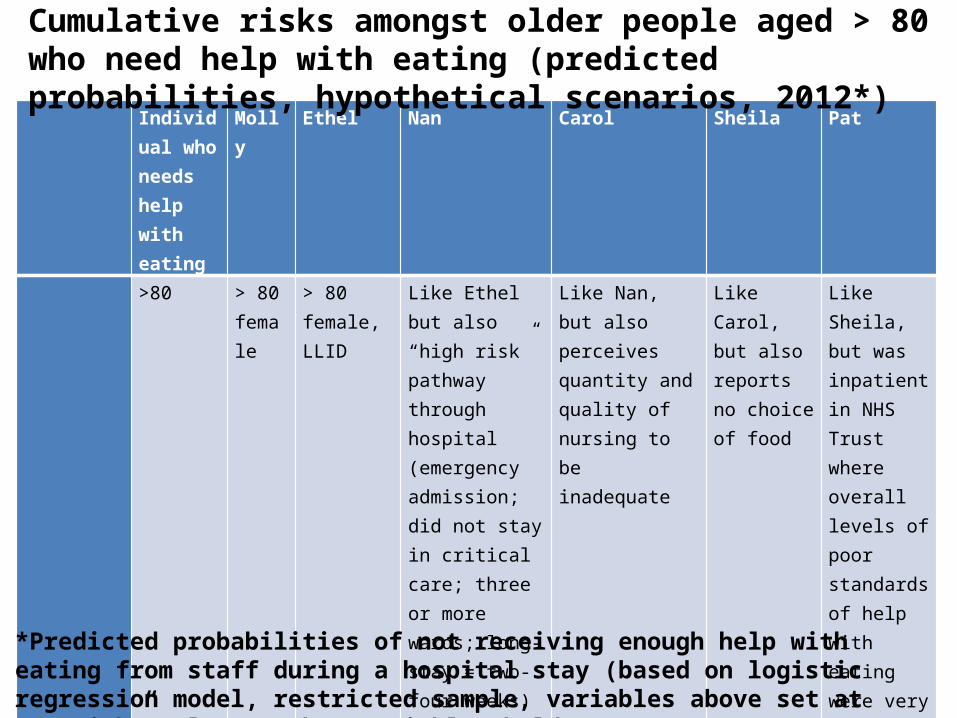
Individual who needs help with eating
Molly Ethel Nan Carol Sheila Pat
>80 > 80 female
> 80 female, LLID
Like Ethel but also “high risk” pathway through hospital (emergency admission; did not stay in critical care; three or more wards; long-stay = two-four weeks)
Like Nan, but also perceives quantity and quality of nursing to be inadequate
Like Carol, but also reports no choice of food
Like Sheila, but was inpatient in NHS Trust where overall levels of poor standards of help with eating were very high
Probability of not receiving enough help
.11 .13 .13 .16 .62 .90 .94
Cumulative risks amongst older people aged > 80 who need help with eating (predicted probabilities, hypothetical scenarios, 2012*)
*Predicted probabilities of not receiving enough help with eating from staff during a hospital stay (based on logistic regression model, restricted sample, variables above set at “at risk” values, other variables held at means)


![DOMESTIC VIOLENCE PERPETRATOR Domestic PROGRAMMES … · PROJECT MIRABAL FINAL REPORT Funded by the Economic and Social Research Council [grant reference ES/HO38086/1] and the Northern](https://img.pdfslide.net/doc/110x75/5eccdf9613c75112e941943c/domestic-violence-perpetrator-domestic-programmes-project-mirabal-final-report-funded.jpg)