Embed Size (px)
Citation preview
Graph-based Interactive Data Federation System forHeterogeneous Data Retrieval and Analytics
Xuan-Son Vu, Addi Ait-Mlouk, Erik Elmroth, Lili JiangDepartment of Computing Science, Umeå University, Sweden{sonvx, addia, elmroth, lili.jiang}@cs.umu.se
ABSTRACTGiven the increasing number of heterogeneous data stored in re-lational databases, file systems or cloud environment, it needs tobe easily accessed and semantically connected for further data ana-lytic. The potential of data federation is largely untapped, this paperpresents an interactive data federation system (https://vimeo.com/319473546) by applying large-scale techniques including hetero-geneous data federation, natural language processing, associationrules and semantic web to perform data retrieval and analytics onsocial network data. The system first creates a Virtual Database(VDB) to virtually integrate data from multiple data sources. Next, aRDF generator is built to unify data, together with SPARQL queries,to support semantic data search over the processed text data bynatural language processing (NLP). Association rule analysis isused to discover the patterns and recognize the most importantco-occurrences of variables from multiple data sources. The systemdemonstrates how it facilitates interactive data analytic towardsdifferent application scenarios (e.g., sentiment analysis, privacy-concern analysis, community detection).
KEYWORDSheterogeneous data federation, RDF, interactive data analysisACM Reference Format:Xuan-Son Vu, Addi Ait-Mlouk, Erik Elmroth, Lili Jiang. 2019. Graph-basedInteractive Data Federation System for Heterogeneous Data Retrieval andAnalytics. In Proceedings of the 2019 World Wide Web Conference (WWW’19), May 13–17, 2019, San Francisco, CA, USA. ACM, New York, NY, USA,5 pages. https://doi.org/10.1145/3308558.3314138
1 INTRODUCTIONMotivation. The ultra-connected world has been generating mas-sive volumes of heterogeneous data stored in different data sources.And these data sources need to be normalized and interconnected tocreate a federated database that can be used to analyze, extract use-ful knowledge, and present it as a valid element for decision making.Semantic web techniques (e.g., RDF, SPARQL) have been widelyused for data federation and linkage. However, the primary issue ofthe semantic web is insufficient integrated solution. To tackle thisissue, we applied data federation, semantic web, and data miningtechnologies to develop this system, which can complement witheach other. The system allows users to select data sources, interact
This paper is published under the Creative Commons Attribution 4.0 International(CC-BY 4.0) license. Authors reserve their rights to disseminate the work on theirpersonal and corporate Web sites with the appropriate attribution.WWW ’19, May 13–17, 2019, San Francisco, CA, USA© 2019 IW3C2 (International World Wide Web Conference Committee), publishedunder Creative Commons CC-BY 4.0 License.ACM ISBN 978-1-4503-6674-8/19/05.https://doi.org/10.1145/3308558.3314138
with visualized graphs, and run customized queries across federateddata to meet specific needs for data analytics.Related Work. Related with data federation, there exist some pop-ular enterprise data virtualization tools, such as IBM InfoSphereFederation Server (https://ibm.co/2qWQbom) and Oracle Data Ser-vice Integrator (https://goo.gl/6MKXkF). As well as some opensource frameworks such as Teiid (teiid.jboss.org) which we used inthis paper. Similar efforts in data federation have been seen fromacademia such as BioMart (www.ensembl.org/biomart) and Mael-strom (www.maelstrom-research.org). In the context of RDF andLinked Open Data, various works have been proposed in the litera-tures [2, 3]. In addition, several tools offering RDF and linked datavisualization have been developed e.g., Sgvizler [6], LODWheel[7], IsaViz 1. RDF-Gravity2, etc. Also, many researchers used fed-erated SPARQL queries to analyze and visualize linked data[4].However, considering advanced data analytics across federateddata is ignored. In this demo paper, we proposed RDF-supporteddata visualization framework over federated databases enrichedwith data mining (e.g., association rules) and NLP techniques (e.g.,sentiment analysis). It can efficiently federate and analyze largeheterogeneous data sources for general or specific analysis needs(e.g., community detection and the like).
Dataset.We processed one of the largest social science researchdatabases, myPersonality corpus 3, which was collected from over6 million volunteers on Facebook (FB). The data was anonymizedand sampled to share with registered scholars around the world. Inthis paper, we used four of its data sources including demographicdataset, personality dataset, political views, and FB status updatesdataset. One more community detection dataset was inferred basedon these four.More information about these data sources is availablein the menu of Data Source of the demo system.
Contributions.We build up a federation system, mapping themultiple heterogeneous, distributed, and autonomous data sourcesinto a unified federated database interface, where user can choosedata sources in their area of interest; we provide data analyticsincluding data exploration and search, which empowers users withability to explore the data via data mining algorithms (i.e., asso-ciation rules), and search by queries to lead advanced analytics.we implement interactive visualization, which allows users to plotthe result in different formats like tables, graphs, scatter plots, anddownload the results. The system is scalable by adding other datasources, applying other data mining algorithms, and aiming at otherdata analytic scenarios.
MySQL
SAS
VDB (TEIID)
RDF
ES
Process 2
Data Exploration(Shiny)
Process 3
Data Search(Kibana)
Process 1
1. Preprocessing
2. Data Indexing
3. RDFGenerator
Server Side End-users Side
(1) Data Federation (2) Data Linkage (3) Knowledge Extraction
Text
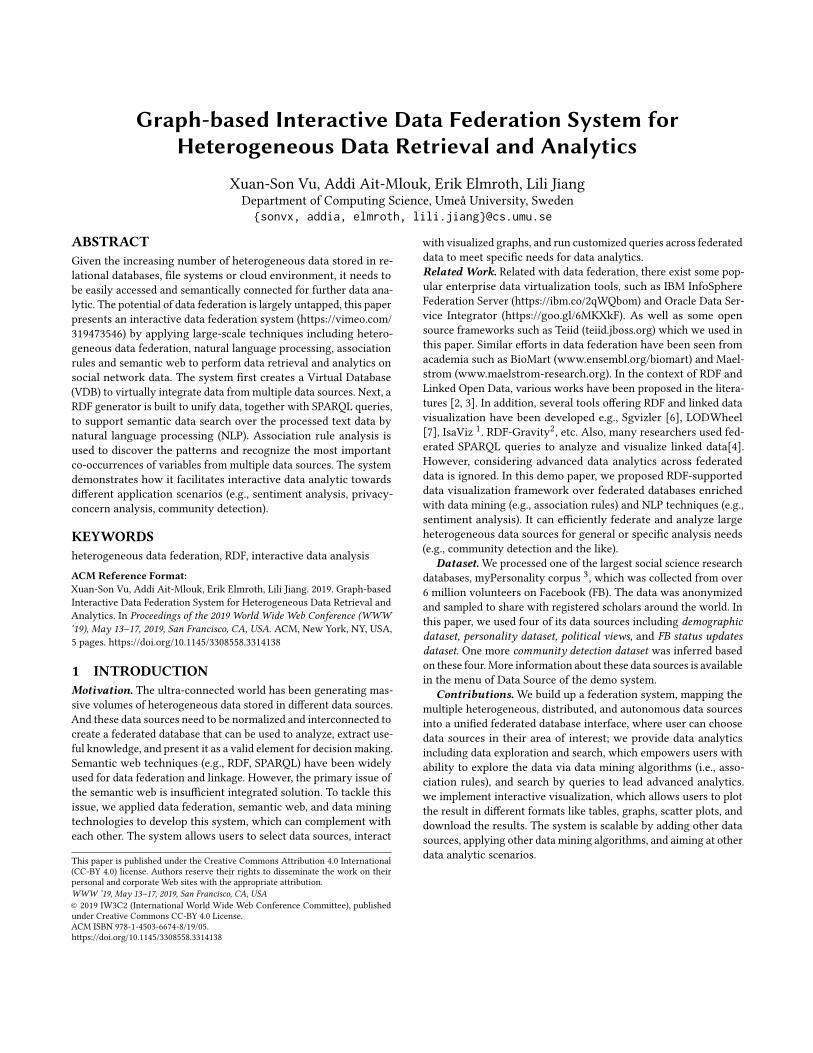
Figure 1: Overview of system architecture: (1) Data Federation, (2) Data Linkage, and (3) Data Analytics.
2 SYSTEM DESCRIPTIONThe system architecture is shown in Figure 1 with three goalsincluding data federation, data linkage, and data analytics. On theserver side, data from multiple data sources were preprocessedand connected through a VDB in the local deployed Teiid server.Different techniques are firstly applied to process raw data includinggenerating RDF from raw data and indexing text-based data (Process1). Association rule analysis is applied to support data exploration,such as exploring hidden patterns and co-occurrences of variablesfrom multiple data sources in visualized ways (Process 2). Afterdata exploration, users can go to data search and issue queriesacross RDF endpoints for general/specific data analytics, whichare powered by semantic web techniques (Process 3). Based on thethree processes mentioned above, on the end-user side, users areenabled to view metadata of data sources, explore the individualand federated data, and further construct simple/advanced queriesof their (research) interests, to get data analytic results. Figure 2presents the user interface.
Ahead of the above procedure, we apply NLP techniques [10] forraw data preprocessing (e.g., data normalization, standardization,non-utf8 characters removal etc.) and infer additional variablessuch as sentiment analysis and privacy concern based on the givenvariables. More information about these variables can be found inthe menu of Data Source in the system.
Figure 2: User interface of the system
1www.w3.org/2001/11/IsaViz2https://www.salzburgresearch.at/publikation/rdf-gravity-3/3https://www.psychometrics.cam.ac.uk/productsservices/mypersonality
2.1 Data Federation and Data LinkageData Federation. Our data federation component was built basedon an open source framework Teiid, which is a data virtualizationsystem that allows applications to use data from multiple, hetero-geneous data stores. We created virtual database (VDB) for datafederation, where data is accessed and virtually integrated in real-time across distributed data sources without copying or otherwisemoving data from its system of record.
Data Linkage. After data federation, we applied semantic webtechniques (e.g., RDF, SPARQL) for data linkage, which is a methodfor publishing structured data using vocabularies like schema.orgthat can be connected together and interpreted by machines. Wecreated our own RDF generator, which standardizes the raw data toa unified RDF format and stored in RDF database as shown in Fig-ure 1, so they can be read automatically by computers and enabledata from different sources to be connected and queried. After-wards, we apply the inverted indexing schema from ElasticSearch(www.elastic.co) (ES) for data indexing, which is an open source,distributable, and highly scalable search engine. The indexed resultsare stored to ES database. These two steps are critical to facilitateefficient data analytics in the following.
2.2 Data AnalyticsData Exploration. After getting to understand the data sources,users are guided to apply datamining techniques to explore patternsand correlations over data variables. We take association rules tech-nique as an example to show how data mining techniques discoverthe relationship between variables in federated data. Associationrules technique was initiated by Agrawal [1] to analyze transac-tional databases. It usually defined as an implication of the formA → B such as A,B ⊂ I and A ∩ B = ∅. Every rule is composed oftwo different sets of items A and B, where A is called antecedentor left-hand-side (LHS) and B called consequent or right-hand-side(RHS). In order to select interesting rules from the set of all possiblerules, constraints on various measures of significance and interestare used. The best-known constraints are minimum thresholds onsupport and confidence. The support is defined as the proportionof transactions in the database which contain the items A, and theconfidence defines how frequently items in B appear in a transac-tion that contains A. In this system, we apply Apriori algorithm [1]to extract association rules among variables over the federated data.For example, given the FB users with specific variables like age (e.g.,31-40), gender (e.g, female), and relation status (e.g., married), the

system may present association rule graph with quantified scoresof the fourth variable “personality”, which indicates the prone ofspecific personality (e.g, high-score neuroticism, low-score agree-ableness etc.) of these types of users.
Data Search. After exploring the federated data sources, users
Figure 3: Data Search interface of the system
come to the page of Data Search and issue queries over the indexeddata on ElasticSearch. As shown in Figure 3, for demonstration pur-pose, we created two dashboards of Case-Study 1&2 and Case-Study3 for users. Each dashboard provides a search box as well as filterconfigurations. We have the pure long-text based variable (i.e., FBstatus update) to support text-based query, and additionally userswill add filters to setup constraints for other variables to customizetheir own query. The third dashboard supports general advancedsearch (e.g., Boolean search).
3 DEMONSTRATION OF THE SYSTEMFor demonstration, let’s say Alice, a psychologist researcher, whowants to research the correlation of personality and stresses inpeople’s life based on social network behaviours. Alice is enabledto apply given data mining algorithms (i.e., association rules) toexplore the hidden patterns across selected variables of interests.Next, Alice will further extrapolate the returned results in DataSearch to havemore detailed information of those people. These twosteps will be described in case-study 1 and case-study 2 accordingly.
3.1 Case-study 1: association rules basedsentiment analysis
In this case study, Alice will select her variables of interests in-cluding sentiment_score_subjectivity (sentiS), cNEU (neuroticism),cCON (conscientiousness), cAGR (agreeableness) [8] in the graphvisualization panel 1 to be inferred through association rules.We applied the Apriori algorithm [1] to extract frequent variables,which satisfies the minimum support requirement specified by theuser, and then generate association rules based on the user-specifiedconfidence threshold. As shown in Figure 4, in Data Exploration,the four variables were chosen to run the inference. Parameterconfiguration panel 2 was displayed on right side including se-lecting data source, setting support and confidence thresholds forassociation rules. Above the configuration panel, a component of“User Guide–Help” gives user guidance of exploring this page. After-wards, Alice moves to the bottom panel 3 and clicks “associationrule graph” tab to see the results like in Figure 5. In this figure, therectangles represent variables and the circles represent associationrules. Larger size of circle imply more data records matching therule, while the darker circle represent more importance of the rule.
Regarding the research question, Alice found a hidden patternbetween three variables regarding neurotic people (cNEU), whichis a personality trait that reflects one’s ability to deal with emotionstates, such as stress and anxiety. The pattern suggests that peoplewho are not agreeableness (N.AGR) and do not have strong purposesin the way they say on FB status (sentiS=0) then most likely theyare neurotic people. This hidden pattern however might not besufficiently significant to draw such a conclusion to define neuroticpeople. Therefore, Alice will verify this discovered pattern in DataSearch to confirm this pattern across data sources. The case-study 2will explain in more detail how Alice confirms the explored pattern.
Figure 4: Selected variables on Data Exploration
Figure 5: Case study of association rule based sentimentanalysis on selected variables.
3.2 Case-study 2: personality and sentimentanalysis
In this case study, we show how Data Search can be used to con-firm the hidden pattern that Alice found out using the associa-tion rules. As shown in Figure 6, in Data Search, after issuingthe query “sentiment_score_subjectivity:0 AND cagr:N.AGR ANDccon:N.CON” (Q1), Alice got a line chart showing the fraction be-tween different personality traits and age group. It clearly showsthat the neurotic group of people is the major group among fivepersonality traits. Furthermore, Alice can find more informationrelated to this group of neurotic people. For instance, a graph called“Age_Political_Views” shows that, mainly neurotic people have polit-ical views of “doesn’t care” and “democratic”. This extrapolation is a
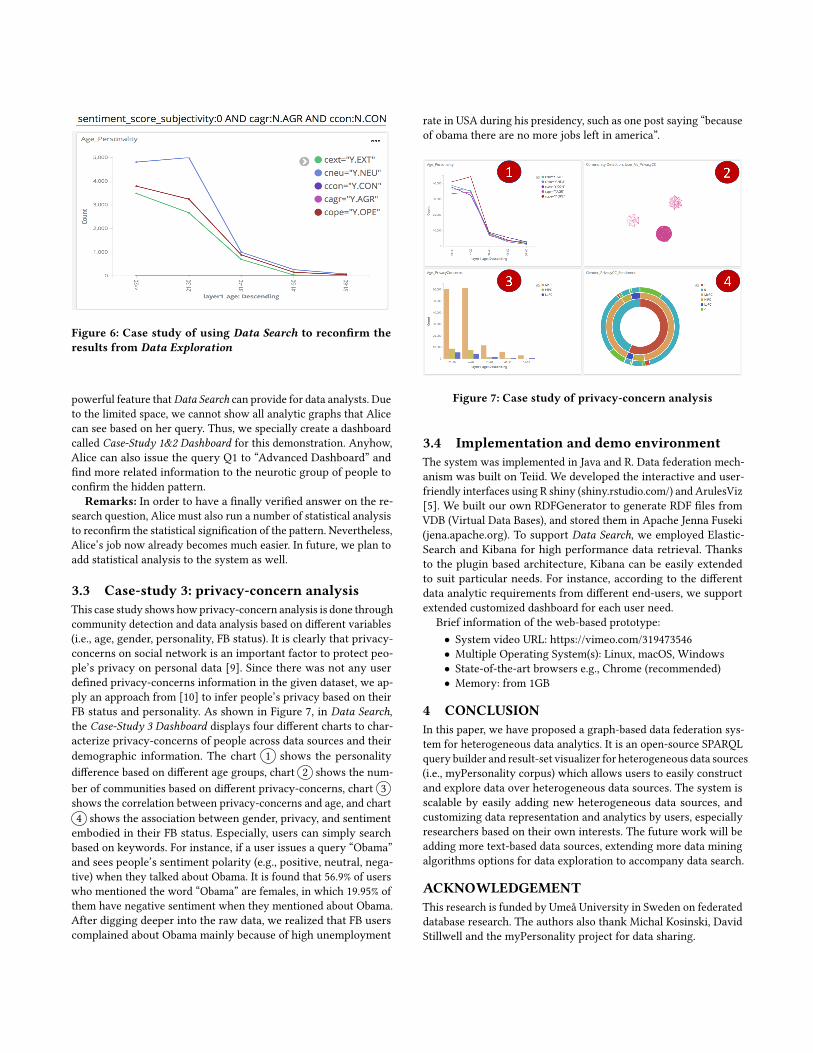
Figure 6: Case study of using Data Search to reconfirm theresults from Data Exploration
powerful feature thatData Search can provide for data analysts. Dueto the limited space, we cannot show all analytic graphs that Alicecan see based on her query. Thus, we specially create a dashboardcalled Case-Study 1&2 Dashboard for this demonstration. Anyhow,Alice can also issue the query Q1 to “Advanced Dashboard” andfind more related information to the neurotic group of people toconfirm the hidden pattern.
Remarks: In order to have a finally verified answer on the re-search question, Alice must also run a number of statistical analysisto reconfirm the statistical signification of the pattern. Nevertheless,Alice’s job now already becomes much easier. In future, we plan toadd statistical analysis to the system as well.
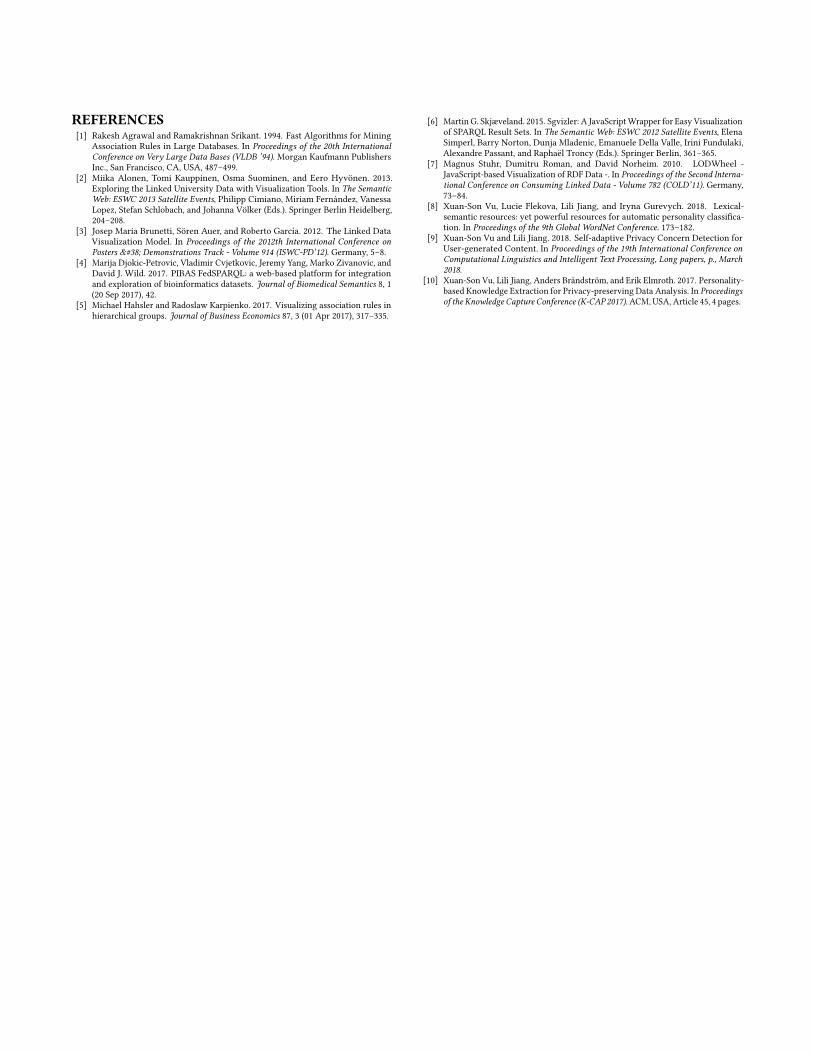
3.3 Case-study 3: privacy-concern analysisThis case study shows howprivacy-concern analysis is done throughcommunity detection and data analysis based on different variables(i.e., age, gender, personality, FB status). It is clearly that privacy-concerns on social network is an important factor to protect peo-ple’s privacy on personal data [9]. Since there was not any userdefined privacy-concerns information in the given dataset, we ap-ply an approach from [10] to infer people’s privacy based on theirFB status and personality. As shown in Figure 7, in Data Search,the Case-Study 3 Dashboard displays four different charts to char-acterize privacy-concerns of people across data sources and theirdemographic information. The chart 1 shows the personalitydifference based on different age groups, chart 2 shows the num-ber of communities based on different privacy-concerns, chart 3shows the correlation between privacy-concerns and age, and chart4 shows the association between gender, privacy, and sentimentembodied in their FB status. Especially, users can simply searchbased on keywords. For instance, if a user issues a query “Obama”and sees people’s sentiment polarity (e.g., positive, neutral, nega-tive) when they talked about Obama. It is found that 56.9% of userswho mentioned the word “Obama” are females, in which 19.95% ofthem have negative sentiment when they mentioned about Obama.After digging deeper into the raw data, we realized that FB userscomplained about Obama mainly because of high unemployment
rate in USA during his presidency, such as one post saying “becauseof obama there are no more jobs left in america”.
Figure 7: Case study of privacy-concern analysis
3.4 Implementation and demo environmentThe system was implemented in Java and R. Data federation mech-anism was built on Teiid. We developed the interactive and user-friendly interfaces using R shiny (shiny.rstudio.com/) and ArulesViz[5]. We built our own RDFGenerator to generate RDF files fromVDB (Virtual Data Bases), and stored them in Apache Jenna Fuseki(jena.apache.org). To support Data Search, we employed Elastic-Search and Kibana for high performance data retrieval. Thanksto the plugin based architecture, Kibana can be easily extendedto suit particular needs. For instance, according to the differentdata analytic requirements from different end-users, we supportextended customized dashboard for each user need.
Brief information of the web-based prototype:• System video URL: https://vimeo.com/319473546• Multiple Operating System(s): Linux, macOS, Windows• State-of-the-art browsers e.g., Chrome (recommended)• Memory: from 1GB
4 CONCLUSIONIn this paper, we have proposed a graph-based data federation sys-tem for heterogeneous data analytics. It is an open-source SPARQLquery builder and result-set visualizer for heterogeneous data sources(i.e., myPersonality corpus) which allows users to easily constructand explore data over heterogeneous data sources. The system isscalable by easily adding new heterogeneous data sources, andcustomizing data representation and analytics by users, especiallyresearchers based on their own interests. The future work will beadding more text-based data sources, extending more data miningalgorithms options for data exploration to accompany data search.
ACKNOWLEDGEMENTThis research is funded by Umeå University in Sweden on federateddatabase research. The authors also thank Michal Kosinski, DavidStillwell and the myPersonality project for data sharing.
REFERENCES[1] Rakesh Agrawal and Ramakrishnan Srikant. 1994. Fast Algorithms for Mining
Association Rules in Large Databases. In Proceedings of the 20th InternationalConference on Very Large Data Bases (VLDB ’94). Morgan Kaufmann PublishersInc., San Francisco, CA, USA, 487–499.
[2] Miika Alonen, Tomi Kauppinen, Osma Suominen, and Eero Hyvönen. 2013.Exploring the Linked University Data with Visualization Tools. In The SemanticWeb: ESWC 2013 Satellite Events, Philipp Cimiano, Miriam Fernández, VanessaLopez, Stefan Schlobach, and Johanna Völker (Eds.). Springer Berlin Heidelberg,204–208.
[3] Josep Maria Brunetti, Sören Auer, and Roberto García. 2012. The Linked DataVisualization Model. In Proceedings of the 2012th International Conference onPosters & Demonstrations Track - Volume 914 (ISWC-PD’12). Germany, 5–8.
[4] Marija Djokic-Petrovic, Vladimir Cvjetkovic, Jeremy Yang, Marko Zivanovic, andDavid J. Wild. 2017. PIBAS FedSPARQL: a web-based platform for integrationand exploration of bioinformatics datasets. Journal of Biomedical Semantics 8, 1(20 Sep 2017), 42.
[5] Michael Hahsler and Radoslaw Karpienko. 2017. Visualizing association rules inhierarchical groups. Journal of Business Economics 87, 3 (01 Apr 2017), 317–335.
[6] Martin G. Skjæveland. 2015. Sgvizler: A JavaScriptWrapper for Easy Visualizationof SPARQL Result Sets. In The Semantic Web: ESWC 2012 Satellite Events, ElenaSimperl, Barry Norton, Dunja Mladenic, Emanuele Della Valle, Irini Fundulaki,Alexandre Passant, and Raphaël Troncy (Eds.). Springer Berlin, 361–365.
[7] Magnus Stuhr, Dumitru Roman, and David Norheim. 2010. LODWheel -JavaScript-based Visualization of RDF Data -. In Proceedings of the Second Interna-tional Conference on Consuming Linked Data - Volume 782 (COLD’11). Germany,73–84.
[8] Xuan-Son Vu, Lucie Flekova, Lili Jiang, and Iryna Gurevych. 2018. Lexical-semantic resources: yet powerful resources for automatic personality classifica-tion. In Proceedings of the 9th Global WordNet Conference. 173–182.
[9] Xuan-Son Vu and Lili Jiang. 2018. Self-adaptive Privacy Concern Detection forUser-generated Content. In Proceedings of the 19th International Conference onComputational Linguistics and Intelligent Text Processing, Long papers, p., March2018.
[10] Xuan-Son Vu, Lili Jiang, Anders Brändström, and Erik Elmroth. 2017. Personality-based Knowledge Extraction for Privacy-preserving Data Analysis. In Proceedingsof the Knowledge Capture Conference (K-CAP 2017). ACM, USA, Article 45, 4 pages.
![Detecting Anomalous Behaviour using Heterogeneous Data · Detecting Anomalous Behaviour using Heterogeneous Data Azliza Mohd Ali, ... images and streaming data [3]. Extract knowledge](https://img.pdfslide.net/doc/110x75/5f68c48acc69010cf04c9bde/detecting-anomalous-behaviour-using-heterogeneous-data-detecting-anomalous-behaviour.jpg)